Preprint
Article

This version is not peer-reviewed.

Revealing the Environmental Footprint of Crepe Rubber Production: A Comprehensive Life Cycle Assessment of a Crepe Rubber Factory in Sri Lanka

A peer-reviewed article of this preprint also exists.

Submitted:

28 November 2024

Posted:

29 November 2024

You are already at the latest version

Abstract

Natural rubber, a renewable material with unique properties, is crucial for various products on the modern market. Crepe rubber, a versatile form of natural rubber, is widely used in numerous applications, including footwear soles, medical devices, automotive parts, adhesives, sports equipment, industrial components, musical instruments, and recreational products. Sri Lanka holds a prominent position as a leading producer of premium-quality crepe rubber but faces environmental challenges in its production process. Since previous life cycle assessments (LCA) in the rubber industry are inadequate to capture overall environmental impact, the present study attempted to address the gaps by conducting a detailed LCA of a Sri Lankan crepe rubber factory, incorporating a novel index termed Trade-off valuation index (TOVI). The research revealed that fertilizer, water, and electricity use contribute most significantly to crepe rubber production's environmental impact. To mitigate these impacts, four key improvement options were identified and evaluated through scenario analysis: 1) enhancing fertilizer efficiency, 2) repairing leaky joints and valves, 3) implementing a water reuse system, and 4) installing solar panels. The integration of TOVI allowed for the prioritization of these options, providing actionable insights for industry stakeholders. This study paves the way for targeted interventions to enhance the sustainability of the natural rubber industry by balancing economic viability with environmental stewardship.

Keywords: 
;  ;  

1. Introduction

Natural rubber, derived primarily from Hevea brasiliensis tree, has been a cornerstone material in various industries for more than a century due to its exceptional elasticity, resilience, and durability[1,2] and such characteristics have been attributed to its unique molecular structure, composed of long chains of cis-1,4-polyisoprene [2,3]. These properties make natural rubber irreplaceable in many applications despite the development of synthetic alternatives. Crepe rubber, a specific form of natural rubber, is produced through a specialized process that involves coagulating latex and passing it through grooved rollers, resulting in a distinctive crinkled texture [2,3,4].
The versatility of crepe rubber has led to its widespread adoption in various sectors. In the footwear industry, it is prized for its shock-absorbing qualities and nonslip characteristics, making it ideal for shoe soles[2,5,6,7]. Medical applications benefit from its biocompatibility and resistance to bodily fluids, while the automotive sector utilizes its vibration-damping properties in various components. The strong adhesive properties of the material make it valuable in the production of adhesives and sealants. Sports equipment manufacturers leverage the grip of crepe rubber and the resilience in items such as tennis balls and gym mats [2]. Its use extends to industrial applications, where it serves as gaskets and seals, and even to the arts, where it finds a place in the construction of musical instruments [2].
Crepe rubber production is a resource-intensive process that involves multiple stages[8,9,10]. At the farm level, latex harvesting for crepe rubber requires a significant input of fertilizers for the health of the rubber tree and optimal yield. Electricity powers heavy machinery, water pumps, wastewater treatment, and lighting at the factory stage for converting latex into crepe rubber. Also, thermal energy, mainly from firewood combustion, is crucial for rubber drying. Freshwater is essential for washing, sanitation, chemical dilution, latex processing, and machine cooling. Various chemicals, including sodium bisulfite, formic acid, and bleaching agents, are used for latex preservation, coagulation, and product refinement in crepe rubber processing at the factory level. Therefore, due to this resource intensive nature, crepe rubber production has faced various environmental issues [2,11,12,13]. Significant water consumption and effluent discharge in crepe rubber manufacturing pose potential environmental concerns if not properly managed. Releasing untreated rubber factory effluent into the environment can lead to water pollution, unpleasant odors, and crop damage, while excessive water use can deplete nearby water resources[14]. Additional environmental issues arise from emissions related to high electricity and firewood consumption [15,16].
Life Cycle Assessment (LCA) is a popular tool that is used to assess the environmental impacts associated with all stages of the life of a product, from the extraction of raw materials through production, use, and disposal [6,10,17,18]. Standardized under ISO 14040/44, LCA provides a systematic framework for quantifying and interpreting the environmental implications of products, processes, or services throughout their entire lifecycle [19]. This holistic approach allows researchers and industry professionals to identify environmental hotspots, compare alternative solutions, and make informed decisions to minimize ecological burdens.
Several LCA studies have been conducted to address the environmental concerns associated with crepe rubber production. Our previous research efforts have focused on evaluating greenhouse gas (GHG) emissions from the crepe rubber processing phase[8,9,10]. Going beyond, Kumara et al. [15] expanded the scope by performing a cradle-to-gate assessment to quantify the carbon footprint of crepe rubber production. These studies have provided valuable information on the environmental impact of crepe rubber production, particularly in terms of GHGs. However, existing research has concentrated mainly on a single impact category or area, which limits a comprehensive understanding of the environmental implications of crepe rubber production. A more holistic approach that considers multiple environmental indicators would be highly beneficial in providing a more complete picture of the environmental issues associated with this industry.
To take an initial step to address this gap, a comprehensive life cycle assessment (LCA) was carried out in a Sri Lankan crepe rubber production estate considering rubber cultivation and processing (notably, we chose Sri Lanka due to its significance as the principal crepe rubber producer and exporter [8,9,10]. This study aimed not only to capture the environmental profile of production, but also to identify hotspots and areas with potential for improvement. Additionally, a novel index was introduced to assess the trade-offs among multiple sustainability aspects: environmental, economic, and social. This approach helps prioritize improvement options for production.

2. Materials and Methods

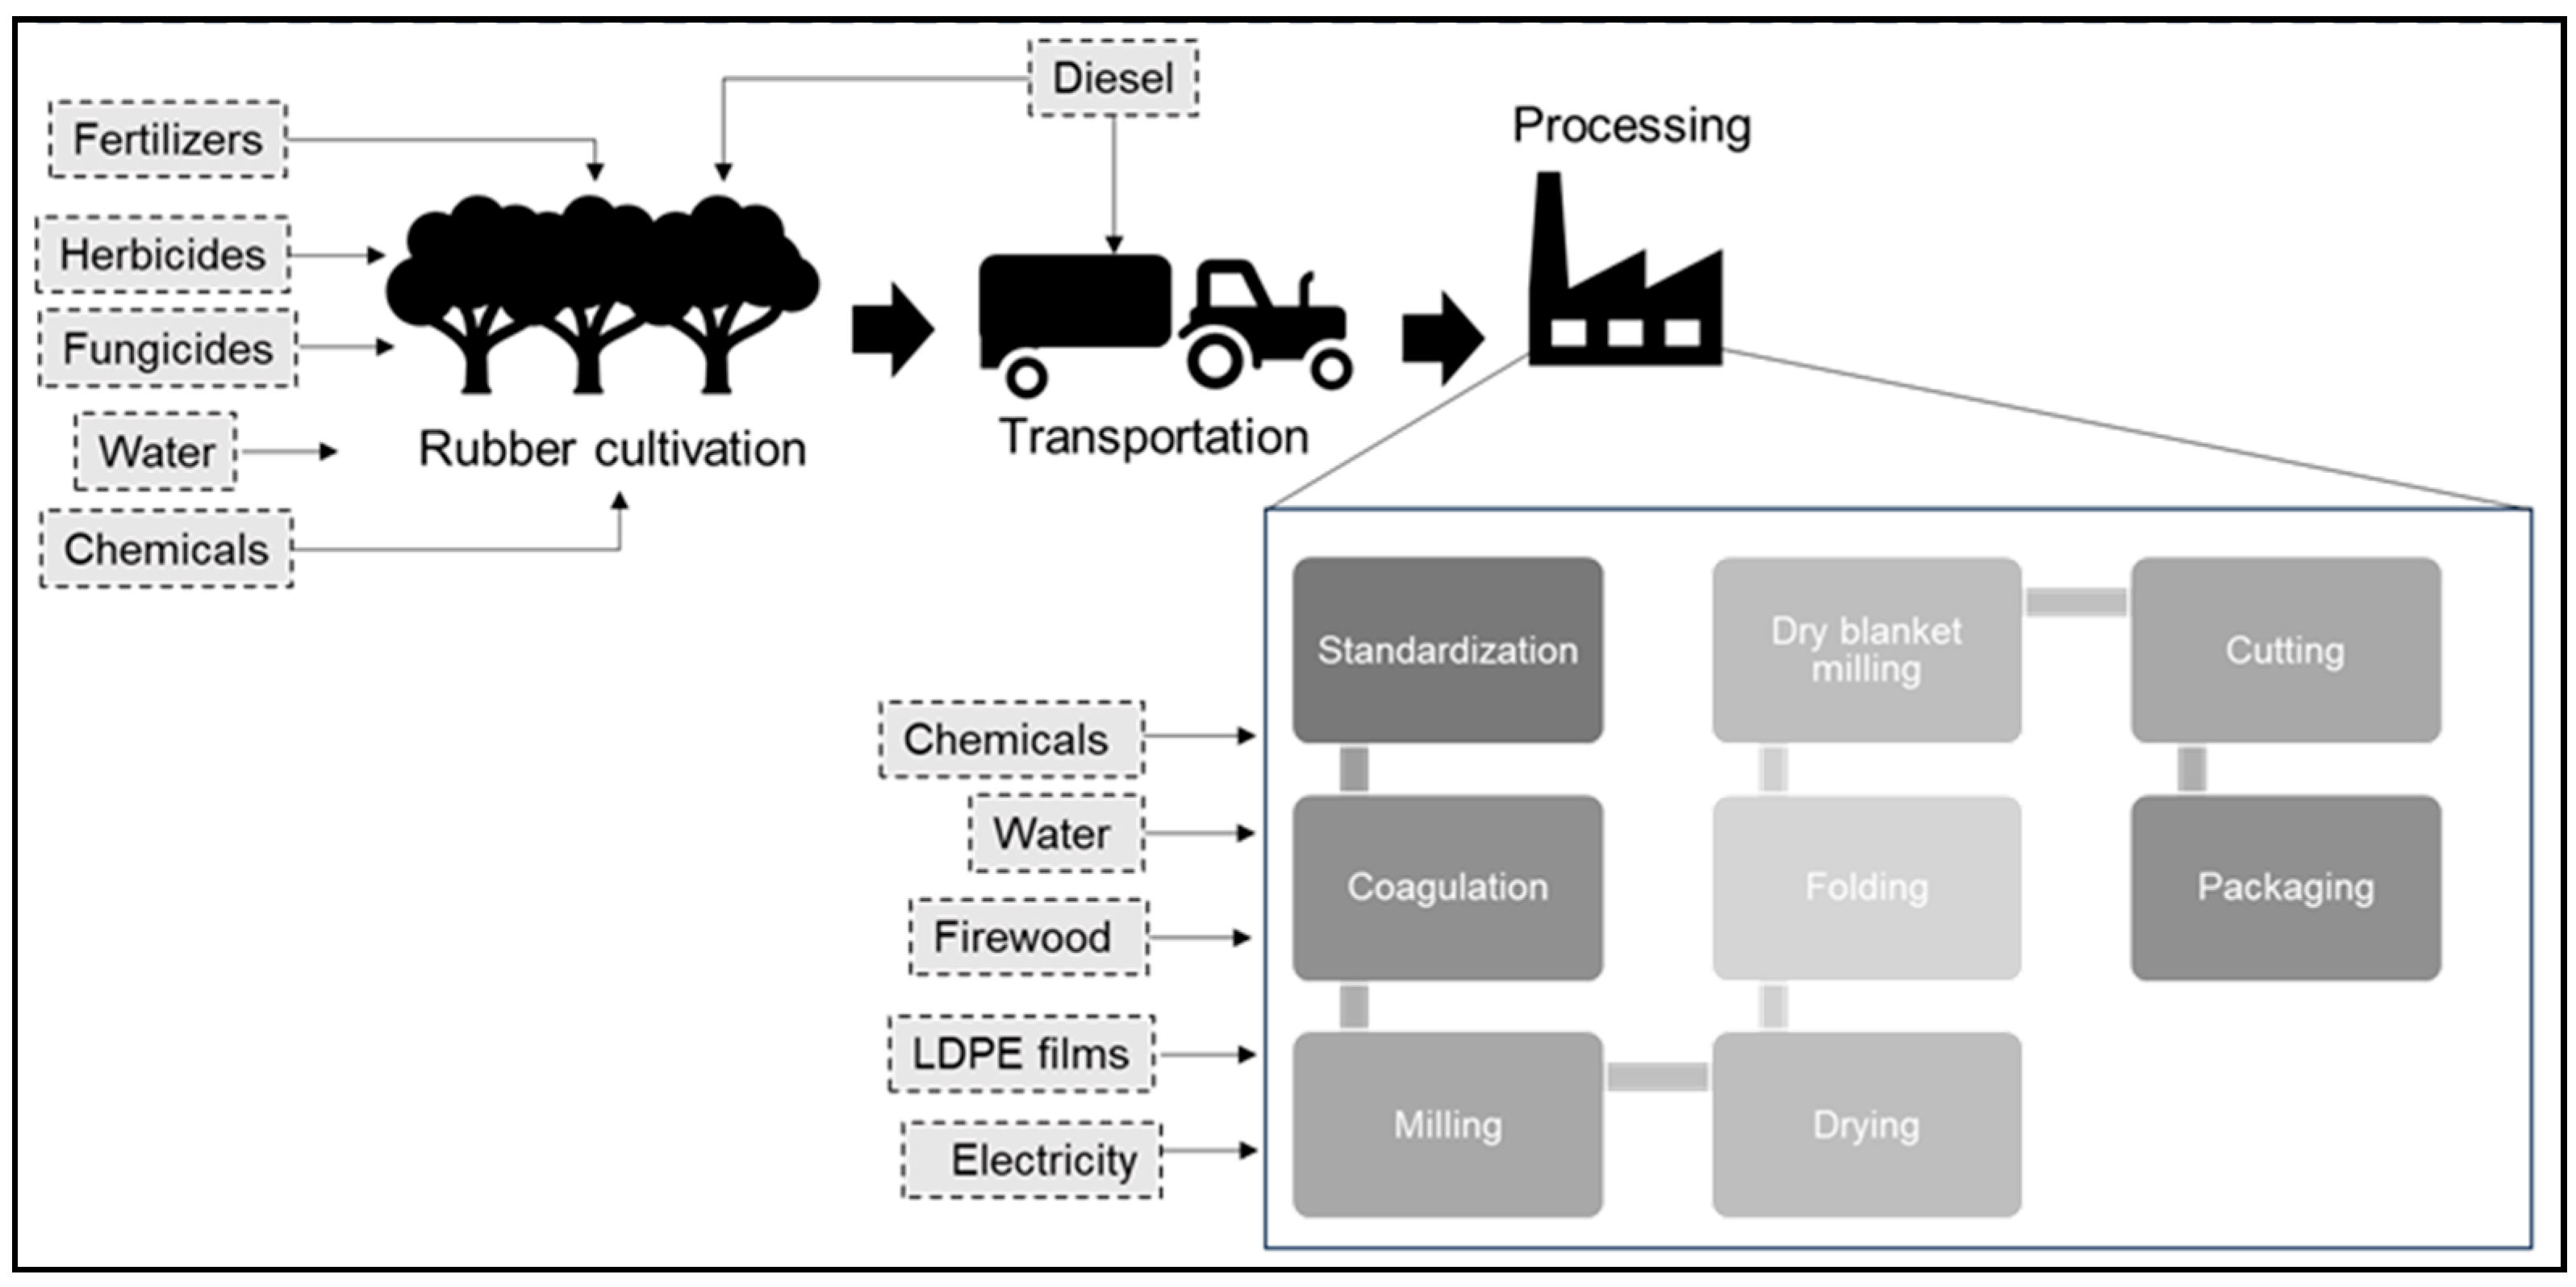
2.1. Details of Rubber Cultivation

The rubber plantation cycle examined in this context extends over a 25-year period, incorporating the nursery period (one year), unyielding immaturity (five to seven years), and yielding maturity stages (over seven years)[2]. The cultivation process begins at the nursery stage, when the seeds collected from fully grown rubber trees are sown. During early development, these plants are grafted with selected genotypes with known characteristics. When these plants reach the required growth stage in which they can sustain independently, they are moved to transplant in a prepared field, a process that involves clearing land, weed removal, soil tilling, and fertilization. Rubber trees require a minimum period of five years to approach the maturity stage, the point at which they are ready to be harvested. Care is provided to transplanted rubber plants during their immature stage to foster their growth and development, which may include the necessary pruning to manage their shape and size. They are also vulnerable to pests and diseases, making the application of insecticides or fungicides useful [2].
Optimal growth and yield depend on the proper balance of nutrients required by rubber plants. Most rubber-growing soils in Sri Lanka lack sufficient amounts of nitrogen (N), phosphorus (P), potassium (K) and Mg [20]. These deficiencies can be managed by applying appropriate proportions and amounts of inorganic fertilizers. Commonly used fertilizers are urea (for N), rock phosphate (for P), muriate of potash (for K), kieserite (for Mg), and dolomite (for Mg). These are typically applied to the soil surrounding the base of each tree [2,20].

2.2. Crepe Rubber Production Process

Initially, rubber in the form of latex is extracted from the rubber tree and sent to the crepe rubber processing factory using bowser trucks. Sodium sulfite is added to rubber prior to transportation as a preservative to combat fungal growth. On arrival at the factory, fresh latex is standardized, separating the yellow pigments and leaving behind the white fraction, which contains most of the rubber particles. Sodium bisulfite and water were then added, according to dry rubber content, to this white fraction, which comprised approximately 10% of the dry rubber content (DRC) [2,21]. The white fraction was transferred to concrete tanks and mixed with water, formic acid, and bleaching agents during the coagulation stage. The process involves converting the white fraction coagulum into cube-shaped pieces by passing it through various milling equipment, including roller mills, a macerator, a diamond roller, and a smooth roller. The main objective of the milling process is to reduce the size of large coagulum pieces with high water content to thin rubber strands called lace crepe with lower water content. These thin strands are then hung on a drying tower for approximately three to four days. After drying, the crepe laces are stacked and folded into 25 kg mats and then passed through a roller mill, known as a dry blanket mill, creating soft-edged rubber blankets. These rubber blankets are cut into customer-specified sizes to produce what is known as blanket crepe rubber. The last step in crepe rubber production involves visual grading and packaging of the product for sale. The yellow fraction is also subjected to the same procedure to produce lower grade of crepe rubber [2].
Figure 1. System boundary of the study. LDPE refers to low density polyethylene.
Preprints 141167 g001

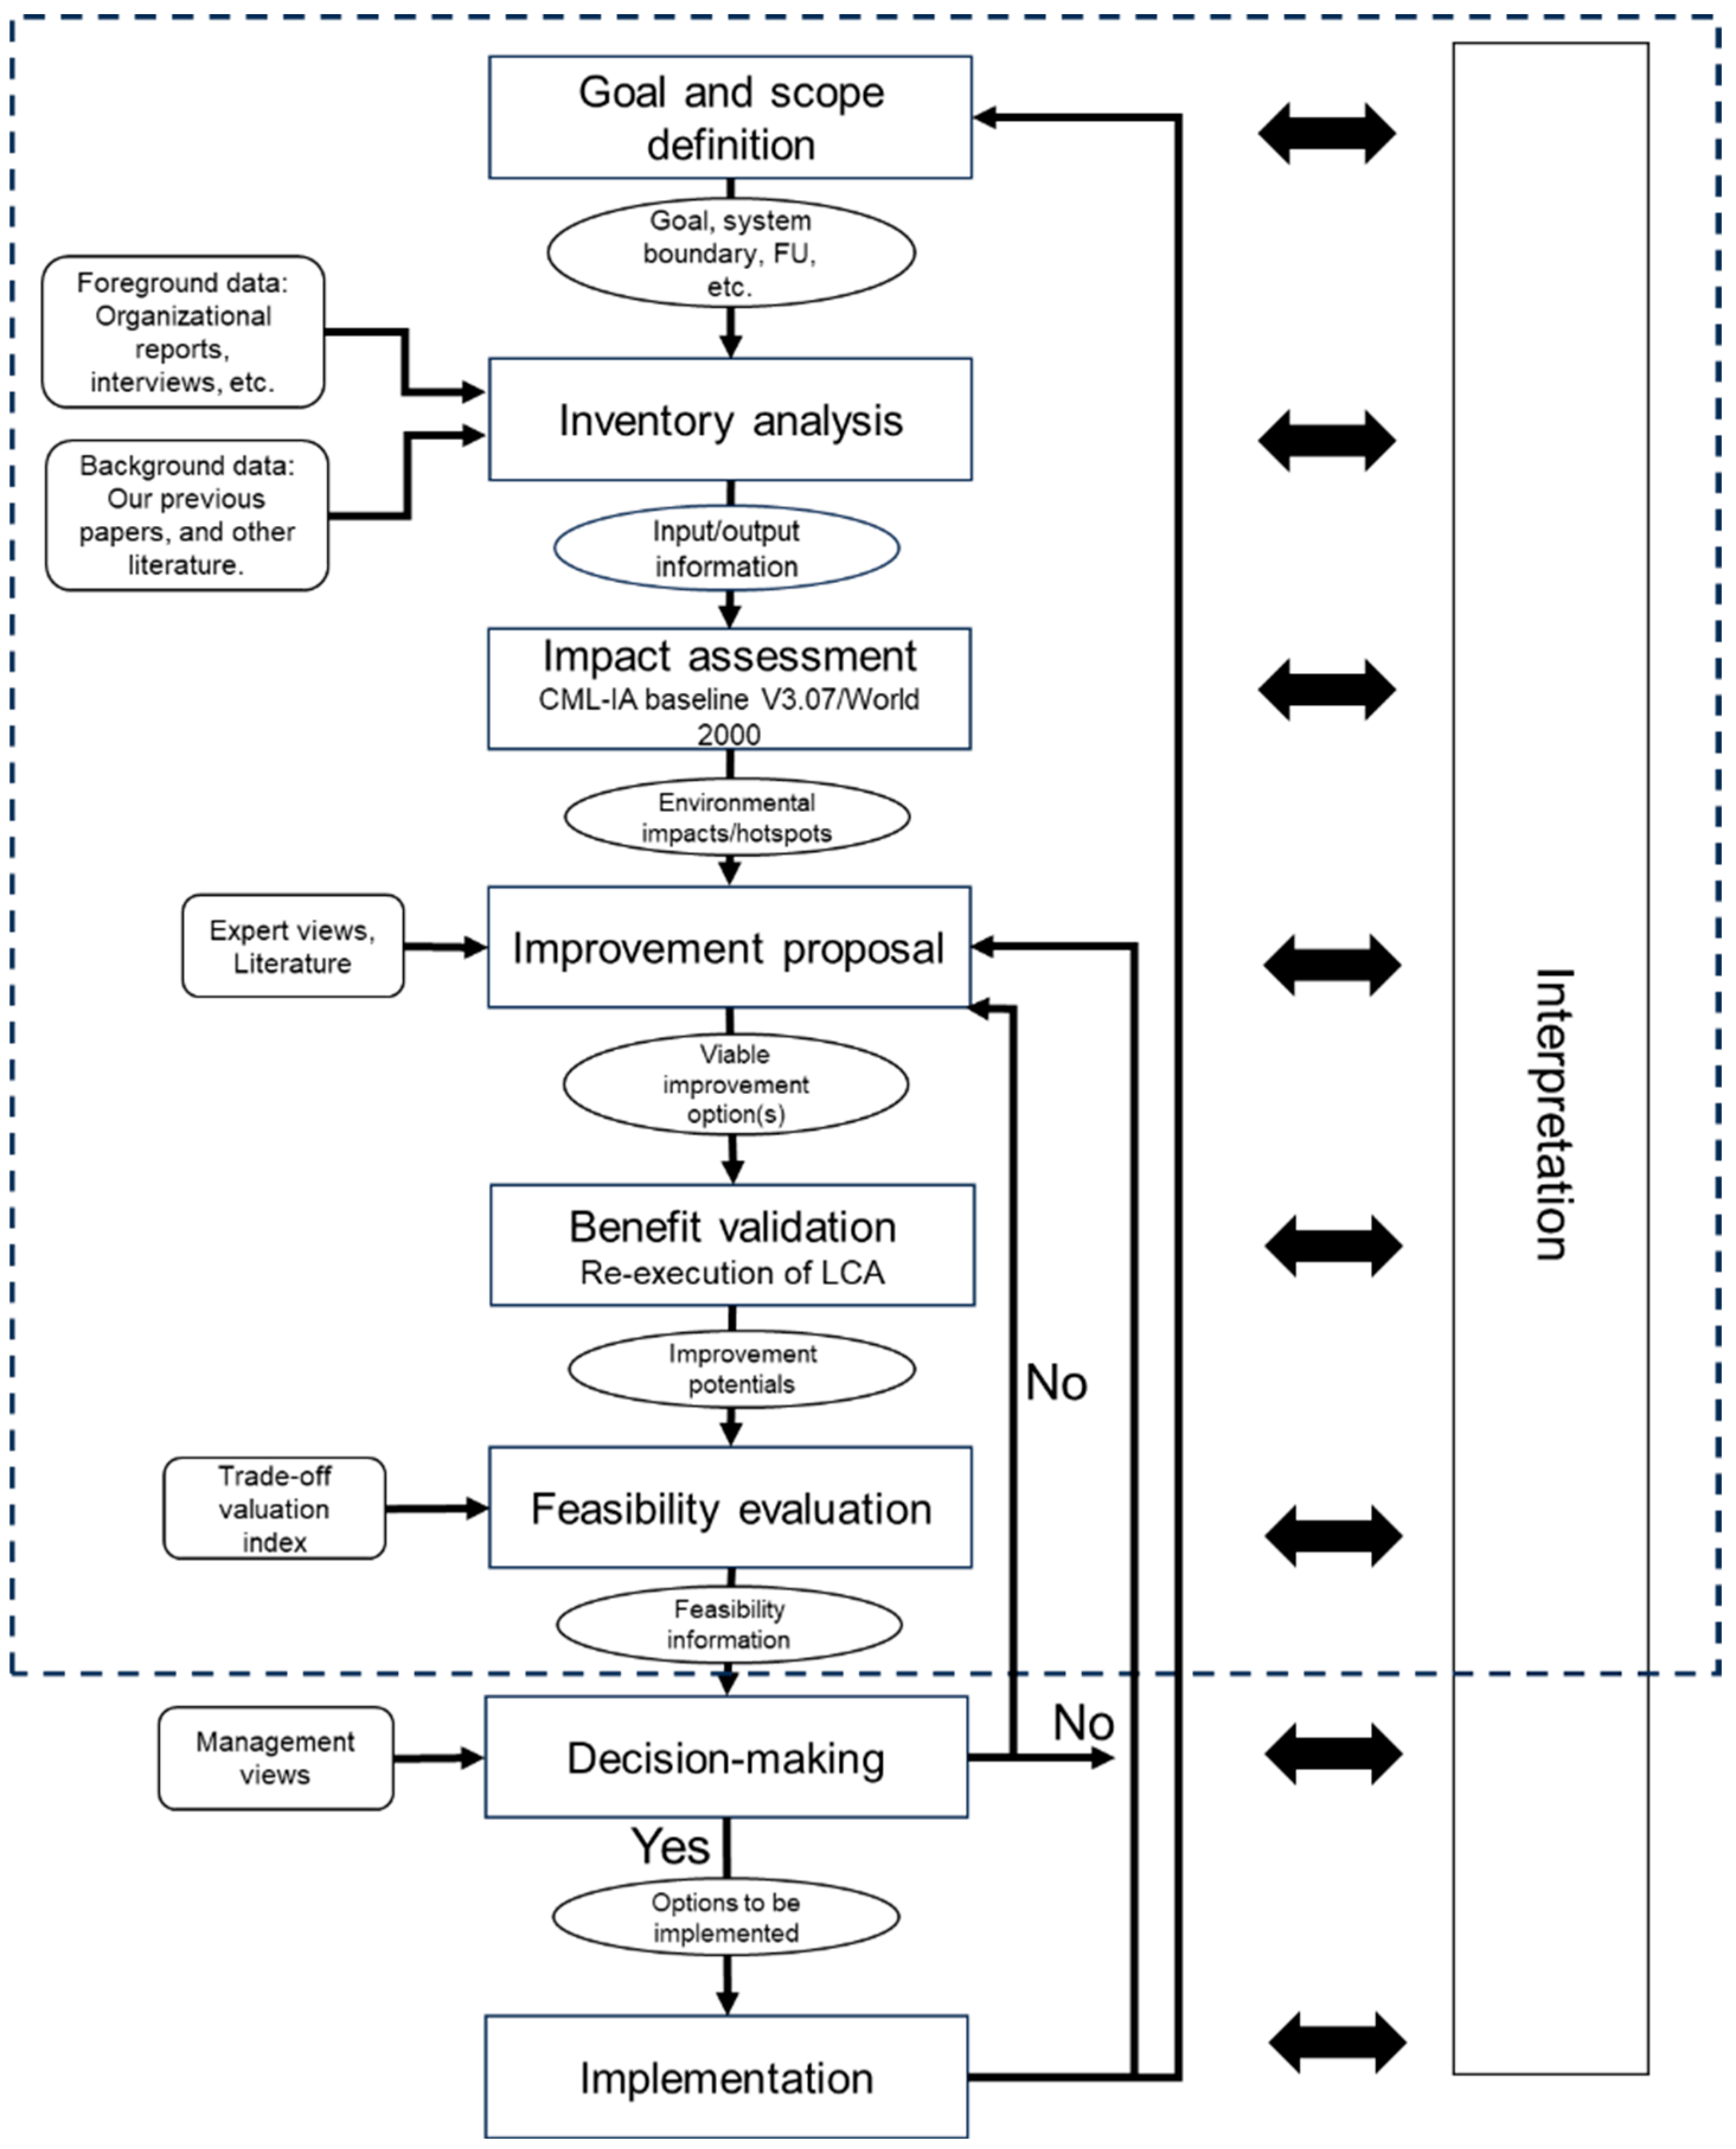
2.3. The Framework of the Study

The framework and its boundary used in our study are defined in Figure 2. Therein, raw data input, methods used, and outputs obtained, are visualized using ovals, rectangles, and rounded rectangles, respectively. It comprises six primary steps to concisely describe the framework. Impact evaluation: We determined the environmental impacts and potential hotspots within the current production system. Improvement proposal: We proposed viable improvement options through consultations with factory personnel and experts as well as through a review of the literature. Benefit validation: The potential benefits of such options were estimated by re-executing LCA. Feasibility evaluation: we then evaluated the financial, environmental and social feasibility of each individual option and the combined scenario using financial, environmental and social payback times, and the trade-offs between the options that were monitored using the novel 'trade-off valuation index (TOVI).' Decision-making: Management makes decisions based on the feasibility results of the previous step. Implementation: Management implements the improvement options (s) decided in Step 5. Our study went only up to the fourth level allowing the management to move onto the next two stages. Additional methodological details, including specific techniques and tools, are elaborated in the following sections of our paper.

2.3.1. Impact Evaluation

Life Cycle Assessment (LCA) is widely recognized as a comprehensive approach for evaluating the environmental impacts of products and services throughout their life cycle and has been the most advanced and tried-and-true methodology for assessing the environmental burden of processes or products. It follows the ISO 14040/44 standards[22] and accordingly, we trailed the steps of goal and scope definition, inventory analysis, impact assessment, and interpretation.
1.
Goal and scope definition
At the goal and scope definition stage of the LCA, the boundaries, system description, functional unit, and intended applications of the study were established. Our study aimed to assess the environmental impact of crepe rubber production in Sri Lanka. The system boundary herein is from cradle to gate, encompassing all stages of the crepe rubber production process, from natural rubber extraction to processing. The functional unit is defined as 'producing 1 tonne of crepe rubber. '
2.
Inventory Analysis
In the inventory analysis stage of the LCA, all inputs and outputs associated with the life cycle stages of crepe rubber production were identified and quantified. In the assessment, two types of inventory data were gathered: foreground and background. The foreground data pertained specifically to the system under analysis, while the background data served as inputs for the evaluation but are not specific to the product being evaluated. In Figure 1, processes related to the foreground system are depicted in a darker shade, whereas those associated with background systems are shaded in lighter colors.
3.
Data collection for rubber cultivation
Foreground data for fertilizer use in rubber cultivation were obtained from the Soil and Plant Nutrition Department of RRISL [23]. The calculations were based on an annual average over the 25-year plantation cycle, assuming a productivity of 1 ton/ha/year on a dry basis [24]. On-site (direct) emissions from fertilizers (NH3 in air, N2O in air, NO3- in water, CO2 to air from urea, and phosphorus emissions to water) were calculated using standard emission and conversion factors presented in Table 1 and Table 2, respectively. Although specific data on the use of fungicides and herbicides and the consumption of diesel for tillage in Sri Lanka were not available, general information applicable to rubber producing countries was obtained from the relevant literature [25,26,27] evaluated the environmental impacts of chemical pesticides, assuming that there is no drift and complete deposition in the soil. Consequently, herein, the entire application of pesticides was treated as input, with equivalent emissions attributed to soil pollution.
4.
Data Collection for Crepe Rubber Processing
The foreground data collected were based on the traditional crepe rubber factories in Sri Lanka and extracted from our previous publications [9,10,28]. The factory has a production capacity of 500 kg of rubber per day and maintains a workforce of 50 employees. Quantitative data on water and electricity consumption, packaging materials use, and rubber throughput were acquired through measurements on site. A laboratory assessment was performed to determine the ash content of the rubberwood. We also referred to factory logbooks and conducted field interviews to obtain data on percentage dry rubber content in latex, chemicals used, work hours, and extent of rubber losses. Wastewater emissions were calculated using the emission factors for CH4 and N2O provided by the IPCC reports [29] as well as the specific characteristics of wastewater for crepe rubber factories detailed in [30]. Inventory data for rubber cultivation and processing are summarized in Table 3 and Table 4, respectively.
For the background processes, we selected representative industrial processes from the ecoinvent v3.8 database considering geographic location of our production system. We selected cut-off system models from ecoinvent because of their simplicity [31]. The cutoff model avoids attributing environmental burdens to recycled materials, treating them as if they do not have prior environmental impact. (for a detailed list of processes used from ecoinvent database v3.8, see Table S1). After gathering the necessary background and foreground data, we mapped the production system using SimaPro software v9.3 [32] to perform the impact assessment of the life cycle.
5.
Impact assessment
In the impact assessment stage, the environmental impacts of the identified inputs and outputs were quantified and evaluated. Having limited impact assessment methods specific to Sri Lanka, the CML-IA baseline V3.07/World 2000 method developed by the Institute of Environmental Sciences of the Universiteit Leiden in the Netherlands was used herein as impact assessment method [18]. The eleven impact categories were considered: Abiotic Resource Depletion in non-fossil resources, expressed as kg of Sb eq (represents the reduction of the total amount of natural resources that are available on Earth), Abiotic Resource Depletion in fossil resources, expressed as MJ (represents the use of fossil fuels such as oil, natural gas, and coal along a product life cycle), Global Warming Potential with a period of 100 years (GWP100), detonated as kg of CO2 eq (Measures the impact on global warming over 100 years due to greenhouse gas emissions), Ozone Layer Depletion Potential; expressed as kg of CFC-11 eq (Indicates the thinning of the stratospheric ozone layer caused by certain chemicals such as chlorofluorocarbons (CFCs), hydrochlorofluorocarbons (HCFCs), etc.), Human toxicity, expressed as kg 1,4- dichlorobenzene (1,4-DB) eq (Assesses potential harm to human health from toxic substances released into air, water, and soil, such as heavy metals (e.g., lead, mercury), organic pollutants (e.g., dioxins, PCBs), pesticides, volatile organic compounds (VOCs), and particulate matter), Freshwater Aquatic Ecotoxicity Potential expressed as 1,4-dichlorobenzene (1,4-DB) (Measures toxic impacts on freshwater ecosystems, including effects on aquatic organisms, due to the release of pollutants such as industrial chemicals, pesticides, heavy metals, pharmaceuticals, and microplastics), Marine Aquatic Ecotoxicity Potential measured in1,4-dichlorobenzene (1,4-DB) (Assesses toxic impacts on marine ecosystems, considering the persistence and accumulation of chemicals in the marine environment), Terrestrial ecotoxicity expressed as kg 1,4-DB eq (Quantifies toxic effects on land-based ecosystems, including soil organisms and terrestrial food chains, due to contaminants such as pesticides, herbicides, heavy metals, industrial chemicals, and atmospheric deposition of pollutants), Photochemical Ozone Creation Potential, expressed as kg of C2H4 eq (Measures the formation of ground-level ozone (smog) through the reaction of VOCs and NOx in sunlight), Acidification Potential, expressed as kg of SO2 eq. (represents the emissions of acidifying substances like NOx, SOx etc.), and Eutrophication Potential, expressed as kg of PO43- eq (represents undesirable input of nutrients emitted and input into ambient water or soil).
6.
Interpretation
The interpretation step involved evaluating and understanding the environmental impacts measured during the impact-assessment stage.
7.
Sensitivity analysis
Sensitivity analysis in Life Cycle Assessment is a crucial step that helps identify how the variability or uncertainty in the data used in the study can affect the results [33,34]. We conducted sensitivity analyses based on two segments: the input parameters (see section 3.2 for more details) and impact assessment methods [33,34,35].
The selection of an impact assessment method can significantly affect the results of a life cycle assessment study. In the absence of impact assessment methods specific to Sri Lanka, we employed the CML-IA baseline V3.07/World 2000 method as our primary analytical tool. To assess how robust our approach is and also to explore the potential variability in environmental impact conclusions, three additional methods were included in our sensitivity analysis, i.e. Impact 2002+, Eco-indicator 95 v2.06, and EPD 2013 [33]. Impact 2002+ was developed at the Swiss Federal Institute of Technology and built on its predecessor IMPACT 2002 [36]. Eco-indicator 95 emerged from a Dutch project involving an array of entities including PRé Consultants, Philips Consumer Electronics, and several Dutch universities and research institutes under the NOH program [37]. The EPD 2013 method, drawing on impact categories from the CML baseline 2000 method, is tailored for the preparation of environmental product declarations, providing a standardized way to communicate the environmental performance of products [38].

2.3.2. Improvement Proposal

We proposed feasible improvement options derived from the hotspots identified during the impact evaluation phase. Those were co-identified with the participation of with the factory management and supported by the literature [8,9,10,24].

2.3.3. Benefit Validation

The potential for improvements in each option and the combined scenario representing the implementation of all options were evaluated by re-executing the LCA.

2.3.4. Feasibility Analysis

We measured the feasibility of each option and the combined scenario by calculating their financial, environmental and social payback periods, as detailed in equations 1, 2, and 3, respectively [17].
F P B T = I A M S    
Where FPBT, I, and AMS are the financial payback period, initial investment, and annual monetary savings, respectively.
E P B T i = E i A E I i                
Where E P B T i is the environmental payback time related to the environmental impact described by the ith impact category; E i is the embodied environmental impact described by the ith impact category bound by the option; and A E I i is the avoided environmental impact of the ith impact category by the option on an annual basis.
S P B T j = S j A S I j                          
Where S P B T j is the social payback time related to the social impact described by the jth impact category, S j is the embodied social impact described by the jth impact category bound by the improvement option; and A S I j is the avoided social impacts of jth impact category by the option on an annual basis.

2.3.5. Trade-Off Valuation Index

The TOV index was developed to compare the sustainability performance of investments and improvement options by capturing direct and indirect financial, environmental, and social gains. This also indicates trade-offs across these aspects for each option. The index varies between 0 and 1; a higher value signifies greater sustainability, and vice versa for lower values. We proposed a similar index in Dunuwila et al. [17], but it lacked representation of the social aspect.
T O V   i n d e x = a e F P B T + b   e E P B T i + c   e S P B T j
Where F P B T is financial payback time, E P B T i is the environmental payback period of ith environmental impact category, S P B T j is the social payback time associated with jth social impact category. Constants a and b represent relative importance, where a + b + c = 1. Impact categories in ELCA and SLCA can be selected at the discretion of the practitioners.

3. Results and Discussion

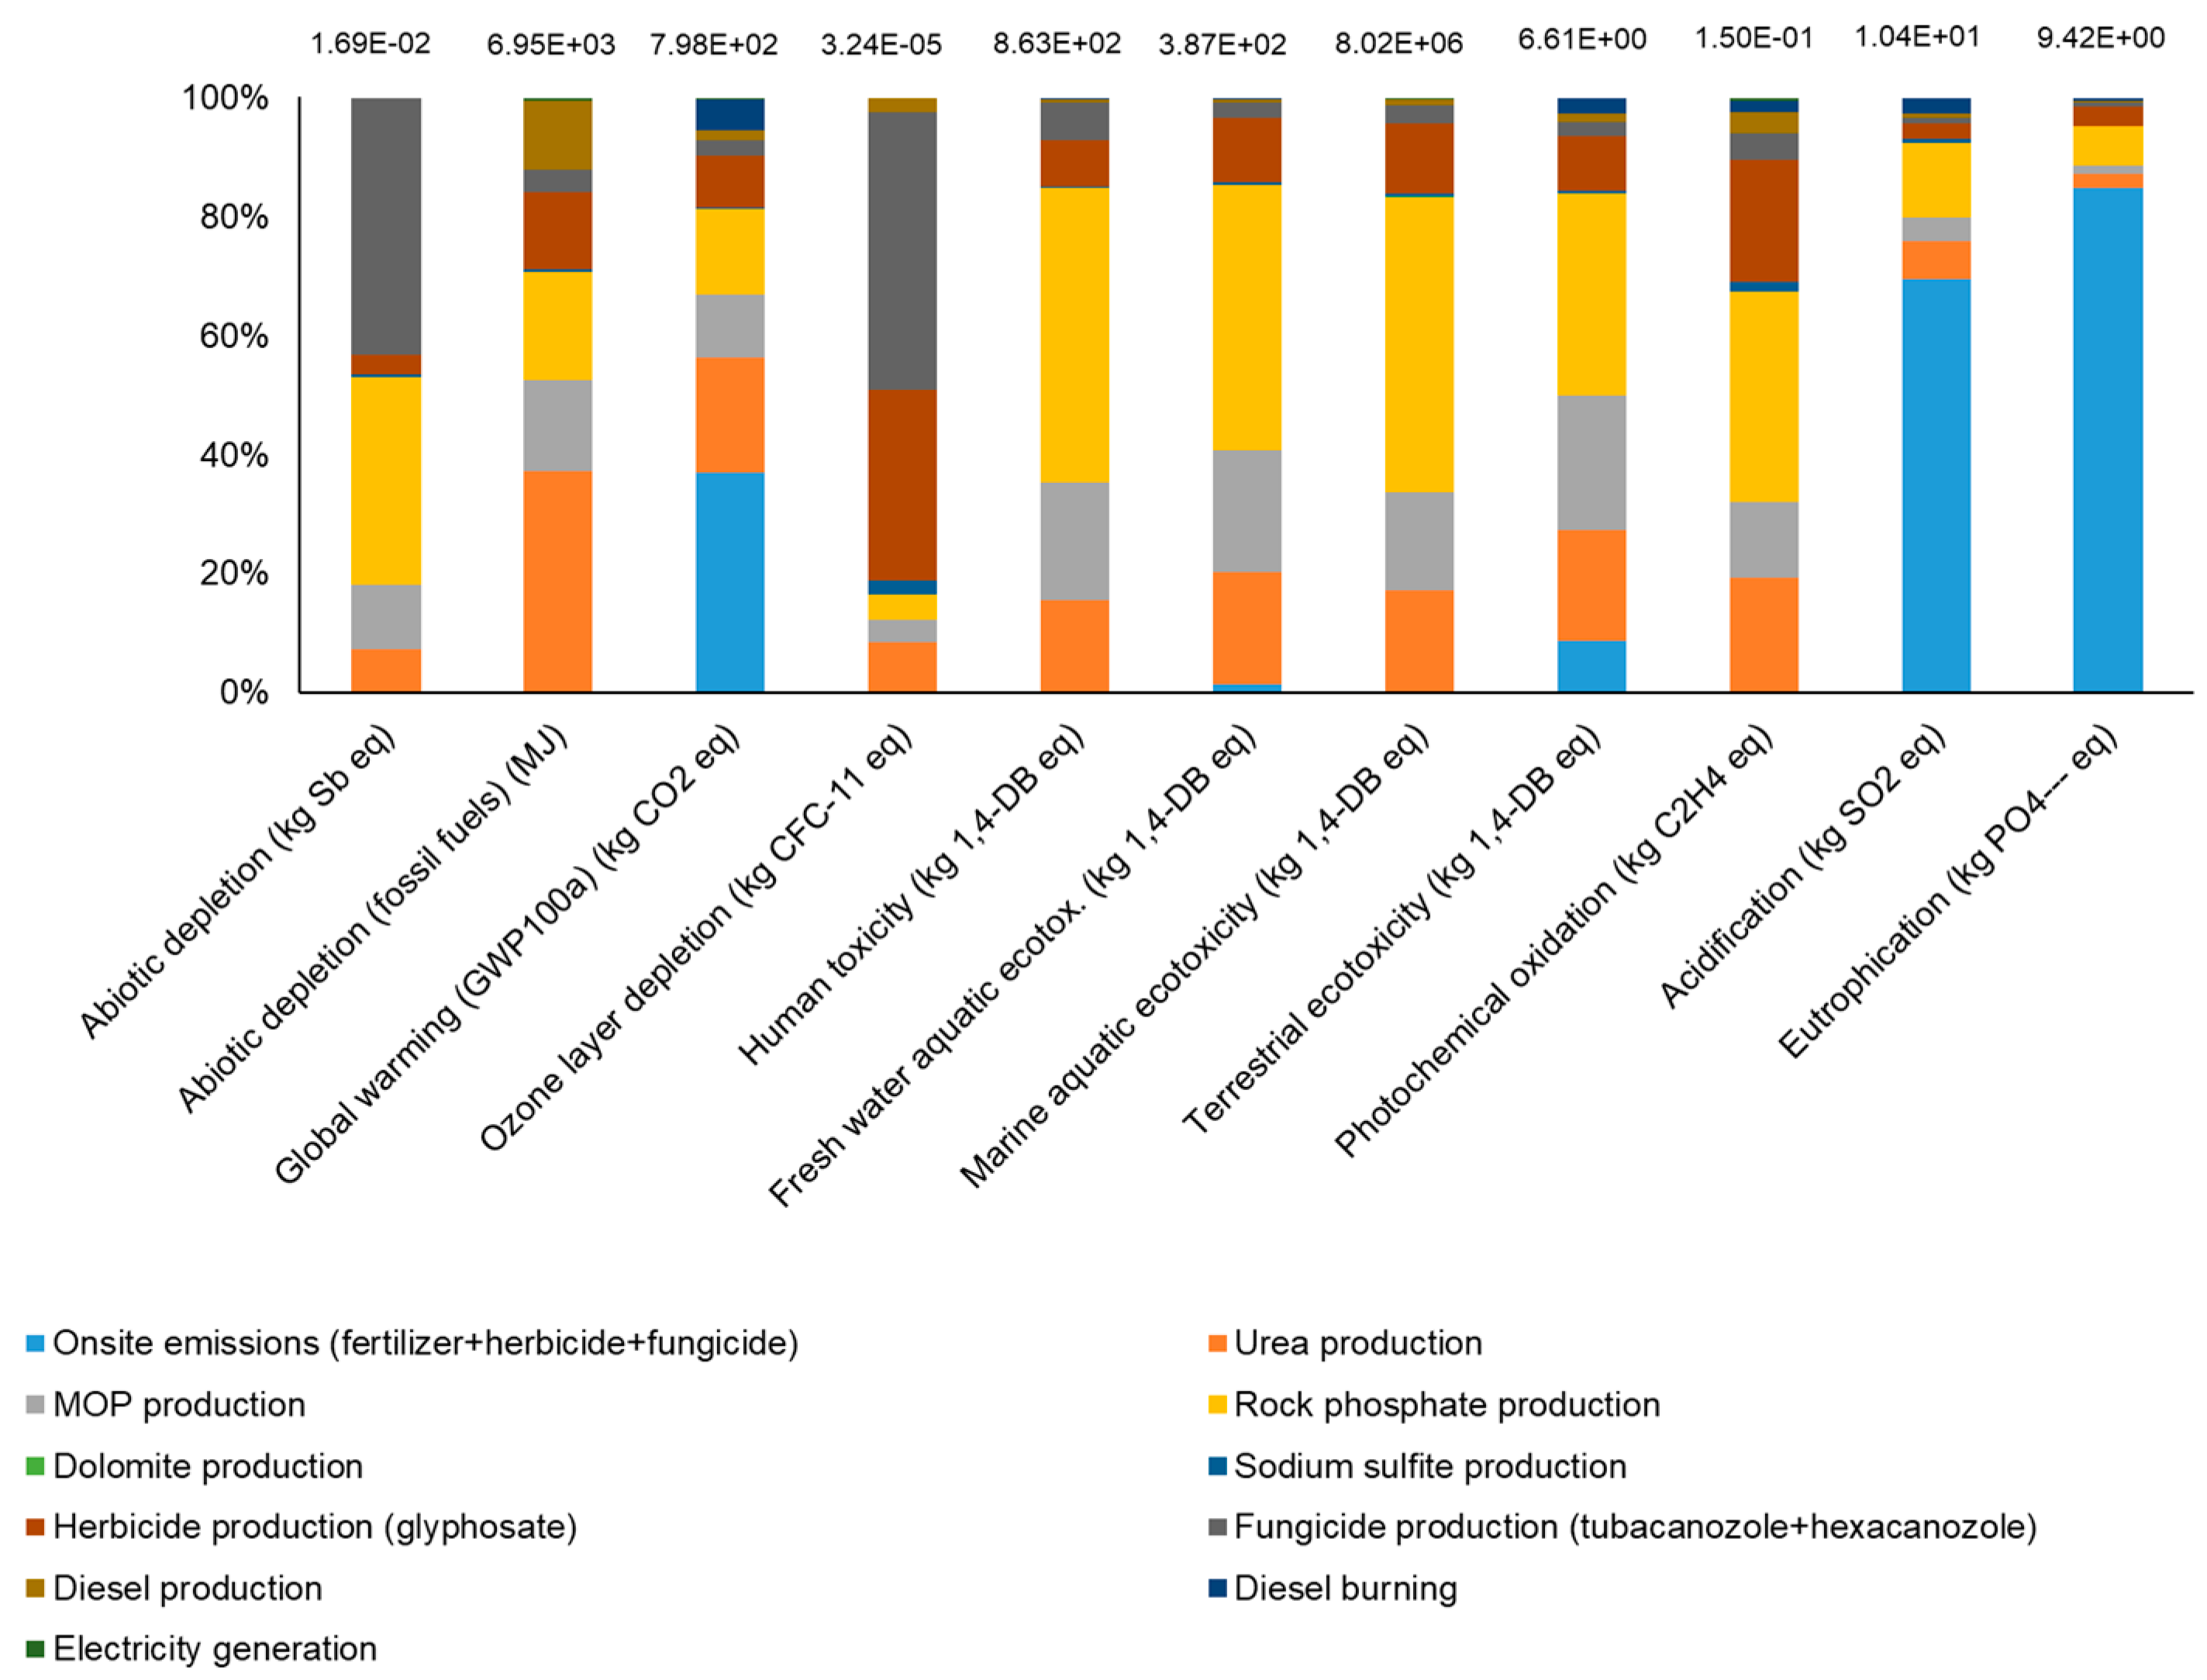
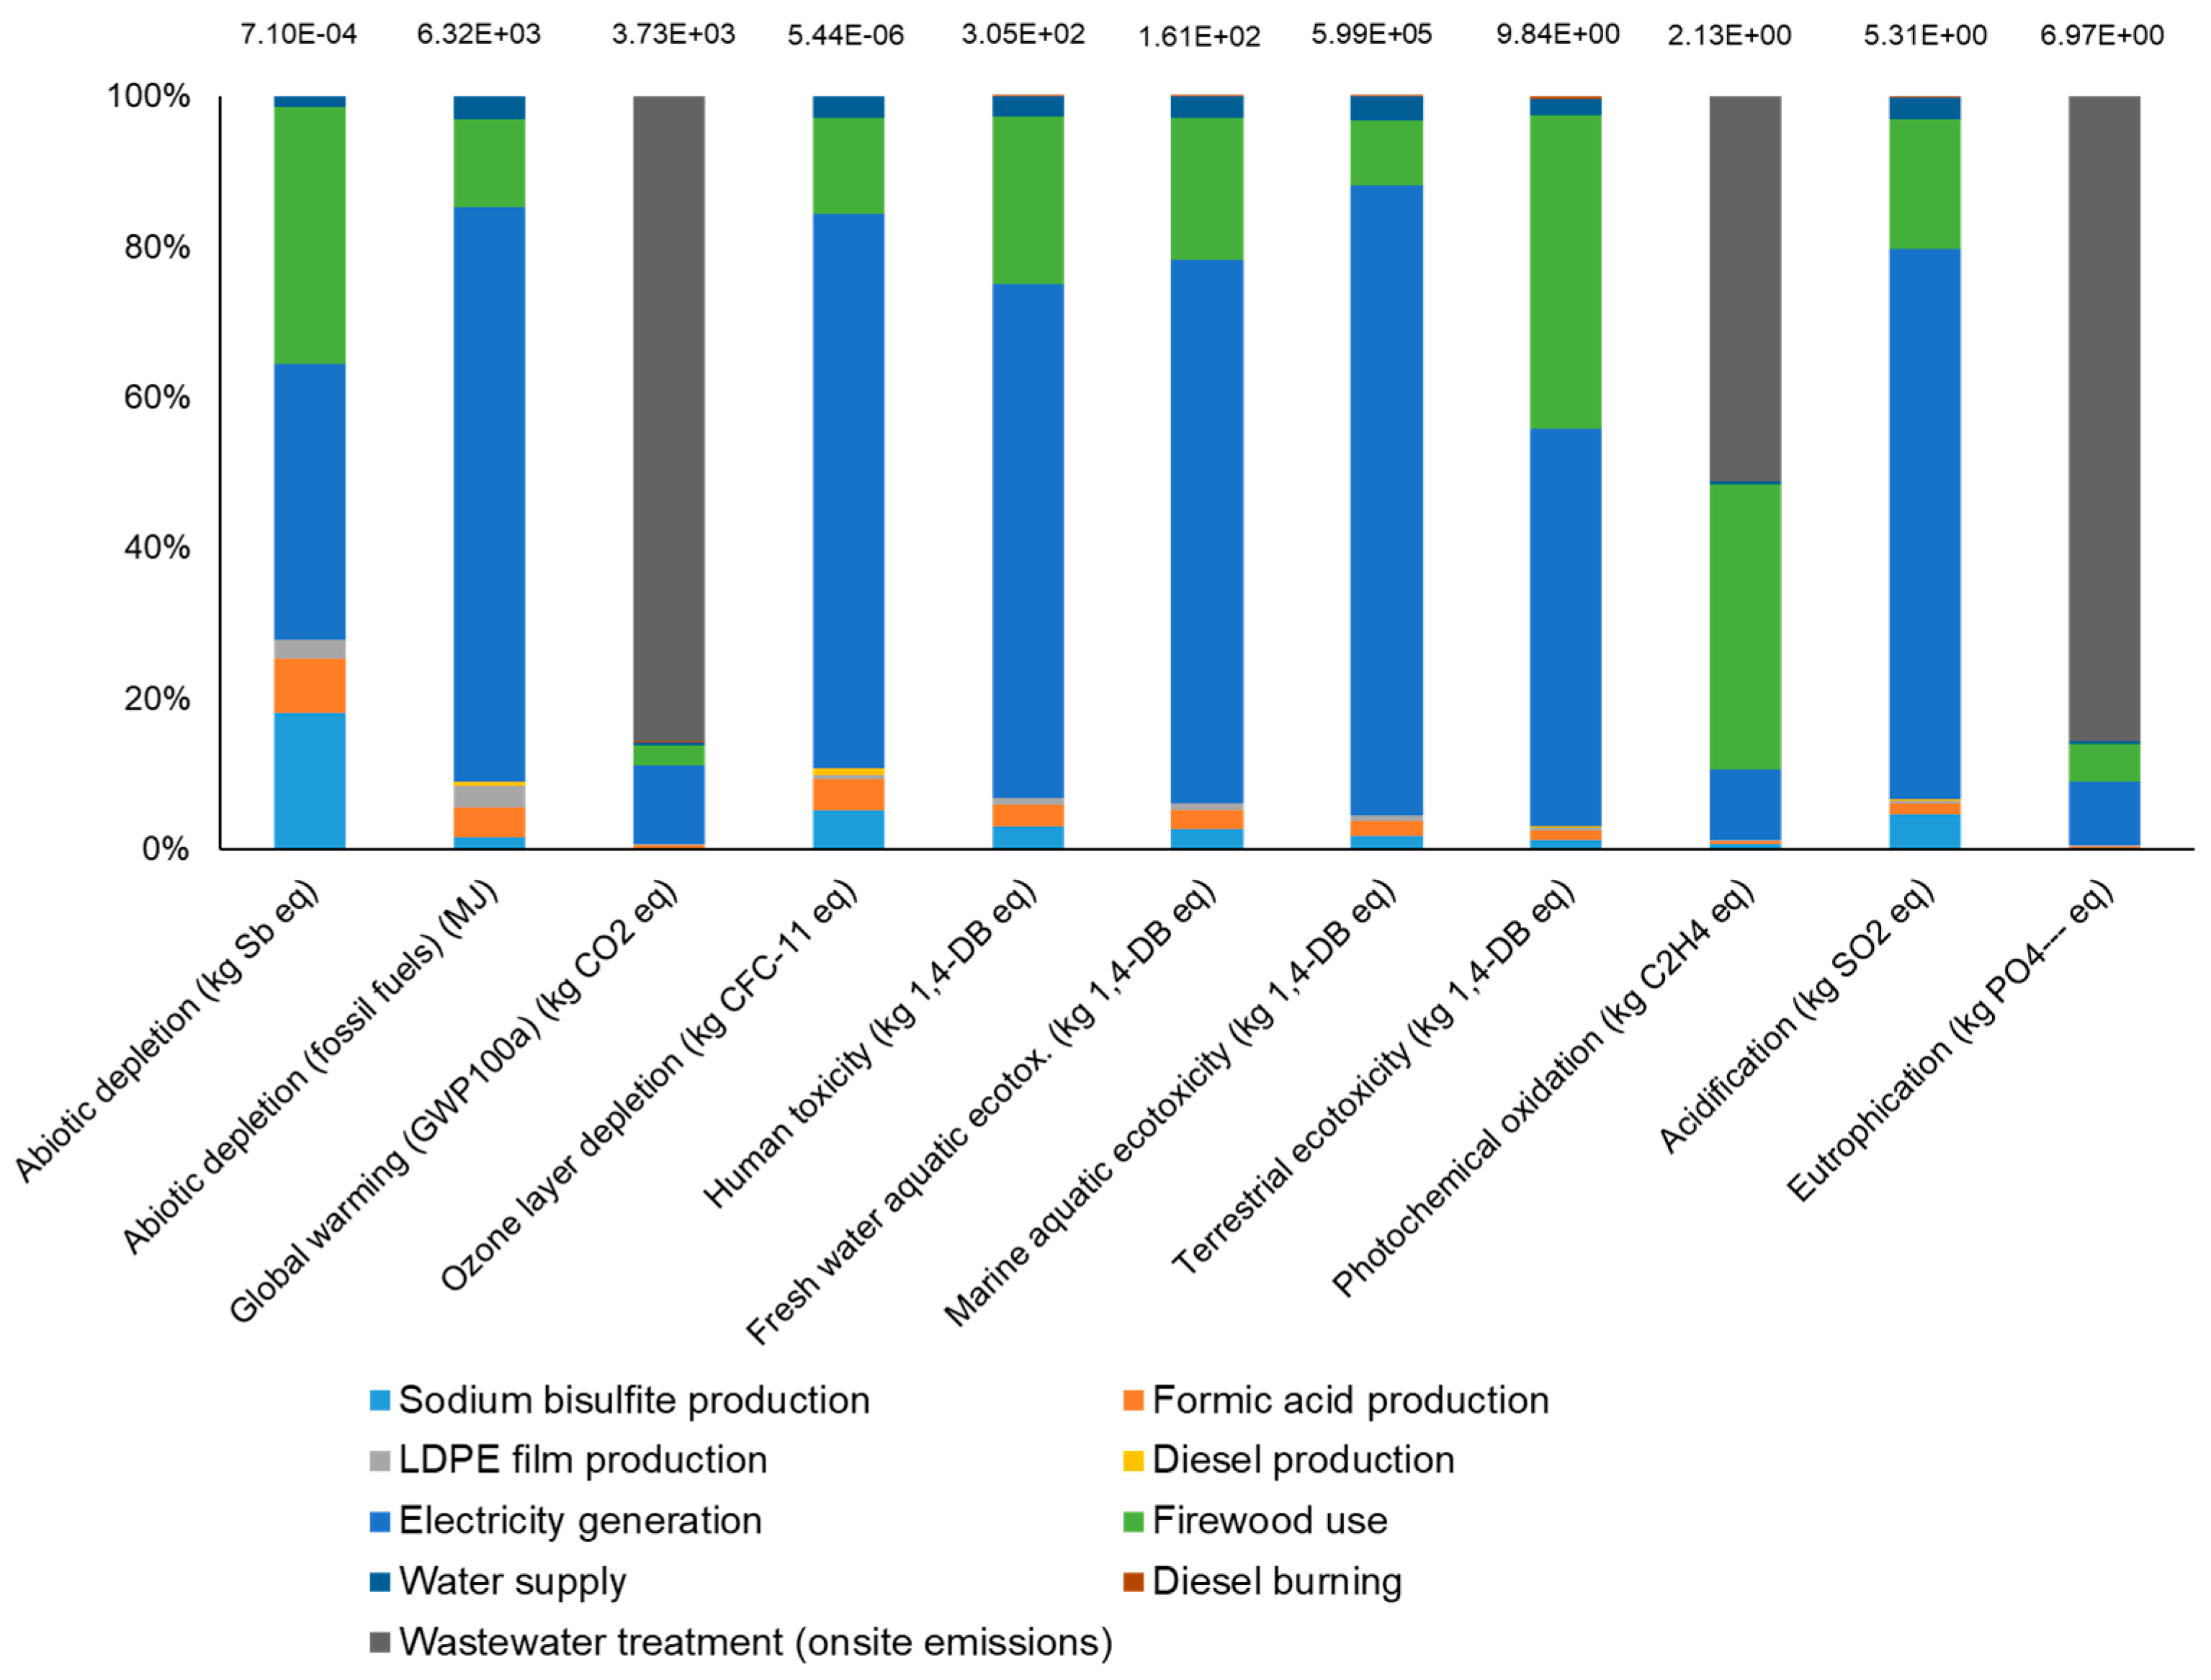
3.1. Impact Evaluation Results

The main inputs for rubber cultivation were fertilizers. Specifically, the amounts of urea, rock phosphate and MOP were recorded at 79.36 kg, 70.45 kg, and 77.34 kg per 1000 kg of dry rubber, respectively. In particular, urea fertilizers can generate not only on-site emissions, but also production-based upstream emissions, which can have significant environmental impacts. For instance, ammonia emissions from urea application contribute to nitrogen deposition, leading to eutrophication in nearby ecosystems. This can disrupt the natural balance of nutrients, promote the growth of undesirable algae and aquatic plants, degrade water quality, and harm aquatic life [39].
Table 3 and Table 4 present the inventory of materials and energy for producing 1 tonne of white crepe rubber during the rubber cultivation and processing stages. An average of 3130 kg of fresh latex is required to produce 1 tonne of crepe rubber. Water is excessively consumed by material in the production system (N.B., the water use for crepe rubber is 50,000 liters per tonne of crepe rubber [2]). This was largely due to poor factory housekeeping, which caused unexpected breakdowns and leaks in the water system. Furthermore, the high usage of water in conjunction with fresh latex generated a large amount of wastewater, with an average of 88,437 kg per 1 tonne of crepe rubber output.
The impact assessment results for the cultivation and processing phases are shown in Figure 3 and Figure 4, respectively. According to Figure 3, the impacts of fertilizer production were dominant across most impact categories during the cultivation phase (i.e., Abiotic depletion, Human toxicity, Freshwater aquatic ecotoxicity, marine ecotoxicity, terrestrial ecotoxicity, photochemical oxidation). Specifically, the production of phosphorus fertilizer makes notable contributions in this regard. For instance, Human toxicity is dominated by thallium and arsenic released into the water during sulfuric acid production in the upstream segment of phosphorus fertilizer production. However, urea production has become the primary driver of abiotic depletion (fossil fuels) because of natural gas consumption in ammonia production in the upstream portion of the supply chain (N.B., Ammonia was used as the hydrogen source). The depletion of the ozone layer was dominated by the production of herbicides (tebuconazole and hexaconazole). This was attributed to the CFC-12 gas released from dichloromethane production in the upstream supply chain of the above herbicide. Furthermore, the impacts of on-site emissions are the dominant factors for Acidification and Eutrophication owing to the release of NH3 and NO3-from fertilizer use. The GWP category also showed some dominance from on-site impacts, stemming from the N2O and CO2 emissions associated with fertilizer use at the site.
In the raw rubber processing phase (Figure 4), electricity generation was the dominant factor across most impact categories, except for Global Warming Potential, Terrestrial Ecotoxicity, Photochemical Oxidation, and Eutrophication. In these cases, GWP and eutrophication were affected by CH4 (released to air) and NO3- (released to water) from the wastewater treatment plant, respectively. Terrestrial ecotoxicity and photochemical oxidation are influenced by the chromium released into the soil from ash and the CO released into the air from firewood use, respectively.

3.2. Sensitivity Analysis

This study included a sensitivity analysis to test the assumptions and informed guesses made during the inventory development process. Here, the effect of the parameters on the results was tested, giving them a + or − 5% change. The tested parameters were as follows: CH4 and N2O emission factors, NO3-, NH4+, COD, and BOD concentrations used to calculate the emissions from wastewater treatment plants (N.B. these emissions were calculated based on generic emission factors and concentrations extracted from the literature, i.e., Eggleston et al. [29]; Gamaralalage et al. [30]. The largest change (ca. ± 3%) was observed in the impact category of GWP with the change in the CH4 emission factor by ± 5%. In addition, positive or negative 1% changes are evident in photochemical oxidation. A concentration of ± 5% NO3- affects eutrophication to be changed by plus or minus 1%, respectively (see Figure S1 in the supplementary material).
Table 6 compares four environmental impact assessment methods across four categories. For global warming, EPD and CML yield similar results, while IMPACT 2002+ shows the lowest value (60% lower than CML). The depletion of the ozone layer is consistent across three methods, with Eco-indicator 95 being 26% higher. Acidification shows two distinct groups: CML/EPD with identical values, and IMPACT 2002+/Eco-indicator 95 about 45% lower. Photochemical oxidation varies significantly: CML/EPD are identical, while IMPACT 2002+ is 103% higher and Eco-indicator 95 is 77% higher. These variations underscore how the choice of method can significantly impact environmental assessments and subsequent decision-making. The differences likely result from variations in the characterization factors between impact assessment methods.

3.3. Improvement Options Proposal

Using the results of LCI and LCIA, fertilizer, water, and electricity consumption were identified as the primary contributors to the environmental footprint of the production, which required immediate action. Therefore, the reduction of fertilization and wastewater by reducing water use and electricity consumption was considered for improvement. Discussions with factory management and a literature review revealed four viable interventions to reduce environmental impacts.

3.3.1. Option 1: Reduction of Fertilization

Improving the timing and frequency of fertilization and avoiding fertilizer spillage can contribute to increased nitrogen use efficiency [40]. Furthermore, slow-release fertilizers may be a viable option for rubber plantations in terms of nutrient management, though considerations must be given to potential environmental impacts such as microplastic release from polymer-coated fertilizers. Alternative slow-release technologies using biodegradable coatings or natural materials might be more environmentally sustainable options, although further research is necessary on both nutrient release efficiency and environmental impacts. According to the adaptive research unit in RRISL and the literature (i.e., Jawjit et al. [40]), adopting such practices could potentially reduce the overall fertilization rate by ca. 20% in many countries. For the potential benefit calculations, the reduction of N fertilizer has been considered [40].

3.3.2. Option 2: Repair Leaky Joints and Valves and Fit Water Flow Meters

To reduce water use, we recommend that the factory replace defective pipes, joints, and valves with new fittings and install water flow meters on the supply lines of each roller at milling process. Additionally, we proposed assigning fixed water flow rates to these machines (based on the expertise of factory officials), which can be accurately monitored using installed water flow meters [8,9,10].

3.3.3. Option: 3: Installation of Industrial Water Recirculation Cooling System

The water discharged from the cooling system of the machinery was clean and could be easily reused. Consequently, we advised the factory to implement an industrial water recirculation cooling system that would chill and recirculate cooling water at a constant rate [8,9,10]. The details of the most appropriate industrial water recirculation cooling system for the factory were collected by consulting a specialized retailer and referring to our previous works [8,9,10].

3.3.4. Option-4: Installation of Solar Panels

To capitalize on the abundant sunlight in the region, we proposed installing a solar panel system as a renewable electricity source in the factory. Here, we referred to our earlier publications to determine the optimal capacity of the system, where we obtained information on the cost per kilowatt, roof area, applicable tariff schemes, and overall project costs. Embodied environmental and social impacts were accounted for using Eco invent [31] and social hotspot databases (V4) [41] on Sima pro v 9.5[32] (see Table S1, S2 for more details).

3.4. Evaluation of Potential Improvements

3.4.1. Option 1: Reduce fertilization

The greatest reductions (see Figure 5) were apparent under the impact categories of acidification and eutrophication, which were approximately 10% and 9%, respectively (mainly due to suppressed emissions of NH3 to air and NO3- to soil, respectively). Abiotic depletion (fossil fuels) has been moderately improved by ca. 4% (due to the reduced fossil fuel consumption associated with production). Negligible reductions are apparent at abiotic depletion, ozone layer depletion, and photochemical oxidation. This option does not have FPBT as it can benefit from the very point of application. With that, EPBT per respective impact categories can be 0. SPBT recorded 0 as no additional inputs or efforts are required. TOV index recorded 1.0000 in the case of GWP and `Single score normalization ` under the impact assessment method of `Social Hotspot 2022 Category Method. `

3.4.2. Option-2: Repair Leaky Joints and Valves and Fit Water Flow Meters

This option yields significant environmental benefits, achieving a 38% reduction in water use and a 37% reduction in wastewater (see Figure 5). These reductions contribute to a 28% decrease in Global Warming Potential, primarily due to lowered methane emissions from wastewater treatment. Furthermore, notable improvements are observed in other impact categories: a 12% reduction in photochemical oxidation, a 14% reduction in eutrophication, and 10% reductions in both abiotic depletion (fossil fuels) and Marine Aquatic Ecotoxicity. Although a negligible change is observed in overall abiotic depletion, this option achieves an TOV index of 0.7308. FPBT recorded 0.26 years, which is promising. More information on EPBTs is summarized in Table S3. SPBT for this option recorded ca. 1 year.

3.4.3. Option: 3: Installation of Industrial Water Recirculation Cooling System

This option could reduce water consumption by ca.54% while reducing wastewater generation by 59%. GWP has been significantly reduced by ca. 40% with the CH4 reduced from wastewater (see Figure 5). Also, notable reductions of ca.17% and 21% are present in photochemical oxidation and eutrophication categories, respectively. This is due to NO3. However, the extra electricity required has hindered the improvements in most impact categories. FPBT of this option is observed to be 151 years, which is not up to expectations. The TOV index of this option recorded 0.0210, while SPBT was 222 years (see Table S4 for details on EPBT).

3.4.4. Option-4: Installation of Solar Panels

A remarkable improvement in abiotic depletion (fossil fuels) and marine ecotoxicity could be observed which was ca. 41% (this is due to the lower consumption of fossil fuel per functional unit) (see Figure 5). Notable reductions were apparent in majority of the impact categories; for instance, Acidification has been improved by ca. 27%. An impact category such as Abiotic depletion showed negligible reduction. FPBT for this option was recorded for 10 years. TOV index was 0.0340 with an SPBT of 15 years. (see Table S5 for more details on EPBT).

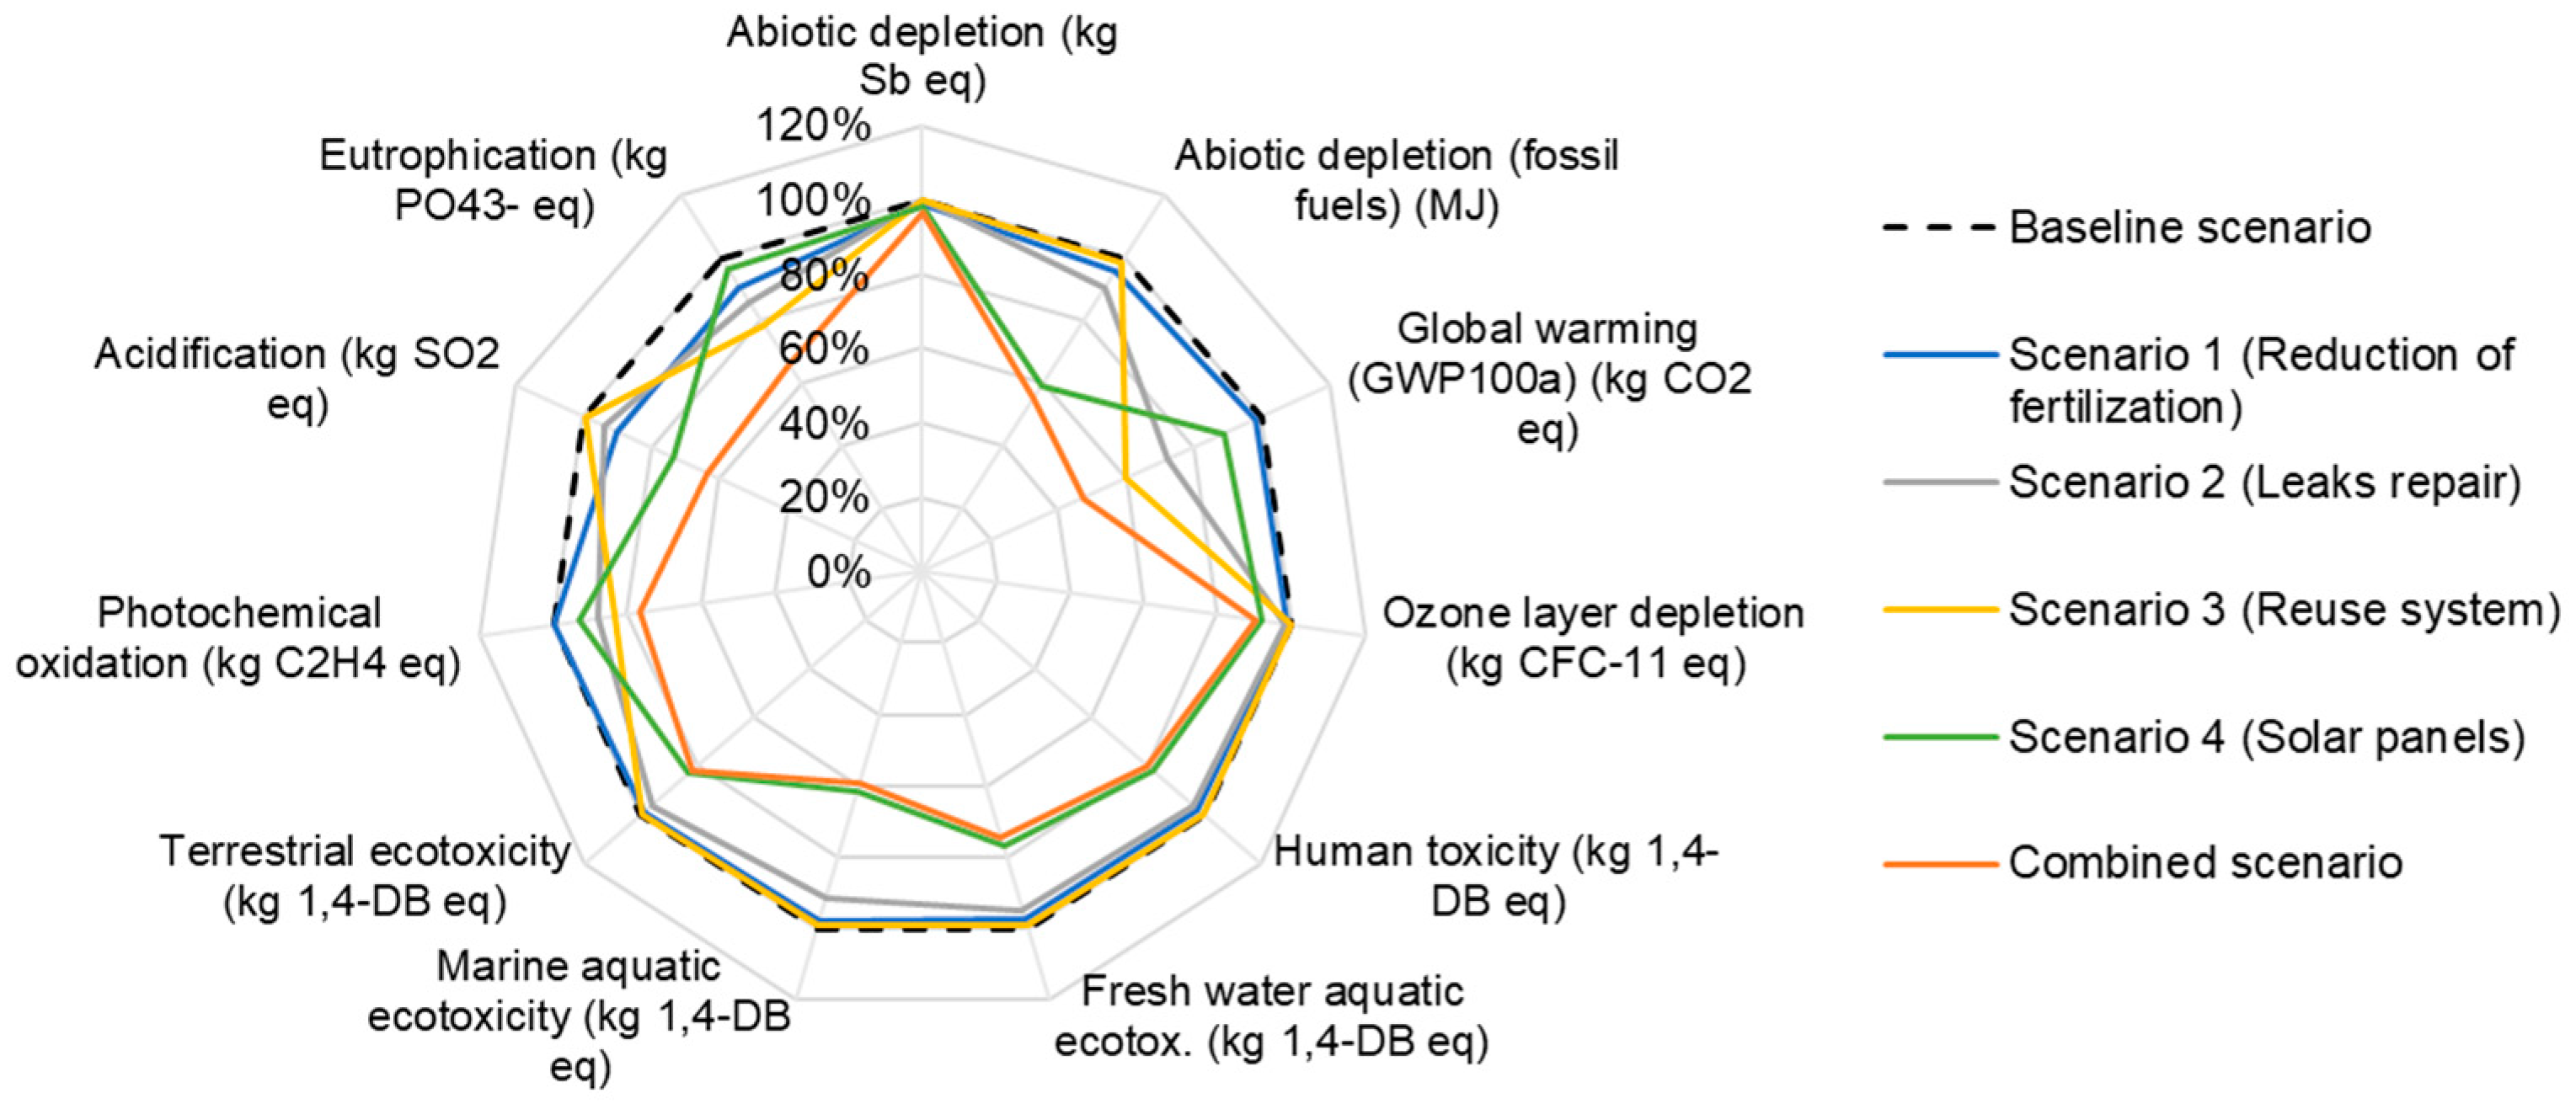
3.4.5. Combined Scenario

The combined scenario seems to be promising from the reduction perspective, as most impact categories showed significant reductions. For example, the largest reduction was from GWP which was ca. 53%. Abiotic depletion (fossil fuels) (MJ) was also remarkable, as it showed ca. 45% improvement (see Figure 3 for more details). The smallest was reported from ozone layer depletion which had even a reduction of 10%. FPBT for this option was ca. 0.8 years (see Table S6 for details on EPBT). TOV index for this option recorded 0.5789 with a value for SPBT of 0.4 years.
Referring to TOVIs, the combined scenario emerges as the most beneficial option and requires immediate attention from factory officials. Future studies may explore several additional options to further enhance environmental sustainability. Biogas capture and utilization presents a promising avenue; for example, captured biogas could be used for heat generation in the drying process, potentially reducing both CH4 emissions and firewood consumption, thus generating additional environmental benefits [42]. In terms of fertilizer production, industrial emissions during synthetic fertilizer manufacturing could be addressed through two approaches. Firstly, CO2 emissions could be reduced through improvements in energy efficiency or by transitioning from fossil fuels to renewables. Second, N2O emissions could be mitigated by catalytic conversion [43]. However, a more effective strategy might be to replace synthetic fertilizers with animal manure, which would eliminate all CO2 and N2O emissions associated with industrial fertilizer production [43]. Among other promising options that could further enhance environmental sustainability are the installation of LED lights, the use of energy-efficient boilers, and minimization of transmission losses during electricity distribution. Implementing a combination of these measures, alongside the priority scenario, could lead to comprehensive environmental improvements in factory operations.
Previous research focusing solely on crepe rubber processing reported substantially lower global warming potential (GWP) values (3.8 tonne CO2e per tonne of crepe rubber) [15]. The particular study was confined to direct processing and energy consumption-based emissions and therefore, the difference in GWP could be attributed to the more comprehensive nature of the present analysis, which integrates the emissions from wastewater treatment processes. By including these additional factors, this study provides a more complete accounting of the environmental impacts associated with crepe rubber production, resulting in higher but potentially more accurate estimates of the carbon footprint.
TOVI has proven to be a powerful tool to comprehensively assess the sustainability impacts of various improvement options. Its strength lies in its ability to evaluate the complex trade-offs between the environmental, economic, and social pillars of sustainability, considering both direct and indirect benefits and drawbacks. For example, the index can effectively evaluate how the installation of solar panels could lead to a decrease in environmental impacts and lower operational costs, while potentially reducing the social risks associated with the energy sector per functional unit. Additionally, the TOVI can account for new economic opportunities and social impacts introduced by alternative solutions, including those that occur during the production and installation phases of technologies such as solar panels. This holistic approach allows for the identification of a 'payback point', where the cumulative benefits of an improvement option across all sustainability dimensions outweigh its potential drawbacks.
Addressing hotspots is an ongoing process, as resolving one issue often shifts focus to another, creating a new hotspot. This necessitates an iterative approach to life cycle assessment, such as the Plan-Do-Check-Act (PDCA) cycle [8], to continuously minimize environmental impacts. This iterative improvement can enhance the product's image, potentially leading to increased sales.
This research highlights the critical role of cleaner production practices in reducing the diverse environmental impacts within crepe rubber production. However, several obstacles can impede the successful implementation of these practices. These barriers include insufficient expertise in sustainable manufacturing and industrial process analytics, prioritization of profitability and market share over sustainability concerns, and the substantial costs associated with investment and infrastructure upgrades. To overcome these challenges, several strategies can be used. These include organizing workshops on sustainable manufacturing and industrial process analytics, providing incentives for factories to adopt sustainable practices, and facilitating knowledge exchange through social media platforms. Additionally, the implementation of mechanisms for the payment of ecosystem services is crucial for sustainable financing. By tackling these barriers, we can foster a more environmentally responsible crepe rubber production. This being an upgraded green value chain, identification of niche markets where these environmental values are translated to monitory terms is essential to recover the costs involved in proposed changes.
This study represents an initial step in evaluating the environmental impact of crepe rubber production focusing on a single factory. Although this provides valuable information, it is important to recognize the limitations of such a narrow scope. To obtain a more comprehensive and generalizable understanding of the environmental footprint associated with crepe rubber production, future research should expand the investigation to include multiple estates and factories. Conducting life cycle assessments across a broader range of production sites would provide a more robust dataset, allowing for a more accurate representation of the industry's environmental impact as a whole.
Furthermore, while this study primarily addresses the environmental dimension of crepe rubber production, it is crucial to recognize that sustainability encompasses multiple interconnected aspects. To establish a holistic understanding of the overall sustainability of crepe rubber production, future research should also explore the social and economic dimensions. This comprehensive approach would provide a more complete picture of the industry's impact on local communities, worker well-being, economic viability, and long-term sustainability. By examining these additional sustainability pillars, researchers can identify potential synergies and trade-offs between environmental, social, and economic factors, ultimately forming more balanced and effective strategies for sustainable crepe rubber production.

4. Conclusions

The present study aimed at assessing the environmental profile of crepe rubber manufacture performing LCA in Sri Lankan context as a case study. This study demonstrated significant potential for reducing the environmental footprint of crepe rubber production through targeted interventions, while balancing environmental, economic, and social considerations.
The study further revealed several key findings. The main environmental hotspots identified were fertilizer use in cultivation, as well as water and electricity consumption during processing. Four improvement options were evaluated: reducing fertilizer use, repairing leaks and installing water meters, implementing a water recirculation cooling system, and installing solar panels. The combined implementation of all options (combined scenario) showed the greatest potential for environmental improvement, reducing global warming potential by up to 53% and fossil fuel depletion by 45%. The novel TOVI proved useful for evaluating trade-offs, with the combined scenario achieving the highest TOVI of 0.5789. However, barriers to implementation were identified, including lack of expertise, prioritization of short-term profits, and high upfront costs. Strategies to overcome these barriers include training workshops, incentives, and knowledge sharing. This being an upgraded green value chain, marketing campaigns highlighting environmental benefits are essential to catch a better price for crepe rubber to recover the costs. Future research should expand to multiple sites and incorporate social and economic dimensions for a more holistic assessment.

Author Contributions

Conceptualization, P.D., E.M., V.H.L.R., I.D. and N.G.; methodology, P.D., E.M., V.H.L.R., I.D. and N.G; software, P.D. and W.G.; validation, P.D., V.H.L.R., I.D. and N.G.; formal analysis, P.D. and W.G.; investigation, P.D.; resources, I.D. and N.G.; data curation, V.H.L.R., I.D. and N.G.; writing—original draft preparation, P.D.; writing—review and editing, E.M., W.G., V.H.L.R., I.D. and N.G.; visualization, P.D.; supervision, V.H.L.R., I.D. and N.G.; funding acquisition, I.D. and N.G. All authors have read and agreed to the published version of the manuscript.

Funding

Not applicable.

Institutional Review Board Statement

Not applicable

Informed Consent Statement

Not applicable

Data Availability Statement

Not applicable

Acknowledgments

Authors would like to thank all the factory personnel involved in conducting this research, including Mr. Ranil.

Conflicts of Interest

The authors declare no conflicts of interest.

References

  1. IHS Markit Rubber, Natural - Chemical Economics Handbook Available online: https://www.ihs.com/products/natural-rubber-chemical-economics-handbook.html (accessed on 18 December 2017).
  2. Tillekeratne, L.M.K.; Nugawela, A.; Seneviratne, W.M.G. Handbook of Rubber; Vishva Lekha Printers: Ratmalana, 2003.
  3. Bengtsen, P. Behind the Rubber Label; 2013.
  4. Sri Lanka Rubber Secretariat Sri Lanka Rubber Industry Development Master Plan 2017-2026; Battaramulla, 2017.
  5. Dunuwila, P.; V.H.L. Rodrigo; Goto, N. SUSTAINABILITY ASSESSMENT IN NATURAL RUBBER INDUSTRY: CASE OF A SRI LANKAN CREPE RUBBER FACTORY. In Proceedings of the International Proceedings of IRC 2017; Jakarta, 2017; pp. 550–571.
  6. Dunuwila, P.; Rodrigo, V.H.L.; Goto, N. Sustainability of Natural Rubber Processing Can Be Improved: A Case Study with Crepe Rubber Manufacturing in Sri Lanka. Resour Conserv Recycl 2018, 133, 417–427. [CrossRef]
  7. Siriwardena, S. PROPOSED SOLAR DRYING SYSTEMS FOR CREPE RUBBER DRYING. Bulletin of the Rubber Research Institute of Sri Lanka 2010, 51, 50–60.
  8. Dunuwila, P.; Rodrigo, V.H.L.; Goto, N. Sustainability of Natural Rubber Processing Can Be Improved: A Case Study with Crepe Rubber Manufacturing in Sri Lanka. Resour Conserv Recycl 2018. [CrossRef]
  9. Dunuwila, P.; Rodrigo, V.H.L.; Goto, N. Financial and Environmental Sustainability in Manufacturing of Crepe Rubber in Terms of Material Flow Analysis, Material Flow Cost Accounting and Life Cycle Assessment. J Clean Prod 2018, 182. [CrossRef]
  10. Dunuwila, P. Integration of Process Analysis and Decision-Making Tools for the Sustainability Improvements in Raw Rubber Manufacture, Toyohashi University of Technology: Toyohashi, 2019.
  11. Peiris, S. Experiences of Cleaner Production Ewlementation in Rubber Industry and Potential For Future in Sri Lanka; 1997.
  12. UNESCAP Country Study on Sri Lanka Using Global Value Chain Analysis: THE INDUSTRIAL RUBBER AND ELECTRONIC PRODUCTS SECTORS; 2011.
  13. Edirisinghe, J. Community Pressure and Environmental Compliance: Case of Rubber Processing in Sri Lanka. Journal of Environmental Professionals Sri Lanka 2013, 1. [CrossRef]
  14. Massoudinejad, M.; Mehdipour-Rabori, M.; Dehghani, M.H. Treatment of Natural Rubber Industry Wastewater through a Combination of Physicochemical and Ozonation Processes Citation: Massoudinejad M, Mehdipour-Rabori M, Dehghani MH. Treatment of Natural Rubber Industry Wastewater through a Combination of Physicoch. J Adv Environ Health Res 2015, 3, 242–249.
  15. Kumara, P.R.; Munasinghe, E.S.; Rodrigo, V.H.L.; Karunaratna, A.S. Carbon Footprint of Rubber/Sugarcane Intercropping System in Sri Lanka: A Case Study. Procedia Food Sci 2016, 6, 298–302. [CrossRef]
  16. Tekasakul, S.; Tantichaowanan, M.; Otani, Y.; Kuruhongsa, P.; Tekasakul, P. Removal of Soot Particles in Rubber Smoking Chamber by Electrostatic Precipitator to Improve Rubber Sheet Color; 2006; Vol. 6.
  17. Dunuwila, P.; Rodrigo, V.H.L.; Goto, N. Improving Financial and Environmental Sustainability in Concentrated Latex Manufacture. J Clean Prod 2020, 255. [CrossRef]
  18. Guinee, J.B. Handbook on Life Cycle Assessment Operational Guide to the ISO Standards. Int J Life Cycle Assess 2002, 7, 311–313. [CrossRef]
  19. The International Organization for Standardization (ISO) International Standard ISO 14040; 2006.
  20. Rubber Research Institute of Sri Lanka Fertilizer for Rubber; Rubber Research Institute of Sri Lanka, 2016.
  21. Dunuwila, P.; Rodrigo, V.H.L.; Goto, N. Assessing the Financial and Environmental Sustainability in Raw Rubber Processing; a Case Study with Ribbed Smoked Sheet Manufacture in Sri Lanka. Indonesian Journal of Life Cycle Assessment and Sustainability 2018, 2.
  22. The International Organization for Standardization (ISO) ISO 14040:2006(En), Environmental Management — Life Cycle Assessment — Principles and Framework; Switzerland, 2006.
  23. Rubber Research Institute of Sri Lanka Rubber Research Institute of Sri Lanka Available online: http://www.rrisl.lk/sub_pags/statistics.html (accessed on 10 May 2016).
  24. Dunuwila, P.; Rodrigo, V.H.L.; Daigo, I.; Goto, N. Social Sustainability of Raw Rubber Production: A Supply Chain Analysis under Sri Lankan Scenario. Sustainability (Switzerland) 2023, 15, 11623. [CrossRef]
  25. Birnbach, M.; Lehmann, A.; Naranjo, E.; Finkbeiner, M. A Condom’s Footprint - Life Cycle Assessment of a Natural Rubber Condom. International Journal of Life Cycle Assessment 2020, 25, 964–979. [CrossRef]
  26. Jawjit, W.; Pavasant, P.; Kroeze, C.; Tuffey, J. Evaluation of the Potential Environmental Impacts of Condom Production in Thailand. Journal of Integrative Environmental Sciences 2021, 18, 89–114. [CrossRef]
  27. Khanali, M.; Mousavi, S.A.; Sharifi, M.; Keyhani Nasab, F.; Chau, K. wing Life Cycle Assessment of Canola Edible Oil Production in Iran: A Case Study in Isfahan Province. J Clean Prod 2018, 196, 714–725. [CrossRef]
  28. Dunuwila, P.; Rodrigo, V.H.L.; Daigo, I.; Goto, N. Social Sustainability of Raw Rubber Production: A Supply Chain Analysis under Sri Lankan Scenario. Sustainability 2023, Vol. 15, Page 11623 2023, 15, 11623. [CrossRef]
  29. Eggleston, H.S.; Buendia, L.; Miwa, K.; Nagara, T.; Tanabe, K. 2006 IPCC Guidelines for National Greenhouse Gas Inventories; 2006.
  30. Gamaralalage, D.; Sawai, O.; Nunoura, T. Effectiveness of Available Wastewater Treatment Facilities in Rubber Production Industries in Sri Lanka. International Journal of Environmental Science and Development 2016, 7, 940–945. [CrossRef]
  31. Frischknecht, R.; Rebitzer, G. The Ecoinvent Database System: A Comprehensive Web-Based LCA Database. J Clean Prod 2005, 13, 1337–1343. [CrossRef]
  32. PRé Sustainability About SimaPro - SimaPro Available online: https://simapro.com/about/ (accessed on 16 March 2023).
  33. Dunuwila, P.; Rodrigo, V.H.L.; Daigo, I.; Goto, N. Unveiling the Environmental Impacts of Concentrated Latex Manufacturing in Sri Lanka through a Life Cycle Assessment. Resources 2024, 13, 5. [CrossRef]
  34. Mahath, C.S.; Mophin Kani, K.; Dubey, B. Gate-to-Gate Environmental Impacts of Dairy Processing Products in Thiruvananthapuram, India. 2018. [CrossRef]
  35. Kumar, M.; Kumar Choubey, V.; Deepak, A.; Gedam, V. V.; Raut, R.D. Life Cycle Assessment (LCA) of Dairy Processing Industry: A Case Study of North India. J Clean Prod 2021, 326, 129331. [CrossRef]
  36. Humbert, S.; De Schryver, A.; Bengoa, X.; Margni, M.; Jolliet, O. IMPACT 2002+: User Guide; 2012.
  37. Goedkoop, M. Eco-Indicator 95; 1995.
  38. EPD® General Programme Instructions for the International EPD® System. Version 2.5, Dated 2015-05-11; 2015.
  39. Gonçalves, J.; Freitas, J.; Fernandes, I.; Silva, P. Microalgae as Biofertilizers: A Sustainable Way to Improve Soil Fertility and Plant Growth. Sustainability 2023, Vol. 15, Page 12413 2023, 15, 12413. [CrossRef]
  40. Jawjit, W.; Kroeze, C.; Rattanapan, S. Greenhouse Gas Emissions from Rubber Industry in Thailand. J Clean Prod 2010, 18, 403–411. [CrossRef]
  41. NewEarth B SHDB Available online: http://www.socialhotspot.org/ (accessed on 31 October 2021).
  42. Sganzerla, W.G.; Rosa, R.G. da; Barroso, T.L.C.T.; Castro, L.E.N.; Forster-Carneiro, T. Techno-Economic Assessment of On-Site Production of Biomethane, Bioenergy, and Fertilizer from Small-Scale Anaerobic Digestion of Jabuticaba By-Product. Methane 2023, Vol. 2, Pages 113-128 2023, 2, 113–128. [CrossRef]
  43. Nesterenko, N.; Medeiros-Costa, I.C.; Clatworthy, E.B.; Cruchade, H.; Konnov, S. V.; Dath, J.P.; Gilson, J.P.; Mintova, S. Methane-to-Chemicals: A Pathway to Decarbonization. Natl Sci Rev 2023, 10. [CrossRef]
Figure 2. Methodological framework used in this study. Perforated line demarcates the boundary of the framework.
Preprints 141167 g002
Figure 3. Impact assessment results of cultivation phase. Absolute values under each category are given above the bar. MOP refers to Muriate of Potassium.
Preprints 141167 g003
Figure 4. Impact assessment results of processing phase. Absolute values for each category are given above the bar. LDPE refers to Low density polyethylene.
Preprints 141167 g004
Figure 5. Reduction potentials of improvement options
Preprints 141167 g005
Table 1. Emission factors used for calculating on-site emissions during cultivation. Terms like kg N2O–N/kg N use refers to mass of nitrogen element in the form of N2O.
Emission source Emission factor Characteristics
N2O direct emissions from fertilizer use (to air) 0.1 kg N2O–N/kg N use
N2O indirect emission after N leaching and runoff (to soil) 0.00225 kg N2O–N/kg N use
N2O indirect emission after emission of fertilizer N as NOx and NH3 (to air) 0.001 kg N2O–N/kg N use
CO2 direct emissions from Urea (to air) 0.2 kg CO2–C/kg urea
NH3 emissions from fertilizer use (to air) 0.1 kg NH3–N/kg N use
Direct NOx from fertilizer use (to air) 0.21 kg NOx/ kg N2O from fertilizers
NO3- emissions from fertilizer use (to soil) 0.3 kg NO3-–N/kg N use
P emissions to water 0.05 kg P emissions/ kg P use
Table 2. conversion factors used for calculating on-site emissions during cultivation. Molecular weight was used to convert the mass of substances; for example, 44/12 is used to convert the mass of C to the mass of CO2.
Type of conversion Coefficients
kg CO2-C to kg CO2 44/12
kg N2O-N to kg N2O 44/28
kg NH3-N to kg NH3 17/14
kg NO3-N to kg NO3 62/14
kg P2O5 to kg phosphorus 62/142
kg CO2-C to kg CO2 44/12
Table 3. Inventory of rubber cultivation per field latex containing 1 tonne of dry rubber.
Activity Amount (kg unless mentioned)
Inputs data
Urea 79.36
Rock phosphate 70.45
Muriate of potash (MOP) 77.34
Dolomite 1.33
Kieserite 0.17
Diesel for tillage 13.68 L
Sodium sulfite 1.38
Herbicide (glyphosate) 5.21
Fungicides (tebuconazole) 0.62
Fungicides (hexaconazole) 0.62
Water (plantation protection) 560
Outputs (onsite)
Field latex (dry rubber basis) 1000
N2O (to air) 0.76
NH3 (to air) 3.99
CO2 (to air) 58.20
NOx (to air) 0.03
P (to water) 0.20
Glyphosate (to soil) 5.21
Tebuconazole (to soil) 0.62
Hexaconazole (to soil) 0.62
Table 4. Inventory involved in crepe rubber processing (per 1 tonne of crepe rubber).
Activity Amount (kg unless mentioned)
Inputs
Diesel for latex transportation 167.18
Field latex (dry/wet basis) 1136.36/3130.23
Sodium bisulfite 4.90
Formic acid 4.30
Bleaching agent 1.22
Electricity 616.85 kWh
Firewood 447.44
LDPE film 1.90
Water 87034.09
Outputs
Crepe rubber (white) 1000
Yellow crepe 136.36
Rubber loss 49.40
Wastewater 88437.61
Ash 5.19
Eminent emissions (on-site) Eminent emissions (on-site)
CO2 (biogenic) (to air) 1490.88
CO2 (fossil) (to air) 1.56
CH4 (biogenic) (to air) 108.74
N2O (to air) 0.44
NOx (to air) 1.24
CO (biogenic) (to air) 45.64
CO (fossil) (to air) 2.94 g
SO2 (to air) 0.51 g
NO3- (to water) 44.10 g
NMVOC, non-methane volatile organic compounds (to air) 6.39
Particulates, < 2.5 um (to air) 1.37
COD (to water) 35.40
BOD (to water) 5.31
NH4+ (to water) 1.86
Table 5. Overall impacts (per 1 tonne of crepe rubber)
Impact category Unit Impact value
Abiotic depletion kg Sb eq 1.76E-02
Abiotic depletion (fossil fuels) MJ 1.33E+04
Global warming (GWP100a) kg CO2 eq 4.53E+03
Ozone layer depletion (ODP) kg CFC-11 eq 3.78E-05
Human toxicity kg 1,4-DB eq 1.17E+03
Fresh water aquatic ecotoxicity kg 1,4-DB eq 5.48E+02
Marine aquatic ecotoxicity kg 1,4-DB eq 1.40E+06
Terrestrial ecotoxicity kg 1,4-DB eq 1.64E+01
Photochemical oxidation kg C2H4 eq 2.28E+00
Acidification kg SO2 eq 1.58E+01
Eutrophication kg PO4--- eq 1.64E+01
Table 6. Results of sensitivity analysis.
Impact category Unit CML (Baseline) IMPACT 2002+ Eco-indicator 95 EPD (2013)
Global warming kg CO2 eq 4.525×10³ 1.806×10³ 2.299×10³ 4.531×10³
Ozone layer depletion kg CFC-11 eq 3.780×10⁻⁵ 3.780×10⁻⁵ 4.770×10⁻⁵ 3.780×10⁻⁵
Acidification kg SO2 eq 15.755 8.730 8.642 15.755
Photochemical oxidation kg C2H4 eq 2.280 4.636 4.032 2.280
Disclaimer/Publisher’s Note: The statements, opinions and data contained in all publications are solely those of the individual author(s) and contributor(s) and not of MDPI and/or the editor(s). MDPI and/or the editor(s) disclaim responsibility for any injury to people or property resulting from any ideas, methods, instructions or products referred to in the content.
Copyright: This open access article is published under a Creative Commons CC BY 4.0 license, which permit the free download, distribution, and reuse, provided that the author and preprint are cited in any reuse.
Prerpints.org logo

Preprints.org is a free preprint server supported by MDPI in Basel, Switzerland.

Subscribe

Disclaimer

Terms of Use

Privacy Policy

Privacy Settings

© 2025 MDPI (Basel, Switzerland) unless otherwise stated