Submitted:
03 June 2023
Posted:
05 June 2023
You are already at the latest version
Abstract
Raw rubber production is the sole foundation for the rubber product industry, rendering raw rubber to manufacture essential commodities to mankind such as tires, condoms, surgical gloves, and so forth. Raw rubber production involves various stakeholders; however, literature focusing on the social impacts of raw rubber production and its supply chain has hereto been limited. Social life cycle assessment, a popular tool to assess the social impacts of a product or process and was deployed herein to assess the social profiles of three Sri Lankan raw rubber supply chains (crepe rubber, concentrated latex, and ribbed smoked sheets). The Social Hotspots Database v4 on Sima Pro v9.3 was used for the analysis. Results indicated that Governance and Labour rights & decent work had been affected in its supply chain of fertilizers due to Corruption and Freedom of association & collective bargaining issues, mainly in Belarus, and China. Proposed improvement options to address these touchpoints were found to be effective. For instance, if the importation of K-fertilizer shifted into low risk countries, overall social risks associated with Corruption and Freedom of association & collective bargaining in the supply chains could be reduced by ca. 36% and 25%, respectively. As a result, social risks in the aforesaid impact categories, i.e., Governance and Labor rights & decent work, were reduced by ca. 35-41% and ca. 17-20%, respectively. Such improvements may help positioning the Sri Lankan rubber industry in the sustainability-conscious-world rubber market. Further, the methodical hierarchy developed herein is suggested to adopt in any industry to measure social sustainability subjected to the relevant refinements to the supply chains.
Keywords:
social life cycle assessment
; crepe rubber
; concentrated latex
; ribbed smoked sheets
; corruption
1. Introduction
The natural rubber industry plays an important part of human life, as it provides indispensable items to the humans, such as tyres, condoms, infant pacifiers, surgical gloves and many more (Dunuwila et al., 2020; IHS Markit, 2017). Natural rubber is derived from the sap of rubber trees (Hevea brasiliensis), grown in tropical regions such as Asia, Africa, and South America (Jawjit et al., 2010; Rubber Research Institute of Sri Lanka, 2003). The industry significantly impacts global economic growth and employs millions of people in developing countries (Dunuwila et al., 2018a). The global natural rubber market is estimated to be worth ca. USD 30 billion in 2022 with Asia holding the largest share of ca. 92% (EMR, 2023).
Raw rubber production serves as the sole foundation for the natural rubber industry, providing raw rubber to manufacture numerous commodities as mentioned in the preceding paragraph (Bengtsen, 2013). Bark of the rubber tree is tapped to obtain latex which is then processed into different raw rubber products, including crepe rubber, concentrated latex, and ribbed smoked sheets (RSS) (Sri Lanka Rubber Secretariat, 2017). Crepe rubber is produced by coagulating rubber latex from a rubber tree, dried, and rolled into thin sheets. Crepe rubber is often used in products such as pharmaceutical items, footwear, and industrial applications such as belts, hoses, and gaskets (Dunuwila et al., 2018a). Concentrated latex is a type of rubber processed through centrifugation, separating the rubber particles from the liquid to a greater extent. Centrifuged latex is often used in products that follow dipping process, such as surgical gloves and condoms (Dunuwila et al., 2020; Jawjit et al., 2015). Ribbed smoked sheets rubber is a rubber sheeting manufactured with low cost machineries at the lowest cost; but this gives high quality if process properly (Dunuwila et al., 2018b; Fagbemi et al., 2018). This rubber is commonly used in tires, rubber bands, and mechanical items (Cecil and Mitchell, 2005; Dunuwila et al., 2018b).
In the process of raw rubber production, significant amounts of electrical and heat energy, chemicals, fresh water, and labor are involved(Cecil and Mitchell, 2005; IHS Markit, 2017; Rubber Research Institute of Sri Lanka, 2003). Also, having many factory employees from the local community, there is a close association between the local community and raw rubber manufacturers (Dunuwila et al., 2022).
With the said nature, the raw rubber sector has faced various economic, environmental, and social challenges. Economic issues include material use inefficiency, poor worker productivity, and higher production expenses(Edirisinghe, 2013; Tillekeratne, 2017; UNESCAP, 2011). Raw rubber production releases toxic chemicals into the environment, especially through wastewater(Leong et al., 2003). These chemicals can harm people and wildlife (Kumara et al., 2016; Massoudinejad et al., 2015). Further, it generates large amounts of greenhouse gases, including carbon dioxide and methane, due to the heavy use of electricity and firewood (Tekasakul and Tekasakul, 2006). In addition, the social impact of the natural rubber industry is also significant. The workers in the industry are typically poor and vulnerable to exploitation. They are often paid low wages and other facilities. Also, pollution-triggered community struggles have been reported (Edirisinghe, 2013).
Several studies have tried to address the above economic and environmental issues. Earlier, we have endeavored to enhance the environmental and economic sustainability of the production of crepe rubber (Dunuwila et al., 2018a, 2018c), and concentrated latex (Dunuwila et al., 2020), and RSS (Dunuwila et al., 2018b). However, literature focusing on the social impacts or issues of raw rubber production has been limited.
Social life cycle assessment (SLCA) is a tool commonly used in scientific research to assess the overall social impacts of products. Despite the widespread use, methodology development in SLCA is still progressing (Pollok et al., 2021) . This systematic approach evaluates the social conditions of the entire life cycle of the product, from the extraction of raw materials to the final disposal or recycling.
We also attempted to analyze the social impacts of a crepe rubber processing estate in Sri Lanka using a novel social life cycle assessment framework (Dunuwila et al., 2022). However, studies analyzing the social sustainability of the entire natural rubber supply chain have hereto been absent. Such attempts are crucial in establishing the overall sustainability of the natural rubber industry. To address this gap, we conduct SLCA focusing on three main rubber supply chains in Sri Lanka (crepe rubber, concentrated latex, and RSS), a country renowned for producing the best high-quality natural rubber (Dunuwila et al., 2022).
2. Raw rubber production
2.1. Rubber cultivation
The rubber plantation cycle considered herein spans over 25 years and is comprised of the nursery (one year), immature (five to seven years), and mature (over 18 years) stages (Birnbach et al., 2020). During the nursery stage, seeds are collected from mature rubber trees and put in a nursery. At early stage of growth, plants are bud grafted with scions of required genotypes. After the plants are mature enough to survive independently, they are transplanted into a field. Before planting rubber plants in the field, the land is cleared and prepared by removing obstructions and weeds. The soil is then tilled and fertilized to make it suitable for the growth of rubber trees (Rubber Research Institute of Sri Lanka, 2016a).
Rubber trees typically require at least five years to enter the mature phase, where the rubber trees are ready for harvest. During the immature phase, the transplanted rubber plants are cared for to ensure healthy growth and development. Pruning may be necessary to ensure the tree's proper shape and size. Rubber trees are susceptible to some pests and diseases. Application of insecticides or fungicides may be necessary to protect the tree from these threats (Rubber Research Institute of Sri Lanka, 2016a).
Optimal growth and yields can be attained only by properly balancing the nutrients per need of the rubber plant. Most rubber-growing soils in Sri Lanka are deficient in nitrogen (N), phosphorus (P), potassium (K), and magnesium (Mg). However, these deficiencies could easily be remedied by applying inorganic fertilizers in the proper proportions and amounts. The most common fertilizers used are urea (for N), rock phosphate (for P), muriate of potash (MOP; for K), kieserite (KIE; for Mg), and dolomite (for Mg). These fertilizers are typically applied to the soil around the base of the tree (Rubber Research Institute of Sri Lanka, 2016b).
2.2. Crepe rubber manufacture
First, rubber is tapped from the rubber tree and transported to the crepe rubber processing factory using bowsers. Before transporting, sodium sulfite is added as a preservative to the rubber to control fungal growth. At the factory, fresh latex is standardized, where its yellow pigments are fractionated leaving the white fraction which contains the majority of rubber particle in liquid form. Here, as per dry rubber content (DRC), sodium bisulfite and water are added. Yellow fraction comprises only ca. 10% of DRC (Rubber Research Institute of Sri Lanka, 2003). The white fraction is then transferred to different containers in the coagulating process while mixing with water, formic acid, and bleaching agents. Then, the coagulum of the white fraction is cut into cube-like pieces and passed through a set of roller mills, a macerator, a diamond roller, and a smooth roller. The primary purpose of milling is to reduce the size of bulky coagulum pieces (with high water content) by pressing them into thin laces of rubber (containing less water). Thin laces are then draped over a drying tower and left for three to four days. Dried crepe laces are stacked, folded into 25 kg mats, and passed through a roller mill called a dry blanket mill, resulting in soft-edged rubber blankets. After the rubber blankets are cut to the customer's desired size, they become known as blanket crepe rubber. The final step in the production of crepe rubber is the visual grading and packaging of the product for sale. Following the same procedure, the yellow fraction is also further processed to obtain a lower-grade crepe rubber.
2.3. Concentrated latex manufacture
In the process of latex collection and transportation to the factory, ammonia is added as a preservative to avert fungal growth in field latex. Upon arrival at the factory, a laboratory test measures the DRC and ammonia concentration of latex. Then the latex is sifted through a 60-mesh sieve and collected in bulking tanks. The bulking tanks are filled with a mixture of tetramethyl thiuram disulfide (TMTD) and zinc oxide (ZnO) (often referred to as T.Z.), diammonium hydrogen phosphate (DAHP), and lauric soap. DAHP functions as a magnesium ion (Mg2+) remover, whereas others act as preservatives. Mg2+ elimination is crucial because the presence of Mg2+ encourages bacterial growth (Rubber Research Institute of Sri Lanka, 2003). Decantation is performed to remove Mg2+ in the form of magnesium ammonium phosphate. The remaining field latex is then centrifuged in centrifuge separators. At the separators, field latex is separated into two segments: concentrated latex and skim latex, with %DRCs of ca. 60% and 3-6%, respectively. Acquired concentrated latex is preserved in steel tanks, with the ammonia concentration kept per customer specifications, i.e., high Ammonia (about 0.7%) or low Ammonia (about 0.2%), until dispatch. Skim latex is coagulated with sulfuric acid in a separate tank (the coagulation tank). After that, the coagulum is removed and pressed to get skim rubber laces. The laces are then air-dried before being mechanically pressed into rubber sheets (dry blanket milling). After that, the blankets are cut into tile-shaped segments and packaged as a skim crepe.
2.4. Ribbed smoked sheets manufacture
Smallholders with less than five acres of rubber plantations mostly manufacture RSS in Sri Lanka. RSS facility at this caliber can process up to 40 kg of rubber daily(Rubber Research Institute of Sri Lanka, 2003). First, rubber trees are tapped to get fresh latex and handled to the mills. When latex arrives at the factory, it is coagulated by passing through a series of flat pans with water and formic acid. Then, the coagulum is milled using two hand-operated rollers, termed smooth and grooved rollers. The coagulum is passed through the smooth roller two to three times before being passed through the grooved roller once. Milled sheets are cleaned and placed in a shade for dripping before being smoke-dried. Smoke-drying involves hanging sheets in a smokehouse for three to five days. Finally, the dried sheets are weighed and transported to regional retail centers.
3. Methodology
3.1. Social life cycle assessment
SLCA is a systematic approach to assess the social impacts of a product or system throughout its life cycle, from material extraction to final disposal or recycling (Ekener et al., 2018). SLCA is a relatively new tool for which a standardized methodology is yet to be proposed(Zheng et al., 2020). However, SLCA follows ISO14040/44 (Benoît Norris et al., 2020; The International Organization for Standardization (ISO), 2006), the international standard for LCA. The first comprehensive framework for SLCA was published in 2009 (Andrews et al., 2009), termed UNEP/SETAC Guidelines for Social Life Cycle Assessment of Products. Therein, five stakeholder categories (Workers, Local community, Society, Value chain actors, and Consumers) have been specified with six impact categories (i.e., Human rights, Working conditions, Health & safety, Development of the country, Socio-economic repercussion, and Governance) for developing social life cycle inventories (Hossain et al., 2018). In order to facilitate this process, a set of subcategories (e.g., Forced labor, Discrimination, etc.) were also defined at each stakeholder category and were set to assess using inventory indicators. A few years later, UNEP/SETAC Methodological Sheets for the Subcategories of SLCA were published to provide practical guidance for conducting SLCA case studies (Benoît-Norris et al., 2011). This document supplemented the above subcategories with inventory indicators and potential data sources. Various entities have developed SLCA databases and frameworks based on the above documents. For instance, NewEarth B released Social Hotspots Database (NewEarth B, 2019) in 2013 to assess the social risks of product supply chains. A group of six companies with PRé Sustainability devised the framework of Product Social Impact Assessment in 2014 (Saling et al., 2020) to render practical guidance to performing SLCA of products at the corporate level; this framework has been updated at several stages ever since. The latest version of the UNEP/SETAC SLCA code of practice was released in 2020 (i.e., Guidelines for social life cycle assessment of products and organizations 2020) (Benoît Norris et al., 2020). It provided extra guidance for the steps of SLCA from the lessons learned from the previous version and touched on different areas of evaluating social issues of organizations and products, e.g., linking SLCA with the Sustainable Development Goals of the United Nations and Social Organizational life cycle assessment.
3.2. Goal and scope definition
We aim to analyze the social footprint of the three raw rubber supply chains, i.e., crepe rubber, concentrated latex, and RSS, seek avenues for improvements, and foresee their potential degrees of improvement when the improvements are in place. The system boundary of the study is demarcated in Figure 1, in which the foreground system encapsulates the processes directly involved with raw rubber production on a cradle-to-gate basis (i.e., from rubber cultivation to manufacture). Such processes require site-specific data (Hannouf and Assefa, 2018). Meanwhile, items which are linked with background supply chains, are indicated by shaded boxes, where sector- or country-level data (or generic data) are necessary (see inventory analysis section for more details on data collection) (Hannouf and Assefa, 2018). The functional unit for the study was set as delivering 1 tonne of product, i.e., white crepe, concentrated latex, and RSS. We follow the basic steps of ISO 14040/44 for the study (Benoît Norris et al., 2020; The International Organization for Standardization (ISO), 2006).
3.3. Life cycle inventory
The second step involves collecting inventory data for both background and foreground processes, which will later be used to model and evaluate potential social impacts at the impact assessment stage (Santos et al., 2020). Initially at this step, the system(s) being examined must be modeled using both site-specific (or foreground) data and generic data (or background data related to the supply chain). Foreground data refer to the data collected specifically for the system being analyzed (Hannouf and Assefa, 2018). Background data refer to the data used as inputs for the assessment that are not specific to the product being evaluated (Santos et al., 2020). Accordingly, data were collected on the amounts of materials and energy inputs at the different stages of the life cycle within the system boundary, the economic sectors that those inputs belong to, regions where the materials and energy are sourced from, and the unit price of materials and energy (Santos et al., 2020).
Background information can be found in SLCA databases and Social Hotspot Database (SHDB) was used in this regard (NewEarth B, 2019). SHDB provides three types of information; 1) supply chain composition, 2) labor intensity; and 3) social risks (Santos et al., 2020). In the provision of No.1 and 2, it uses the Global Trade Analysis Project (GTAP) global economic equilibrium model version 9 (Center for Global Trade Analysis, 2023). In terms of No.1, SHDB holds the trade flows between 57 economic sectors from 140 countries in 2011. Along with foreground data, the SHDB can compute trade flows of related sectors or regions. As for the No. 2, SHDB determines the labor intensity by the "working hours per U.S. dollar of product output” for the year 2011 for each of the 57 economic sectors in each of the 140 countries, calculated by dividing GTAP data of total wage payments (U.S. dollars) per U.S. dollar of output by the sector/region average wage (U.S. dollars/hour) (Benoît Norris and Norris, 2015). Regarding No. 3, SHDB holds the social risks information of over 160 social inventory indicators for 140 regions and 57 sectors and uses various sources for obtaining them (e.g., intergovernmental databases (e.g., ILO database), country statistics, literature, etc.). Risk information, for instance, the indicator: "percentage of the population living under USD 2 per day," is used to attribute risk for the social subcategory: "Poverty" under the "Labor Rights and Decent Work" impact category (see impact assessment section for more details) (Benoît Norris and Norris, 2015).
Foreground data for the study was collected from different sources as given below. Activity data on fertilizer use and unit prices in Sri Lanka were obtained from the Soils & Plant Nutrition Department of the Rubber Research Institute of Sri Lanka (RRISL) and was based on an annual mean over the plantation cycle of 25 years and productivity (in a dry basis) of 1 tonne/ha/year. Data on fungicide, herbicide, and insecticide use, and diesel used for tillage were not available specifically for Sri Lanka, however, could be considered as common to any rubber growing country in general. Therefore, those were gathered from literature (i.e., Birnbach et al. (2020) and Jawjit et al. (2021)) with prices from IndiaMART (IndiaMART, 2023). Material and energy inputs related to rubber manufacture were gathered from our previous research on crepe rubber (Dunuwila et al., 2018c, 2018a), concentrated latex (Dunuwila et al., 2020), and RSS manufacture (Dunuwila et al., 2018b). Low-ammonia concentrated latex manufacturing was considered, which was common in Sri Lankan context (Dunuwila et al., 2020).
Unit prices for material and energy inputs in rubber manufacture were taken from our recent publications (Dunuwila et al., 2018c, 2018a, 2018b; Dunuwila et al., 2020). Firewood and water required for the manufacture of crepe rubber and RSS are usually obtained within the estates, hence no purchase cost has been considered. To be compatible with GTAP model of SHDB, USD values gathered were standardized to match USD 2011 values using an online inflation calculator (U.S. BUREAU OF LABOR STATISTICS, 2023) (N.B. This tool is based on consumer price index which is a commonly used measure of inflation that tracks changes in the prices of goods and services over time). The regions from which the materials and energy were sourced were identified through RRISL, the Observatory of Economic Complexity (OEC) (Datawheel, 2023) and Volza databases (Volza, 2020). The economic sectors corresponding to the inputs were determined using the GTAP manual (Center for Global Trade Analysis, 2023). Please refer to the supplementary material for more details on foreground data.
By integrating foreground data with background data from SHDB version 4 (NewEarth B, 2019), we mapped three rubber supply chain models on SimaPro version 9.3 software (PRé Sustainability, 2023).
3.3. Impact assessment
This stage involved transforming inventory data collected in the preceding step into potential social impacts. The impact assessment phase in SHDB included 26 subcategories (e.g., Child labor, Forced labor, etc.) aggregated into five impact categories, i.e., Labor rights & decent work, Human rights, Health & safety, Governance, and Community. Around 160 social impact indicators were used to evaluate these subcategories, with some evaluated with a single indicator and others evaluated with multiple indicators (Benoît Norris and Norris, 2015). Each indicator has four defined risk levels (very high, high, medium, and low) with a corresponding characterization factor (10, 5, 1, and 0.1, respectively) that reflects the relative probability of an adverse situation happening (Benoît Norris and Norris, 2015). With the given value ‘1’, medium risk level has been basis in assigning relative probabilities to other levels. With Sima Pro v9.3, SHDB combined these characterization factors with inventory data acquired in the previous step to quantify the potential social impacts in Medium Risk Hours equivalent (Mrheq) (Benoît Norris and Norris, 2015). Accordingly, the product of working hours and their risk levels provides the value of Mrheq. For instance, if child labor in sector A in country B is potentially at very high risk and the working hours to produce USD 1 of final product is 1 hour, the Mrheq of sector A becomes 10×1 = 10.
Ultimately, analyses provided three types of results, i.e., the social footprint, salient risks, and social hotspots. Social footprint refers to the overall impact of purchase supply chains, measured in Mrheq. This index highlights the supply chains that contribute the most to overall risks and the impact categories with the highest Mrheq values. Salient risks are the subcategories that account for a greater share of the overall risk (Norris et al., 2019). Social hotspots are individual production activities or countries contributing significantly to the overall risk by impact category or subcategory (Norris et al., 2019).
The aggregation method, “Social hotspot 2019 Subcat & Cat Method w Damages”, was deployed to calculate the said indexes within SHDB (Norris et al., 2019; Santos et al., 2020).
3.4. Interpretation
The final step of a social LCA was to analyze and interpret the outcomes of each stage by being interactive with them.
3.5. Improvement proposals
Firstly, we identified the most critically affected impact categories referring to social footprint results. Here, a contribution level of 20% was considered initially to identify the critically affected impact categories. Then, the highest contributing subcategories to those impact categories were identified. Thirdly, hotspot analyses were conducted to identify the sectors contributing significantly to the overall risk by the identified subcategories. Considering the level of contributions, a minimum level of 10% contribution level was kept initially to identify the most influential hotspots. Accordingly, alternative options were proposed to minimize the social risks.
4. Results and discussion
4.1. Social footprints and salient risks in supply chains of three raw rubber types
Figure 2 illustrates the social footprints of three raw rubber types in Sri Lanka (in terms of medium risk hours equivalent (Mrheq) per 1 tonne of rubber product) as given by supply chain analyses. The social footprint of rubber cultivation has been higher than that of rubber manufacturing and transportation (which is negligible being handled by the factory of manufacturing) in all three cases. Comparably larger amounts of material use (especially chemicals and fertilizer) during rubber cultivation have been the roots of such results. Due to higher processing intensity, crepe rubber and concentrated latex supply chains showed larger Mrheq than RSS. Most critical social issues have been related to Governance for all supply chains. Further, Labor rights & decent work, and Health & safety hold second and third places for all supply chains. `Human rights` has been the least affected.
Table 1 encapsulates the social footprints of subcategories under each impact category in terms Mrheq. Accordingly, the salient risks, the highest risks are associated with Freedom of association & collective bargaining, followed by Corruption, Forced labor, Migrant labor, and the Legal system. `Unemployment` poses the smallest social risk of all subcategories.
Figure 3, Figure 4 and Figure 5 illustrate the contribution of activities related to crepe rubber, concentrated latex, and RSS supply chains to the social risks at each subcategory. Supply chains associated with the rubber cultivation stage tend to dominate all graphs. For instance, MOP (K-fertilizer) and urea supply chains account for larger proportions of social risks in most subcategories. Notably, the MOP (K-fertilizer) supply chain overshadows the subcategories `Injuries & fatalities` and `Unemployment,` while the urea supply chain does the same for the ‘Children out of the school.’ However, the largest contributor to `Access to drinking water` has been recorded as the herbicide supply chain in all graphs. Further, the DAHP supply chain contributes considerably to the same subcategory in concentrated latex supply chain. The electricity supply chain shows a considerable contribution to risks at `Excessive working time` and `Indigenous rights` regarding the crepe rubber supply chain as the electricity demand remains larger than concentrated latex manufacture. Formic acid, the only purchase supply chain at RSS manufacture, contributes negligibly to all subcategories.
4.2. Improvement proposals
Considering the impact categories having more than 20% of contribution to the social footprints in Figure 2, we focus on improving the social risks related to Governance, and Labor rights & decent work. To do so, subcategories under the respective impact categories were investigated first.
We identified that a larger proportion of social issues related to Governance are from the subcategory Corruption for three rubber supply chains (i.e., crepe rubber: 56%; concentrated latex: 55%; RSS: 54%) (see Figure S1). Similarly, the largest contribution to Labor rights & decent work was from the Freedom of association & collective bargaining (i.e., crepe rubber: 22%; concentrated latex: 21%: RSS ca. 22%) (see Figure S2).
Then, hotspot analyses were conducted to determine the contribution of each country and sector involved in the three production lines under the most influential subcategories identified, i.e., Corruption, and Freedom of association & collective bargaining.
Figure 6, Figure 7 and Figure 8 illustrate the results of hotspot analyses by supply chain (directly involving sectors with more than 3% of contribution to the social risks have been labeled for convenience). The sector named as ‘Chemical, rubber, and plastic product’ in Belarus poses the most significant social risk in all three supply chains under the two subcategories of the database namely, Corruption and Freedom of association & collective bargaining. The sector mentioned above involves K-fertilizer usage at the rubber cultivation stage (N.B., ca. 52% of K-fertilizer is imported from Belarus). Due to the importation of urea fertilizer from China, herbicides from India and the social situation in Sri Lanka, the next three significant sectors contributing to social risks are the Chemical, rubber and plastic product in China, then the same in India and the Electricity sector in Sri Lanka, respectively. The electricity sector in Belarus can be deemed an indirectly involving upstream sector that links with the Chemical, rubber, and plastic product sector in Belarus.
In the proposal for improvements, hotspot sectors contributing more than 10% were considered initially; therefore, the Chemical, rubber, and plastic product sector in Belarus had been the focus. SHDB ranks its inventory indicators for Corruption and Freedom of association & collective bargaining in Belarus (e.g., overall corruption) as very high.
Having 20% of K-fertilizer being imported from Lithuania (a low social risk country) at present, there could be a possibility of increasing this amount up to 77% for avoiding the impact associated with Belarus. According to the personal communication with officials of the Fertilizer secretariat of Sri Lanka the K-fertilizer has recently been imported from Israel, Jordan, Laos, Malaysia, Vietnam and Canada within the price range (in terms of CIF) of USD 850 to 950 per tonne. Therefore, this confirms the possibility of importing K-fertilizer from socially low risk countries such as Canada, Israel and Lithuania. We learned that the importation of fertilizer is currently being done considering the commercial value, availability of required amounts at the correct time, trade balance between relevant country, physical quality of material, credit facilities provided by supplier, etc. However, no consideration has been given to social risks in the country of origin, particularly the sectors ‘Corruption and Freedom of association & collective bargaining’ as revealed by the present study. Assuming equal amounts of K-fertilizer are imported from aforesaid low-risk countries (Canada, Israel and Lithuania) to avoid the social risks associated with the importation of the same from Belarus, scenario analysis was implemented.
As per scenario analysis, overall social risks associated with Corruption in the supply chains can be reduced by ca. 36%, if the importation of K-fertilizer shifted into low-risk countries. Similarly, it has impacted on Freedom of association & collective bargaining by reducing ca. 25% of risks. As a result, social risks in two targeted impact categories, i.e., Governance and Labor rights & decent work, have remarkably been reduced by ca. 35-41% and ca. 17-20%, respectively (see Figure 9). Also, other impact categories showed notable improvements; for instance, the impact category ‘Health & safety’ has been improved by ca. 22%. However, this has had a relatively low impact on the impact category of ‘Human rights’.
Overall, this paper highlights the significance of considering the entire supply chain when performing SLCA. Neglecting to do so may result in overlooked impacts in various geographic regions where imports are involved. Moreover, it emphasizes the importance of refining the supply chain by eliminating identified hotspots to enhance the social sustainability of the product being manufactured.
Improvements were identified as promising and can further be magnified by addressing the next levels of hotspots identified herein. More specifically, Chemical, rubber, and plastic product sector in China and the Electricity sector in Sri Lanka which involves urea and electricity supply chains respectively, may be the next touch points. Addressing the former issue may be achievable in short-term. However, resolving the latter may require more time and effort. In this regard, the Sri Lankan government should implement a comprehensive anti-corruption policy that outlines the laws, regulations, and punishments for acts of corruptions. This policy must be widely disseminated and understood by all stakeholders in the energy sector so that corruption can effectively be deterred.
In order to improve the conditions of Freedom of association & collective bargaining in the energy sector in Sri Lanka, it is essential to ensure that workers' rights are more respected than present. Moreover, the government should incentivize private companies to enter the energy sector fairly and transparently and ensure that they comply with relevant labor laws (economynext, 2022; ILO, 2023). Furthermore, the government should collaborate with private companies and trade unions to develop a skills training program for energy sector workers.
Once the hotspots identified herein are addressed, new ones may emerge. Therefore, continuously addressing these issues - for example, following the Plan, Do, Check, and Act (PDCA) cycle - can significantly reduce social footprints. This type of effort can also help achieve net positive social impacts by creating a social handprint (Norris et al., 2019; Norris, 2015).
Under a situation where previous SLCA studies had overlooked the natural rubber industry, one of our previous studies (site-specific) on a Sri Lankan rubber estate revealed that the production of crepe rubber posed a significant impact on social benefits, health and safety of the workers (Dunuwila et al., 2022). In contrast, using generic social data, this study unveiled a border spectrum of social risks concealed behind the far corners of rubber supply chains. In our view, combining both analyses would uplift the comprehensiveness of decision-making using SLCA.
Since this study was based on generic social data from the SHDB and the import ratios and unit prices that are prone to fluctuate, the social profiles observed herein may differ from those associated with real-world processes for the time being (Norris et al., 2019). Therefore, the supply chain may be required to be analyzed using site-specific data. Such an analysis could uncover more insightful information about the supply chains considered in this study. However, it should be noted that this process may require a significant amount of data and effort.
5. Conclusions
This paper unveiled the underlying social risks of three main rubber supply chains, crepe rubber, concentrated latex, and RSS in Sri Lanka. It highlighted the potential degrees of improvement that can be achieved through refining those supply chains. More specifically, Governance and Labor rights had been affected due to Corruption and Freedom of association and collective bargaining, mainly associated with the Chemical, rubber, and plastic product sectors of Belarus and China and the Electricity sector in Sri Lanka. Improvements would be promising upon the addressing of those hotspots. For instance, if the importation of K-fertilizer shifted into low risk countries, overall social risks associated with Corruption and Freedom of association & collective bargaining in the supply chains could be reduced by ca. 36% and 25%, respectively. As a result, social risks in two targeted impact categories, i.e., Governance and Labor rights & decent work, reduced by ca. 35-41% and ca. 17-20%, respectively. Therefore, relevant officials may put their hands on urgently addressing these issues. Further, they may continuously work toward reducing the social footprint of subjected rubber supply chains and subsequently, using the positiveness in marketing approaches. The findings herein will help Sri Lanka to be competitive in the sustainability-conscious-world rubber market, ultimately contributing to rebuilding its hard-hit economy. This paper vitalizes the supply chain-based analysis. Any industry may follow its methodical hierarchy to measure social sustainability and thereby give relevant refinements to assure the social well-being of the supply chain of interest.
Supplementary Materials
The following supporting information can be downloaded at the website of this paper posted on Preprints.org.
Author Contributions
Conceptualization, P.D., V.R. and N.G.; Methodology, P.D., V.R.; Software, P.D.; Validation, P.D. and V.R.; Formal Analysis, P.D.; Investigation, P.D.; Resources, I.D. and N.G.; Data Curation, P.D.; Writing – Original Draft Preparation, P.D.; Writing – Review & Editing, V.R., I.D. and N.G.; Visualization, P.D.; Supervision, V.R., I.D. and N.G. All authors have read and agreed to the published version of the manuscript.
Acknowledgments
We want to extend our sincere gratitude to Mr. Shobatake from TCO2 Co., Ltd. and the researchers (especially Dr. Sajeep Sankalpa and Dr. Rasika Hettiarachchi) and officials (especially Mr. Lakshman) from the Rubber Research Institute of Sri Lanka, and factory employees (especially Mr. Ranil) for their invaluable assistance in helping us bring this project to fruition. Without their support, this work would not have been possible.
Conflicts of Interest
The authors declare no conflict of interest.
References
- Andrews, E.S. , Barthel, L.-P., Tabea, B., Benoît, C., Ciroth, A., Cucuzzella, C., Gensch, C.-O., Hébert, J., Lesage, P., Manhart, A., Mazeau, P., Mazijn, B., Methot, A.-L., Parent, J., Moberg, A., Norris, G., Prakash, S., Reveret, J.-P., Spillemaeckers, S., Ugaya, C.M., Valdivia, S., Weidema, B., 2009. Guidelines for Social Life Cycle Assessment of Products. UNEP.
- Bengtsen, P. , 2013. Behind the rubber label.
- Benoît Norris, C. , Norris, G., 2015. The Social Hotspots Database Context of the SHDB, in: Murray, J., McBain, D., Wiedmann, T. (Eds.), The Sustainability Practitioner’s Guide to Social Analysis and Assessment. Common Ground Publishing.
- Benoît Norris, C. , Traverso, M., Neugebauer, S., Ekener, E., Schaubroeck, T., Russo Garrido, S., Berger, M., Valdivia, S., Lehmann, A., Finkbeiner, M., Arcese, G., 2020. Guidelines for Social Life Cycle Assessment of Products and Organisations 2020. UNEP.
- Benoît-Norris, C. , Vickery-Niederman, G., Valdivia, S., Franze, J., Traverso, M., Ciroth, A., Mazijn, B., 2011. Introducing the UNEP/SETAC methodological sheets for subcategories of social LCA. Int J Life Cycle Assess 16, 682–690. [CrossRef]
- Birnbach, M. , Lehmann, A., Naranjo, E., Finkbeiner, M., 2020. A condom’s footprint - life cycle assessment of a natural rubber condom. International Journal of Life Cycle Assessment 25, 964–979. [CrossRef]
- Cecil, J. , Mitchell, P., 2005. Processing of Natural Rubber [WWW Document].
- Center for Global Trade Analysis, 2023. Global Trade Analysis Project (GTAP) [WWW Document]. URL https://www.gtap.agecon.purdue.edu/ (accessed 3.15.23).
- Datawheel, 2023. The Observatory of Economic Complexity | OEC - The Observatory of Economic Complexity [WWW Document]. URL https://oec.world/ (accessed 3.16.23).
- Dunuwila, P. , Rodrigo, V.H.L., Daigo, I., Goto, N., 2022. Social impact improving model based on a novel social life cycle assessment for raw rubber production: A case of a Sri Lankan rubber estate. J Clean Prod 338, 130555. [CrossRef]
- Dunuwila, P. , Rodrigo, V.H.L., Goto, N., 2020. Improving financial and environmental sustainability in concentrated latex manufacture. J Clean Prod 255. [CrossRef]
- Dunuwila, Pasan, Rodrigo, V.H.L., Goto, N., 2020. Improving financial and environmental sustainability in concentrated latex manufacture. J Clean Prod 255, 120202. [CrossRef]
- Dunuwila, P. , Rodrigo, V.H.L., Goto, N., 2018a. Financial and environmental sustainability in manufacturing of crepe rubber in terms of material flow analysis, material flow cost accounting and life cycle assessment. J Clean Prod 182, 587–599. [CrossRef]
- Dunuwila, P. , Rodrigo, V.H.L., Goto, N., 2018b. Assessing the Financial and Environmental Sustainability in Raw Rubber Processing; a Case Study with Ribbed Smoked Sheet Manufacture in Sri Lanka. Indonesian Journal of Life Cycle Assessment and Sustainability 2.
- Dunuwila, P. , Rodrigo, V.H.L., Goto, N., 2018c. Sustainability of natural rubber processing can be improved: A case study with crepe rubber manufacturing in Sri Lanka. Resour Conserv Recycl 133, 417–427. [CrossRef]
- economynext, 2022. Sri Lanka opens floodgates for corruption in power sector: Harsha | EconomyNext [WWW Document]. URL https://economynext.com/sri-lanka-opens-floodgates-for-corruption-in-power-sector-harsha-95565/ (accessed 3.16.23).
- Edirisinghe, J. , 2013. Community Pressure and Environmental Compliance: Case of Rubber Processing in Sri Lanka. Journal of Environmental Professionals Sri Lanka 1. [CrossRef]
- Ekener, E. , Hansson, J., Gustavsson, M., 2018. Addressing positive impacts in social LCA—discussing current and new approaches exemplified by the case of vehicle fuels. International Journal of Life Cycle Assessment 23, 556–568. [CrossRef]
- EMR, 2023. Market Research Reports | Strong Industry Analysis | Expert Market Research [WWW Document]. URL https://www.expertmarketresearch.com/about-us (accessed 3.15.23).
- Fagbemi, E.A. , Audu, M., Ayeke, P., Ohifuemen, A., 2018. A, Ribbed Smoked Rubber Sheet Production – Review. Ribbed Smoked Rubber Sheet Production – A Review 3, 38–41.
- Hannouf, M. , Assefa, G., 2018. Subcategory assessment method for social life cycle assessment: a case study of high-density polyethylene production in Alberta, Canada. International Journal of Life Cycle Assessment 23, 116–132. [CrossRef]
- Hossain, M.U. , Poon, C.S., Dong, Y.H., Lo, I.M.C., Cheng, J.C.P., 2018. Development of social sustainability assessment method and a comparative case study on assessing recycled construction materials. International Journal of Life Cycle Assessment 23, 1654–1674. [CrossRef]
- IHS Markit, 2017. Rubber, Natural - Chemical Economics Handbook [WWW Document]. URL https://www.ihs.com/products/natural-rubber-chemical-economics-handbook.html (accessed 12.18.17).
- ILO, 2023. 8.Freedom of Association and Collective Bargaining [WWW Document]. URL https://www.ilo.org/global/topics/dw4sd/themes/freedom-of-association/lang--en/index.htm (accessed 3.16.23).
- IndiaMART, 2023. IndiaMART [WWW Document]. URL https://www.indiamart.com/ (accessed 3.16.23).
- Jawjit, W. , Kroeze, C., Rattanapan, S., 2010. Greenhouse gas emissions from rubber industry in Thailand. J Clean Prod 18, 403–411. [CrossRef]
- Jawjit, W. , Pavasant, P., Kroeze, C., 2015. Evaluating environmental performance of concentrated latex production in Thailand. J Clean Prod 98, 84–91. [CrossRef]
- Jawjit, W. , Pavasant, P., Kroeze, C., Tuffey, J., 2021. Evaluation of the potential environmental impacts of condom production in Thailand. Journal of Integrative Environmental Sciences 18, 89–114. [CrossRef]
- Kumara, P.R. , Munasinghe, E.S., Rodrigo, V.H.L., Karunaratna, A.S., 2016. Carbon Footprint of Rubber/Sugarcane Intercropping System in Sri Lanka: A Case Study. Procedia Food Sci 6, 298–302. [CrossRef]
- Leong, S.T. , Muttamara, S., Laortanakul, P., 2003. Reutilization of wastewater in a rubber-based processing factory: a case study in Southern Thailand. Resour Conserv Recycl 37, 159–172. [CrossRef]
- Massoudinejad, M. , Mehdipour-Rabori, M., Dehghani, M.H., 2015. Treatment of natural rubber industry wastewater through a combination of physicochemical and ozonation processes Citation: Massoudinejad M, Mehdipour-Rabori M, Dehghani MH. Treatment of Natural Rubber Industry Wastewater through a Combination of Physicoch. J Adv Environ Health Res 3, 242–9.
- NewEarth B, 2019. SHDB [WWW Document]. URL http://www.socialhotspot.org/ (accessed 10.31.21).
- Norris, C.B. , Norris, G.A., Azuero, L., Pflueger, J., 2019. Creating Social Handprints: Method and Case Study in the Electronic Computer Manufacturing Industry. Resources 2019, Vol. 8, Page 176 8, 176. [CrossRef]
- Pollok, L. , Spierling, S., Endres, H.J., Grote, U., 2021. Social Life Cycle Assessments: A Review on Past Development, Advances and Methodological Challenges. Sustainability 2021, Vol. 13, Page 10286 13, 10286. [CrossRef]
- PRé Sustainability, 2023. About SimaPro - SimaPro [WWW Document]. URL https://simapro.com/about/ (accessed 3.16.23).
- Rubber Research Institute of Sri Lanka, 2016a. Production of Budded Plants. Rubber Research Institute of Sri Lanka.
- Rubber Research Institute of Sri Lanka, 2016b. Fertilizer for Rubber. Rubber Research Institute of Sri Lanka.
- Rubber Research Institute of Sri Lanka, 2003. HANDBOOK OF RUBBER.
- Saling, P. , Morris, D., Florea, A., Visser, D., Morao, A., Musoke-Flores, E., Alvarado, C., Rawat, I., Schenker, U., Goedkoop, M., Harmens, R., de Beer, I., Head, M., Collotta, M., Viot, J.-F., Whatelet, A., Andro, T., 2020. Handbook for product social impact assessment. PRé Sustainability.
- Santos, A. , Benoît Norris, C., Barbosa-Póvoa, A., Carvalho, A., 2020. Social Life Cycle Assessment of Pulp and Paper Production – A Portuguese Case Study. Computer Aided Chemical Engineering 48, 15–20. [CrossRef]
- Sri Lanka Rubber Secretariat, 2017. Sri Lanka Rubber Industry Development Master Plan 2017-2026. Battaramulla.
- Tekasakul, P. , Tekasakul, S., 2006. Environmental Problems Related to Natural Rubber Production in Thailand. J. Aerosol Res 21, 122–129.
- The International Organization for Standardization (ISO), 2006. International Standard ISO 1 4040.
- Tillekeratne, L.M.K. , 2017. Strategies to curb declining rubber production | The Sunday Times Sri Lanka. The Sunday Times Sri Lanka.
- UNESCAP, 2011. Country Study on Sri Lanka using Global Value Chain Analysis: THE INDUSTRIAL RUBBER AND ELECTRONIC PRODUCTS SECTORS.
- U.S. BUREAU OF LABOR STATISTICS, 2023. CPI Inflation Calculator [WWW Document]. URL https://www.bls.gov/data/inflation_calculator.htm (accessed 3.16.23).
- Volza, 2020. Volza.com - Global Export Import Trade Data of 209 Countries [WWW Document]. URL https://www.volza.com/ (accessed 3.16.23).
- Zheng, X. , Easa, S.M., Ji, T., Jiang, Z., 2020. Modeling life-cycle social assessment in sustainable pavement management at project level. International Journal of Life Cycle Assessment 25, 1106–1118. [CrossRef]
Figure 1.
System boundary of the study. Shaded boxes demarcate background processes. LDPE refers to low-density polyethylene.
Figure 1.
System boundary of the study. Shaded boxes demarcate background processes. LDPE refers to low-density polyethylene.
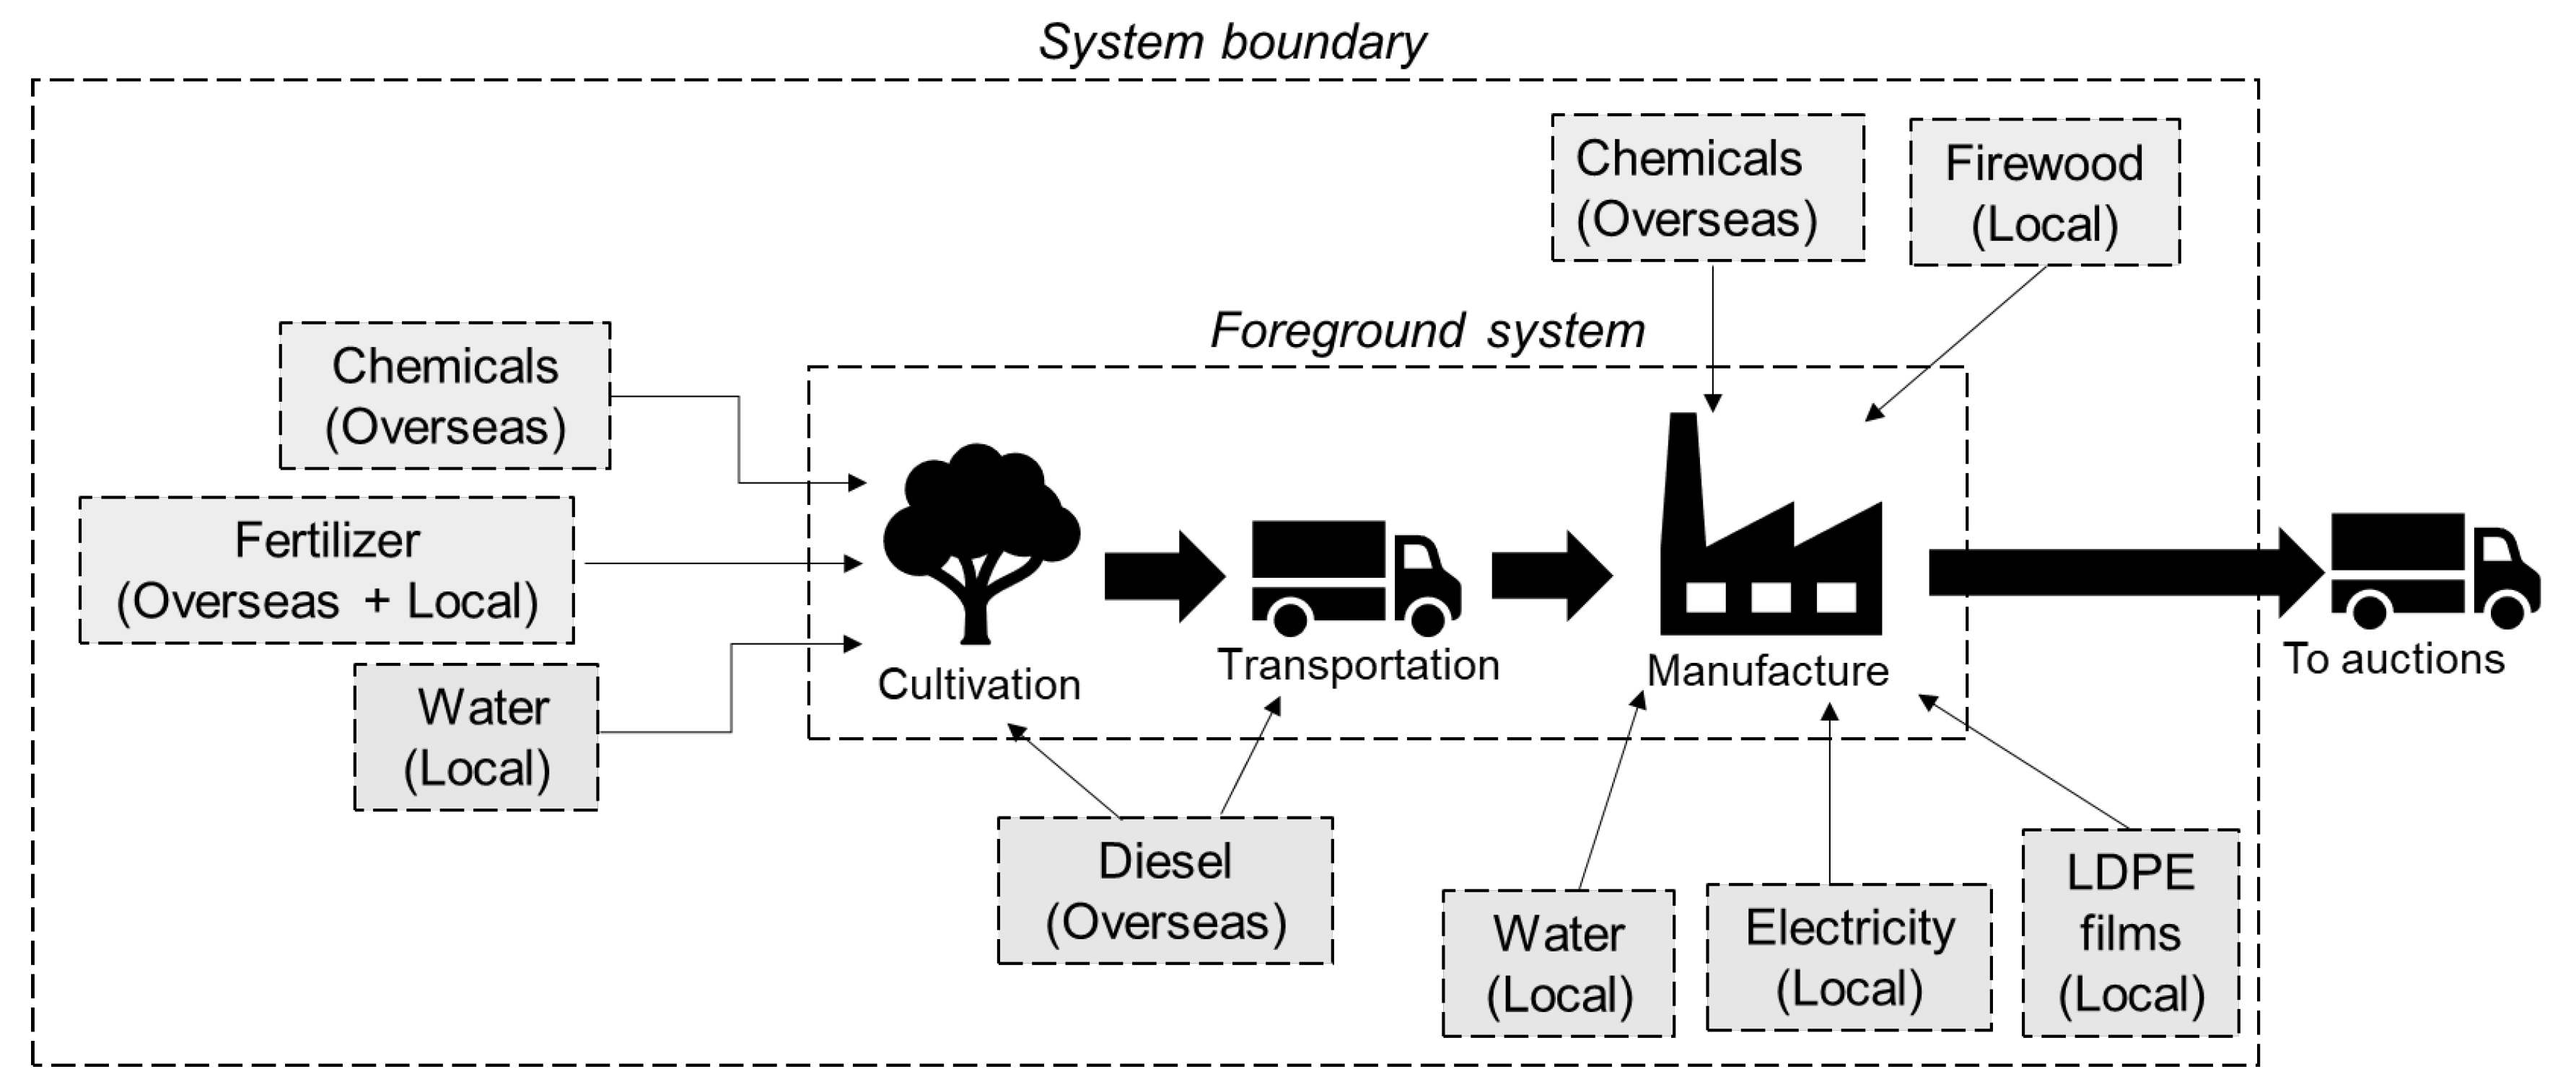
Figure 2.
Social footprints of three raw rubber types per 1 tonne of product basis in terms of medium risk hours equivalent (Mrheq). Contributions of respective impact categories to the social footprints of respective products are indicated within parentheses as percentages (%).
Figure 2.
Social footprints of three raw rubber types per 1 tonne of product basis in terms of medium risk hours equivalent (Mrheq). Contributions of respective impact categories to the social footprints of respective products are indicated within parentheses as percentages (%).
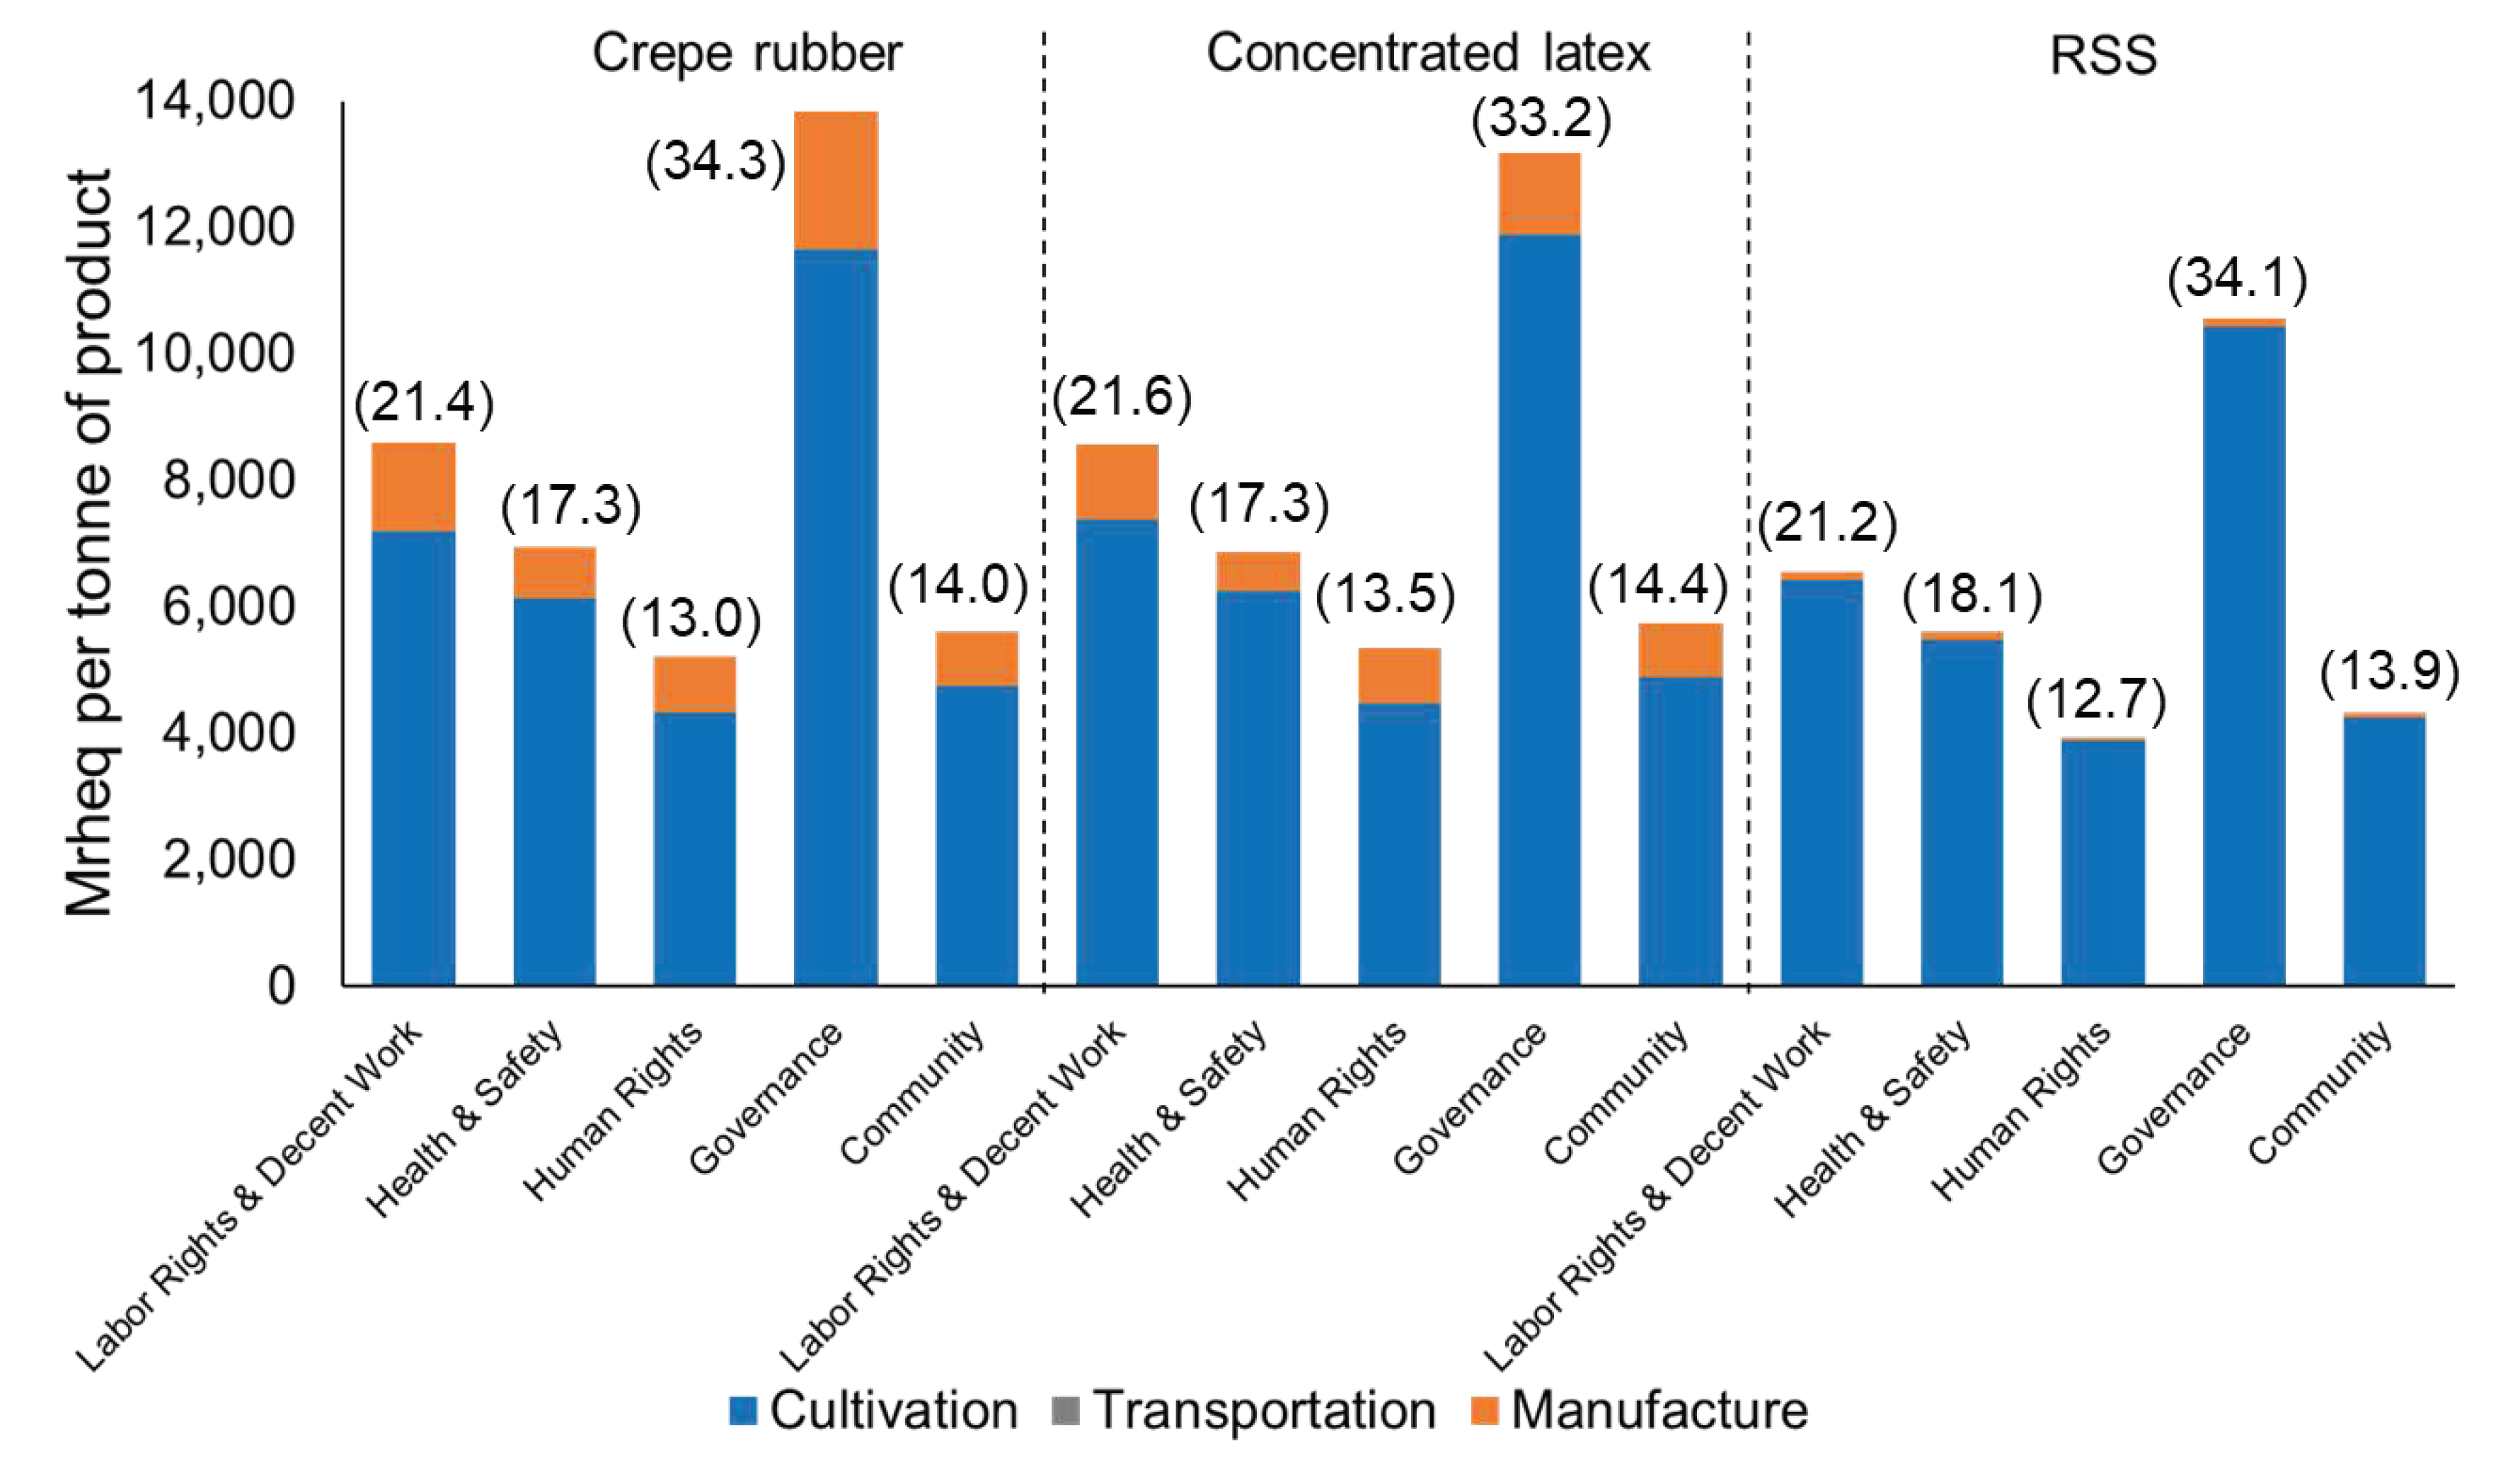
Figure 3.
Contribution of crepe-rubber supply chain activities at every subcategory. LDPE, MOP, and KIE refer to low-density polyethylene, muriate of potash, and kieserite, respectively.
Figure 3.
Contribution of crepe-rubber supply chain activities at every subcategory. LDPE, MOP, and KIE refer to low-density polyethylene, muriate of potash, and kieserite, respectively.
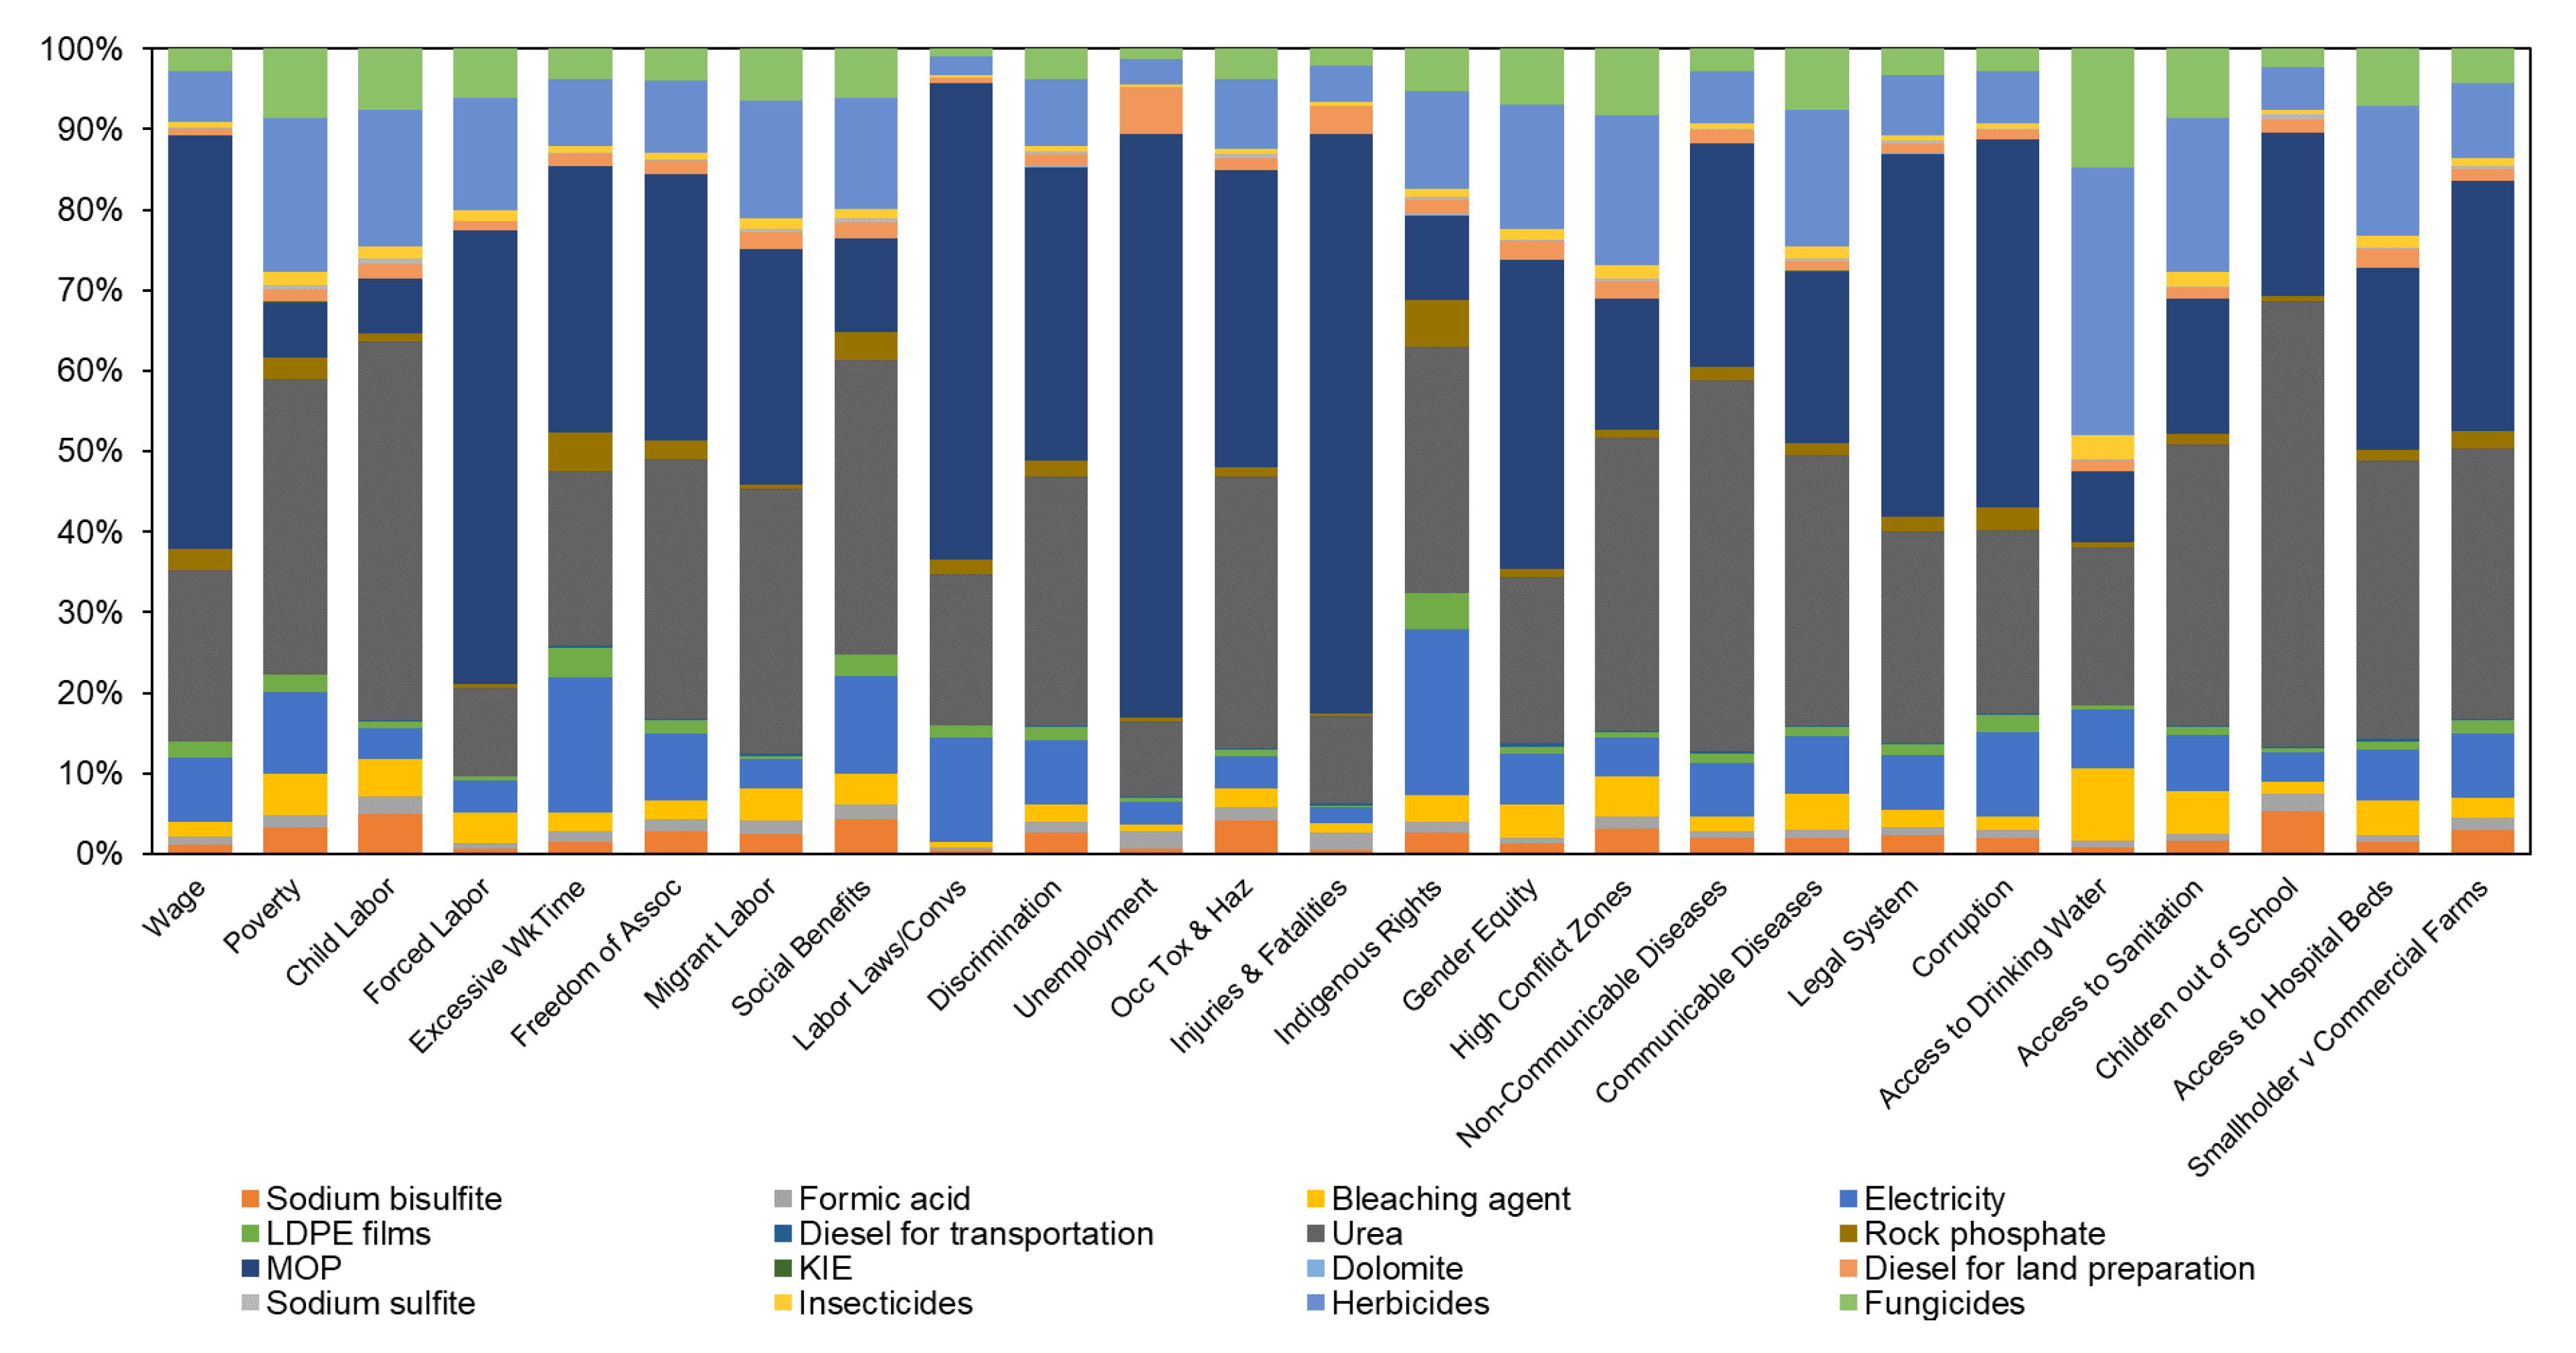
Figure 4.
Contribution of activities related to concentrated latex rubber supply chain at every subcategory. DAHP, TZ., TMTD, MOP, KIE refer to diammonium hydrogen phosphate, a mixture of tetramethyl thiuram disulfide (TMTD) and zinc oxide (ZnO), tetramethyl thiuram disulfide, muriate of potash, and kieserite, respectively.
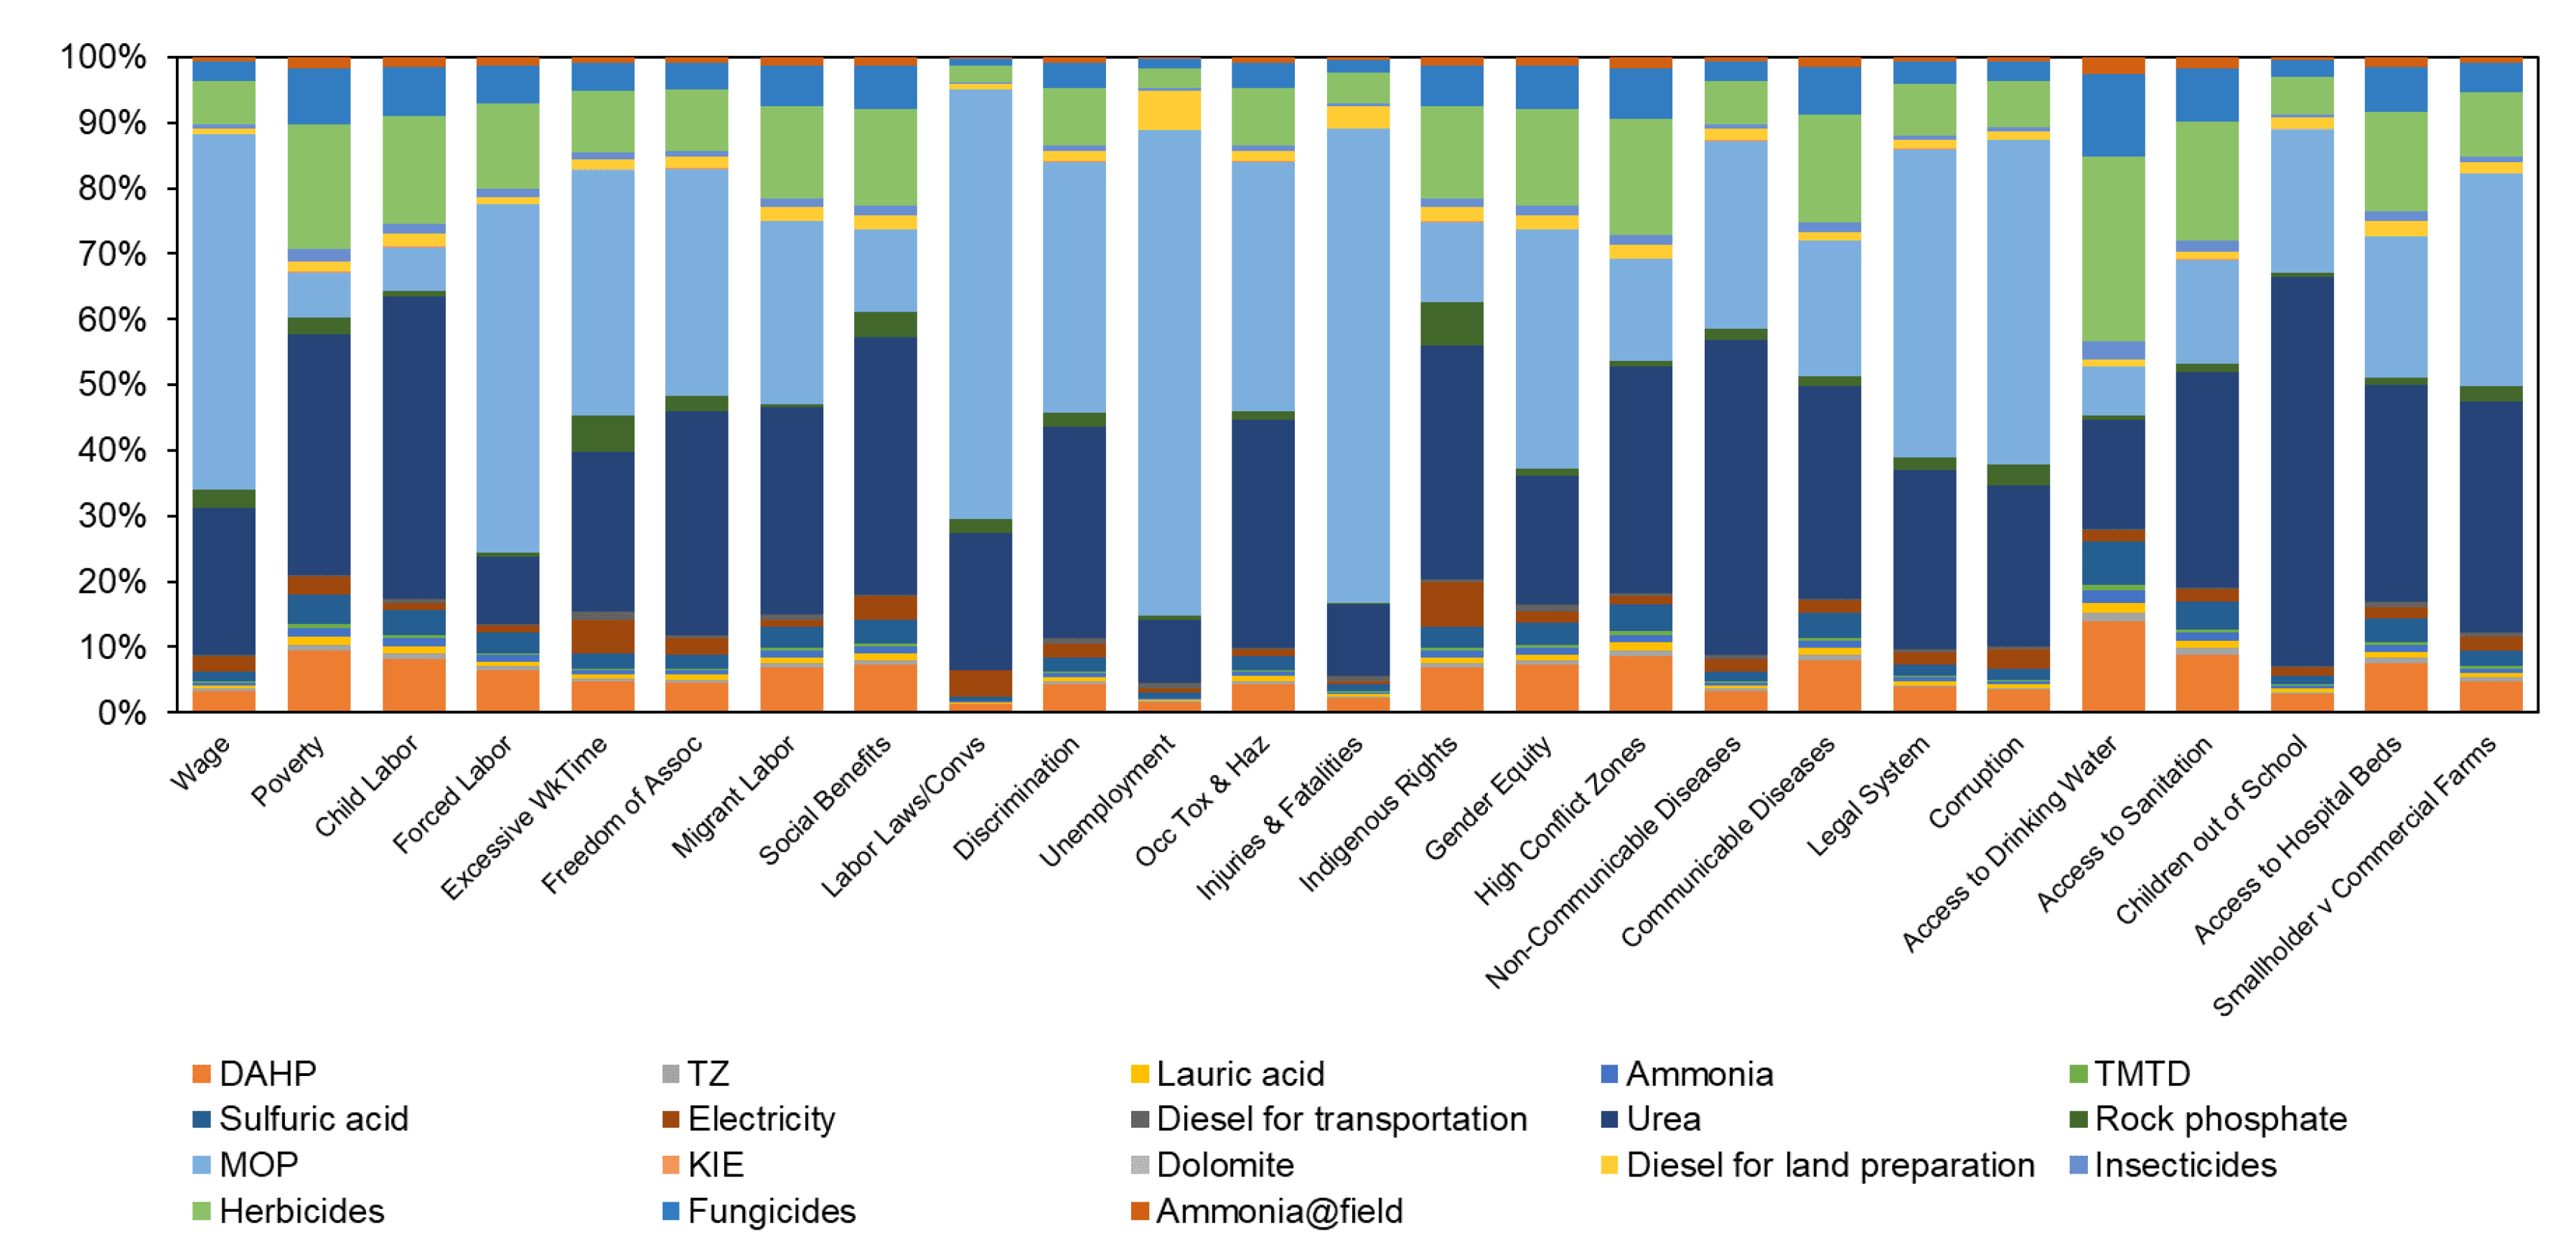
Figure 5.
Contribution of activities related to ribbed smoked sheets rubber supply chain at every subcategory. MOP and KIE refer to muriate of potash, and kieserite, respectively.
Figure 5.
Contribution of activities related to ribbed smoked sheets rubber supply chain at every subcategory. MOP and KIE refer to muriate of potash, and kieserite, respectively.
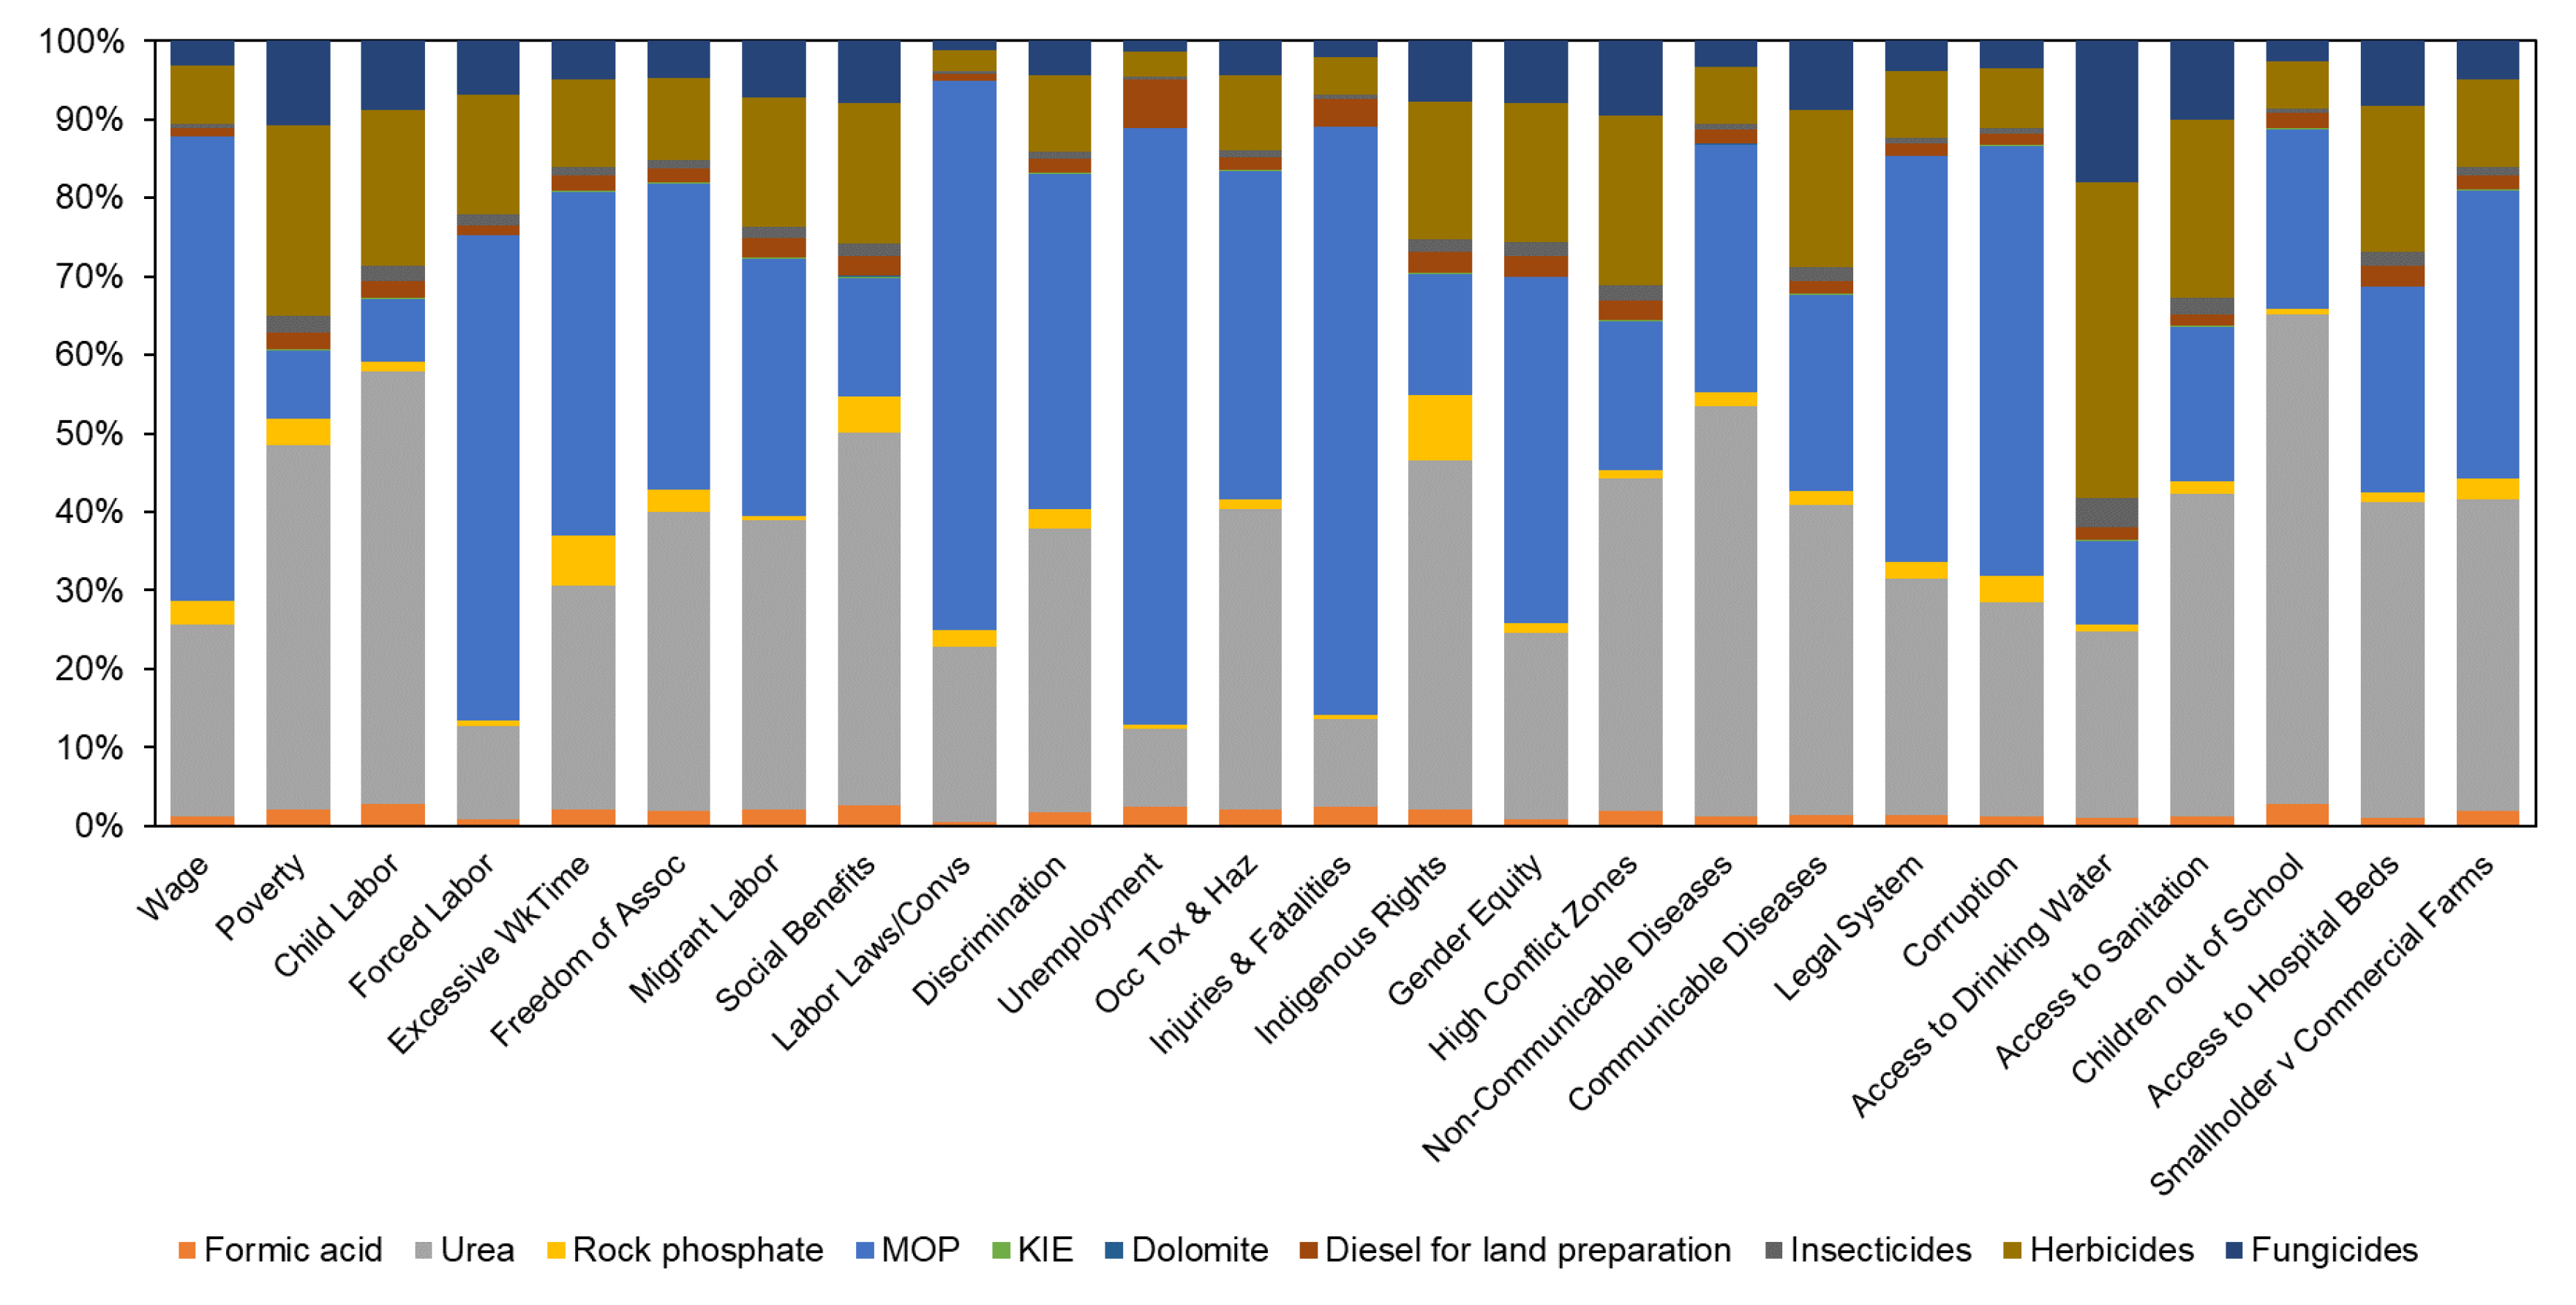
Figure 6.
Hotspots analysis of crepe rubber supply chain (a: Corruption; b: Freedom of association & collective bargaining). Sectors with more than 3% contribution are labeled. Red text: x ≥10%; orange text: 10% > x ≥5%; green text: 5% > x ≥3%. Grey text signifies indirectly involved sectors.
Figure 6.
Hotspots analysis of crepe rubber supply chain (a: Corruption; b: Freedom of association & collective bargaining). Sectors with more than 3% contribution are labeled. Red text: x ≥10%; orange text: 10% > x ≥5%; green text: 5% > x ≥3%. Grey text signifies indirectly involved sectors.
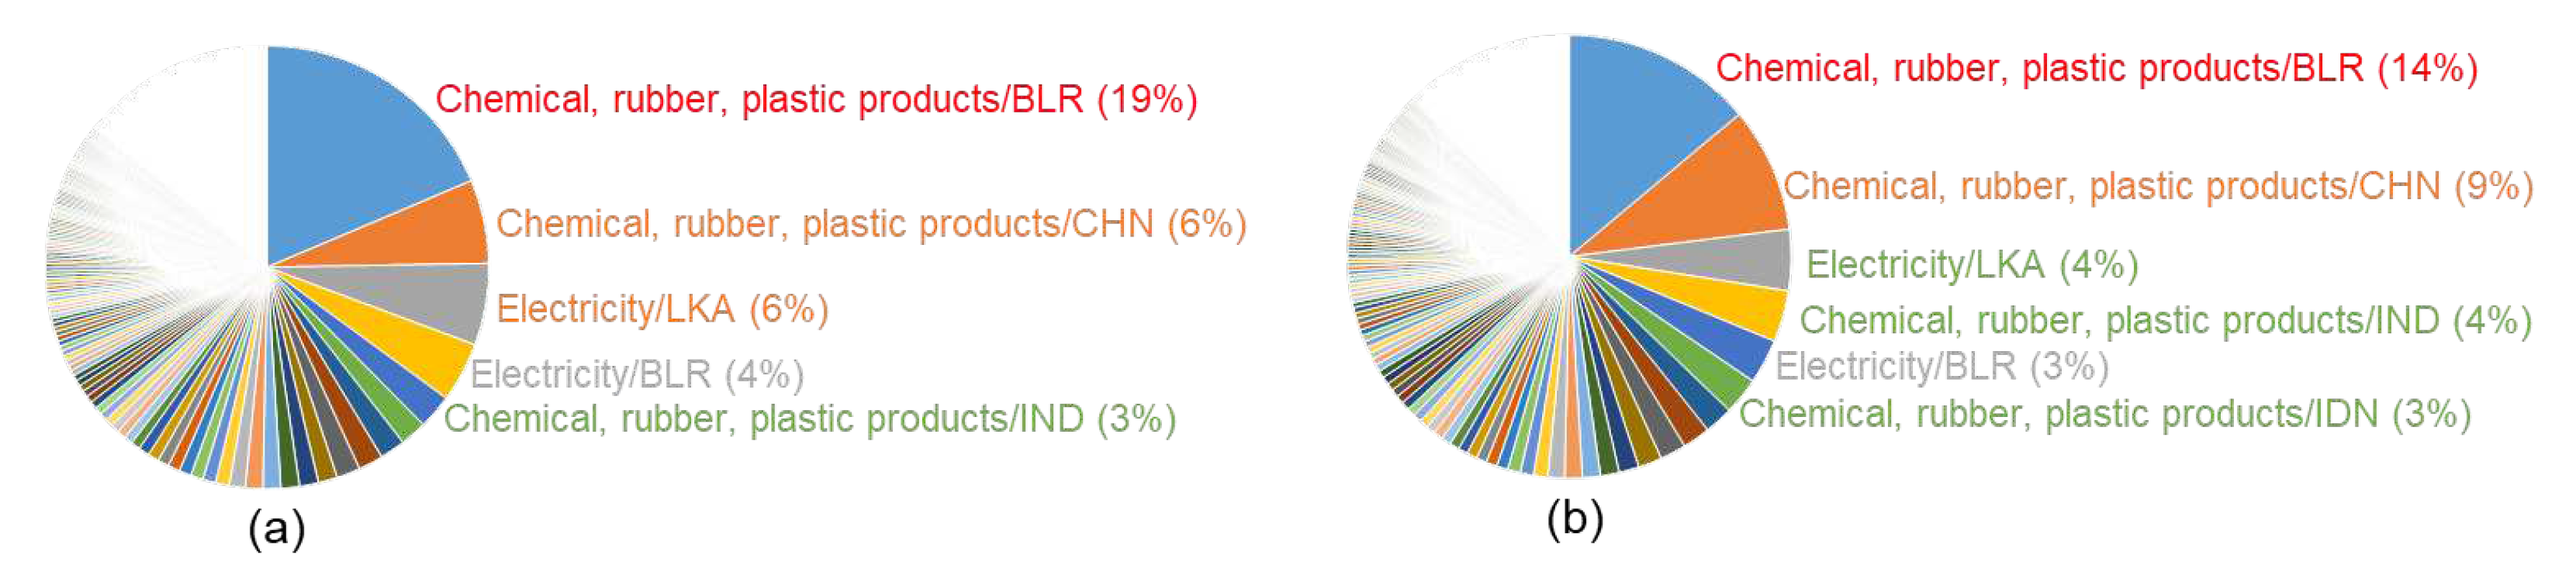
Figure 7.
Hotspots analysis of concentrated latex supply chain (a: Corruption; b: Freedom of association & collective bargaining). Sectors with more than 3% contribution are labeled. Directly involving sectors with more than 3% contribution are labeled. Red text: x ≥10%; orange text: 10% > x ≥5%; green text: 5% > x ≥3%. Grey text signifies indirectly involved sectors.
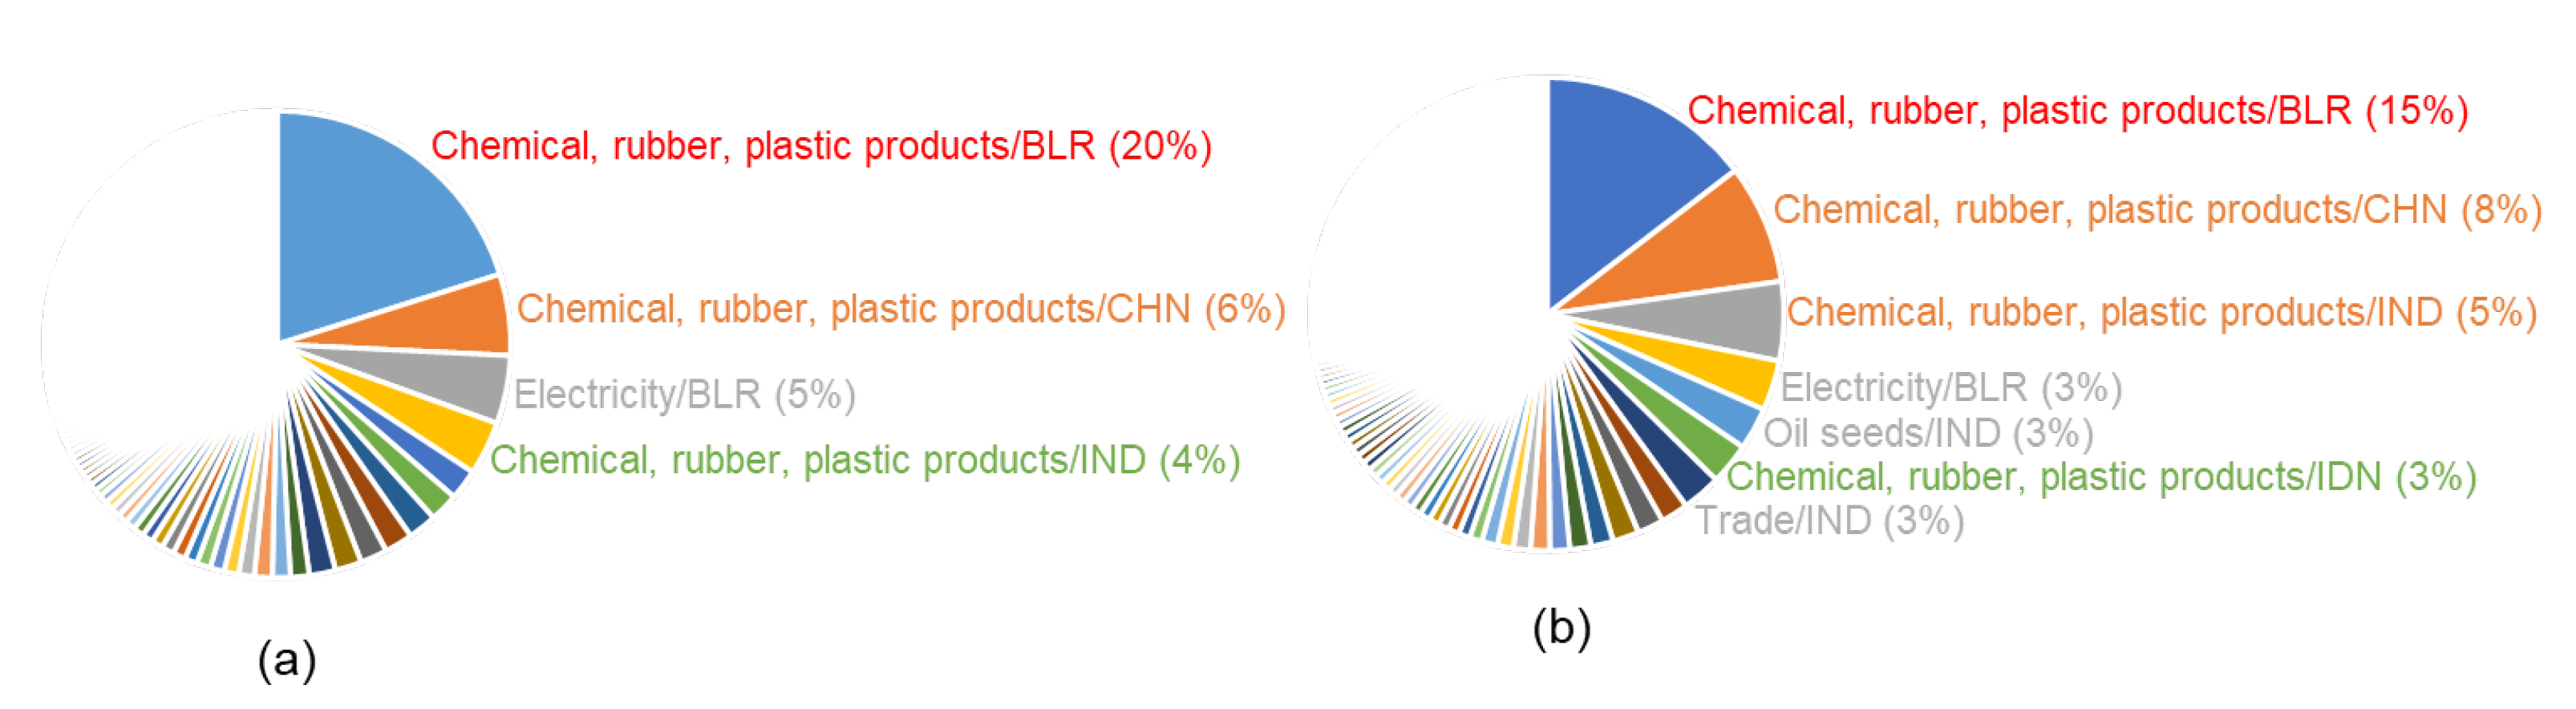
Figure 8.
Hotspots analysis of RSS supply chain (a: Corruption; b: Freedom of association & collective bargaining)). Sectors with more than 3% contribution are labeled. Directly involving sectors with more than 3% contribution are labeled. Red text: x ≥10%; orange text: 10% > x ≥5%; green text: 5% > x ≥3%. Grey text signifies indirectly involved sectors.
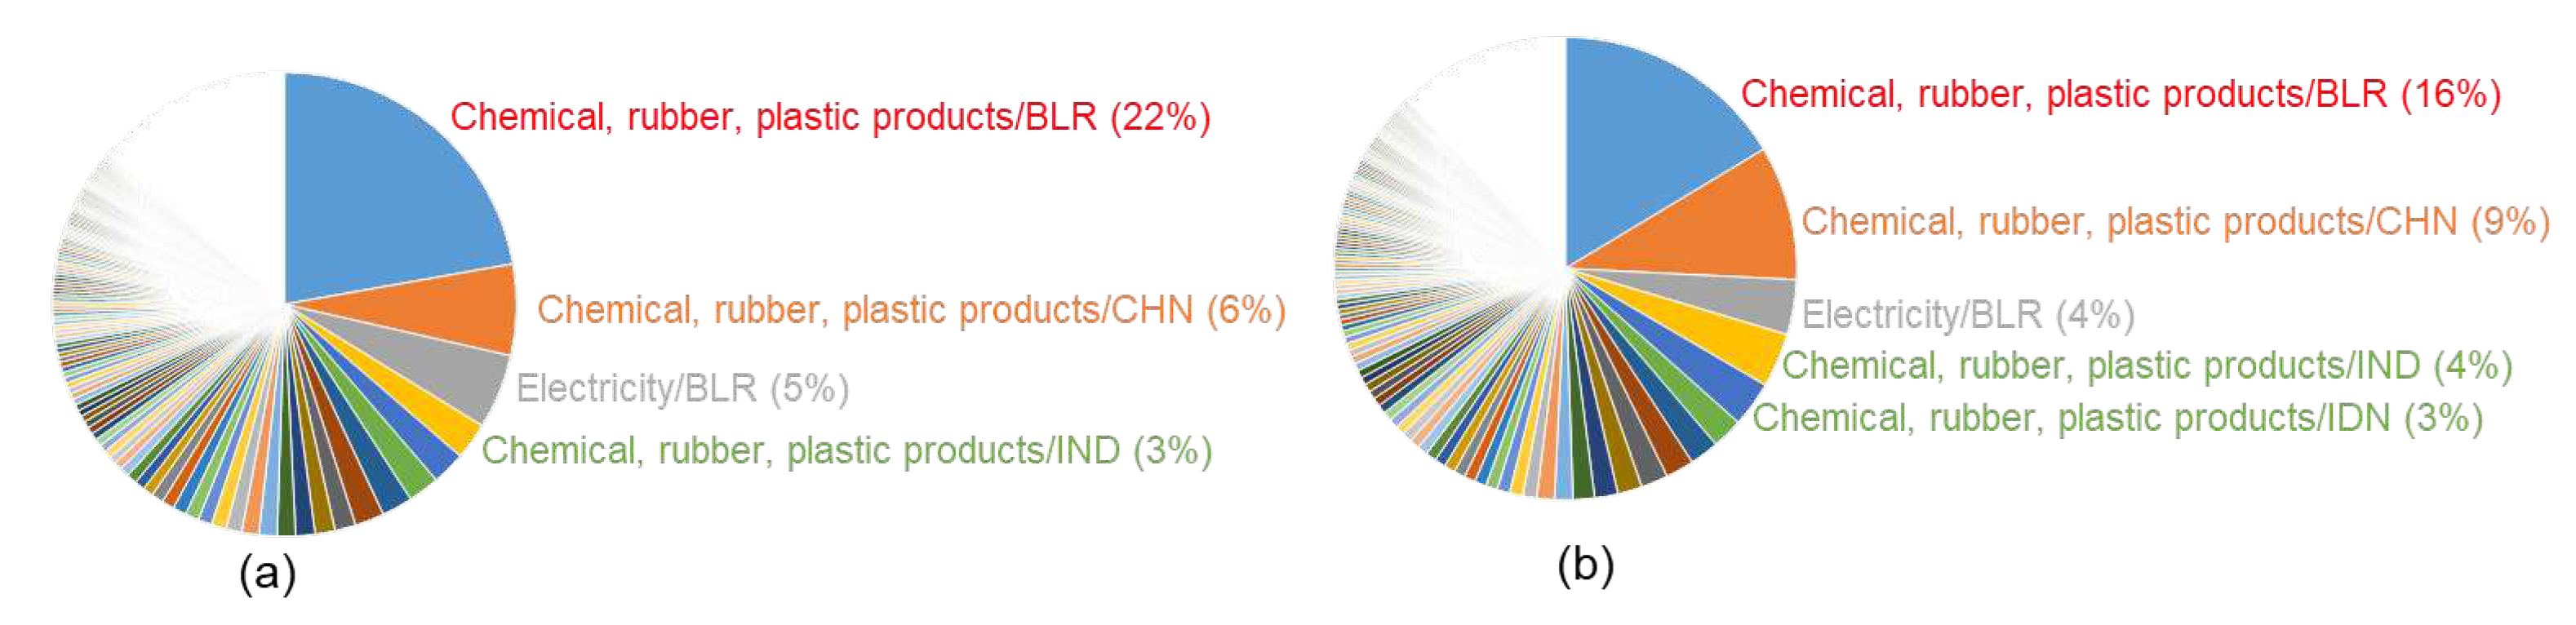
Figure 9.
Reduction potentials of social risks in the supply chain (a: crepe rubber; b: concentrated latex; c: ribbed smoked sheets) by importing of K-fertilizer from low risk countries.
Figure 9.
Reduction potentials of social risks in the supply chain (a: crepe rubber; b: concentrated latex; c: ribbed smoked sheets) by importing of K-fertilizer from low risk countries.
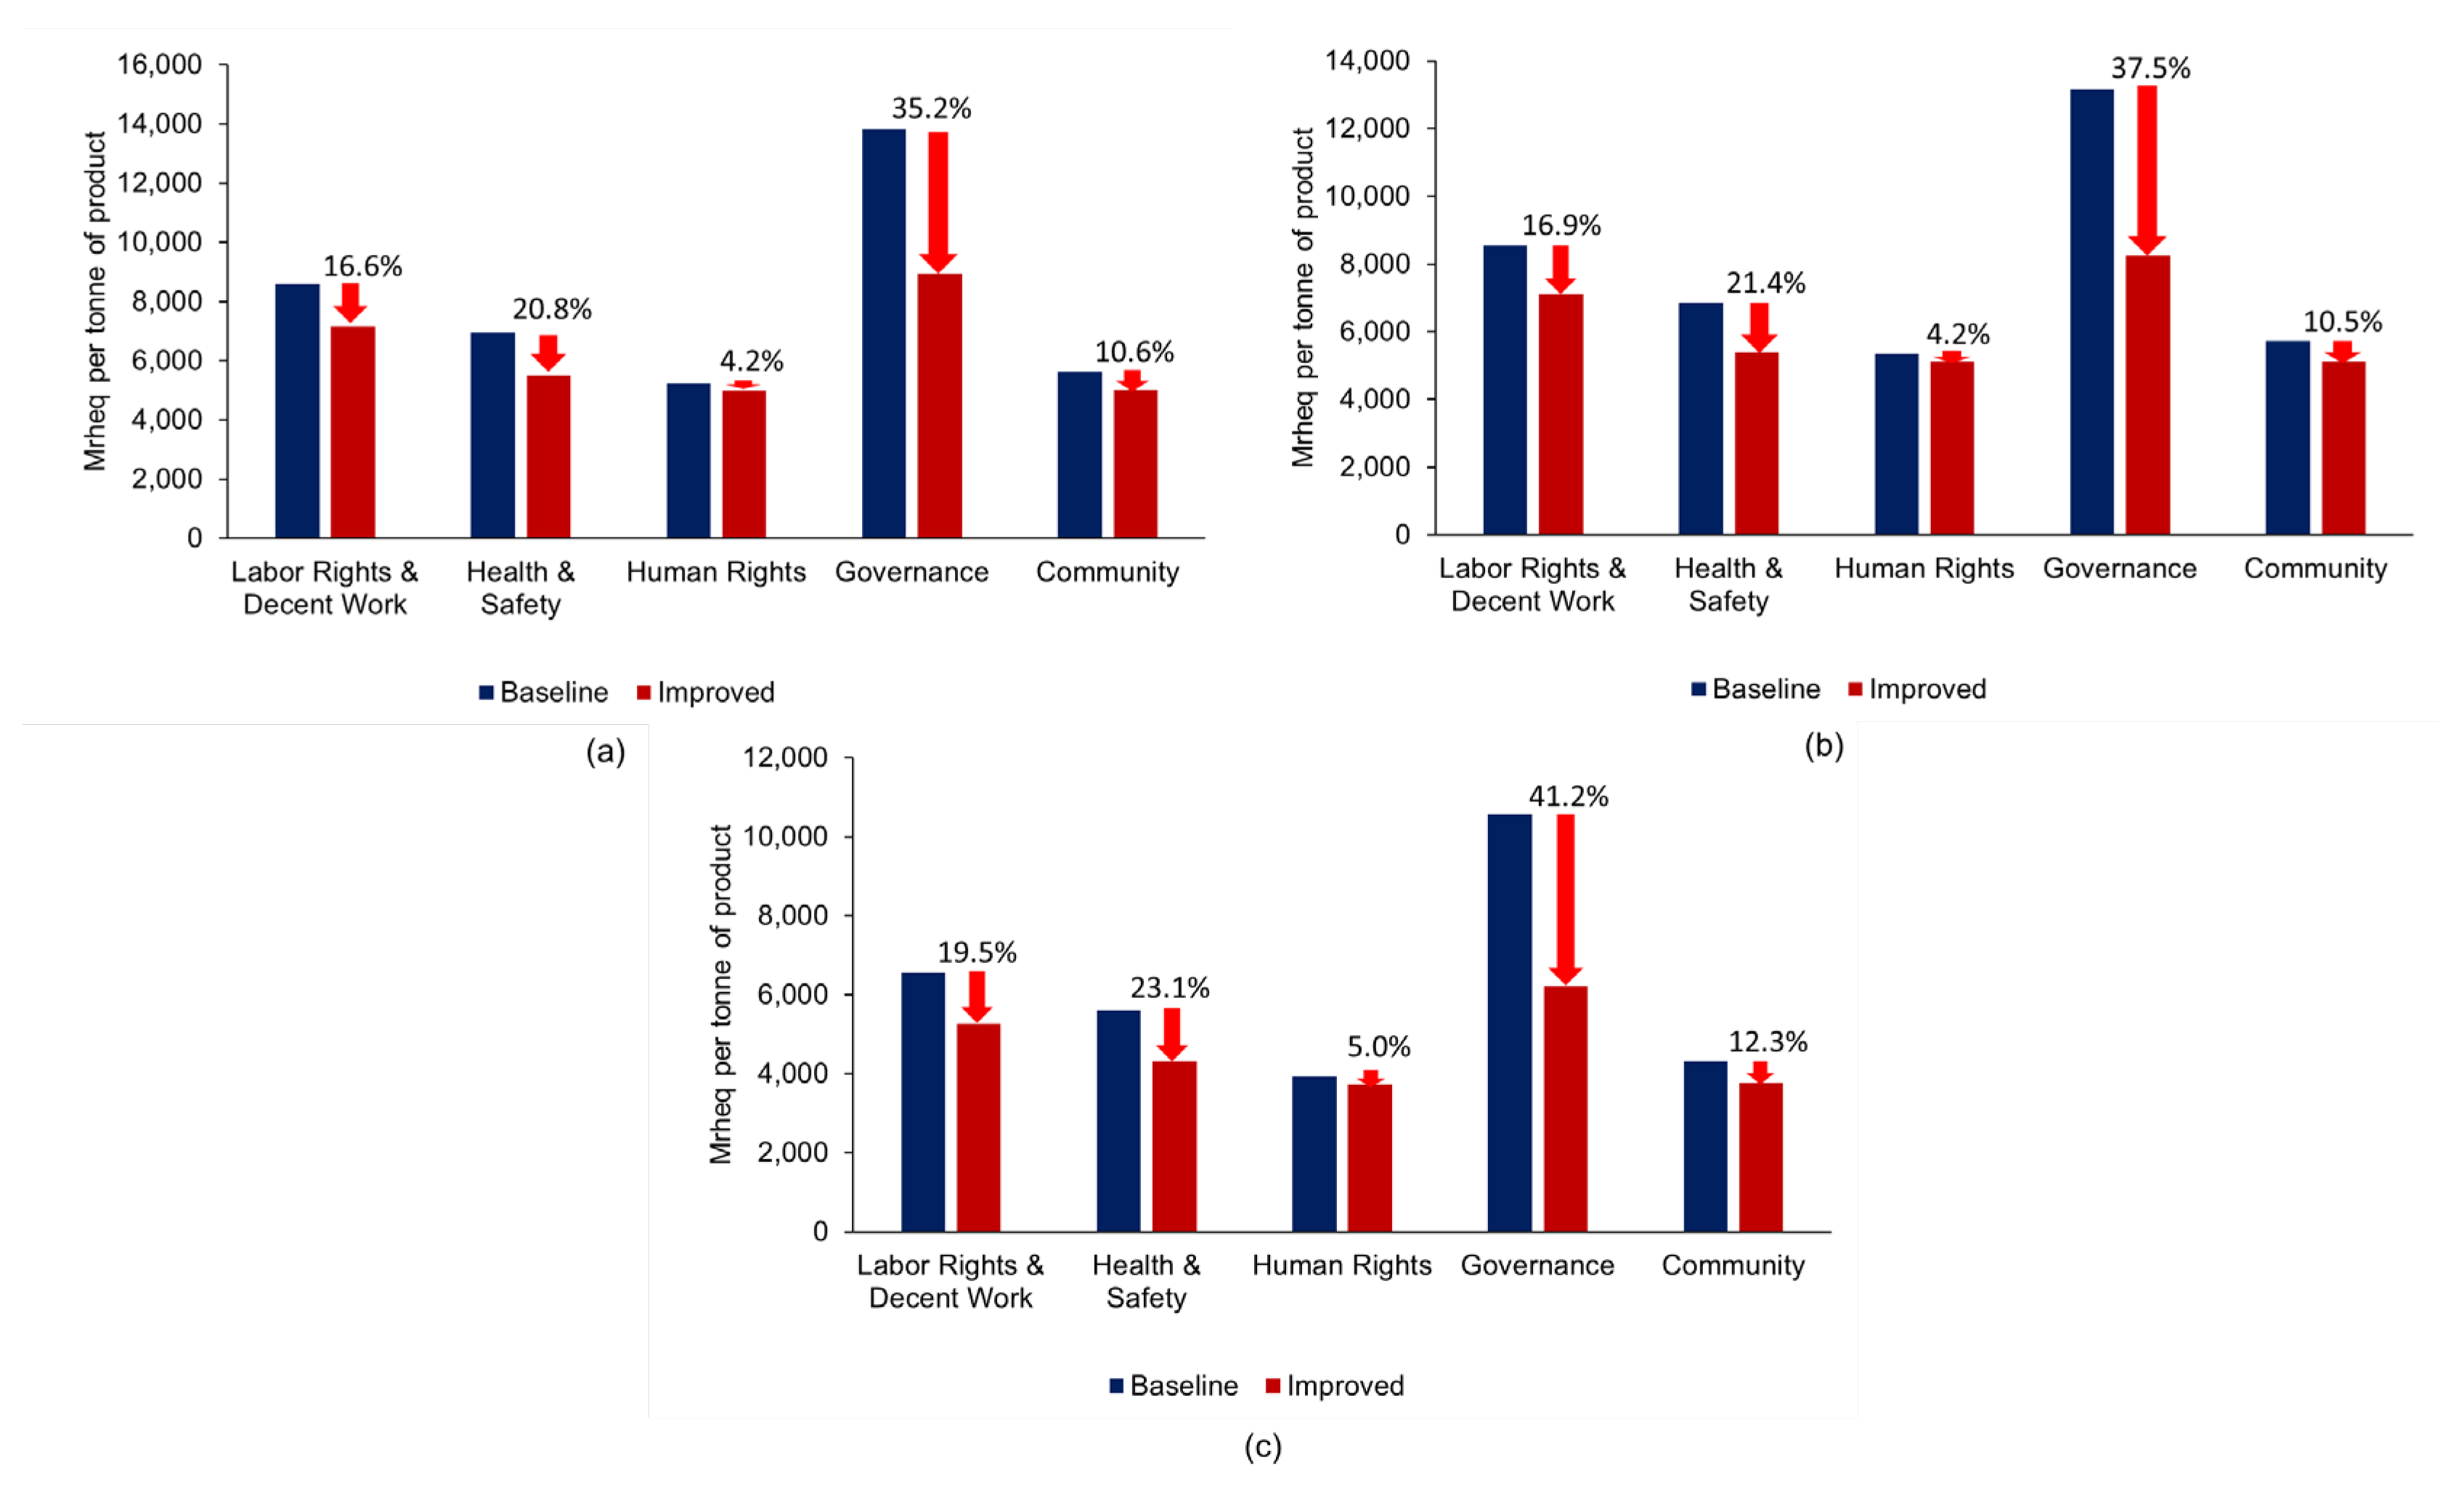

Table 1.
Social footprints of subcategories of each impact category under three rubber supply chains. CL and RSS refer to concentrated latex and ribbed smoked sheets, respectively. Values are given in Mrheq per 1 tonne of product basis with percentage of contribution to the total in parenthesis.
Table 1.
Social footprints of subcategories of each impact category under three rubber supply chains. CL and RSS refer to concentrated latex and ribbed smoked sheets, respectively. Values are given in Mrheq per 1 tonne of product basis with percentage of contribution to the total in parenthesis.
| Impact category | Subcategory | Crepe rubber | CL | RSS |
| Labor rights and decent work | Wage | 262.9 (2.8) | 253.1 (2.7) | 205.2 (2.8) |
| Poverty | 417.3 (4.4) | 454.3 (4.8) | 317.7 (4.4) | |
| Child Labor | 446.6 (4.7) | 433.3 (4.6) | 319.3 (4.4) | |
| Forced Labor | 614.9 (6.5) | 655.6 (6.9) | 498.4 (6.8) | |
| Excessive WkTime | 206.6 (2.2) | 185.4 (2.0) | 140.3 (1.9) | |
| Freedom of Assoc | 1027.1(10.8) | 990.9 (10.4) | 780.0 (10.7) | |
| Migrant Labor | 611.0 (6.4) | 645.2 (6.8) | 487.1 (6.7) | |
| Social Benefits | 326.0 (3.4) | 307.2 (3.2) | 225.9 (3.1) | |
| Labor Laws/Convs | 215.5 (2.3) | 197.0 (2.1) | 163.0 (2.2) | |
| Discrimination | 564.8 (5.9) | 554.1 (5.8) | 439.0 (6.0) | |
| Unemployment | 31.9 (0.3) | 31.6 (0.3) | 27.2 (0.4) | |
| Health & safety | Occ Tox & Haz | 572.8 (6.0) | 555.1 (5.9) | 448.1 (6.2) |
| Injuries & Fatalities | 130.0 (1.4) | 131.5 (1.4) | 111.9 (1.5) | |
| Human rights | Indigenous Rights | 156.6 (1.6) | 164.6 (1.7) | 117.7 (1.6) |
| Gender Equity | 283.6 (3.0) | 301.7 (3.2) | 221.1 (3.1) | |
| High Conflict Zones | 461.2 (4.8) | 493.0 (5.2) | 356.2 (4.9) | |
| Non-Communicable Diseases | 188.2 (2.0) | 153.0 (1.6) | 123.8 (1.7) | |
| Communicable Diseases | 215.7 (2.3) | 226.4 (2.4) | 164.7 (2.3) | |
| Governance | Legal System | 609.7 (6.4) | 598.6 (6.3) | 481.5 (6.6) |
| Corruption | 767.0 (8.1) | 718.6 (7.6) | 575.5 (7.9) | |
| Community | Access to Drinking Water | 128.0 (1.3) | 152.5 (1.6) | 94.3 (1.3) |
| Access to Sanitation | 224.2 (2.4) | 240.6 (2.5) | 170.8 (2.3) | |
| Children out of School | 270.3 (2.8) | 256.3 (2.7) | 214.8 (2.9) | |
| Access to Hospital Beds | 278.3 (2.9) | 296.1 (3.1) | 216.0 (3.0) | |
| Smallholder v Commercial Farms | 502.8 (5.3) | 487.5 (5.1) | 382.6 (5.3) | |
| Total | 9513.0 | 9483.1 | 7281.9 |
Disclaimer/Publisher’s Note: The statements, opinions and data contained in all publications are solely those of the individual author(s) and contributor(s) and not of MDPI and/or the editor(s). MDPI and/or the editor(s) disclaim responsibility for any injury to people or property resulting from any ideas, methods, instructions or products referred to in the content. |
© 2023 by the authors. Licensee MDPI, Basel, Switzerland. This article is an open access article distributed under the terms and conditions of the Creative Commons Attribution (CC BY) license (http://creativecommons.org/licenses/by/4.0/).
Copyright: This open access article is published under a Creative Commons CC BY 4.0 license, which permit the free download, distribution, and reuse, provided that the author and preprint are cited in any reuse.


