
Submitted:
27 November 2024
Posted:
28 November 2024
You are already at the latest version
Abstract
This study investigates the potential risks and mechanisms of action of rejuvenation therapies, focusing on metformin and partial reprogramming, using an integrative approach that combines gene expression, protein interaction networks, and toxicological annotations.
Keywords:
Omics
; Toxicology
Introduction
Increasingly, known drugs, supplements and other interventions are being studied as rejuvenation therapies. While most of these interventions are known to be sufficiently safe when used for their original purpose, when developing new rejuvenation therapies that may require regular and long-term use, it is important to consider what side effects may be untenable in healthy people, or what side effects may become apparent with use in the larger population. Here, we use an integrative approach combining gene expression, gene/protein interaction/regulation and annotations drawn from toxicology to identify potential risks and mechanisms of action in a widely used drug (metformin), and when developing a high-risk therapy (partial/transient reprogramming).
Glossary:
AOP - Adverse Outcome Pathway
KE - Key Event
MIE - Molecular Initiation Event
DEG - Differentially Expressed Gene
Methods
Datasets
Data were downloaded from the Gene Expression Omnibus.
Metformin: GSE137317
Human whole blood RNA-seq comparing 24 healthy people at a baseline before starting metformin, and after 7 days of taking metformin [1].
Partial Reprogramming: GSE190986
Mouse (C57BL/B6) tissues (spleen, liver, skin, kidney, lung and muscle) RNA-seq comparing 5 mice after 7 months of induced OSKM reprogramming to control mice [2]. For this analysis tissues were analysed separately.
KE Enrichment and Network Analysis
Differential expression analysis was carried out on each dataset using the edgeR R package. Benjamini-Hochberg adjusted p-values of less than 0.05 were treated as significant. Differentially expressed gene lists were then tested for enrichment of genes associated with Key Events (KEs) of Adverse Outcome Pathways (AOPs) using the annotations provided in [3] and the clusterProfiler R package. Again, KEs with a Benjamini-Hochberg adjusted p-value of less than 0.05 were treated as significantly enriched. Significant gene lists were then filtered for only those genes that were members of the gene sets of these KEs, and then STRING interactions between them were identified based on the complete STRING network (i.e. including functional interactions as well as physical) using the STRING plugin of Cytoscape. STRING interactions were only included if they were based on experimental evidence with a confidence score of at least 0.9. Linkscores in accordance with ExprEssence [4] were then calculated for the resultant STRING subnetwork and the subnetworks were thus visualised in accordance with the ExprEssence defaults. STRING subnetworks with more than 50 edges were condensed by keeping only the top-50 edges in the network, ranked by linkscore. Tissues/treatments were selected for further investigation and visualization if their subnetwork was enriched for at least one KE that was also an MIE. Thus the metformin data, in addition to the spleen, liver and skin partial reprogramming data, were selected for further analysis.
Results
Differential Expression
The number of differentially expressed genes (DEGs) for each dataset, along with the number of enriched KE gene sets in the concatenated list of both over and underexpressed DEGs for each dataset can be seen in Table 1. Full DEG results can be found in Supplemental Tables S1–S7. Full AOP enrichment results can be found in Supplemental Tables S8–S14.
Network Analysis
STRING protein-protein interaction networks and ExprEssence linkscores were visualised for each dataset/tissue (Figures 1, 3, 4 and 5).
Metformin
Metformin treatment resulted in one small subnetwork of 4 genes, HBA1, HBA2, HBB and HBD (Figure 1), representing a downregulation of haemoglobin expression. Only 3 KEs met the threshold for significance in the metformin data, with KEs for AOPs involved in adverse neurodevelopment in mammals (“Thyroperoxidase, Inhibition”, see AOP:42) and various anaemia AOPs, one of which is visualized in Figure 2.
Partial Reprogramming
Spleen. The spleen results gave a large,
activated network including multiple cyclin dependent kinases and DNA repair
genes (Figure 3). In total, 30 enriched
KEs were identified (Table S9), primarily
concerned with DNA damage and associated with a wide range of cancer AOPs.
Liver. Partial reprogramming in the liver resulted in two gene pairs, ETFB-ACADM and COL4A1-COL4A2 (Figure 4). The first of these, involved in mitochondrial fatty acid oxidation, was activated by partial reprogramming while the latter, involved in the formation of type 4 collagen, was inhibited (evidenced by a small but significant increase/decrease of gene expression levels). Overall, 37 significantly enriched KEs were identified in the liver network genes (Table S10). These formed two distinct groups, one, activated, concerned with fatty acid synthesis and accumulation, and the other, inhibited, concerned with collagen synthesis and accumulation.
Skin. Finally, the results in the skin gave two small subnetworks joined by GNG11-GNB3 (Figure 5), one downregulated subnetwork involved in blood coagulation processes and inflammation (F2, FGB, FGG, SERPINC1) and one upregulated subnetwork involved in mitochondrial fatty acid oxidation (ETFA, ETFB and ACADM). A total of 57 significantly enriched KEs were identified in the skin (Table S11), splitting into two main groups similarly to the results in the liver: one activated group involved in fatty acid synthesis and accumulation, and one inhibited group involved in inflammation.
Discussion
Metformin
Although metformin is a safe intervention in most people, there can still be serious side effects in some cases. This analysis identified anaemia as a potential side effect, reflected by the underexpression of various haemoglobin genes. In particular, HBA1, HBB and AHSP were identified as important in this process, as not only are they downregulated and interacting in the STRING network, but they are also members of KE gene sets pertaining to anaemia (Figure 1). All three genes are annotated to the KEs “Formation, Formation hemoglobin adducts”, and “N/A, Methemoglobinemia, decreased hemoglobin, hematocrit, red blood cell number”, which are components of the AOP “Oxidation of iron in hemoglobin leading to hematotoxicity”, the full pathway of which can be seen in Figure 2. Although metformin has been associated with vitamin B12 deficiency, a potential cause of anaemia [5], it has also been associated with an early risk of anaemia in diabetic patients in a likely B12-deficiency-independent manner, based on the observed timescales [6]. The remaining highlighted KE, “Thyroperoxidase, inhibition”, is a MIE in multiple AOPs. Notably, impaired iron metabolism is associated with reduced thyroid function and thyroid hormone production [7,8].
Partial Reprogramming
An intervention as holistic as partial reprogramming (in that, it induces widespread epigenetic and thus transcriptomics changes), could be expected to affect different organs, tissues and cell types differently, potentially offering net benefits in one place and net toxicity in another. The dataset analysed here included data from liver, spleen, skin, kidney, lung and muscle, after whole body partial reprogramming, of which connections to AOPs were identified in spleen, liver and skin.
Spleen. In spleen, a large number of DEGs were identified, resulting in a large number of STRING interactions between them and high enrichment for many DNA repair and cell cycle related KEs (Figure 3). The high number of DEGs in the spleen could be due to increased cell proliferation as a response to the immune challenge caused by the intervention, reflected in the blood cells in the spleen. Of the specific genes in the subnetworks, they indicate higher proliferation by activation of the cell cycle under the stress caused by the reprogramming factors [9], and/or they respond to the associated damage. Indeed, spleen sees an increase in extramedullary haematopoiesis in response to partial reprogramming [10] which could explain these results in part.
Liver. In liver, two potentially interesting STRING subnetworks were identified (Figure 4). These subnetworks are both composed of two genes, one is an overexpression of ACADM and ETFB, representing fatty acid oxidation processes while the other is an underexpression of COL4A1 and COL4A2, representing collagen related processes. These subnetworks may indicate protective/rejuvenating effects of partial reprogramming in the liver, as ACADM overexpression may be protective against hepatocellular carcinoma due to its suppression of liver lipid accumulation [11], while overexpression of COL4A2 has been shown to promote proliferation, migration and epithelial-mesenchymal transition in liver cancer [12], so that the underexpression we observe should be beneficial as well.
Skin. Finally, in skin, four subnetworks were identified, one is a downregulated network of various inflammatory and ”coagulatory” genes (Figure 5 on the left), one an upregulated network of fatty acid oxidation genes as found in liver (Figure 5 at the top right), then two small subnetworks of only two genes each, GNG11 and GNB3 for one and CRYAA and CRYAB for the other. Interestingly, GNG11 and GNB3 connect the inflammatory gene subnetwork to the fatty acid oxidation network, as both genes are involved in platelet aggregation (linking to F2, FGB and FGG) and PPARG activation (linking to ACADM). Additionally, though not necessarily via platelet activation as suggested here, fatty acids are involved in several inflammation signalling pathways [13]. The downregulation of SERPINC1, F2, FGB and FGG suggests that partial reprogramming can help alleviate inflammation and fibrosis in the skin. Indeed, this agrees with a study in mice that showed that in vivo partial reprogramming of skin can alleviate scar tissue formation after wounding [14].
Interestingly, while overexpression of ACADM in liver seems protective of cancer, the overexpression of ACADM in skin may be associated with increased metastasis in melanoma [15]. Compounding this, the crystallins CRYAA and CRYAB may play a role in cancer, in addition to their more usually studied role in cataract development [16]. In particular, CRYAB (here overexpressed) frequently has an increased copy number and expression in many cancers, including uveal melanoma [17]. It is difficult to disentangle this effect however, as while CRYAB expression is a risk factor in many cancers, it may also be protective in others, including skin cutaneous melanoma [18]. Ultimately, these results show that the various gene expression changes induced by partial reprogramming, and sometimes common across tissues, may be protective in some tissues but carcinogenic in others, and careful study of the tissue specific effects of partial reprogramming is thus important.
Supplementary Materials
The following supporting information can be downloaded at the website of this paper posted on Preprints.org. Figure S1: The unfiltered ExprEssence network for the Browder, 2022 partial reprogramming in spleen dataset. Tables S1-14: Full DEG and AOP Enrichment results for each dataset analysed.
Conflicts of Interest
DP, RAA and GF receive funding from the German Federal Ministry for Economic Affairs' EXIST program, which supports the development of innovative startups originating from academic research.
References
- Ustinova, M.; Silamikelis, I.; Kalnina, I.; Ansone, L.; Rovite, V.; Elbere, I.; Radovica-Spalvina, I.; Fridmanis, D.; Aladyeva, J.; Konrade, I.; et al. Metformin strongly affects transcriptome of peripheral blood cells in healthy individuals. PLOS ONE 2019, 14, e0224835. [Google Scholar] [CrossRef] [PubMed]
- Browder, K.C.; Reddy, P.; Yamamoto, M.; Haghani, A.; Guillen, I.G.; Sahu, S.; Wang, C.; Luque, Y.; Prieto, J.; Shi, L.; et al. In vivo partial reprogramming alters age-associated molecular changes during physiological aging in mice. Nat. Aging 2022, 2, 243–253. [Google Scholar] [CrossRef] [PubMed]
- Saarimäki, L.A.; Fratello, M.; Pavel, A.; Korpilähde, S.; Leppänen, J.; Serra, A.; Greco, D. A curated gene and biological system annotation of adverse outcome pathways related to human health. Sci. Data 2023, 10, 1–8. [Google Scholar] [CrossRef] [PubMed]
- Warsow, G.; Greber, B.; Falk, S.S.; Harder, C.; Siatkowski, M.; Schordan, S.; Som, A.; Endlich, N.; Schöler, H.; Repsilber, D.; et al. ExprEssence - Revealing the essence of differential experimental data in the context of an interaction/regulation net-work. BMC Syst. Biol. 2010, 4, 164–164. [Google Scholar] [CrossRef] [PubMed]
- Liu, Q.; Li, S.; Quan, H.; Li, J. Vitamin B12 Status in Metformin Treated Patients: Systematic Review. PLOS ONE 2014, 9, e100379. [Google Scholar] [CrossRef] [PubMed]
- Donnelly, L.A.; Dennis, J.M.; Coleman, R.L.; Sattar, N.; Hattersley, A.T.; Holman, R.R.; Pearson, E.R. Risk of Anemia With Metformin Use in Type 2 Diabetes: A MASTERMIND Study. Diabetes Care 2020, 43, 2493–2499. [Google Scholar] [CrossRef] [PubMed]
- Garofalo, V.; Condorelli, R.A.; Cannarella, R.; Aversa, A.; Calogero, A.E.; La Vignera, S. Relationship between Iron Deficiency and Thyroid Function: A Systematic Review and Meta-Analysis. Nutrients 2023, 15, 4790. [Google Scholar] [CrossRef] [PubMed]
- Hess, S.Y.; Zimmermann, M.B.; Hurrell, R.F.; Arnold, M.; Langhans, W. Iron Deficiency Anemia Reduces Thyroid Peroxidase Activity in Rats. J. Nutr. 2002, 132, 1951–1955. [Google Scholar] [CrossRef] [PubMed]
- Leaman, S.; Marichal, N.; Berninger, B. Reprogramming cellular identity in vivo. Development 2022, 149. [Google Scholar] [CrossRef] [PubMed]
- Chondronasiou, D.; Gill, D.; Mosteiro, L.; Urdinguio, R.G.; Berenguer-Llergo, A.; Aguilera, M.; Durand, S.; Aprahamian, F.; Nirmalathasan, N.; Abad, M.; et al. Multi-omic rejuvenation of naturally aged tissues by a single cycle of transient reprogramming. Aging Cell 2022, 21, e13578. [Google Scholar] [CrossRef] [PubMed]
- Ma, A.P.Y. , et al., Suppression of ACADM-Mediated Fatty Acid Oxidation Promotes Hepatocellular Carcinoma via Aberrant CAV1/SREBP1 Signaling. Cancer Res 2021, 81, 3679–3692. [Google Scholar] [CrossRef] [PubMed]
- Zhang, H., Y. Wang, and H. Ding, COL4A1, negatively regulated by XPD and miR-29a-3p, promotes cell proliferation, migration, invasion and epithelial-mesenchymal transition in liver cancer cells. Clin Transl Oncol 2021, 23, 2078–2089. [Google Scholar] [CrossRef] [PubMed]
- Calder, P.C. Fatty acids and inflammation: The cutting edge between food and pharma. Eur. J. Pharmacol. 2011, 668 (Suppl. S1), S50–S58. [Google Scholar] [CrossRef] [PubMed]
- Doeser, M.C.; Schöler, H.R.; Wu, G. Reduction of Fibrosis and Scar Formation by Partial Reprogramming In Vivo. Stem Cells 2018, 36, 1216–1225. [Google Scholar] [CrossRef] [PubMed]
- Alonso, S.R. , et al., A high-throughput study in melanoma identifies epithelial-mesenchymal transition as a major determinant of metastasis. Cancer Res 2007, 67, 3450–3460. [Google Scholar] [CrossRef] [PubMed]
- Lulli, M.; Nencioni, D.; Papucci, L.; Schiavone, N. Zeta-crystallin: a moonlighting player in cancer. Cell. Mol. Life Sci. 2020, 77, 965–976. [Google Scholar] [CrossRef] [PubMed]
- Rashidieh, B.; Bain, A.L.; Tria, S.M.; Sharma, S.; Stewart, C.A.; Simmons, J.L.; Apaja, P.M.; Duijf, P.H.G.; Finnie, J.; Khanna, K.K. Alpha-B-Crystallin overexpression is sufficient to promote tumorigenesis and metastasis in mice. Exp. Hematol. Oncol. 2023, 12, 1–19. [Google Scholar] [CrossRef] [PubMed]
- Cheng, L. , et al., The role of CRYAB in tumor prognosis and immune infiltration: A Pan-cancer analysis. Front Surg 2022, 9, 1117307. [Google Scholar] [CrossRef] [PubMed]
Figure 1.
ExprEssence subnetwork indicating metformin induced downregulation in genes associated with AOP KEs (see Table S8). Orphaned genes (i.e. genes that did not share a STRING interaction with any other genes in the subnetwork(s)) were removed, and membership of genes in KE gene sets was visualised by linking them with a dashed line to the appropriate KE (only KEs that are linked to two or more genes are shown). Each gene is represented as a heatmap, with the left side indicating control expression, and the right side indicating treated expression. These heatmaps are coloured to indicate the level of expression of a gene relative to the total distribution of expression of all genes, so strong red colouration indicates highly expressed genes, strong green colouration indicates lowly expressed genes, and white indicates genes with middling expression. The thickness and intensity of the edges indicates the “linkscore” between the two genes, calculated by summing the differences in expression between the two conditions for both connected genes; red edges indicate strongly positive linkscores (activation by the treatment), green edges indicate strongly negative linkscores (inhibition by the treatment) with the colour tending toward white as a linkscore approaches 0. In cases where expression between treated and control are similar relative to the overall distribution, the node may appear a single colour. In these cases, a “+” sign indicates the gene was activated by the intervention and a “-” sign indicates a gene was inhibited by the intervention.
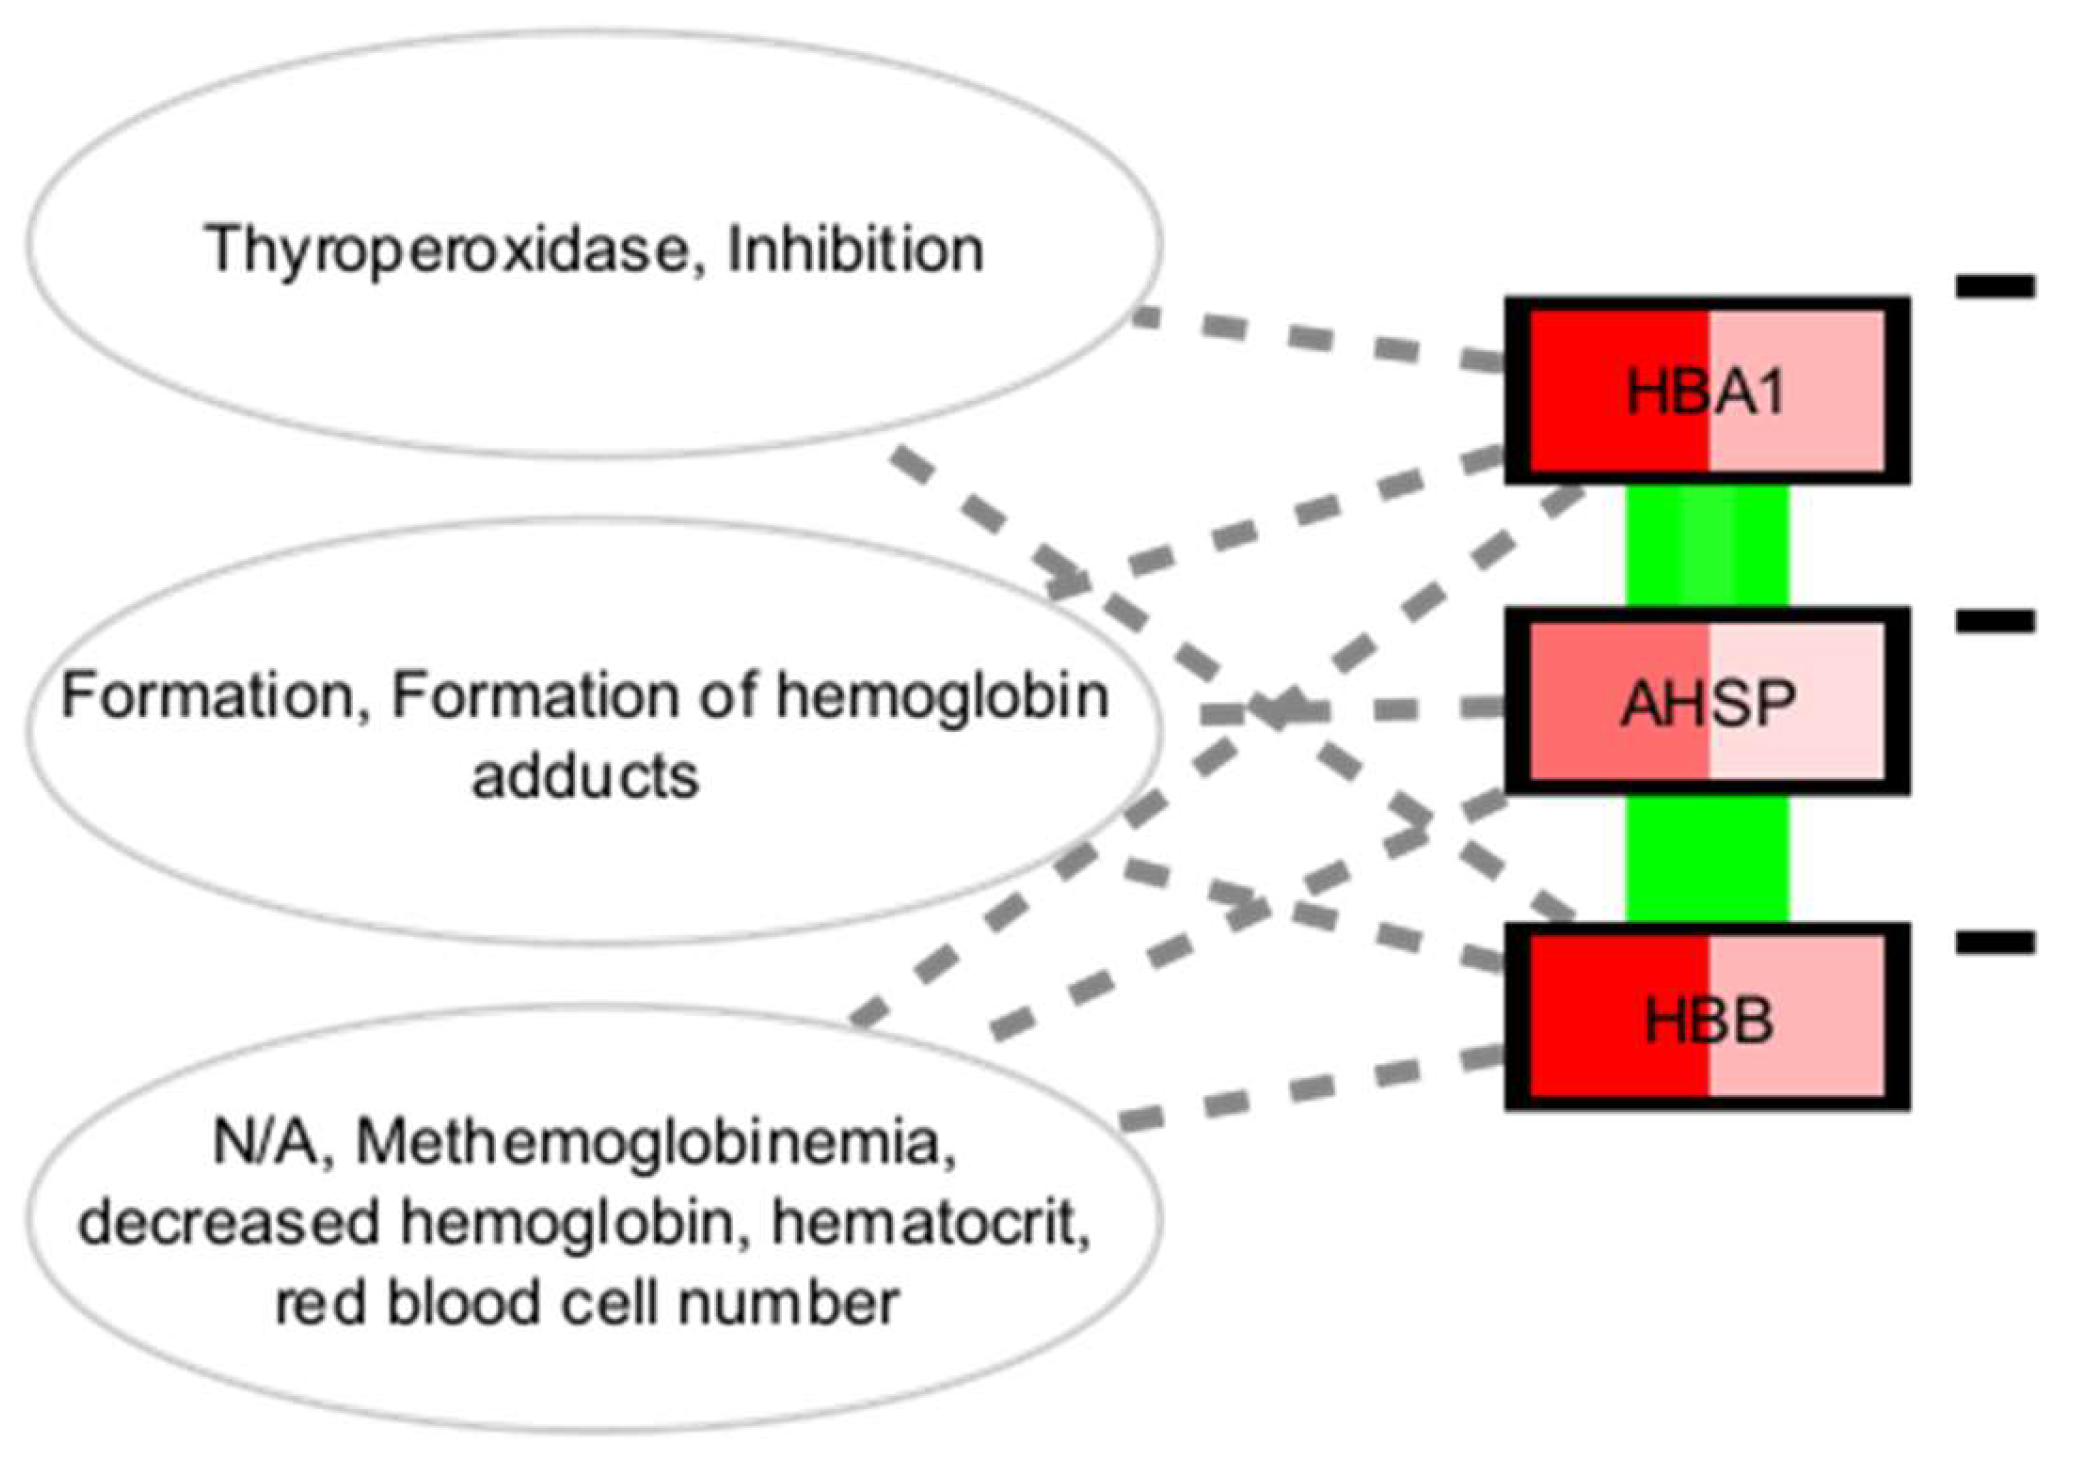
Figure 2.
“Oxidation of iron in hemoglobin leading to hematotoxicity” AOP including two of the KEs identified as potential causes of metformin side effects (indicated with a *). Figure taken from https://aopwiki.org/aops/31. As with all AOPs, and already noted in the abstract published for this AOP, the MIEs listed here are not necessarily toxicant specific.
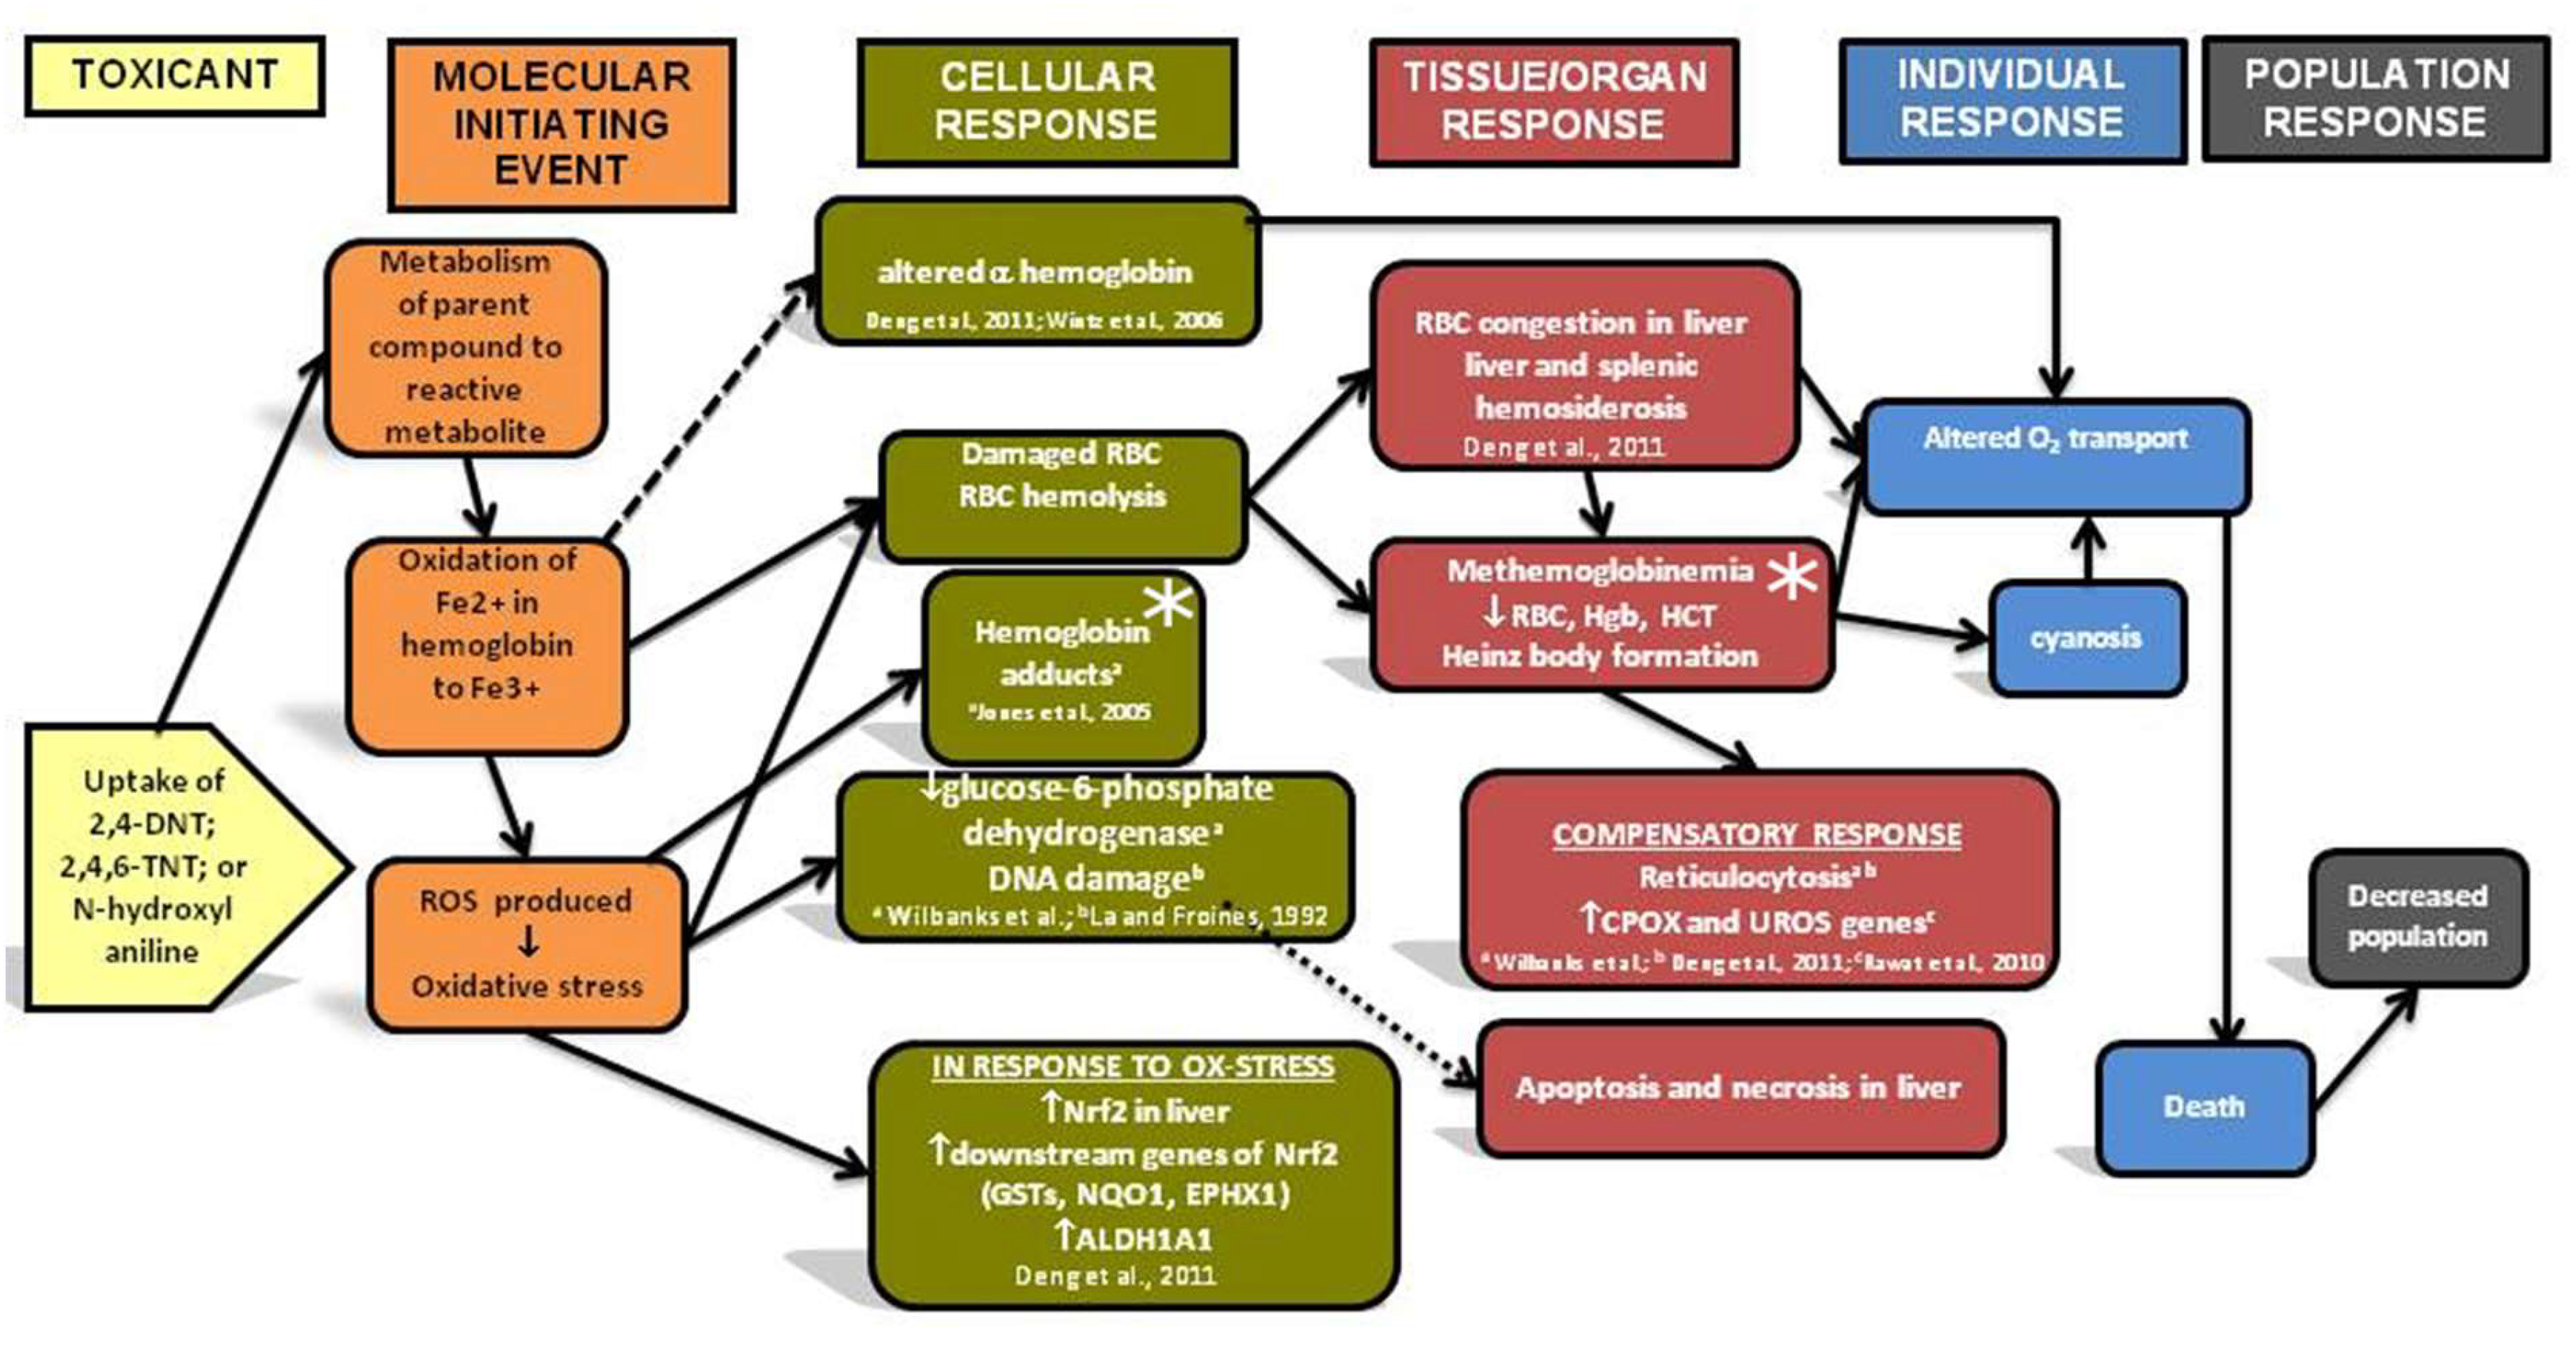
Figure 3.
ExprEssence subnetwork indicating partial reprogramming induced modulation in genes in the spleen associated with the initiation of various AOPs (see Table S9). For explanation of the colours and annotations, see Figure 1. This network was simplified by thresholding to only the top 20 linkscores before removing KEs that then only connected to one gene, and finally removing genes that were then not connected to a KE. The full unfiltered network is available in Figure S1.
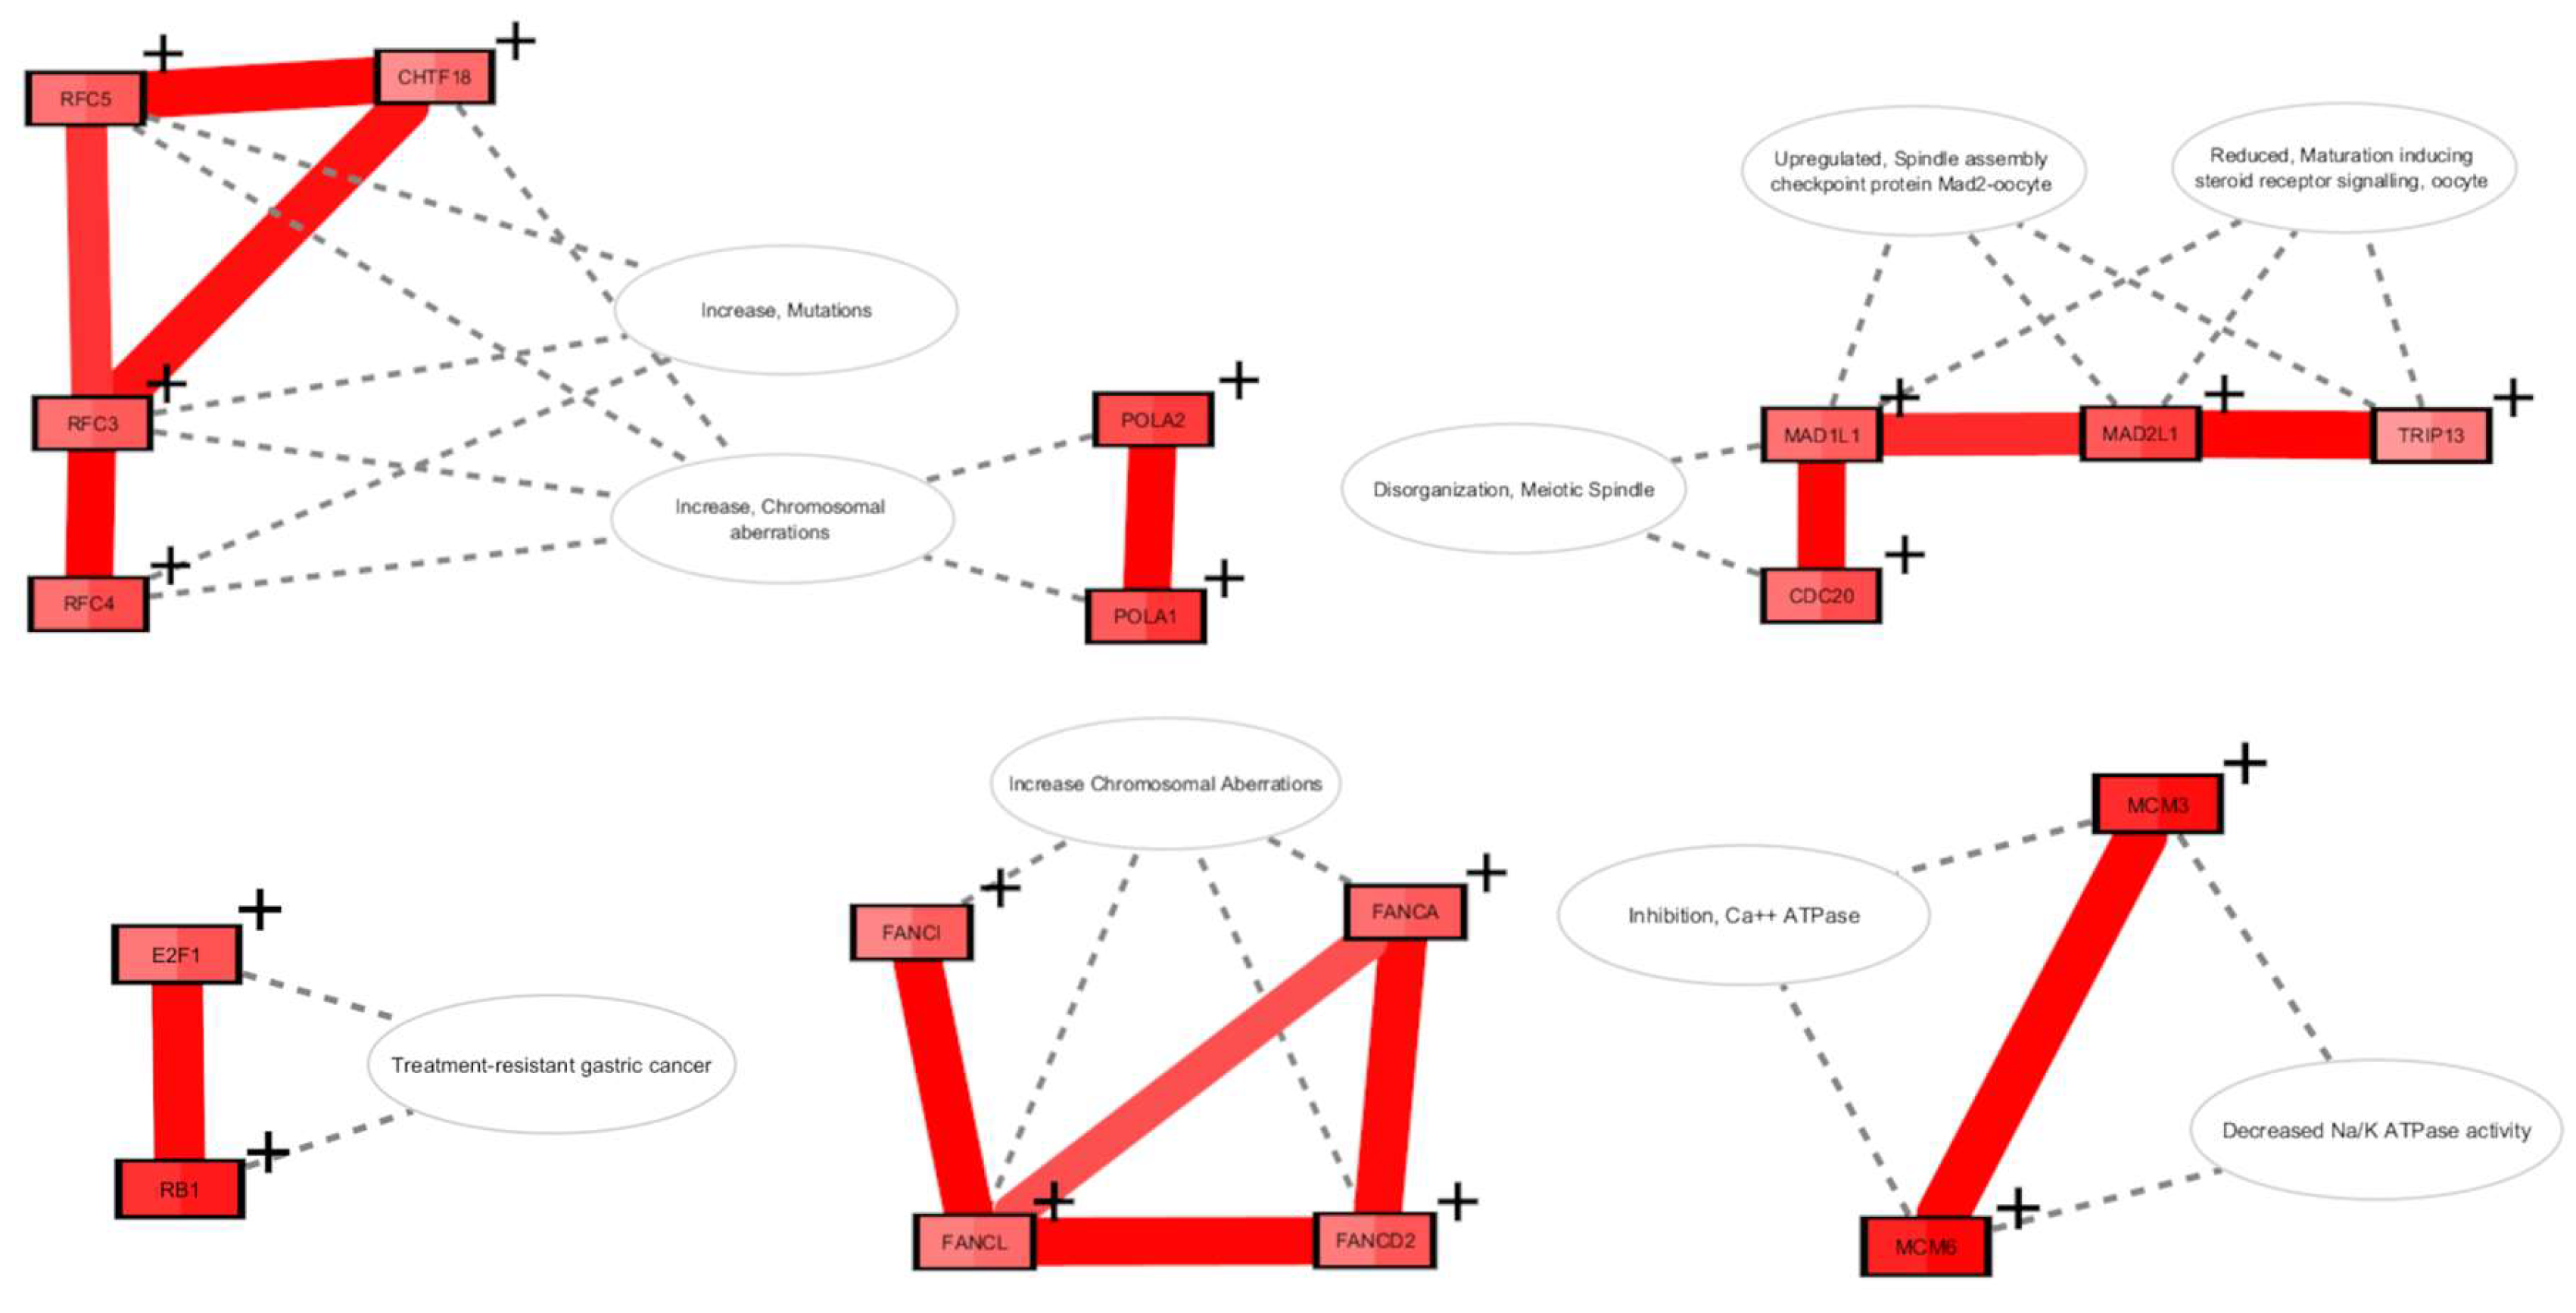
Figure 4.
ExprEssence subnetwork indicating partial reprogramming induced modulation in genes in the liver associated with the initiation of various AOPs (see Table S10). For explanation of the colours and annotations, see Figure 1.
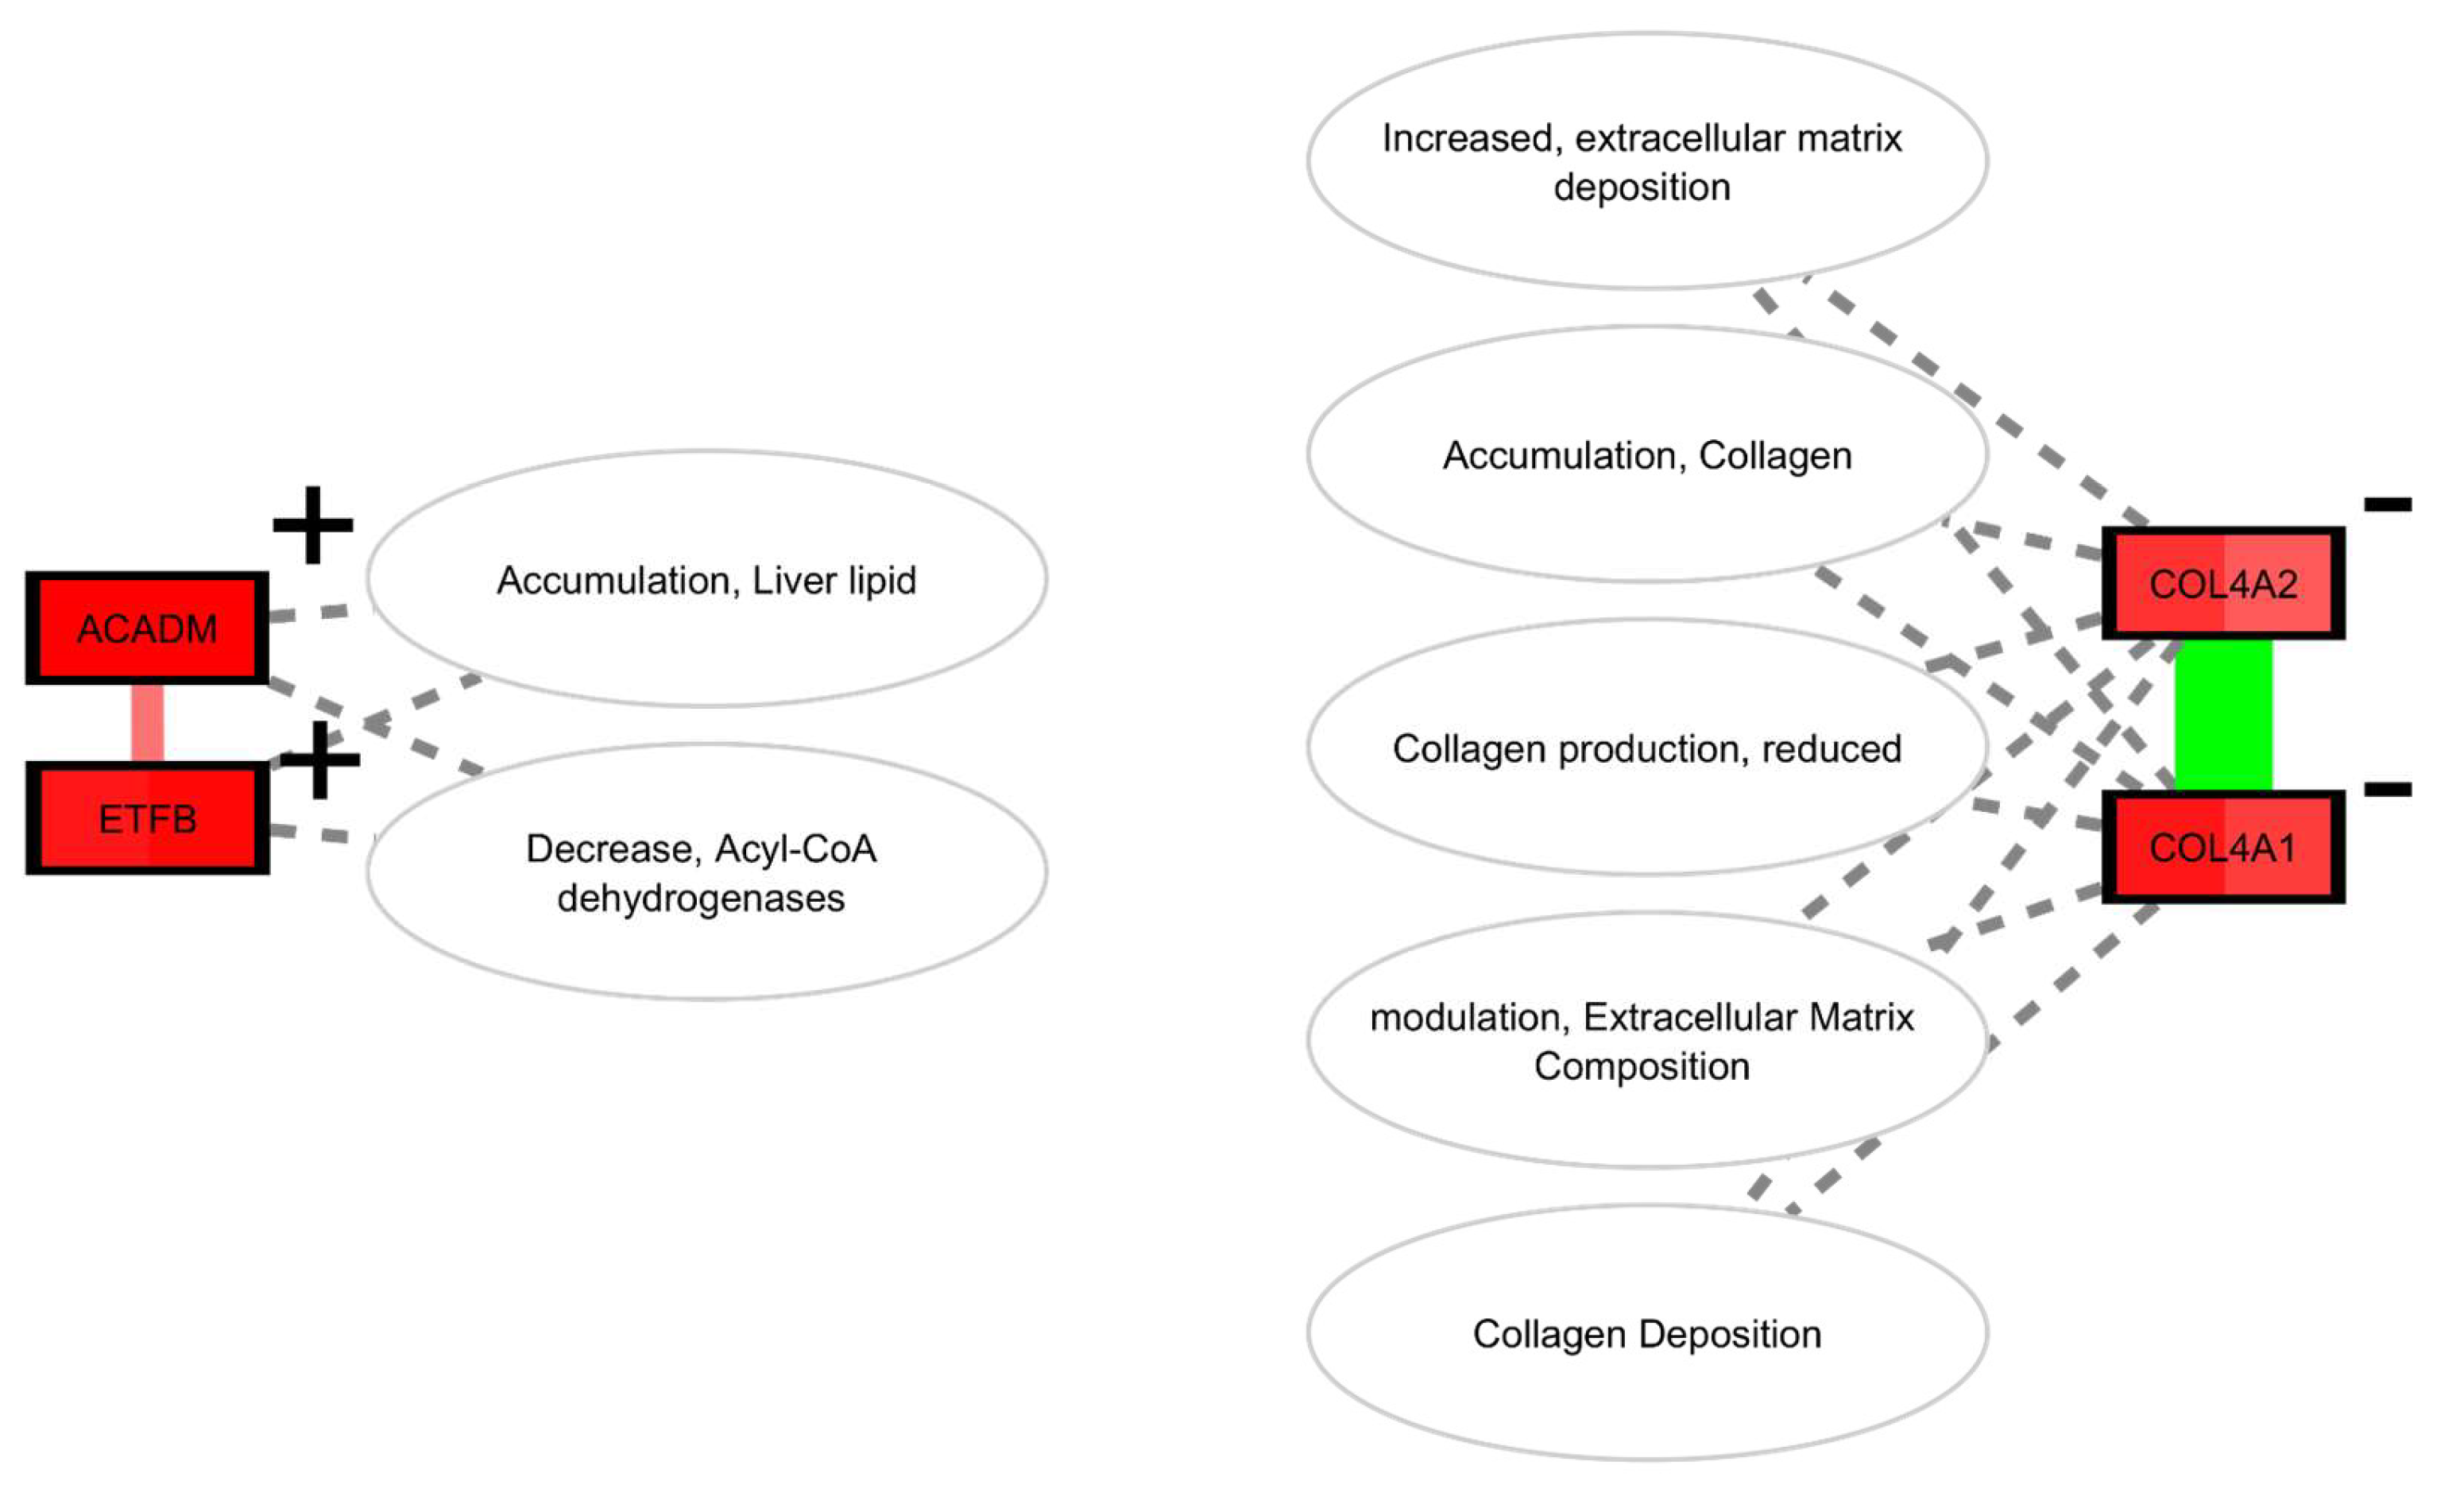
Figure 5.
ExprEssence subnetwork indicating a region of partial reprogramming induced modulation in genes in the skin associated with the activation/inhibition of various AOPs (see Table S11). For explanation of the colours and annotations, see Figure 1.
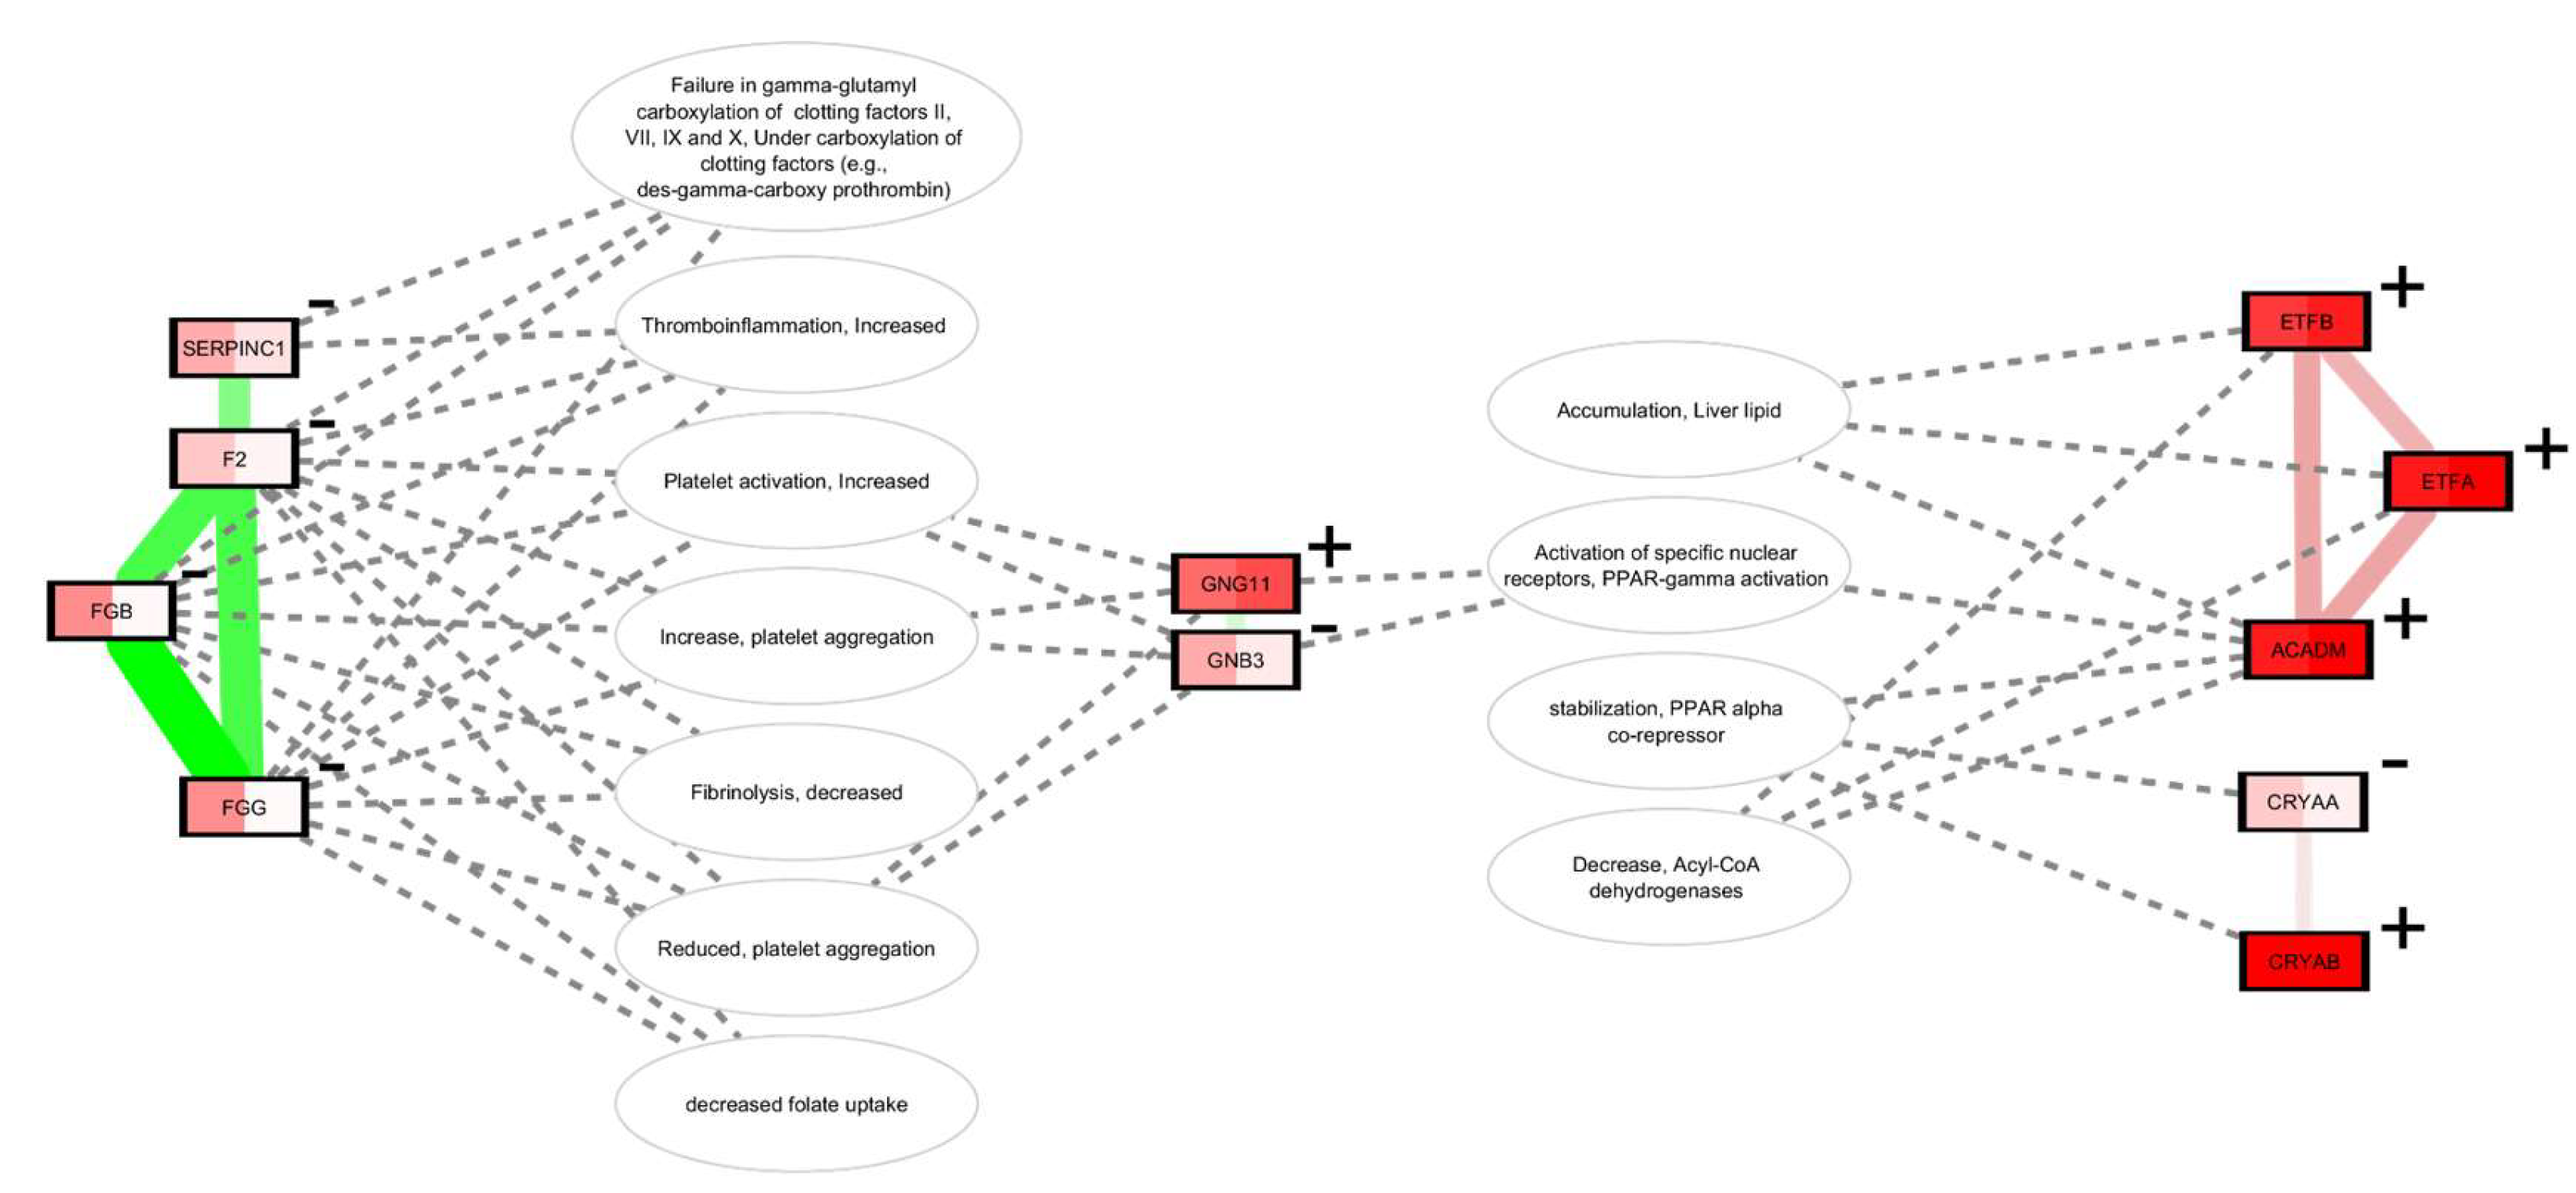

Table 1.
Numbers of DEGs by treatment, direction, and tissue, and the number of enriched KEs in the concatenated list of over and underexpressed DEGs.
Table 1.
Numbers of DEGs by treatment, direction, and tissue, and the number of enriched KEs in the concatenated list of over and underexpressed DEGs.
| Tissue | Treatment | Overexpressed DEGs | Underexpressed DEGs | Enriched KEs |
|---|---|---|---|---|
| Whole Blood | Metformin | 12 | 90 | 3 |
| Spleen | Partial Reprogramming | 892 | 251 | 30 |
| Liver | Partial Reprogramming | 330 | 277 | 37 |
| Skin | Partial Reprogramming | 129 | 122 | 59 |
| Kidney | Partial Reprogramming | 101 | 148 | 7 |
| Lung | Partial Reprogramming | 48 | 57 | - |
| Muscle | Partial Reprogramming | 76 | 16 | - |
Disclaimer/Publisher’s Note: The statements, opinions and data contained in all publications are solely those of the individual author(s) and contributor(s) and not of MDPI and/or the editor(s). MDPI and/or the editor(s) disclaim responsibility for any injury to people or property resulting from any ideas, methods, instructions or products referred to in the content. |
© 2024 by the authors. Licensee MDPI, Basel, Switzerland. This article is an open access article distributed under the terms and conditions of the Creative Commons Attribution (CC BY) license (http://creativecommons.org/licenses/by/4.0/).
Copyright: This open access article is published under a Creative Commons CC BY 4.0 license, which permit the free download, distribution, and reuse, provided that the author and preprint are cited in any reuse.


