
Submitted:
27 November 2024
Posted:
28 November 2024
You are already at the latest version
Abstract
The water trapping after drilling, completion, and reconditioning operations in a low-permeability reservoir, critically impacts hydrocarbon production by creating capillary barriers for oil flow to the wellbore. Water flow and its influence on oil threshold pressure were evaluated with constant pressure injection at a given reservoir pressure gradient (1173 hPa) will be generated. Compounds encompassing alcohols and surfactants were strategically employed to mitigate the undesirable impact of heightened water saturation. These agents were chosen for their efficacy in diminishing water saturation, reducing capillary pressure through the modulation of interfacial tension, and inducing alterations in rock wettability via adsorption mechanisms. Each treatment performance was evaluated by The Amott method and stalagmometric analysis which revealed that ethylene glycol decreased interfacial tension by up to 38.5% at 60% concentration, Propanol to 29,08 mN/m at the same concentration, and butanol reversed the rock wettability to an oil-wet state, evidenced by a wettability index of -0.159. The highest oil displacement efficiency was demonstrated by butanol, achieving a 72.6% rate of water recovery at 20% concentration.
Keywords:
water recovery
; capillary pressure
; oil flooding
; interfacial tension
; wettability
; adsorption
; surfactants
; experimental analysis
; water block
; simulation model
I. Introduction
Capillary pressure and relative permeability vary by the pore surface properties including wettability, endpoint saturations, and contact angle, Marle (1981) points out that capillary pressure and relative permeability are complicated functions of the properties of the fluids and porous media [1]. Thus, the low interconnectivity of the pore throats in the reservoirs creates a strong capillary action that could be misplayed and challenging in several scenarios during hydrocarbon production. Capillary pressure, is defined as the difference in pressure across the interface between two immiscible fluids, say oil and water, in the reservoir [2]. One of the problems encountered in the oil and gas industry is the phenomenon of water block. Water can become trapped by capillary forces in the reservoir rock near the wellbore and significantly reduce the rate of oil or gas production. The general term for wells suffering from loss of productivity due to capillary trapped water is "water block." This paper aims to delve into this phenomenon, investigating the repercussions of interfacial forces between oil and water phases within the reservoir, and examining their interaction with the formation by tracking wettability and related microscopic phenomena.
II. Water Block Remediation
Theory
To solve the blockage of the invaded water around the wellbore in compact or low permeable reservoirs, this research targets the behavior of the interface properties in the fluid-rock system and its alterations due to the applied chemical treatment. To evidence the theory and evaluate the efficiency of the process, in the second part of this paper, it is essential to track the displacement of water by oil in the sample and measure the oil flooding performance as a final result.
Selected chemical treatment
The selection of the treatment was guided by these two properties, interfacial tension, and rock wettability, with ethylene glycol being chosen due to its favorable hydrophilic-lipophilic balance, which allows it to effectively stabilize emulsions and reduce interfacial tension between immiscible liquids, such as oil and water. This balance enhances its ability to interact with both polar and non-polar phases [3]. Butanol on the other side despite its effectiveness in reducing interfacial tension, has been selected due to its ability to solubilize within micelles enhances its effectiveness as a surfactant. Butanol partitions between the micellar phase and the bulk phase, allowing for improved interaction with surfactants and facilitating better overall performance in altering wettability compared to other alcohols that do not partition as effectively [4]. Propanol due to its ability to form hydrogen bonds with water molecules, which disrupts the hydrogen bonding network among water molecules and surfactants at the interface. This interaction enhances the fluidity of the surfactant at the interface, leading to more effective wetting properties and improved performance in altering wettability [5].
Experimental
1. Interfacial Tension Measurement
Manipulation
Aqueous solutions were prepared of water and the surfactants ethylene glycol, propanol, and butanol at different concentrations, 10%, 30%, and 60%. The stalagmometric method was utilized to assess the effectiveness of these aqueous solutions, and the interfacial tension (σ) was calculated using the Young-Laplace equation (1) based on the data gathered from the experiment.
2πr.σ=ρ. v. g ….

Table 1.
Results of Interfacial and Surface Tension Measurements.
| Concentration of surfactant | Superficial tension (mN/m) | Interfacial tension (mN/m) | |
|---|---|---|---|
| ethylene-glycol | 10% | 30,841 | 199,5 |
| 30% | 34,032 | 171,38 | |
| 60% | 27,65 | 133,69 | |
| Propanol | 10% | 29,75 | 40,01 |
| 30% | 21,11 | 29,08 | |
| 60% | 20,03 | 29,08 | |
| Butanol | 05% | 30,989 | 45,472 |
| 10% | 21,69 | 31,3 | |
| 20% | 20,86 | 30,31 | |
Results and Discussion: The results in Table 3 show that interfacial tension decreases as surfactant concentration increases. The ethylene glycol solution, in particular, showed a significant reduction in interfacial tension to a minimum of 133.69 mN/m at 60% concentration, Whereas the butanol at 20% concentration got 30.31 mN/m, the Propanol reached 29.08 at 60% of concentration.
2. Wettability Assessment
Manipulation: This experience requires 24h of interaction between 1g of cuttings and 40 ml of (Butanol 20%, Propanol 60%, EG 60%) each round.
The relation between superficial force and wettability
Superficial force is a component of overall wettability, representing the force acting parallel to the solid surface that maintains liquid contact. Wettability is a more intricate phenomenon, encapsulating the interaction between the liquid and the solid surface, determined by the balance between adhesive and cohesive forces [6,7]. In this part, changes in wettability were tracked by analyzing the surface forces of the sample independently. Subsequently, the final wettability value was determined conclusively. This method provided a detailed microscopic understanding of reservoir behavior.
Results and discussion: After 24h, the surface tension was reevaluated and compared to the initial measurement. The results presented in Table 2 indicate a notable increase in surface tension was observed between the pure state and post-adsorption in all three chemical solutions.
The adsorption Model
The adsorption of organic molecules provides information on the interaction between the adsorbed molecules themselves as well as their interaction with the surface of the electrode. Measurements were made to evaluate the type and process of adsorption of the prepared aqueous solutions (Propanol Butanol and EG) on the surface reservoir rock cuttings and find the model best suited to the results. To evaluate the adsorption process of the surfactants, we used the Langmuir adsorption isotherm [2] that was obtained according to the following:
C/ơ = (1/K) + C ……
Figure 1.
Langmuir adsorption isotherm of propanol, butanol, EG.
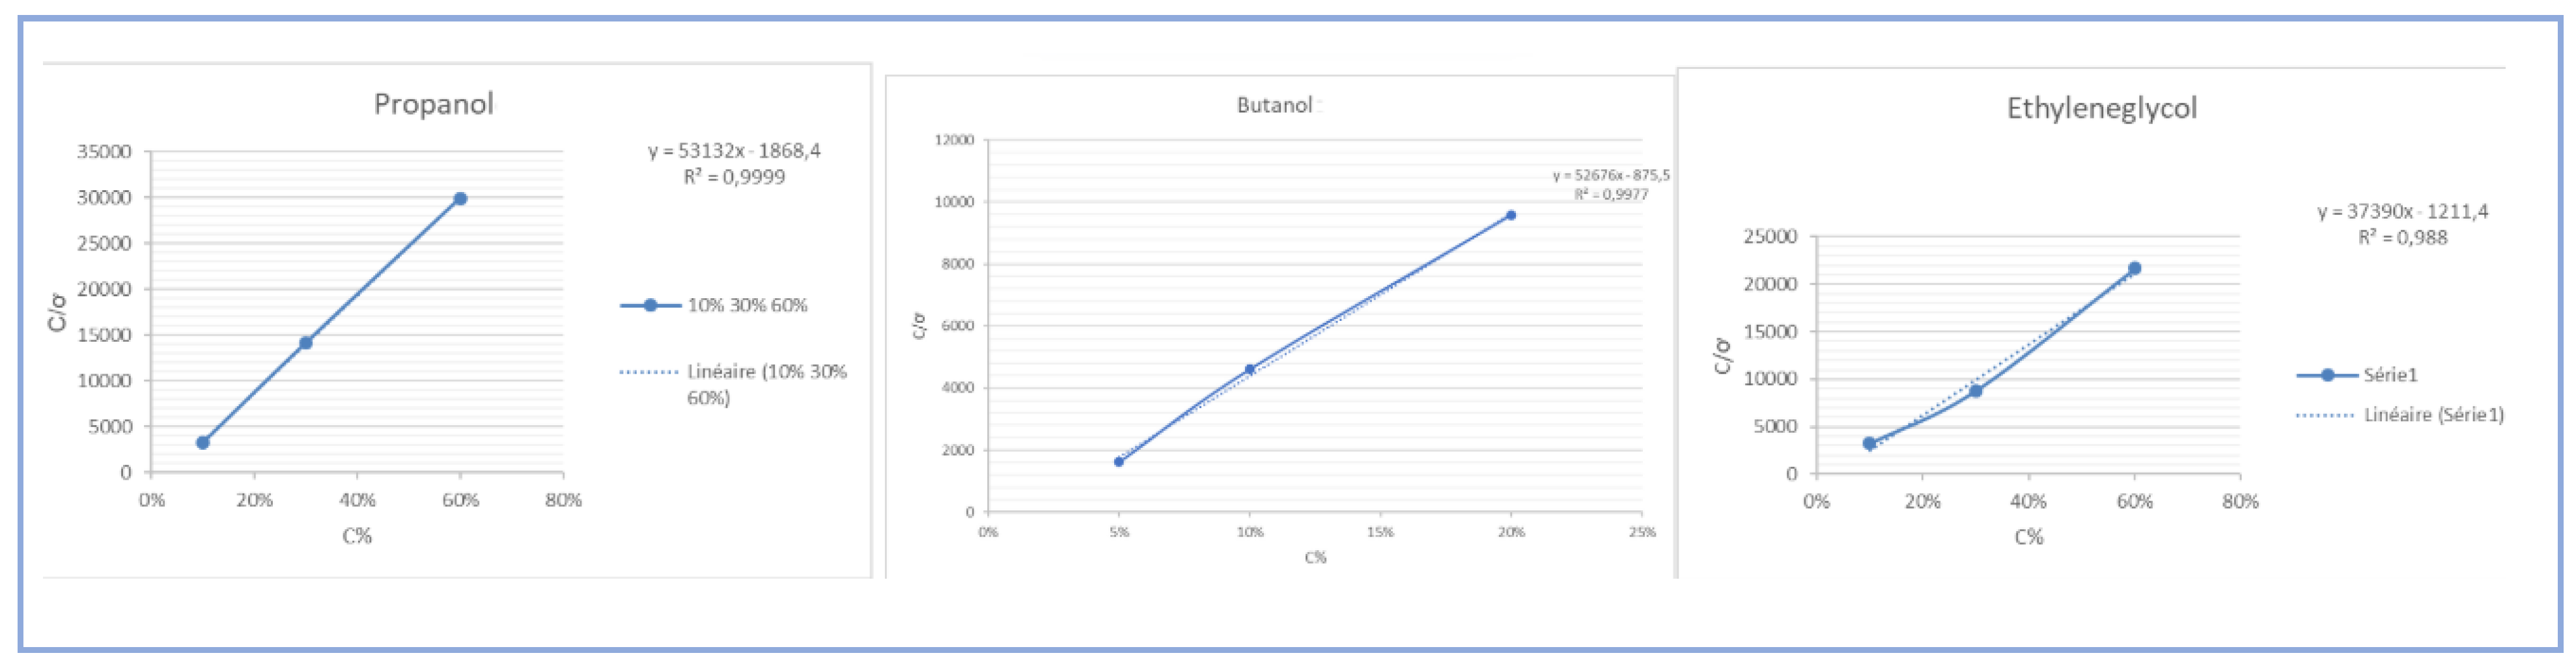
Results: The variation of the C/ơ ratio as a function of the surfactant concentration is linear with a regression coefficient R2 = 0.9977/ 0.9999 / 0.988 close to unity, which confirms the monolayer adsorption happening by the model of Langmuir
Wettability alteration
Wettability was assessed using the Amott-IFP method, with samples initially demonstrating water-wet characteristics. After the soaked experiment, wettability was measured again.
Results and discussion: From the results presented below, it can be observed that each cutting sample exhibited a reduction in water wettability. The adsorption capacity of each sample varied depending on the treatment used (ethylene glycol, propanol, or butanol). Among these, butanol demonstrated the ability to alter the rock's wettability from water-wet to oil-wet, yielding a negative wettability index of -0.159, confirming its effectiveness in altering rock-fluid interaction dynamics.
Table 3.
sample’s wettability results.
| The Surfactant | Propanol | EG | Butanol |
|---|---|---|---|
| Wettability index | 0.287 | 0.224 | -0.159 |
3. The Water Block Modeling Simulation
An experimental setup was designed and implemented to simulate the water block phenomenon and evaluate oil displacement efficiency.
Figure 2.
Schematic Representation of the Oil Flooding Experimental Model. (1 Oil tank, 2 Pump, 3 Pressure Gauge, 4 Sample, 5 output tank, 6 Chronometer, 7 Capillary Tube).
Figure 2.
Schematic Representation of the Oil Flooding Experimental Model. (1 Oil tank, 2 Pump, 3 Pressure Gauge, 4 Sample, 5 output tank, 6 Chronometer, 7 Capillary Tube).
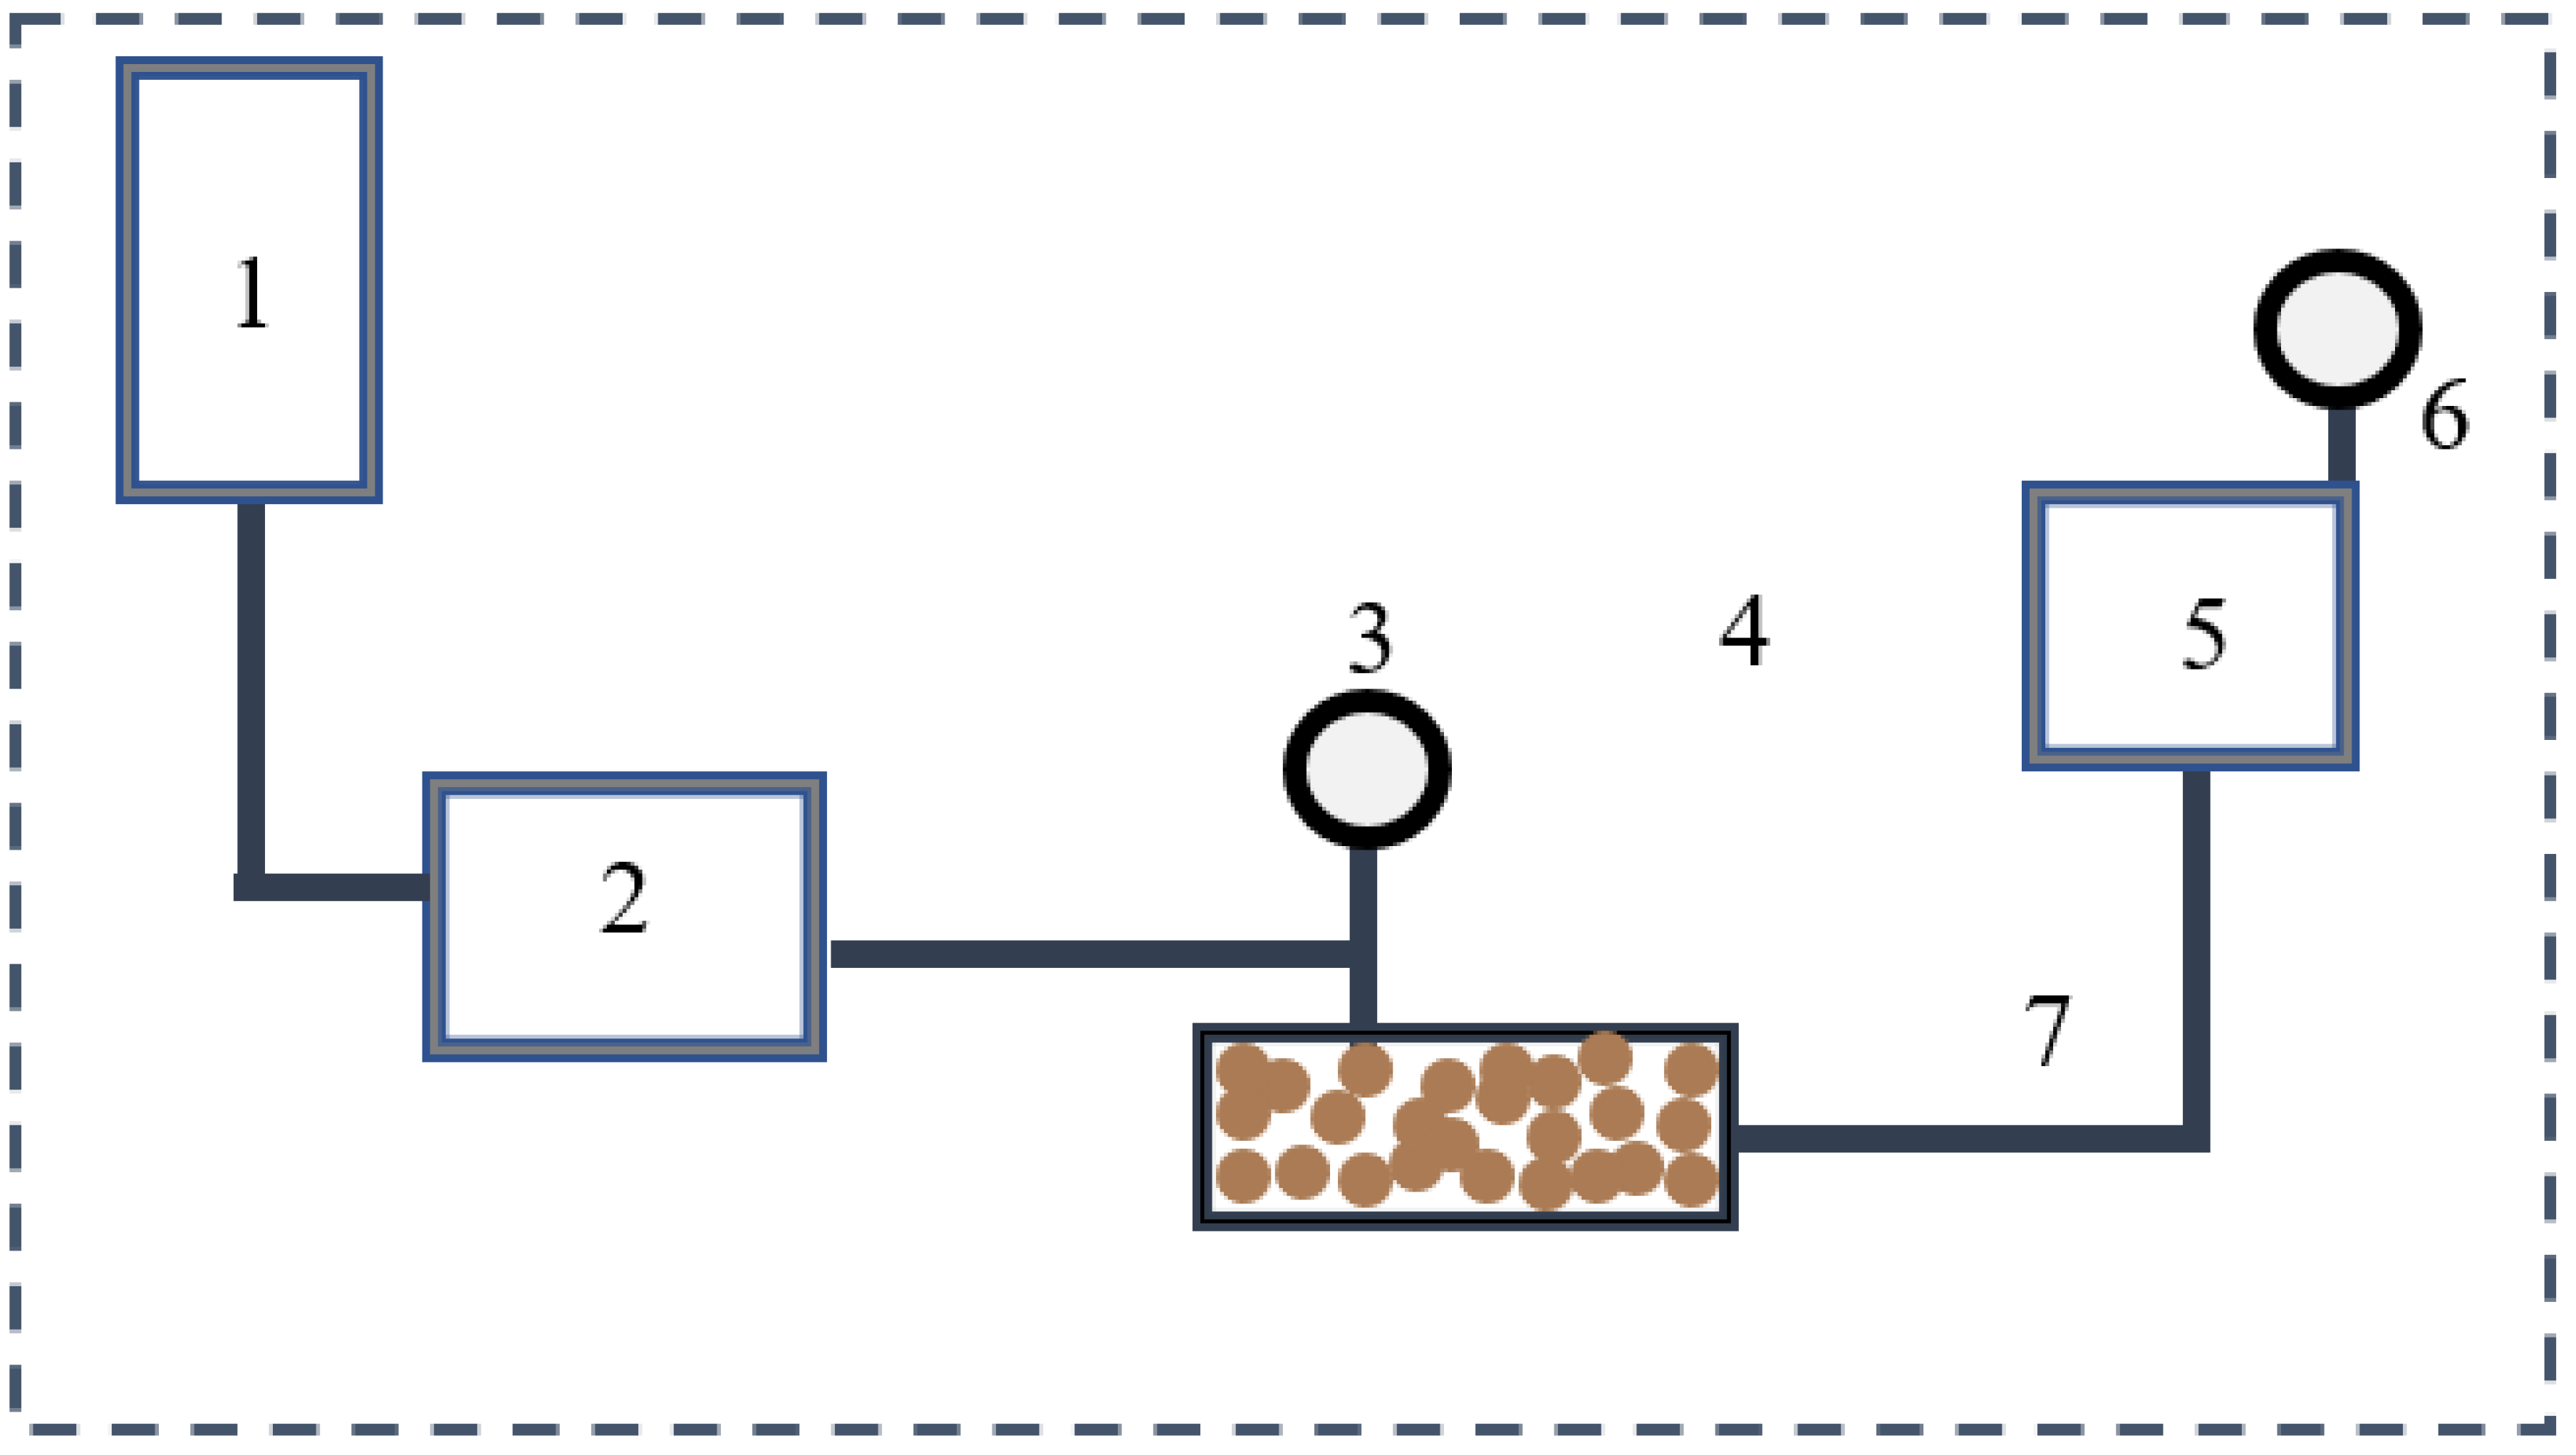
Materials:
- Oil Tank: Represents the oil drainage zone.
- Sample: Represents the invaded wellbore zone saturated with water or surfactant solutions.
- Capillary Tube: Simulates flow paths within the formation.
- Pressure Gauge: Monitors the pressure applied during the displacement process.
- Pump: Provides constant pressure to simulate reservoir-fluid behavior (1173 hPa).
- Chronometer: Measures the time required for water recovery processes.
- Distilled Water: For controlled experimental comparisons.
- Gasoil: Represents the reservoir oil.
- Ethylene Glycol (EG), Propanol, and Butanol.
- Output tank: Container for the collected water, and measurement for water recovery.
Sample preparation and characterization
Materials: Reservoir cuttings of the Barkine Oilfield, Algeria (depth 3734-3740 m), Sample container ( inside diameter 3,3 cm/ length 6cm), Gasoil (viscosity 0,3 cp/ density 0,85), Distilled water, Ethylene glycol, Propanol, Butanol.
Cuttings treatment process: Cleansing, Drying, Grinding, Granulometric analyses.
Petrophysical proprieties: Sandstone reservoir samples were processed and characterized to determine a certain porosity and permeability to imitate the proprieties of the low-permeability reservoirs. Firstly, By the water saturation method Porosity measurements averaged 12.72%. Secondly, after measuring the absolute and effective permeability of both water and oil in the sample, the determination of the relative permeability was calculated by the formula (3) and the results are shown in Table 4. The wettability measurements were conducted by the Amott-IFP test, then calculated by (4) which consists of the determination of fluid recovery by both spontaneous and forced displacement of (water/oil).
WI = Iw - Io …
Note: Iw water wettability indicator,
Io oil wettability indicator
Figure 3.
The Amott-IFP test Process. Note: This characterized sample is the same one used in the previous experiences mentioned in the first section of this paper.
Figure 3.
The Amott-IFP test Process. Note: This characterized sample is the same one used in the previous experiences mentioned in the first section of this paper.
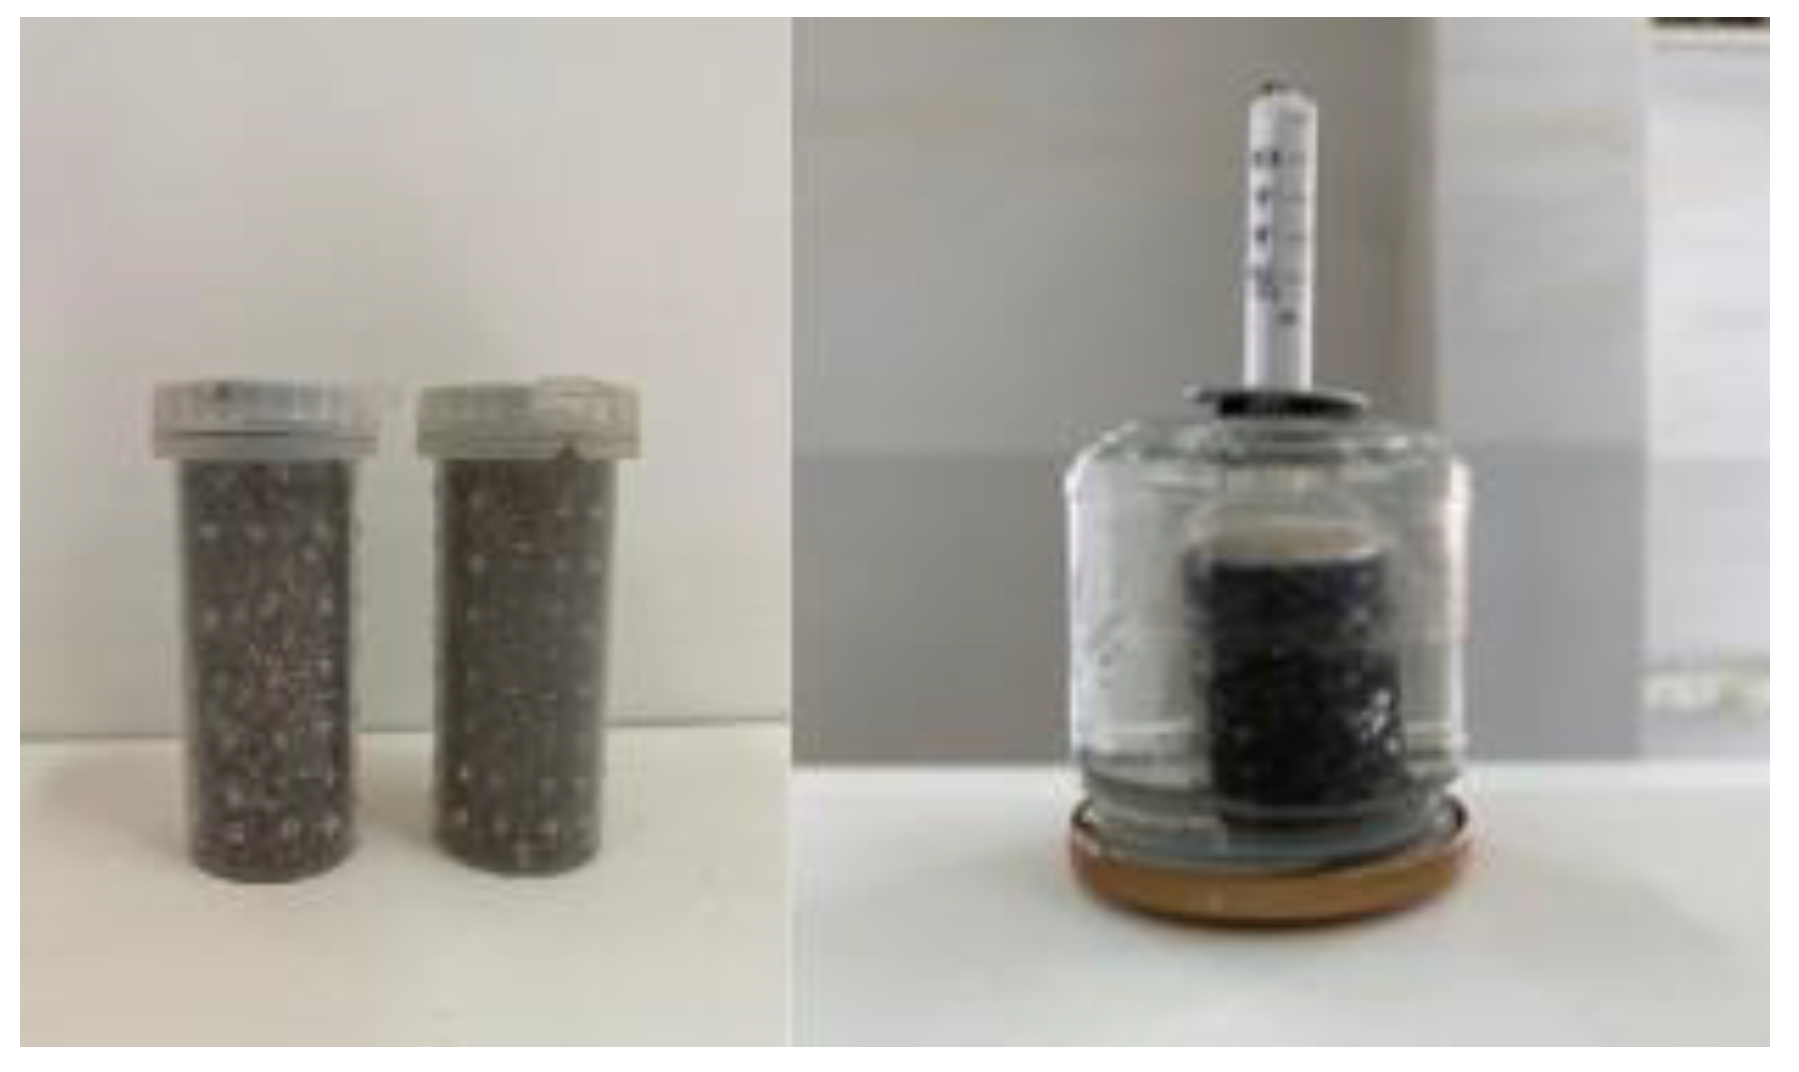
Table 5.
Wettability measurement results.
| V1(ml) | V2 (ml) | V3 (ml) | V4 (ml) | Wettability type of the sample | |||
|---|---|---|---|---|---|---|---|
| 3,500 | 5,500 | 0,050 | 2 | 0.380 | 0,024 | 0,356 | Water-Wet |
Oil flooding methodology
The sample saturated with water is used to represent the invaded wellbore zone with trapped water in its pores and the oil tank simulates the drainage zone. Oil is pumped through the saturated core sample at constant pressure, replicating the behavior of reservoir fluids under production conditions, the output of the sample is the recovery of the trapped water. To study oil flooding efficiency, the process is repeated using samples saturated with different surfactant solutions (EG, Propanol, and Butanol) at varying concentrations. Water recovery is measured for each solution to evaluate the displacement efficiency.
Figure 4.
Water recovery from oil displacement tests of different surfactants.
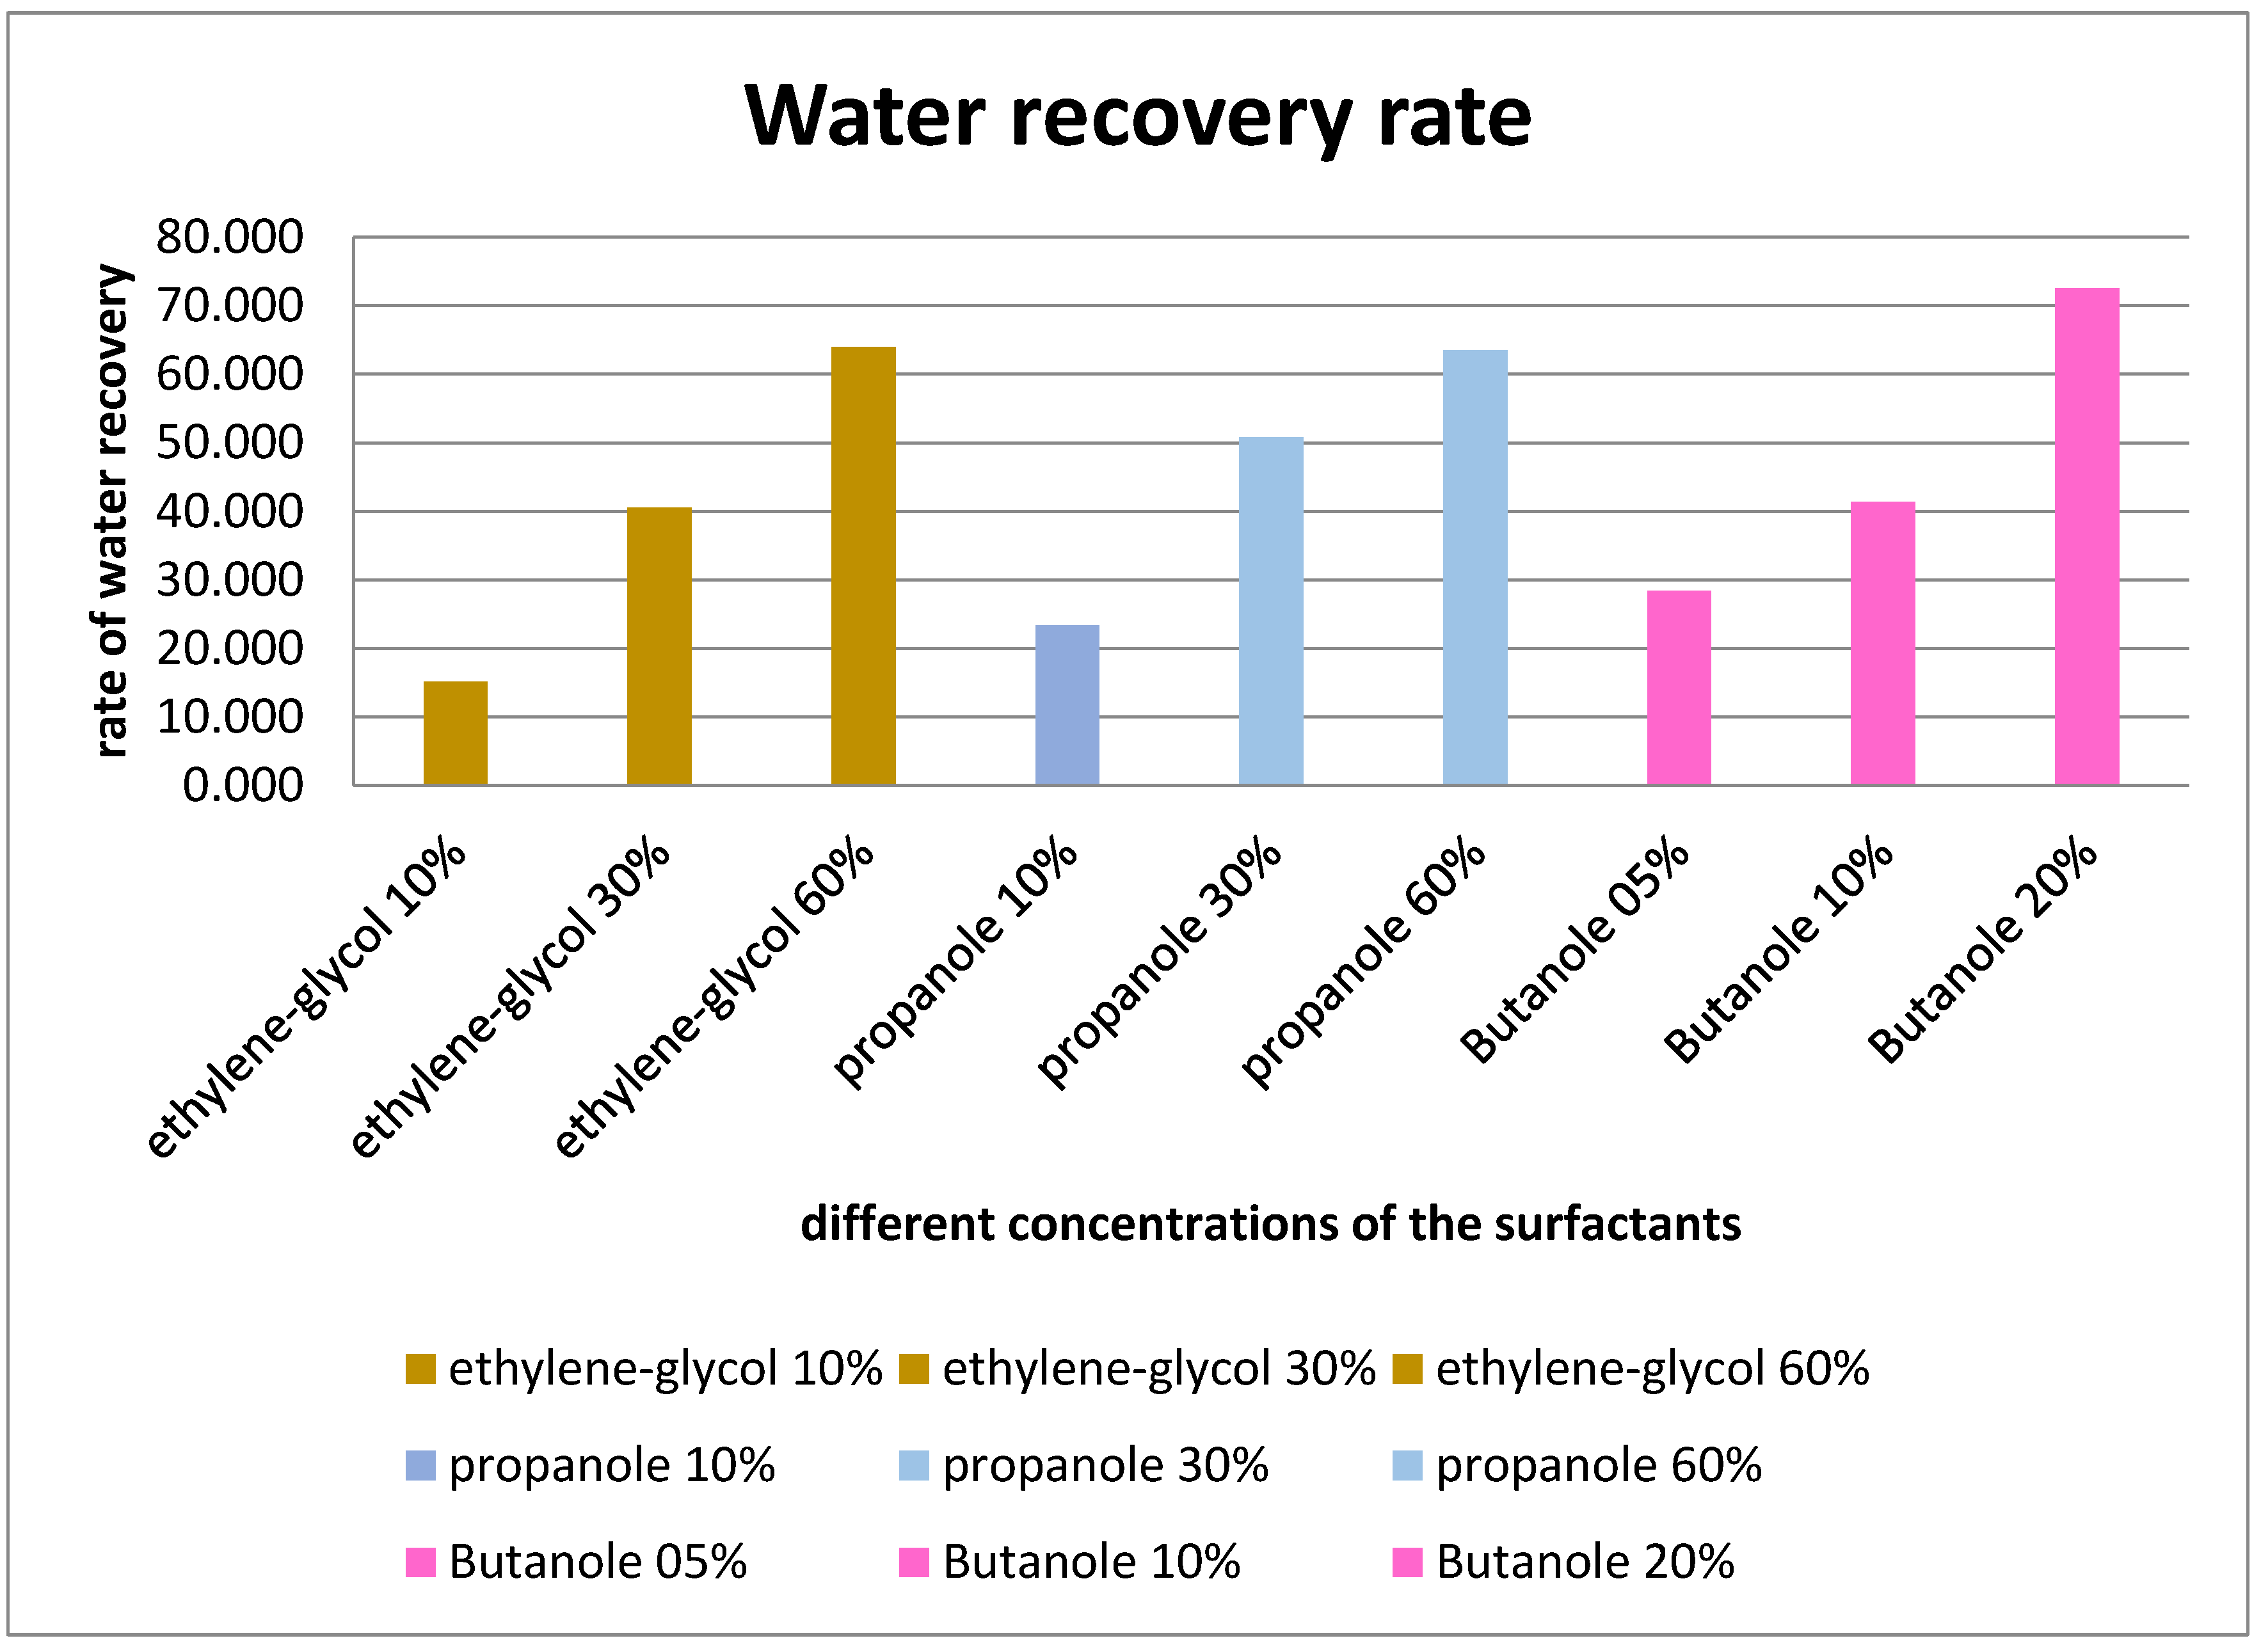
Results and discussion: With a maximum water recovery rate of 72,6%, butanol outperforms water block remediation experiments, achieving this efficiency at a concentration of only 20%. The oil flooding caused by the Ethylene Glycol and Propanol is flowing in the same range for close values of water recovery (64%-63%) with their maximum concentration of 60%. The effectivity of each surfactant on the water block remediation is unambiguous from the presented graph above.
III. Conclusions
- (1)
- Butanol, Propanol, and Ethylene glycol cause monolayer adsorption at any surface under the Langmuir adsorption isotherm model.
- (2)
- EG causes a significant reduction in interfacial tension to a minimum of 133.69 mN/m at 60% concentration.
- (3)
- Surfactants can change the wettability of the rock, whereas butanol in particular can reverse it with an index of -0.159.
- (4)
- Butanol outperforms in water block remediation achieving 72,6% of water recovery only at a concentration of 20%.
Acknowledgments
The authors would like to express their sincere gratitude to Lebtahi Hamid for his invaluable guidance and supervision throughout this work, ensuring its successful completion. His expertise and support have been instrumental in shaping the research direction and achieving meaningful results. We also extend our appreciation to Zakaria Adjou for his helpful contributions in providing guidance during specific aspects of the project.
References
- Civan, F. (2007). Reservoir Formation Damage (2nd ed.). Elsevier, Amsterdam.
- Dimri, V.P., & Vedanti, N. (2012). Handbook of Geophysical Exploration: Seismic Exploration. Elsevier, Amsterdam.
- Sanyo Chemical Solutions. (2024). Enhancing well productivity with innovative chemical solutions for hydraulic fracturing. Sanyo Chemical Solutions. Available at: https://sanyo-chemical-solutions.com/technology/2024/04/102498/. Accessed 21 November 2024.
- Soltani, M., Jang, H., Yazdi, M., et al. (2019). Application of magnetic nanoparticles to enhance oil recovery by improving interfacial behavior. Journal of Magnetism and Magnetic Materials, 485, 165–173. [CrossRef]
- Jafari, E., Asghari, R., Mohammadi, A. H., et al. (2023). Investigation of the phase behavior of multicomponent hydrocarbon mixtures using a newly developed model. Physical Chemistry Chemical Physics, 25, 19311–19325. [CrossRef]
- Zhao, J. (n.d.). Capillary Force and Surface Wettability. [Publisher details unavailable].
- Cleaning Technology Group. (n.d.). Online article.
Table 2.
soaked cuttings superficial tension measurements.
| Surfactant solution | Initial Superficial tension | Soaked Superficial tension |
|---|---|---|
| EG | 27,65 | 43,89 |
| Propanol | 20, 03 | 21, 00 |
| Butanol | 20, 86 | 24, 00 |
Table 4.
Relative permeability results.
| Fluid | Absolute permeability | Effective permeability | Relative permeability |
|---|---|---|---|
| Water | 0.134 | 9.5 × 10₋3 | 7.08 × 10₋2 |
| Oil | 3.21 × 10₋3 | 4.02 × 10₋3 | 1.25 |
Disclaimer/Publisher’s Note: The statements, opinions and data contained in all publications are solely those of the individual author(s) and contributor(s) and not of MDPI and/or the editor(s). MDPI and/or the editor(s) disclaim responsibility for any injury to people or property resulting from any ideas, methods, instructions or products referred to in the content. |
© 2024 by the authors. Licensee MDPI, Basel, Switzerland. This article is an open access article distributed under the terms and conditions of the Creative Commons Attribution (CC BY) license (http://creativecommons.org/licenses/by/4.0/).
Copyright: This open access article is published under a Creative Commons CC BY 4.0 license, which permit the free download, distribution, and reuse, provided that the author and preprint are cited in any reuse.


