
Submitted:
24 January 2025
Posted:
24 January 2025
You are already at the latest version
Abstract
Significant amounts of oil often remain in reservoirs after traditional waterflooding. Water-Alternating-CO₂ (CO₂-WAG) injection has shown to be a more efficient technique for recovering residual oil, leveraging successive imbibition and drainage cycles. Effective simulation of WAG injection requires a thorough understanding of three-phase relative permeability. In this study, a sector model of the X Oil field reservoir was developed to assess the potential of WAG injection, compared to continuous water and CO₂ flooding. The model area was selected to represent the field's geological and material-balance regions, with a natural closed boundary around its exterior surfaces. Simulations were conducted using the GEM simulator for different wettability characteristics (water-wet and mixed-wet) to evaluate oil recovery across three injection methods: CO₂-WAG, continuous water, and continuous CO₂ injection.The results indicate that continuous CO₂ injection yields a higher oil recovery factor than other methods in both water-wet and mixed-wet systems. However, the water-wet system outperformed the mixed-wet system in terms of overall recovery efficiency, highlighting the significant impact of wettability on EOR performance. This study provides valuable insights into optimizing injection strategies for enhanced oil recovery (EOR).
Keywords:
CO₂-WAG
; EOR
; CO₂ injection
; relative permeability
1. Introduction
With the global shift toward sustainable energy systems, optimizing hydrocarbon recovery from mature oil reservoirs remains critical for bridging the gap between renewable energy growth and current energy demands. Enhanced oil recovery (EOR) techniques, particularly Water-alternating gas (WAG) injection, are at the forefront of innovative reservoir management strategies. WAG injection combines the displacement efficiency of waterflooding with the mobility control and oil swelling benefits of gas injection. Specifically, Water-Alternating-CO₂ (CO₂-WAG) injection has garnered significant attention due to its dual benefit: increasing oil recovery while contributing to CO₂ sequestration, a priority under international climate commitments (IPCC, 2021).
Traditional water flooding often leaves a substantial amount of oil in the reservoir due to capillary trapping and inefficient displacement in heterogeneous rock formations. CO₂-WAG injection, through successive cycles of imbibition and drainage, offers an effective method to mobilize this trapped oil. However, the efficiency of CO₂-WAG is influenced by various factors, including wettability, phase behavior, and three-phase relative permeability. These factors control fluid displacement efficiency and CO₂ storage potential, making their accurate representation in reservoir models critical for optimizing injection strategies (Karimaie et al., 2021; Al-Wahaibi et al., 2022).
One of the most complex aspects of modeling WAG injection is the accurate characterization of three-phase relative permeability. This parameter governs the flow dynamics of oil, water, and gas within the reservoir and is a function of saturation, wettability, and capillary pressure. Despite its importance, most existing models are based on empirical correlations that fail to capture the complexity of multiphase flow in heterogeneous systems. Moreover, differences in reservoir wettability—ranging from water-wet to mixed-wet conditions—significantly impact oil recovery and CO₂ trapping behavior, further complicating predictive modeling efforts (Sheng, 2022).
This study seeks to address these challenges by comparing the performance of CO₂-WAG injection in water-wet and mixed-wet systems. Using a sector model of the X Oil Field reservoir, the research evaluates the efficiency of three injection strategies—CO₂-WAG, continuous water injection, and continuous CO₂ injection—using state-of-the-art simulation techniques. The findings underscore the superiority of the CO₂ injection method and highlight the influence of wettability on oil recovery performance. This work contributes to the growing body of knowledge on EOR techniques by offering practical insights for optimizing injection strategies.
Enhanced Oil Recovery and WAG Injection
Enhanced Oil Recovery (EOR) methods are essential for extracting the remaining oil in mature reservoirs. Among these methods, WAG injection is considered one of the most versatile due to its ability to simultaneously improve macroscopic sweep efficiency and microscopic displacement efficiency. The success of WAG injection depends on its ability to mitigate the shortcomings of standalone water or gas injection methods, such as early gas breakthrough, poor mobility control, and gravity segregation (Al-Wahaibi et al., 2022).
CO₂-WAG injection, a variant of WAG, leverages the unique properties of CO₂, such as its ability to dissolve in crude oil, lower oil viscosity, and swell oil volumes, leading to enhanced recovery. Field-scale applications of CO₂-WAG have demonstrated significant improvements in oil recovery, particularly in reservoirs with favorable miscibility conditions (Rossen & van Dijke, 2020). However, the efficiency of CO₂-WAG is strongly dependent on reservoir properties, injection parameters, and wettability.
Wettability and Its Role in WAG Injection
Wettability, defined as the affinity of reservoir rock surfaces for water or oil, plays a pivotal role in determining fluid flow behavior in porous media. Water-wet reservoirs typically exhibit higher recovery during waterflooding, as water preferentially imbibes into pore spaces, displacing oil. In contrast, mixed-wet systems, where both oil and water wet the rock surfaces, present a more complex flow behavior, often leading to lower recovery efficiency during water flooding (Anderson, 1987; Al-Anazi et al., 2023).
The impact of wettability extends to CO₂-WAG processes, influencing fluid distribution, relative permeability curves, and CO₂ trapping mechanisms. Recent studies indicate that water-wet systems generally achieve higher oil recovery compared to mixed-wet systems during CO₂-WAG injection, primarily due to better sweep efficiency and reduced capillary trapping of oil (Li et al., 2022). However, mixed-wet systems may offer advantages in terms of residual CO₂ trapping, making them attractive from a carbon storage perspective.
Three-Phase Relative Permeability
Accurate modeling of three-phase relative permeability is essential for simulating WAG injection. Traditional models, such as those proposed by Corey (1954) and Stone (1970), provide simplified correlations for estimating relative permeability based on two-phase data. While these models are widely used in reservoir simulation, they often fail to capture the complex interactions between oil, water, and gas in three-phase flow systems (Lake, 1989).
Advances in experimental techniques have enabled the measurement of three-phase relative permeability under reservoir-relevant conditions. For example, Karimaie et al. (2021) conducted core flooding experiments to evaluate the effect of wettability on three-phase flow and proposed modifications to traditional models to account for wettability variations. Similarly, Zhao et al. (2023) used machine learning to develop predictive models for three-phase relative permeability, demonstrating improved accuracy over empirical correlations.
Despite these advancements, significant gaps remain in the application of three-phase relative permeability models to field-scale WAG simulations. Most studies are limited to laboratory-scale experiments or theoretical analyses, with few comprehensive validations against field data. This highlights the need for integrated studies that combine experimental, numerical, and field data to improve model reliability.
Simulation of CO₂-WAG Injection
The use of compositional reservoir simulators, such as GEM and Eclipse, has facilitated the study of CO₂-WAG injection under various reservoir conditions. These simulators allow for the incorporation of complex phase behavior, capillary pressure effects, and relative permeability hysteresis (Rossen & van Dijke, 2020). However, the accuracy of simulation results depends heavily on the quality of input data, particularly relative permeability and wettability parameters.
Recent research emphasizes the importance of calibrating simulation models with experimental data to improve prediction accuracy. For instance, Al-Anazi et al. (2023) demonstrated that incorporating experimentally derived relative permeability curves into WAG simulations led to better alignment with observed field performance. Such studies underscore the critical role of experimental data in bridging the gap between theoretical models and real-world applications.
The novelty of this research lies in the demonstration, to the best of the authors' knowledge, that no prior study has conclusively shown CO2 flooding to outperform WAG flooding as an effective injection technique for enhanced oil recovery (EOR) in highly heterogeneous reservoirs. Additionally, the application of the CMG GEM simulator to this specific oil field adds a unique methodological dimension. Finally, the conclusion that a water-wet system is more effective than a mixed-wet system contrasts with findings from prior research, offering a fresh perspective on wettability's role in EOR.
2. Materials and Methods
Properties of the Sector Model
A compositional simulation software was used for the numerical simulation of this study. Figure 1 demonstrates a 3-D view of a seven-point CO2-WAG sector model.
There are 32 layers in the model, each layer has its own characteristics. The porosity and permeability distribution in some of the layers are shown in the figures below.
Reservoir Porosity
In this reservoir, the porosity ranges from 0.070 to 0.091. Most of the layers have the same porosity, however, the highest porosity value of 0.091 was found in layer 20. Figure 2 portrays porosity distributions in Layers 17 and 18.
Reservoir Permeability
The study reservoir is heterogeneous. Permeability variation is high, with permeability ranging from 1 to 70 md. Most of the layers have the same permeability. The highest permeability was found in layers 20 and 22 (see Figure 3). In reservoirs with high permeability contrast, CO2 migration, and trapping efficiency are affected by the variability in flow paths. High-permeability layers, such as layers 20 and 22, act as conduits, enabling faster CO2 migration. Low-permeability layers may impede vertical migration and provide additional trapping mechanisms.
Relative Permeability Curves
Figure 4 and Figure 5 depict the relative permeability data for two rock types (Type 1 and Type 2). Both formations are water-wet (Swx values when krw/kro vs. Sw intersect are larger than 0.5).
In water-wet rocks, despite the enhanced trapping, an early gas breakthrough may occur in high-permeability zones, requiring careful control of injection rates and cycle timing. In addition, high water retention in smaller pores can lead to water blockage in low-permeability zones, reducing oil recovery efficiency. However, the addition of CO2 will potentially alter rock wettability over time (e.g., shifting to intermediate-wet conditions), affecting long-term WAG performance.
3. Results and Discussions
CO2-WAG Recovery Technique
After the primary depletion, a secondary recovery technique (water flooding) was employed to improve the declined formation pressure by flooding water into the well. Although some amount of oil was recovered, a considerable amount of oil remained. Eventually, a tertiary recovery method (CO2-WAG) was considered for the recovery of abandoned residual oil. A significant amount of oil was recovered with the help of this recovery technique.
The sector model with the real history of CO2-WAG was deployed in this study to investigate the potential of this technique for oil production and CO2 sequestration. The water injection process was initiated in 2002, and only two wells, namely H79-3-03 and H79-5-3 showed an increase in an oil recovery factor. About a year later the production of the well (H79-5-3) rose by recovering around 25000 m3. The production remained the same until switching to the tertiary oil recovery method (CO2-WAG). Another well (H79-3-1) produced a significant amount of oil over time solely with the help of water flooding.
In the year 2013, after water flooding, CO2-WAG was initiated and after about a year and a half, the production rose steadily across the time in almost all the wells as shown in Figure 6.
WAG Performance in Comparison with Waterflood and CO2-Flood in the Water-Wet System
This research is based on a sector model, having two rock types. There are 10 wells in which 7 are producers (H79-3-1, H79-3-03, H79-3-3, H79-5-03, H79-5-3, J79-5-1 and J79-5-3) and 3 of them are injectors (H79-3-1-w, J79-5-03-w and J79-5-3-g). For this investigation, the following three scenarios were considered in the first stage:
1) Continually flooding with water; 2) CO2 flooding; 3) CO2-WAG injection
The fundamental multi-phase features of the rock, such as capillary pressure and relative permeability curves, are influenced by the wettability of the rock, which in turn impacts fluid distribution and movement in pores. Although reservoirs can be water-wet, oil-wet, or mixed-wet, this field case exclusively looks at oil production in water-wet and mixed-wet systems. Therefore, the other two models will also be constructed for water-wet and mixed-wet systems to establish a fair relationship between the three injection methods.
Comparing the simulation outcomes of CO2 injection and CO2-WAG, the same amount of CO2 was injected into the reservoir for both techniques as shown in Figure 7.
To have a fair comparison, the limitations for CO2 injection and water injection were set to be identical to the WAG injection sector model. For the water injection wells (H79-3-1-w, J79-5-03-w), the surface water rate (STW) was limited to 78.69999 m3/day and 19.89999 m3/day while bottom hole pressure (BHP) was set 30000 MPa and 1000000 kPa respectively as a maximum value. In the system of gas injection well, the surface gas rate (STG) was restricted to 22983.40039 m3/day while bottom hole pressure (BHP) was limited to 1000000 kPa.
The amount of water injected in two injection wells was also kept the same for both WAG and water injection operations as illustrated in Figure 8 and Figure 9. More than 40000 m3 of water was injected during both injection methods.
After clear observation of the three injection methods, simulation results proved that the oil production rate of CO2 injection was higher at first, starting from 2015 till 2020. However, it declined at the end of the period due to CO2 breakthrough at later stages. Moreover, the oil rate during CO2-WAG injection was also better at the initial stages but lower compared to the CO2 flooding technique. Finally, in terms of the water injection process, the oil rate was enough lower at the initial stages however, surprisingly it performed better at the final stages compared to the other two injection processes. The oil production rate of all three injection methods is illustrated in Figure 10.
Figure 11 The total oil production from all three injection methods is shown below. Overall, the simulation findings show that from 2014 to 2022, the cumulative oil production by each injection method increased dramatically. Water injection showed the lowest production accounting for 30,000 m3 at the end of the period. Production through the WAG method was higher compared to water injection alone. However, it was lower than continuous CO2 injection accounting for around 45,000 m3. Finally, the continuous CO2 flooding technique remained the highest for cumulative oil production. The production recorded via CO2 flooding was approximately 48,000 m3 at the end of the period.
Figure 12 proves that not only does CO2-WAG have lower oil production compared to continuous CO2 flooding but also has a higher gas-oil ratio (GOR). This is yet another issue with the CO2-WAG injection procedure. In the event of continuous CO2 injection, the GOR was initially greater but gradually decreased over time compared to CO2-WAG. The GOR reached around 32000 m3/m3 in the case of CO2-WAG, which was the highest peak throughout the period.
Also, the water cut was quite similar during water injection and CO2-WAG as shown in Figure 13. Although it started lower than water flooding in the early stages of WAG, it gradually climbed from 2015 till the end of the period. This result clearly illustrates that the CO2-WAG process is not superior to water flooding in terms of water cuts.
WAG Performance in Comparison with Waterflood and CO2-Flood in Mixed-Wet System
The simulation results in a mixed-wet system were quite comparable to those in a water-wet system to begin the comparative study with the oil rate. The oil rate in CO2 flooding was higher most of the time throughout the period however, at the end of the period oil rate in water injection superseded. The oil rate in CO2-WAG was also almost identical to continuous CO2 flooding however, it declined later. Finally, the oil rate in water flooding was lower at the initial stages but it went up at the end of the period. Figure 14 illustrates the oil rate in all three injection methods for mixed-wet reservoirs.
The cumulative oil production of all three injection methods for the mixed-wet system is shown below in Figure 15. Overall, the simulation results showed an increment in oil production for each injection method throughout the period from 2014 to 2022 as was the term in the water-wet system. However, the cumulative oil production for each injection method was very low compared to the case of the water-wet reservoir. CO2 injection cumulative oil production was around 30,000 m3 and remained the highest among other flooding processes. In the case of CO2-WAG and water injection operation, the cumulative oil production was approximately 28,000 m3 and 21,000 m3 respectively.
The gas-oil ratio condition in the mixed-wet model is almost identical to the water-wet model. In general, the GOR data show fluctuations. In this case, the GOR was lower in CO2-WAG initially however, it increased later compared to CO2 injection. Moreover, considerable variations took place after 2016 both in CO2-WAG and continuous CO2 GOR due to modifications in well completion and gas meter maintenance issues. A complete illustration of GOR for mixed-wet is presented in Figure 16.
Water cut is another important parameter, which must be considered for better oil recovery factor. In this case, water cut is studied for CO2-WAG as well as water flooding technique in mixed-wet systems. The results were quite like the water-wet system which has been discussed above, showing that water cut was lower at the initial stages of CO2-WAG compared to water flooding. However, it rose over time and became equal to a water cut of water flooding. All these variations are depicted below Figure 17.
To put it simply, the oil recovery factor of the simulation findings for the water-wet and mixed-wet systems was radically different. The recovery factor for CO2 flooding in the water-wet model was 27.2%, while that for CO2-WAG and water flooding was 26% and 23.6%, respectively. The oil recovery factor in the mixed-wet model also demonstrated that continuous CO2 flooding has a higher recovery efficiency than the other two injection techniques. According to Table 1, the recovery factors for CO2-WAG, water injection, and continuous CO2 injection were 16.2%, 12.4%, and 17.2%, respectively.
The total oil production of CO2 injection was 48,000 m3 which was a little higher than CO2-WAG 45,000 m3 in the case of the water-wet model. Turning to the mixed-wet model, although the results were lower compared to the water-wet model, oil production in continuous CO2 flooding was still higher than the other two injection methods within the same wettability system. A total of 174328.3 barrels of oil per day were produced by CO2-WAG, 185584 barrels per day were produced by continuous CO2 injection, and 133881.7 barrels per day were produced by continuous water flooding. Overall, this simulation study shows that, when related to CO2-WAG and water flooding, continuous CO2 injection performs better in both water-wet systems and mixed-wet systems. The investigation's findings also suggest that for all three of the injection operations, a water-wet wettability condition is preferable over a mixed-wet condition.
4. Conclusion
This study investigated the efficiency of CO₂-WAG injection compared to continuous CO₂ and water flooding in water-wet and mixed-wet reservoirs using a sector model of the X Oil Field. The findings reveal that continuous CO₂ injection outperformed other methods in terms of oil recovery efficiency in both wettability systems, although water-wet conditions consistently provided higher recovery rates than mixed-wet systems. CO₂-WAG demonstrated advantages in balancing CO₂ sequestration with moderate oil recovery but was less efficient than continuous CO₂ injection.
While continuous water flooding showed the lowest recovery overall, it exhibited stable performance in later stages, highlighting its suitability in specific scenarios. The study underscores the critical role of wettability in enhancing oil recovery and suggests that continuous CO₂ injection is the optimal choice for maximizing production in mature reservoirs, particularly under water-wet conditions.
Future research should focus on refining three-phase relative permeability models and investigating long-term CO₂ sequestration capabilities to enhance the sustainability of enhanced oil recovery (EOR) techniques.
Abbreviations
The following abbreviations are used in this manuscript:
| CO₂-WAG | Carbon Dioxide-Water Alternating Gas |
| EOR | Enhanced Oil Recovery |
| IPCC | Intergovernmental Panel on Climate Change |
| GOR | Gas-Oil Ratio |
| GEM | Generalized Equation-of-State Model |
| BHP | Bottom Hole Pressure |
| STW | Surface Water Rate |
| STG | Surface Gas Rate |
References
- Anderson, W. G. "Wettability Literature Survey—Part 4: Effects of Wettability on Capillary Pressure. " Journal of Petroleum Technology 1987, 39, 1453–1468. [Google Scholar] [CrossRef]
- Sheng, J. J. Enhanced Oil Recovery Field Case Studies. Gulf Professional Publishing, 2022.
- Al-Anazi, N. , et al. "Advances in Three-Phase Relative Permeability Models for EOR Applications.". Journal of Petroleum Science and Engineering 2023, 220, 110981. [Google Scholar]
- Lake, L. W. Enhanced Oil Recovery. Prentice Hall, 1989.
- Karimaie, A. , et al. "Evaluation of Relative Permeability Models in Simulating WAG Processes.". Energy & Fuels 2021, 35, 4218–4232. [Google Scholar]
- Rossen, W. R. , & van Dijke, M.I. "Mechanistic Modeling of Gas Injection Processes.". SPE Journal 2020, 25, 1680–1694. [Google Scholar]
- Al-Wahaibi, Y. , et al. "Field Applications of CO₂-WAG and Challenges in Reservoir Management.". SPE Reservoir Evaluation & Engineering 2022, 25, 56–67. [Google Scholar]
- Li, X. , et al. "Wettability Alteration During CO₂ Injection: Implications for EOR and CO₂ Storage.". Advances in Colloid and Interface Science 2022, 299, 102630. [Google Scholar]
- Zhao, Q. , et al. "Machine Learning in Compositional Simulation: A Paradigm Shift for EOR Predictions.". Computational Geosciences 2023, 27, 345–360. [Google Scholar]
- IPCC. Sixth Assessment Report: Mitigation of Climate Change. Cambridge University Press. 2021.
Figure 1.
3D view of CO2-WAG sector model.
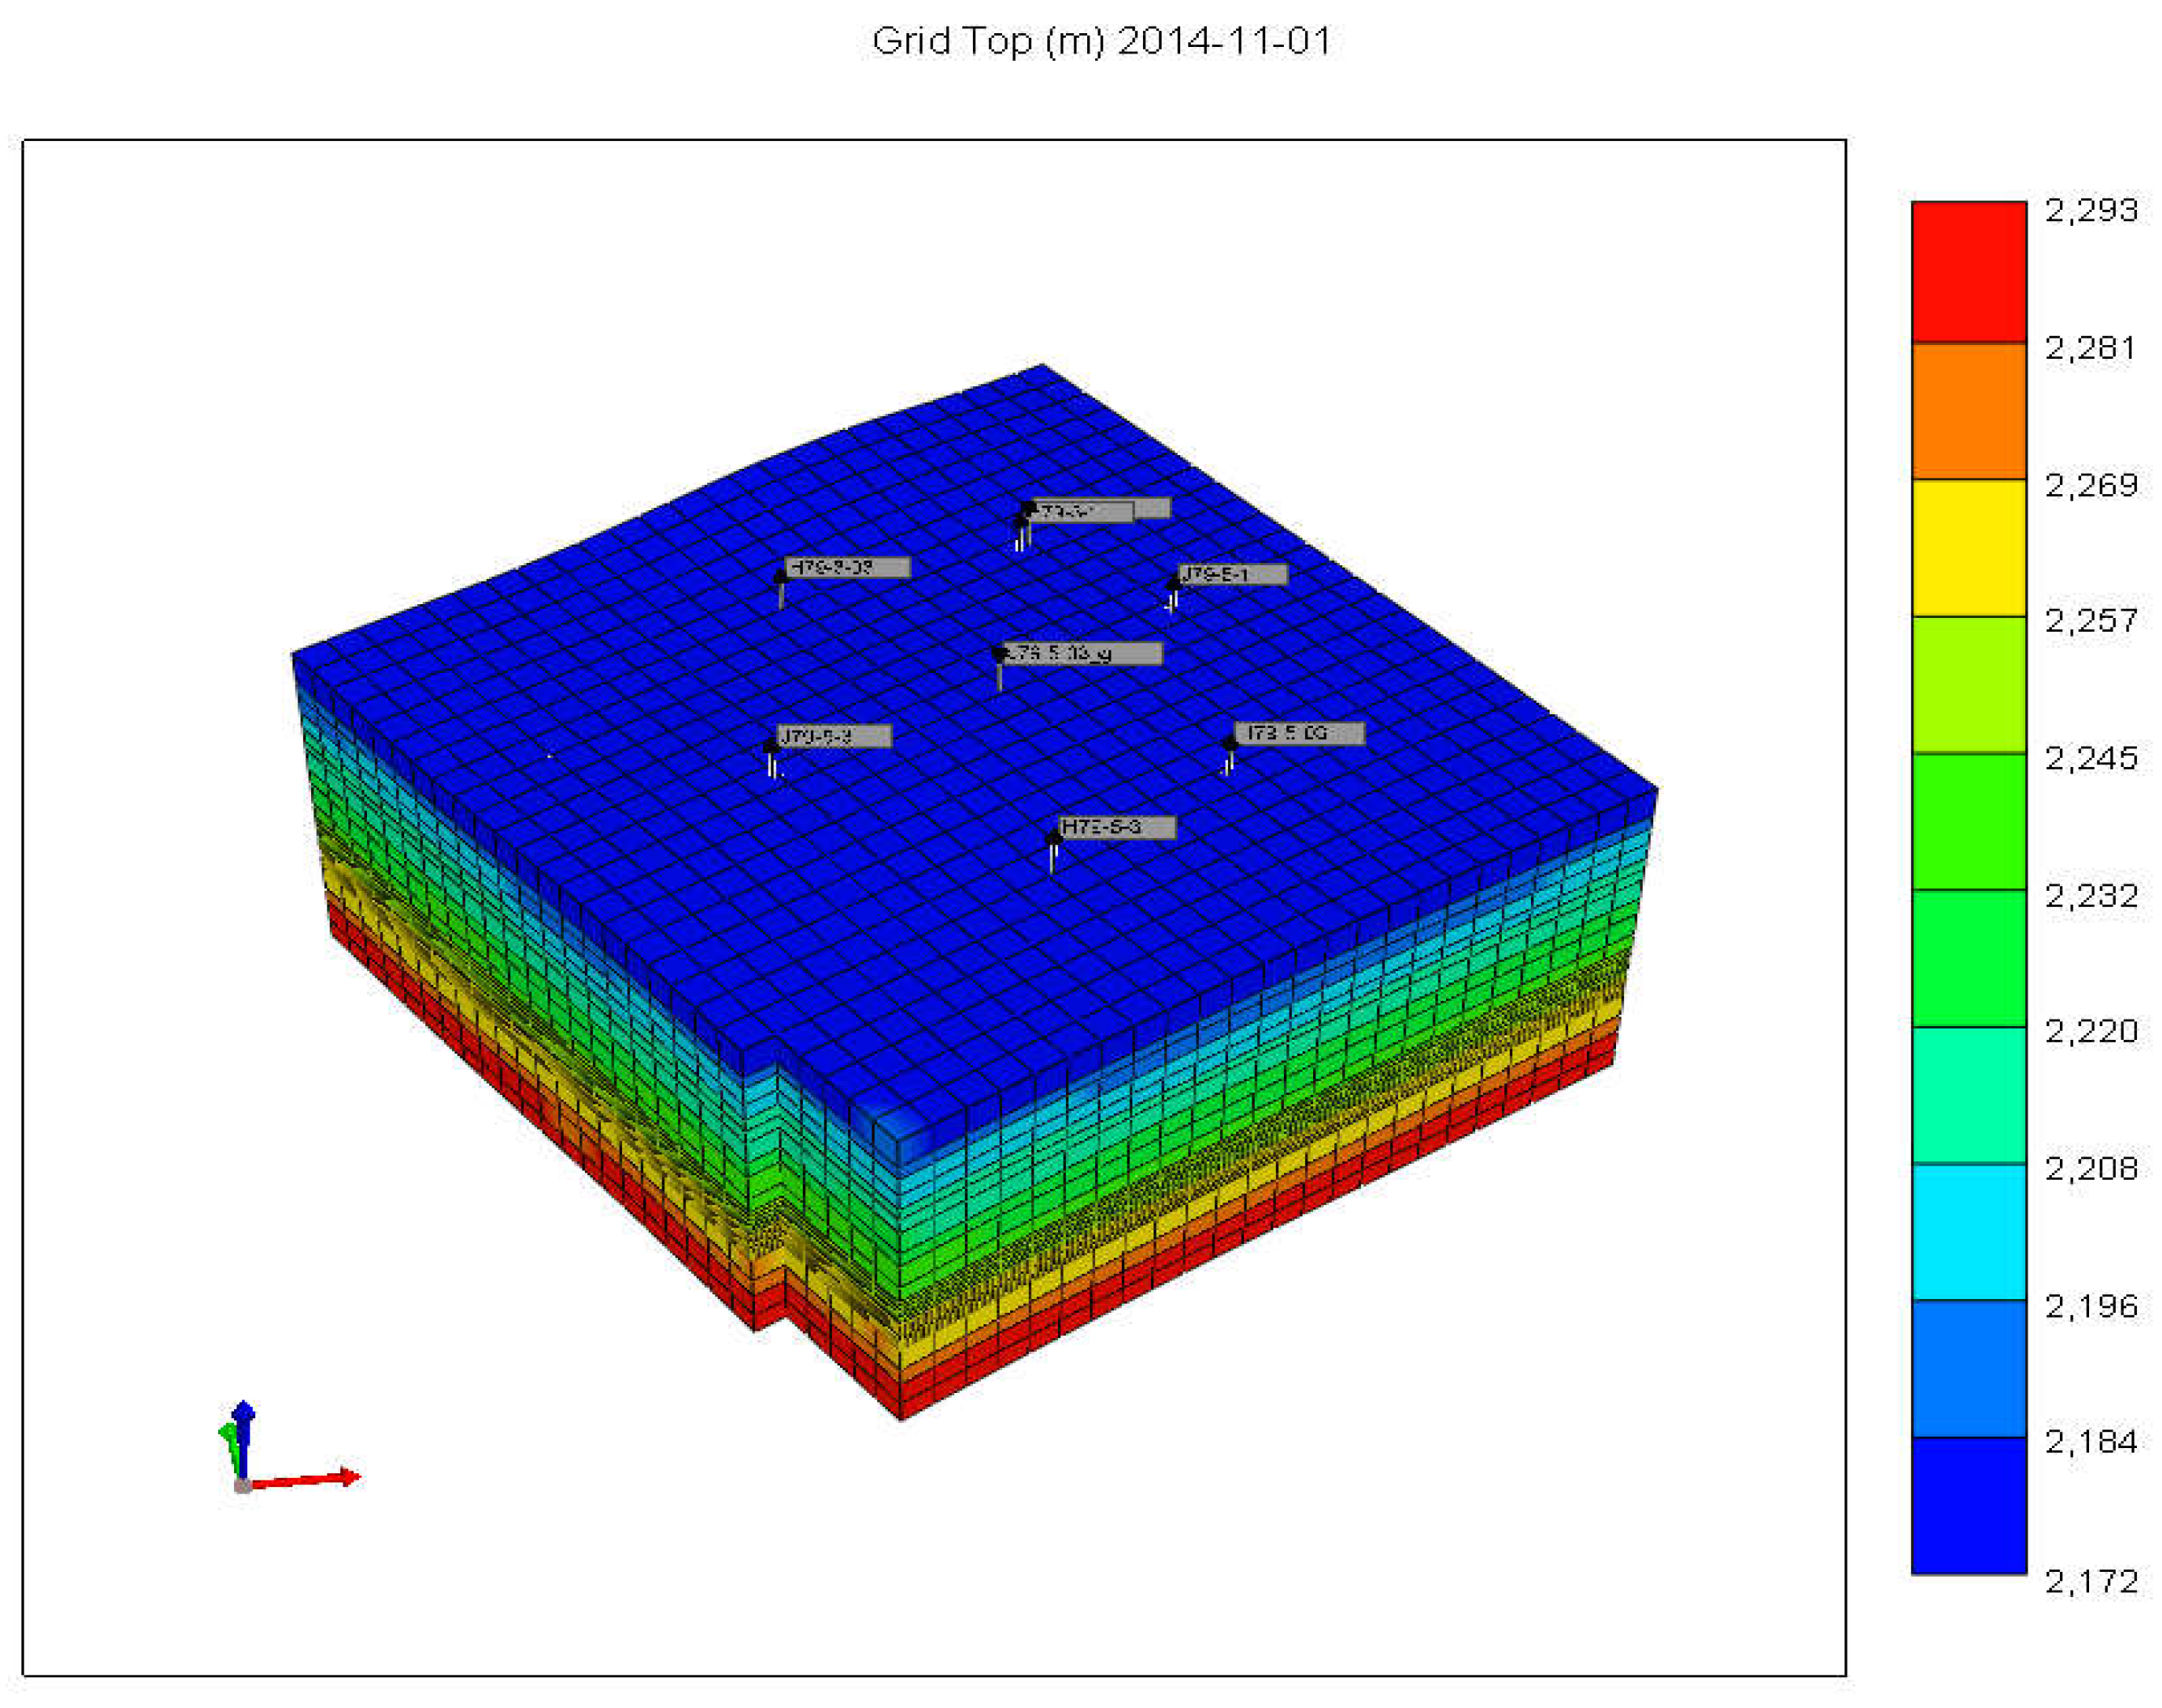
Figure 2.
Porosity distribution in layer 17 (left) and in layer 18 (right).
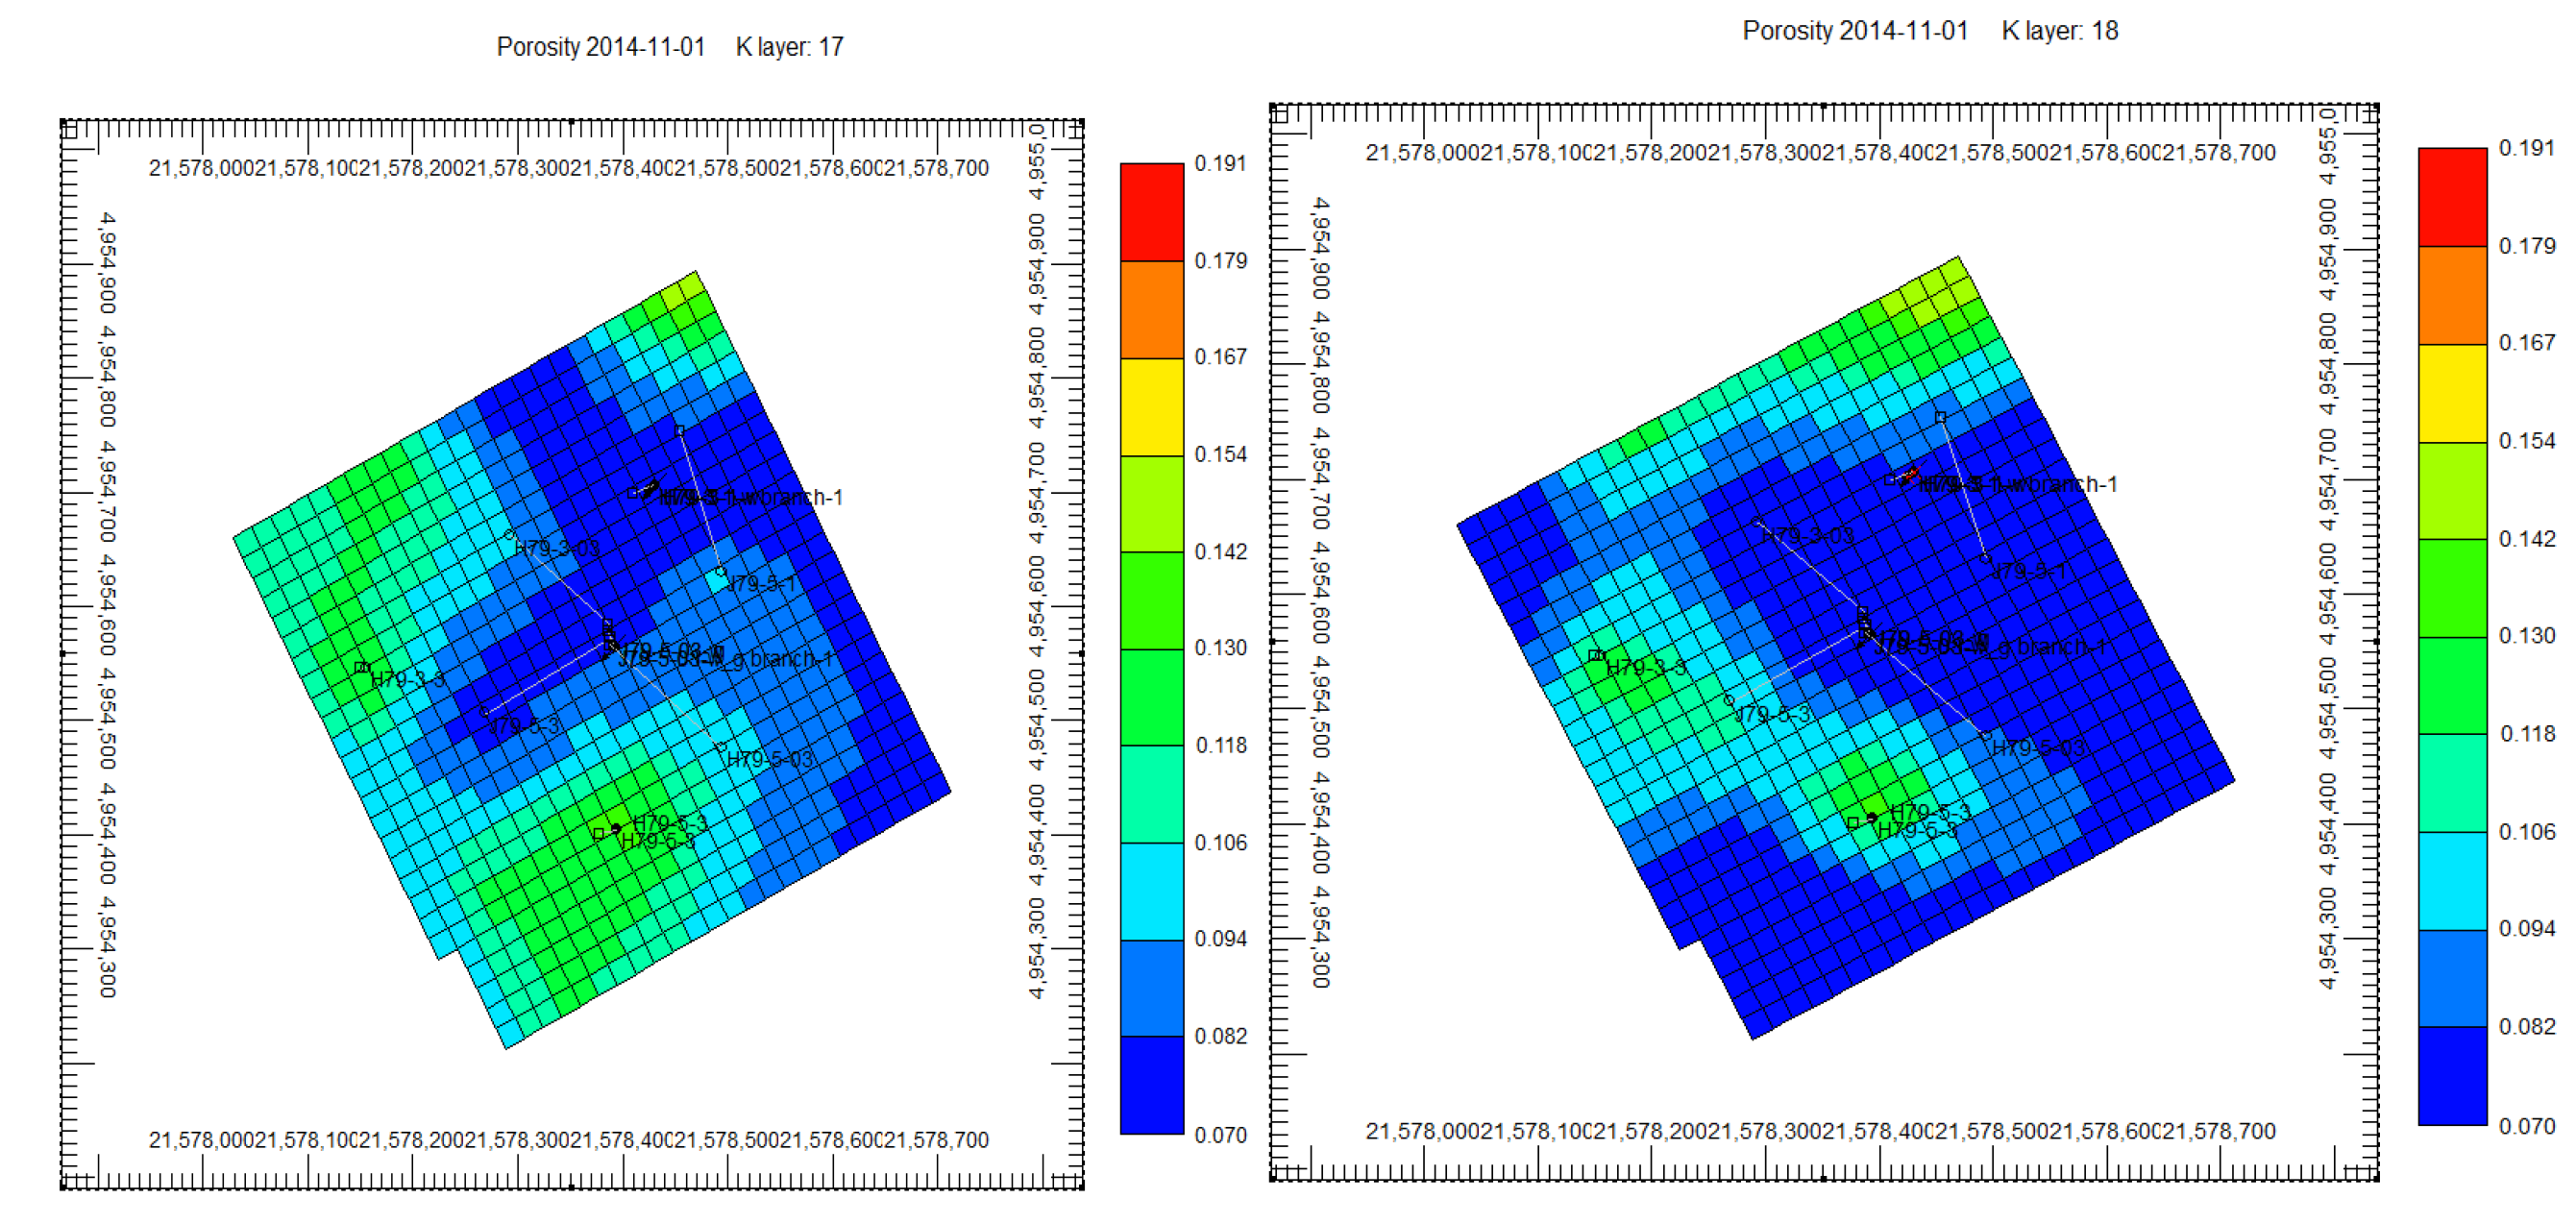
Figure 3.
Permeability distribution in layer 20 (left) and in layer 22 (right).
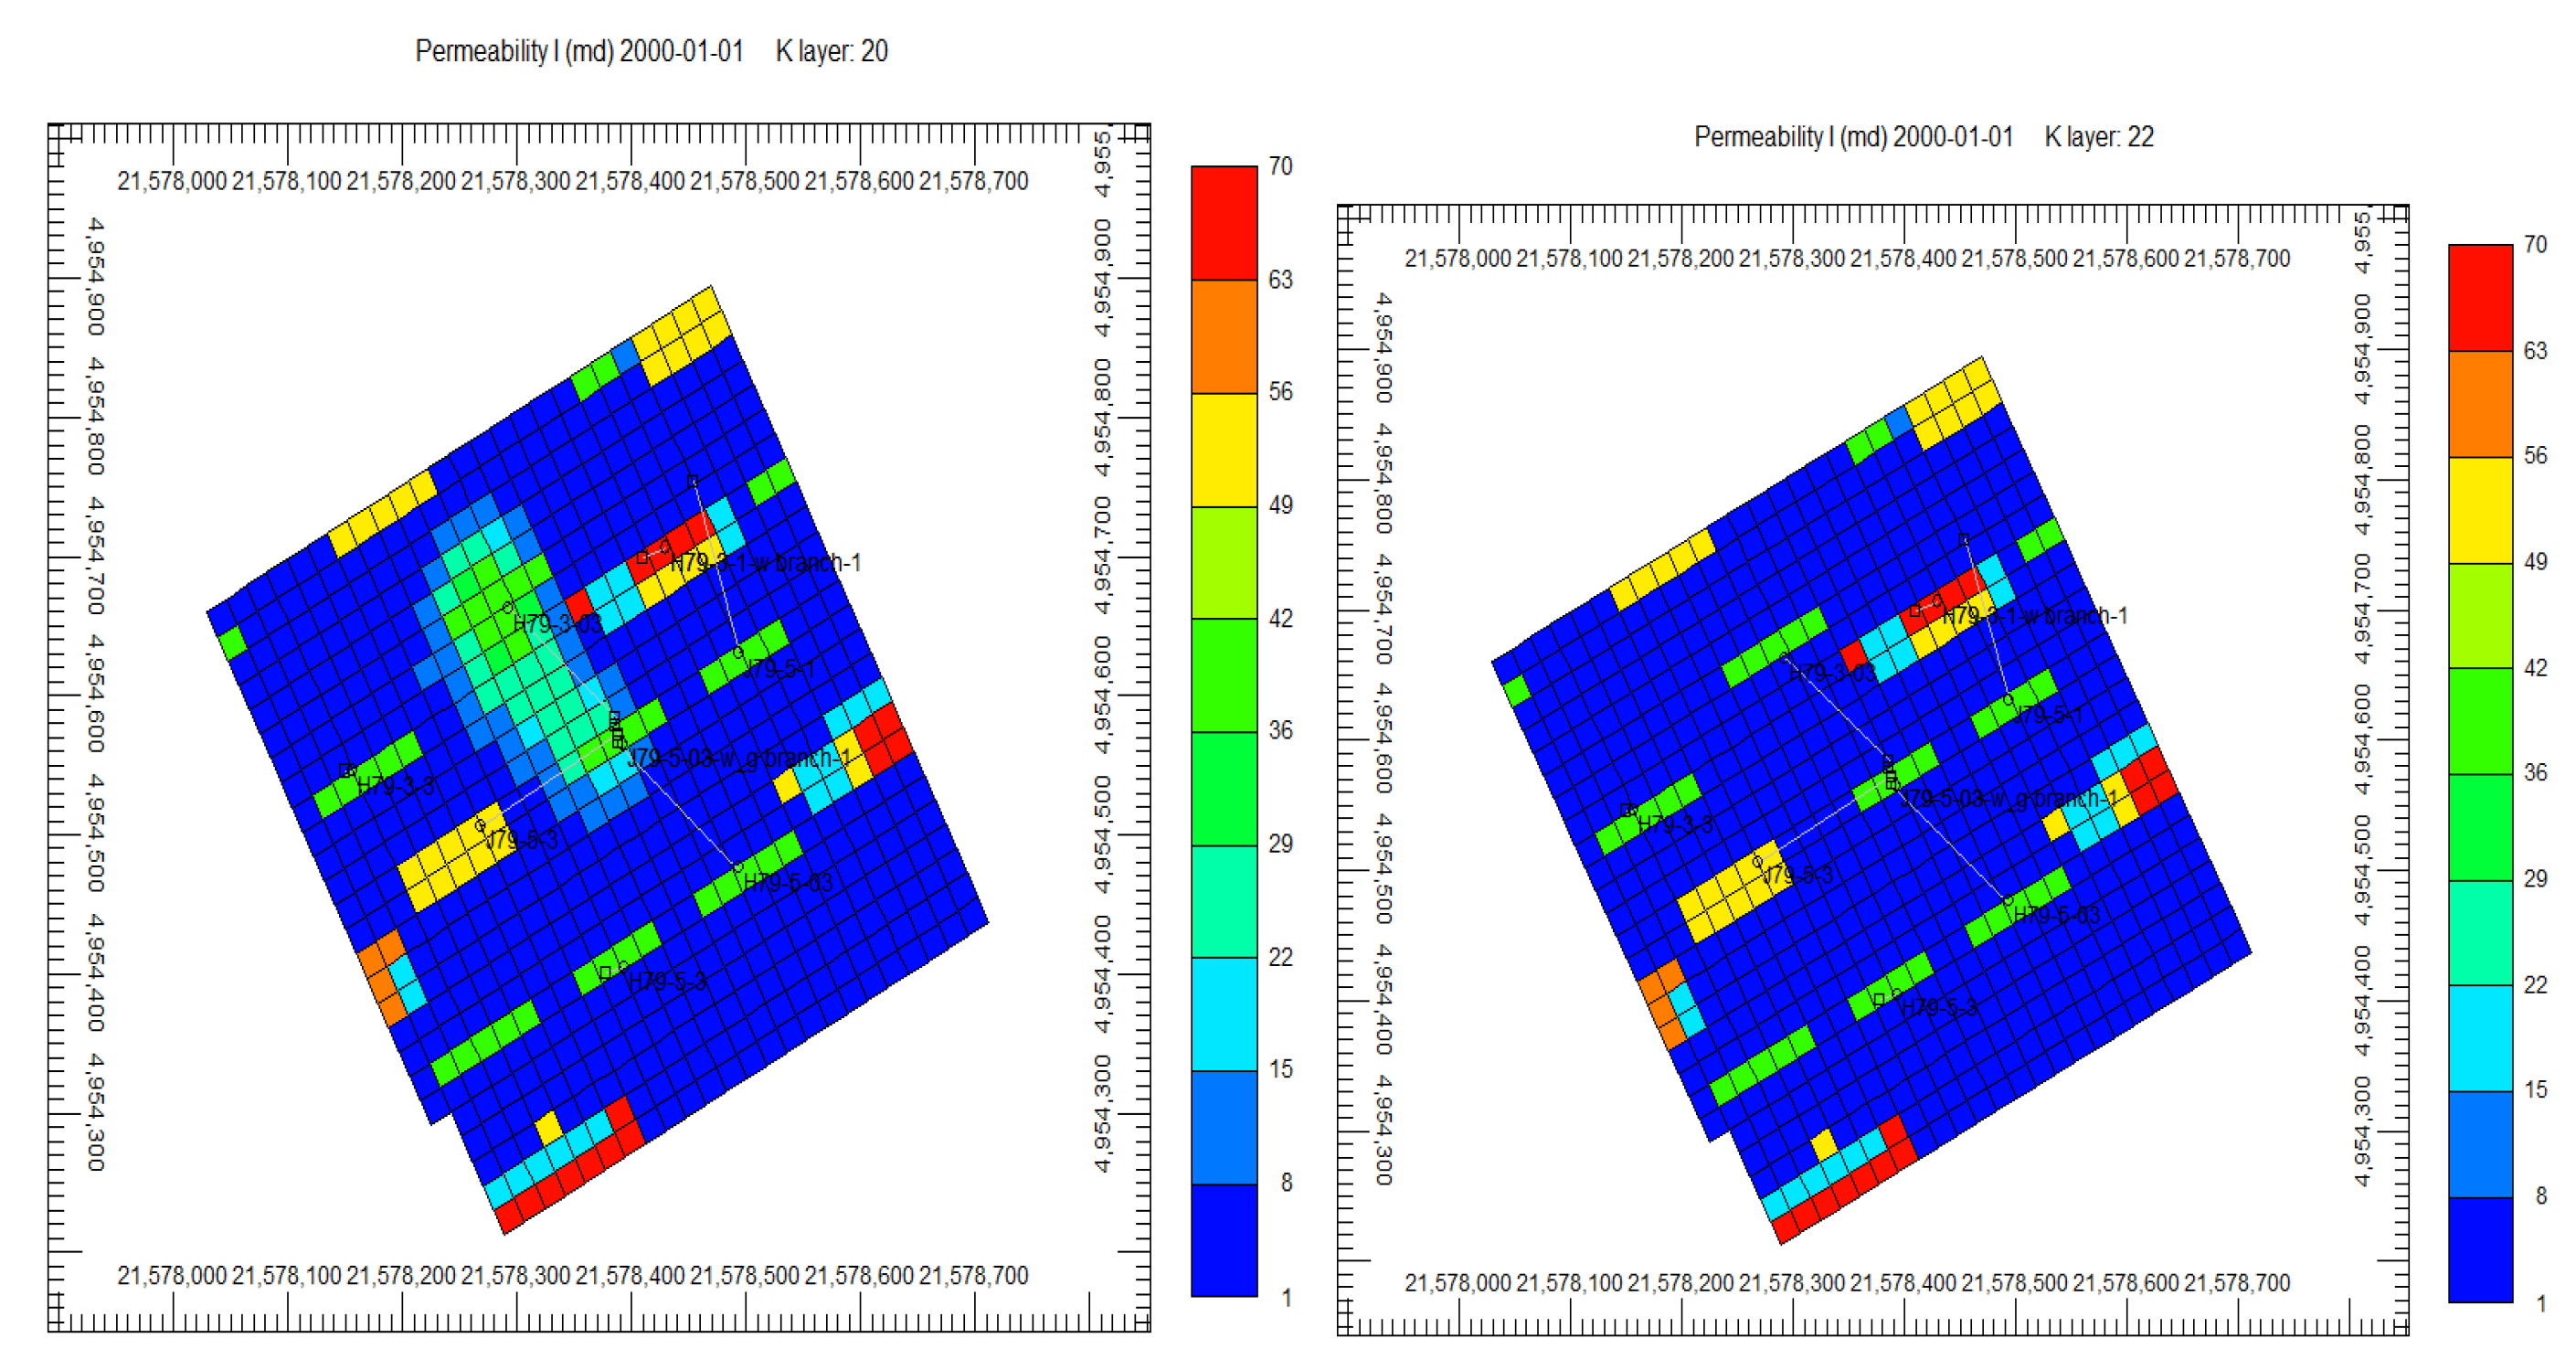
Figure 4.
Relative permeability curves (Rock type 1).
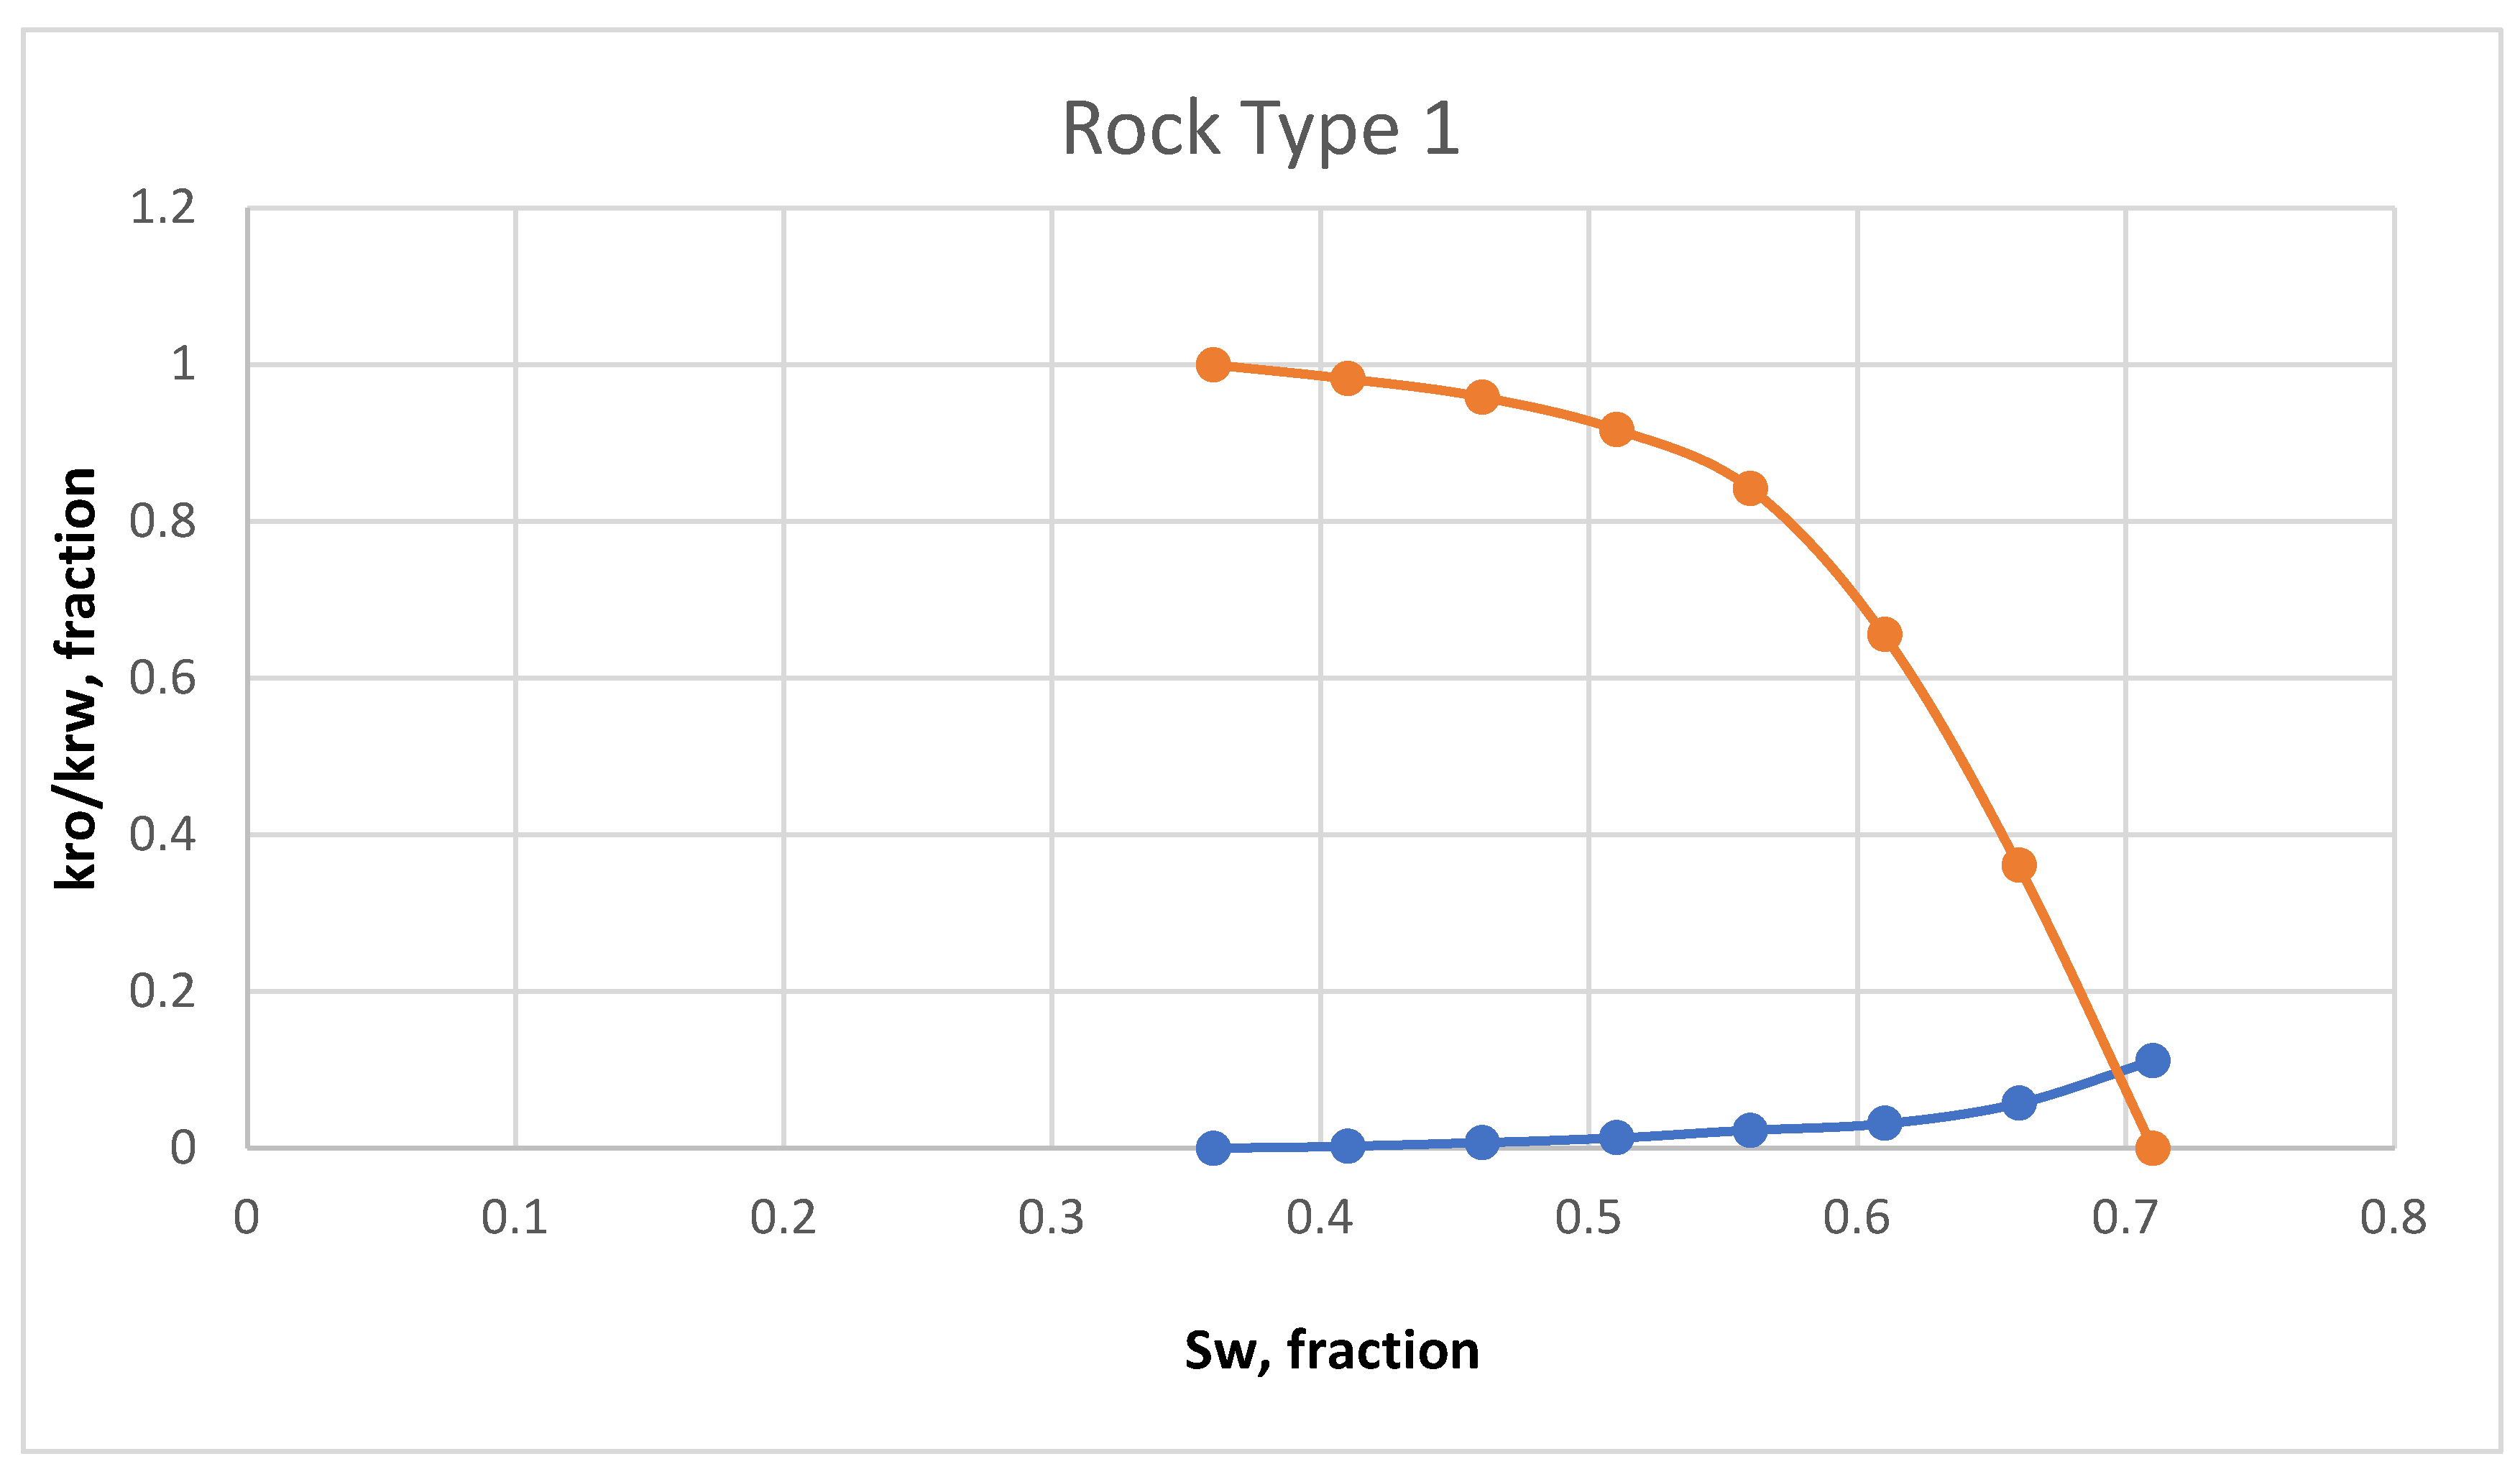
Figure 5.
Relative permeability curves (Rock Type 2).
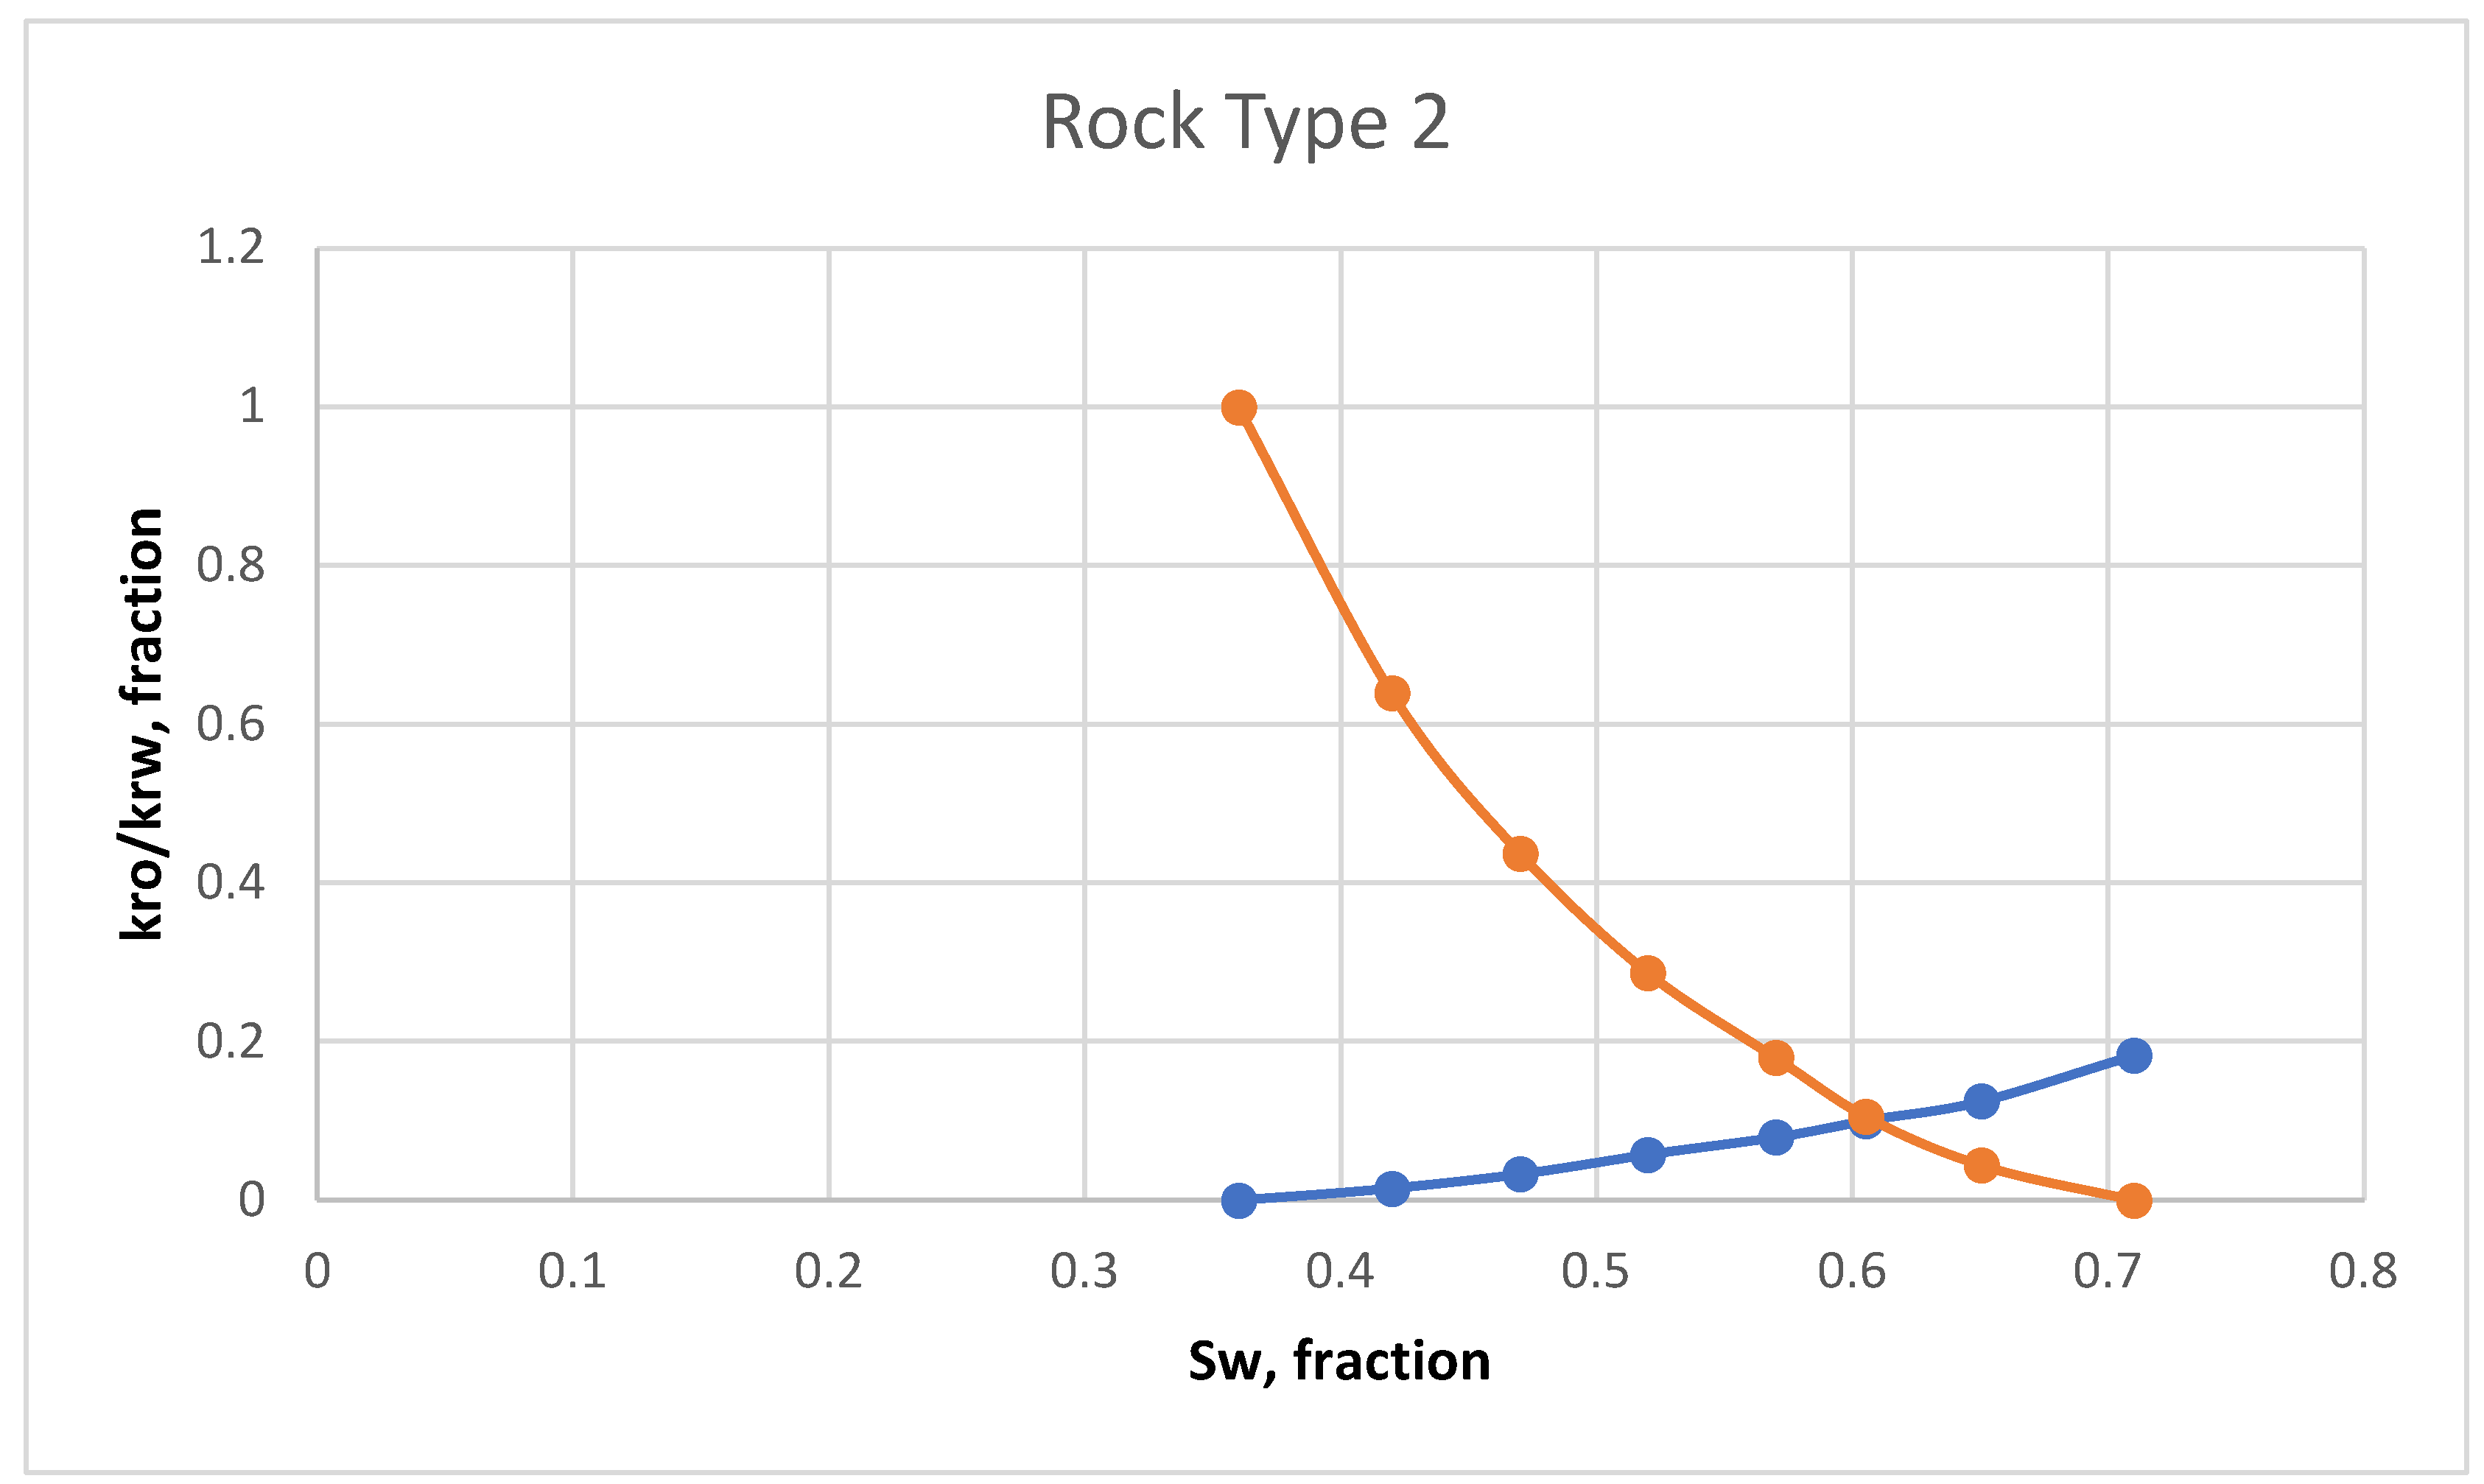
Figure 6.
Oil production by CO2-WAG injection process.
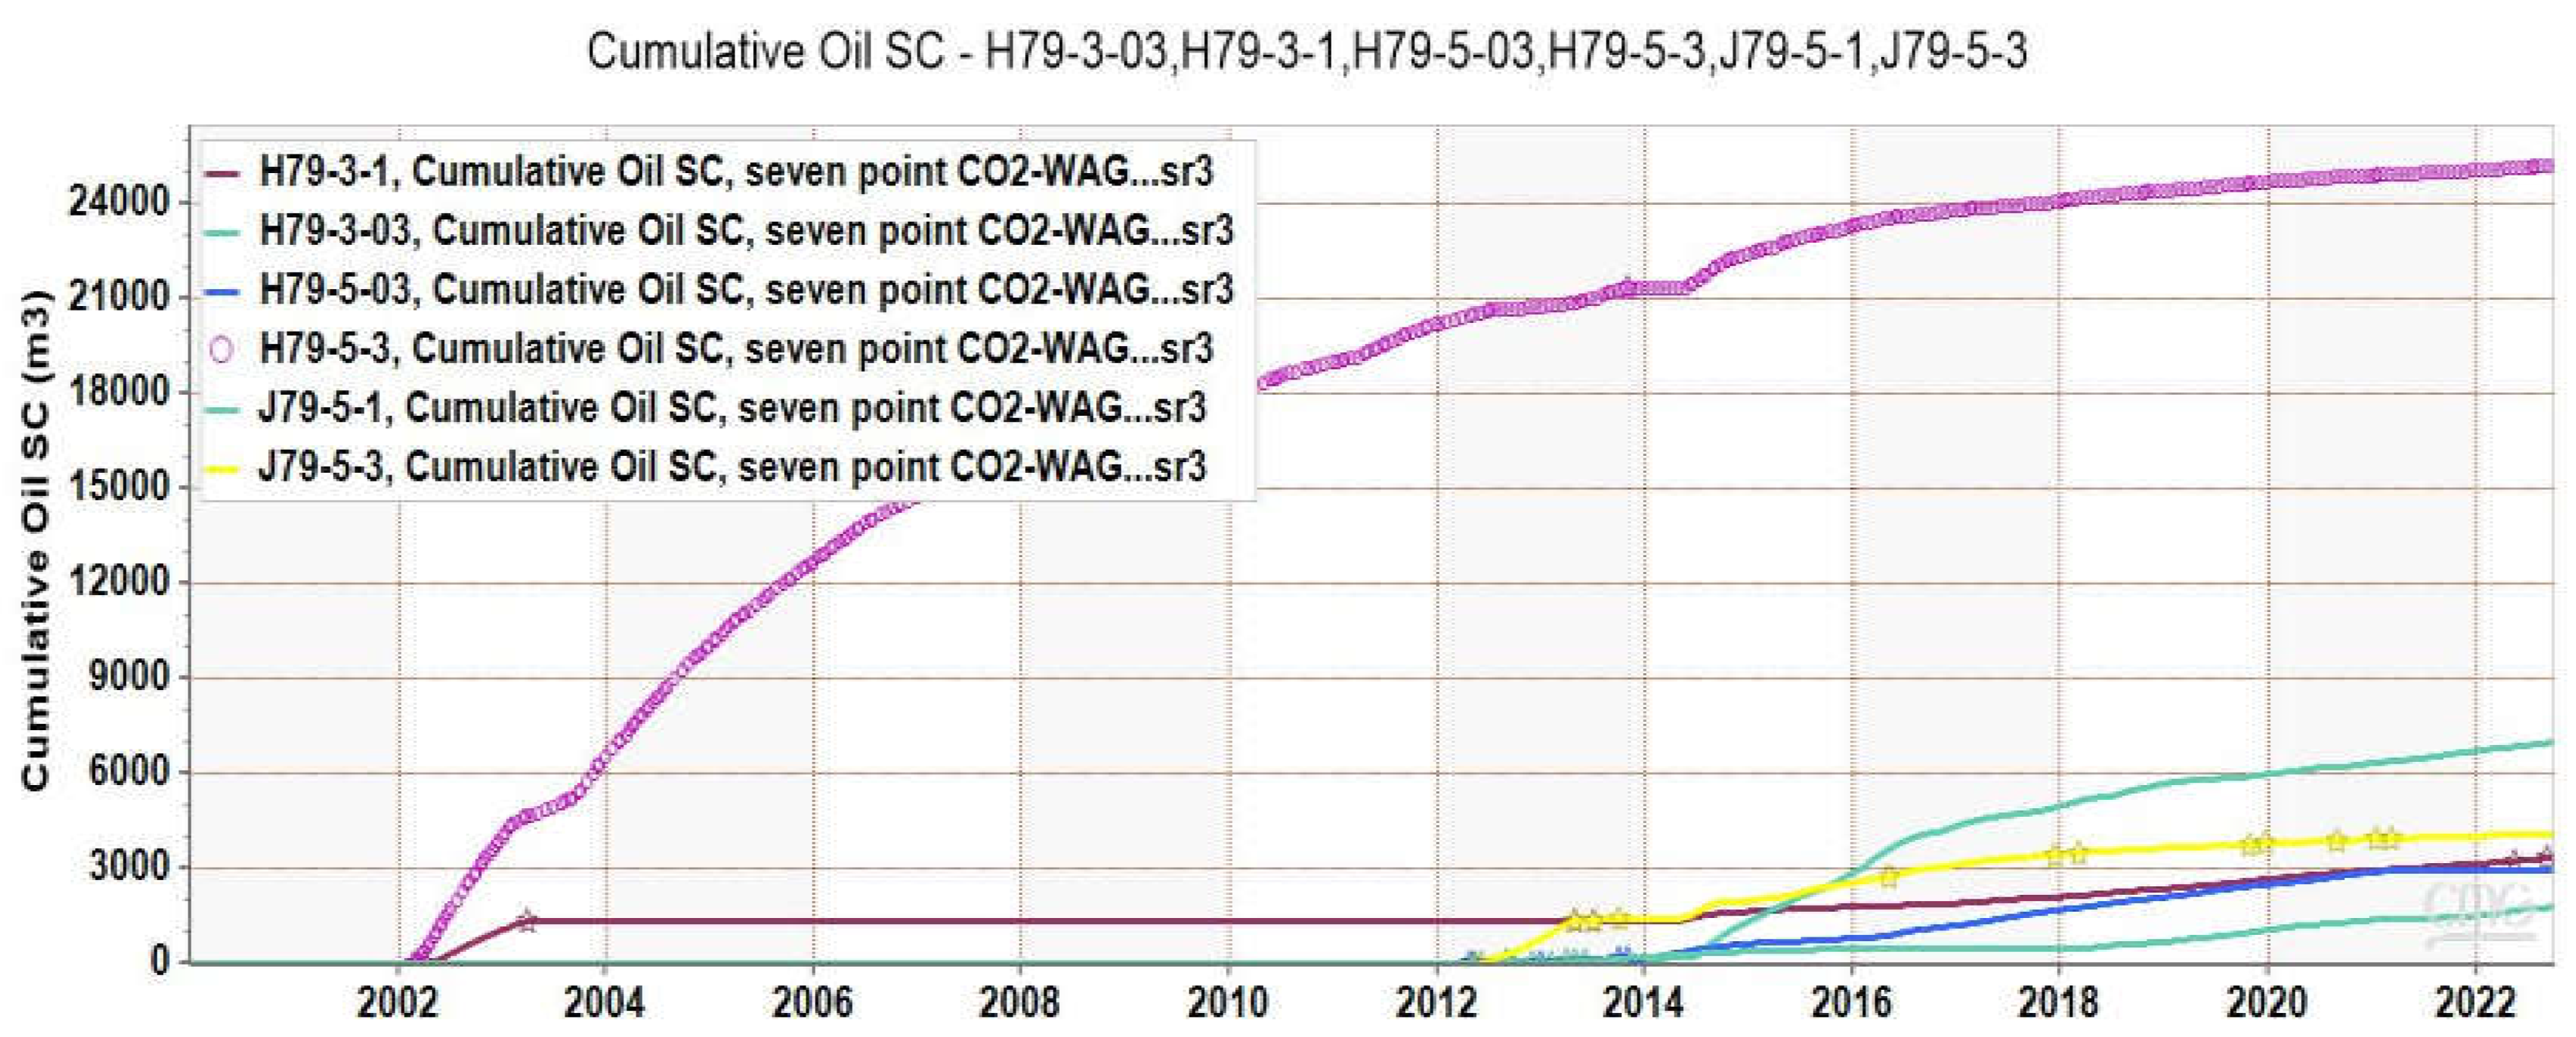
Figure 7.
Cumulative CO2 injection during continuous CO2 flooding and CO2-WAG.
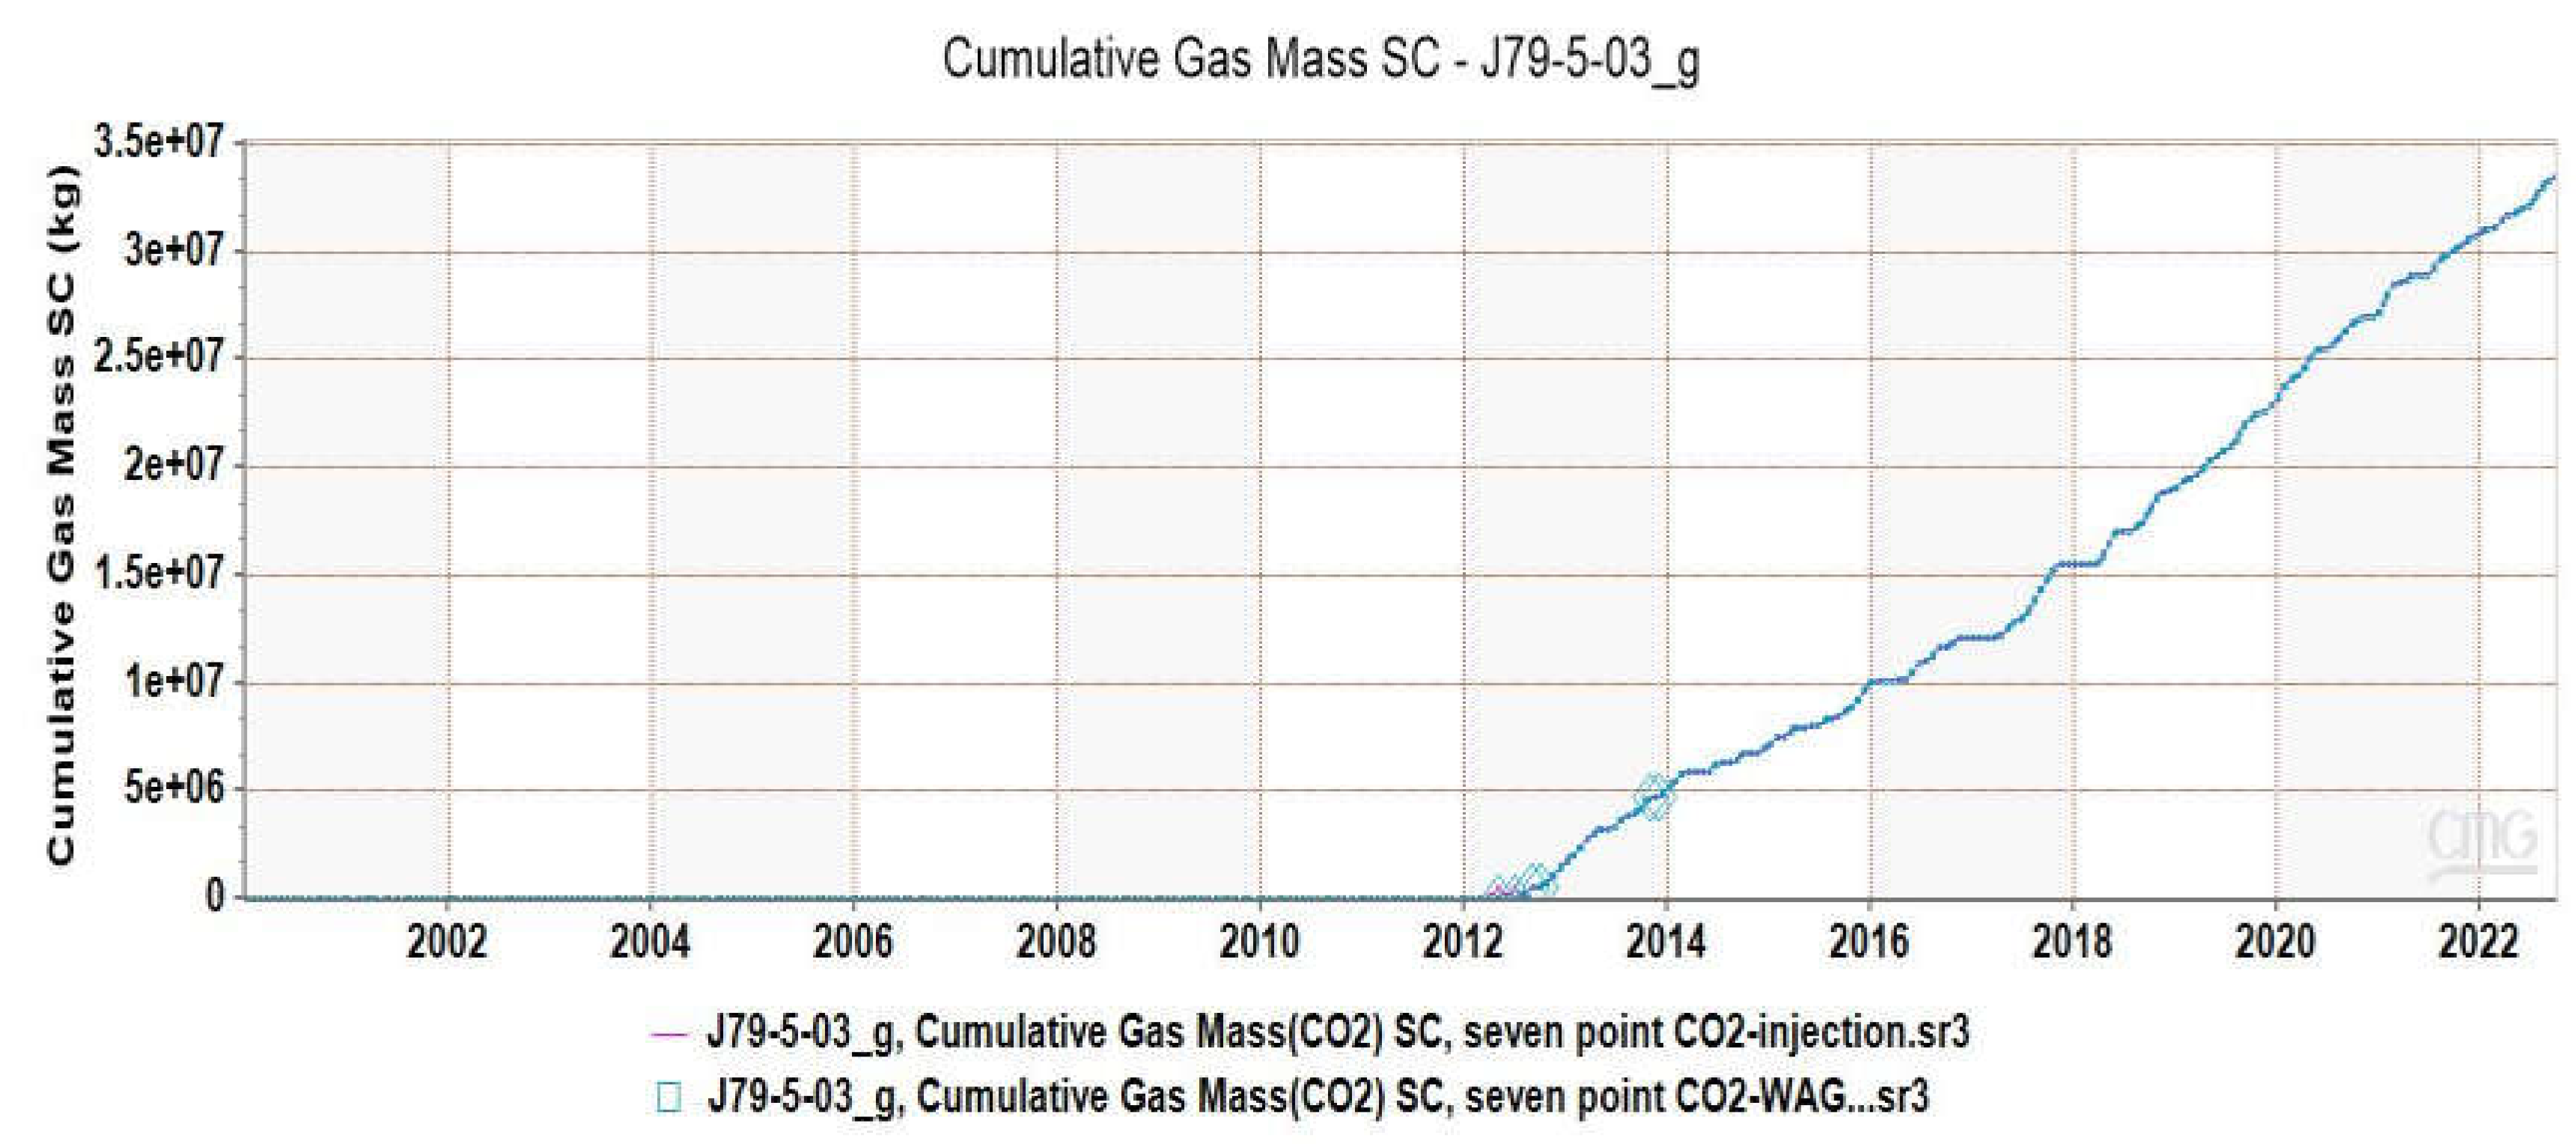
Figure 8.
Cumulative water injection during continuous water flooding and CO2-WAG.
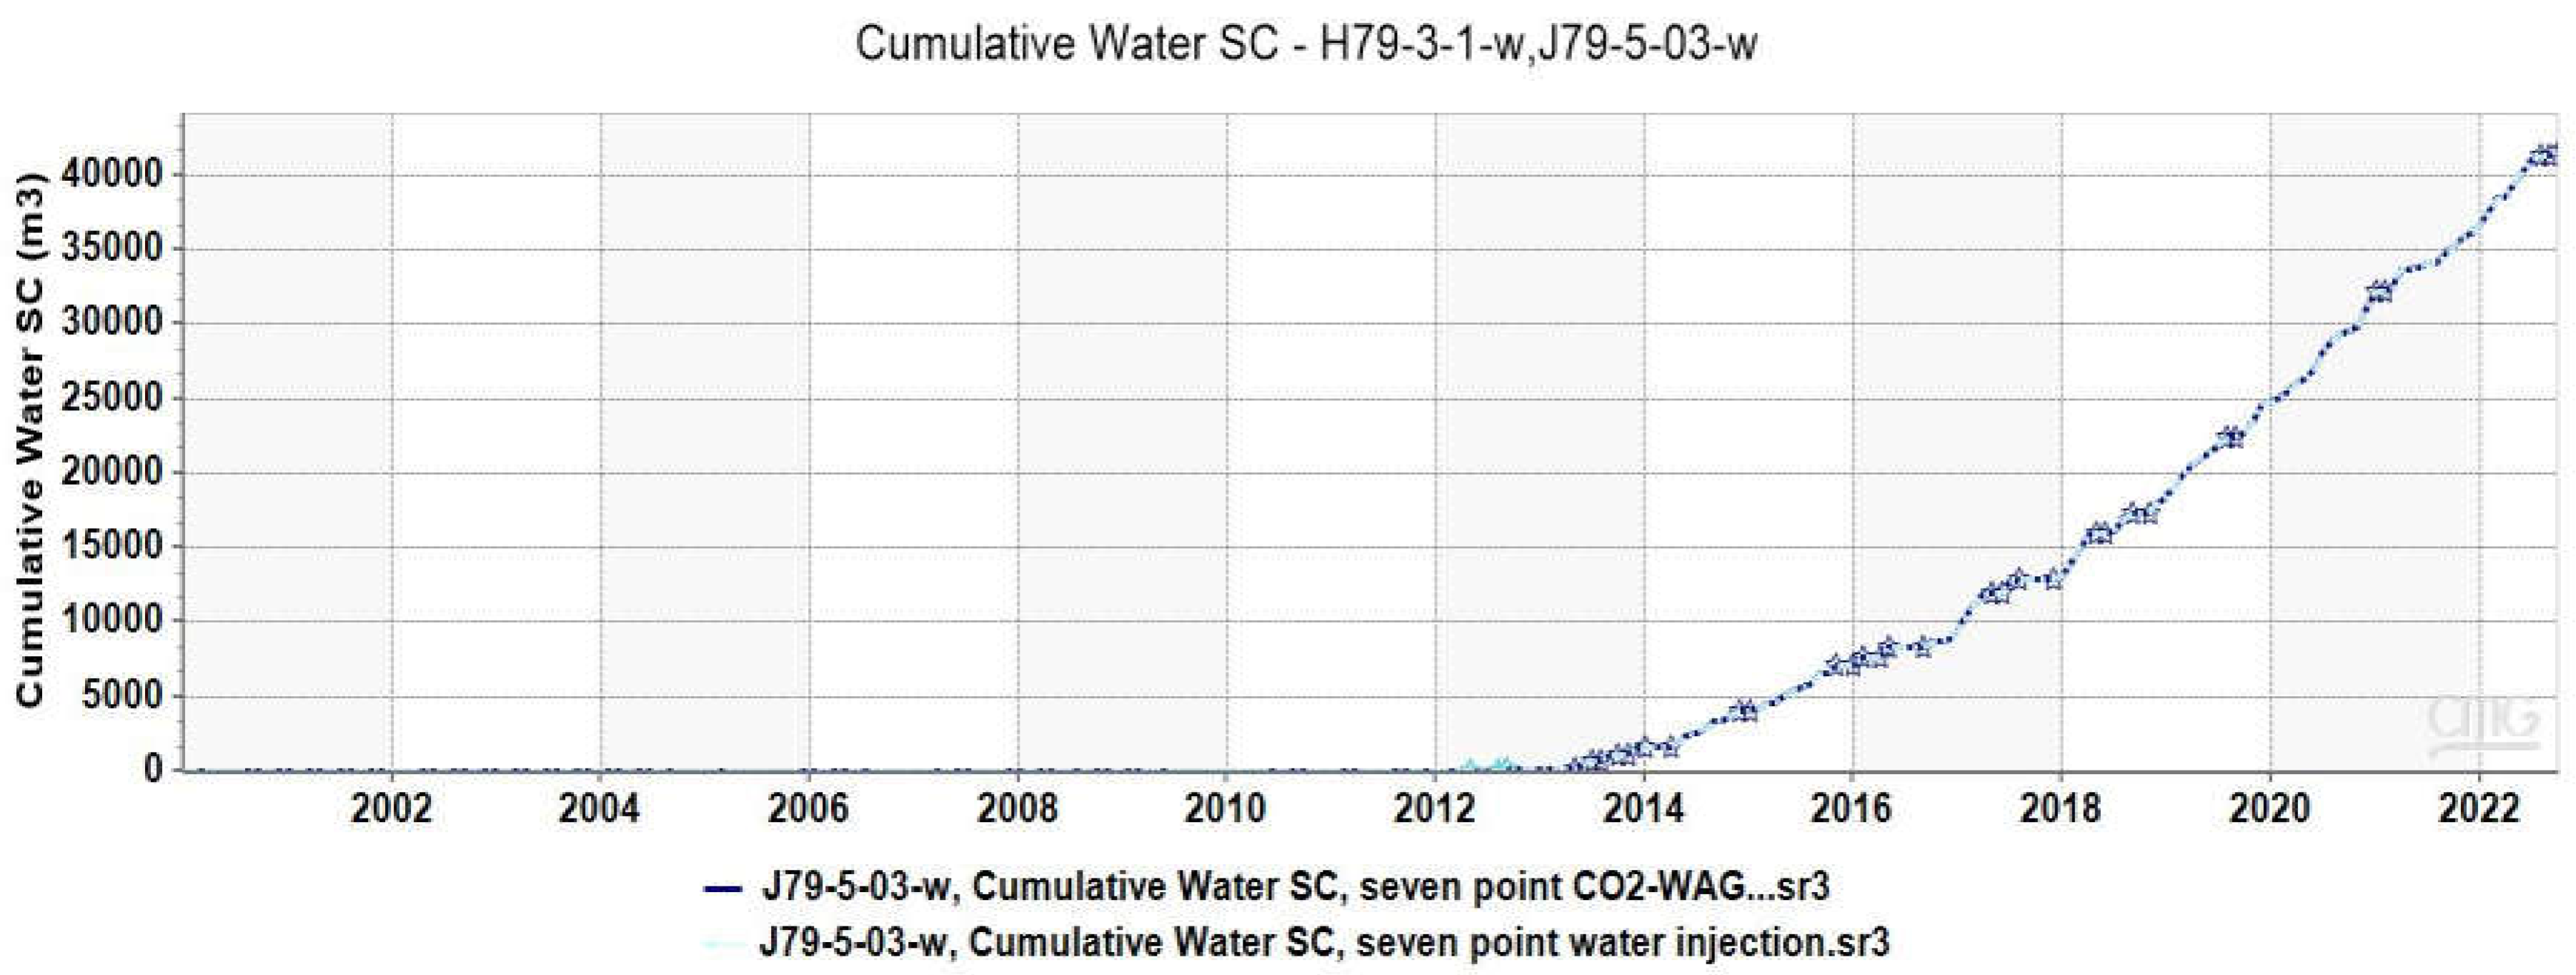
Figure 9.
Cumulative water injection during continuous water flooding and CO2-WAG.
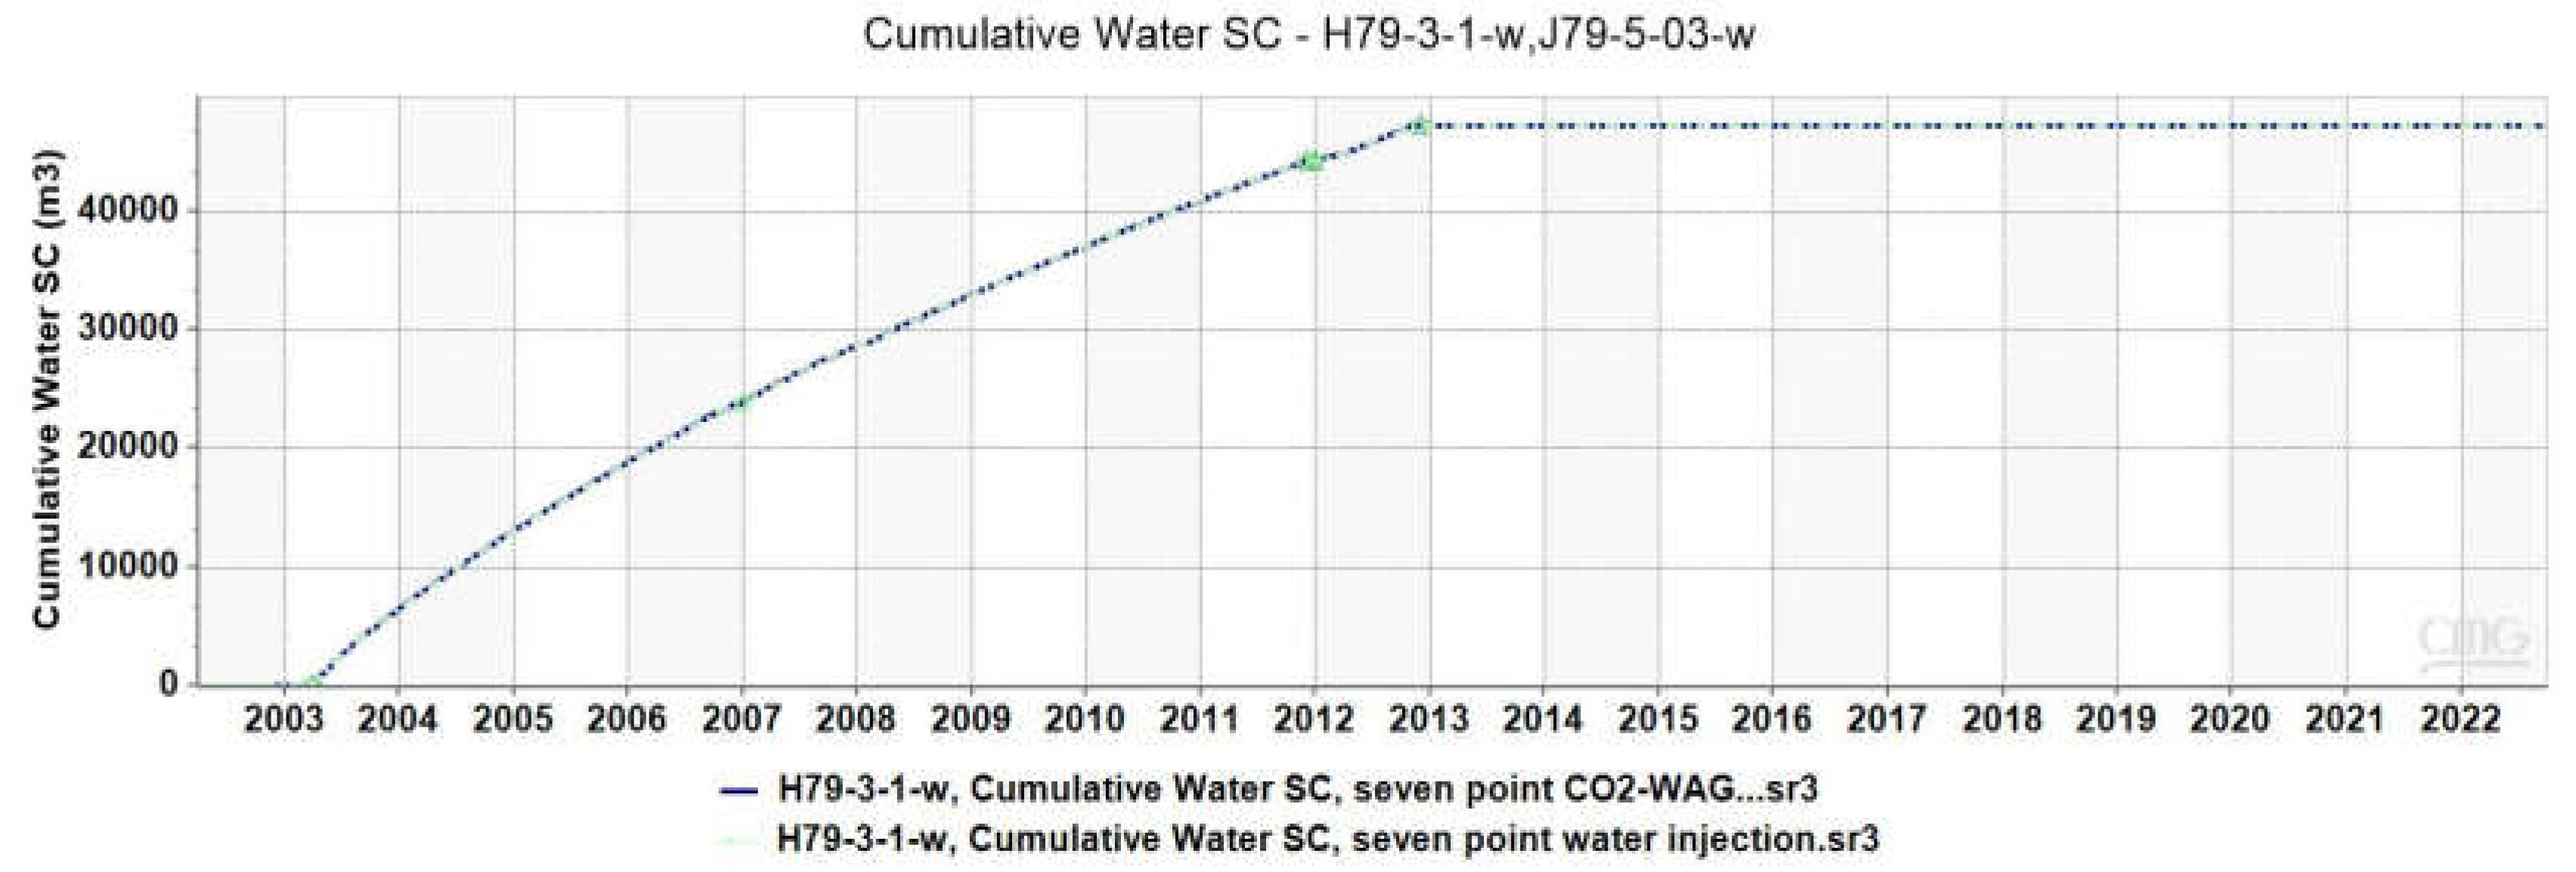
Figure 10.
Oil production rate during continuous CO2 flooding, CO2-WAG, and water flooding techniques for the water-wet system.
Figure 10.
Oil production rate during continuous CO2 flooding, CO2-WAG, and water flooding techniques for the water-wet system.
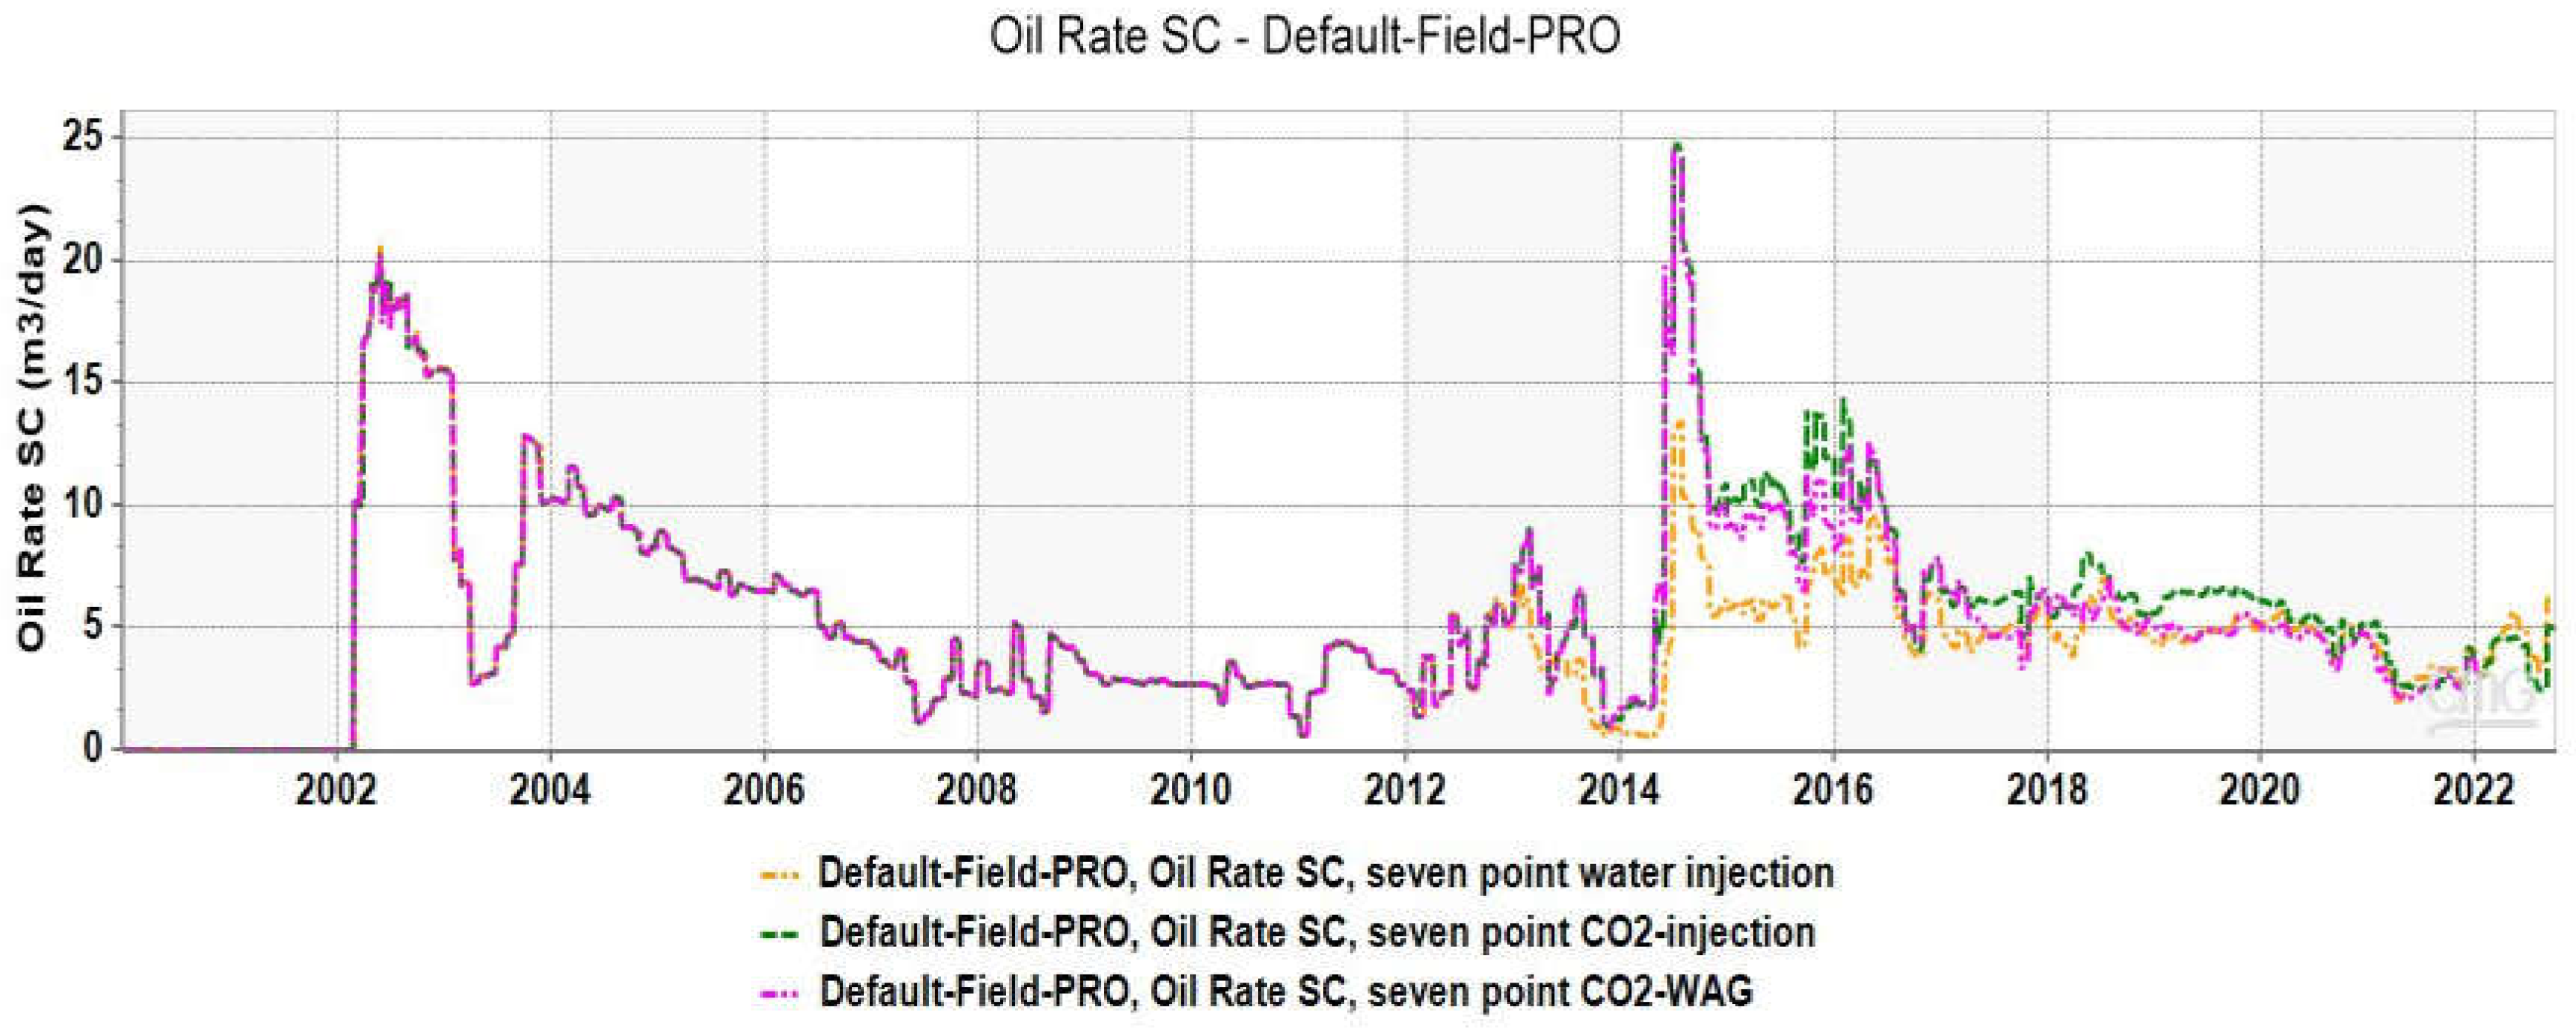
Figure 11.
Cumulative oil production through continuous CO2 flooding, CO2-WAG, and water flooding techniques in a water-wet system.
Figure 11.
Cumulative oil production through continuous CO2 flooding, CO2-WAG, and water flooding techniques in a water-wet system.
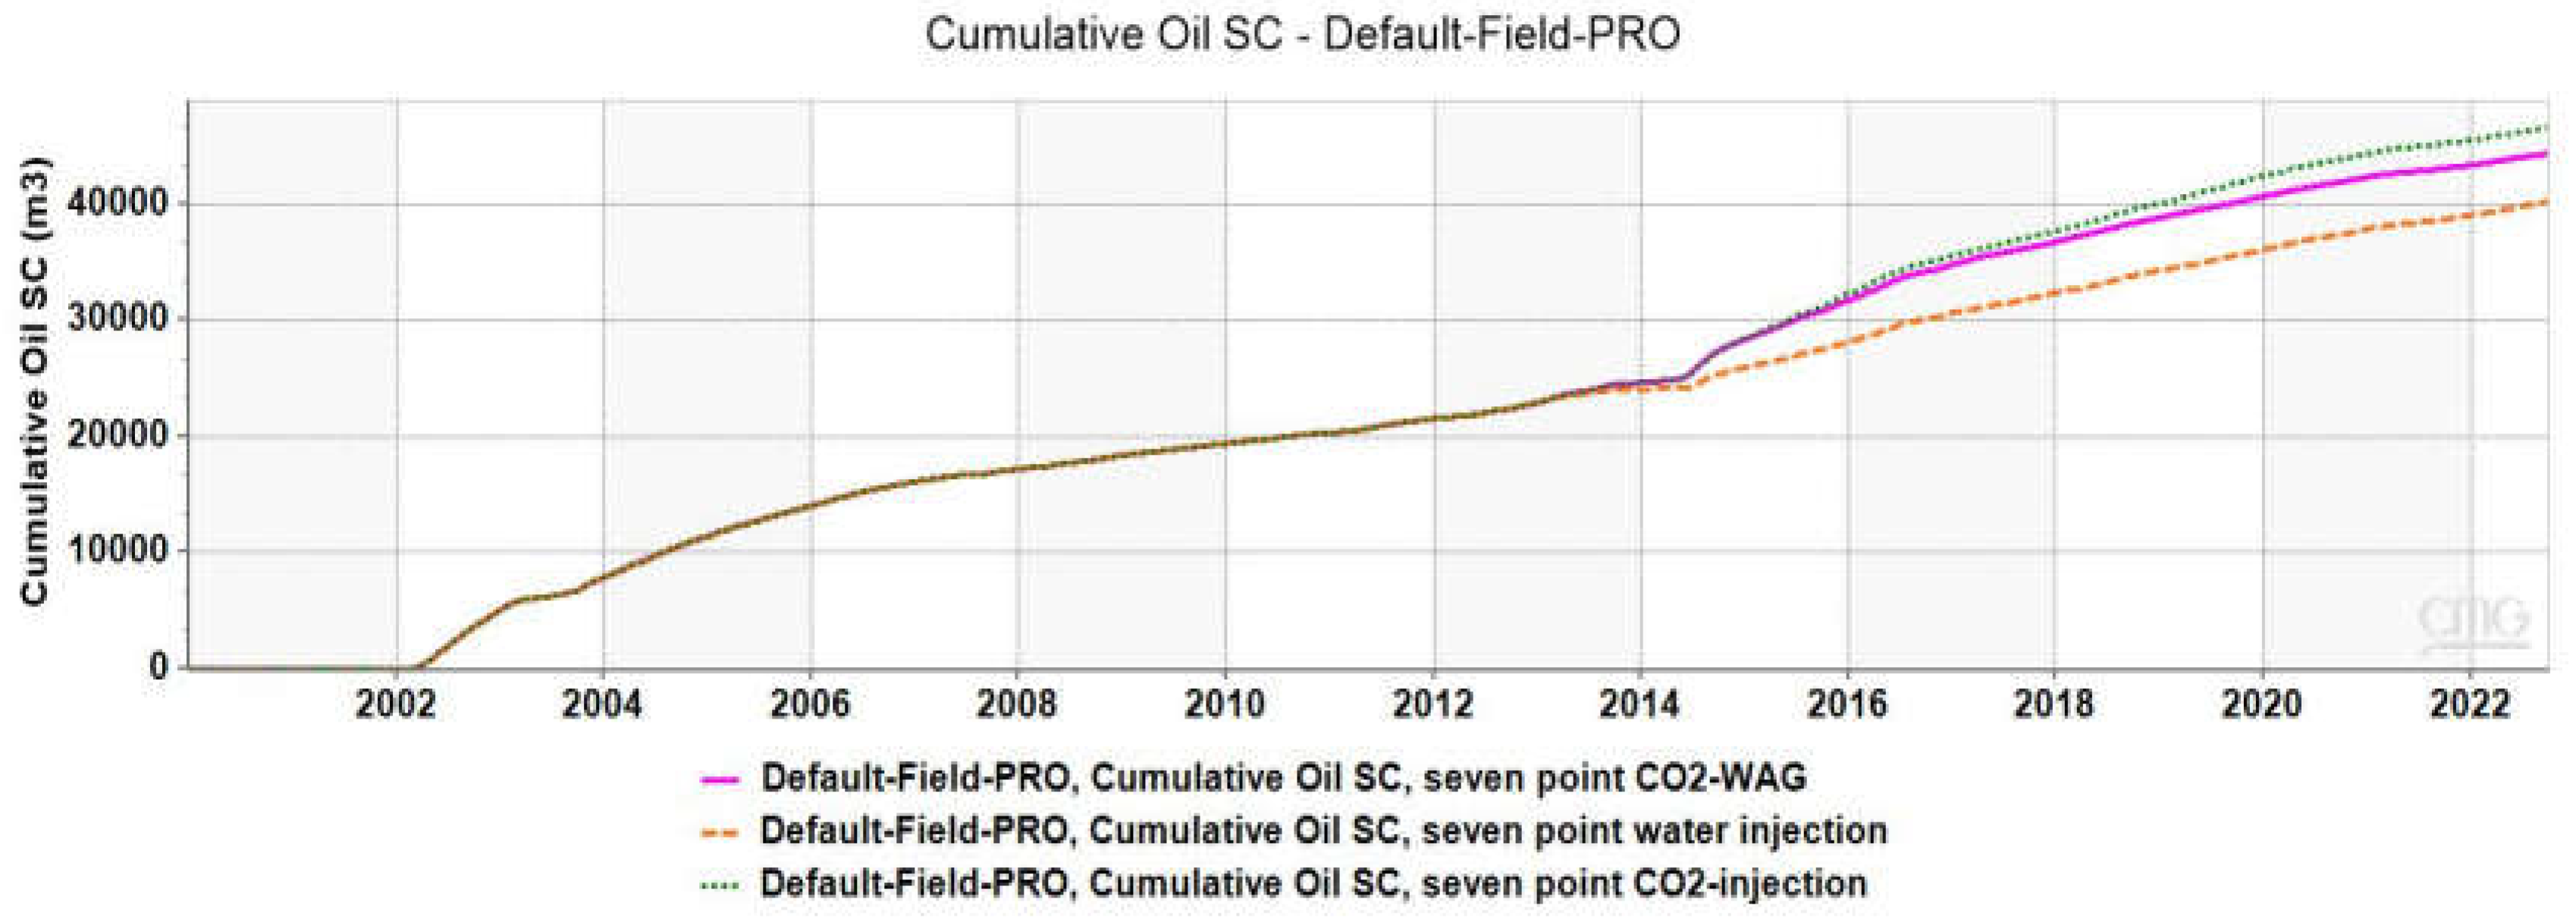
Figure 12.
Gas oil ratio during continuous CO2 flooding and CO2-WAG flooding techniques.
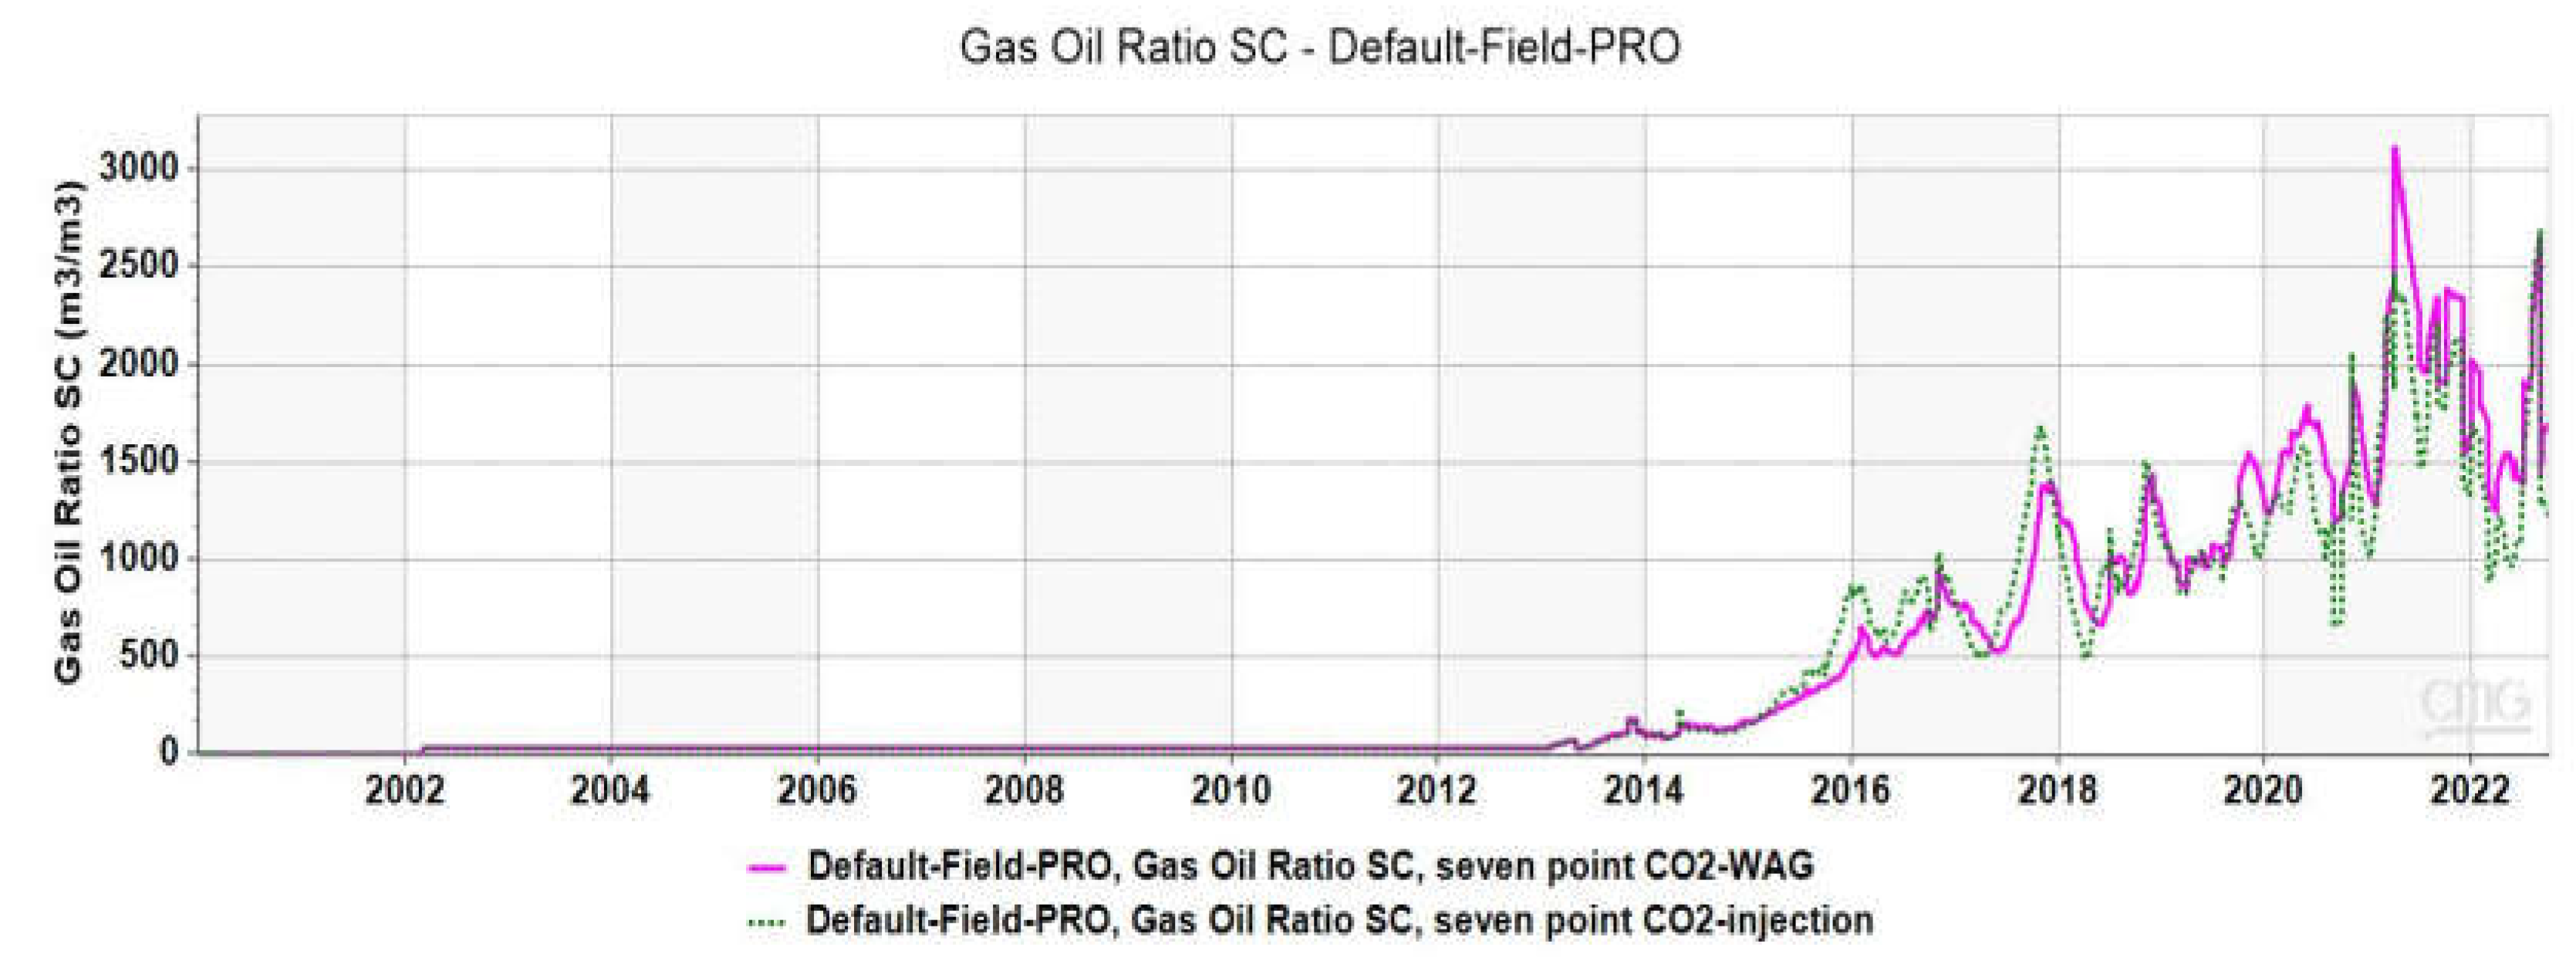
Figure 13.
Water cut during continuous CO2 flooding and CO2-WAG flooding techniques in the water-wet system.
Figure 13.
Water cut during continuous CO2 flooding and CO2-WAG flooding techniques in the water-wet system.
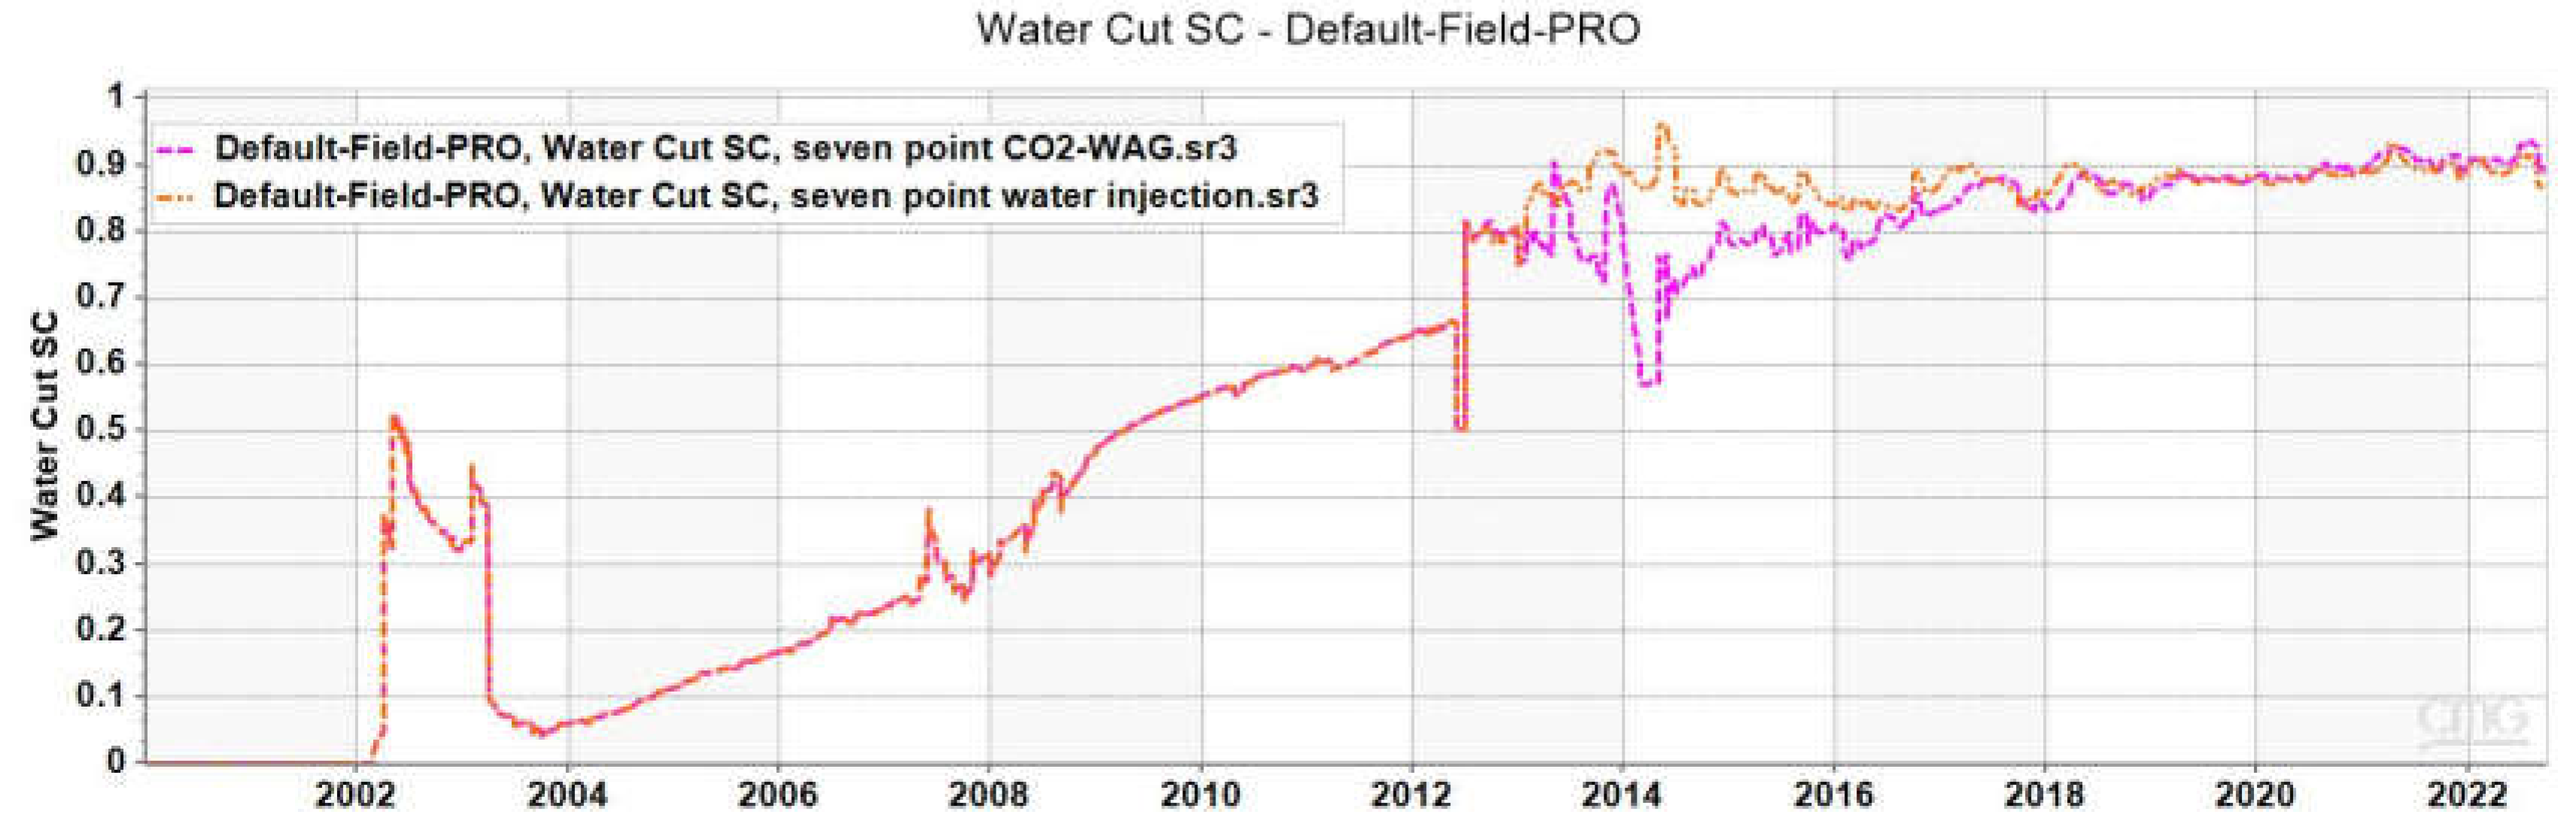
Figure 14.
Oil production rate during continuous CO2 flooding, CO2-WAG, and water flooding techniques for mixed-wet system.
Figure 14.
Oil production rate during continuous CO2 flooding, CO2-WAG, and water flooding techniques for mixed-wet system.
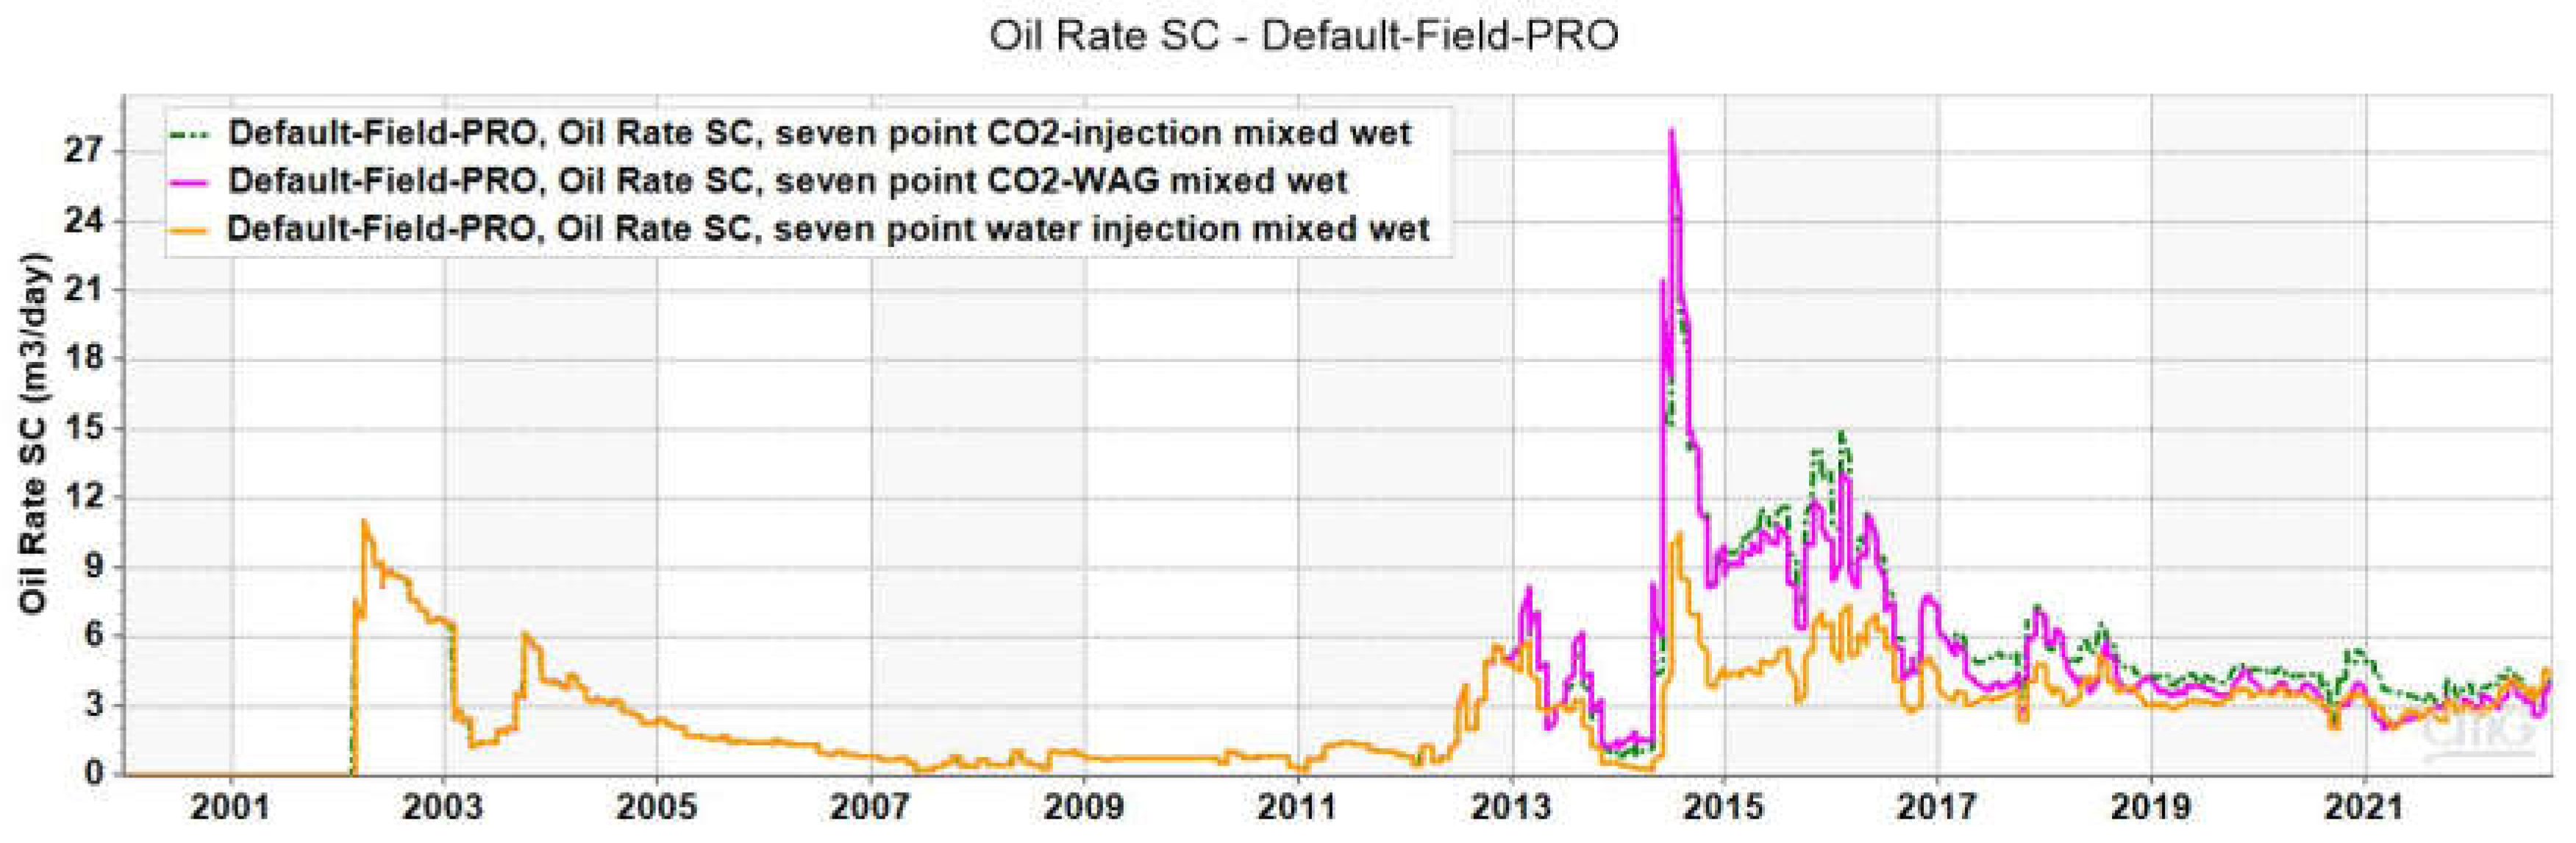
Figure 15.
Cumulative oil production through continuous CO2 flooding, CO2-WAG, and water flooding techniques for mixed-wet systems.
Figure 15.
Cumulative oil production through continuous CO2 flooding, CO2-WAG, and water flooding techniques for mixed-wet systems.
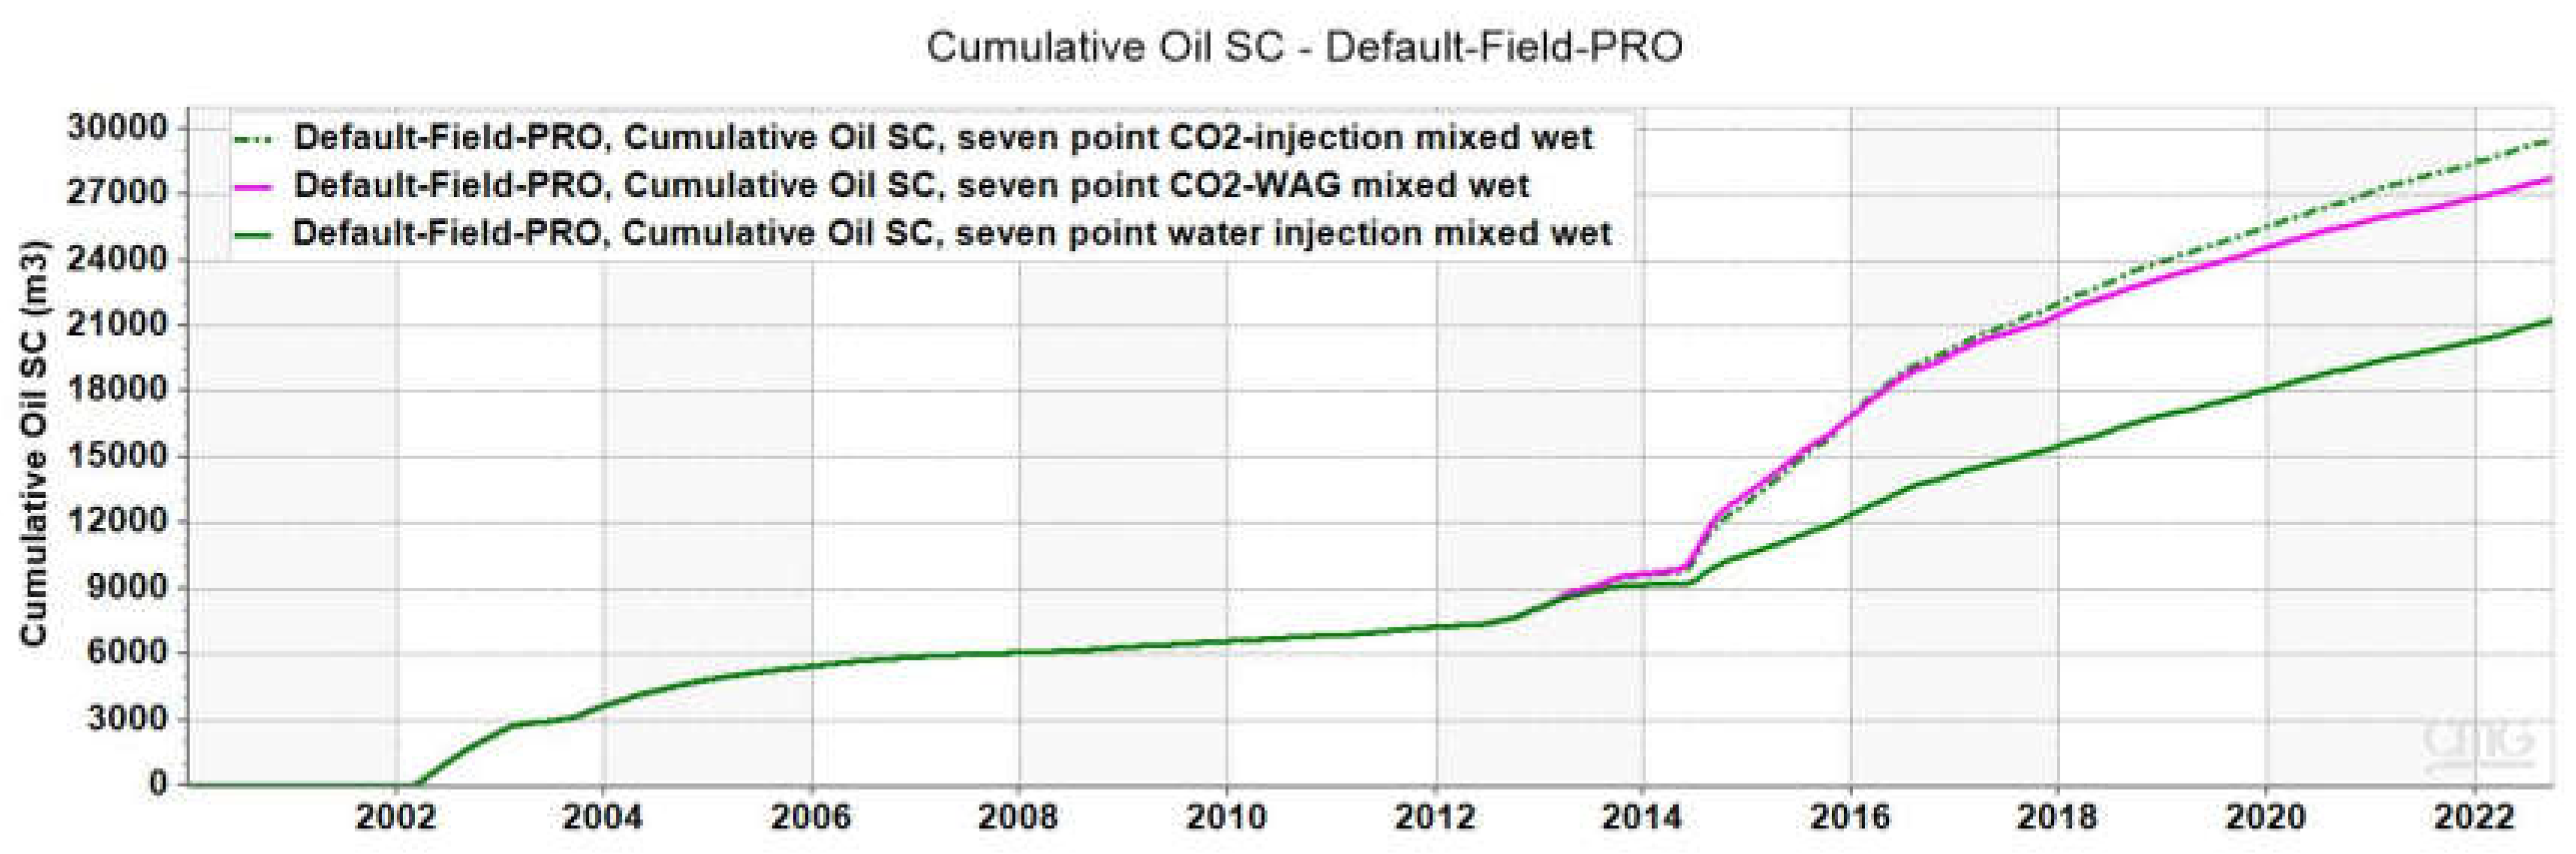
Figure 16.
Gas oil ratio during continuous CO2 flooding and CO2-WAG flooding techniques in mixed-wet system.
Figure 16.
Gas oil ratio during continuous CO2 flooding and CO2-WAG flooding techniques in mixed-wet system.
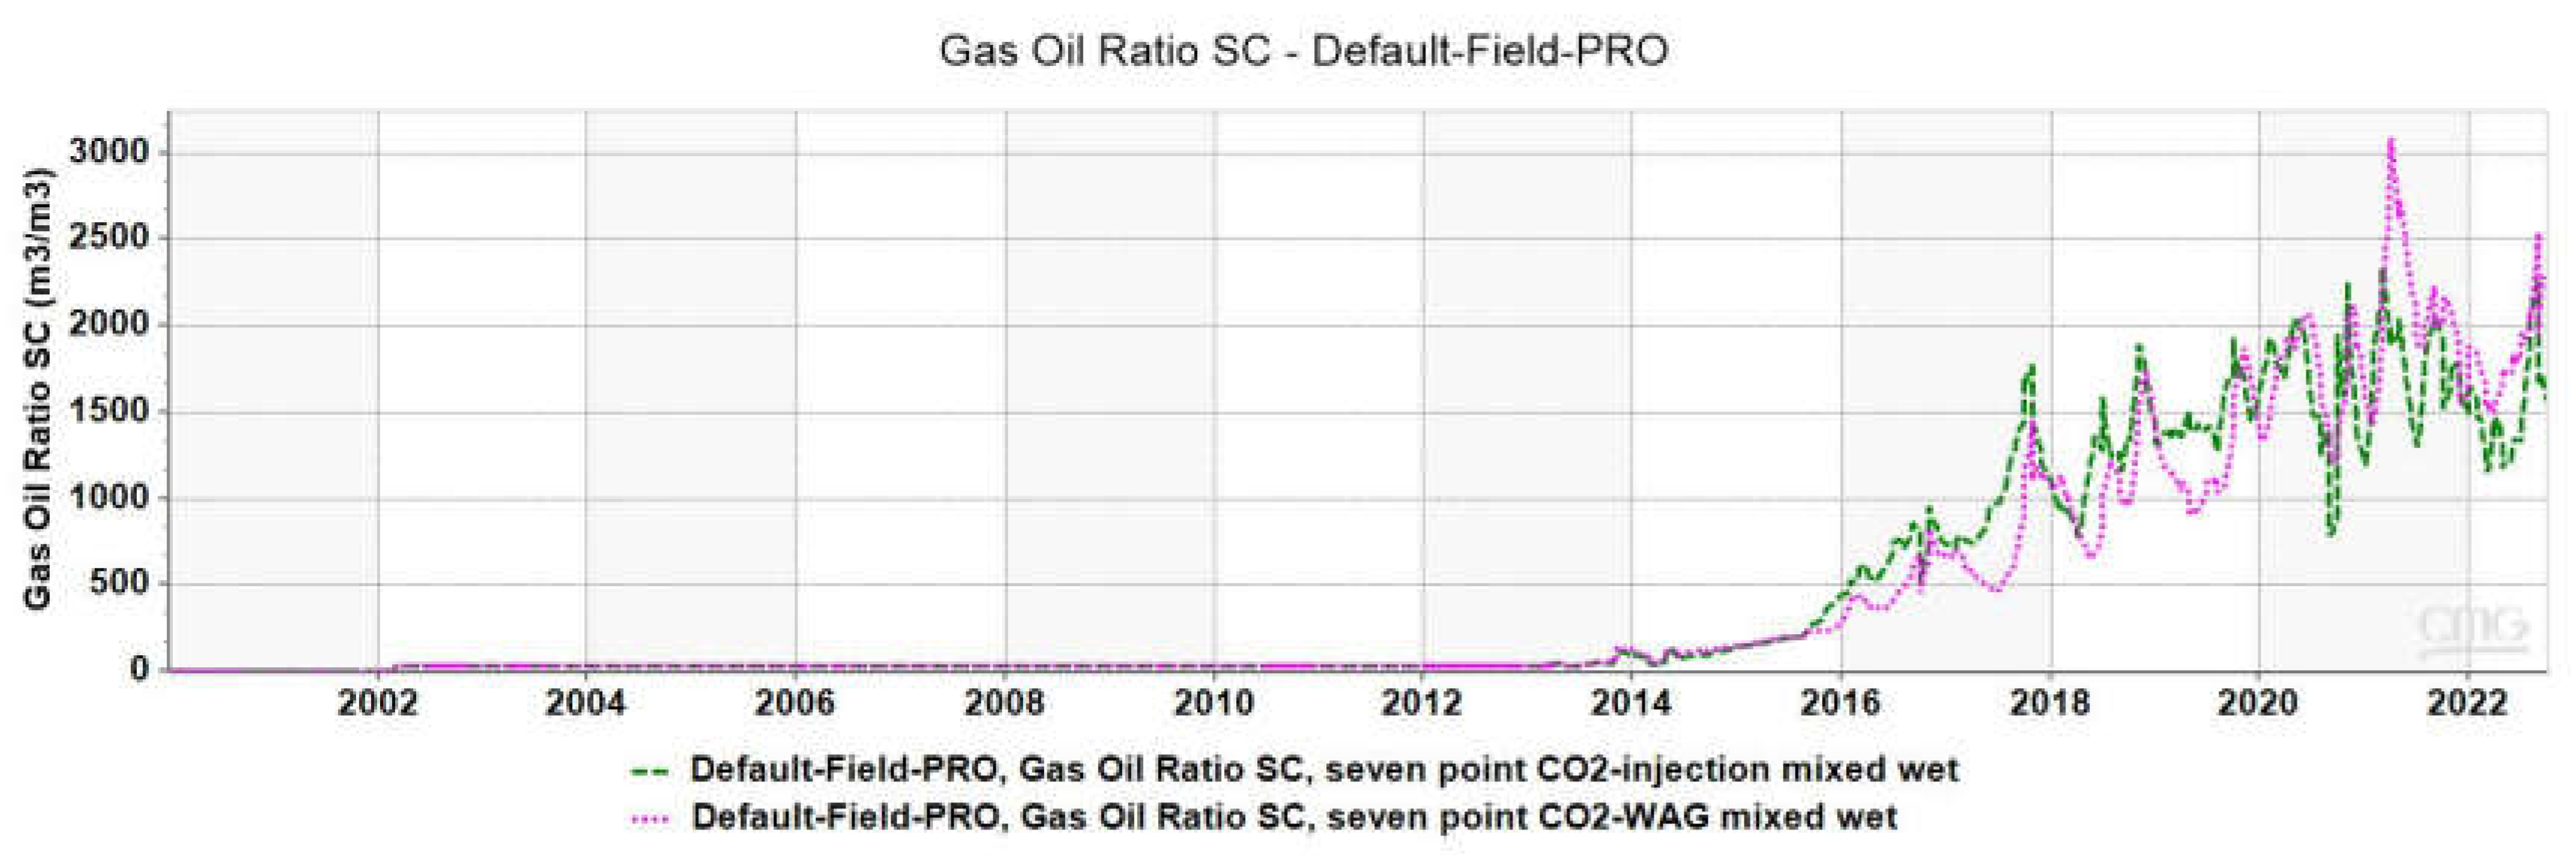
Figure 17.
Water cut during continuous CO2 flooding and CO2-WAG flooding techniques in mixed-wet system.
Figure 17.
Water cut during continuous CO2 flooding and CO2-WAG flooding techniques in mixed-wet system.
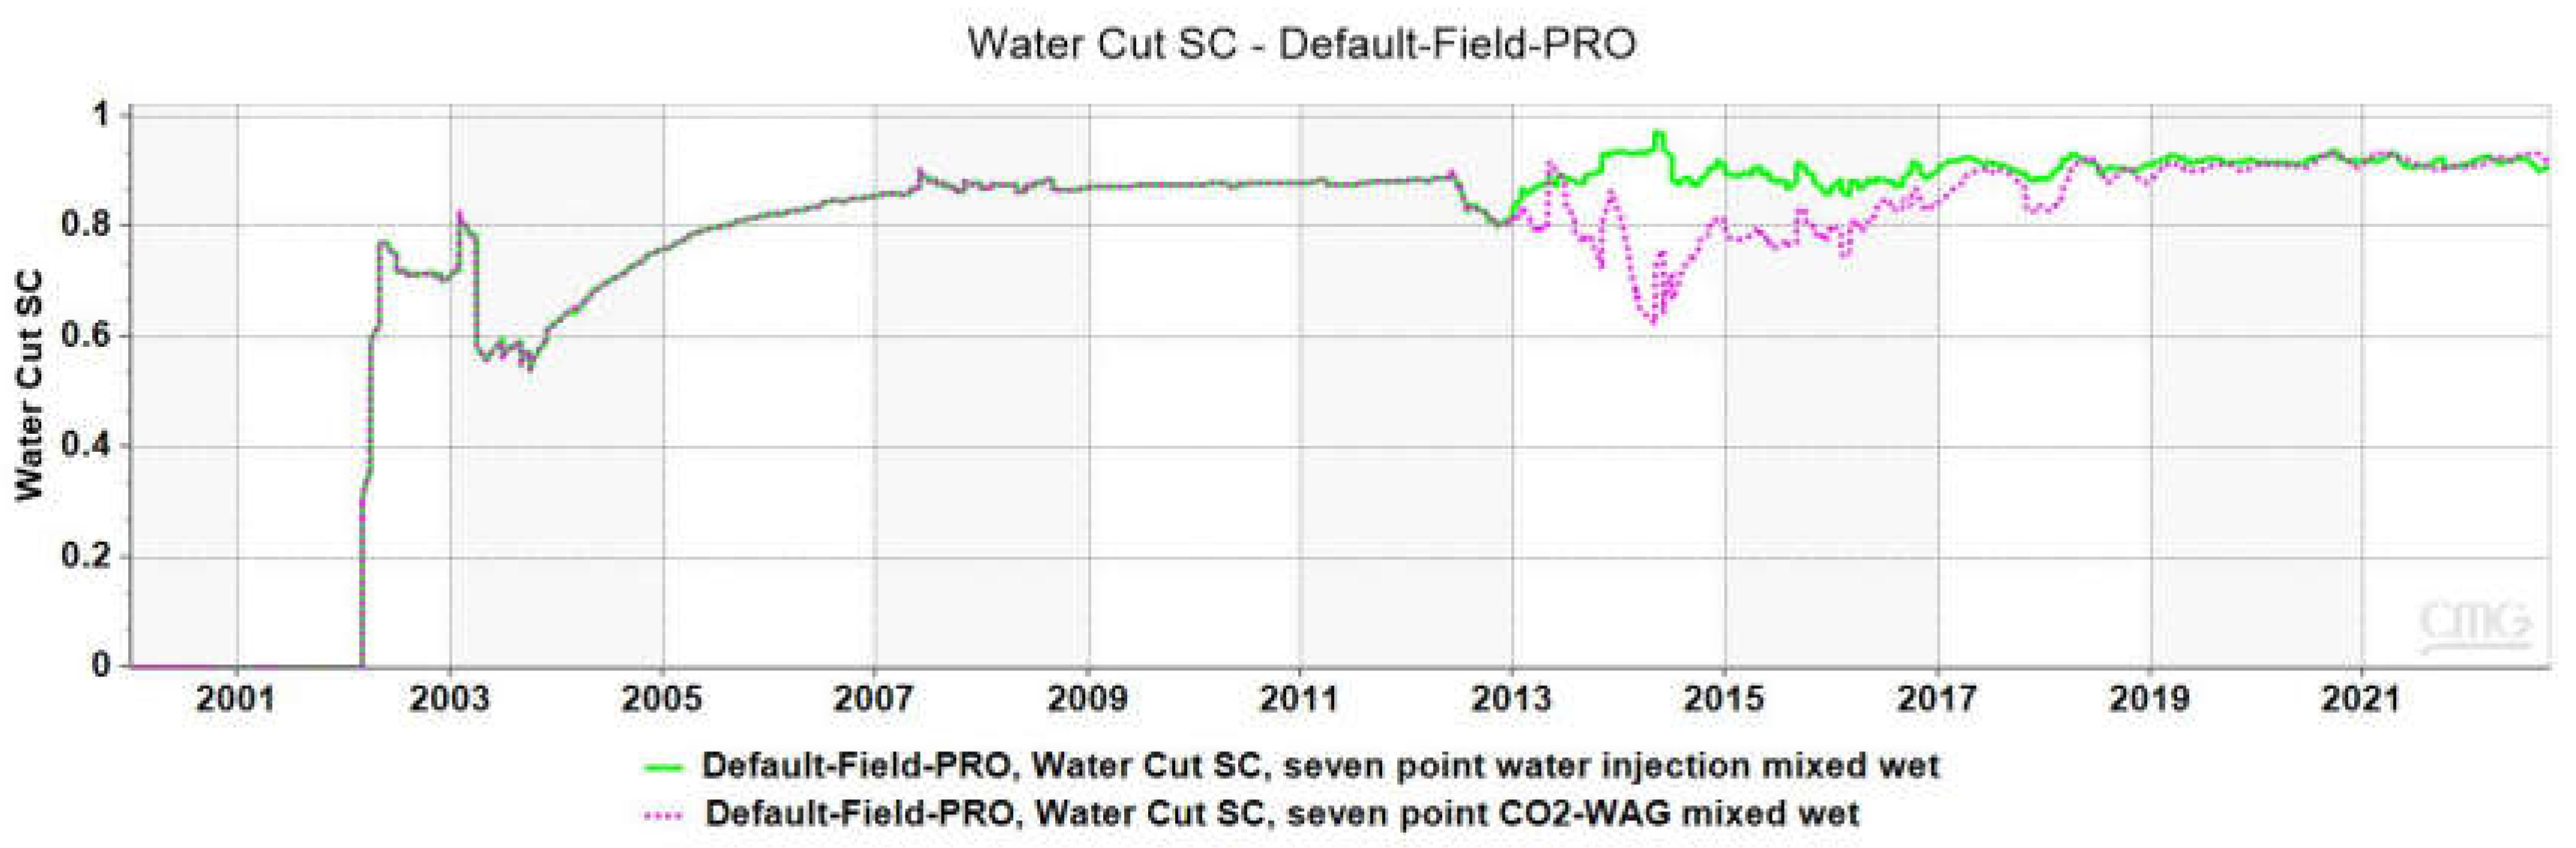

Table 1.
Oil recovery factors for water-wet and mixed-wet systems.
| Injection methods | Water-Wet System | Mixed-Wet System |
| CO2-WAG | 26 | 16.1 |
| CO2-flooding | 27.2 | 17.2 |
| Water Flooding | 23.6 | 12.4 |
Disclaimer/Publisher’s Note: The statements, opinions and data contained in all publications are solely those of the individual author(s) and contributor(s) and not of MDPI and/or the editor(s). MDPI and/or the editor(s) disclaim responsibility for any injury to people or property resulting from any ideas, methods, instructions or products referred to in the content. |
© 2025 by the authors. Licensee MDPI, Basel, Switzerland. This article is an open access article distributed under the terms and conditions of the Creative Commons Attribution (CC BY) license (http://creativecommons.org/licenses/by/4.0/).
Copyright: This open access article is published under a Creative Commons CC BY 4.0 license, which permit the free download, distribution, and reuse, provided that the author and preprint are cited in any reuse.


