1.0. Introduction
Researchers and sports training professionals commonly seek to understand and optimize physical performance in athletes and recreational practitioners across different sports modalities [
1,
2,
3,
4]. Therefore, the understanding that the ability to increase our physical and competitive performance, in general, is dependent and better explained by its determining variables [
5,
6,
7]. In the case of long-distance running, economy of movement, a variable expressed by the balance between submaximal oxygen consumption and the energy expended at a given stable velocity, appears to be the most relevant component for sporting success [
8,
9,
10,
11]. However, endurance or short-duration running itself also has a close relationship with the velocity indexes associated with the occurrence of VO
2Max [
7], anaerobic energy pathways [
12] and strength production capacity [
13,
14,
15,
16,
17,
18,
19].
Strength training has been shown to be an effective strategy for improving running performance [
20], and its effects seem better associated with neural adaptations than actual structural elements [
9,
10,
11,
14]. Previous studies had already established the relationship between absolute maximum strength or strength relative to body mass with running performance, reinforcing the perspective of positive interference of muscular strength on aerobic performance, suggesting that the greater the external load lifting capacity, the shorter the running time would be; however, sprinting skills were mainly analyzed [
14,
15,
16,
17,
18,
19,
21]. Determining how much maximum strength interferes with and explains variations in running performance, whether aerobic or anaerobic, although not a new subject, remains inconclusive, especially for endurance performance. Furthermore, we do not know whether the development of maximum strength would produce the same associations across different levels of physical capacity, which leads us to explore the topic from a new perspective.
Movement professionals understand that strength is therefore a relevant element to include in a training program [
20,
22]. Despite that, defining which exercise patterns would best associate with running performance still requires research. Historically, exercises with kinematic patterns involving simultaneous hip, knee and ankle extension, such as squat (SQ) and its derivatives, with different manifestations of strength, are used as a predictive mechanism for running performance [
13,
15,
16,
18,
19,
21,
23], explained mainly under a movement mechanics analogous to running.
On the other hand, based on the descriptive rationale of the movement and the specificity, other kinematically similar exercises, such as the Deadlift (DL) movement, could demonstrate viability as a predictive strategy [
24]. Although they are kinematically similar movements, particularities are observed when their kinetics are documented by Choe et al., [
25]. The authors demonstrate that the DL exercise presents a higher peak joint torque on the hip extensors, compared to the squat (3.59 vs. 2.98 Nm·kg
−1,
d = 0.81, p < 0.001), while the SQ exercise presents a higher peak joint moment on the knees (2.14 vs. 1.18 Nm·kg
−1,
d = 1.44 p < 0.001) [
25].
Despite this understanding, no study to date has established the associative capacity of DL to explain running performance, with only jumping performance being investigated [
24], which requires analysis. Furthermore, understanding that both movements produce particular kinetics, but that they are commonly required in the running pattern, we speculate that the sum of the absolute external loads between DL and SQ could complement each other and better explain the aerobic and anaerobic running performance; however, this perspective still requires investigation. Furthermore, to our knowledge, there are no studies that have developed and validated equations to estimate aerobic and anaerobic performance based on absolute and relative maximum strength.
Therefore, the primary objective of this study was to establish the relationship between maximum force production, represented by the maximum amount of external load lifted (kg), and normalized by body mass (BM1.0) in DL and SQ exercises, in order to analyze whether the anaerobic performance of MART (maximal anaerobic running test) and maximum progressive aerobic (VPeak) could be satisfactorily estimated through strength, for individuals stratified into high strength scores and low strength scores. Secondarily, we will analyze whether the sum of absolute loads (DL + SQ workload) would present a better predictive value for aerobic and anaerobic performance than individual loads, both for individuals with high strength scores and for those with low strength scores. Thus, we developed and investigated the validity of prediction equations for aerobic and anaerobic performance based on absolute and relative maximum strength. Finally, we will establish the reliability of maximum strength (RM) measurements.
Our hypothesis (H1) is that the regressive model will present significant predictive outcomes for individuals with high and low strength scores, both for DL and SQ movements analyzed by absolute loads and for loads allometrically relativized by BM1.0. In addition, we believe that the sum of DL and SQ loads can produce better coefficients of determination than individual DL and SQ loads to estimate anaerobic and aerobic performance in laboratory tests (H2). Finally, 1RM determinations will present excellent correlation coefficients (H3).
Subsequently, a second stage of data collection aimed to perform cross-validation of the generated equations. We believe that the equations will present a significant association between the real and predicted measurements (H1’).
2.0. Materials and Methods
2.1. Experimental Approach
This study was conducted based on the STROBE Statement guidelines for cross-sectional studies (
https://www.strobe-statement.org/checklists) and was divided into two distinct collections. The study followed Resolution 466/2012 of the National Health Council and was approved by the Research Ethics Committee (number – 3.858.767 – CAAE: 26916819.9.0000.5512). All participants were recruited by convenience, in a public call at a private university in the Midwest of Brazil, and signed a consent form containing pertinent information about the experimental procedures, as well as the possible risks and discomforts involved in the study. This information was also explained verbally in detail. After selection, acceptance and understanding of the risks inherent to physical exercise, all participants signed the consent form.
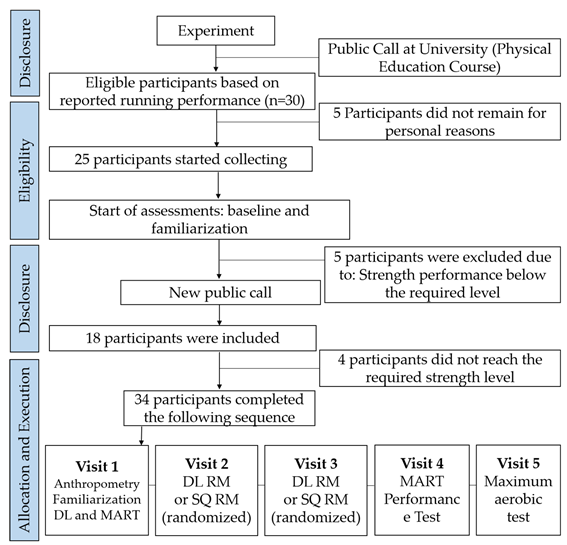
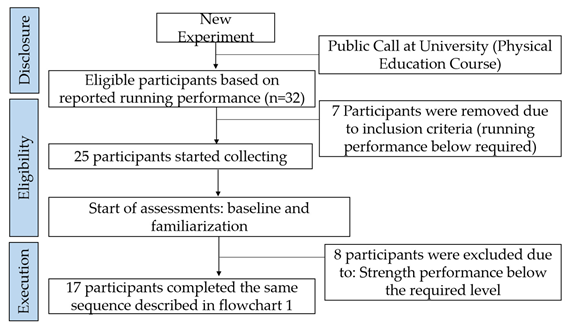
The first collection was a cross-sectional observational study and was established in a non-randomized and controlled manner. As a primary outcome measure, we analyzed the associative potential of the absolute strength of the DL and SQ exercises on the performance of maximal aerobic power and anaerobic power, as well as whether the allometric normalizations of the external loads relativized by body mass could better predict performance (H1). As a secondary outcome (H2), we focused on analyzing whether the sum of the absolute loads would be better associated with aerobic and anaerobic performance than the individual loads. Finally, we established the reliability of the strength measures (H3). Flowchart 1 presents the results of the recruitment, entry, eligibility and exclusion of the participants in the experimental collection.
A second cross-sectional observational characteristic collection was carried out, and the cross-validation of the equations produced was analyzed. Flowchart 2 presents the results of the recruitment, entry, eligibility and exclusion of participants from the experimental collection.
2.2. Study Design
2.2.1. First Data Collection (for the Development of the Equation)
Participants signed an informed consent form and came to the laboratory for a total of five visits. The first visit consisted of a characterization of the sample based on anthropometric procedures, as well as a maximum repetition (RM) test of the DL and SQ movements, as well as familiarization with the MART performance test. On the second visit, participants performed the RM of DL or SQ, applied in random order. On the third visit, a new RM of DL or SQ was performed, establishing the consistency of the measurement. The fourth visit consisted of the execution of the MART maximum performance test. Finally, on the last visit, the maximum progressive aerobic performance protocol was performed. During all visits, participants were encouraged to perform to the best of their ability. All procedures were performed at the same time of day and at a controlled temperature between 21 and 23º.
2.2.2. Second Data Collection (to Ttest the Validity of the Equation)
Participants signed an informed consent form and attended only four visits. The first visit consisted of determining the sample characteristics based on anthropometric procedures and a RM test of the DL and SQ movements (randomized). On the second visit, a new RM test of one of the movements was performed, as well as familiarization with the MART performance test. On the third and fourth visits, a maximum MART performance test and the maximum progressive aerobic performance protocol, were performed in random order. For all tests, there was encouragement to achieve maximum performance. All procedures were carried out at the same time of day and at a controlled temperature between 21 and 23º.
2.3. Sample
In the first collection, 34 university students, 12 of whom were women, recreationally trained for running, at low risk according to the risk stratification criteria proposed by the ACSM, and apparently healthy, were invited to participate in the present study after a public call at a university in the central-west of Brazil. The call took place during the period from August 2022 to January 2023.
In the second collection, 32 university students of 10 whom were women, recreationally trained, apparently healthy, were invited to participate in the study via a public call at a university in the central-west of Brazil. The second call took place during the period from January 2024 to May 2024.
For both collections, participants were included based on the levels of force relativized by body mass in the DL and SQ movements (between 1.0 and 2.5 kg/kg) and on recreational running performances for a distance of 5 KM (up to 30 min). However, for the second collection, only participants with less than 1.5 of external load ratio relativized by body mass in the movements in question were included [
26].
As exclusion criteria, participants who used substances that alter the cardiovascular system or substances that artificially promote improved strength, as well as recurrent previous injuries, were excluded. Participants who obtained strength levels lower than 1.0, considering the relationship between load and body mass, were considered beginners and were also eliminated from the study [
26]. All participants had the procedures agreed upon in advance and their doubts clarified.
The sample size was defined based on the parameters for linear regression: random model, considering the following attributes: Tail = Two; H1 = 0.4; alpha error = 0.05; Power = 0.95; Number of predictors = 2, resulting in a total sample of 34 participants.
2.4. Procedures
2.4.1. Morphological and Anthropometric Procedures
Standard measurements established by the International Society for the Advancement of Kinanthropometry (ISAK) were used, consisting of the following indicators: body mass and height (WELMY 110 CH, Brazil), as well as skinfold. The relative body fat was estimated using the skinfold technique, in which body density is calculated using the seven-fold protocol proposed by Jackson and Pollock [
27,
28] where values are collected at each point in a rotational sequence on the right side of the body and the average value of three measures is recorded. The measurements were performed by a single investigator using a skinfold compass (Slim Guide, Rosscraft, Canada). After calculating the body density, it was converted to a percentage of body fat using the equation proposed by Siri [
29].
2.4.2. One Repetition Maximum Test
To perform the 1 RM test, the participant was required to perform one repetition with the greatest possible load in the DL and SQ exercises. To do this, there was a progression and three attempts with a five-minute interval between them. For the Deadlift movement, the participants started with their arms aligned at shoulder width, feet at shoulder width and a pronated grip. The bar started from the floor with the knees and hips flexed, and the torso flexed forward. In the concentric phase, the bar is raised from the floor to the waist line. Attempts in which the participant was unable to establish the extended alignment position were not considered.
For the squat movement, each participant underwent a load progression and three attempts with a five-minute interval between them to determine 1 RM. Participants started with the bar on their backs, performing the eccentric phase of the movement during the downward movement to the lowest angles of the knee and hip. The concentric phase consisted of raising the bar to the starting point in full extension. Attempts in which the participants were unable to establish the alignment position in maximum extension were not considered.
Before the three attempts, participants performed a load progression as follows: a) standard warm-up with only the barbell weight (12 to 15 reps); b) one set of six to eight reps with 50% of the maximum load estimated by the volunteer (3-min interval); c) one set of three reps with 75% of the maximum load estimated (5-min interval). After the progression, the actual 1RM attempts began. Strong verbal encouragement was provided for all strength measurements.
2.4.3. Anaerobic Performance Test MART
A three-minute warm-up was performed at 5.0 km·h
-1 and without inclination. After the warm-up phase, progressive stimuli of 20 seconds and passive recovery of 100 seconds were performed, starting at 10.2 km·h
-1 with increments of 1.0 km·h
-1 at each stage with a fixed inclination of 12% until maximum voluntary exhaustion, adapted from the protocol of Rusko and Nummela et al., [
30]. The velocity corresponding to the last stage of the test was considered as the maximum MART velocity (vMART). In case of an incomplete attempt, the previous stage counted as the actual vMART [
5,
30,
31].
2.4.4. Progressive Maximal Effort Performance Test
The treadmill test was conducted in a laboratory environment with an initial velocity of 8 km·h-1 for 2 minutes. After the start, a load progression of 1 km·h-1 every 2 minutes was performed until the maximum effort was reached. VO2Max was estimated from the maximum velocity (VPeak) reached during the progressive maximal test, and estimated from the metabolic equation for running proposed by the American College of Sports Medicine (ACSM). Eq. 1 presents the predictive equation for determining VO2Max.
2.4.5. Allometry
The standard exponent was used for the body mass (BM) variable, scaling the relative strength to the 1.0 (Kg/BM1.0). Predictive analyses were performed based on all scenarios, normalized and non-normalized.
2.4.6. Stratification of Training Levels
To stratify participants between predictive strategy groups, values greater than 1.8 for the DL exercise and 1.5 for the SQ exercise were considered, as suggested by Santos Junior et al., [
26] for advanced participants. This group was called “high strength score”. The group called “low strength score” was defined based on strength levels relativized by body mass between 1.0 and 1.6 for the DL exercise and 1.0 and 1.4 for SQ.
2.4.7. Data Analysis and Processing
To avoid possible biases in the analysis, the data were collected by two different researchers associated with the project and the research group (P.A. and P.D.). A third evaluator was responsible for the data analysis. The researcher responsible for the data analysis remained blinded throughout the data collection process (group leader A.S.).
2.5. Statistical Analysis
The normality of the data was tested by the Shapiro-Wilk test. Since the variables did not violate normality, the data were expressed as mean and standard deviation. Furthermore, a Student t-test for independents samples was used to determine the differences between the baseline measures for sample characterization and predictive variables. A linear regression was applied to investigate the level of association between aerobic and anaerobic performance and the different maximal strength strata (high vs. low strength score), as well as to produce a predictor equation for aerobic and anaerobic performance from the different maximal strength strata (high vs. low strength score). In addition, an analysis of variance (ANOVA for quadratic model regression) was applied to verify whether the adjustment of the regression model as a predictor of aerobic and anaerobic powers was significant. Finally, an intraclass correlation coefficient (ICC) was used to determine the reliability of the strength measurement.
For the second collection, after analyzing data normality, a Spearman correlation was used to determine the level of association between the actual performance measures and the predicted. The Wilcoxon test was used to subsequently compare the actual and predicted values (cross-validation). A significance level of p < 0.05 was assumed and the SPSS statistical package version 20 was used.
3.0. Results (Fist Collection)
The sample characterization data were stratified by high training score and low training score groups and are expressed as mean and standard deviation (SD), and presented in
Table 1. The sample normality was duly tested by Shapiro-Wilk, presenting a normal distribution pattern for all dependent variables (p < 0.05). Flowchart 1 presents the inclusion and exclusion steps of participants. The Student t-test for independent groups designed to determine the differences in characterization between groups showed equality in the variables of age (p = 0.575), BM (p = 0.673), height (p = 0.523) and BMI (p = 0.981).
The independent Student t-test compared participants with high vs. low strength scores, indicating differences between groups for maximum DL strength (p < 0.0001), relative DL/BM strength (p < 0.0001), maximum SQ strength (p < 0.0001) and relative SQ/BM strength (p < 0.0001). The baseline variables are presented in
Table 2.
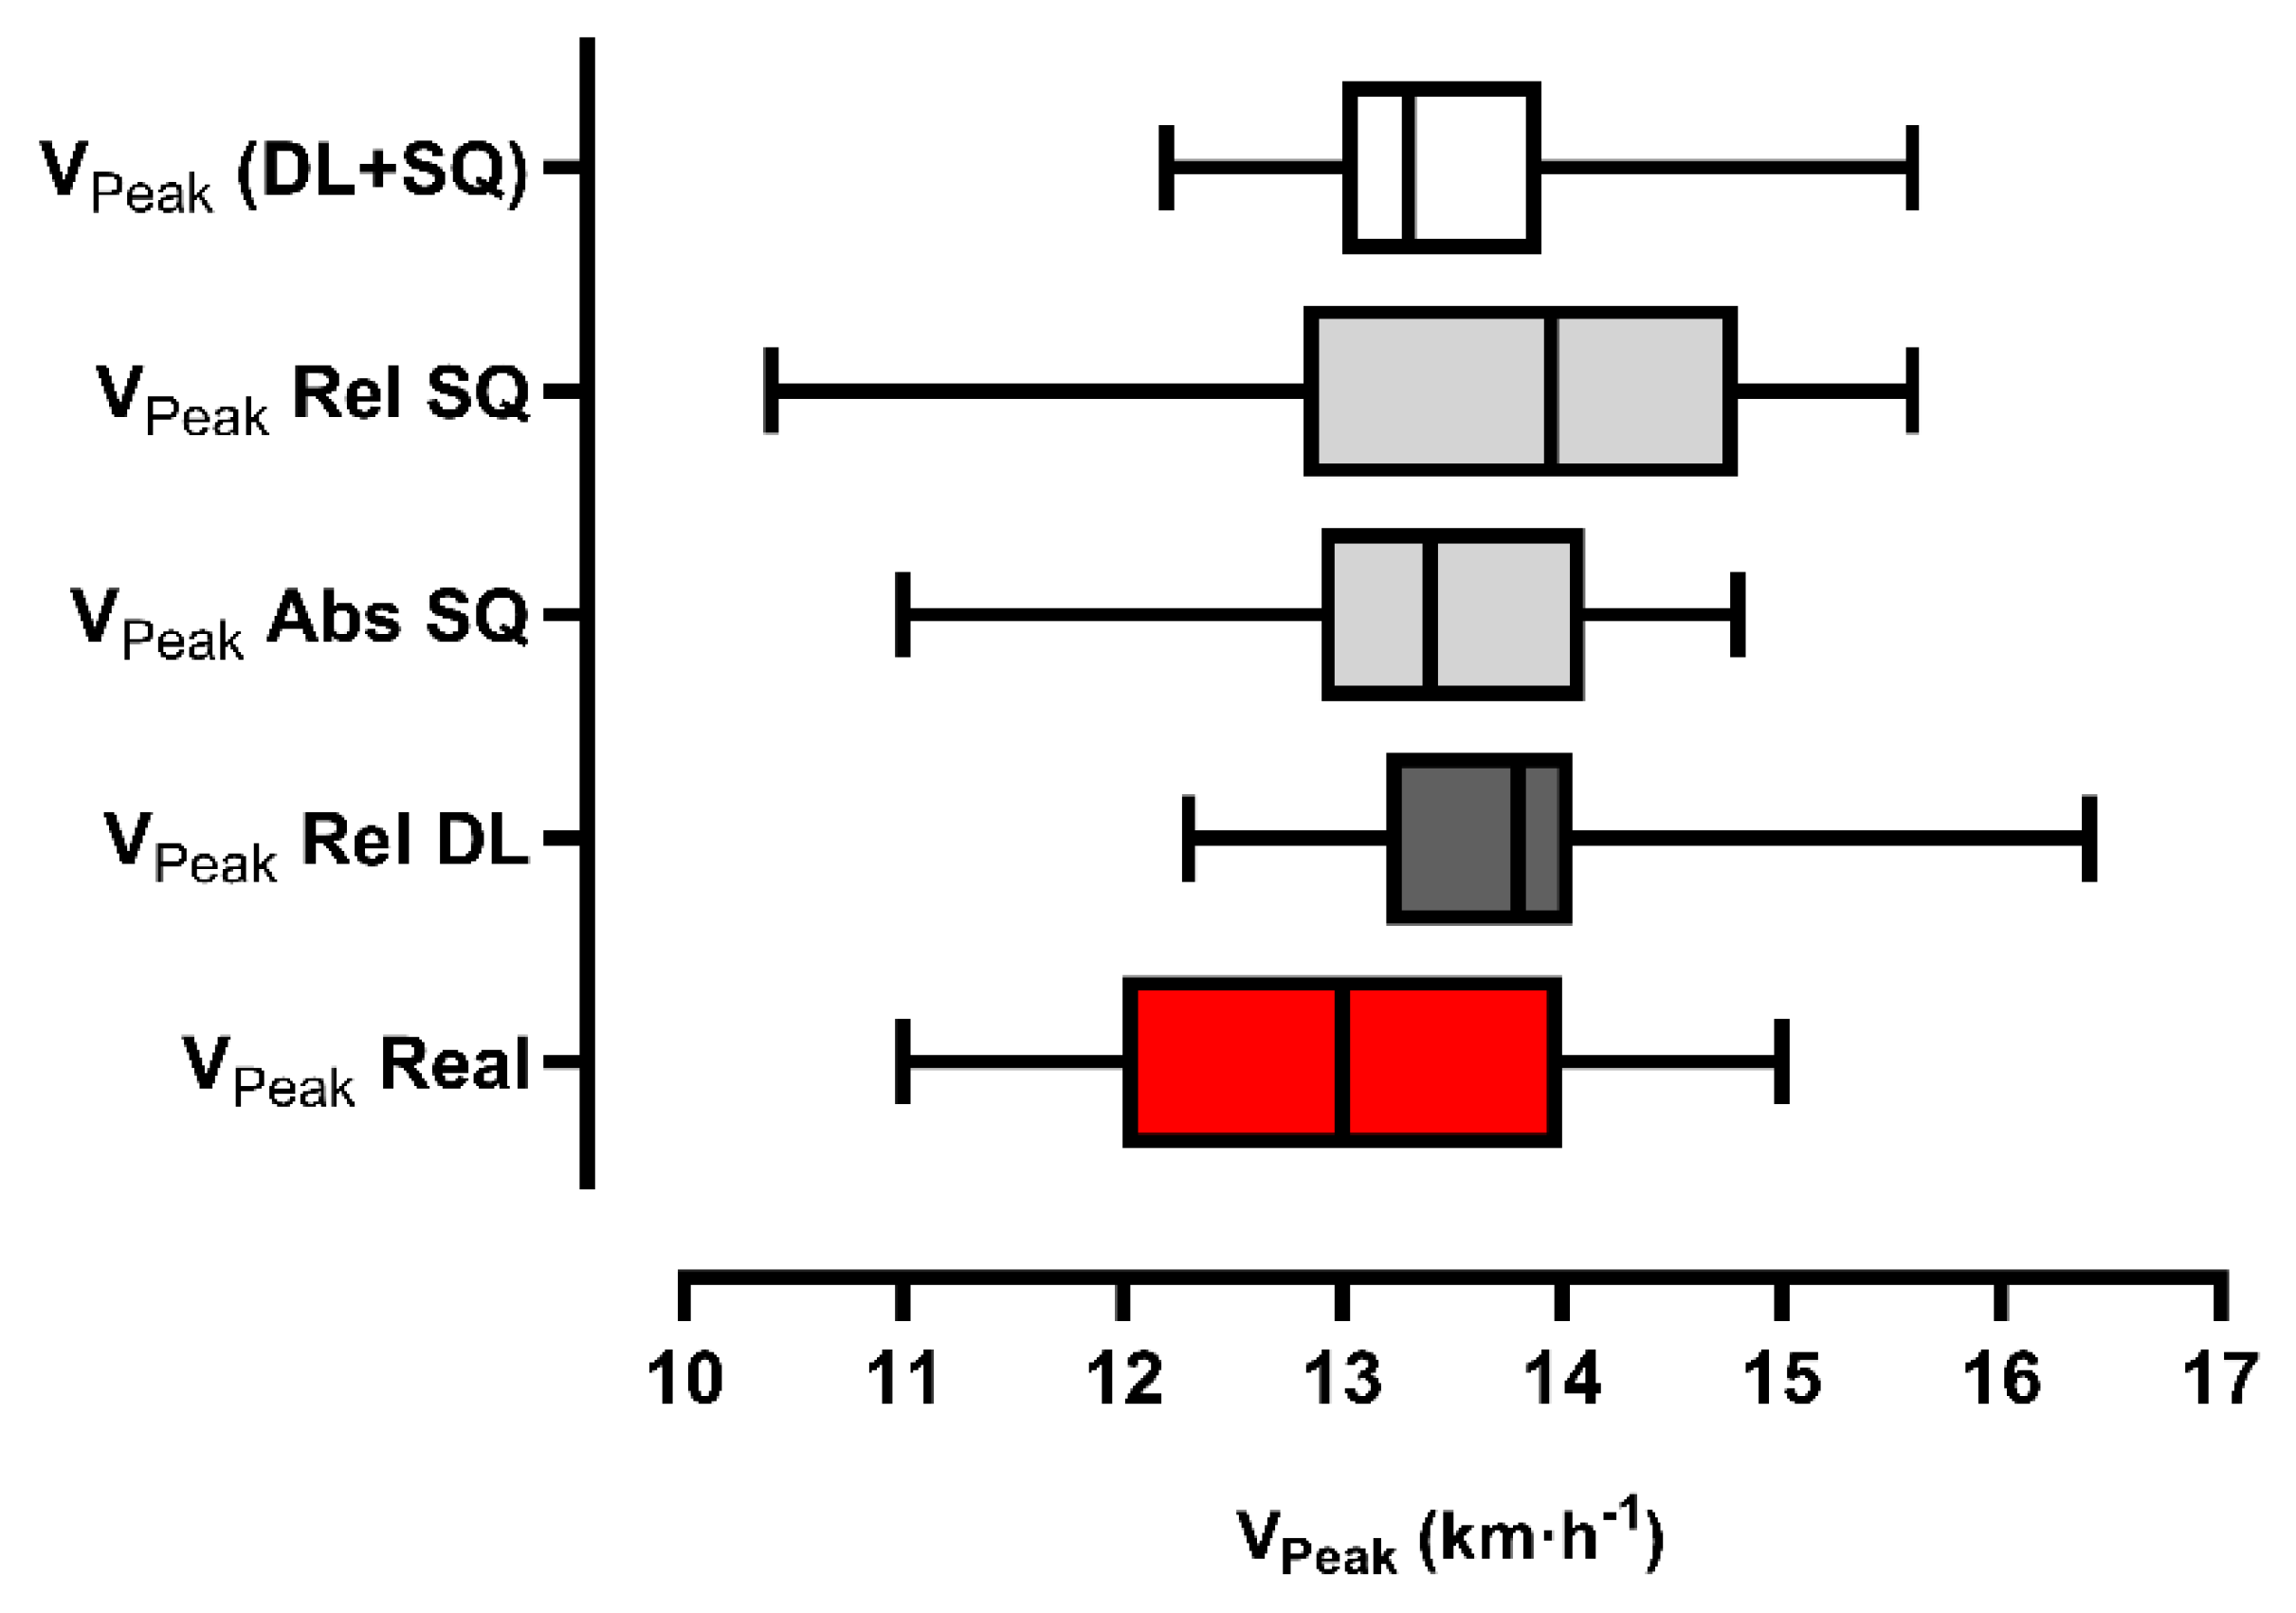
The performance results of vMART and the maximum incremental test, as well as the estimated metabolic demand values for both, are presented in
Table 3. There were no differences for all baseline dependent variables related to the running tests (V
Peak: p = 0.228; vMART: p = 0.145).
3.1. Primary Outcomes
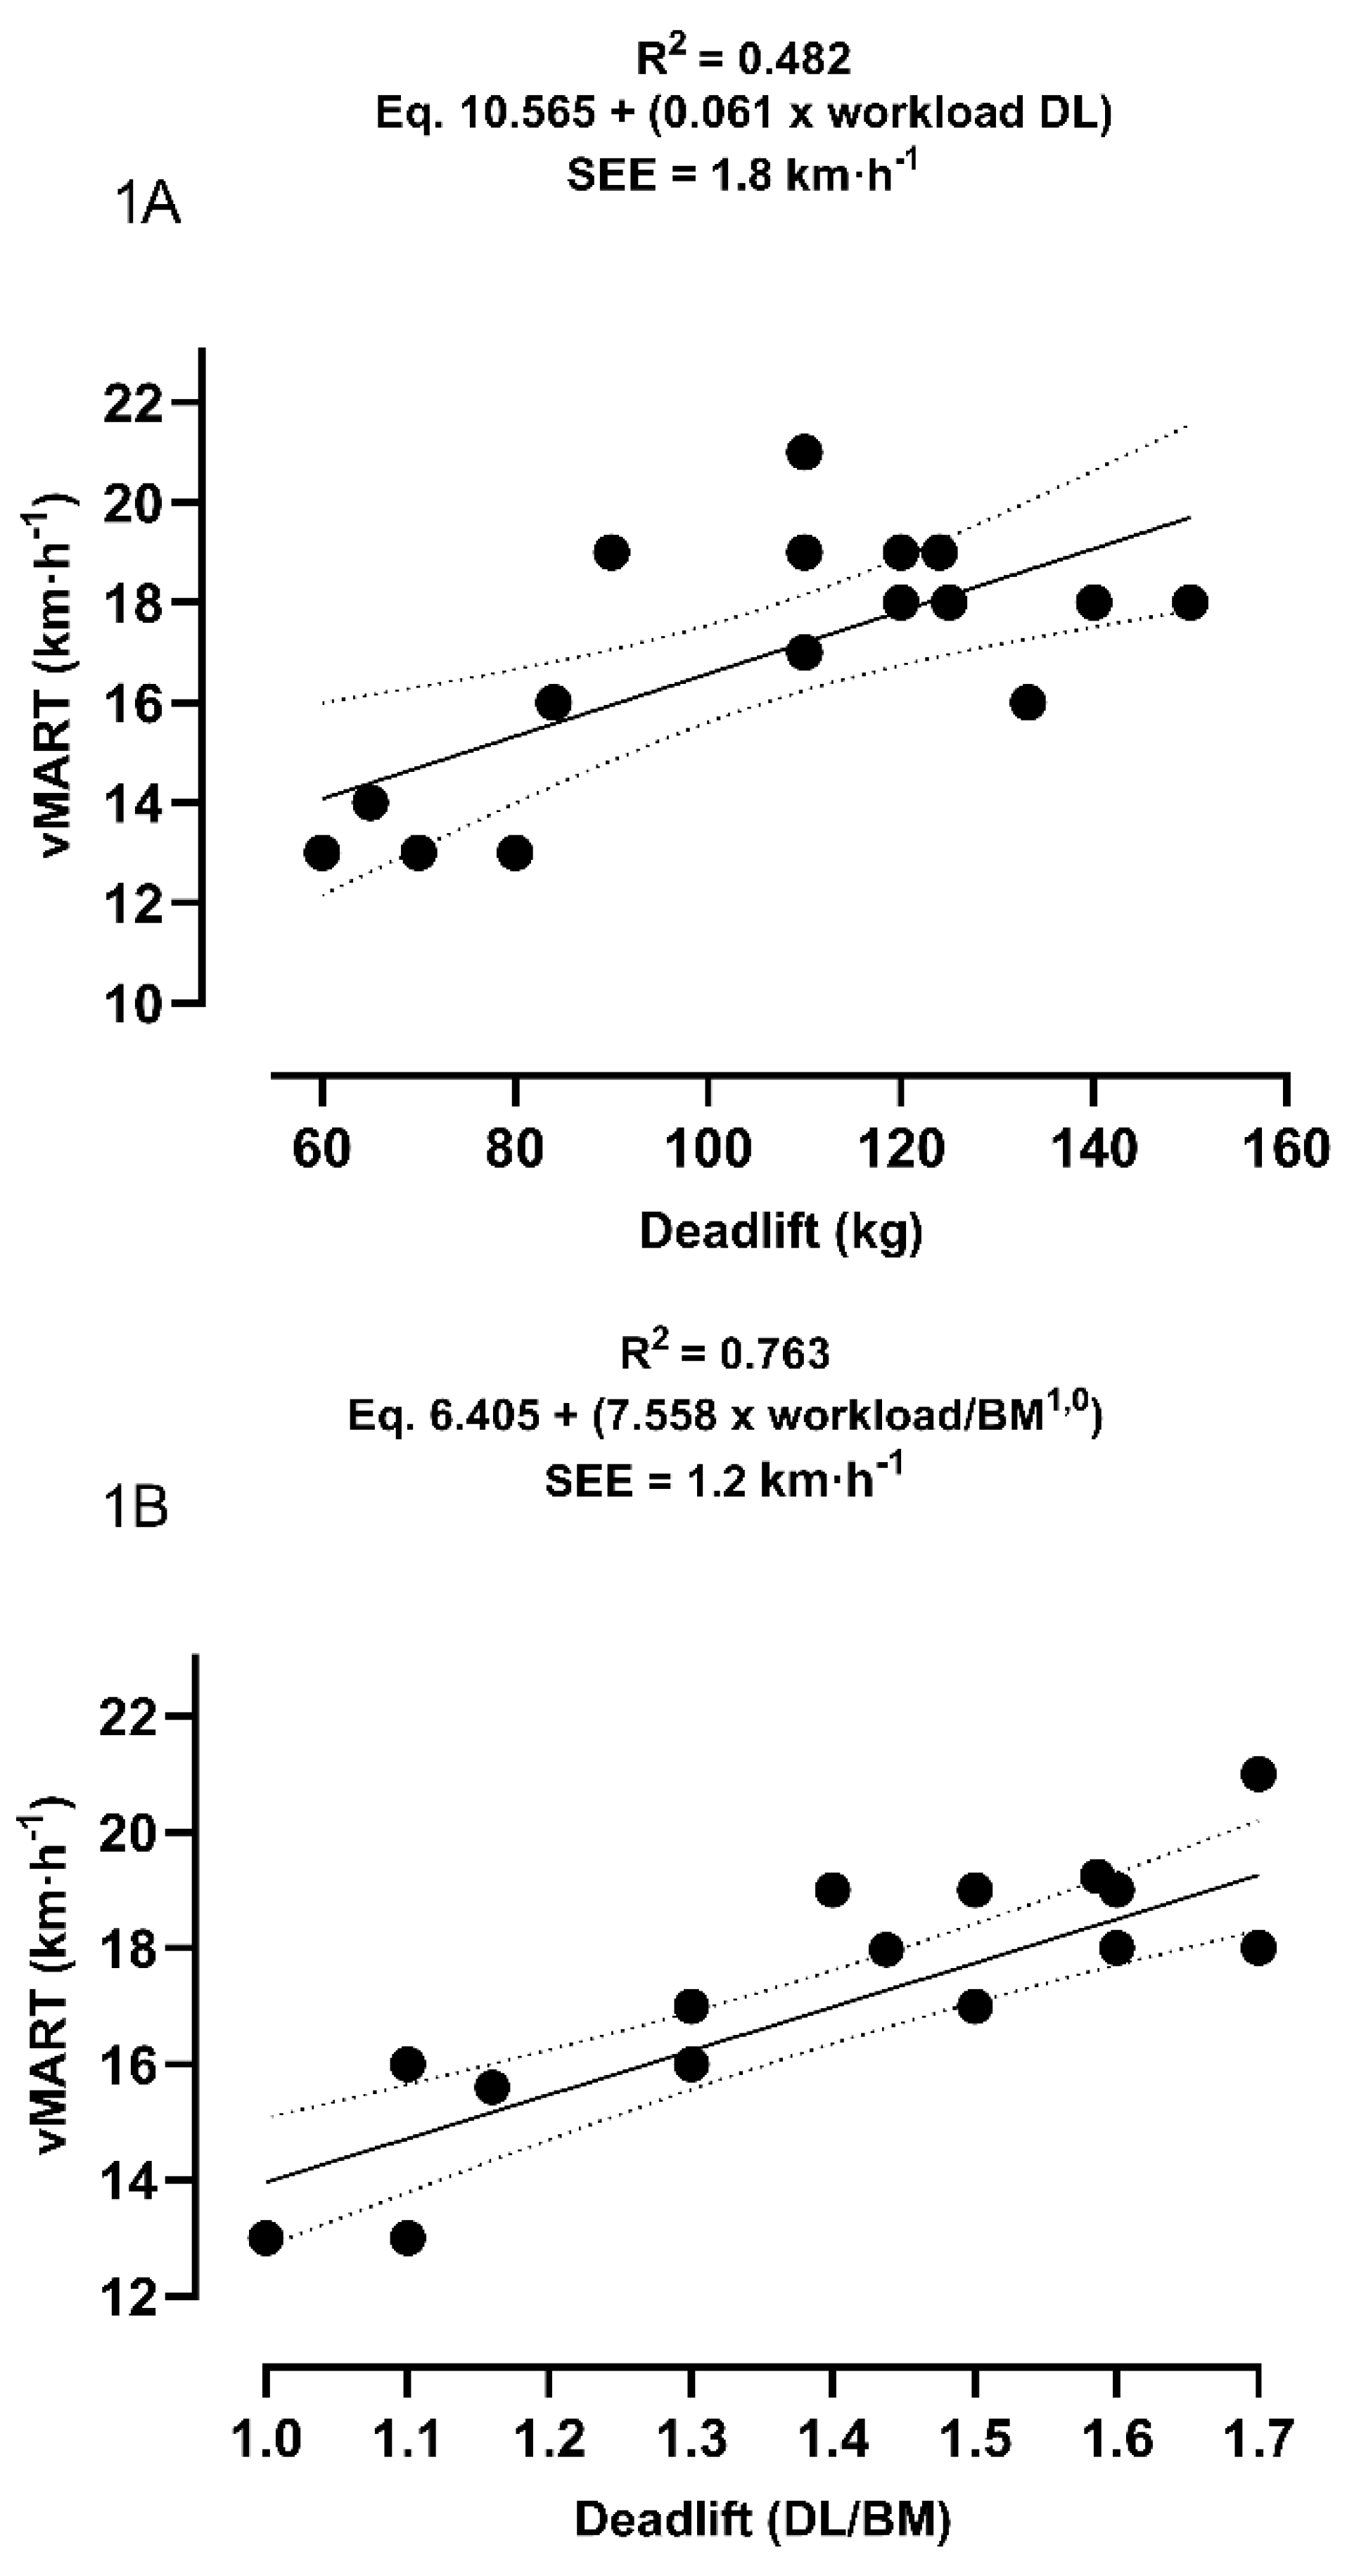
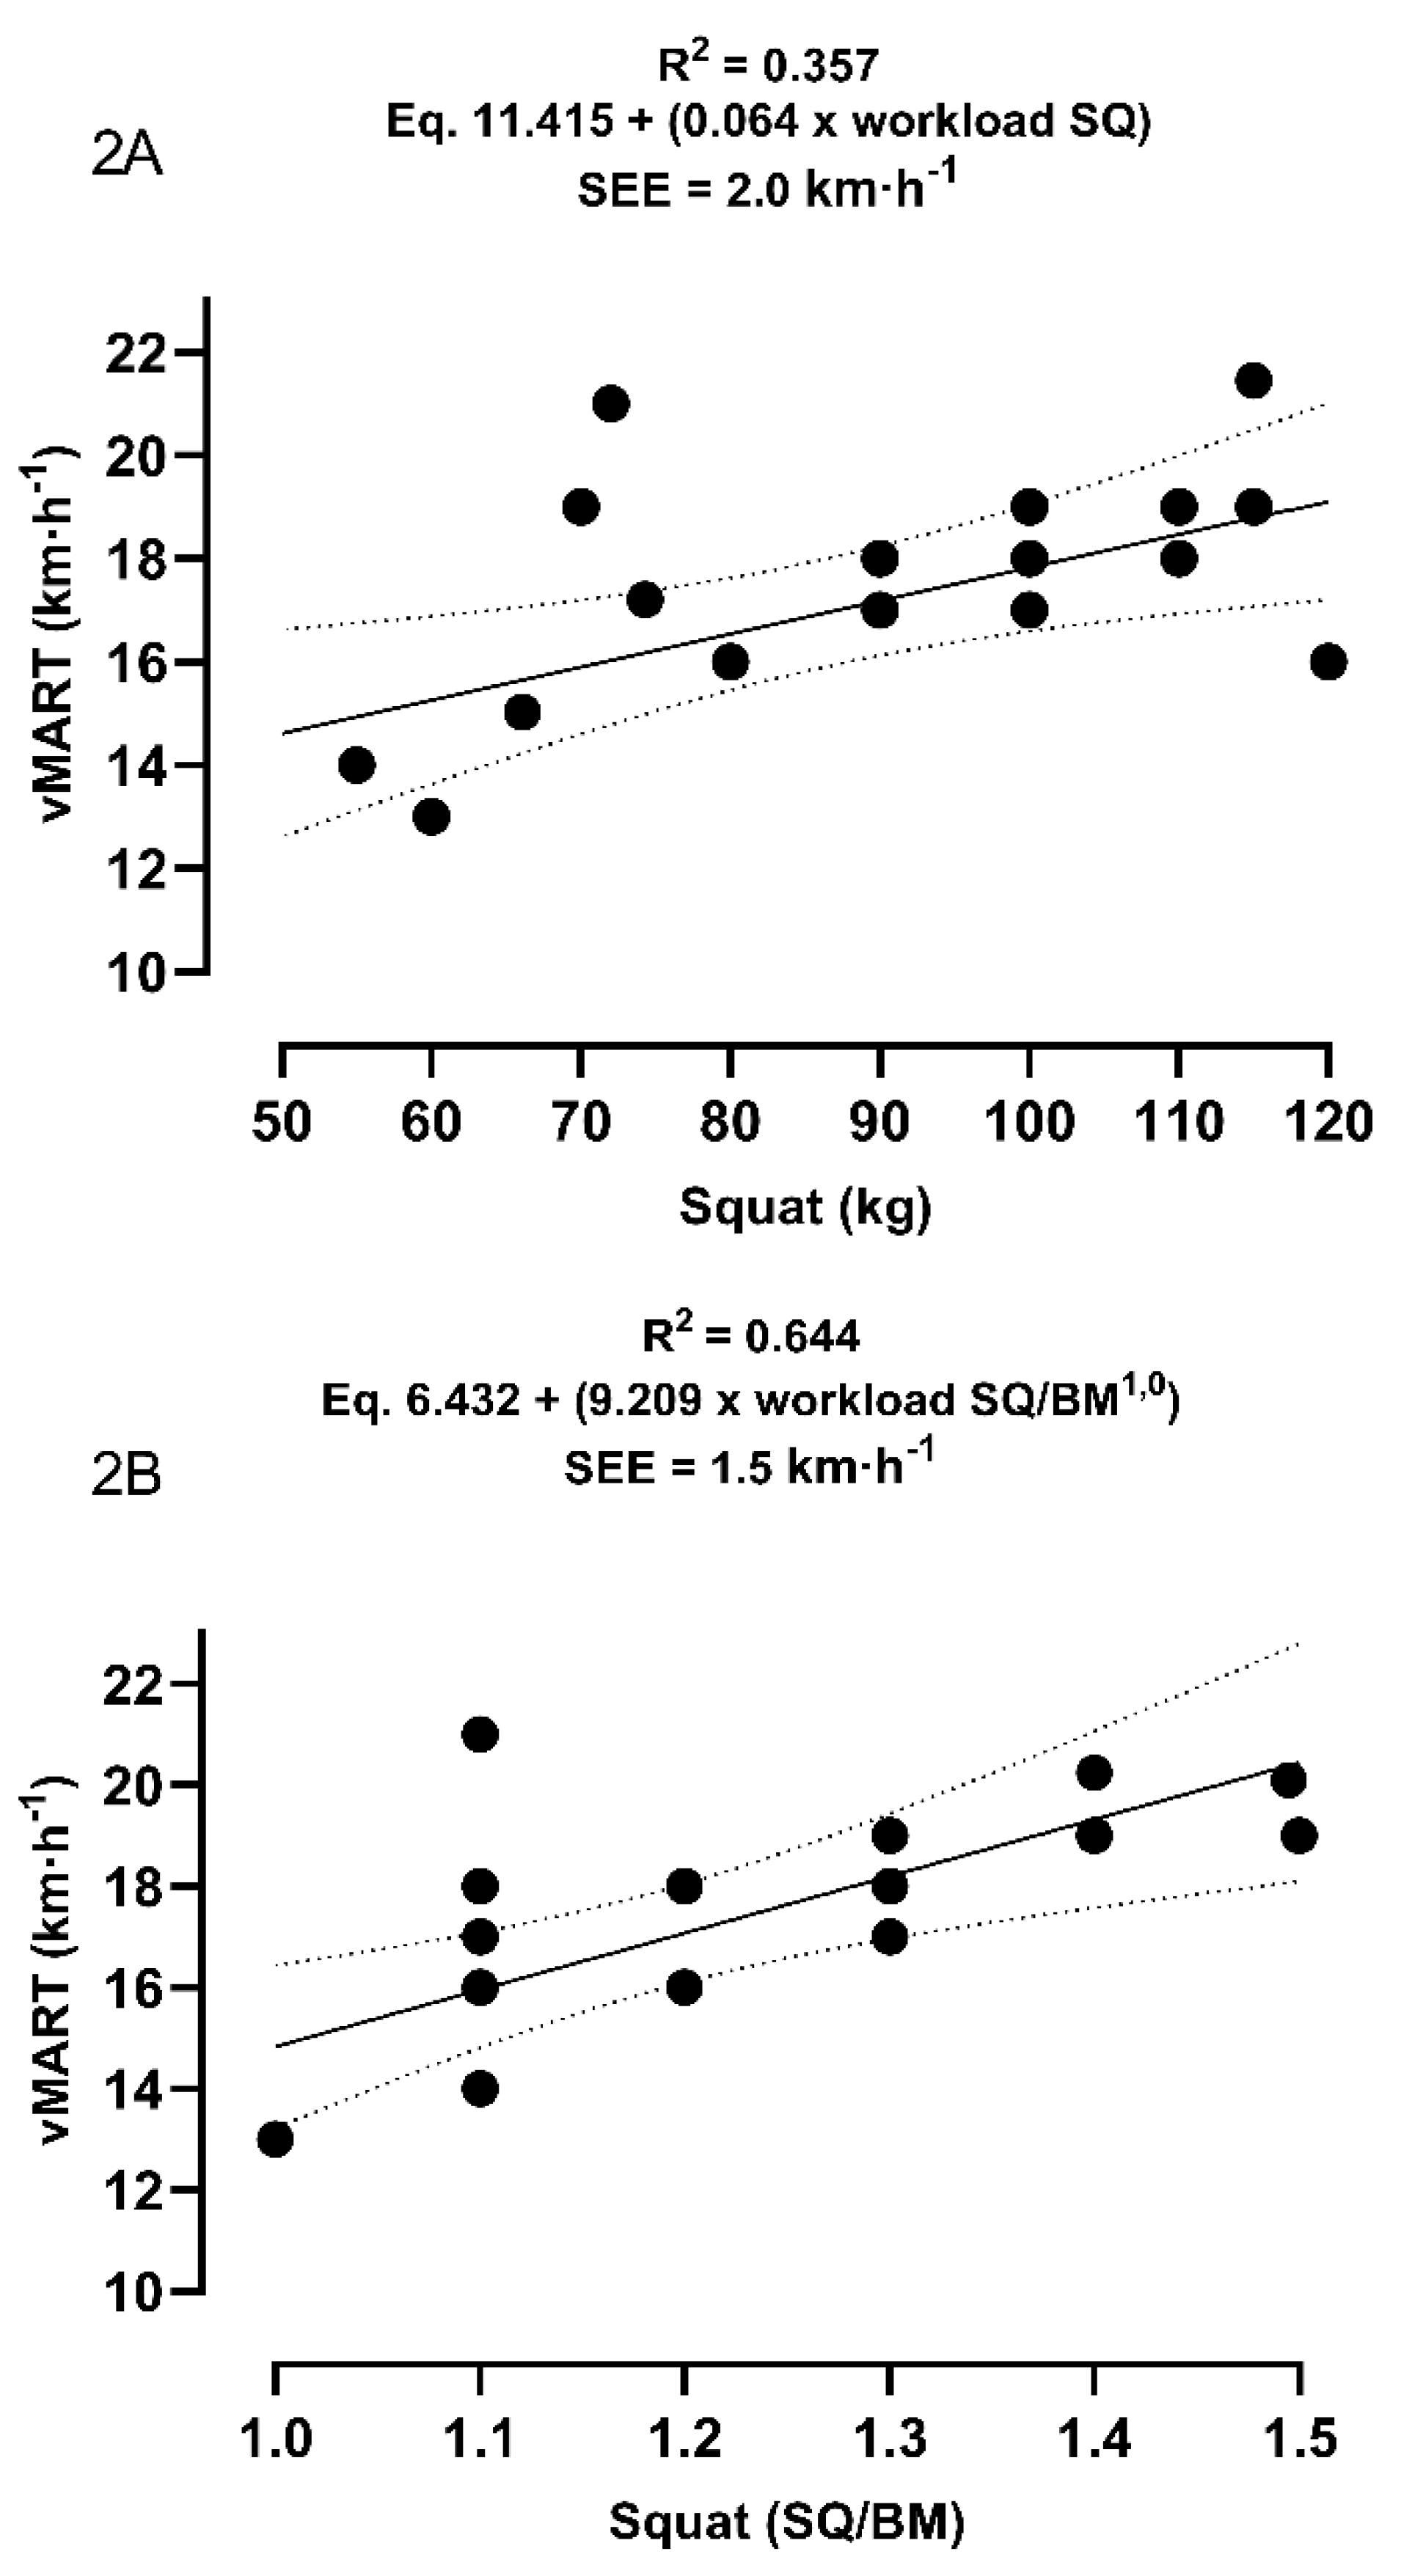
For linear regression analysis, the prerequisites of linearity between the predicted and predictor variables, as well as homoscedasticity and normality of distribution of residuals, were accepted. The regression model for participants with high strength scores did not predict vMART performance for either the DL (r = 0.193; R2 = 0.037; F(1,15) = 0.581; p = 0.458) or DL/BM (r = 0.057; R2 = 0.003; F(1,15) = 0.048; p = 0.829) exercise, or the SQ (r = 0.106; R2 = 0.011; F(1,15) = 0.170; p = 0.686) or SQ/BM (r = 0.076; R2 = 0.006; F(1,15) = 0.087; p = 0.772) exercise. Thus, the DL RM test does not explain the variations in vMART performance, suggesting that strength from a certain level does not influence anaerobic running performance.
Conversely, linear regression demonstrated a positive result for predicting vMART performance in the face of lower strength scores. The regression model presented significant results for DL (r = 0.694; R
2 = 0.482; F(1,15) = 13.95; p = 0.002), DL/BM (r = 0.874; R
2 = 0.764; F(1,15) = 48.493; p < 0.001) and SQ (r = 0.597; R
2 = 0.357; F(1,15) = 8.328; p = 0.011) and SQ/BM (r = 0.803; R
2 = 0.644; F(1,15) = 27.154; p < 0.001).
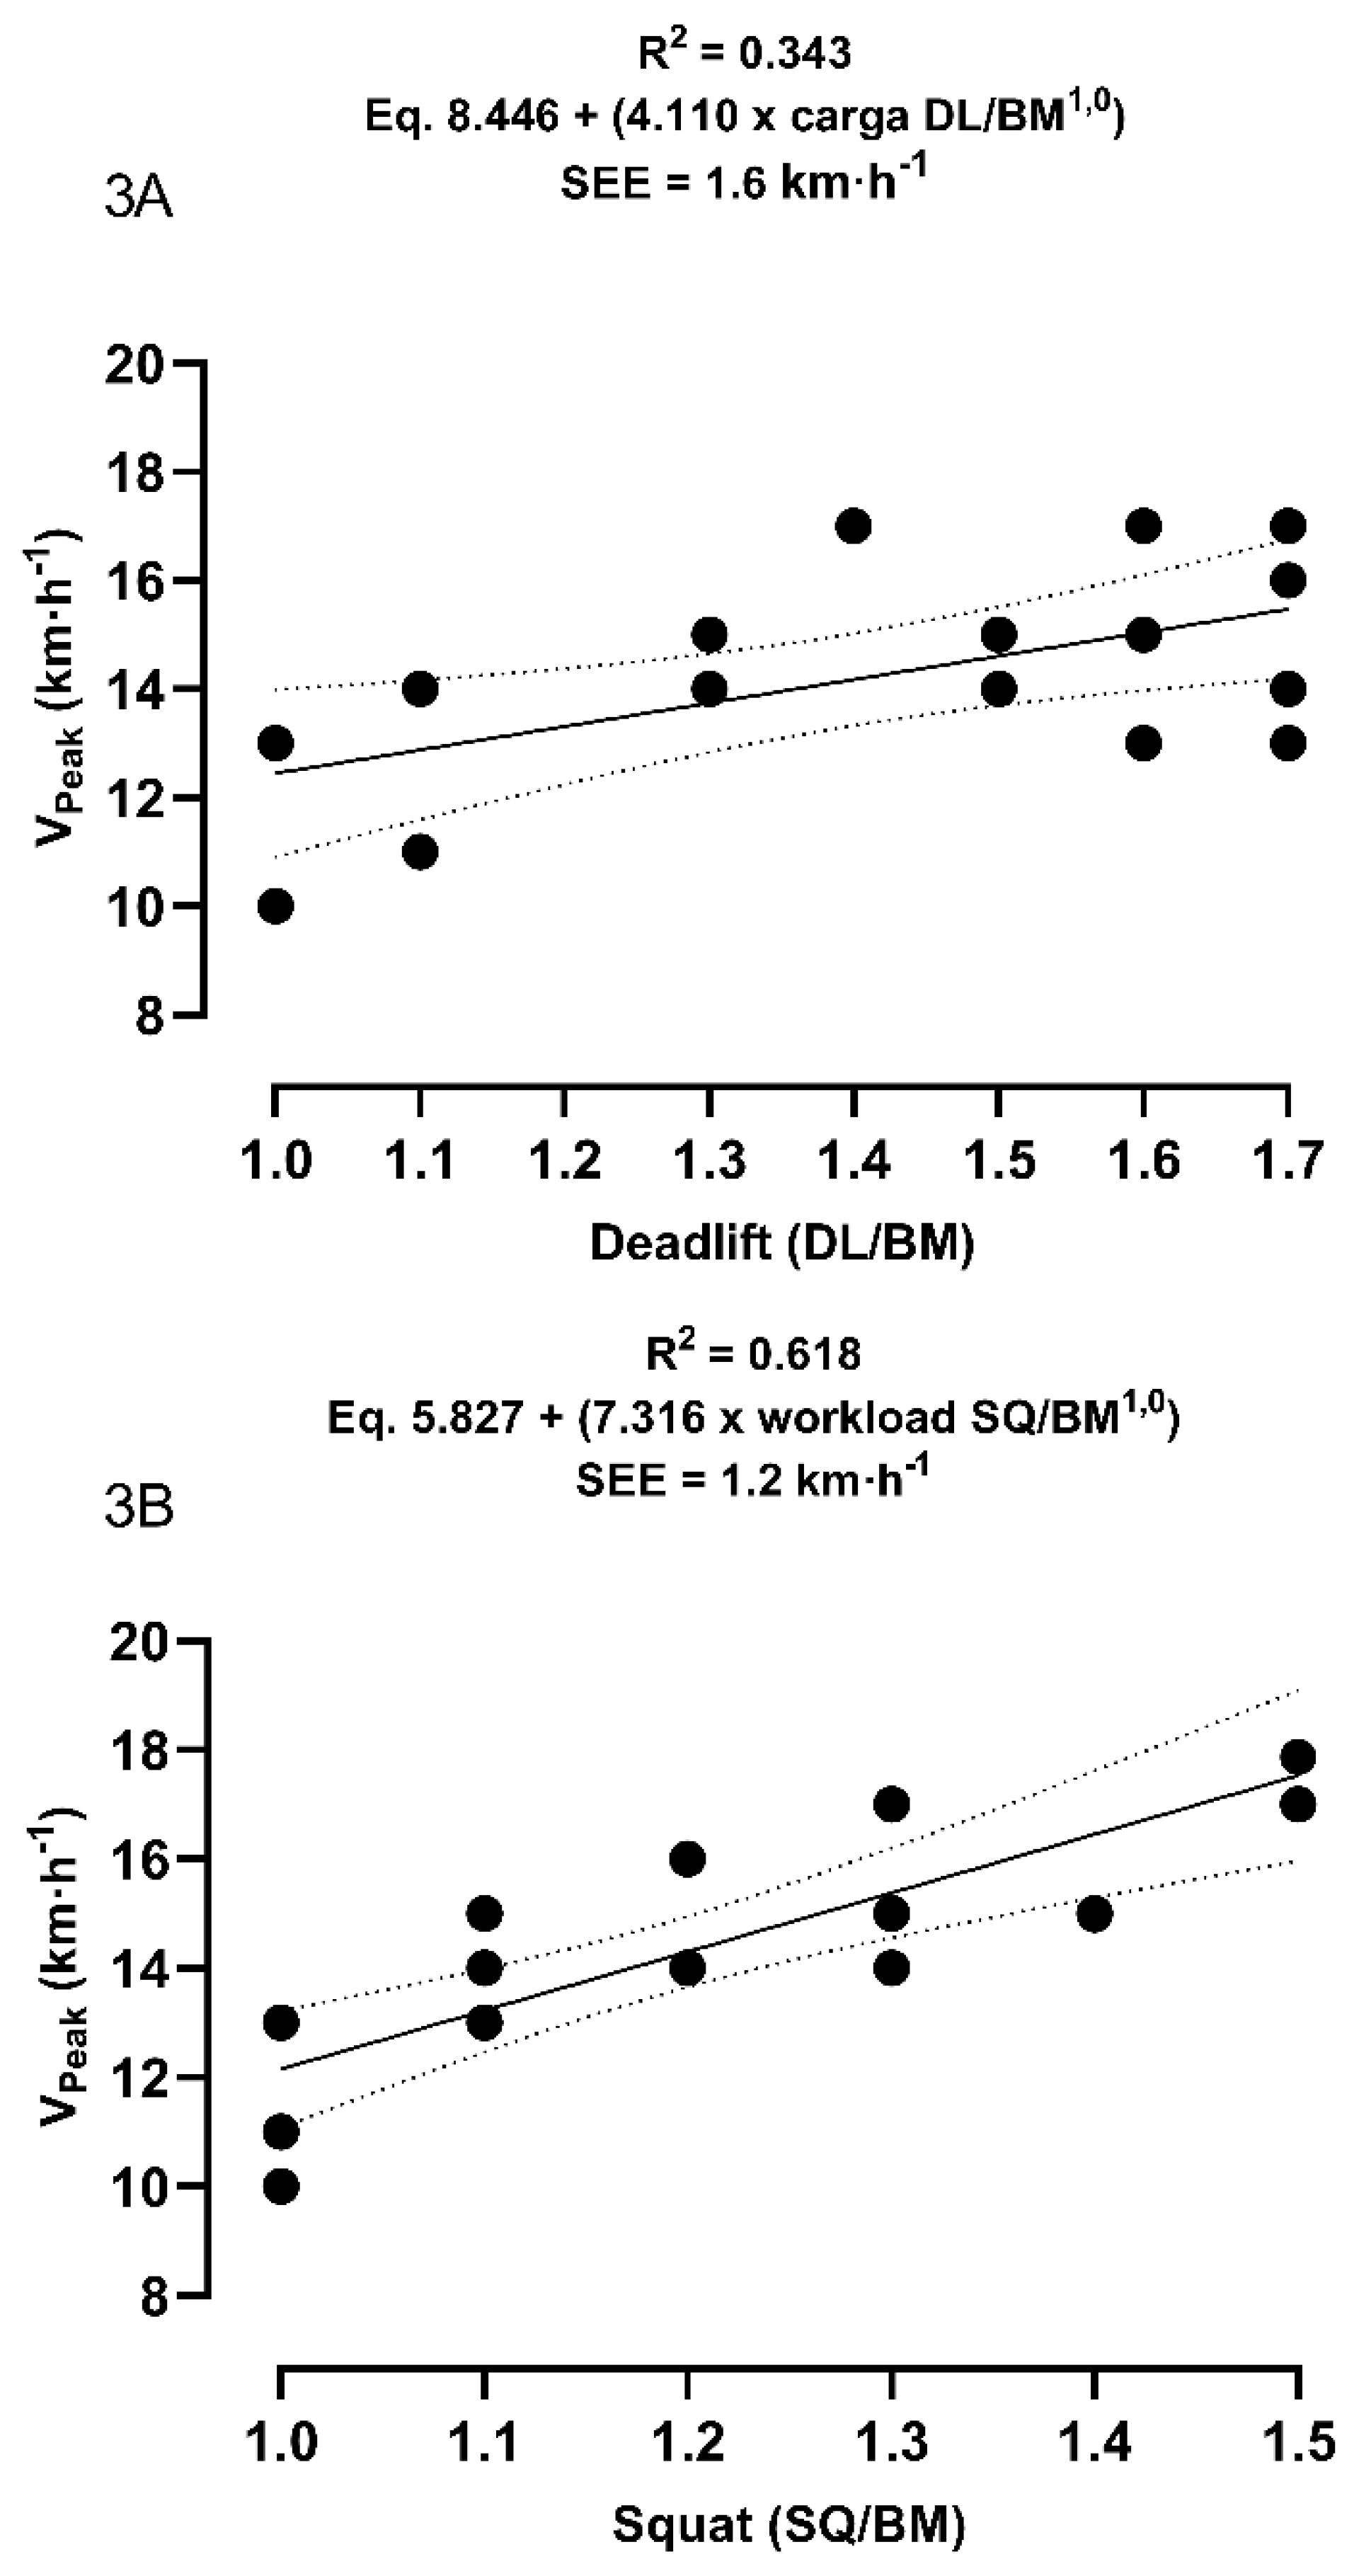
Figures 1A and 1B present the regression plots for vMART performance for DL movement and
Figures 2A and 2B present the regression analyses between vMART and SQ.
Figure 1.
Represent the equation of the linear regression of the variables absolute DL (1A) and relative DL by body mass (1B). R2 = coefficient of determination; DL/BM = external deadlift workload relativized by body mass; vMART = peak velocity obtained in the MART incremental test; SEE = standard error of the estimate.
Figure 2.
They represent the equation of the linear regression of the variables absolute SQ (2A) and relative SQ by body mass (2B). R2 = coefficient of determination; DL/BM = external deadlift workload relativized by body mass; SQ/BM = external squat workload relativized by body mass; vMART = peak velocity obtained in the MART incremental test; SEE = standard error of the estimate.
Regarding aerobic power analysis, the linear regression also did not demonstrate a significant association between the movements of DL (r = 0.158; R2 = 0.025; F(1,15) = 0.384; p = 0.545), DL/BM (r = 0.265; R2 = 0.070; F(1,15) = 1.123; p = 0.306), SQ (r = 0.123; R2 = 0.018; F(1,15) = 0.267; p = 0.613), SQ/BM (r = 0.102; R2 = 0.010; F(1,15) = 0.157; p = 0.698) and VPeak for participants with high training scores.
The regressive model using DL movement (r = 0.467; R
2 = 0.218; F(1,15) = 4.192; p = 0.059) to predict V
Peak did not show statistical significance. In contrast, SQ was able to predict V
Peak performance (r = 0.555; R
2 = 0.309; F(1,15) = 6.692; p = 0.021). When we used allometric relativization, the model also showed positive for DL/BM (r = 0.586; R
2 = 0.343; F(1,15) = 7.841; p = 0.013) predicting V
Peak performance. Finally, the regression of V
Peak by the predictor variable SQ/BM was positive, presenting significant results between the measured and predictor variables (r = 0.786; R
2 = 0.618; F(1,15) = 24.264; p < 0.001).
Figures 3A to 3B show the regression graphs for the V
Peak performance for both investigated movements.
Figure 3.
Represent the linear regression equation of the variables DL (3A) and SQ (3B) relativized by body mass. R2 = coefficient of determination; DL/BM = deadlift external workload relativized by body mass; SQ/BM = squat external workload relativized by body mass; VPeak = peak velocity obtained in the maximum incremental test; SEE = standard error of the estimate.
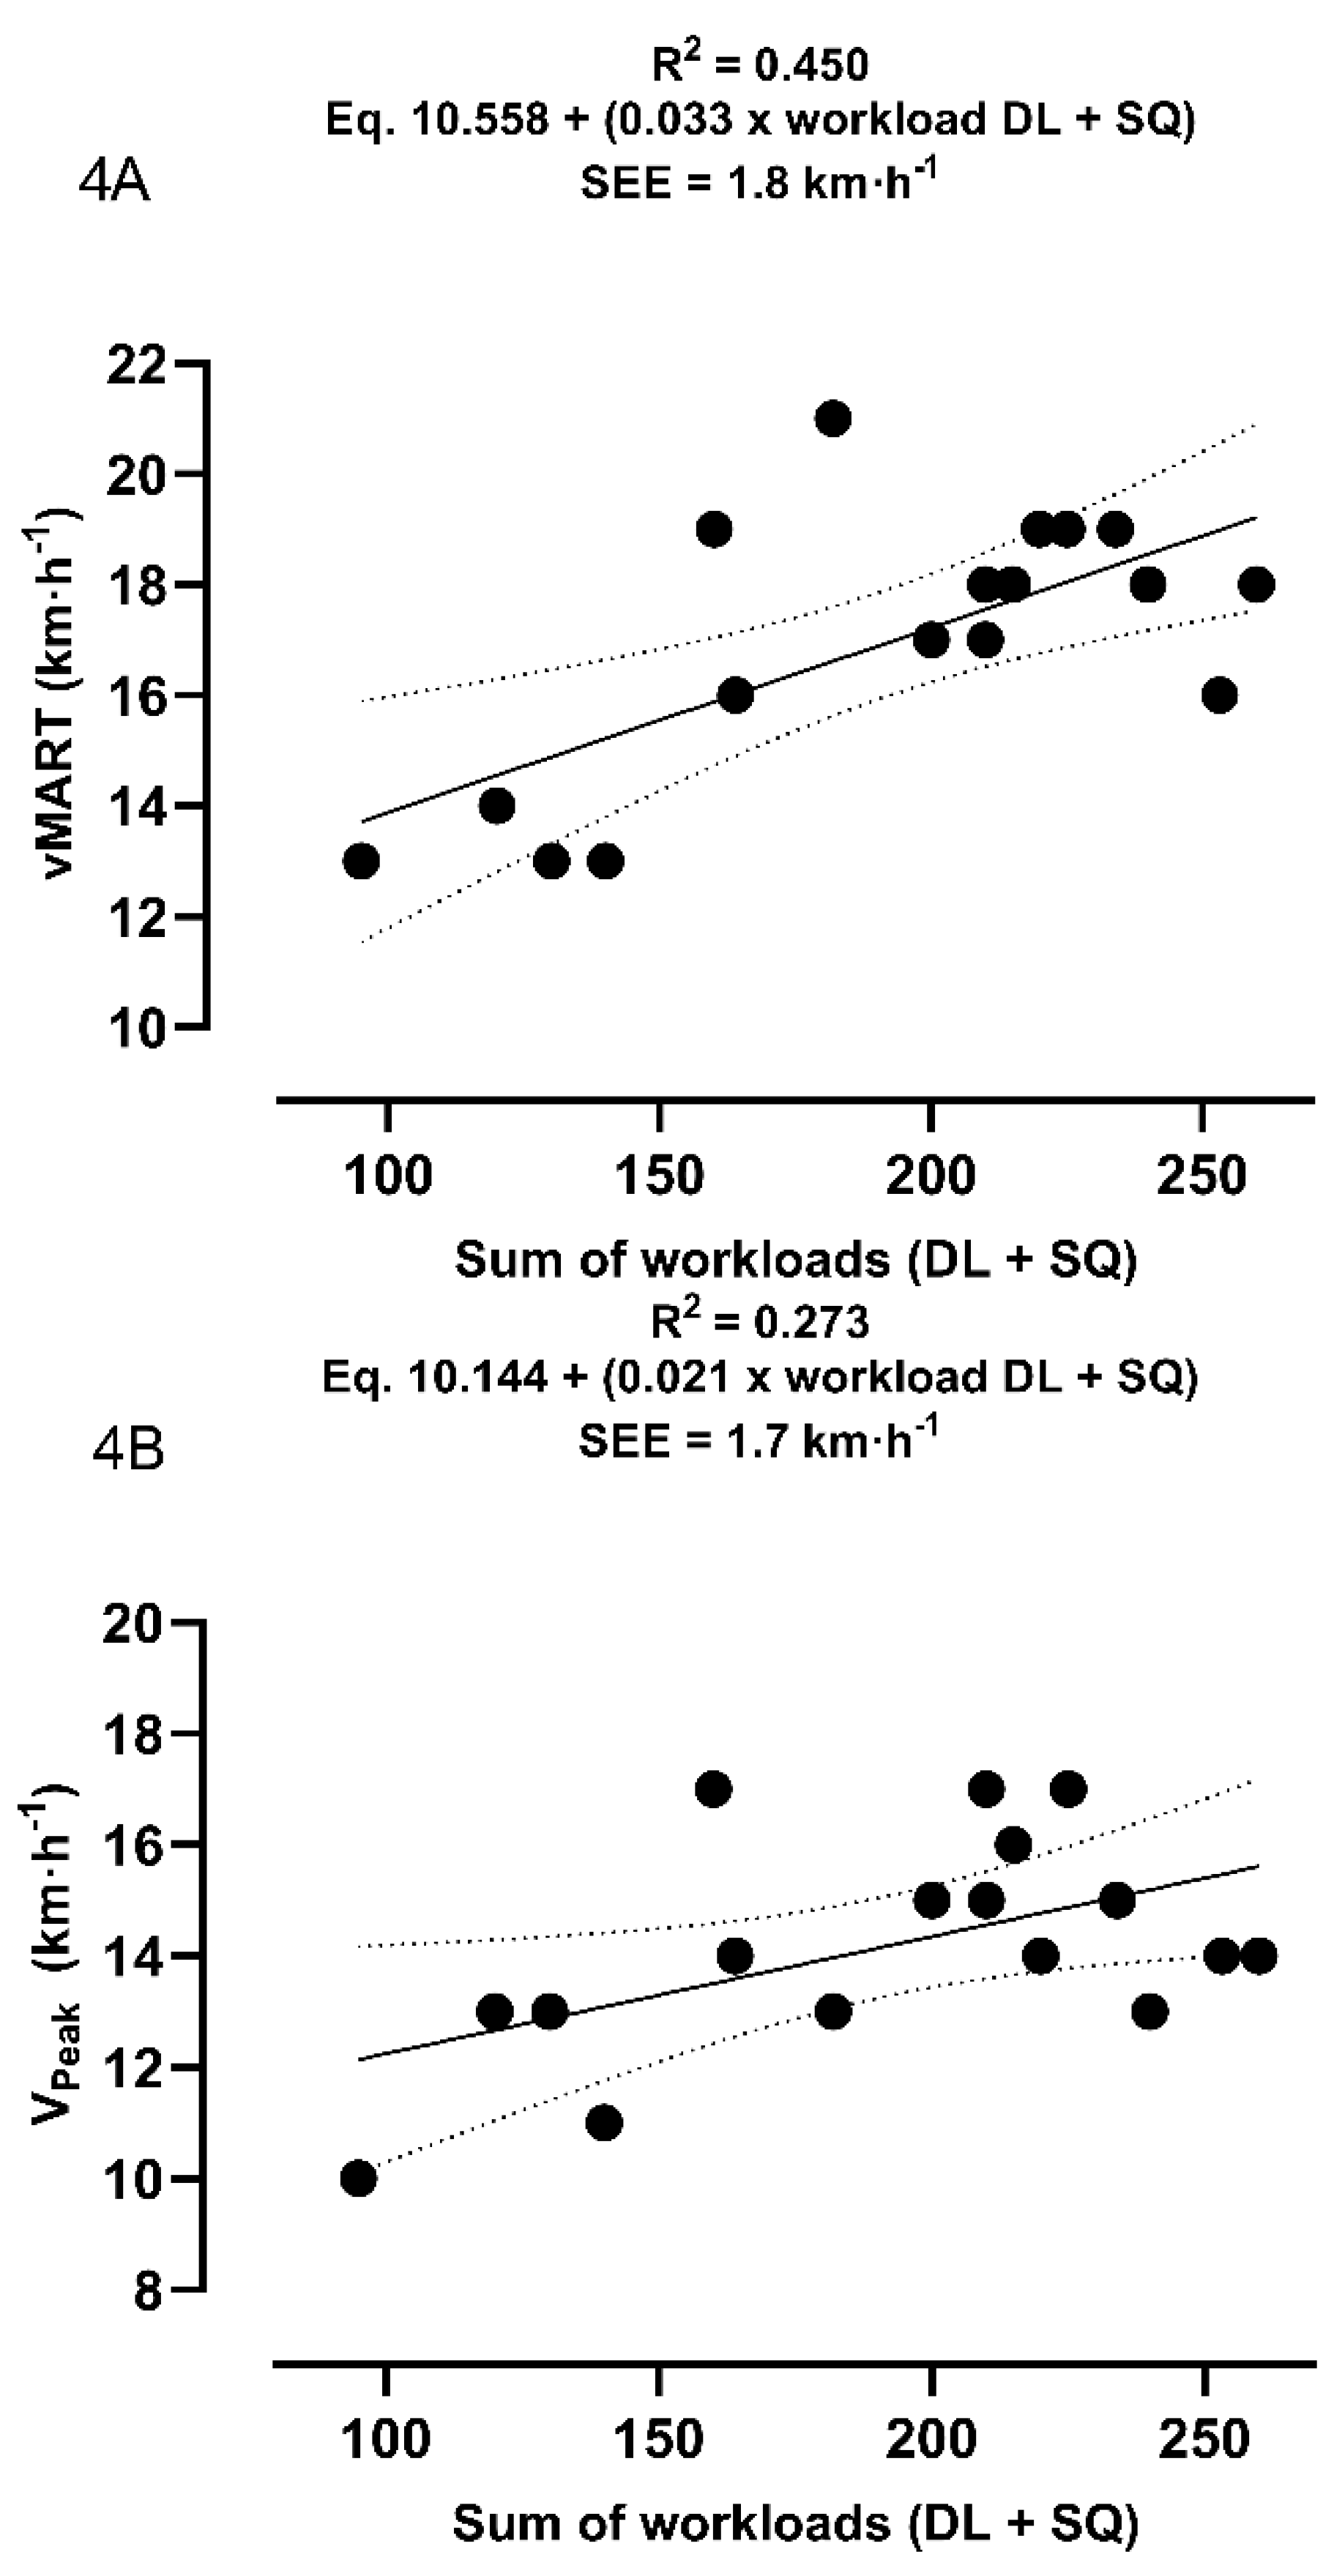
3.2. Secondary Outcome
The sum of the external loads was calculated and used to predict performance. There were significant differences between the scores of high vs. low level of training (p < 0.0001).
Table 4 presents the sums of the DL and SQ workloads.
The predictive model using the sum of loads in both movements was tested based on the assumptions of linearity and normality. The sum of loads (DL + SQ) did not produce a significant association with MART performance (r = 0.176; R2 = 0.031; F(1,15) = 0.481; p = 0.499) for participants with a high training score. When analyzing participants with a lower training score, the linear regression, although significant, does not appear to be superior to other isolated predictive models (r = 0.671; R2 = 0.451; F(1,15) = 12.318; p = 0.003).
The predictive model using the sum of workloads as a predictor variable of V
Peak did not present significant results when considering the high levels of training scores (r = 0.037; R
2 = 0.001; F(1,15) = 0.021; p = 0.888), but was significant when considering the lowest levels of training (r = 0.523; R
2 = 0.273; F(1,15) = 5.646; p = 0.031).
Figures 4A and 4B show the regression graphs for the sum of performances.
Figure 4.
Represent the linear regression equation of the sum of the DL and SQ workloads for vMART (4A) and VPeak (4B), respectively. R2 = coefficient of determination; vMART = peak velocity obtained in the MART incremental test; VPeak = peak velocity obtained in the maximum incremental test; SEE = standard error of the estimate.
3.3. Tertiary Outcome
Finally, the reliability of the strength measurements was initially performed in only the first 22 participants (G power = Correlation Biserial Model; Two Tail; Effect Size = 0.7; Alpha = 0.01; Power = 0.95). The ICC analysis indicated excellent stability of the measurement (ICC = 0.99) between the sessions performed for the DL movement (117.2 ± 32.7 kg – 120.2 ± 34.4 kg, respectively for session 1x2). For the SQ movement, the ICC showed an association of 0.99 (91.4 ± 24.6 kg – 93.2 ± 22.3 kg, respectively for session 1x2).
4.0. Cross-Validation Results (Second Collection)
After analyzing statistical assumptions, no normality was observed in the distribution of data for the measurement variables vMART predicted by absolute and relative DL (p = 0.007; p = 0.009, respectively), or absolute and relative SQ (p = 0.017; p = 0.003, respectively), as well as for the measurement variables VPeak predicted by relative DL (p = 0.092) and VPeak predicted by absolute and relative SQ (p = 0.020; p = 0.004). The same occurred for the sum of the workloads for prediction of vMART (p = 0.050), sum of the loads for prediction of VPeak (p = 0.046). Therefore, the data were treated nonparametrically. Flowchart 2 presents the results of the recruitment, entry, eligibility and exclusion of participants from the experimental collection.
Table 5 presents the characterization of the new sample participating in the validation process of the prediction equations.
Table 6 presents the strength and running performance data.
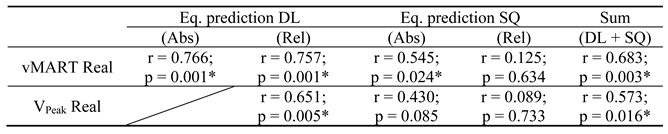
Table 7 presents the results of the association between the real performance measures vMART and V
Peak vs. the different results predicted by absolute and relative values of DL and SQ, as well as the sum of the workloads.
The Wilcoxon test for the measures of Real vMART vs. vMART predicted by DL (p = 0.02) and SQ (p = 0.043) showed significant differences, but not for DL/BM (p = 0.051) and SQ/BM (p = 0.093). The same statistical treatment was used for the measures of Real V
Peak vs. V
Peak predicted by DL/BM (p = 0.002), SQ (p = 0.019) and SQ/BM (p = 0.05), demonstrating significant differences between the real measure and that predicted by the equation. For the prediction of vMART performance from the sum of the DL and SQ workloads, the comparison by the Wilcoxon test did not demonstrate significant differences (p = 0.148), however, the same did not occur for the prediction of V
Peak performance from the sum of the DL and SQ workloads (p = 0.008), where significant differences were observed.
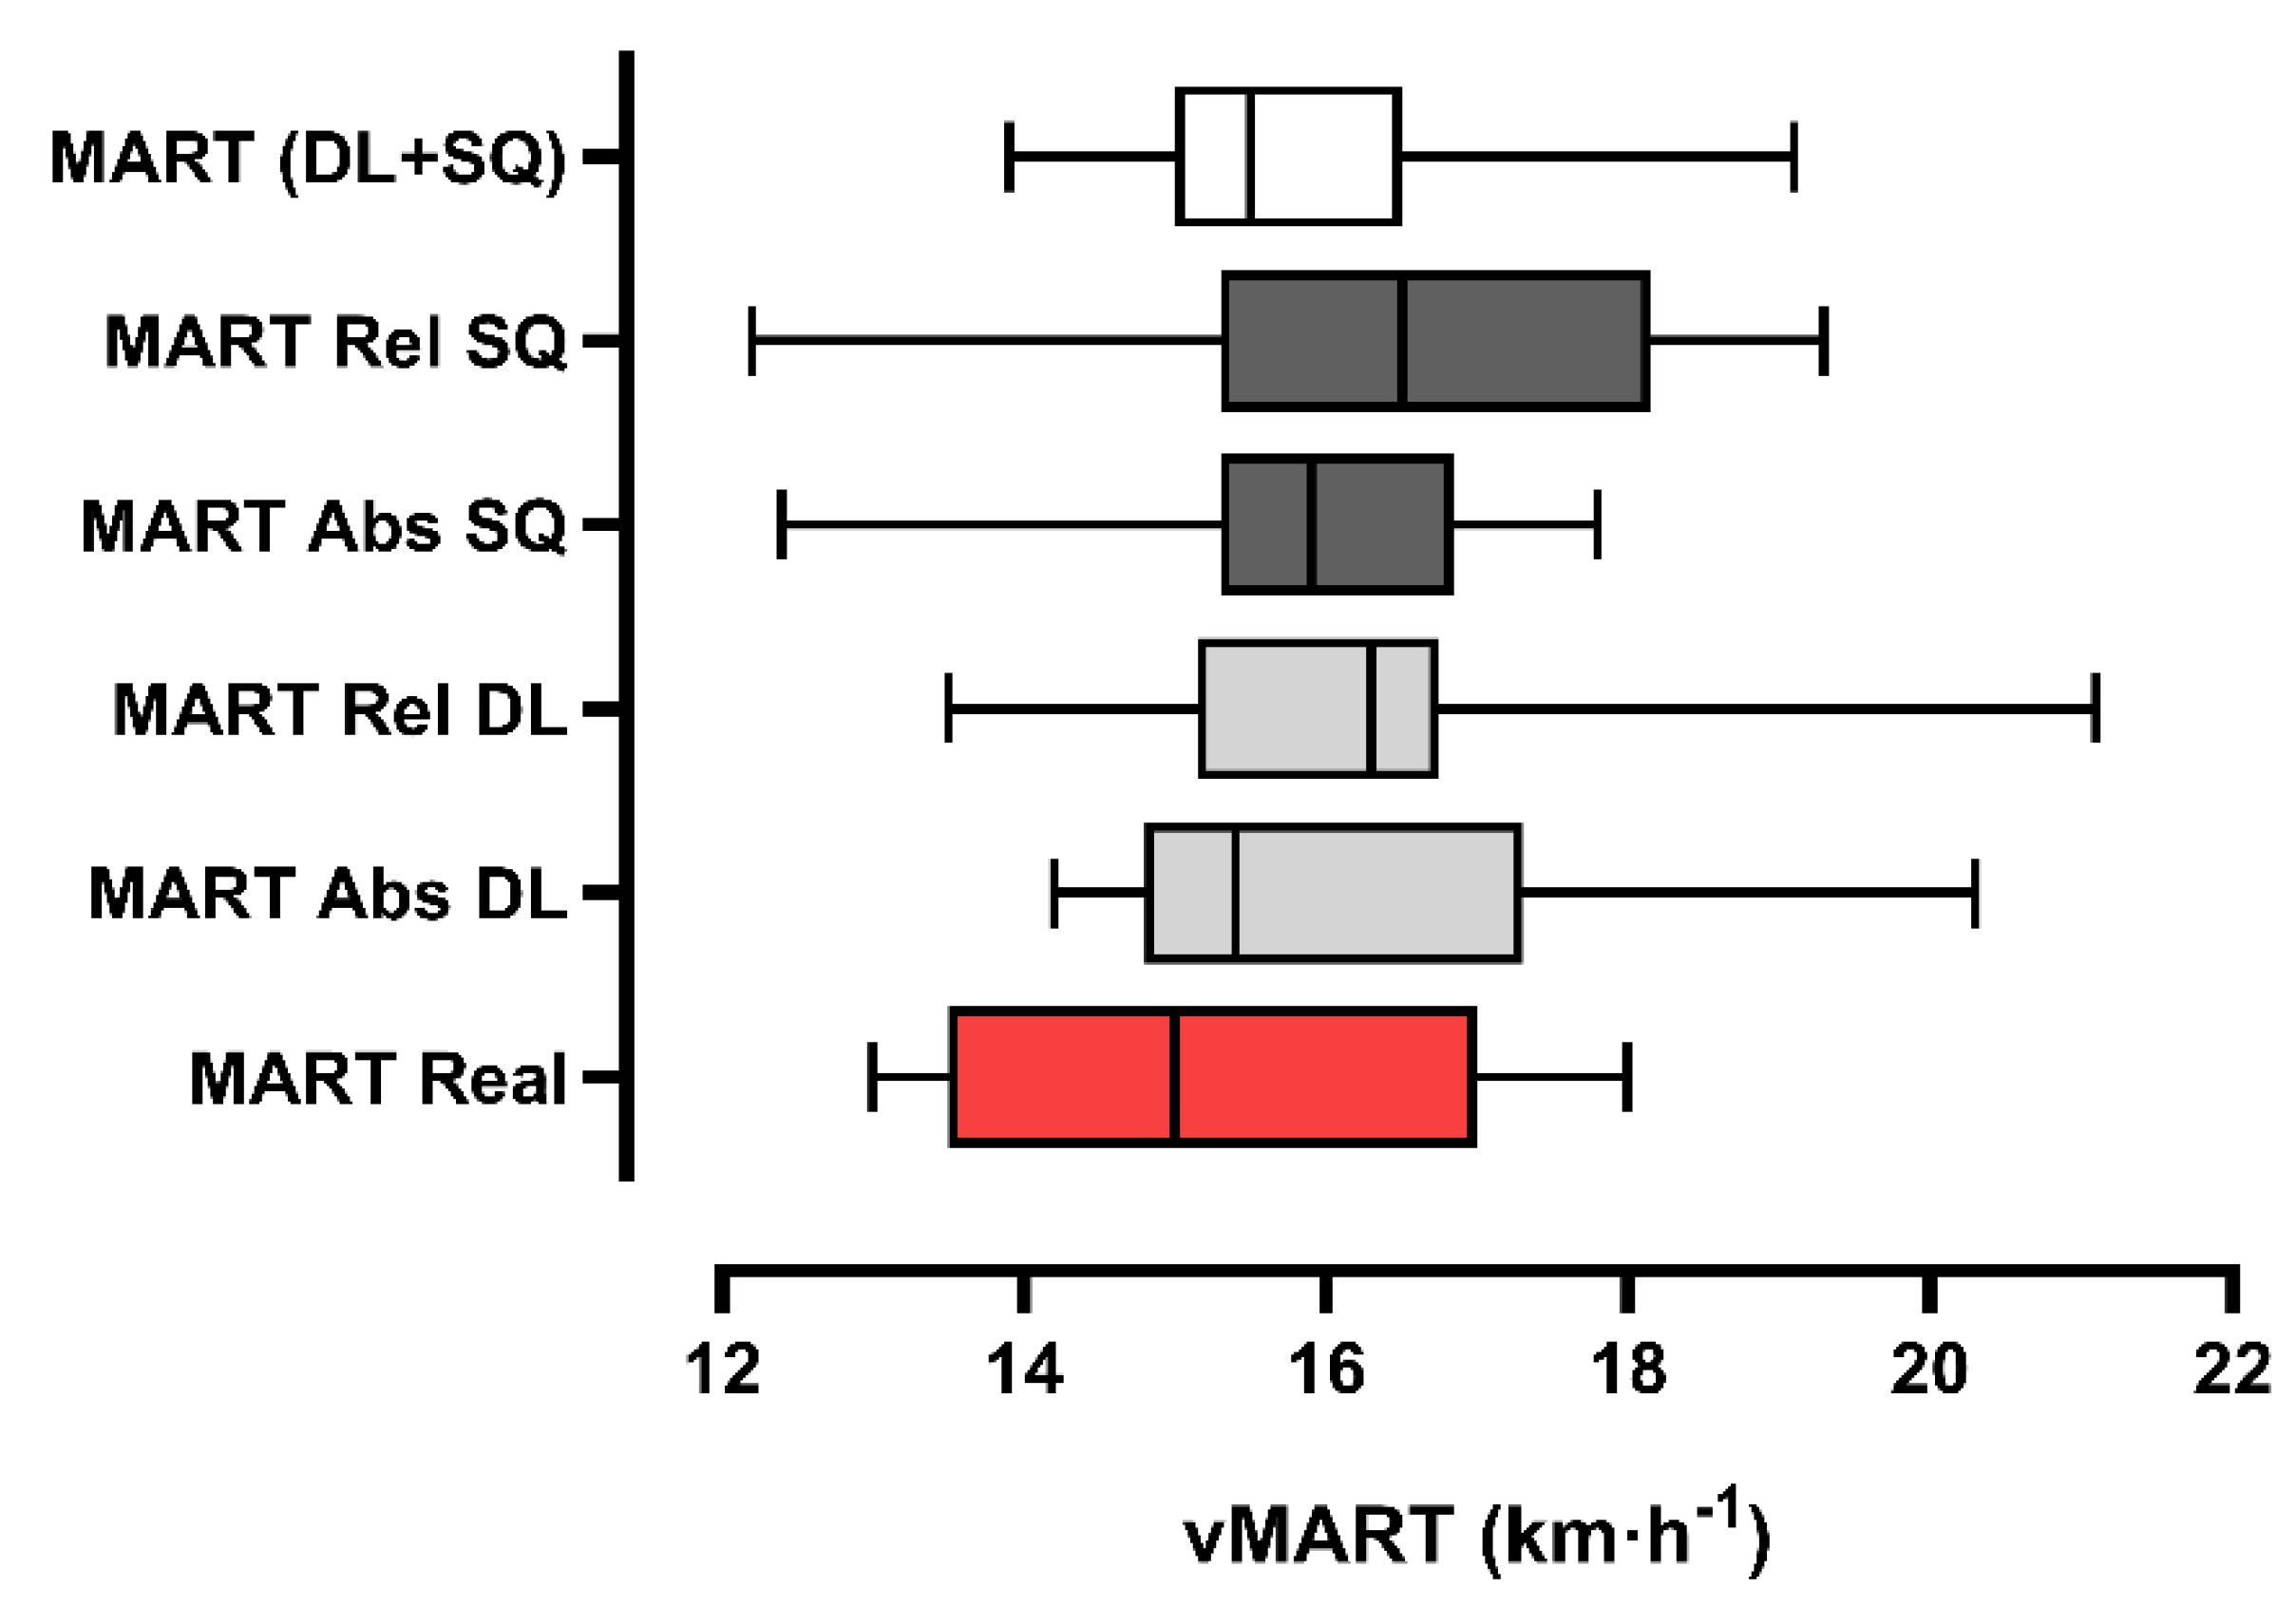
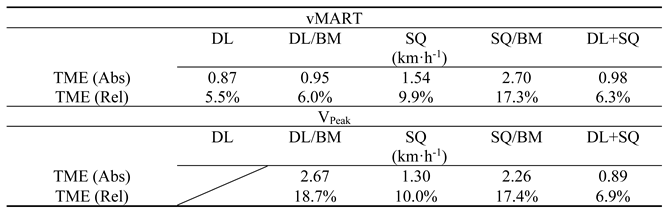
Table 8 presents the typical measurement error for the real vs. predicted variables.
Figure 5 and
Figure 6 present the comparisons between the real vs. predicted measurements by the equation, using DL, SQ and the sum of the workloads. Figures 7 and 8 present the Bland-Altman agreement analysis (supplementary material).
5.0. Discussion
The primary objective of this study was to establish the relationship between the production of absolute maximum strength, represented by the maximum amount of external load lifted (kg), and relativized by BM1.0 in the DL and SQ exercises, in order to analyze whether the anaerobic performance of MART and maximum aerobic performance VPeak could be satisfactorily estimated through strength. Our primary hypothesis was partially accepted, since the strength levels did not significantly impact the anaerobic and aerobic performance, in individuals with a large maximum strength base, suggesting the existence of a ceiling at which the maximum strength levels would continue to interfere in the improvement of performance. In contrast, we observed in individuals with lower strength scores that the increase in maximum strength would be appropriate as a strategy to influence running performance. In this sense, our study is a pioneer in presenting the perspective of a limit in which strength is really important, and that after such a limit, there is no longer a need to invest in new attempts at increments.
The importance of strength training for the development of running performance is reasonably understood in the literature [
8,
9,
10,
13]. When combined with running, it appears to reflect significant adaptations, which in turn would positively influence running economy and muscular power factors [
11]. Sentija, Marsie e Dizdar [
14] demonstrate that strength training in physically active young individuals can induce increases in both anaerobic and aerobic endurance. In untrained individuals, there is also a small influence on maximum oxygen consumption. Logically, our study was not a chronic intervention based on the exercises presented; however, such an argumentative reference of improvement reinforces the plausibility of the investigation, so that the effects of the components related to maximum strength are in fact related to running performance [
15,
16,
18,
21].
Furthermore, our study is also a pioneer in demonstrating that the DL movement can be an important predictor of both anaerobic and aerobic performance. The DL movement is similar to the SQ regarding its mechanical description (planes and axes of movement). It is an extension of the hip, knee and ankle, however, with different initial positioning, main action required (concentric only) and in its amplitude. Choe et al., [
25] also demonstrate that DL presents a greater peak joint torque on the hip extensors, compared to SQ (3.59 vs. 2.98 Nm·kg
−1, d = 0.81, p < 0.001). In this sense, we know that, mainly, the requirement for large ranges of motion when running is reasonably small, which makes the SQ an apparently unspecific element. Additionally, the extension movements of the hip, knee and ankle joints are the main accelerators of BM when performing short-term, such as in the MART [
15,
16]. Therefore, based mainly on the premise of specificity, there seems to be plausibility in using DL exercise in the context of running performance, and our study corroborates this argument, especially when the external load is relativized by BM (DL vs. MART – R
2 = 0.482; DL/BM vs. vMART – R
2 = 0.763; DL/BM vs. V
Peak – R
2 = 0.343. Therefore, the DL movement relativized by BM presents itself as a great alternative, explaining 76% of the variations in anaerobic and aerobic performance in participants with lower strength score levels (< 1.5 of BM).
However, despite this approach, in our study we saw that SQ is also relevant to explain running performance, even when faced with a kinematic pattern that is different from that used in running (deep squat). Since the movement of SQ, as well as its variations in the face of different manifestations of strength, appear in the literature as an optional evaluation measure and predictive mechanism [
16,
17,
18,
19], our results are in line, presenting a coefficient of determination capable of explaining 35% of the variations in anaerobic performance when we consider the gross external load (R
2 = 0.357), increasing its associative capacity to 64% when relativized by BM
1.0 (R
2 = 0.644). The prediction of V
Peak, however, only presented associative potential when relativized by BM
1.0 (SQ/BM vs. V
Peak – R
2 = 0.614), explaining 61% of the variations in aerobic performance.
Also in a pioneering way, we based our secondary hypothesis on the perspective that the combination of external loads in the DL and SQ movements could better predict both performances, compared to the measurement of strength alone. This justification originated from the idea that both movements produce specific (higher) torque on a given joint, as suggested by Choe et al., [
25]. However, our hypothesis H
2 was refuted, because despite the viability of its use as a performance predictor mechanism, the sum of strength measurements did not show superiority in the predictive model of anaerobic (R
2 = 0.45) and aerobic (R
2 = 0.27) performance, compared to the strength models alone, therefore, perhaps making it unnecessary to use two distinct assessments.
Comparison with the literature proved to be complex given its unique condition, since we do not have similar studies that carried out the force summation strategy. However, it is possible to make inferences about prediction analyses in different modalities, such as in Crossfit. Previous studies analyzed the sum of maximum strength variables in DL movements, “Clean” (Snatch) and “Pess” movements (any overhead pushing movements) and observed that the sum of the variables produced better predictive responses than the exercises alone, distancing themselves from our results [
32]. The authors also observed a negative correlation between VO
2Max (r = -0.79; p = 0.001), the maximum load lifted in the clean movement (r = -0.86; p = 0.001), squat (r = -0.65; p = 0.008) and front squat (r = -0.79; p = 0.002) and the sum of the absolute workloads (r = -0.78; p = 0.001) with performance in the Open 15.5 workout [
33]. Additionally, Meier, Rabel and Schmidt [
34,
35], are aligned with these statements, highlighting that the sum of the strengths of their personal records (PR) in the main basic movements can be used as a measure of success to predict physical performance.
Our hypothesis H
3 only reinforces the perspective observed on the subject in the literature. Reliability analysis has been extensively discussed for years, and we already know that although it varies from study to study, or from movement to movement, Grgic, Lazinica, Schoenfeld and Pedisic [
36], admit in their systematic review that, in view of 32 studies on the test-retest reliability of the 1RM assessment (n = 1595), they observed that 92% of the studies with moderate to excellent methodological quality presented ICC ≥ 0.90. In our study, the results were not different from the literature, presenting excellent stability for the DL movement (CCI = 0.99; 117.2 ± 32.7 kg vs. 120.2 ± 34.4 kg), as well as for the SQ movement (CCI = 0.99; 91.4 ± 24.6 kg vs. 93.2 ± 22.3 kg).
Finally, the second part of our study aimed to perform cross-validation of the generated equations. We believed that the equations would show a significant association between the actual and predicted measures (H1). However, our hypothesis was partially accepted. The predictive equations using DL and DL/BM showed a strong association between the actual and predicted MART performance measures (r = 0.766 and r = 0.757 - p = 0.001, respectively), with an estimated measurement error of 5.5 and 6.0%, respectively. Despite this small measurement error, only the equation generated by DL/BM did not differ significantly when compared (p = 0.051). Similarly, DL/BM also showed a moderate relationship between the actual and predicted VPeak measurements (r = 0.651; p = 0.005), however, with a very high measurement error (18.7%) and statistically different from the actual VPeak measurement (p = 0.002), which makes it unusable. When observing the SQ and SQ/BM measurements in the predictive context of MART, the estimated SQ was different from the real measurement (p = 0.019), however, SQ/BM showed borderline statistical equality between the predicted and the real measurement (p = 0.05), despite the high measurement error of 17.3%. The same did not occur for SQ and SQ/BM as a predictive mechanism for VPeak. In this case, the correlation did not demonstrate a significant relationship (r = 0.430 - p = 0.085; r = 0.089 - p = 0.733), in addition to presenting significant statistical differences, therefore, its practical use is not appropriate.
Ultimately, we observed a good relationship between predicted and predictor measures for the sum of SQ and DL workload (r = 0.683 - p = 0.003; r = 0.573 - p = 0.016, respectively for actual MART and V
Peak measures), however, only anaerobic performance benefited from the prediction, showing no differences between predicted and actual measures (p = 0.148), as well as to a low aggregate measurement error (6.3%).Despite these outcomes, as previously mentioned, it seems unnecessary to use both loads, since the measurement of DL or DL/BM to predict MART results alone already presents good correlation and low measurement error. We know that the cross-validation process is a procedure required to analyze whether a measure actually predicts what it is intended to predict [
37]. Evidence over the past few years has produced predictive equations for maximal oxygen consumption [
38,
39] as well as for external load variables related to aerobic and anaerobic performance [
40,
41,
42], with varying results. Mahar et al., [
40], analyzed the predictive validity of the equations generated by the PACER (Progressive Aerobic Cardiovascular Endurance Run) test in adolescents, and observed that the regression demonstrated that the Quadratic Model and the Linear Model were slightly more accurate than other VO
2Max estimation models. The correlations for these models between measured and estimated VO
2Max were r = 0.75 and r = 0.74) and with very similar levels of precision (total error of 6.37 and 6.59 mL·kg
-1·min
-1, respectively). Similar to our outcomes, some predictive models, despite presenting moderate to high correlations, low estimation accuracies were observed (V
Peak estimation through DL/BM = 18.7%; SQ = 10.0%; SQ/BM = 17.4% typical measurement error).