Submitted:
27 November 2024
Posted:
29 November 2024
You are already at the latest version
Abstract
Mimosa series Cordistipulae was created by Barneby in 1991, embracing species diagnosed by the small subshrubby habit, presence of gland-tipped setae and trimerous flowers. Most species are endemic to Northeastern Brazil, and some possess characters deemed diagnostic which nonetheless overlap, making species identification difficult. Our study aimed to test species circumscriptions and sets of characters that could be applied to unequivocally distinguish the species. Twelve populations (225 individuals) were collected at nine localities, encompassing the Brazilian vegetation types Caatinga, Campos Rupestres and Restinga. Linear measurements of 38 floral and vegetative characters were measured and analyzed using Canonical Variates Analysis and Cluster Analysis. The first two canonical axes explained 41.4% and 18.9% of the variation and separated two populations of the group recently described as new species. Vegetative characters are more informative for species delimitation than flower characters, and most groups are distinguished primarily by the number of pinnae pairs, number of leaflets per pinna and length of the leaf rachis. The species displaying highest morphological similarity are M. misera, M. leptantha, and M. minarum. The traditional morphometric approach was capable to objectively deal with a type of variation that would be difficult to interpret by purely examining herbarium specimens.
Keywords:
Canonical Variate Analysis
; Cluster Analysis
; multivariate analysis
; species delimitation
1. Introduction
Mimosa L. with 530 species is one of the largest genera of Leguminosae [1], occurring in Central Mexico, United States, Central America, South America, Southeast Africa and India [2]. in the 90’s five sections and 78 series of Mimosa were established [3]. In this monograph, Series Cordistipulae Barneby includes 13 species: Mimosa guaranitica Chodat & Hassl., M. misera Benth., M. morroënsis Barneby, M. setuligera Harms, M. ulbrichiana Harms, M. hirsuticaulis Harms, M. borboremae Harms, M. minarum Barneby, M. brevipinna Benth., M. leptantha Benth., M. cordistipula Benth., M. blanchetii Benth. and M. xiquexiquensis Barneby [3]. More recently, five new species, M. bahiana J. Gelma, L.P. Queiroz & Van den Berg, M. confusa J. Gelma, L.P. Queiroz & Van den Berg, Mimosa crassifolia J. Gelma, L.P. Queiroz & Van den Berg, Mimosa melosa J. Gelma, L.P. Queiroz & Van den Berg and M. rubra V.F.Dutra & F.C.P. Garcia were described [4,5].
Species of series Cordistipulae are often functionally herbaceous subshrubs seldom more than 1 m and their branches are covered with a viscid indumentum composed of gland-tipped setae. Prickles are generally absent, stipules are lanceolate, spicules and paraphyllidia are absent, and flowers are trimerous. Most species occur in the Brazilian state of Bahia and in other states of Northeastern Brazil such as Pernambuco, Ceará and Piauí, growing in open areas of Caatinga vegetation or in sandy soils in Campo Rupestre vegetation [3,6]. A comprehensive phylogeny of the genus was presented by [1] based on the trnD-T plastid spacer. In their study, 259 species of Mimosa were sampled of which ten belong to ser. Cordistipulae. The series was recovered as monophyletic (corresponding to their “Clade I”) and trimerous flowers indicated as a putative synapomorphy for the group.
Taxonomy of series Cordistipulae has been mostly based in quantitative characters, including number of pinnae per leaf, number of leaflets per pinna, and measurements of leaf and flower structures. Several of these characters overlap in closely related species rendering identification a difficult task in some groups of species. This is especially the case of the species related to M. misera (hereinafter called as the misera complex). The species M. misera had already been regarded as an “imperfect species” [7] without giving justification for this definition. M. misera was also pointed out as an “amorphous” and “undetermined” species [3], and the same author listed M. cordistipula, M. guaranitica, M. leptantha, M. minarum and M. setuligera as closely related to it. Besides these species, during taxonomic work in herbarium specimens, we found overlap in pinnae length between M. brevipinna and M.setuligera.
Multivariate analyses have been successfully and widely employed to help untangle species complexes in angiosperms [8,9,10,11,12,13,14,15,16]. In Leguminosae, a search in the literature revealed that many “morphometric” studies are actually numerical taxonomy studies trying to infer species relationships with cluster analyses of qualitative and quantitative characters e.g. [17,18,19]. However, there are several studies that demonstrated the potential of morphometric data associated with multivariate ordination techniques to help in the delimitation of species complexes in genera taxonomically scattered within the family, such as Acacia [20], Apuleia [21], Astragalus [22], Bauhinia [23], Chamaecrista [24], Daniellia [25], Daviesia [26], Lens [27], Lupinus [28] and Ononis [29], among others. Some of these studies included also genetic data, but many obtained good results only with morphological quantitative evidence. Despite this, the number of studies using morphometrics for delimiting species complexes in legumes can be considered small in relation to the size of the family and the abundance of species complexes lacking studies.
In this work we carry out morphometric analyses of putative taxa within ser. Cordistipulae aiming to assess if quantitative linear measurements associated with multivariate analyses can clarify the interspecific boundaries within the misera complex to answer the following questions: Which suites of morphological characters are useful to recognize species within the group? How to evaluate the morphological variation and identify the species? What are the relationships among morphological variation, species niches and phylogeny of the species? How effective morphometric methods are for dealing with species complexes difficult to resolve with traditional herbarium taxonomy?
2. Results
All the chi-square values associated to the eleven axes of the CVA analysis were significant (Table 1). In the classification matrix, no individual was classified outside the group to which it was originally assigned. Well-defined groups were formed, as it can be observed in Figure 1, Figure 2, Figure 3, Figure 4 and Figure 5. These groups mostly correspond to species described by Barneby [3,6], except for two groups.
The vegetative characters most important for the differentiation of the species were the number of pinnae per leaf, number of leaflet per pinna, distance between leaflets along the pinna and leaflet width. Among the reproductive characters the most important were stamen length and bracteole dimensions.
The scatterplot of Figure 1 the first axis explains 41.40% of the total variation. Two groups can be distinguished along the first axis, one including the populations of M. setuligera (Mset) and the recently described Mimosa crassifolia (Mcra) and denominated G1, and a second group comprising the remaining populations. The most important characters for the differentiation of these groups were vegetative characters (# V.6, V.11, V.12, V.13, V.21; Table 3). The differentiation of M. setuligera and M. crassifolia from the remaining taxa in G2 is due to them having ca. twice the number of pinnae per leaf and leaflets twice as long as the taxa in G2.
The second axis explains 18.9% of the total variation (Figure 1) and distinguishes the recently described M. confusa (Mcon) from other species in group G2. The most important characters for the differentiation of this species are V.14, V.18, V.27, V.28. In this case M. confusa differs from other species in group G2 by a larger number of leaflets in the terminal pinnae (e.g. double the number of M. cordistipula), oblong basal leaflets (linear in the remaining species of G2) and many more flowers (often double) per glomerule (more than 80 flowers per inflorescence).
The third canonical axis (Figure 2) distinguishes M. cordistipula (Mc) from the remaining populations, in special due to the characters V.1, V.6, V.23, V.25, V.31; Table 3). These characters indicate much larger stipule length and petiole length, and width of the last leaflet pairs for this species. The stipules are much larger in M. cordistipula, e.g. in comparison to M. misera. In the former, the stipules are persistent, even after dropping leaflets, and measure 4–6 mm, deeply lanceolate and with a spinescent apex. In M. misera stipules are much smaller, and caducous with the leaflets, and measure 2–4 mm and never spinescent. In addition to measures, the terminal leaflets in the first pair of pinnae are half the size in relation to the remaining species in the group.
In the fourth canonical axis (Figure 3) the two species within group G1, M. setuligera (Mset) and the recently described M. crassifolia (Mcra) are separated, with the most important characters V.9, V.11, V.24, V.30, V.38; Table 3. These variables reflect the well-defined leaf patterns which distinguish these two species. Mimosa setuligera presents a larger number of pinnae along the leaf rachis in relation to M. crassifolia. Moreover, these pinnae are relatively shorter than M. setuligera. Also, the leaflets of M. setuligera are spathulate whereas in M. crassifolia they are oblong. In this case floral characters also are important because the stamens of M. setuligera are longer with 7–9 mm, whereas in M. crassifolia they are 4–5 mm long.
The fifth axis distinguishes M. guaranitica (Mgua) from other species, especially M. leptantha, and one of the populations of M. minarum (Mmin1, Figure 4), with the most important characters being V.5, V.7, V.20, V.31. Mimosa guaranitica can therefore be distinguished by its rachis dimensions of the first interpinnae segment. The rachis of M. guaranitica is relatively shorter but the interpinnae segment is longer, when compared to M. minarum and M. leptantha. Therefore, pinnae of M. guaranitica are more sparsely distributed in relation to the other two species. Additionally, M. guaranitica has narrower bracteoles in relation to the other two.
The sixth axis distinguishes the populations of M. leptantha (Mlept1 and Mlept2) from the populations of M. misera (Mmis1, Mmis2 and Mmis3) with slight overlaps (Figure 5). These are similar species from different habitats (restinga and caatinga). M. leptantha is distinguished from M. misera for shorter first interpinnae segments, and larger number of pinnae pairs and leaflet pairs per pinna (V.7, V.11, V.14). In this way, the pinnae of M. leptantha are more clustered along the rachis, even though the length of the rachis between the two species are similar.
Two major groups can be observed in the dendrogram of Figure 6, which correspond the to same groups G1, and G2 seen in the CDA (Figure 1). The populations assumed to be conspecific grouped together. The smallest distance is observed among the populations of M. leptantha, followed by the populations of M. misera, where the most different population is Mmis3 (Oeiras). Mimosa guaranitica was clustered near the populations of M. minarum. The populations Mcon and Mc are the most distinct within group G2.
3. Discussion
3.1. Comparison Between Morphometric Patterns and Traditional Taxonomy of the M. misera Species Complex
One of the main aims of the present study was to assess the difficult circumscription of M. misera, as indicated in the literature. As circumscribed by morphometric data, M. misera (occurring in sandy areas of the inland semi-arid caatingas) appeared more similar to M. leptantha than to M. guaranitica in opposition to the ideas presented in the earlier taxonomic monograph of the group [3]. M. leptantha occurs in sand dunes along the coast, in restinga vegetation, whereas M. guaranitica occurs in highland campo rupestre vegetation (also in sandy soils) and disjunctly in savanna vegetation of northeastern Paraguay and Argentina. It also occurs in northeastern Mexico but the latter occurrence has been assumed as a recent invasion [3]: “an antropochorous newcomer to Mexico”. This suggests that probably M. misera and M. leptantha can be a pair of related species that share similar sandy habitats in lowlands, but originated by allopatric speciation, whereas M. guaranitica occurs in much higher habitats. In the UPGMA cluster analysis the populations of Mimosa misera group together. This provides evidence that there are characters that unite the populations of this species, at least at quantitative morphometric level. However, no single diagnostic characters could be identified, and the aggregation of the M. misera populations is due to a combination of several vegetative characters, including measurements of the petiole, stipules, rachis, pinnae, and leaflets. Beyond this polythetic nature, which in fact extend to many species of the whole group studied, M. misera seems to bear the set of characters with most intermediacy among all others in the group (for this reason it was clearly separated only in the Axis 6 of the CVA, indicating many other stronger patterns of separation in the group before this one could be observed), what explains why this taxon has been historically regarded as problematic, when [6] considered M. misera an “imperfect species”, and [3] as “amorphous” and “undetermined”. On the other hand, the results indicate the power of morphometric data together with CDA to recover patterns of quantitative variation which cannot be studied in herbarium materials by pure observation without statistical techniques.
The position of M. minarum also deserves attention. Previously, there have been suggested morphological affinities among M. minarum, M. guaranitica and M. misera [3], being the main difference between M. minarum and M. guaranitica the petiole length. Our results point out again to a combination of characters, such as stipule length, number of pinnae pairs and leaflet measurements. In the phylogeny of Mimosa [1], M. minarum was not even in the same clade as M. guaranitica and M. misera. It was sister to a different clade, with species that presented no problems for delimitation. Mimosa rubra is morphologically quite similar and occur in sympatry with M. minarum, differing mostly by the reddish branches and foliage and sparse indumentum [4] and is probably phylogenetically related to M. minarum. The morphometric and phylogenetic differences have additional support from its allopatric distribution. Mimosa minarum occurs in Minas Gerais state, at least 600km away from populations of M. guaranitica and M. misera.
3.2. Overall Comparison Between Morphometric Clusters and Phylogenetic Relationships
A phylogenetic study of Mimosa [1] sampled ten out of the 18 species ascribed to ser. Cordistipulae. The series was strongly supported as monophyletic with two well-supported subclades. Species of the misera complex appeared in the two subclades: (A) M. minarum and M. setuligera grouped with M. blanchetii and M. xiquexiquensis and (B) M. cordistipula, M. guaranitica, M. leptantha and M. misera clustered with M. morroënsis and M. ulbrichiana. The fact that species of the misera complex appeared dispersed in two well-supported monophyletic groups is a clear indicative that the similar morphology found in the misera complex arose by convergence rather than reflecting common ancestry. The subclade A brings together rupicolous species that grow in high mountain areas above 900 m, except for the lowland sand dune M. xiquexiquensis while subclade B holds lowland species that grows until 600 m high. This finding is in agreement with the general phylogenetic pattern found in Mimosa [1] in which the deeper nodes in Mimosa phylogeny agree better with geographical areas than morphology. At lower level, ecology seems to better explain relationships than morphology within ser. Cordistipulae.
3.3. Usefulness and Perspectives for the Use of Multivariate Morphometrics in Leguminosae
When trying to compare the performance of our study with other morphometric studies in Leguminosae, we verified the extreme heterogeneity of approaches and purposes. As an example, in the present study, vegetative characters performed clearly better to differentiate species than floral characters. This seems to be a common pattern in Legumes, at least at morphometric level. Often, species taxonomy in Leguminosae relies heavily in leaf characters, and there is extensive variation in leaflet size among individuals within and between populations. This size variation as well as allometric effects in shape could explain the difficulties of previous Mimosa taxonomists in interpreting the species patterns that seem quite evident in the results of our analyses. For this reason, we should stress here the usefulness of multivariate morphometrics to deal with species complexes where the standard herbarium approach does not achieve immediate success, and species seem to overlap. Another morphometric study trying to delimit species of Chamaecrista [24] also pointed out for the use of leaf characters, when the number of leaflet pairs, the length of the second pair of leaflets and petiole length provided well-delimited taxa. Ours and the latter study had a very similar experimental design, with multiple population sampling within species, and multiple samples per population. Despite the fact that multivariate morphometrics is composed of old and straightforward techniques, very few studies follow the same experimental design just mentioned. After an extensive review, we found that early studies tended to try to infer the “relationships” of a group of species based on few samples of each (e.g. [17,30]), in the old numerical taxonomy context, considered today a bad use for morphometric data. Other studies were mostly interested in the separation of a single pair of species [30,31,32,33], with reasonable success. Some other studies used a mixture of genetic and morphometric data, generally sampling a single population or even pooling scattered individuals of each species and trying to detect differences [20,21,35,36]. This type of approach should rely on analyses that do not imply previous group assumptions (e.g. Principal Components of Principal Coordinates). Because of the statistical assumptions, the use of CVA (as in our study) should be carried out with caution. To use this technique, the experimental design must sample multiple individuals in real populations in the field and try whenever possible to have multiple populations of the assumed taxa (even though for some endemic taxa this will not be possible, in the case of some species in the current study). The algebra involved in CVA is based on removing the variation of the within-population variance followed by maximization of the group differences [35,36,37]. If CVA is applied to an experimental design with only a single population of each species, or worse, a pooled collection of herbarium specimens from different locations representing each species, the results could be philosophically flawed [38]. In this case, the variation within each species will be shrunk by the statistic technique, and differences and discontinuities might be simply caused by the groups assumed rather than any real biological differences. In this type of experimental design, researchers should prefer to base their results only on Principal Component Analysis (PCA) instead of CVA. The PCA approach should be used in this experimental design to preserve the original distances between samples and, if distinct groups are recovered in the analysis, they will correspond to real discontinuities that might be interpreted as putative species. Based on the results of the current study and the optimal experimental design for CVA, we suggest that future studies aiming at species delimitation are performed always based on an experimental design previously intended for multivariate morphometric analysis of population data, with individual sampling of the populations in each location, multiple locations per species whenever possible, and the use of CVA. Besides the current study, there was only other study with field sampling designed specifically for CVA that we found and cited in the current paper [24]. When based only in pooled herbarium samples for each species the studies should avoid CVA and prefer PCA, PCO and NMDS despite their lower discriminatory power (good examples of this design in legumes are [22,39,40].
4. Materials and Methods
4.1. Data Collection
We sampled a total of 225 individuals in 12 natural populations (Table 2; Figure 7). including all taxa of the misera complex encompassing the entire range of the species, including type localities, except in the case of M. guaranitica for which it was not possible sampling extra-Brazilian populations, and the rare and newly described M. rubra which is know by only by two collections [4] and was described after we finished our experiment. Also, the species Mimosa bahiana and M. melosa, recently described [5] from herbarium material, were not known when we collected the data used in the current study, and the available herbarium material was unsuitable for the statistical designed that was used, that follows. Fifteen to twenty individuals were sampled at each population, and the individuals collected were at least one meter apart from each other, to avoid clonality. Definition of the sampling area was based on the geographical distribution of series Cordistipulae, which is highly concentrated in Eastern Brazil, in the Northeastern coast, from Ceará to Rio Grande do Norte states (3º 58’S) to Northern Minas Gerais State (17º 45’ S). Populations were assigned to species recognised by Barneby [3] using diagnostic characters proposed by this author. As we aimed to test species circumscription, the ascription of a population to a species represented only an initial taxonomic hypothesis, but was not used as a categorial variable for the analyses. We collected one population of each M. cordistipula (Mc), M. guaranitica (Mgua) and M. setuligera (Mset), two populations of M. lepthanta (Mlept1, Mlept2), M. minarum (Mmin1, Mmin2) and three populations of M. misera (Mmis1, Mmis2, Mmis3). Two populations included in this study could not be assigned to any known species at the time of data collection but were later described with the names Mimosa crassifolia (Mcra) and Mimosa confusa (Mcon)[40], based on the data which is presented in the current paper. M. brevipinna (known only from the type material deposited at K) was not found in the field, despite efforts made in several field trips, and therefore could not be included in the study. Vouchers are housed at the herbarium of Feira de Santana State University (HUEFS; Table 2). A total of 38 linear measurements were taken, being 12 floral characters and 26 vegetative characters (Table 3). Measures were taken from the third leaf from the apex and from the apical flowers of the apical glomerule of axillary inflorescences. Due to the small size of the structures, measures of continuous characters were taken from camera-lucida outlines of the structures using of a Zeiss Stemi SV11 stereomicroscope. The measurements of the drawings were made with an engineer’s scale and then converted back to the real sizes of the structures. A data matrix with all the measurements was prepared for the statistical analyses.
4.2. Data Analysis
We employed Canonical Variate Analysis (CVA), taking only the populations as categorical variable (the individuals were grouped according to the populations to which they belong) in order to detect the patterns of differentiation of groups and evaluate which characters influence their separation, without pre-defining the species. This could not be avoided in species with a single population, however in the overall dataset we assess the clustering and ordination patterns without forcing any of the species clustering by maintaining only the population level as an a priori assumption. The number of axes to be interpreted was chosen with basis on the chi-square value obtained from successive root removal [41]. The standardized coefficients were used to analyze the contribution of characters to canonical axes. A cluster analysis was performed in order to investigate patterns of hierarchical clustering of the different groups. For this purpose we used the UPGMA algorithm (Unweighted Pair Group Method with Arithmetic Averages [42]) on the Generalized Mahalanobis Distances between group centroids, obtained during the CVA. In the CVA we also examined the classification matrix of individuals in the groups, based on the proximity to the inferred centroids for each group. This was used to assess the level of coherence of each group originally postulated.
Author Contributions
Conceptualization, C.v.d.B and L.P.Q.; methodology, C.v.d.B and M.C.M.; software, C.v.d.B and J.G.A.N.; investigation, J.G.A.N. writing—original draft preparation, J.G.A.N., M.C.M. and C.v.d.B.; writing—review and editing, L.P.Q. All authors have read and agreed to the published version of the manuscript.
Funding
This research was funded by Coordenação de Aperfeiçoamento de Pessoal de Nível Superior (CAPES finance code 001) with a scholarship to J.G.A.N., Fundação de Amparo à Pesquisa e Conselho Nacional de Desenvolvimento Científico e Tecnológico (FAPESB/CNPq grant PNX0014/2009). L.P.Q. and C.v.d.B thank for productivity grants from CNPq (Pq-1A).
Data Availability Statement
Original data matrices can be requested to the C.v.d.B.
Acknowledgments
We thank A.K. Santos, D.B.O.S. Cardoso, J. Costa, T.S. Nunes and L. Lima for helping on field excursions.
Conflicts of Interest
The authors declare no conflicts of interest.
References
- Simon, M.F.; Grether, R.; Queiroz, L.P.; Särkinen, T.E.; Dutra, V.F.; Hughes, C.E. The evolutionary history of Mimosa (Leguminosae): toward a phylogeny of sensitive plants. Amer. J. Bot. 2011, 98, 1201–1221. [Google Scholar] [CrossRef] [PubMed]
- Lewis, G.P.; Schrire, B.; Mackinder, B.; Lock, M. Legumes of the world; Royal Botanic Gardens, Kew: Richmond, United Kingdom, 2005. [Google Scholar]
- Barneby, R.C. Sensitivae Censitae: a description of the genus Mimosa Linnaeus (Mimosaceae) in New World. Mem. New York Bot. Gard. 1991, 65, 1–835. [Google Scholar]
- Dutra, V.F.; Garcia, F.C.P. Three new species of Mimosa (Leguminosae) from Minas Gerais, Brazil. Syst. Bot. 2013, 38, 398–405. [Google Scholar] [CrossRef]
- Nascimento, J.G.A.; Rocha,L. ; Dutra, V.F.; Queiroz, L.P.; van den Berg, C. Phytotaxa 2023, 599, 265–279. [Google Scholar]
- Barneby, R.C. The genus Mimosa (Mimosaceae) in Bahia, Brazil: new taxa and nomenclatural adjustments. Brittonia 1985, 37, 125–153. [Google Scholar] [CrossRef]
- Bentham, G. Notes on Mimoseae, with a short synopsis of species. J. Bot. (Hooker) 1842, 4, 323–418. [Google Scholar]
- Borba. E.L.; Shepherd, G.J.; van den Berg, C.; Semir. J. Floral and vegetative morphometrics of five Pleurothalis (Orchidaceae) species: correlation with taxonomy, phylogeny, genetic, variability and pollination systems. Ann. Bot. 2002, 90, 219–230. [Google Scholar] [CrossRef]
- Goldman, D.H.; van den Berg, C.; Griffith, M.P. Morphometric circumscription of species and infraspecific taxa in Calopogon R.Br. (Orchidaceae). Pl. Syst. Evol. 2004, 274, 37–60.
- Schmalzel, R.J.; Nixon, R.T.; Best, A.L. Morphometric variation in Coryphantha robustipina (Cactaceae). Syst. Bot. 2004, 29, 553–568. [Google Scholar] [CrossRef]
- Oliveira, R.P.; Borba. E.L.; Longhi-Wagner, H.M. Morphometrics of herbaceous bamboos of the Raddia brasiliensis complex (Poaceae–Bambusoideae): implications for the taxonomy of the genus and new species from Brazil. Pl. Syst. Evol. 2007, 270, 159–182. [Google Scholar] [CrossRef]
- Ribeiro, P.L.; Borba, E.L.; Smidt, E.C.; Lambert, S.M.; Schnadelbach, A.S.; van den Berg, C. Genetic and morphological variation in the Bulbophyllum exaltatum (Orchidaceae) complex occurring in the Brazilian “campos rupestres”: implications for taxonomy and biogeography. Pl. Syst. Evol. 2008, 270, 109–137. [Google Scholar] [CrossRef]
- Venhuis, C.; Venhuis, P.; Oostermeijer, J.G.B.; van Tienderen, P.H. Morphological systematics of Serapias L. (Orchidaceae). Pl. Syst. Evol. 2007, 265, 165–177. [Google Scholar] [CrossRef]
- Andrade. M.; Mayo, S.J.; Kirkup, D.; van den Berg, C. Comparative morphology of populations of Monstera Adans. (Araceae) from natural forest fragments in Northeast Brazil using Elliptic Fourier Analysis of leaf outlines. Kew Bull. 2008, 63, 193–211. [Google Scholar] [CrossRef]
- Marcussen, T.; Borgen, L. Species delimitation in the Ponto-Caucasian Viola sieheana complex, based on evidence from allozymes, morphology, ploidy levels, and crossing experiments. Pl. Syst. Evol. 2011, 291, 183–196. [Google Scholar] [CrossRef]
- Sosa, M.M.; Panseri, A.; Damateis, M. Morphometric analysis of Stemodia hyptoides and S. stricta (Plantaginaceae). Pl. Syst. Evol. 2012, 298, 1315–1326.
- Doğan, M.O.; Kence, A.; Tigin, C. Numerical taxonomic study on the genus Lathyrus (Leguminoseae). Edinburgh J. Bot. 1992, 49, 333–341. [Google Scholar] [CrossRef]
- Rahman, M.Z.; Rahman, M.O. Morphometric analysis of Desmodium Desv. in Bangladesh. Bangladesh J. Bot. 2012, 41, 143–148. [Google Scholar] [CrossRef]
- Rahman, M.O.; Rhaman, M.Z.; Begum, A. Numerical taxonomy of the genus Senna Mill. from Bangladesh. Bangladesh J. Pl. Taxon. 2013, 20, 77–83. [Google Scholar] [CrossRef]
- Casiva, P.V.; Saidman, B.O.; Vilardijc, J.C.; Cialdella, A.M. First comparative phenetic studies of Argentinean species of Acacia (Fabaceae), using morphometric, isozymal, and RAPD approaches. Amer. J. Bot. 2002, 89, 843–853. [Google Scholar] [CrossRef]
- Souza, I.M.; Funch, L.S.; Queiroz, L.P. Morphological analyses suggest a new taxonomic circumscription for Hymenaea courbaril L. (Leguminosae, Caesalpinioideae). PhytoKeys 2014, 38, 101–118. [Google Scholar] [CrossRef]
- Knaus, B.J. Morphometric architecture of the most taxon-rich species in the U.S. Flora: Astragalus lentiginosus (Fabaceae). Amer. J. Bot. 2010, 97, 1816–1826. [Google Scholar] [CrossRef]
- Boonkerd, T.; Saengmanee, S.; Baum, B.R. The varieties of Bauhinia pottsii G. Don in Thailand (Leguminosae-Caesalpinioideae). Pl. Syst. Evol. 2002, 232, 51–62. [Google Scholar] [CrossRef]
- Conceição, A.S.; Queiroz, L.P.; Lambert, S.M.; Pereira, A.C.S.; ,Borba. E.L. Biosystematics of Chamaecrista sect. Absus subsect. Baseophyllum (Leguminosae-Caesalpinioideae) based on allozyme and morphometric analyses. Pl. Syst. Evol. 2008, 270, 183–207. [Google Scholar]
- Estrella, M.; Aedo, C. ; Velayos. M. A morphometric analysis of Daniellia (Fabaceae–Caesalpinioideae). Bot. J. Linn. Soc. 2009, 159, 268–279.
- Chandler, G.T.; Crisp, M.D. Morphometric and phylogenetic analysis of the Daviesia ulicifolia complex (Fabaceae, Mirbelieae). Pl. Syst. Evol. 1998, 209, 93–122. [Google Scholar] [CrossRef]
- Hoffman, D.L.; Muehlbauer. F.J.; Ladizinsky. G. Morphological variation in Lens (Leguminosae). Syst. Bot. 1988, 13, 89–96. [Google Scholar] [CrossRef]
- Riggins, R.; Pimentel. R.A.; Walters, D.R. Morphometrics of Lupinus nanus (Leguminosae). I. Variation in natural populations. Syst. Bot. 1977, 2, 317–326. [Google Scholar] [CrossRef]
- Agulló, J.C.; Juan, A.; Alonso. M.; Terrones, A.; Crespo, M.B. Taxonomic status of Ononis tridentata (Fabaceae) from Morocco, resolved by multivariate morphometric analyses. Pl. Biosyst. 2013, 147, 645–653. [Google Scholar] [CrossRef]
- Ahmad, M.; McNeil, D.L.; Sedcole, J.R. Phylogenetic relationships in Lens species and their interspecific hybrids as measured by morphological characters. Euphytica 1997, 94, 101–111. [Google Scholar] [CrossRef]
- Maxted, N. A phenetic analysis of Vicia section Atossa series Truncatulae (Leguminosae: Vicieae). Kew Bull. 1993, 48, 739–753. [Google Scholar] [CrossRef]
- Kirchner, F.; Bullock, J.M. Taxonomic separation of Ulex minor Roth. and U. gallii Planch.: morphometrics and chromosome counts. Watsonia 1999, 22, 365–376. [Google Scholar]
- Sheidai, M.; Yazdanbakhsh, Z.; Assadi, M.; Moussavi, M. Cytology and morphometry study of Alhagi (Leguminosae) species in Iran. Nordic J. Bot. 2001, 21, 83–91. [Google Scholar] [CrossRef]
- Ceolin, B.G.; Miotto, S.T.S. Combining ecological and morphometrical approaches to increase the resolution within the Galactia neesii (Leguminosae) complex. Pl. Syst. Evol. 2012, 298, 645–652. [Google Scholar] [CrossRef]
- Fisher, R.A. The use of multiple measurements in taxonomic problems. Ann. Eugenics 1936, 7, 179–188. [Google Scholar] [CrossRef]
- Rencher, A.C.; Christensen, W.F. Methods of multivariate statistics, 3rd ed.; John Wiley & Sons: Hoboken, U.S.A, 2012; pp. 281–308. [Google Scholar]
- Zelditch, M.L.; Swiderski, D.L.; Sheets, H.D. Geometric morphometrics for biologists: a primer., 2nd ed.; Academic Press: San Diego, U.S.A, 2012; pp. 151–167. [Google Scholar]
- Bateman. R.M. Evolution and classification of European orchids: insights from molecular and morphological characters. J. Eur. Orch. 2001, 33, 501–568. [Google Scholar]
- Kropf, M. Intraspecific patterns of European mountain plants: a morphometric analysis confirms molecular results in the submediterranean oreophyte. Taxon 2008, 57, 511–524. [Google Scholar]
- Sousa, F.P.S.T.; Lewis, G.P.; Hawkins, J.A. A revision of the South American genus Apuleia (Leguminosae, Cassieae). Kew Bull. 2010, 65, 225–232. [Google Scholar] [CrossRef]
- Bartlett, M.S. Multivariate analysis. J. Royal Stat. Soc. 1947, 9, 176–197. [Google Scholar] [CrossRef]
- Sneath, P.H.A.; Sokal, R.R. Numerical taxonomy; W.H.Freeman: San Francisco, U.S.A.; 1973. [Google Scholar]
Figure 1.
Canonical Axis 1 and 2 of a Canonical Variate Analysis of twelve populations in Mimosa series Cordistipulae based on 38 morphological characters. Axis one corresponds to 41.40 % of the total variance and axis 2 corresponds to18.9 %. For legend codes, please See Table 2.
Figure 1.
Canonical Axis 1 and 2 of a Canonical Variate Analysis of twelve populations in Mimosa series Cordistipulae based on 38 morphological characters. Axis one corresponds to 41.40 % of the total variance and axis 2 corresponds to18.9 %. For legend codes, please See Table 2.
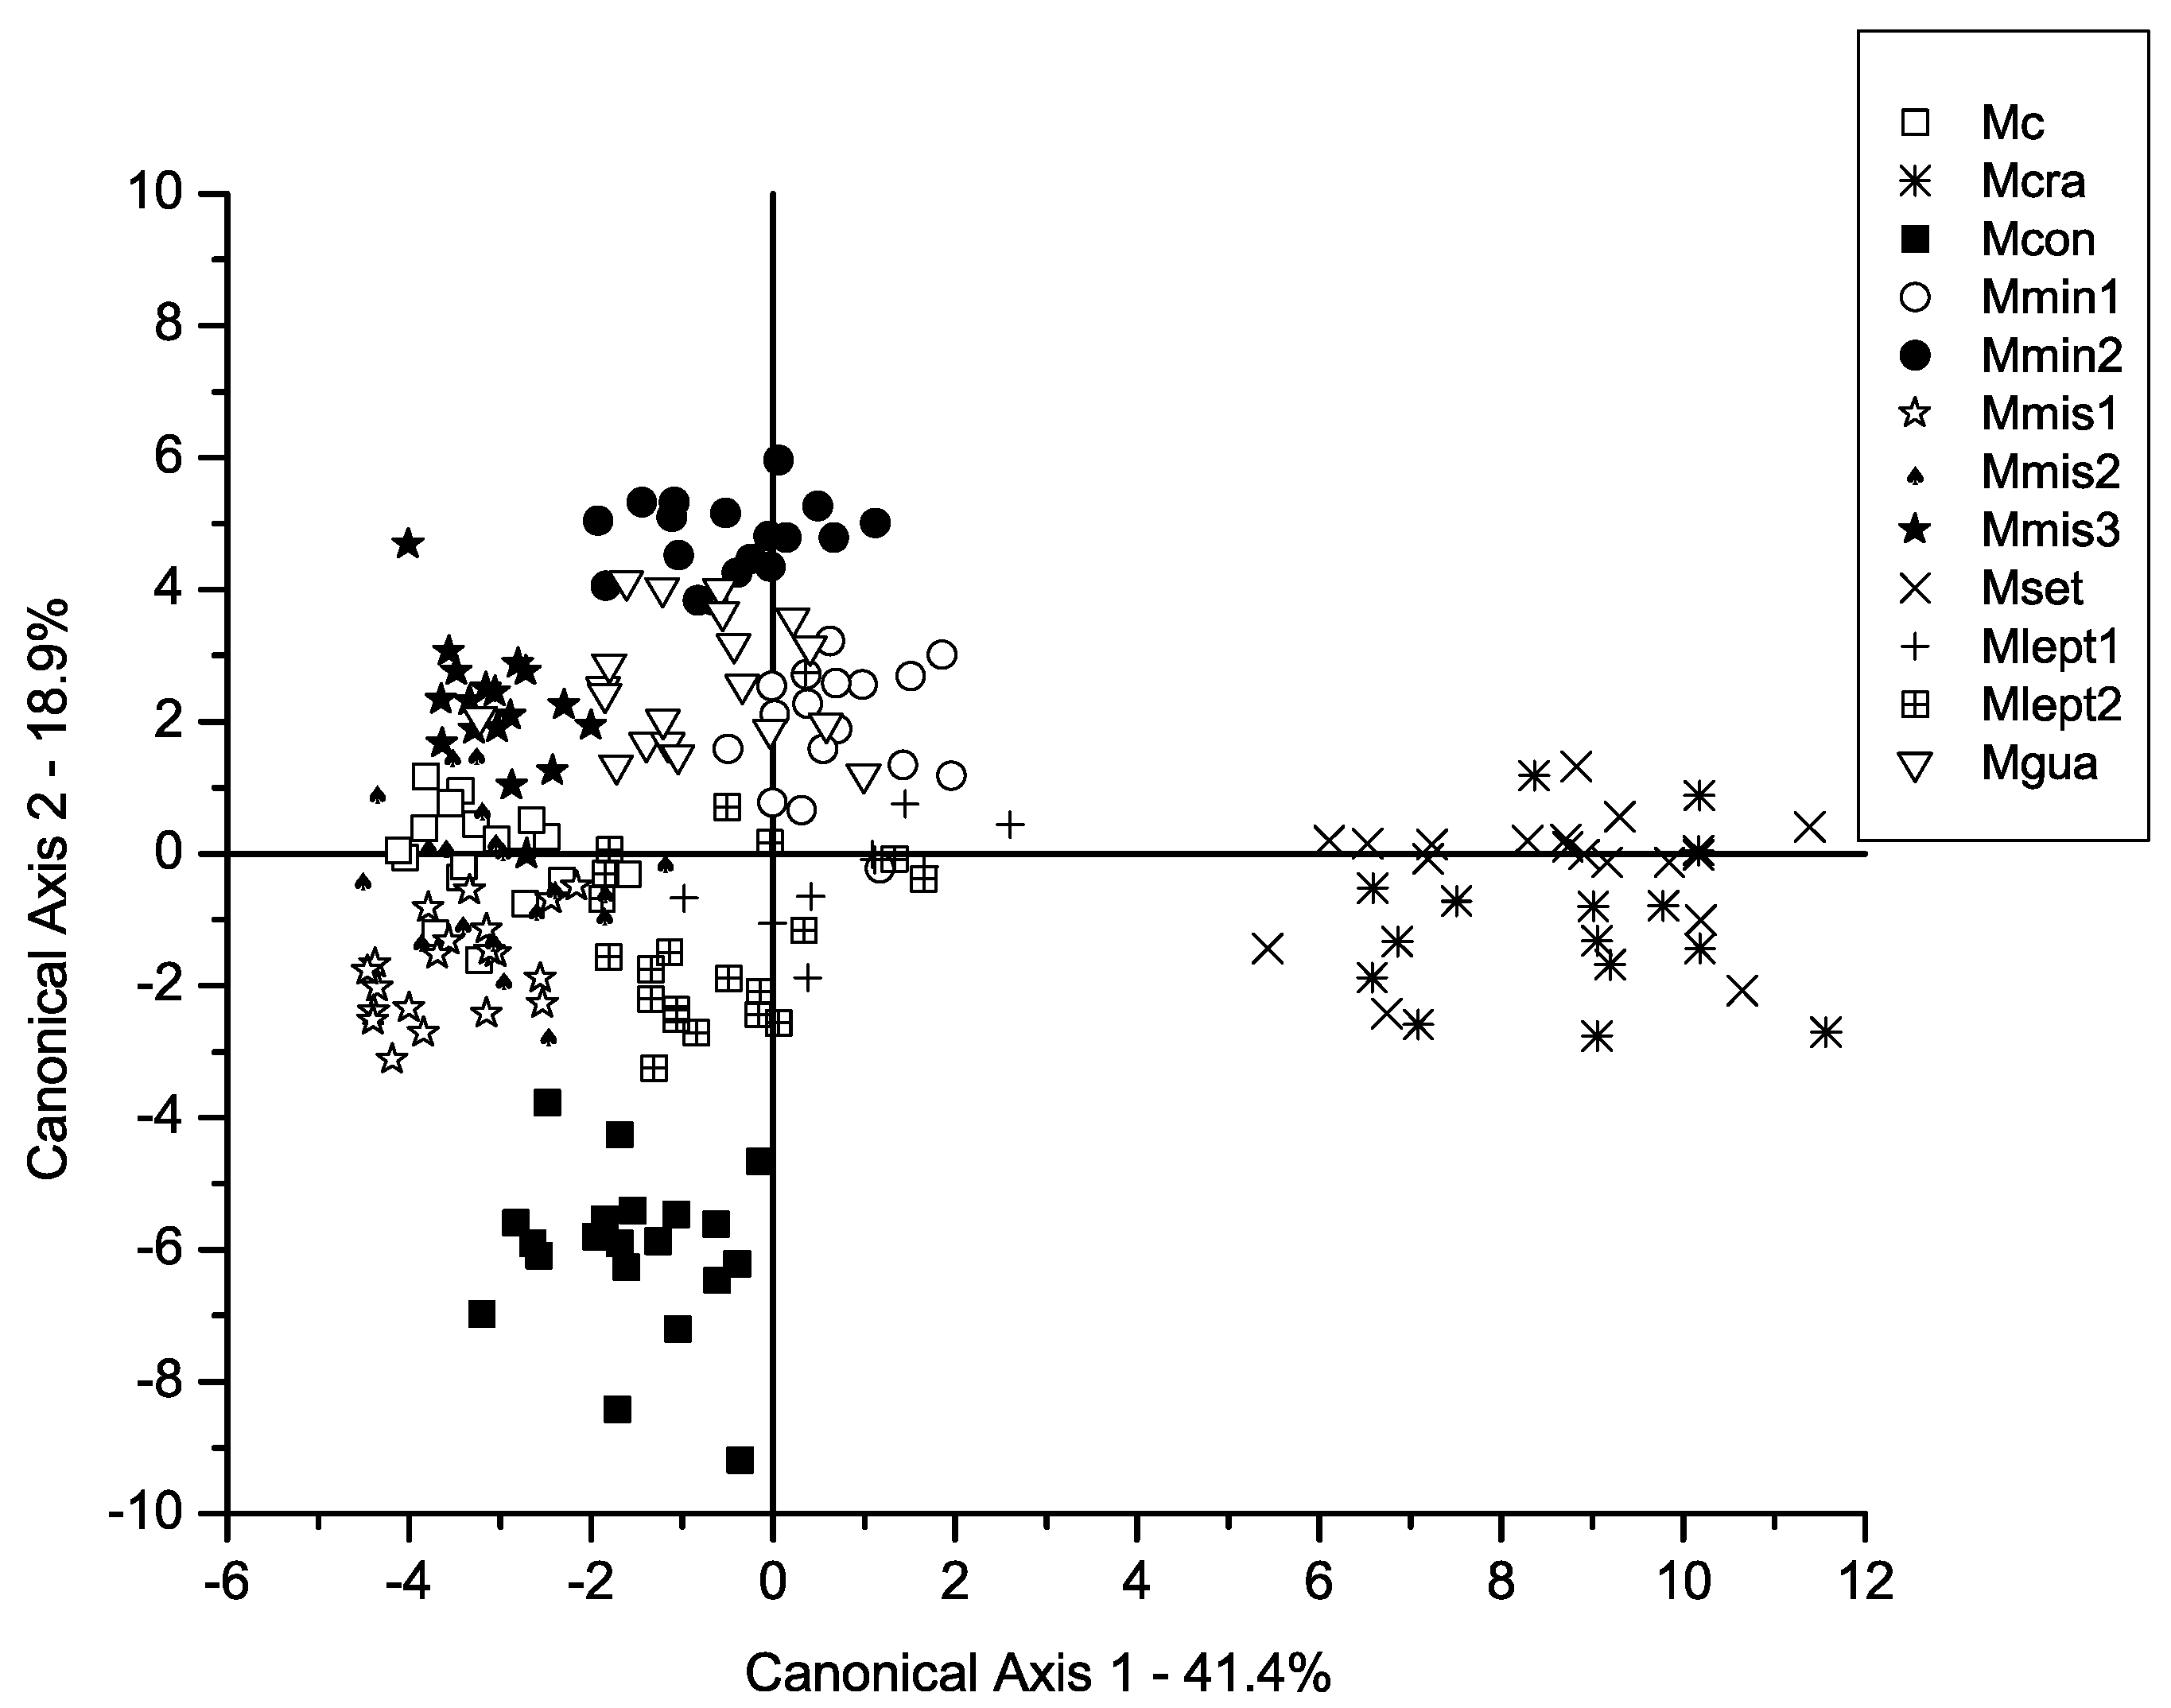
Figure 2.
Canonical Axis 1 and 3 of a Canonical Variate Analysis of twelve populations in Mimosa series Cordistipulae based on 38 morphological characters. Axis one corresponds to 11.57 % of the total variance. Groups separated in previous axes have been grayed out.
Figure 2.
Canonical Axis 1 and 3 of a Canonical Variate Analysis of twelve populations in Mimosa series Cordistipulae based on 38 morphological characters. Axis one corresponds to 11.57 % of the total variance. Groups separated in previous axes have been grayed out.
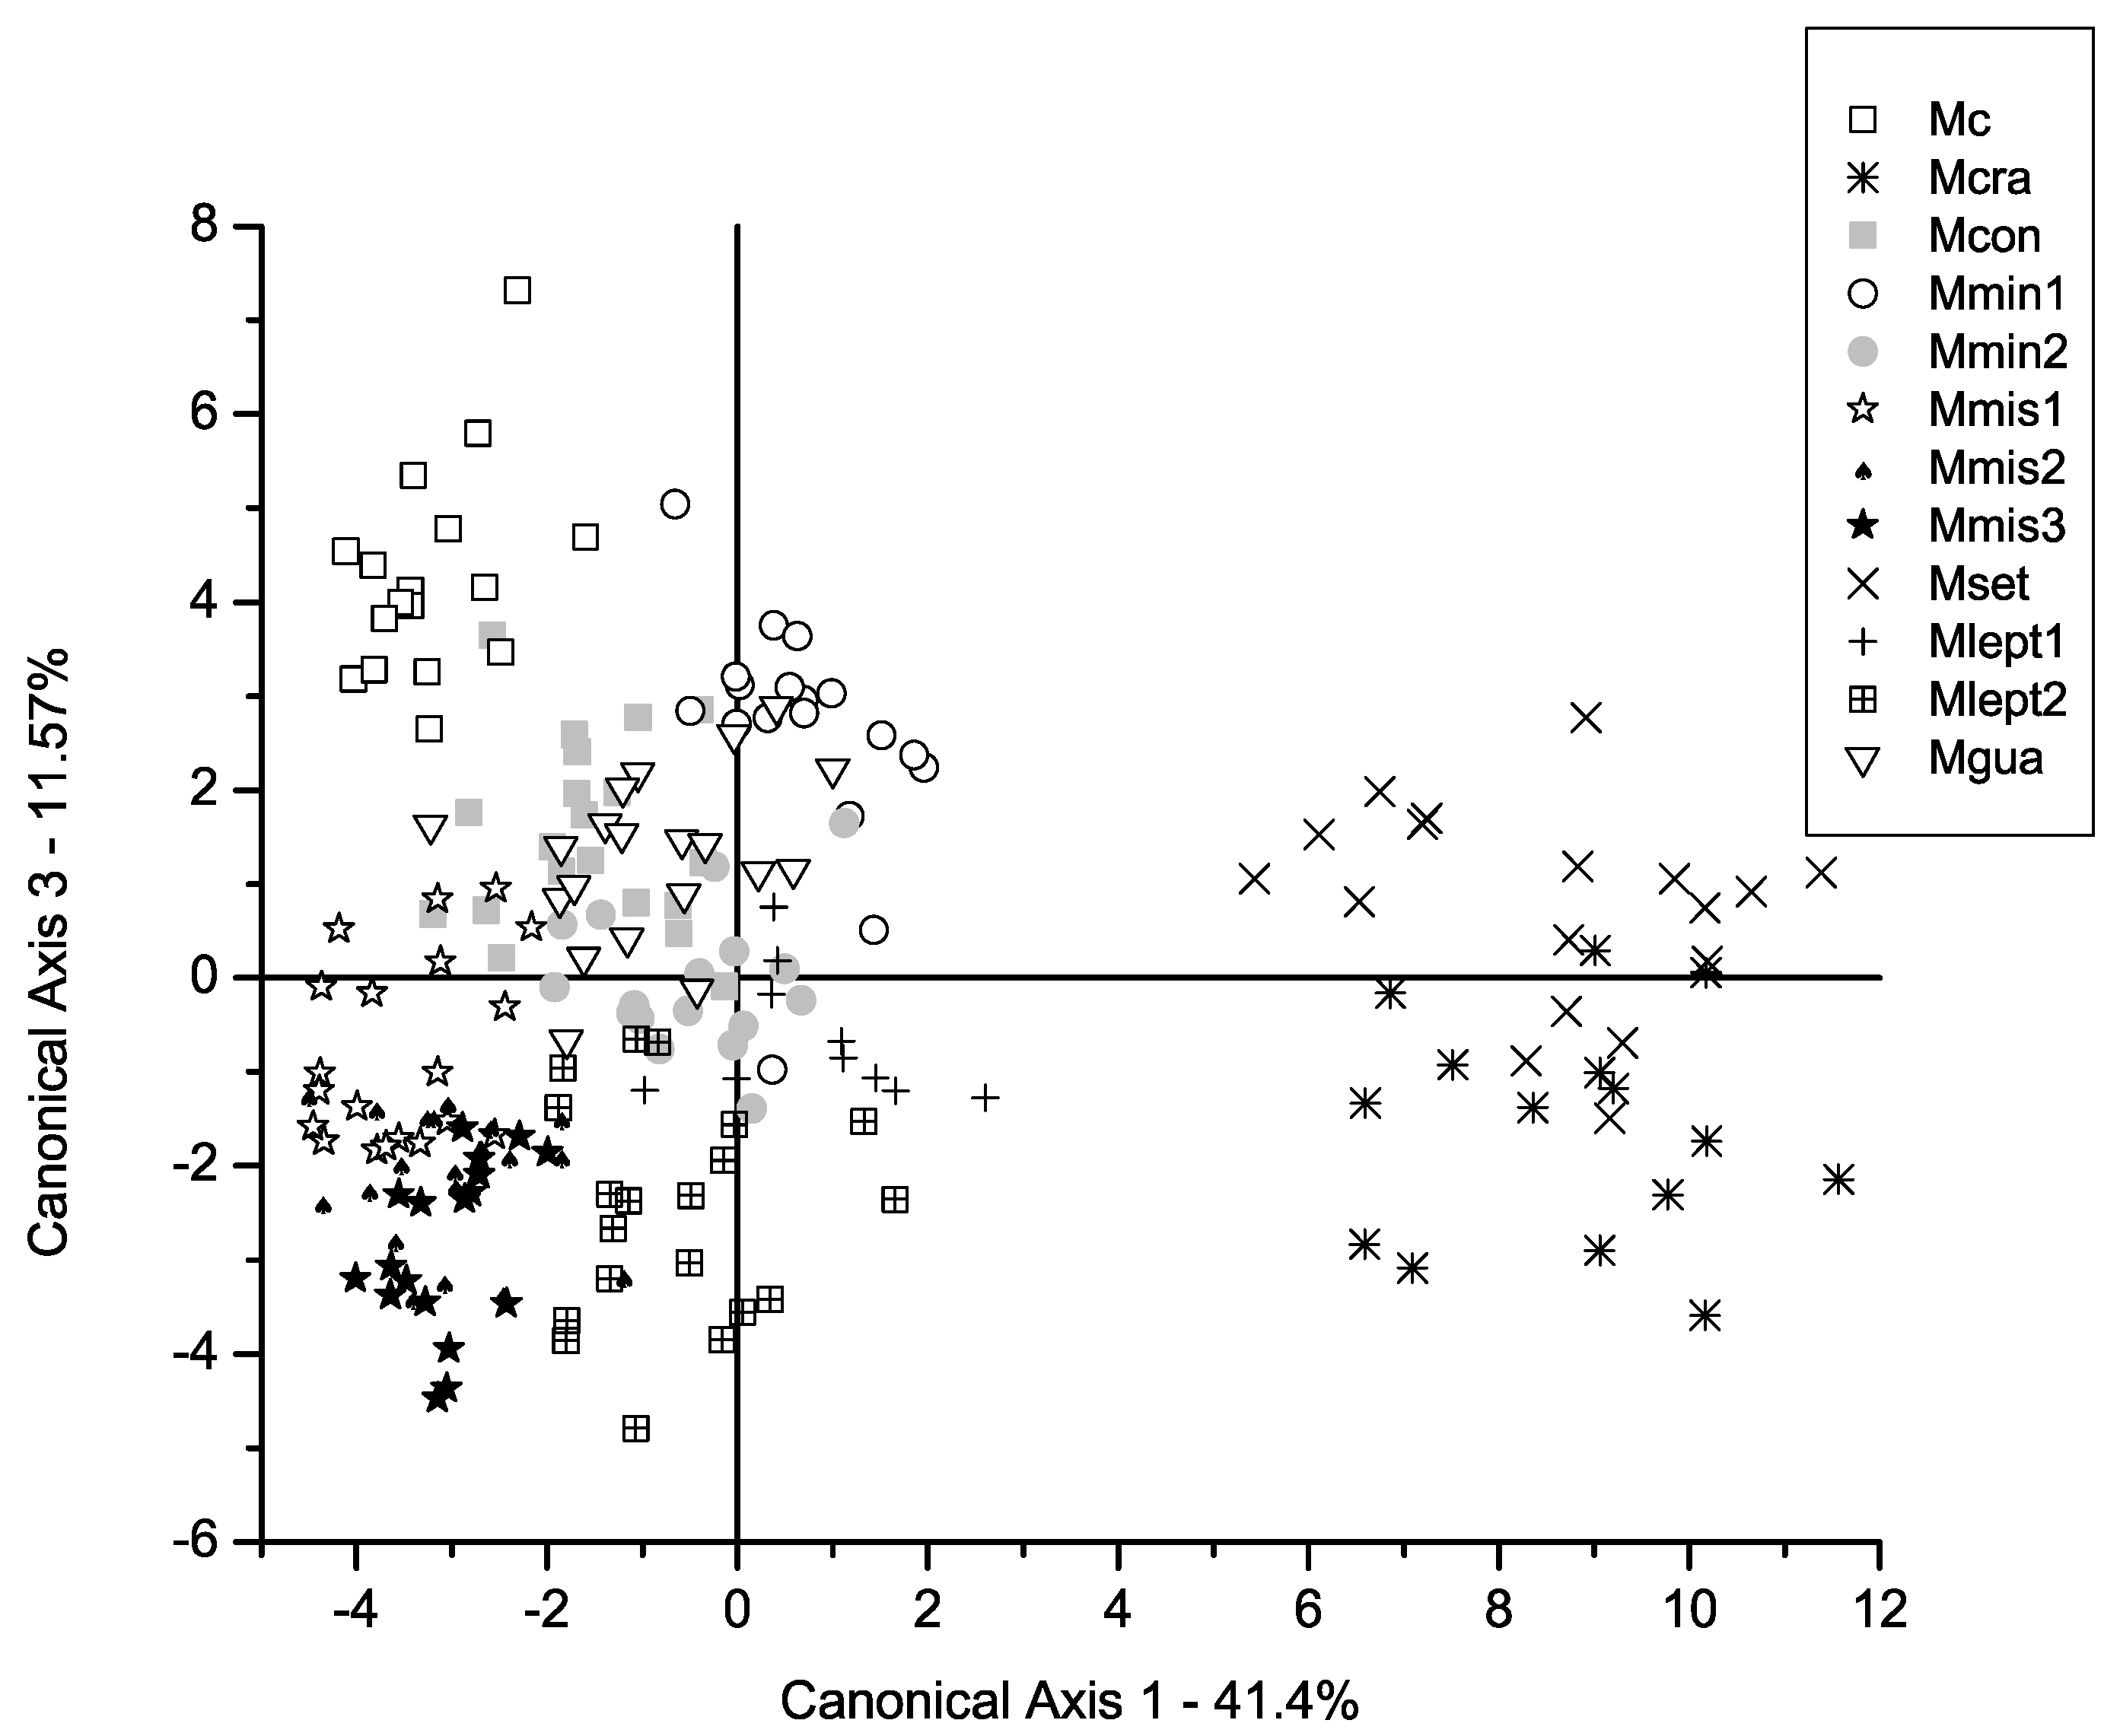
Figure 3.
Canonical Axis 1 and 4 of a Canonical Variate Analysis of twelve populations in Mimosa series Cordistipulae based on 38 morphological characters. Axis one corresponds to 7.38 % of the total variance. Groups separated in previous axes have been grayed out.
Figure 3.
Canonical Axis 1 and 4 of a Canonical Variate Analysis of twelve populations in Mimosa series Cordistipulae based on 38 morphological characters. Axis one corresponds to 7.38 % of the total variance. Groups separated in previous axes have been grayed out.
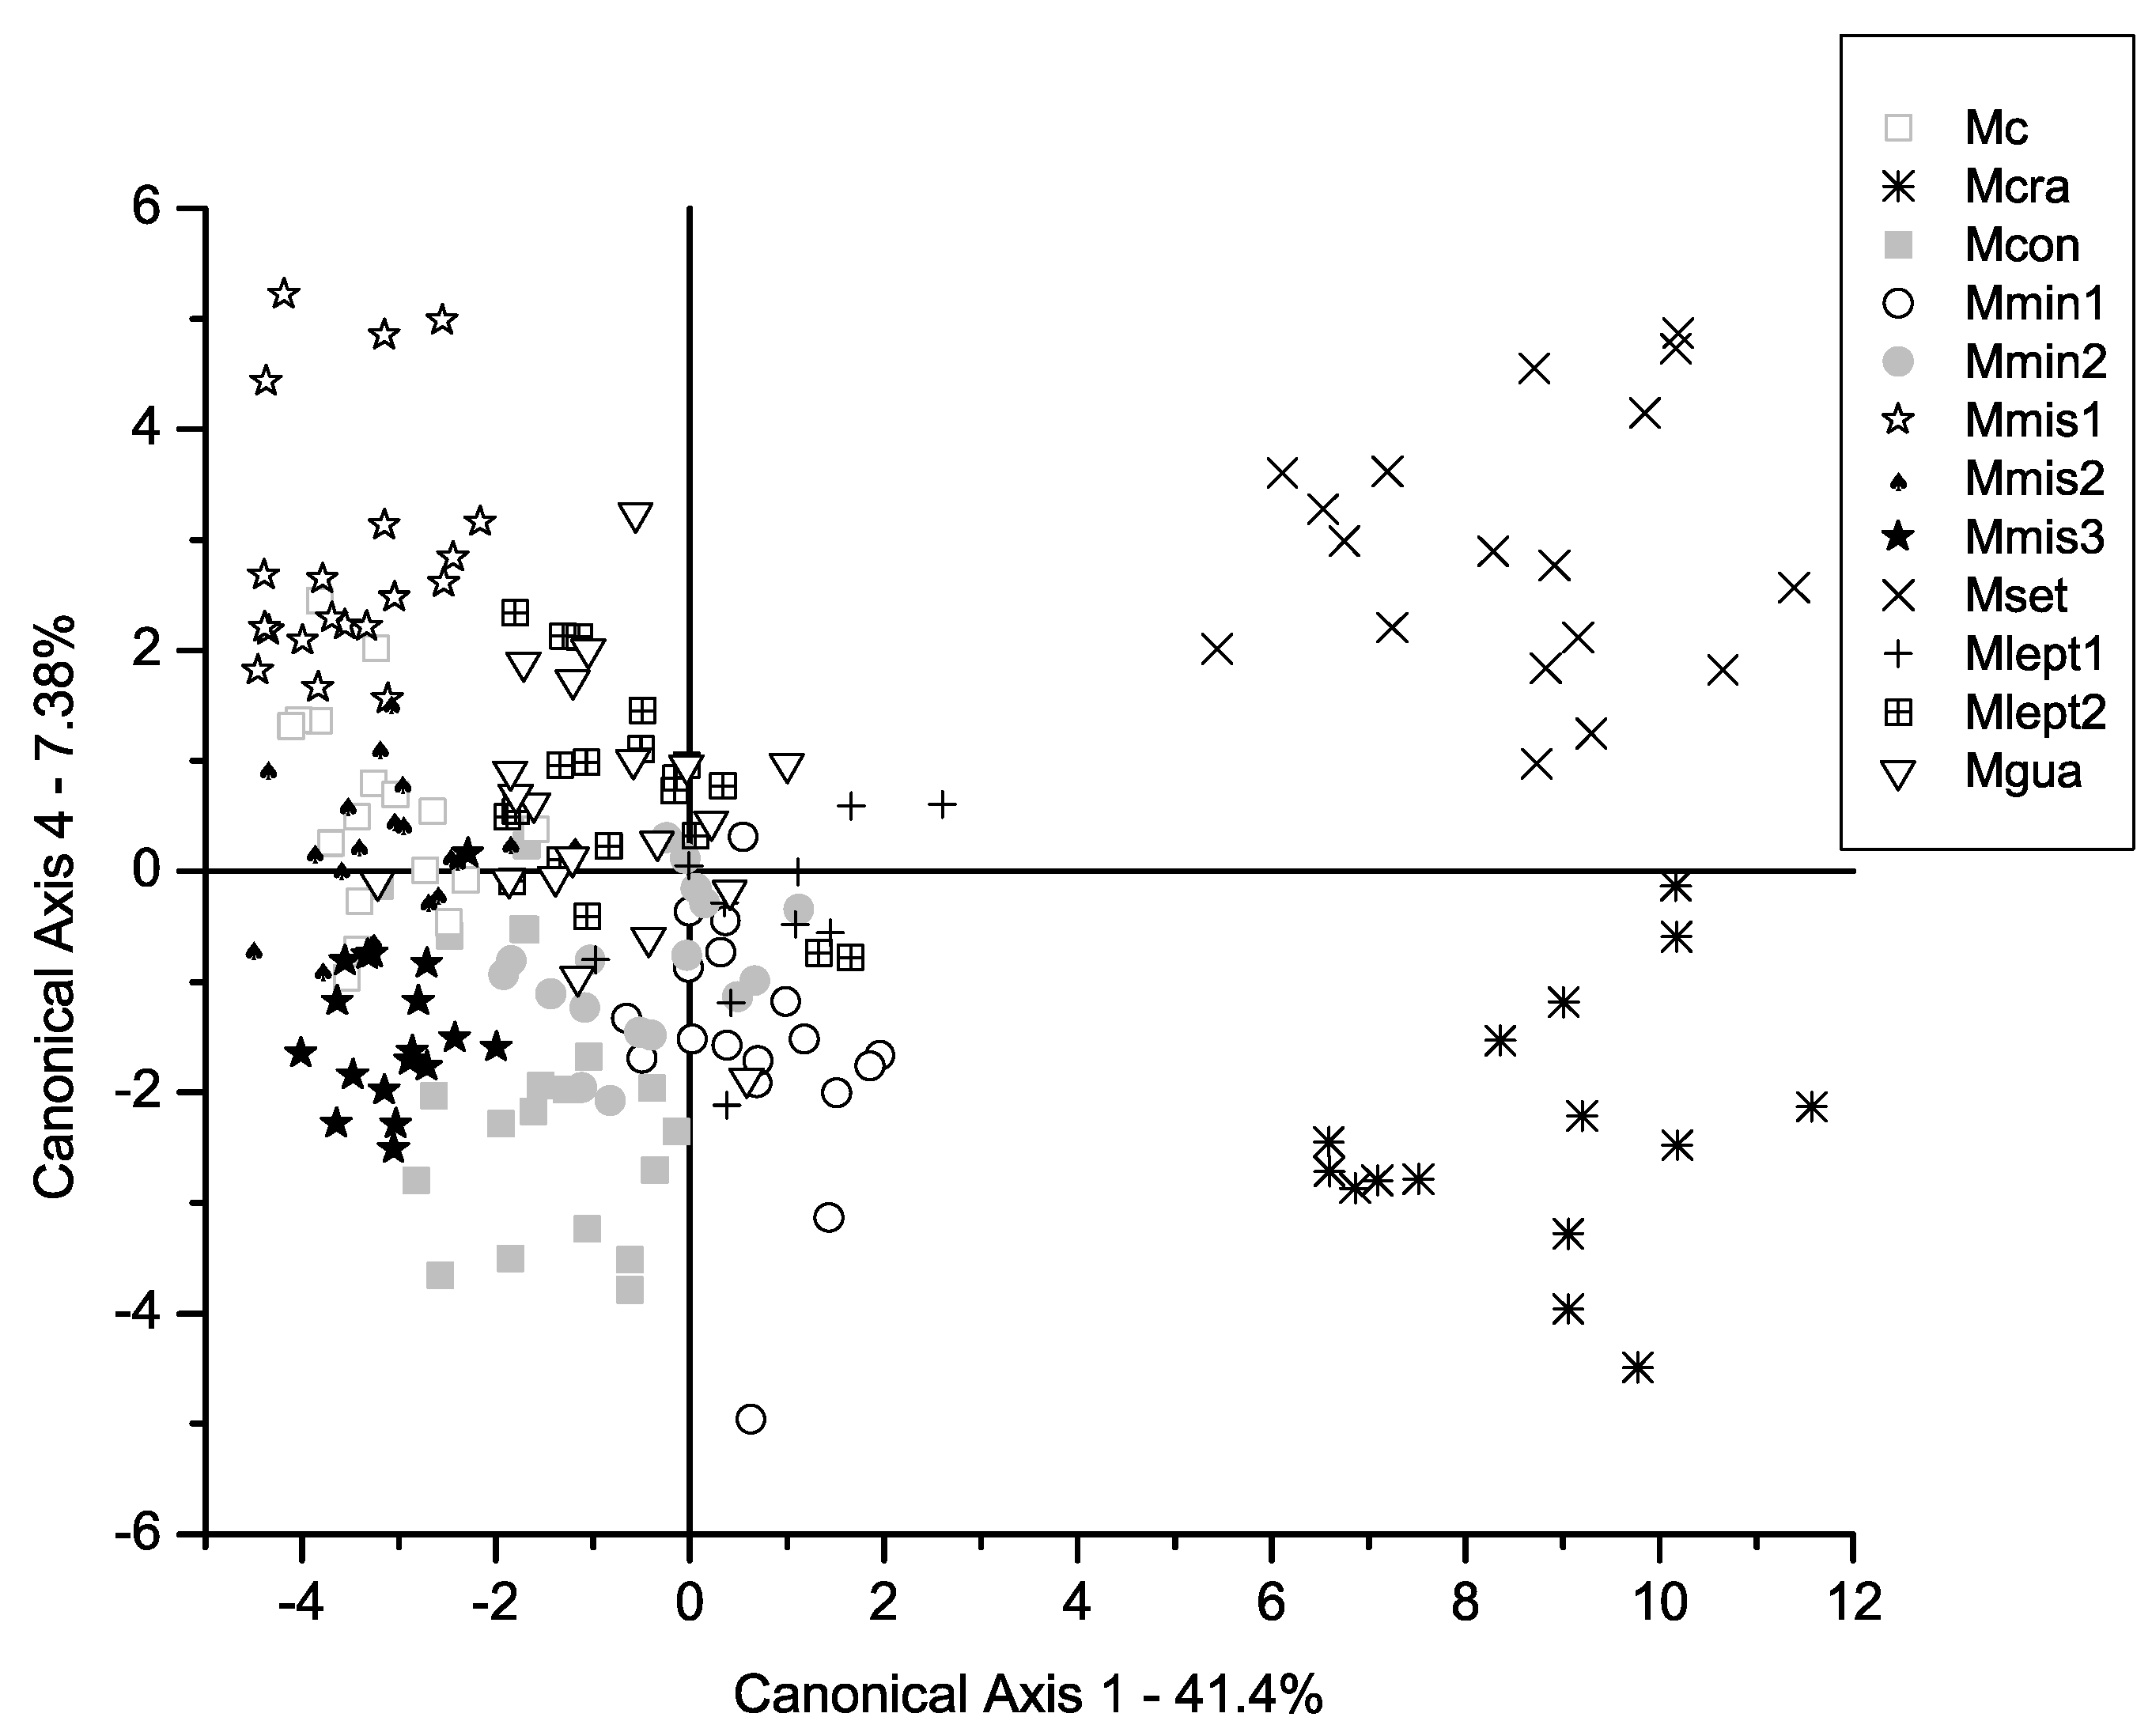
Figure 4.
Canonical Axis 1 and 5 of a Canonical Variate Analysis of twelve populations in Mimosa series Cordistipulae based on 38 morphological characters. Axis one corresponds to 5.92 % of the total variance. Groups separated in previous axes have been grayed out.
Figure 4.
Canonical Axis 1 and 5 of a Canonical Variate Analysis of twelve populations in Mimosa series Cordistipulae based on 38 morphological characters. Axis one corresponds to 5.92 % of the total variance. Groups separated in previous axes have been grayed out.
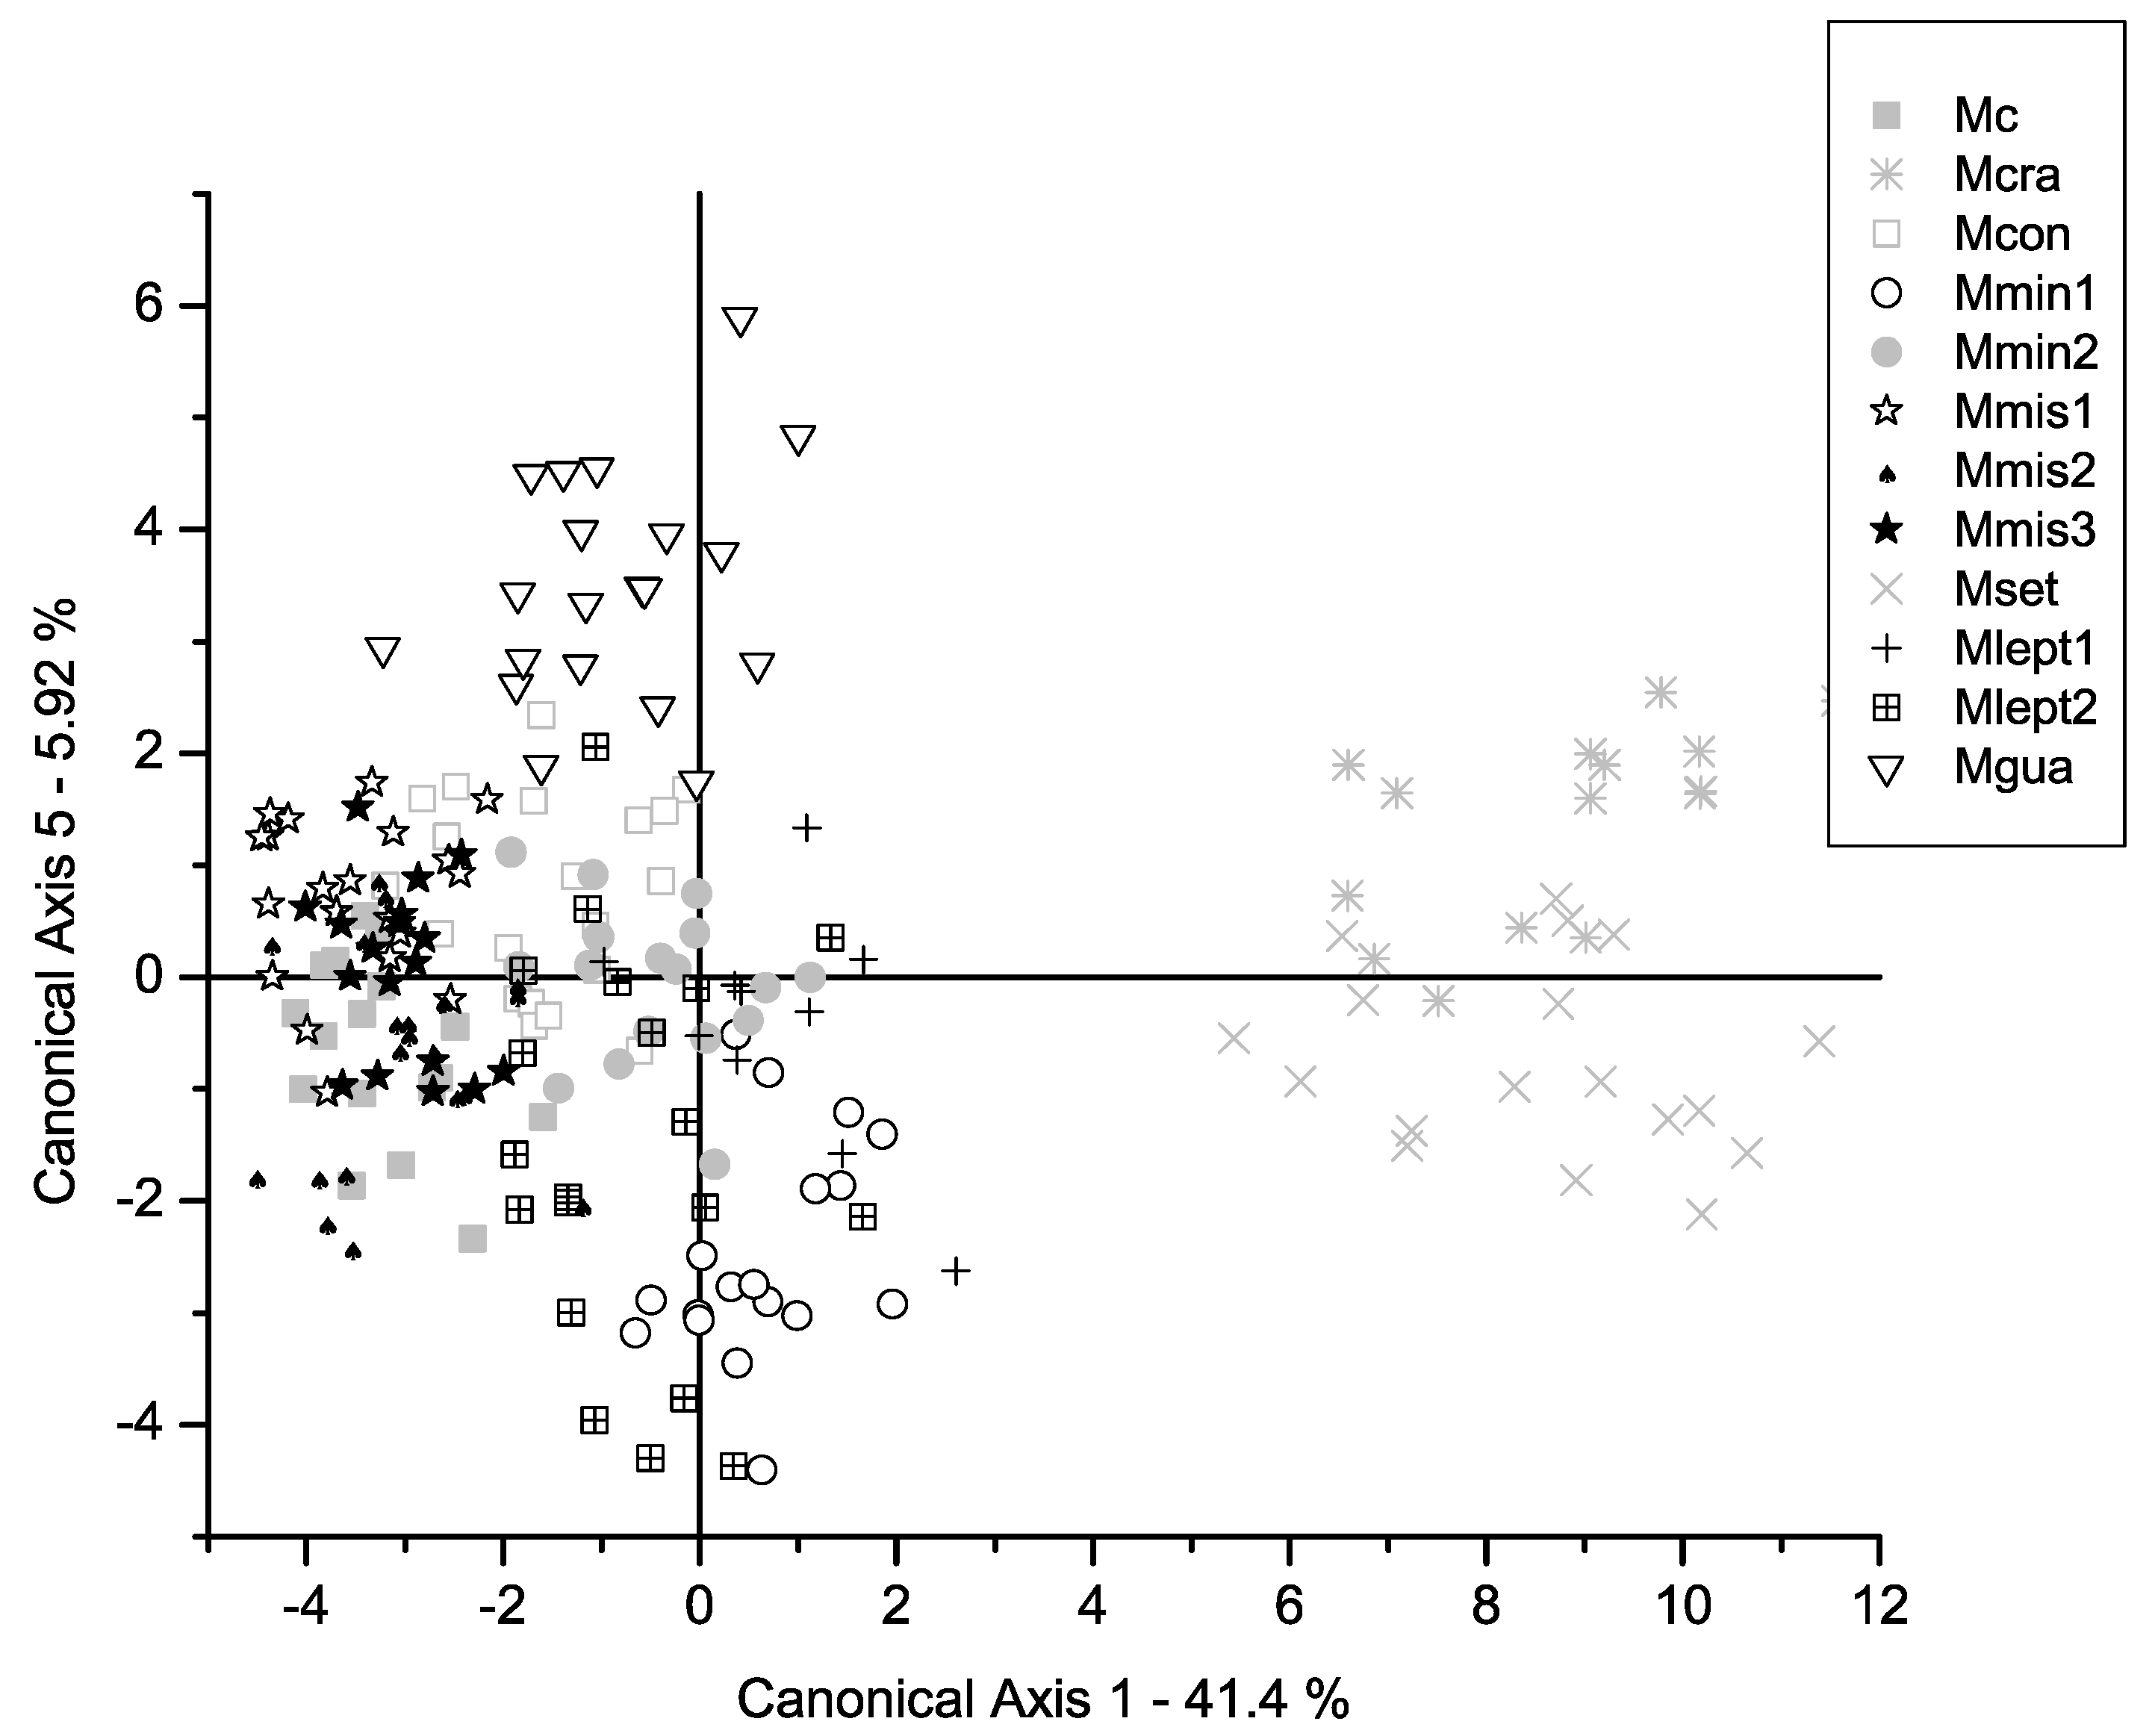
Figure 5.
Canonical Axis 1 and 6 of a Canonical Variate Analysis of twelve populations in Mimosa series Cordistipulae based on 38 morphological characters. Axis one corresponds to 3.76 % of the total variance. Groups separated in previous axes have been grayed out.
Figure 5.
Canonical Axis 1 and 6 of a Canonical Variate Analysis of twelve populations in Mimosa series Cordistipulae based on 38 morphological characters. Axis one corresponds to 3.76 % of the total variance. Groups separated in previous axes have been grayed out.

Figure 6.
Phenetic relationships among 12 populations of Mimosa series Cordistipulae based on the Mahalanobis Distance and the Unweighted Pair-Group Methods of Averages (UPGMA) clustering algorithm on 38 morphological characters.
Figure 6.
Phenetic relationships among 12 populations of Mimosa series Cordistipulae based on the Mahalanobis Distance and the Unweighted Pair-Group Methods of Averages (UPGMA) clustering algorithm on 38 morphological characters.
Figure 7.
Sampling locations for the populations included in a morphometric study of Mimosa series Cordistipulae. Population codes are given in Table 2.
Figure 7.
Sampling locations for the populations included in a morphometric study of Mimosa series Cordistipulae. Population codes are given in Table 2.

Table 1.
Chi-square tests for successive removal of canonical axes, associated with a Canonical Variate Analysis of 12 populations of various taxa in Mimosa series Cordistipulae based on 35 linear measurements and meristic variables.
Table 1.
Chi-square tests for successive removal of canonical axes, associated with a Canonical Variate Analysis of 12 populations of various taxa in Mimosa series Cordistipulae based on 35 linear measurements and meristic variables.
| Axis removed | Eigenvalue | Canonical R | Wilks' lambda | Х2 | d.f.* | p** |
|---|---|---|---|---|---|---|
| 0 | 16.49 | 0.971 | 0.000001 | 2671.032 | 418 | 0.000000 |
| 1 | 8.67 | 0.947 | 0.000010 | 2138.772 | 370 | 0.000000 |
| 2 | 6.74 | 0.933 | 0.000098 | 1716.765 | 324 | 0.000000 |
| 3 | 4.59 | 0.906 | 0.000760 | 1336.009 | 280 | 0.000000 |
| 4 | 3.00 | 0.866 | 0.004248 | 1015.796 | 238 | 0.000000 |
| 5 | 2.14 | 0.825 | 0.016978 | 758.105 | 198 | 0.000000 |
| 6 | 1.60 | 0.785 | 0.053239 | 545.530 | 160 | 0.000000 |
| 7 | 1.21 | 0.741 | 0.138549 | 367.634 | 124 | 0.000000 |
| 8 | 0.84 | 0.677 | 0.306866 | 219.730 | 90 | 0.000000 |
| 9 | 0.36 | 0.516 | 0.566029 | 105.855 | 58 | 0.000127 |
| 10 | 0.30 | 0.478 | 0.771238 | 48.315 | 28 | 0.009909 |
* degrees of freedom associated with the chi-square value, ** p-value relative to the chi-square table at the required d.f.
Table 2.
Sampling locations and vouchers for the populations included in a morphometric study of Mimosa series Cordistipulae. All locations are in Brazil, and vouchers are deposited at the Herbarium of the Universidade Estadual de Feira de Santana (HUEFS).
Table 2.
Sampling locations and vouchers for the populations included in a morphometric study of Mimosa series Cordistipulae. All locations are in Brazil, and vouchers are deposited at the Herbarium of the Universidade Estadual de Feira de Santana (HUEFS).
| Taxon | Voucher/sample size | Population Code | Locality data (state, municipality, site) | Geographical coordinates |
|---|---|---|---|---|
| M. confusa | Queiroz et al. 7733 (20) | Mcon | Bahia, Morro do Chapéu, Lajes in the road to Irecê | 11º36’58”S, 41º00’18”W |
| M. cordistipula | Nascimento 149 (19) | Mc | Bahia, Morro do Chapéu | 11º36’4.7”S, 41º9’46.6”W |
| M. crassifolia | Santos et al. 355 (15) | Mcra | Bahia, Morro do Chapéu, Tabuleiro dos Tigres | 11º36’4.7”S, 41º9’46.6”W |
| M. guaranitica | Santos 807 (20) | Mgua | Bahia, Rio de Contas, Estrada para o Pico das Almas | 13º28’12”S, 41º50’25”W |
| M. leptantha | Nascimento 453 (19) | Mlept1 | Ceará, Aracati, Cumbi | 4º29’34”S, 37’45”33.2W |
| M. leptantha | Nascimento 473 (19) | Mlept2 | Rio Grande do Norte, Caraúbas, road to Governador Rosado | 5º44’46.9”S, 37º33’38.7”W |
| M. minarum | Nascimento 495 (18) | Mmin1 | Minas Gerais, Joaquim Felício, Serra do Cabral | 17º41’34”S, 44º11’56”W |
| M. minarum | Nascimento 520 (17) | Mmin2 | Minas Gerais, Grão Mogol, 3km ao N de Grão-Mogol | 16º36’47.3”S, 42º56’S 27.6”W |
| M misera | Nascimento 359 (20) | Mmis1 | Bahia, Remanso, road to São Raimundo Nonato | 9º45’S, 42º17’W |
| M. misera | Lima 177 (20) | Mmis2 | Bahia, Canudos, Estação Biológica de Canudos, Base II | 10°1'S, 39°9'W |
| M. misera | Nascimento 381 (19) | Mmis3 | Piauí, Oeiras, road to Gaturiana | 6º58’18.4”S, 42º1’37”W |
| M. setuligera | Nascimento 338 (19) | Mset | Bahia, Remanso, road to São Raimundo Nonato | 9º45’S, 42º18’W |
Table 3.
Linear measurements and meristic variables for a multivariate morphometrics study of Mimosa series Cordistipulae.
Table 3.
Linear measurements and meristic variables for a multivariate morphometrics study of Mimosa series Cordistipulae.
| Variable | Character |
|---|---|
| 1 | Stipule length (mm) |
| 2 | Stipule width at ¾ of the length from the base (mm) |
| 3 | Stipule width at ½ of the length from the base (mm) |
| 4 | Stipule width at ¼ of the length from the base (mm) |
| 5 | Rachis length (mm) |
| 6 | Petiole length (including pulvinus) (mm) |
| 7 | First interpinal segment length (mm) |
| 8 | Last interpinal segment length (mm) |
| 9 | Length of the rachis in the pinna of first pair (mm) |
| 10 | Length of the rachis in the pinna of last pair (mm) |
| 11 | Minimum number of pinnae pairs |
| 12 | Maximum number of pinnae pairs |
| 13 | Number of leaflet pairs in the first pinna |
| 14 | Number of leaflet pairs in the last pinna |
| 15 | First leaflet pair length (mm) |
| 16 | First leaflet pair width in the first pinna at 3/4 of the length from the base (mm) |
| 17 | First leaflet pair width in the first pinna at ½ of the length from the base (mm) |
| 18 | First leaflet pair width in the first pinna at ½ of the length from the base (mm) |
| 19 | Length of the third pair of leaflets (mm) |
| 20 | Third leaflet pair width in the first pinna at ¾ of the length from the base (mm) |
| 21 | Third leaflet pair width in the first pinna at ½ of the length from the base (mm) |
| 22 | Third leaflet pair width in the first pinna at ¼ of the length from the base (mm) |
| 23 | Length of the last pair of leaflets (mm) |
| 24 | Last leaflet pair width in the first pinna at ¾ of the length from the base (mm) |
| 25 | Last leaflet pair width in the first pinna at ½ of the length from the base (mm) |
| 26 | Last leaflet pair width in the first pinna at¾ of the length from the base (mm) |
| 27 | Peduncle length (mm) |
| 28 | Number of flowers per head |
| 29 | Bracteole length (mm) |
| 30 | Bracteole width at ¾ of the length from the base (mm) |
| 31 | Bracteole width at½ of the length from the base (mm) |
| 32 | Bracteole width at ¼ of the length from the base (mm) |
| 33 | Calyx length (mm) |
| 34 | Corolla tube length (mm) |
| 35 | Corolla lobes length (mm) |
| 36 | Corolla lobes width at the base (mm) |
| 37 | Gynoecium length (mm) |
| 38 | Androecium length (mm) |
Disclaimer/Publisher’s Note: The statements, opinions and data contained in all publications are solely those of the individual author(s) and contributor(s) and not of MDPI and/or the editor(s). MDPI and/or the editor(s) disclaim responsibility for any injury to people or property resulting from any ideas, methods, instructions or products referred to in the content. |
© 2024 by the authors. Licensee MDPI, Basel, Switzerland. This article is an open access article distributed under the terms and conditions of the Creative Commons Attribution (CC BY) license (http://creativecommons.org/licenses/by/4.0/).
Copyright: This open access article is published under a Creative Commons CC BY 4.0 license, which permit the free download, distribution, and reuse, provided that the author and preprint are cited in any reuse.


