Submitted:
27 November 2024
Posted:
29 November 2024
You are already at the latest version
Abstract
Background/Objectives: Diet and physical activity (PA) significantly impact health. Unfortunately, a worrying trend of decreasing PA among children and adolescents, accompanied by unhealthy nutritional behavior, is observed worldwide. The aim of the study was to evaluate the nutritional behavior and body mass index (BMI) of adolescents aged 13 years in relation to their physical activity at school. Methods: The study was conducted in six schools among adolescents born in 2007 (n = 213), in two groups of standard and extended PA at school (SPA and EPA), wherein each group received 4 and 10 hours of physical education lessons per week, respectively. Their height and body mass were measured. BMI was calculated and compared with percentile charts. A questionnaire was used to assess nutritional behavior and extracurricular physical activity. Results: Approximately 62% of adolescents had a normal body weight, with SPA 58%, EPA 64%, overweight 13.63%, SPA 13.75%, EPA 13.50%, obesity 14.13%, SPA 19.25%, EPA 9%, and underweight 11.17%, SPA 8.85%, and EPA 13.50%. Among the potential health-promoting foods, dishes, and beverages, fruits and vegetables were the most frequently consumed items, whereas fish and legume dishes were the least consumed. Butter, white bread, sweets, cheeses, cold cuts, and sausages were all consumed very often. Fast food and lard were the least frequently consumed items. Conclusions: A significant proportion of 13-year-olds were overweight or obese. Extended PA had a beneficial effect on BMI, but it had little effect on nutritional behavior among the studied adolescents. The adolescents exhibited moderate nutritional behaviors, however, it was more favorable in those exposed to extended PA at school than those exposed to standard PA. It's possible to argue that extending organized PA at school leads to even more PA during leisure time. It is recommended to increase PA for adolescents by doubling the mandatory number of physical education lessons or other sports activities in the school curriculum.
Keywords:
adolescents
; BMI
; obesity
; physical activity
; diet
; nutritional behaviors
1. Introduction
A healthy diet and regular physical activity (PA) are important elements in improving the health of the young generation [1,2]. Adolescence is a crucial period of physical and mental development, and behaviors that promote regular physical activity and a healthy diet during this period are crucial for health in adulthood [2]. The global prevalence of childhood and adolescent obesity has reached an unprecedented level [3]. The World Obesity Federation estimates that every fourth person in the world will be struggling with obesity by the year 2035 [4]. The steady rise in excess body weight among children and adolescents is particularly concerning. In Poland, the situation is particularly worrying, and studies indicate that Polish teenagers are gaining weight the fastest in Europe [5,6]. One-fourth of teenagers aged 10–19 were found to have excess body weight [7]. Studies estimate that at least 80% of obese school-age children will also develop obesity in adulthood. The physical activity is a crucial component of a healthy lifestyle. The World Health Organization (WHO) recommends regular moderate to vigorous physical activity for an average of 60 minutes and high-intensity aerobic activity that strengthens muscles and bones at least 3 days per week [8,9]. Studies have shown that regular PA helps develop the musculoskeletal system, cardiovascular and respiratory systems, and nervous system [10]. Increased PA levels in children and adolescents lead to a reduced risk of overweight and obesity, and improve body composition, health, and physical fitness [11,12,13,14]. Additionally, studies show that children who engage in regular sports activity exhibit more favorable nutritional bahavior compared to children with a more sedentary lifestyle [15,16,17]. Preventing weight gain has focused on factors such as reducing sedentary behavior and energy intake with the diet and expending more energy through regular PA. Despite numerous benefits of PA, adherence rates to PA recommendations among adolescents are poor. A study of 1.6 million people from 146 countries found that over 81% of teenagers don’t reach the WHO-recommended level of physical activity [18]. In Poland, only 15% of adolescents aged 11–18 years meet these recommendations [19].
In addition to PA, another important factor influencing health is dietary behavior. There are unique health benefits to the Mediterranean diet, which is recognized worldwide for its healthy eating patterns [20]. It is based on the use of olive oil, eating vegetables, fruits, whole grains, nuts and seeds, as well as moderate consumption of legumes, fresh fish and moderate meat consumption. The Mediterranean diet provides most of the necessary macronutrients. In the meantime, young people frequently observe an increase in the consumption of goods high in sugar, fat, and salt, as well as products deep-fried in deep fat, and a decrease in the consumption of goods with high nutritional value [22]. These dietary behaviors are associated with many negative health consequences, such as obesity, hypertension, heart disease, diabetes [23]. Many countries, including Poland, have dietary recommendations for children and adolescents in graphic form, such as a healthy eating plate, which presents the recommended frequency of consumption of selected food products and beverages [24]. Unfortunately, in adolescents diet, we can often find undesirable behavior like a low consumption of vegetables, fruits, fish, and whole grain products, with a high consumption of sweets, salty snacks, and sweet beverages [25]. Hence, the aim of the study was to evaluate the nutritional behavior and body mass index (BMI) of adolescents aged 13 years in relation to their physical activity at school.
2. Materials and Methods
2.1. Participants
This was a pilot, prospective, follow-up cohort study with a control group. The study took place in autumn 2021 in six elementary schools in Siedlce, a medium-sized Polish city. The participants were 13-years old adolescents starting the last grate of elementary school. They all were born in 2007. The participants typically went to schools where special classes with more physical activity lessons had been implemented. Each class had 22-25 children.
The study classified the participants into two groups: the control was those who received four hours of physical education lessons at school. This was a standard dimension of physical education in the school’s curriculum in Poland. The intervention group received ten hours of physical education lessons, which was more than double the standard currucular dimension. We will refer to them as the standard (SPA—standard PA) and extended (EPA—extended PA) groups, respectively. The physical education lessons comprised team games and fitness exercises. The focus was not on coaching specific sport extended, but increasing the number of standard physical education lessons in the school curriculum.
We used convenience sampling because we assigned participants to the groups based on their parents’ wishes, and the groups were unequal. The sample size was justified using G*power software, version 3.1.9.7 (University of Kiel, Germany) [26].
The inclusion criteria for the study were as follows: (1) good health (no newly diagnosed chronic diseases, injuries, or wounds, and good well-being); (2) age 13 years; (3) consent from the schools managers, teachers, and parents to participate in the study; (4) ability to complete the questionnaire independently; and (5) not following a special diet that could potentially affect the final result. Failure to meet any of the criteria resulted in being excluded from the study. The research team supervised the completion of the questionnaire about nutritional behavior and anthropometric measurements at the school.
Before the study began, participants received information about the confidentiality of the results and the purpose of the study. The study adolescents verbally agreed to take part, and their parents provided written informed consent. The University of Siedlce Research Ethics Committee approved the research (number 2/2016).
2.2. Procedure
The study included an assessment of anthropometric parameters, such as height and weight, as well as participants’ nutritional behavior. A qualified and experienced group of nutritionists carried out the investigation using the same equipment in all schools. The calculated BMI was referred to the percentile charts appropriate for age and gender. The researchers analyzed nutritional behavior based on current guidelines [27,28,29]. Our team conducted anthropometric measurements following the methods outlined in our earlier research [30]. An anonymous questionnaire based on the QEB—Questionnaire of Eating Behavior, developed by specialists from the Polish Academy of Sciences, was used to assess the dietary behavior.
The study adhered to the Helsinki Declaration [31]. The researchers asked parents to refrain their children from engaging in any intense physical activity, other than necessary housework, for at least 12 hours before the measurements. The measurements took place from 10am-11am in schools following the necessary guidelines for height and body mass measurements. We used the validated procedures described in our previous work [32].
2.3. Body Mass Index
We measured height in centimeters and body mass in kilograms according to the standard procedures [33]. Body height was measured using a Seca 214 stadiometer (Seca GmbH & Co. KG, Hamburg, Germany). Body mass was measured with a Tanita SC-240MA (Tanita Corporation, Tokyo, Japan) [34,35]. BMI was calculated as body weight divided by height (kg/m2). We compared the calculated BMI to percentile charts for the population of Polish children [27,28]. According to the criteria, overweight was considered as BMI ≥ 85 percentile, obesity as BMI ≥ 95 percentile, and underweight as BMI ≤ 10 percentile [27,28].
2.4. Questionnaire
The survey, conducted anonymously, contained 31 inquiries, each requiring a single response from the aforementioned options. Participants received brief instructions on how to respond to the questions before submitting the survey. Teachers and members of the research team supervised the completion of the questionnaire in classrooms, clarifying any doubts about the questions.
The questionnaire inquired about the frequency of recommendations for healthy diet food products, dishes, and beverages. The first group of questions highlighted foods that should be consumed more often in a healthy diet. These foods included: whole grain bakery products, buckwheat groats, oatmeal, whole grain pasta, coarse-grained groats, milk, yoghurts, cottage cheese, white meat dishes, fish, legumes dishes, fruit, vegetables, and eggs. These were products of favorable health properties. The second group of questions concerned foods that consumption in a healthy diet should be moderate or low. These foods included: white bread, white rice, white pasta, fine-grained groats, fast food, fried meat or flour dishes, butter,high fat cheeses, cold cuts, sausages, frankfurters, red meat dishes, sweets, canned meat, sweetened drinks, and energy drinks [29]. Additionally, the survey included questions regarding the regularity of eating breakfast, snacking between meals, and self-assessment of nutrition. The survey also asked about how participants preferred to spend their free time outside of school, including activities like watching TV and using the computer, learning, reading, listening to music, and engaging in physical activities such as sports, walking, and cycling. We used the following categories for consumption frequency and daily frequency (times/day): never; one-three times a month; once a week; several times a week; once a day and several times a day [29].
2.5. Statistical Analysis
Statistical calculations were performed using Microsoft Excel 365 (Microsoft, Corp, Washington DC, USA) and Statistica 13 (Stat Soft, Krakow, Poland). The significance level was alpha ≤0.05. We conducted various statistical tests. The Student’s t-test, the Mann-Whitney U test and analysis of variance. We conducted this analysis after checking for the normality of the distribution and the homogeneity of variance. The Shapiro-Wilk test was used to check the normality of the distribution, and the Levene test was used to verify the assumption of homogeneity of variance, for values greater than the accepted significance coefficient of 0.05. To analyze the interdependence of BMI and PA at school and nutritional behavior, we performed a PCA analysis (principal component analysis).
3. Results
3.1. Group Characteristics
The study obtained consent from 236 parents and adolescents, consisting of 111 EPA and 125 SPA. However, the study included 213 participants, 99 EPA (girls 50; boys 49) and 114 SPA (girls 56; boys 58). The reason for the exclusion was the absence of the participant on the day of measurement. The study excluded approximately 11% of EPA participants and 9% of SPA participants. The average age of the participants was 13.69 years, and they were similar in terms of socioeconomic status and backgrounds.
3.2. BMI
The body mass, height, BMI of participants, along with the corresponding percentiles, are shown in Table 1. Participants were similar in height (SPA 167.23 cm; EPA 166.86 cm; p=0.148). Boys were taller on average than girls (169.76 cm vs. 164.67 cm, respectively; p=0.021). Mean body mass was higher in SPA than EPA (61.24 kg vs. 58.39, respectively; p=0.002). Girls were lower than boys (57.19 kg vs. 62.58 kg, respectively; p=0.031). EPA adolescents had a lower BMI on average than SPA (20.84 kg/m2 and 75th percentile vs. 21.70 kg/m2 and 50th percentile, respectively; p=0.012). On average, BMI was slightly higher in boys than in girls (21.53 kg/m2 vs. 21.06 kg/m2, respectively; p=0.147).
3.1. BMI
Almost 62% of participants had a normal body weight (SPA 58%, EPA 64%; p=0.001), overweight in 13% (SPA 13%, EPA 13%; p=0.067), obesity in 14% (SPA 19%, EPA 9%; p=0.000) and underweight in 11% (SPA 9%, EPA 13%; p=0.000) (Figure 1). Excess body weight (overweight and obesity) was more common in SPA than EPA (33% vs. 22%, respectively; p=0.001).
Obesity was most frequently noted in SPA girls (21%) and was twice as high as in EPA girls (10%). Whereas in boys, obesity was twice more frequent in SPA than EPA (17% vs. 8.00%, respectively; p=0.001). Overweight rate was similar in all groups but most frequently occurred in SPA boys and EPA girls (15% and 12%, respectively; p=0.002). Underweight was most frequent among EPA boys (15%) and was twice as frequent as in SPA boys (7%), but in girls it was similar in both groups (12% vs. 10%, respectively; p=0.050) (Table 2).
3.2. Nutritional behavior
Table 3 and Table 4 show the declared frequency of food consumption by the participants. Adolescents most often ate 4 meals a day (EPA 40%, SPA 32%; p=0.001), and only 21% of children ate 5 meals (SPA 24%, EPA 17%; p=0.001). Boys more often ate 5 meals compared to girls (23% vs. 19%, respectively; p=0.024). Nearly 62% of participants ate breakfast every day (SPA 58%; EPA 66%; p=0.470). However, 42% of SPA and 34% of EPA ate breakfast irregularly. Girls more often declared regular breakfast consumption than boys (65% vs. 59%, respectively; p=0.012).
Snacks between main meals were eaten by approximately 82% of participants (18% SPA and 18% EPA; p=0.170). Boys consumed snacks slightly more often than girls (81% vs. 83%, respectively; p=0.062). Participants usually ate salty snacks (SPA 31%; EPA 27%; p=0.071), fruits (SPA 22%; EPA 29%; p=0.010) and sweets (SPA 23%; EPA 23%; p=0.715). Girls consumed sweets more often than boys (24% vs. 21%, respectively; p=0.871) and salty snacks (32% vs. 26%, respectively; p=0.610). The most popular drink was water (SPA 76%; EPA 65%; p=0.004). Tea without sugar was drunk by 10% EPA and 4% SPA (p=0.001).
On average, 37% of participants reported consuming dairy products once a week (SPA 38%; EPA 36%; p = 0.415). Boys consumed milk more often than girls (Table 4). Yoghurts (SPA 41% and EPA 46% (p=0.221), cottage cheese (SPA 21% and EPA 30%; p=0.000) and cheese (SPA 43%; EPA 41%; p=0.078) were also consumed once a week (Table 3). Boys more often consumed yoghurts than girls (46% vs. 41%, respectively; p=0.061), cottage cheese (29% vs. 22%; p=0.078) and cheese (44% vs. 40%; p=0.072).
The study found that a high percentage of adolescents, averaging 77%, chose to eat white bread at least once a day. Significantly more SPA than EPA chose white bread (81% vs. 74%, respectively; p=0.431). Boys consumed wheat bread more often than girls (82% vs. 73%; p=0.010). Participants consumed whole grain cereal products rarely, with only 21% of participants consuming them every day (SPA 19%; EPA 23%; p=0.001). The consumption of whole grain bread once a day was declared by 24% of girls and 18% of boys (p=0.023).
Only 6% of participants consumed fine-grained groats, oatmeal, and whole-grain pasta at least once a day (SPA 4% and EPA 9%; p=0.012). Several times a week ate these products 17% of girls and 25% of boys (p=0.028). More than 2/3 of participants consumed white rice, fine-grained groats and white pasta (SPA 61% and EPA 55%; p=0.611). The frequency of these products consumption in girls and boys was at a similar level (p=0.920).
The frequency of poultry consumption was moderate, but on average, EPA participants reported it more often than SPA. Almost 38% of participants consumed poultry several times a week (SPA 36%, EPA 40%; p=0.024). Boys showed a higher consumption of poultry compared to girls (37% vs. 30%, respectively; p=0.035). Adolescents ate poultry more often than red meat, with the latter consumed most often once a week, on average 49% (SPA 56%, EPA 45%; p=0.041). Consumption of red meat several times a week declared 12% girls and 20% boys (p=0.020). Participants reported a high consumption of cold cuts, sausages, and frankfurters. Approximately 39% of SPA and 35% of EPA participants ate the above products at least once a day (p=0.047). Boys significantly more often declared consumption of these foods than girls (50% vs. 24%, respectively; p=0.001). Whereas, the frequency of fish consumption was low, with rates of once a week being 52% (SPA 49% and EPA 56%; p = 0.021) and once a month 32%, while 14% didn’t eat fish at all. Fish consumption was low regardless of the group type, however, EPA participants ate significantly more fish than SPA. As many as 20% of girls and 13% of boys didn’t eat fish at all (p= 0.047).
Fruit and vegetables were more frequently eaten by EPA participants than SPA. Every day vegetable consumed 56% SPA and 61% EPA participants (p=0.027). Girls consumed vegetables more often than boys (62% vs. 55%; p=0.023). Fruit was consumed every day by 59% SPA and 69% EPA (p=0.003). Girls consumed fruit more often than boys (69% vs. 58%, respectively; p=0.010).
Butter was the most frequently chosen fat, with 59% of SPA participants and 54% of EPA participants eating it every day (one or several times) (p=0.044). Approximately 53% of girls and 60% of boys declared every day butter consumption (p=0.028), and 22% of girls and 17% of boys several times a week.
The most frequently declared fast food consumption was once a week. This indicated 50% of participants (SPA 53%; EPA 47%; p=0.041), while 1-3 times a month, was indicated by 33% SPA and 45% EPA. Boys consumed fast food more often than girls (p=0.043).
The study observed a high consumption of sweets. Approximately 54% SPA and 29% EPA participants ate sweets every day (p=0.001), and almost 30% ate sweets several times a week (SPA 22%; EPA 36%; p=0.020). Consumption of sweets was at a similar level in girls and boys (p=0.240).
Participants typically chose juices once a week (SPA 45%; EPA 47%; p= 0.065), more often in boys than girls (21% vs. 17%, respectively; p= 0.61). Sweetened carbonated drinks were drank several times a week by 19% SPA and 9% EPA participants (p= 0.003). Participants drank energy drinks most frequently, 1-3 times a month. That was reported by 24% SPA and 19% EPA participants (p= 0.062). However, 65% SPA and 73% EPA didn’t drink energy drinks at all. Boys significantly more often drank carbonated drinks than girls (p= 0.020) and energy drinks (p= 0.038).
3.3. Extra-Curricular PA
The surveyed adolescents most often declared that they spent their free time practicing in various forms of PA. On average, 69% preferred active forms of spending free time (SPA 64%, EPA 75%; p=0.003), while 31% preferred sedentary activities, such as watching TV or the Internet surfing (SPA 36%, EPA 25%; p=0.027). Boys, significantly more often than girls, declared active forms of spending free time (79% vs. 60%, respectively; p=0.001).
EPA adolescents more likely participated in extra-curricular PA than SPA (Figure 2). Approximately 91% of EPA participants undertake extra-curricular PA at least 4 days a week while in SPA it was almost 47%. Approximately 35% of them reported every day extra-curricular PA during their free time (EPA 52% vs. SPA 18%, respectively; p=0.000) (Figure 2). EPA participants more likely reported being physically active four to five days a week (EPA 41% vs. SPA 29%; p=0.000). While SPA participants were more likely physically active two or three days a week (SPA 40% vs. EPA 7%; p=0.000). On average, 4% of SPA adolescents reported taking part in extra-curricular PA only one day a week. Approximately 1% EPA and 12% SPA adolescents reported only one day a week or lack of extra-curricular PA. Approximately 42% of boys and 28% of girls reported being physically active every day (p=0.010), while 35% reported being physically active 4–6 days a week (33% and 37%, respectively; p=0.047).
The vast majority (EPA 94% and SPA 97%; p=0.817) were fully aware of the beneficial effects of healthy diet on sports performance. Most adolescents declared their diet to be healthy, with SPA 60% and EPA 59%, while 40% considered it to be unhealthy.
3.4. PCA
In PCA we compared variables as nutritional behavior (variable A and B), BMI (variable C), and the level of PA at school (Variable D). We split the nutritional behavior into two indicators. The first indicator (variable A) reflected the average consumption of foods such as vegetables, fruits, whole grain products, thick groats, cottage cheese, yogurts, milk, lean meat, eggs, and water, all of which are recommended in a healthy diet. The second (variable B) concerned average consumption of those foods which intake should be moderate or low (white bread, small groats and wheat pasta, rice, fried meat or flour dishes, red meat, sausages, canned meat, fatty cheese, sweets, fast food products, carbonated drinks, juices).
In the SPA group, BMI (variable C) and favorable nutritional behavior (variable A) were one group of variables positively correlated with each other. Unfavorable nutritional behavior (variable B) constituted another group of variables. Standard PA at school was associated with an increase in unfavorable nutritional behavior (B) and BMI (C) (Figure 3). SPA adolescents consumed fewer health-promoting foods (A) and more foods that should be limited in a healthy diet (B) than EPA adolescents. Whereas, in the EPA group, PA at school (D), BMI (C) and favorable nutritional behavior (A) constituted one group of variables positively correlated with each other. Similarly to SPA, unfavorable nutritional behaviors (B) constituted another group of variables. Expanded PA at school positively correlated with normal BMI and more favorable nutritional behavior and reduced unfavorable nutritional behavior (Figure 4).
The results of the PCA revealed a negative correlation between standard PA at school and favorable nutritional behavior and a healthy BMI. Conversely, extended physical activity at school was positively correlated with normal BMI and more favorable nutritional behavior among adolescents. It also negatively correlated with unfavorable nutritional behaviors.
4. Discussion
The study showed that extended PA at school reduced the number of adolescents who were obese and improved their nutritional behavior slightly. This is in agreement with previous studies, which also found that low physical activity is often positively associated with overweight and improper nutritional behavior [12,13,14].
Our observations suggest that children and adolescents who are physically active tend to have a lower BMI than children who have low PA. This is consistent with our observations. We found that most teenagers were healthy and had a higher percentage of EPA than SPA (64% vs. 58%; respectively). Nowaczyk et al. (2023) showed that after 10 months of increased PA, the percentage of participants with a normal BMI increased from 52% to 58%, while in the group without additional PA it decreased from 59% to 49% [36]. In our study, we found that the prevalence of excess body weight in 13-year-olds was very high, with an average of 28% being overweight or obese, including more often in SPA than EPA. Data from a few years back shows that about 22% of teenagers are overweight [25]. Our research indicates that the percentage is increasing. The study by Nowaczyk et al. (2023) also shows that almost 28% of 11-year-olds are overweight [36]. Nonetheless, lower levels of overweight and obesity were noted in the studies conducted by Zou et al. (2023) [37] and Bartosiewicz et al. (2020) [38]. Similar findings were reported by Petri et al. (2020) and Lima et al. (2021) [39,40]. According to the cited article, 22% of children performing sports were overweight or obese [39].
According to Jacob et al. (2021), interventions that focus on regular PA and healthy eating have the greatest potential to reduce BMI in adolescents to normal values [41]. This is in line with our results. This finding is also consistent with the study by Gbska et al. (2023), which showed that higher BMI values were observed in the group of adolescents not participating in additional PA [42]. Nowaczyk et al. (2023) demonstrated that following a period of 10 months of increased physical activity, the percentage of overweight participants decreased from 25% to 17%, and with obesity, the percentage decreased from almost 3% to less than 1% [36]. Despite their increased physical activity at school, the teenagers in the study still had a high share of overweight and obesity. There were 22% of extended PA participants who were overweight and obese compared to 33% of those who had standard PA. Nonetheless, several studies have failed to demonstrate the impact of elevated PA on body mass index [43,44].
In recent years, it has been frequently reported that in many nations, the likelihood of obesity is higher among teenage boys compared to girls [45]. In our study, we found that excess body weight was more often found among girls than boys (average 29% vs 26%, respectively). The same result was shown in the study by Bartosiewicz et al. (2020), (21% vs. 23%, respectively) [38]. The study by Nowaczyk et al. (2023) revealed that excess body weight was more prevalent in females than males [36]. Unfavorable nutritional behavior and low PA are associated with the risk of excess body weight. Schlesinger et al. (2019) found that certain food groups are associated with the risk of excess body weight, such as sweets, salty snacks, and highly processed foods [46]. A healthy diet for adolescents should include vegetables, fruit, legumes, whole grains, milk, fish, eggs, and lean meat [20,21,22].
Our results showed that adolescents who were exposed to extended PA at school had more favorable nutritional behavior than those who were exposed to standard PA. Several significant studies have also demonstrated correlations between sports and generally healthier dietary choices, including a reduction in consumption of sweets, sugar-sweetened beverages, and energy drinks, akin to our findings [17,47,48]. A small group of teenagers adhered to the daily allowance of whole grains and vegetables. An even smaller percentage of the study participants consumed fish, legumes, whole grain groats, whole grain pasta and oatmeal, which could have contributed to the higher BMI. The dietary irregularities and qualitative nutritional mistakes found in this study were, in fact, similar to those reported in other studies [39,40].
Our study found that girls were more likely to consume milk, whole grain bread, thick groats, oatmeal, lean meat, fruit, and vegetables than boys. This was consistent with national observations, which showed that girls had greater nutritional knowledge than boys [49]. On average, vegetables and fruits were consumed every day, with fruits being the most popular than vegetables. It is worth mentioning that adolescents who were exposed to extended PA at school more often consumed vegetables and fruit compared to those of standard PA. These results are similar to the findings of Kanellopoulou et al. (2021) who found that participation in additional sports activities may be associated with an increased consumption of fruits and vegetables [50]. Contrary to our investigation, Froberg et al. (2002) demonstrated that participation in organized PA during free time was not associated with a greater intake of fruit and vegetables [51].
In our study, the declared frequency of consumption of milk, yogurt, and cottage cheese was low, with EPA adolescents consuming them more often than SPA. This is consistent with Fröberg et al. (2022) observations [51]. We also observed a high consumption of wheat bread and a low consumption of whole grain products and thick groats, such as oatmeal. EPA participants ate whole grain products more often than they did SPA, but their consumption was still low. Hurr et al. (2012) also found that children and adolescents don’t eat enough whole grain products [52]. Frequent consumption of sweets and fast foods is one of the most detrimental nutritional habits among children and adolescents. We observed a high consumption of the above products in our study. Sweets were eaten daily by 54% of SPA participants and 29% of the EPA participants. Fast food, on the other hand, was favored by 53% of SPA and 47% of EPA once per week. Archero et al. (2018) found that teenagers every day ate sweets or frequently went to fast-food restaurants. The high consumption of fast food was noted in the work of Scaglioni et al. (2018), where 10% of teenagers declared daily consumption, and 41% once a week [54]. It was noted that a high consumption of sweet juices and carbonated drinks was noted, with nearly 30% of participants drinking juices several times a week, and 46% drinking once a week. Carbonated drinks were drank by 14% and 28%, respectively. It is noteworthy that juices and carbonated beverages were consumed more frequently in SPA than in EPA. Vega-Ramrez (1924) demonstrated a higher consumption of carbonated drinks [55].
We found that EPA adolescents were much more likely than SPA adolescents to engage in additional, out-of-school PA, with boys more often than girls. Similar results were reported by Chen et al. (2018), who found that adolescents who were more active at school and in extracurricular activities had significantly higher levels of moderate PA during the week. This was confirmed in our work [56]. It’s possible to argue that increasing organized PA at school leads to even more PA during leisure time. Other studies also observed that boys engage in more physical activity than girls [57,58]. The study found that SPA adolescents were more likely to engage in sedentary activities than EPA adolescents. The study by Warnberg et al. (2021) showed that more time spent in front of the screen was associated with lower consumption of healthy food, including vegetables, legumes, fish and nuts, and higher consumption of sweets and fast food [59].
The present study found that the amount of organized PA at school was a factor related to BMI and nutritional behavior of participants. A systematic review by Lehmann et al. (2020) indicated that regular PA can help prevent obesity [60]. Other studies showed a positive association between PA and favorable nutritional behavior [61]. However, some researchers did not confirm these relationships [62].
Our study has some limitations. First, the study was restricted to a relatively small group of participants aged 13 years. The investigation should be extended to adolescents from other ages and from a broader geographical area. The content of body fat, which appears to be more suitable for determining the degree of overweightness, was not examined. Only participants’ declarations were used to estimate extracurricular PA and the way they spent free time. The questionnaire contained only a question about the frequency of consumption of various food products, without considering the amount. Another limitation was the anonymous nature of the survey, which prevented comparisons between dietary habits and BMI. The impact of economic standing on the formation of healthy habits is well-known, but this aspect was not taken into account in this investigation.
5. Conclusions
The study revealed that a significant proportion of 13-year-olds were overweight or obese, particularly among those who attended a standard PA. Differences in BMI and nutritional behavior were shown between adolescents with standard and extended PA at school. Extended PA had a beneficial effect on BMI, but it had little effect on nutritional behavior among adolescents. The adolescents exhibited moderate nutritional behaviors, however, it was more favorable in those exposed to extended PA at school than those exposed to standard PA. Girls demonstrated more favorable behaviors than boys. Extended PA at school was positively correlated with normal BMI and more favorable nutritional behavior, as well as negatively correlated with unfavorable nutritional behaviors. Moreover, it’s possible to argue that extending organized PA at school leads to even more PA during leisure time. It is recommended to increase PA for adolescents by doubling the mandatory number of physical education lessons or other sports activities in the school curriculum.
Author Contributions
Conceptualization, W.K.; methodology, K.Ł. and W.K.; software, J.T.; validation, K.L and E.K.N.; formal analysis, E.K.N.; investigation, K.Ł. and W.K.; resources, E.K.N.; data curation, J.T.; writing—original draft preparation, K.Ł.; writing—review and editing, W.K.; visualization, J.T.; supervision, W.K. All authors have read and agreed to the published version of the manuscript.
Funding
This research received no external funding.
Institutional Review Board Statement
The study was conducted in accordance with the Declaration of Helsinki, and approved by the University of Siedlce Ethics Committee of Research Ethics Committee approved the research (Protocol number 2/2016).
Informed Consent Statement
Informed consent was obtained from all subjects involved in the study.
Data Availability Statement
The data supporting reported results are available on request from corresponding author.
Acknowledgments
We expressed our thanks to the adolescents taking part in the study, as well as their parents and educators, for their time and engagement in the study.
Conflicts of Interest
The authors declare no conflicts of interest.
References
- DiPietro, L.; Buchner, D.M.; Marquez, D.X.; Pate, R.R.; Pescatello, L.S.; Whitt-Glover, M.C. New scientific basis for the 2018 U.S. Physical Activity Guidelines. J Sport Health Sci. 2019, 8, 197–200. [Google Scholar] [CrossRef] [PubMed]
- Patton, G.C.; Sawyer, S.M.; Santelli, J.S.; Ross, D.A.; Afifi, R.; Allen, N.B.; Arora, M.; Azzopardi, P.; Baldwin, W.; Bonell, C.; Kakuma, R.; Kennedy, E.; Mahon, J.; McGovern, T.; Mokdad, A.H.; Patel, V.; Petroni, S.; Reavley, N.; Taiwo, K.; Waldfogel, J.; Wickremarathne, D.; Barroso, C.; Bhutta, Z.; Fatusi, A.O.; Mattoo, A.; Diers, J.; Fang, J.; Ferguson, J.; Ssewamala, F.; Viner, R.M. Our future: a Lancet commission on adolescent health and wellbeing. Lancet. 2016, 387, 2423–2478. [Google Scholar] [CrossRef] [PubMed]
- Han, J.C.; Lawlor, D.A.; Kimm, S.Y. Childhood obesity. Lancet. 2010, 375, 1737–1748. [Google Scholar] [CrossRef] [PubMed]
- World Obesity Federation, World Obesity Atlas 2023. Available online: https://data.worldobesity.org/publications/?cat=19 (accessed on 2 September 2024).
- Jebeile, H.; Kelly, A.S.; O’Malley, G.; Baur, L.A. Obesity in children and adolescents: Epidemiology, causes, assessment, and management. Lancet Diabetes Endocrinol. 2022, 10, 351–365. [Google Scholar] [CrossRef]
- NCD Risk Factor Collaboration (NCD-RisC). Worldwide trends in body-mass index, underweight, overweight, and obesity from 1975 to 2016: A pooled analysis of 2416 population-based measurement studies in 128·9 million children, adolescents, and adults. Lancet. 2017, 390, 2627–2642. [Google Scholar] [CrossRef]
- WHO European Regional Obesity Report 2022. WHO Regional Office for Europe, Copenhagen 2022. (accessed on 2 May 2024).
- Bull, F.C.; Al-Ansari, S.S.; Biddle, S.; Borodulin, K.; Buman, M.P.; Cardon, G.; Carty, C.; Chaput, J.P.; Chastin, S.; Chou, R.; Dempsey, P.C.; DiPietro, L.; Ekelund, U.; Firth, J.; Friedenreich, C.M.; Garcia, L.; Gichu, M.; Jago, R.; Katzmarzyk, P.T.; Lambert, E.; Leitzmann, M.; Milton, K.; Ortega, F.B.; Ranasinghe, C.; Stamatakis, E.; Tiedemann, A.; Troiano, R.P.; van der Ploeg, H.P.; Wari, V.; Willumsen, J.F. World Health Organization 2020 guidelines on physical activity and sedentary behaviour. Br. J. Sports Med. 2020, 54, 1451–1462. [Google Scholar] [CrossRef]
- Górna, S.; Pazdro-Zastawny, K.; Basiak-Rasała, A.; Krajewska, J.; Kolator, M.; Cichy, I.; Rokita, A.; Zatoński, T. Physical activity and sedentary behaviors in Polish children and adolescents. Arch Pediatr. 2023, 30, 42–47. [Google Scholar] [CrossRef]
- WHO. WHO Guidelines on Physical Activity and Sedentary Behaviour. WHO.; Geneva, Switzerland: 2020.
- Eddolls, W.T.B.; McNarry, M.A.; Stratton, G.; Winn, C.O.N.; Mackintosh, K.A. High-Intensity Interval Training Interventions in Children and Adolescents: A Systematic Review. Sports Med. 2017, 47, 2363–2374. [Google Scholar] [CrossRef]
- Ługowska, K.; Kolanowski, W.; Trafialek, J. The Impact of Physical Activity at School on Children’s Body Mass during 2 Years of Observation. Int. J. Environ. Res. Public Health. 2022, 19, 3287. [Google Scholar] [CrossRef]
- Ng, A.K.; Hairi, N.N.; Jalaludin, M.Y.; Majid, H.A. Dietary intake, physical activity and muscle strength among adolescents: The Malaysian Health and Adolescents Longitudinal Research Team (MyHeART) study. BMJ Open. 2019, 9, e026275. [Google Scholar] [CrossRef]
- Manzano-Carrasco, S.; Felipe, J.L.; Sanchez-Sanchez, J.; Hernandez-Martin, A.; Clavel, I.; Gallardo, L.; Garcia-Unanue, J. Relationship between Adherence to the Mediterranean Diet and Body Composition with Physical Fitness Parameters in a Young Active Population. Int. J. Environ. Res. Public Health. 2020, 17, 3337. [Google Scholar] [CrossRef] [PubMed]
- Purcell, L.K.; Canadian Paediatric Society. Paediatric Sports and Exercise Medicine Section Sport nutrition for young athletes. Paediatr. Child Health. 2013, 18, 200–202. [Google Scholar] [CrossRef]
- Ługowska, K.; Kolanowski, W.; Trafialek, J. Eating Behaviour and Physical Fitness in 10-Year-Old Children Attending General Education and Sports Classes. Int. J. Environ. Res. Public Health. 2020, 17, 6467. [Google Scholar] [CrossRef]
- Dortch, K.S.; Gay, J.; Springer, A.; Kohl, H.W.; Sharma, S.; Saxton, D.; Wilson, K.; Hoelscher, D. The Association between Sport Participation and Dietary Behaviors among Fourth Graders in the School Physical Activity and Nutrition Survey, 2009–2010. Am. J. Heal. Promot. 2014, 29, 99–106. [Google Scholar] [CrossRef]
- Guthold, R.; Stevens, G.A.; Riley, L.M.; Bull, F.C. Global Trends in Insufficient Physical Activity among Adolescents: A Pooled Analysis of 298 Population-Based Surveys with 1·6 Million Participants. Lancet Child Adolesc. Health. 2020, 4, 23–35. [Google Scholar] [CrossRef]
- Drygas, W.; Gajewska, M.; Zdrojewski, T. Niedostateczny Poziom Aktywności Fizycznej w Polsce Jako Zagrożenie i Wyzwanie Dla Zdrowia Publicznego. Narodowy Instytut Zdrowia Publicznego—Państwowy Zakład Higieny; Warsaw, Poland: 2021.
- López-Gil, J.F.; García-Hermoso, A.; Sotos-Prieto, M.; Cavero-Redondo, I.; Martínez-Vizcaíno, V.; Kales, S.N. Mediterranean Diet-Based Interventions to Improve Anthropometric and Obesity Indicators in Children and Adolescents: A Systematic Review with Meta-Analysis of Randomized Controlled Trials. Adv Nutr. 2023, 14, 858–869. [Google Scholar] [CrossRef]
- Martínez-Lacoba, R.; Pardo-Garcia, I.; Amo-Saus, E.; Escribano-Sotos, F. Mediterranean diet and health outcomes: a systematic meta-review. Eur. J. Public Health. 2018, 28, 955–961. [Google Scholar] [CrossRef]
- Mendenhall, E.; Singer, M. The global syndemic of obesity, undernutrition, and climate change. Lancet. 2019, 393, 741. [Google Scholar] [CrossRef]
- Masini, A.; Dallolio, L.; Sanmarchi, F.; Lovecchio, F.; Falato, M.; Longobucco, Y.; Lanari, M.; Sacchetti, R. Adherence to the Mediterranean Diet in Children and Adolescents and Association with Multiple Outcomes: An Umbrella Review. Healthcare (Basel). 2024, 12, 449. [Google Scholar] [CrossRef]
- Narodowe Centrum Edukacji Żywieniowej. Talerz zdrowego żywienia. Available online: https://ncez.pzh.gov.pl/abc-zywienia/talerz-zdrowego-zywienia/ (accessed on 2 September 2024).
- Mazur, J.; Małkowska-Szkutnik, A.; editor. Zdrowie uczniów w 2018 roku na tle nowego modelu badań HBSC. Mother and Child Institute, Warsaw. Available online: https://imid.med.pl/files/imid/Aktualnosci/Aktualnosci/raport%20HBSC%202018.pdf (accessed on 2 September 2024).
- Faul, F.; Erdfelder, E.; Lang, A.G.; Buchner, A. G*Power 3: A flexible statistical power analysis program for the social, behavioral, and biomedical sciences. Behav. Res. Methods 2007, 39, 175–191. [Google Scholar] [CrossRef]
- Kułaga, Z.; Różdżyńska, A.; Palczewska, I. Percentile charts of height, body mass and body mass index in children and adolescents in Poland—Results of the OLAF study. Stand. Med. Pediatr. 2010, 7, 690–700. [Google Scholar]
- Kułaga, Z.; Grajda, A.; Gurzkowska, B.; Góźdź, M.; Wojtyło, M.; Świąder, A.; Różdżyńska-Świątkowska, A.; Litwin, M. Polish 2012 growth references for preschool children. Eur. J. Pediatr. 2013, 172, 753–761. [Google Scholar] [CrossRef] [PubMed]
- Jeżewska-Zychowicz, M.; Gawęcki, J.; Wądołowska, L.; et al. Kwestionariusz do badania poglądów i zwyczajów żywieniowych dla osób w wieku od 16 do 65 lat. KomPAN, Warsaw: 2020. p. 22–34.
- Ługowska, K.; Kolanowski, W.; Trafialek, J. The Impact of Physical Activity at School on Children’s Body Mass during 2 Years of Observation. Int. J. Environ. Res. Public Health. 2022, 19, 3287. [Google Scholar] [CrossRef] [PubMed]
- World Medical Association. World Medical Association Declaration of Helsinki. Bull World Health Organ. 2013, 79, 373–374. [Google Scholar]
- Kolanowski, W.; Ługowska, K. The Effectiveness of Physical Activity Intervention at School on BMI and Body Composition in Overweight Children: A Pilot Study. Appl. Sci. 2024, 14, 7705. [Google Scholar] [CrossRef]
- Marfell-Jones, M.; Old, T.; Steward, A.; Carter, J.E.L. International Standards for Anthropometric Assessment; ISAK: Palmerston North, New Zeland, 2012. [Google Scholar]
- Tanita SC-240MA Instruction Manual. Tanita User Manual SC 240 MA. Available online: https://www.manualslib.com/manual/1065295/Tanita-Sc-240ma.html (accessed on 2 September 2024).
- Orsso, C.E.; Gonzalez, M.C.; Maisch, M.J.; Haqq, A.M.; Prado, C.M. Using bioelectrical impedance analysis in children and adolescents: Pressing issues. Eur. J. Clin. Nutr. 2022, 76, 659–665. [Google Scholar] [CrossRef]
- Nowaczyk, M.; Cieślik, K.; Waszak, M. Assessment of the Impact of Increased Physical Activity on Body Mass and Adipose Tissue Reduction in Overweight and Obese Children. Children (Basel). 2023, 10, 764. [Google Scholar] [CrossRef]
- Zou, Y.; Huang, L.; Zhao, D.; He, M.; Han, D.; Su. D.; Zhang, R. Food and Nutrient Intake in Children and Adolescents with or without Overweight/Obesity. Nutrients 2023, 15, 4450. [Google Scholar] [CrossRef]
- Bartosiewicz, A.; Łuszczki, E.; Kuchciak, M.; Bobula, G.; Oleksy, Ł.; Stolarczyk, A.; Dereń, K. Children’s Body Mass Index Depending on Dietary Patterns, the Use of Technological Devices, the Internet and Sleep on BMI in Children. Int. J. Environ. Re.s Public Health. 2020, 17, 7492. [Google Scholar] [CrossRef]
- Petri, C.; Mascherini, G.; Bini, V.; Anania, G.; Calà, P.; Toncelli, L.; Galanti, G. Integrated total body composition versus Body Mass Index in young athletes. Minerva Pediatr. 2020, 72, 163–169. [Google Scholar] [CrossRef]
- Lima, N.M.D.S.; Leal, V.S.; Oliveira, J.S.; Andrade, M.I.S.; Santos, NF.D.; Pessoa, J.T.; Aquino, N.B.; Lira, P.I.C. Excess weight in adolescents and associated factors: data from the ERICA study. J. Pediatr. (Rio J). 2021, 97, 676–684. [Google Scholar] [CrossRef] [PubMed]
- Jacob, C.M.; Hardy-Johnson, P.L.; Inskip, H.M.; Morris, T.; Parsons, C.M.; Barrett, M.; Hanson, M.; Woods-Townsend, K.; Baird, J. A systematic review and meta-analysis of school-based interventions with health education to reduce body mass index in adolescents aged 10 to 19 years. Int. J. Behav. Nutr. Phys. Act. 2021, 18, 1. [Google Scholar] [CrossRef]
- Głąbska, D.; Guzek, D.; Skolmowska, D.; Adamczyk, J.G.; Nałęcz, H.; Mellová, B.; Żywczyk, K.; Baj-Korpak, J.; Gutkowska, K. Influence of Food Habits and Participation in a National Extracurricular Athletics Program on Body Weight within a Pair-Matched Sample of Polish Adolescents after One Year of Intervention-goathletics Study. Nutrients. 2023, 15, 5106. [Google Scholar] [CrossRef]
- Słowik, J.; Grochowska-Niedworok, E.; Maciejewska-Paszek, I.; Kardas, M.; Niewiadomska, E.; Szostak-Trybuś, M.; Palka-Słowik, M.; Irzyniec, T. Nutritional Status Assessment in Children and Adolescents with Various Levels of Physical Activity in Aspect of Obesity. Obes. Facts. 2019, 12, 554–563. [Google Scholar] [CrossRef]
- Koca, T.; Akcam, M.; Serdaroglu, F.; Dereci, S. Breakfast habits, dairy product consumption, physical activity, and their associations with body mass index in children aged 6–18. Eur. J. Pediatr. 2017, 176, 1251–1257. [Google Scholar]
- Shah, B.; Tombeau Cost, K.; Fuller, A.; Birken, C.S.; Anderson, L.N. Sex and gender differences in childhood obesity: Contributing to the research agenda. BMJ Nutr. Prev. Health. 2020, 3, 387–390. [Google Scholar] [CrossRef]
- Schlesinger, S.; Neuenschwander, M.; Schwedhelm, C.; Hoffmann, G.; Bechthold, A.; Boeing, H.; Schwingshackl, L. Food Groups and Risk of Overweight, Obesity, and Weight Gain: A Systematic Review and Dose-Response Meta-Analysis of Prospective Studies. Adv. Nutr. 2019, 10, 205–218. [Google Scholar] [CrossRef]
- Cerrato-Carretero, P.; Roncero-Martín, R.; Pedrera-Zamorano, J.D.; López-Espuela, F.; Puerto-Parejo, L.M.; Sánchez-Fernández, A.; Canal-Macías, M.L.; Moran, J.M.; Lavado-García, J.M. Long-Term Dietary and Physical Activity Interventions in the School Setting and Their Effects on BMI in Children Aged 6-12 Years: Meta-Analysis of Randomized Controlled Clinical Trials. Healthcare (Basel). 2021, 9, 396. [Google Scholar] [CrossRef]
- Torstveit, M.K.; Johansen, B.T.; Haugland, S.H.; Stea, T.H. Participation in organized sports is associated with decreased likelihood of unhealthy lifestyle habits in adolescents. Scand. J. Med. Sci. Sports. 2018, 28, 2384–2396. [Google Scholar] [CrossRef]
- Hamulka, J.; Wadolowska, L.; Hoffmann, M.; Kowalkowska, J.; Gutkowska, K. Effect of an Education Program on Nutrition Knowledge, Attitudes toward Nutrition, Diet Quality, Lifestyle, and Body Composition in Polish Teenagers. The ABC of Healthy Eating Project: Design, Protocol, and Methodology. Nutrients. 2018, 10, 1439. [Google Scholar] [CrossRef]
- Kanellopoulou, A.; Diamantis, D.V.; Notara, V.; Panagiotakos, D.B. Extracurricular Sports Participation and Sedentary Behavior in Association with Dietary Habits and Obesity Risk in Children and Adolescents and the Role of Family Structure: a Literature Review. Curr. Nutr. Rep. 2021, 10, 1–11. [Google Scholar] [CrossRef] [PubMed]
- Fröberg, A.; Lindroos, A.K.; Moraeus, L.; Patterson, E.; Warensjö Lemming, E.; Nyberg, G. Leisure-time organised physical activity and dietary intake among Swedish adolescents. J. Sports. Sci. 2022, 40, 1198–1205. [Google Scholar] [CrossRef] [PubMed]
- Hur, I.Y.; Reicks, M. Relationship between whole-grain intake, chronic disease risk indicators, and weight status among adolescents in the National Health and Nutrition Examination Survey, 1999-2004. J. Acad. Nutr. Diet. 2012, 112, 46–55. [Google Scholar] [CrossRef] [PubMed]
- Archero, F.; Ricotti, R.; Solito, A.; Carrera, D.; Civello, F.; Di Bella, R.; Bellone, S.; Prodam, F. Adherence to the Mediterranean Diet among School Children and Adolescents Living in Northern Italy and Unhealthy Food Behaviors Associated to Overweight. Nutrients. 2018, 10, 1322. [Google Scholar] [CrossRef] [PubMed]
- Scaglioni, S.; De Cosmi, V.; Ciappolino, V.; Parazzini, F.; Brambilla, P.; Agostoni, C. Factors Influencing Children’s Eating Behaviours. Nutrients. 2018, 10, 706. [Google Scholar] [CrossRef]
- Vega-Ramírez, L. Exploring the Influence of a Physical Activity and Healthy Eating Program on Childhood Well-Being: A Comparative Study in Primary School Students. Int. J. Environ. Res. Public Health. 2024, 21, 418. [Google Scholar] [CrossRef]
- Chen, W.; Hammond-Bennett, A.; Hypnar, A.; Mason, S. Health-related physical fitness and physical activity in łelementary school students. BMC Public Health. 2018, 18, 195. [Google Scholar] [CrossRef]
- Beltrán Carrillo, V.J.; Sierra, A.C.; Jiménez Loaisa, A.; González-Cutre, D.; Martínez Galindo, C.; Cervelló, E. Diferencias según género en el tiempo empleado por adolescentes en actividad sedentaria y actividad física en diferentes segmentos horarios del día (Gender differences in time spent by adolescents in sedentary and physical activity in different day segmen. Retos. Digit. 2016, 31, 3–7. [Google Scholar] [CrossRef]
- Portela-Pino, I.; López-Castedo, A.; Martínez-Patiño, M.J.; Valverde-Esteve, T.; Domínguez-Alonso, J. Gender Differences in Motivation and Barriers for The Practice of Physical Exercise in Adolescence. Int J Environ Res Public Health. 2019, 17, 168. [Google Scholar] [CrossRef]
- Warnberg, J.; Perez-Farinos, N.; Benavente-Marin, J.C.; Gomez, S.F.; Labayen, I.; Gusi, N.; Aznar, S.; Alcaraz, P.E.; Gonzalez-Valeiro, M.; et al. Screen Time and Parents’ Education Level Are Associated with Poor Adherence to the Mediterranean Diet in Spanish Children and Adolescents: The PASOS Study. J. Clin. Med. 2021, 10, 795. [Google Scholar] [CrossRef]
- Lehmann, F.; Varnaccia, G.; Zeiher, J.; Lange, C.; Jordan, S. Influencing factors of obesity in school-age children and adolescents—A systematic review of the literature in the context of obesity monitoring. J. Health Monit. 2020, 5, 2–23. [Google Scholar] [PubMed]
- Llargues, E.; Franco, R.; Recasens, A.; Nadal, A.; Vila, M.; Perez, M.J.; Manresa, J.M.; Recasens, I.; Salvador, G.; Serra, J.; et al. Assessment of a school-based intervention in eating habits and physical activity in school children: The AVall study. J. Epidemiol. Community Health. 2011, 65, 896–901. [Google Scholar] [CrossRef] [PubMed]
- Wawrzyniak, A.; Traczyk, I. Nutrition-Related Knowledge and Nutrition-Related Practice among Polish Adolescents-A Cross-Sectional Study. Nutrients. 2024, 16, 1611. [Google Scholar] [CrossRef] [PubMed]
Figure 1.
BMI categories in adolescents. EPA—elevated PA group; SPA—standard PA group.
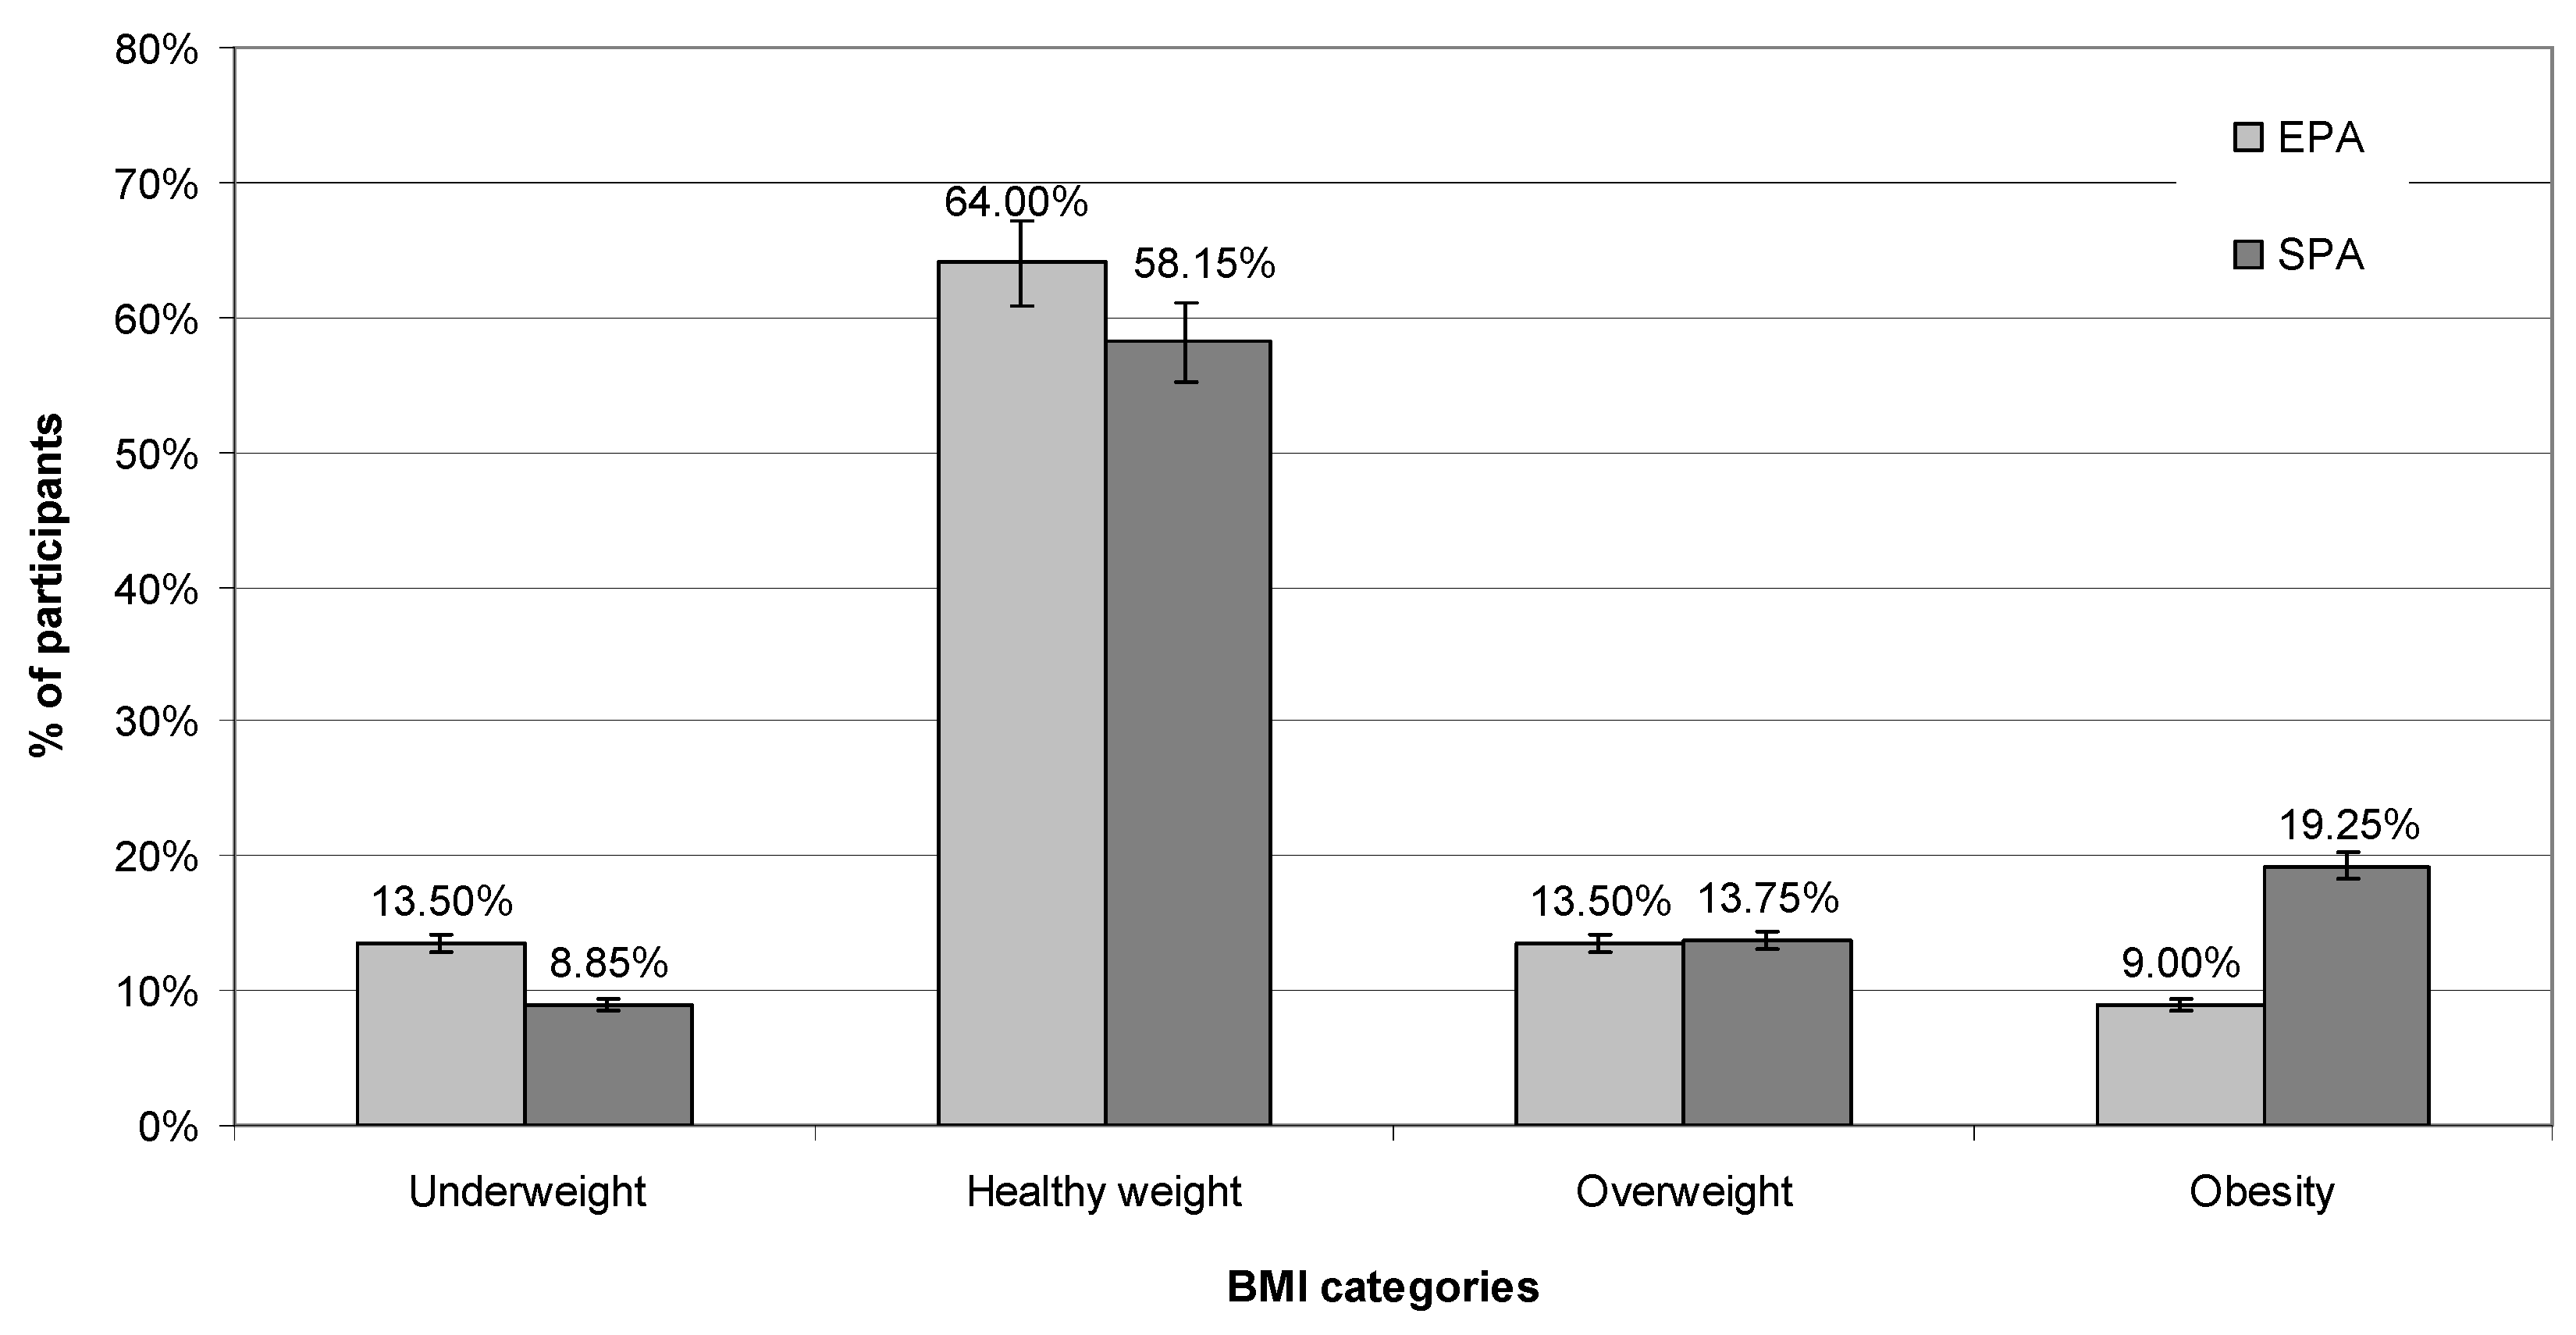
Figure 2.
Extra-curricular physical activity.
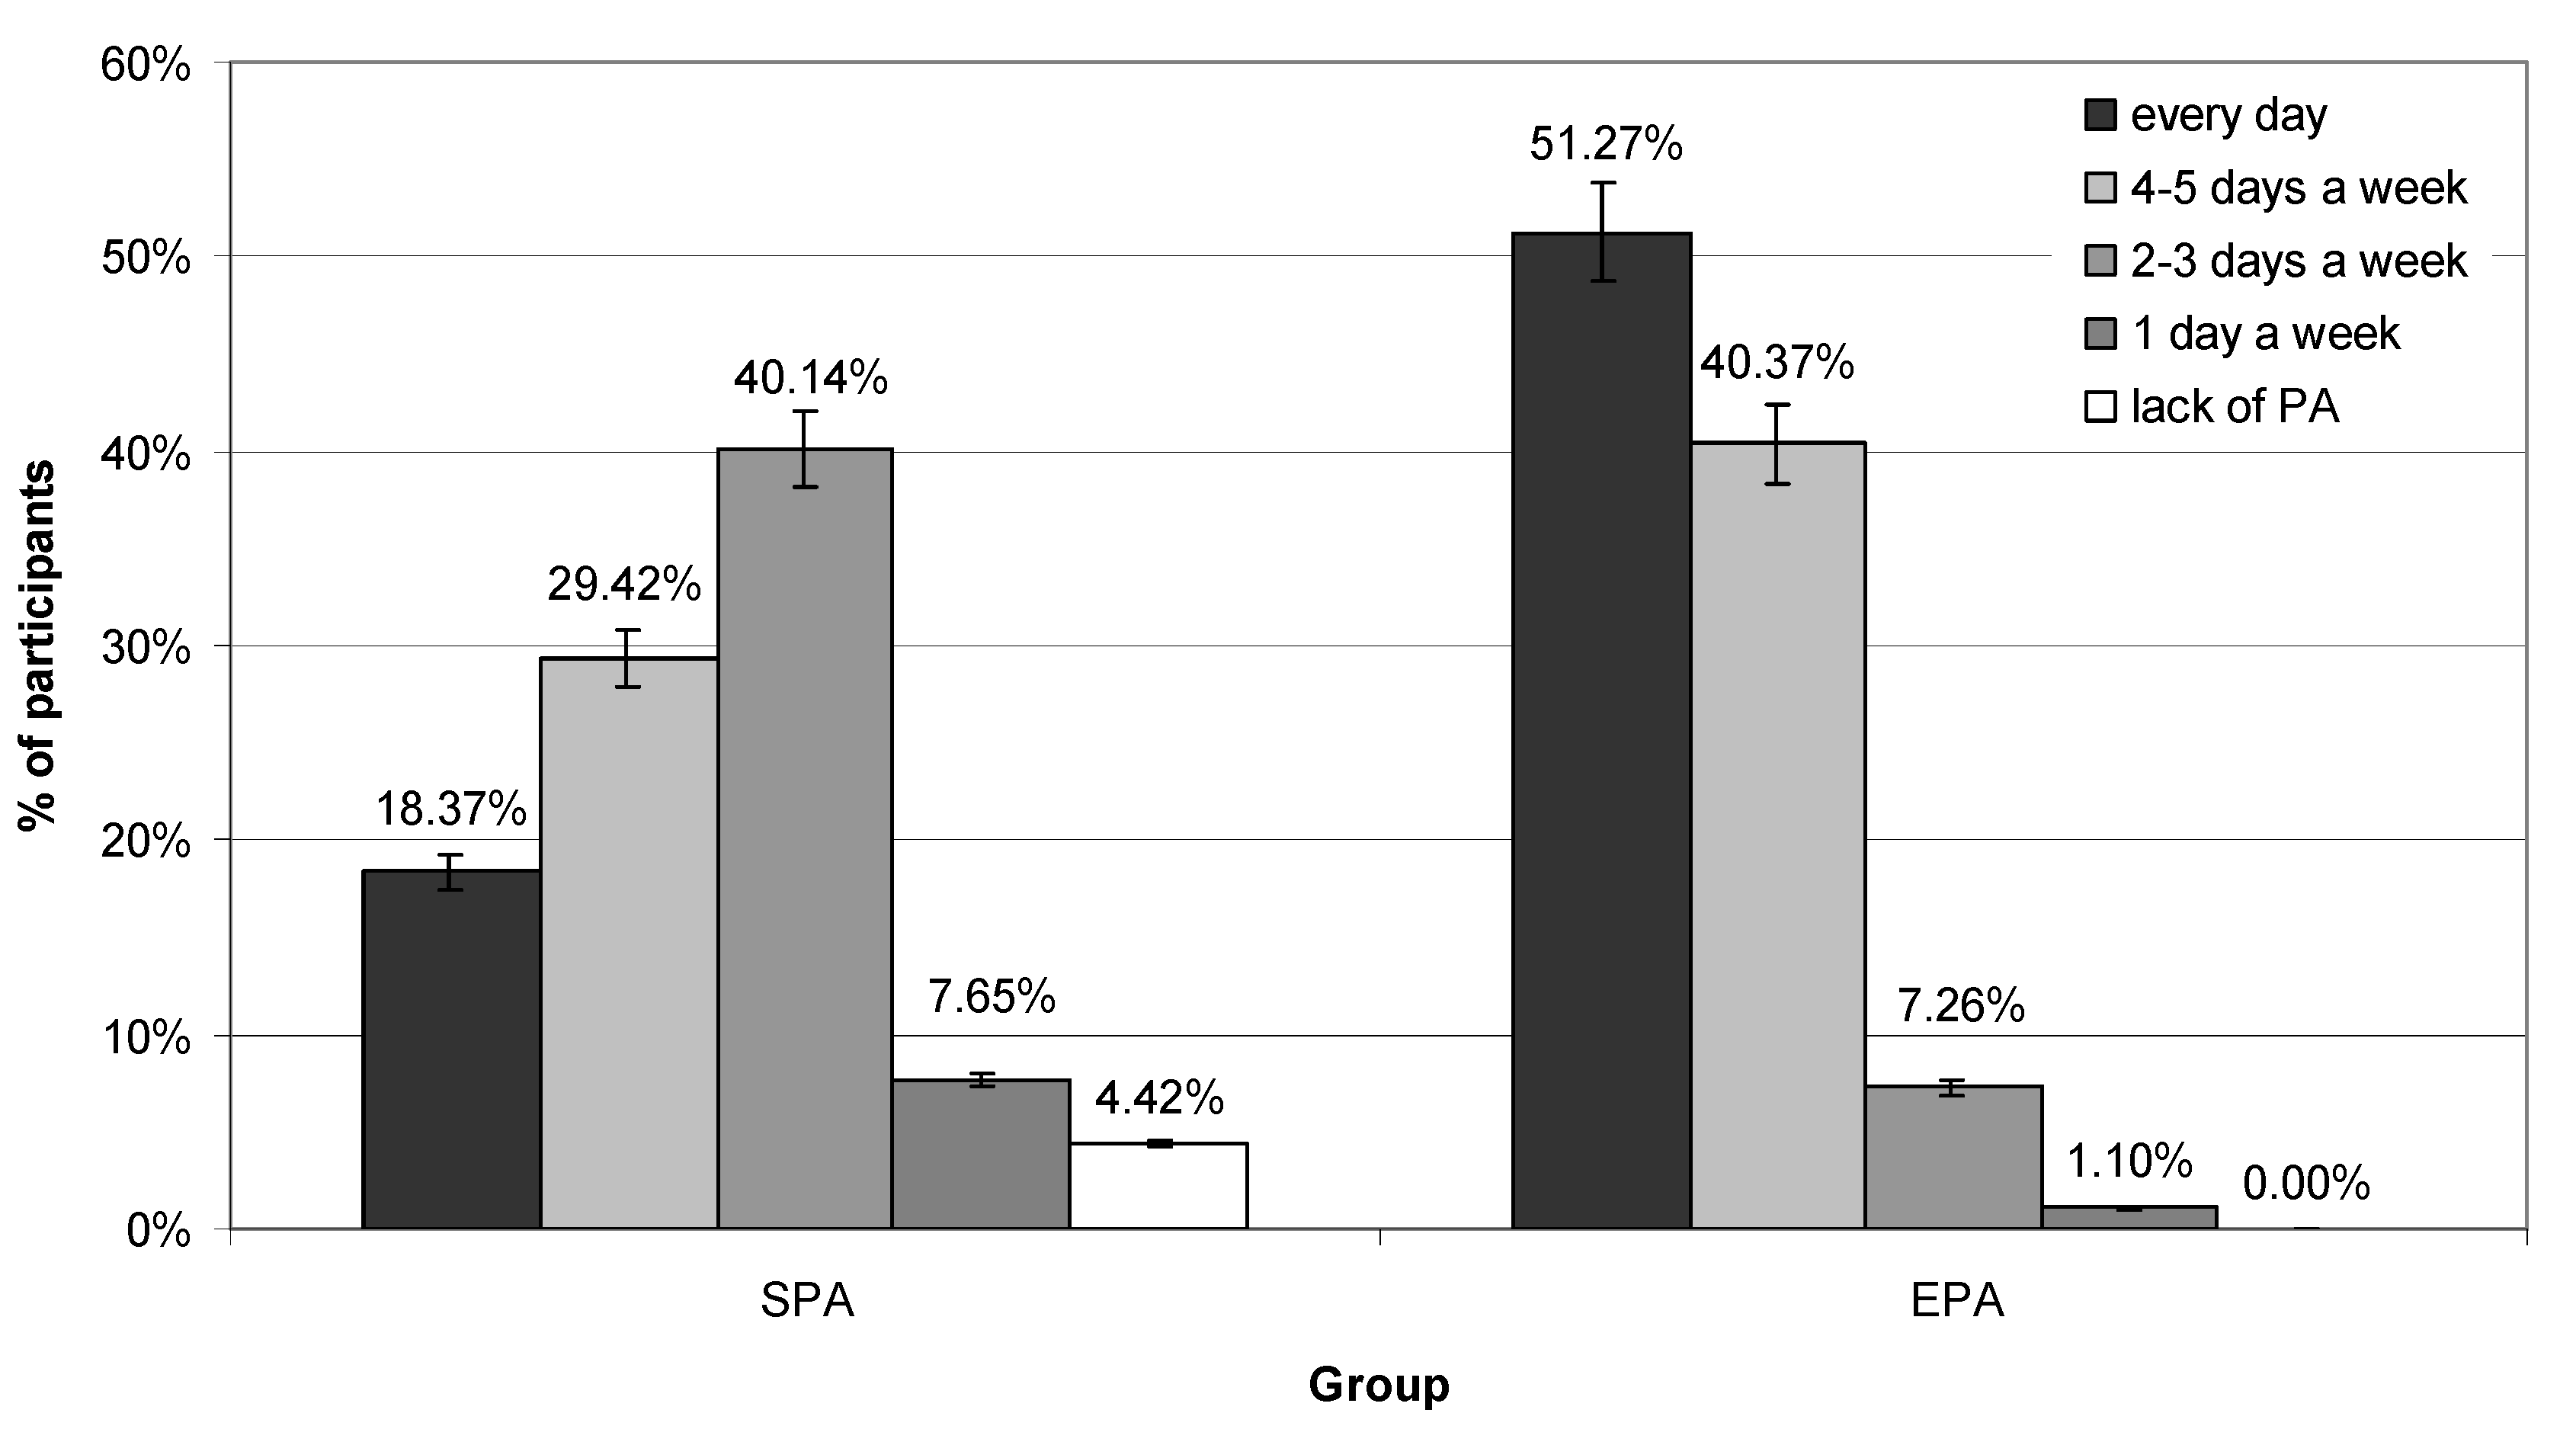
Figure 3.
PCA analysis of physical activity, BMI and nutritional behavior correlations in SPA group. A—Favorable nutritional behaviors; B—Unfavorable nutritional behavior; C—BMI; D—PA at school.
Figure 3.
PCA analysis of physical activity, BMI and nutritional behavior correlations in SPA group. A—Favorable nutritional behaviors; B—Unfavorable nutritional behavior; C—BMI; D—PA at school.
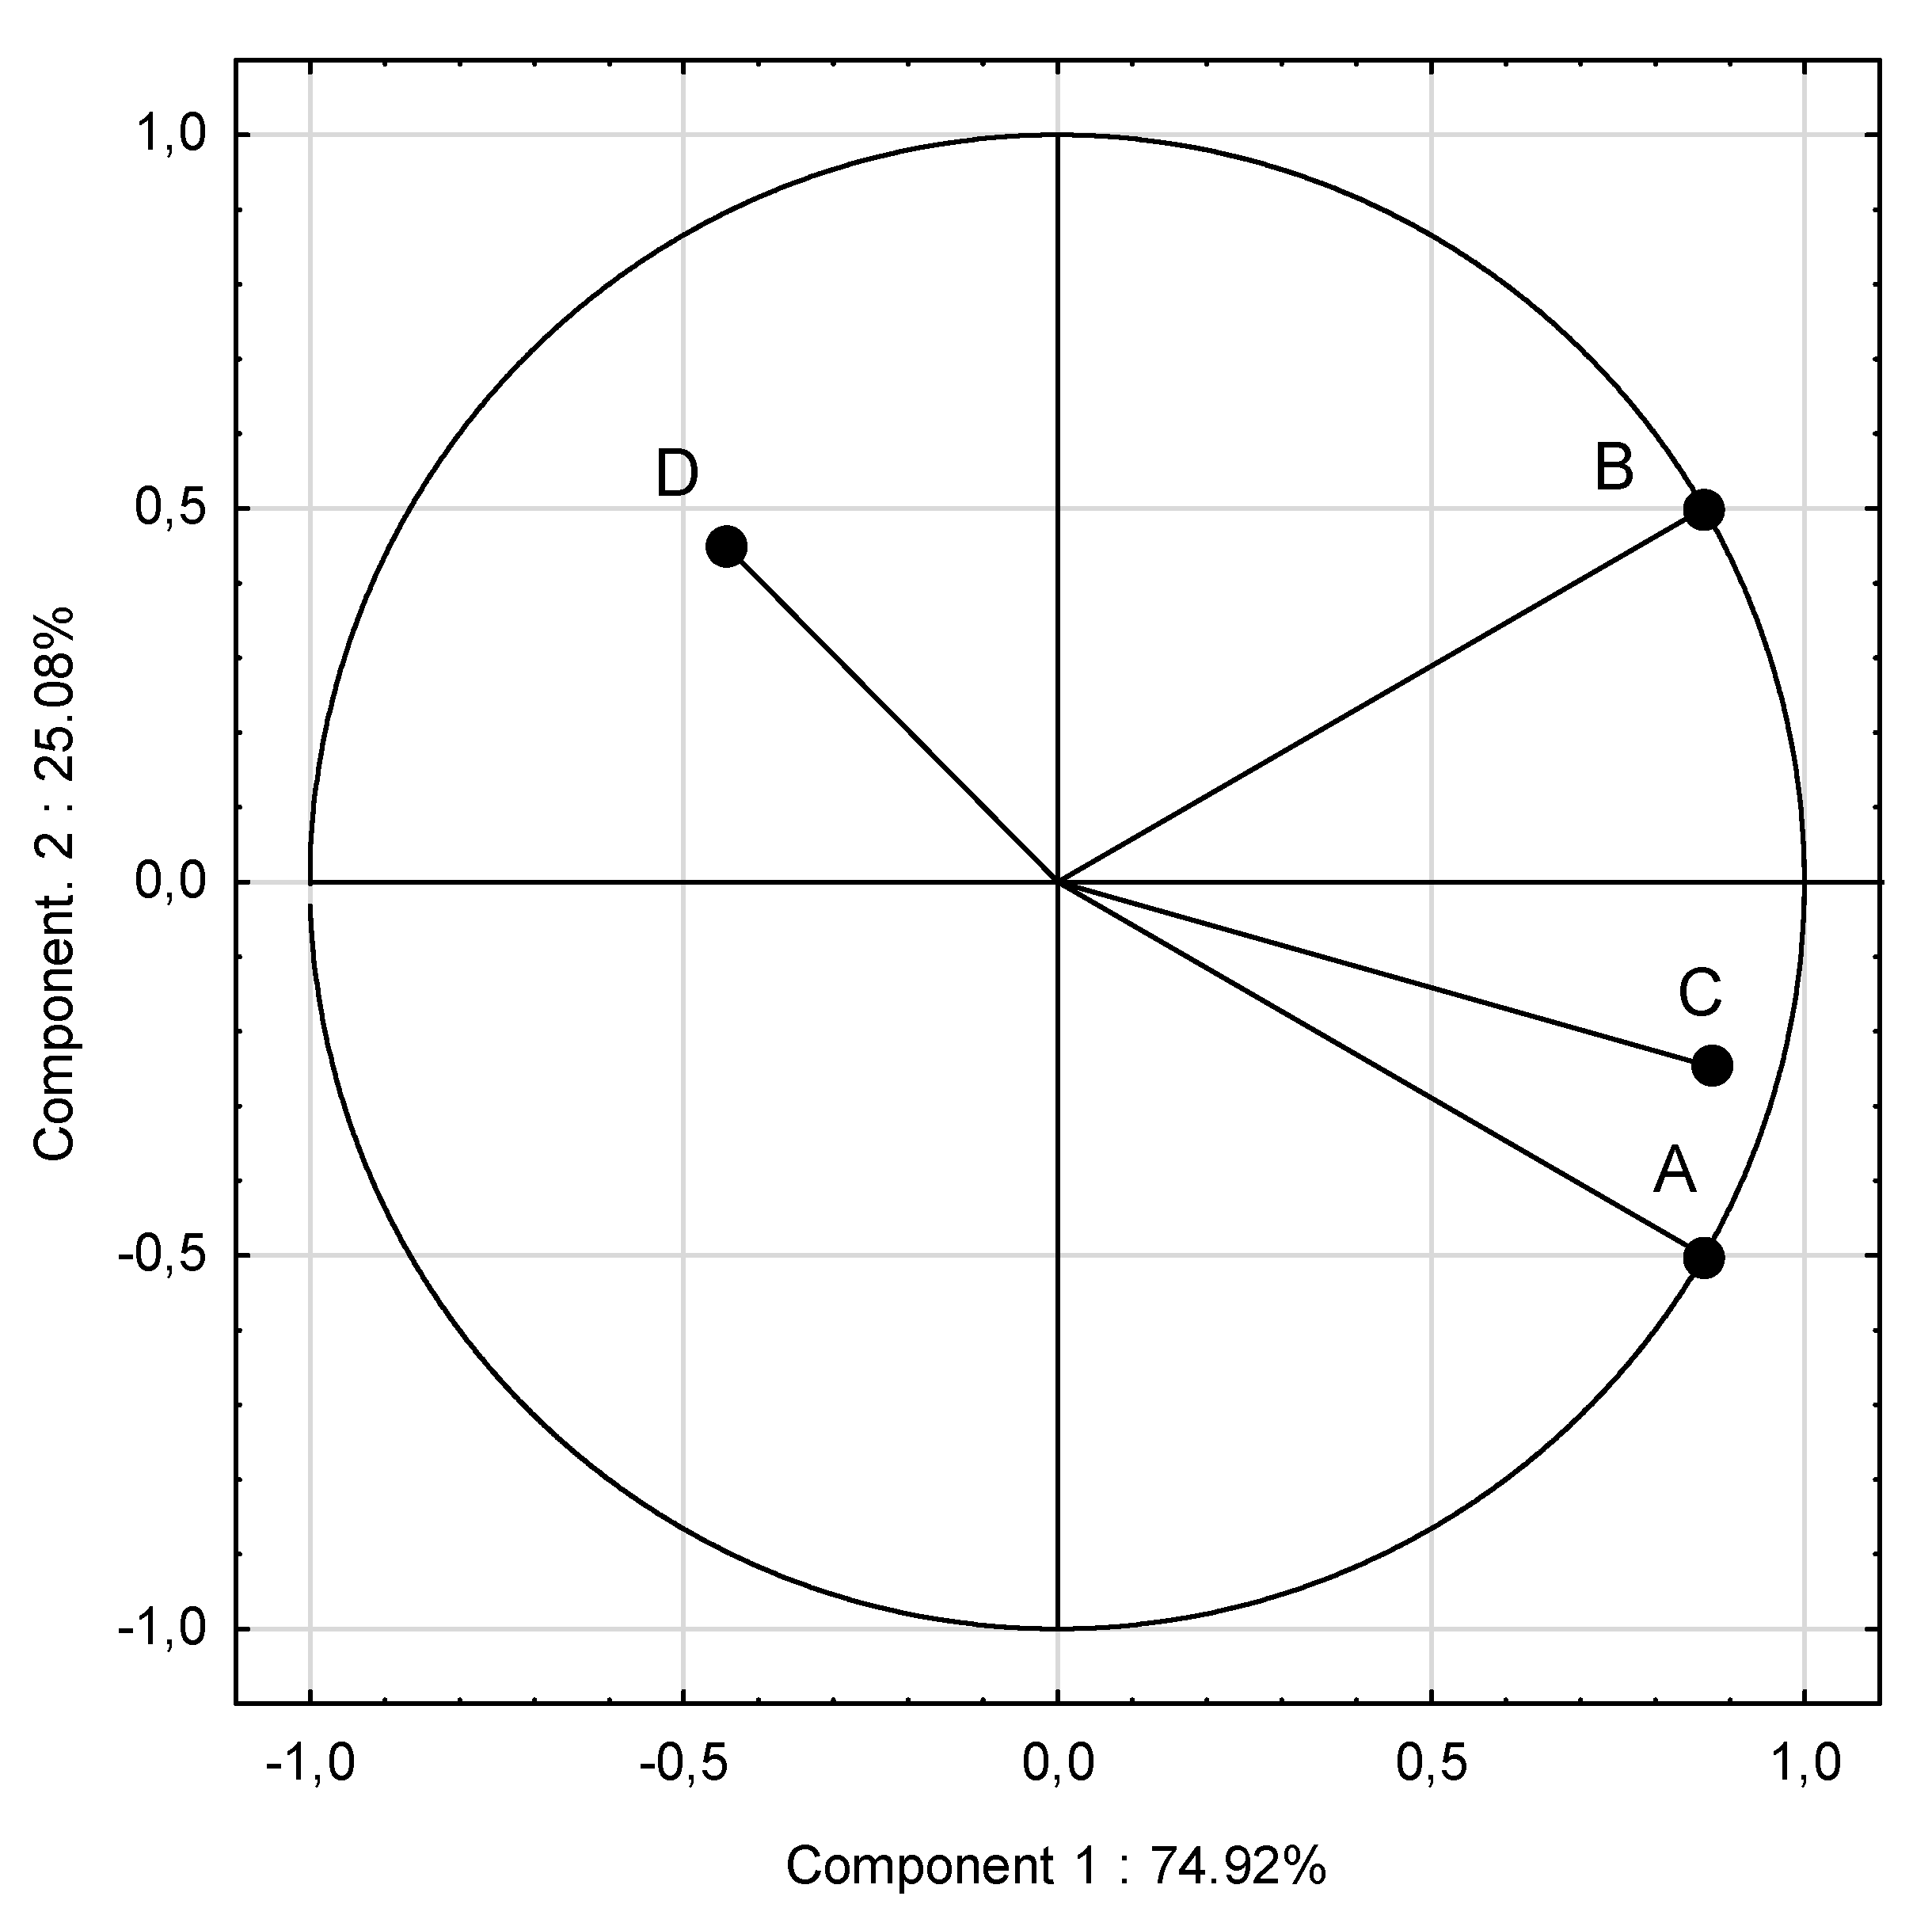
Figure 4.
PCA analysis of physical activity, BMI and nutritional behavior correlations in EPA group. A—Favorable nutritional behaviors; B—Unfavorable nutritional behavior; C—BMI; D—PA at school.
Figure 4.
PCA analysis of physical activity, BMI and nutritional behavior correlations in EPA group. A—Favorable nutritional behaviors; B—Unfavorable nutritional behavior; C—BMI; D—PA at school.
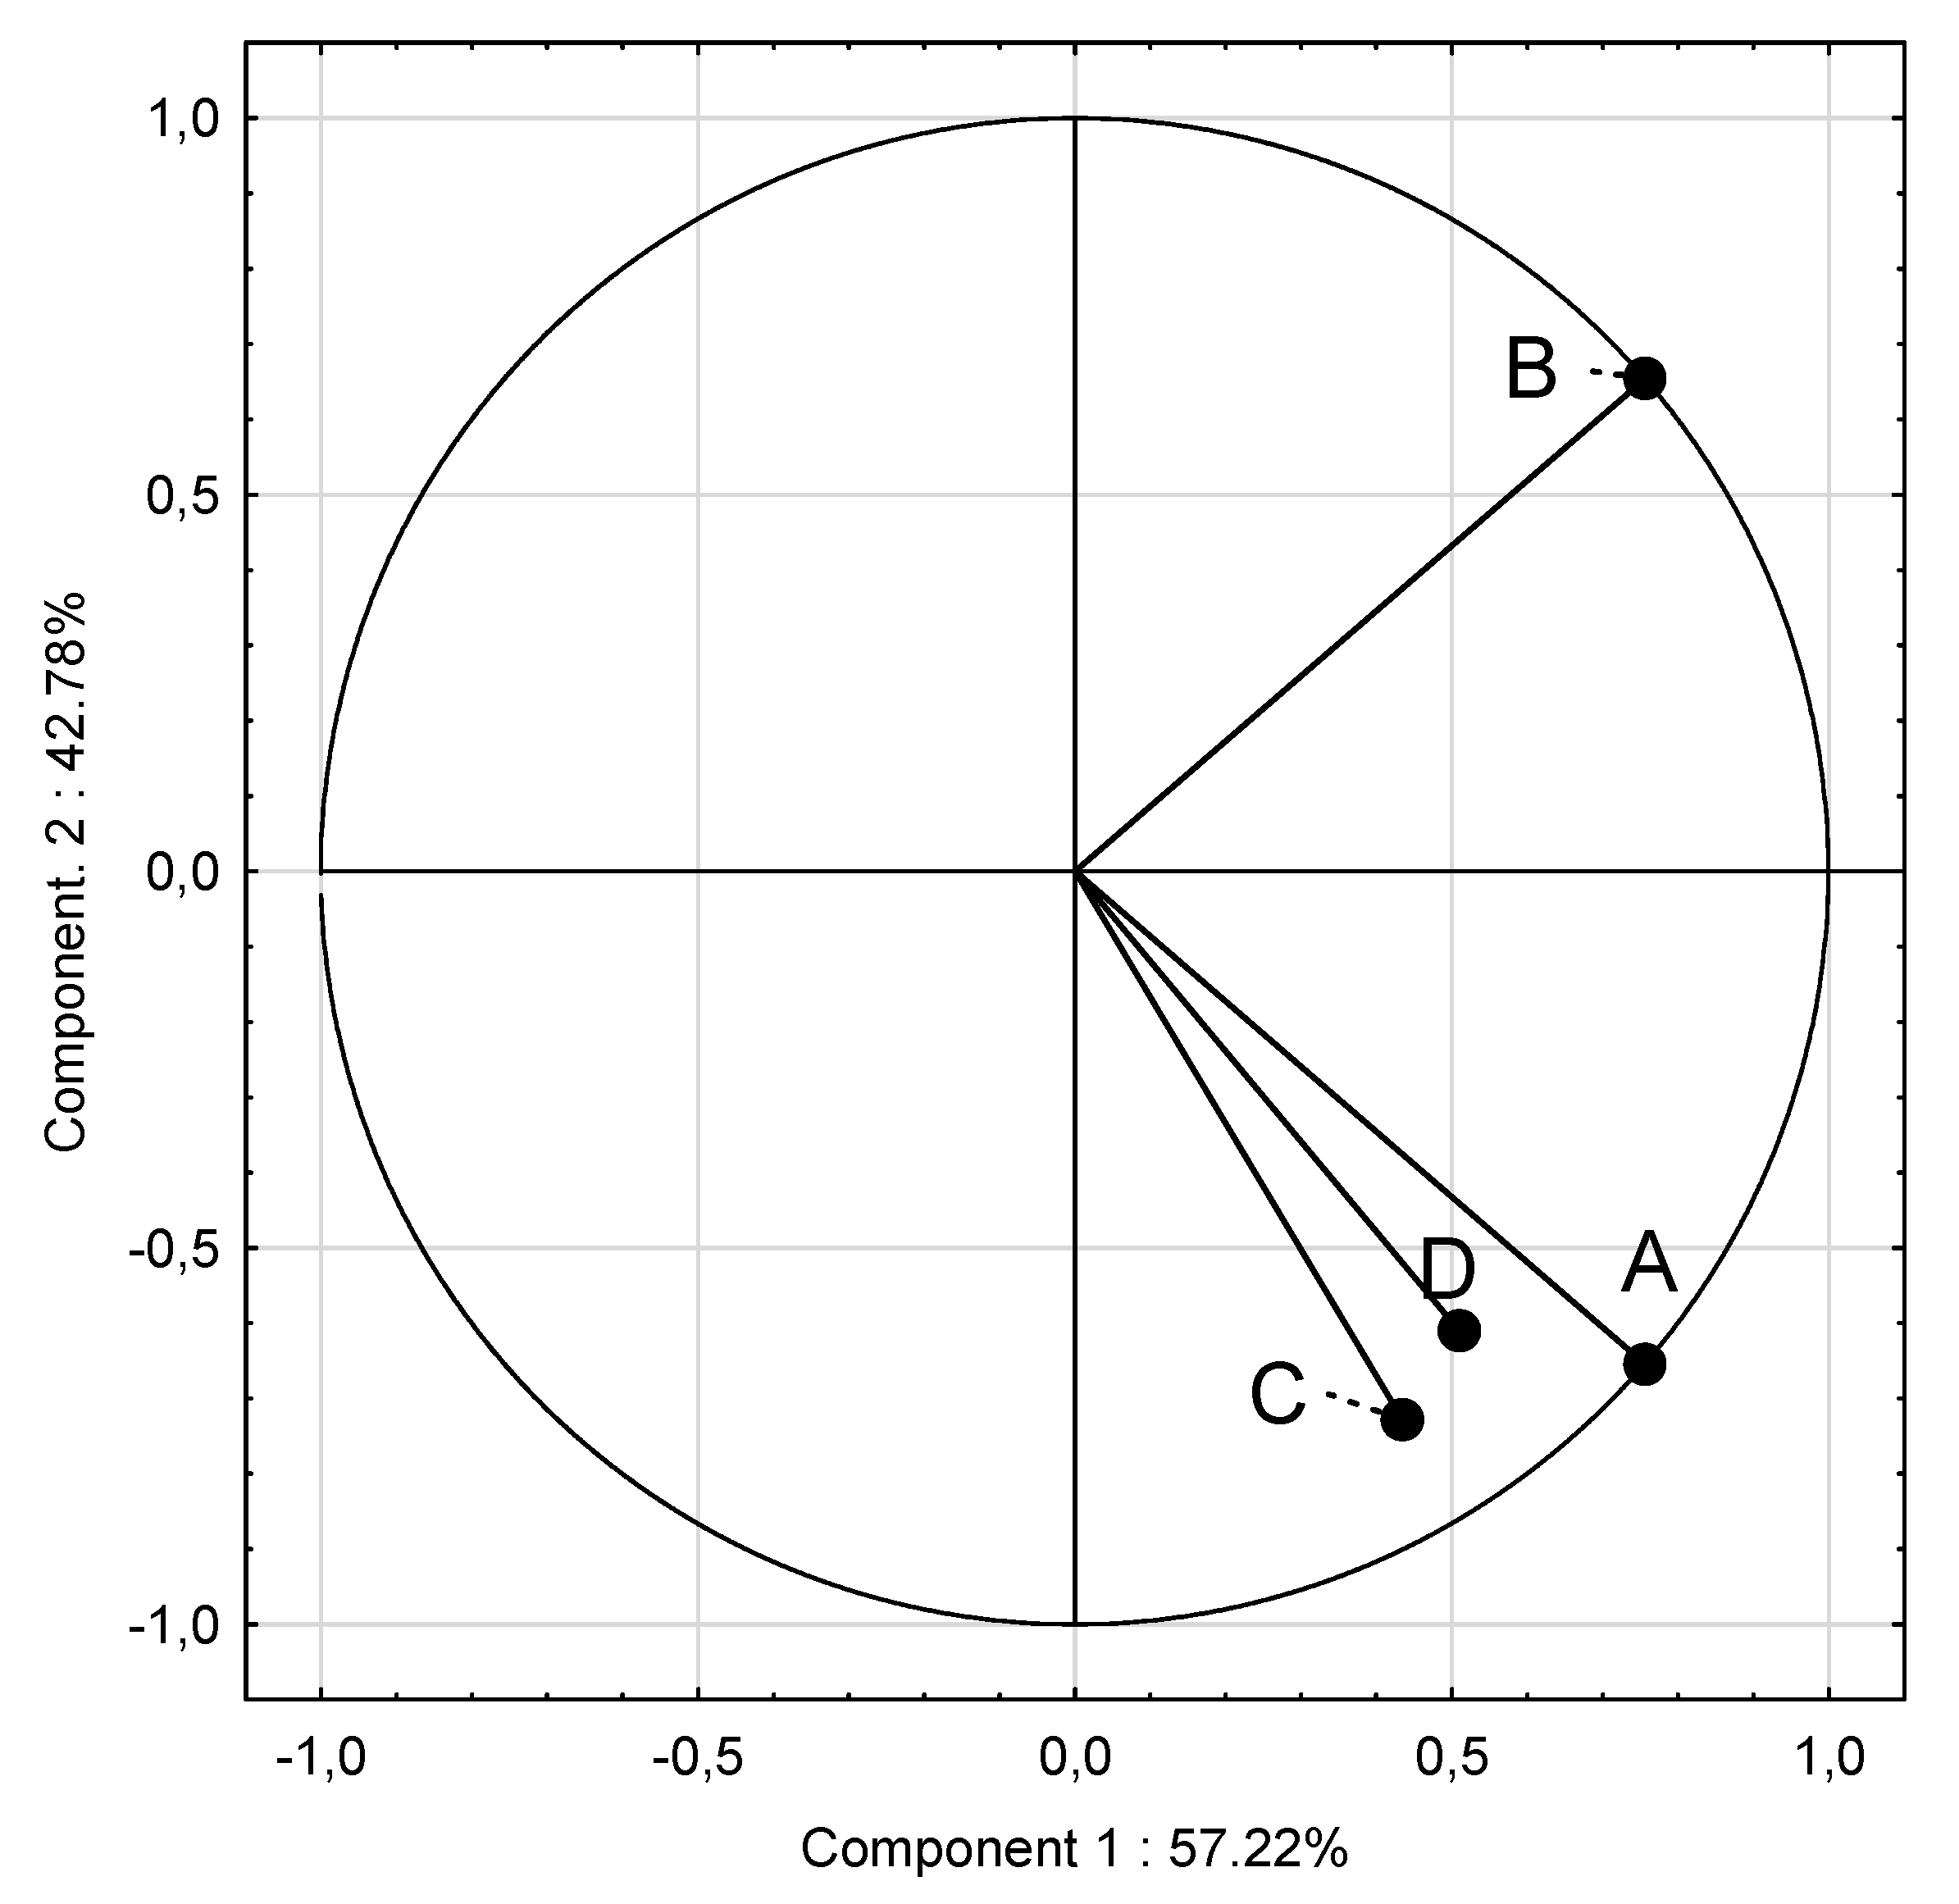

Table 1.
Anthropometric indicators and BMI of the studied adolescents.
| Indicator | Groups | |||||||||||
| Mean total |
SPA | EPA | p | |||||||||
| Mean | Median | Min | Max | SD | Mean | Median | Min | Max | SD | |||
| Height (cm) | 167.23 | 167.57 | 166.50 | 147.00 | 186.00 | 8.39 | 166.83 | 167.00 | 146.00 | 182.00 | 7.01 | 0.148 |
| Weight (kg) | 59.90 | 61.24 | 58.85 | 37.80 | 109.20 | 14.78 | 58.36 | 57.90 | 29.90 | 93.20 | 120.02 | 0.002 |
| BMI (kg/m2) | 21.30 | 21.70 | 21.00 | 15.40 | 36.50 | 4.46 | 20.84 | 20.50 | 14.00 | 30.00 | 3.44 | 0.012 |
| Girls | ||||||||||||
| Height (cm) | 164.67 | 164.82 | 164.00 | 152.00 | 180.00 | 5.90 | 164.52 | 164.00 | 149.00 | 182.00 | 5.92 | 0.217 |
| Weight (kg) | 57.19 | 58.61 | 55.65 | 37.80 | 99.50 | 12.99 | 55.60 | 53.80 | 40.10 | 80.10 | 10.09 | 0.041 |
| BMI (kg/m2) / percentile |
21.06 | 21.58 75th |
20.20 | 16.20 | 36.50 | 4.73 | 20.48 50th |
20.30 | 14.80 | 29.40 | 3.26 | 0.035 |
| Boys | ||||||||||||
| Height (cm) | 169.76 | 170.24 | 170.00 | 147.00 | 186.00 | 9.55 | 169.20 | 170.00 | 146.00 | 182.00 | 7.30 | 0.723 |
| Weight (kg) | 62.58 | 63.78 | 61.05 | 37.80 | 109.20 | 16.02 | 61.17 | 61.00 | 29.90 | 93.20 | 13.23 | 0.021 |
| BMI (kg/m2) / percentile |
21.53 | 21.81 75th |
21.15 | 15.40 | 33.70 | 4.23 | 21.20 50th |
21.20 | 14.00 | 30.00 | 3.60 | 0.043 |
EPA—elevated PA group; SPA—standard PA group;p ≤ 0.05.
Table 2.
BMI categories of participants by gender, %.
| BMI categories | Mean | Groups | |||||
| SPA | EPA | ||||||
| Boys | Girls | p | Boys | Girls | p | ||
| Underweight | 11.17 | 7.00 | 10.70 | 0.001 | 15.00 | 12.00 | 0.001 |
| Normal | 61.07 | 61.00 | 55.30 | 0.000 | 65.00 | 63.00 | 0.041 |
| Overweight | 13.63 | 15.00 | 12.50 | 0.024 | 12.00 | 15.00 | 0.034 |
| Obesity | 14.13 | 17.00 | 21.50 | 0.001 | 8.00 | 10.00 | 0.000 |
EPA—elevated PA group; SPA—standard PA group; p ≤ 0.05.
Table 3.
Eating frequency of food products, dishes and drinks in SPA and EPA groups, %.
|
No |
Foods |
Group |
Frequency of consumption [%] |
p* |
|||||
| Never | 1–3 times a month | Once a week | Several times a week | Once a day | Several times a day | ||||
| 1. | Milk | SPA | 3.00 | 5.00 | 23.00 | 38.00 | 19.00 | 12.00 |
0.415 |
| EPA | 2.00 | 6.00 | 15.00 | 36.00 | 29.00 | 13.00 | |||
| 2. | Yoghurts (natural and flavoured) | SPA | 13.00 | 18.00 | 17.00 | 41.00 | 7.00 | 5.00 |
0.221 |
| EPA | 7.00 | 14.00 | 20.00 | 46.00 | 6.00 | 8.00 | |||
| 3. | Cottage chesses | SPA | 17.00 | 27.00 | 29.00 | 21.00 | 5.00 | 2.00 |
0.000 |
| EPA | 15.00 | 25.00 | 20.00 | 30.00 | 8.00 | 4.00 | |||
| 4. | High fat cheses (including processed and blue cheses) | SPA | 4.00 | 11.00 | 23.00 | 43.00 | 16.00 | 4.00 |
0.078 |
| EPA | 4.00 | 13.00 | 21.00 | 41.00 | 18.00 | 5.00 | |||
| 5. | White bread and rolls | SPA | 1.00 | 2.00 | 5.00 | 13.00 | 29.00 | 52.00 |
0.431 |
| EPA | 2.00 | 4.00 | 5.00 | 16.00 | 26.00 | 48.00 | |||
| 6. | Whole grain bread and rolls | SPA | 13.00 | 20.00 | 28.00 | 21.00 | 11.00 | 8.00 |
0.001 |
| EPA | 15.00 | 23.00 | 15.00 | 26.00 | 13.00 | 10.00 | |||
| 7. | White rice, white pasta, fine-grained groats | SPA | 5.00 | 10.00 | 61.00 | 20.00 | 4.00 | 0.00 |
0.611 |
| EPA | 2.00 | 17.00 | 55.00 | 19.00 | 3.00 | 3.00 | |||
| 8. | Oatmeal, whole grain pasta, coarse-grained groats, buckwheat groats | SPA | 9.00 | 19.00 | 43.00 | 26.00 | 4.00 | 0.00 |
0.012 |
| EPA | 1.00 | 17.00 | 57.00 | 17.00 | 4.00 | 5.00 | |||
| 9. | Poultry dishes | SPA | 3.00 | 10.00 | 43.00 | 36.00 | 7.00 | 2.00 | 0.024 |
| EPA | 5.00 | 11.00 | 31.00 | 40.00 | 6.00 | 8.00 | |||
| 10. | Red meat dishes | SPA | 7.00 | 18.00 | 56.00 | 18.00 | 1.00 | 0.00 |
0.041 |
| EPA | 13.00 | 27.00 | 45.00 | 13.00 | 2.00 | 0.00 | |||
| 11. | Cold cuts, sausages, frankfurters | SPA | 17.00 | 6.00 | 17.00 | 21.00 | 19.00 | 20.00 |
0.047 |
| EPA | 11.00 | 6.00 | 16.00 | 33.00 | 19.00 | 16.00 | |||
| 12 | Canned meats | SPA | 60.00 | 35.00 | 6.00 | 0.00 | 0.00 | 0.00 | 0.069 |
| EPA | 78.00 | 21.00 | 2.00 | 0.00 | 0.00 | 0.00 | |||
| 13. | Fried meat or flour dishes | SPA | 0.00 | 4.00 | 21.00 | 47.00 | 26.00 | 4.00 | 0.067 |
| Fried meat or flour dishes | EPA | 0.00 | 2.00 | 24.00 | 54.00 | 20.00 | 1.00 | ||
| 14. | Eggs | SPA | 5.00 | 19.00 | 50.00 | 26.00 | 0.00 | 0.00 | 0.023 |
| EPA | 7.00 | 18.00 | 59.00 | 10.00 | 6.00 | 0.00 | |||
| 15. | Fish | SPA | 20.00 | 30.00 | 49.00 | 1.00 | 0.00 | 0.00 | 0.021 |
| EPA | 8.00 | 35.00 | 56.00 | 1.00 | 0.00 | 0.00 | |||
| 16. | Legumes | SPA | 33.00 | 44.00 | 15.00 | 9.00 | 0.00 | 0.00 | 0.067 |
| EPA | 29.00 | 39.00 | 19.00 | 11.00 | 3.00 | 0.00 | |||
| 17. | Fruit | SPA | 3.00 | 3.00 | 8.00 | 29.00 | 26.00 | 33.00 | 0.003 |
| EPA | 0.00 | 1.00 | 6.00 | 25.00 | 28.00 | 41.00 | |||
| 18. | Vegetables | SPA | 3.00 | 4.00 | 14.00 | 24.00 | 30.00 | 26.00 | 0.027 |
| EPA | 2.00 | 1.00 | 17.00 | 10.00 | 25.00 | 36.00 | |||
| 19. | Butter as an addition to bread or dishes, for frying, baking, etc. | SPA | 3.00 | 4.00 | 14.00 | 21.00 | 40.00 | 19.00 | 0.044 |
| EPA | 6.00 | 10.00 | 14.00 | 18.00 | 36.00 | 18.00 | |||
| 20. | Lard as an addition to bread or dishes, for frying, baking, etc. | SPA | 89.00 | 12.00 | 0.00 | 0.00 | 0.00 | 0.00 | 0.067 |
| EPA | 95.00 | 5.00 | 0.00 | 0.00 | 0.00 | 0.00 | |||
| 21. | Fast food, different types | SPA | 2.00 | 33.00 | 53.00 | 13.00 | 0.00 | 0.00 | 0.041 |
| EPA | 6.00 | 45.00 | 47.00 | 3.00 | 0.00 | 0.00 | |||
| 22. | Sweets, candies, chocolate, bars | SPA | 2.00 | 8.00 | 16.00 | 22.00 | 36.00 | 18.00 | 0.001 |
| EPA | 2.00 | 13.00 | 21.00 | 36.00 | 17.00 | 12.00 | |||
| 23. | Juices | SPA | 10.00 | 19.00 | 45.00 | 21.00 | 3.00 | 4.00 | 0.065 |
| EPA | 8.00 | 18.00 | 47.00 | 16.00 | 7.00 | 5.00 | |||
| 24. | Sweetened carbonated or non-carbonated drinks | SPA | 14.00 | 22.00 | 32.00 | 19.00 | 10.00 | 5.00 | 0.003 |
| EPA | 22.00 | 41.00 | 24.00 | 9.00 | 5.00 | 0.00 | |||
| 25. | Energy drinks | SPA | 65.00 | 24.00 | 7.00 | 5.00 | 0.00 | 0.00 | 0.062 |
| EPA | 73.00 | 19.00 | 6.00 | 3.00 | 0.00 | 0.00 | |||
EPA—extended PA group; SPA—standard PA group; *chi² test; p ≤ 0.05.
Table 4.
Eating frequency of food products, dishes and drinks by gender, %.
|
No |
Foods |
Group |
Frequency of consumption [%] |
p* |
|||||
| Never | 1–3 times a month | Once a week | Several times a week | Once a day | Several times a day | ||||
| 1. | Milk | Girls | 4.00 | 7.00 | 19.00 | 30.00 | 29.00 | 12.00 |
0.415 |
| Boys | 1.00 | 5.00 | 19.00 | 43.00 | 19.00 | 13.00 | |||
| 2. | Yoghurts (natural and flavoured) | Girls | 10.00 | 17.00 | 21.00 | 41.00 | 6.00 | 6.00 |
0.061 |
| Boys | 10.00 | 15.00 | 16.00 | 46.00 | 7.00 | 7.00 | |||
| 3. | Cottage chesses | Girls | 18.00 | 23.00 | 27.00 | 22.00 | 8.00 | 3.00 |
0.078 |
| Boys | 14.00 | 29.00 | 22.00 | 29.00 | 5.00 | 3.00 | |||
| 4. | High fat chesses (including processed and blue chesses) | Girls | 4.00 | 11.00 | 24.00 | 40.00 | 17.00 | 5.00 |
0.072 |
| Boys | 4.00 | 13.00 | 19.00 | 44.00 | 17.00 | 4.00 | |||
| 5. | White bread and rolls | Girls | 1.00 | 4.00 | 4.00 | 20.00 | 31.00 | 42.00 |
0.010 |
| Boys | 2.00 | 3.00 | 6.00 | 9.00 | 24.00 | 58.00 | |||
| 6. | Whole grain bread and rolls | Girls | 16.00 | 21.00 | 19.00 | 22.00 | 13.00 | 11.00 |
0.023 |
| Boys | 12.00 | 22.00 | 23.00 | 26.00 | 11.00 | 7.00 | |||
| 7. | White rice, white pasta, fine-grained groats | Girls | 6.00 | 15.00 | 56.00 | 18.00 | 6.00 | 1.00 |
0.920 |
| Boys | 3.00 | 12.00 | 58.00 | 22.00 | 4.00 | 2.00 | |||
| 8. | Oatmeal, whole grain pasta, coarse-grained groats, buckwheat groats | Girls | 5.00 | 20.00 | 53.00 | 17.00 | 4.00 | 1.00 |
0.028 |
| Boys | 5.00 | 15.00 | 46.00 | 25.00 | 5.00 | 4.00 | |||
| 9. | Poultry dishes | Girls | 6.00 | 11.00 | 43.00 | 30.00 | 8.00 | 3.00 |
0.035 |
| Boys | 2.00 | 10.00 | 39.00 | 37.00 | 5.00 | 7.00 | |||
| 10. | Red meat dishes | Girls | 9.00 | 26.00 | 54.00 | 12.00 | 0.00 | 0.00 |
0.020 |
| Boys | 8.00 | 17.00 | 51.00 | 20.00 | 4.00 | 0.00 | |||
| 11. | Cold cuts, sausages, frankfurters | Girls | 19.00 | 9.00 | 21.00 | 27.00 | 11.00 | 13.00 |
0.001 |
| Boys | 10.00 | 4.00 | 11.00 | 26.00 | 27.00 | 23.00 | |||
| 12 | Canned meats | Girls | 70.00 | 29.00 | 2.00 | 0.00 | 0.00 | 0.00 |
0.201 |
| Boys | 68.00 | 27.00 | 5.00 | 0.00 | 0.00 | 0.00 | |||
| 13. | Fried meat or flour dishes | Girls | 0.00 | 6.00 | 24.00 | 48.00 | 21.00 | 3.00 |
0.580 |
| Boys | 0.00 | 0.00 | 21.00 | 52.00 | 25.00 | 2.00 | |||
| 14. | Eggs | Girls | 6.00 | 24.00 | 53.00 | 16.00 | 1.00 | 0.00 |
0.068 |
| Boys | 7.00 | 13.00 | 56.00 | 19.00 | 5.00 | 0.00 | |||
| 15. | Fish | Girls | 20.00 | 35.00 | 42.00 | 2.00 | 0.00 | 0.00 |
0.047 |
| Boys | 13.00 | 35.00 | 52.00 | 0.00 | 0.00 | 0.00 | |||
| 16. | Legumes | Girls | 31.00 | 40.00 | 18.00 | 11.00 | 1.00 | 0.00 |
0.091 |
| Boys | 32.00 | 43.00 | 16.00 | 9.00 | 2.00 | 0.00 | |||
| 17. | Fruit | Girls | 0.00 | 0.00 | 8.00 | 24.00 | 23.00 | 46.00 |
0.010 |
| Boys | 3.00 | 4.00 | 6.00 | 30.00 | 30.00 | 28.00 | |||
| 18. | Vegetables | Girls | 2.00 | 0.00 | 16.00 | 20.00 | 25.00 | 37.00 |
0.023 |
| Boys | 3.00 | 5.00 | 15.00 | 24.00 | 30.00 | 25.00 | |||
| 19. | Butter as an addition to bread, dishes, for frying, baking, etc. | Girls | 5.00 | 10.00 | 10.00 | 22.00 | 35.00 | 18.00 |
0.028 |
| Boys | 4.00 | 4.00 | 17.00 | 17.00 | 41.00 | 19.00 | |||
| 20. | Lard as an addition to bread, dishes, for frying, baking, etc. | Girls | 90.00 | 10.00 | 0.00 | 0.00 | 0.00 | 0.00 |
0.810 |
| Boys | 94.00 | 6.00 | 0.00 | 0.00 | 0.00 | 0.00 | |||
| 21. | Fast food, different types | Girls | 6.00 | 41.00 | 46.00 | 9.00 | 0.00 | 0.00 |
0.043 |
| Boys | 2.00 | 37.00 | 55.00 | 7.00 | 0.00 | 0.00 | |||
| 22. | Sweets, candies, chocolate, bars | Girls | 2.00 | 9.00 | 17.00 | 30.00 | 27.00 | 17.00 |
0.240 |
| Boys | 2.00 | 11.00 | 21.00 | 28.00 | 27.00 | 12.00 | |||
| 23. | Juices | Girls | 11.00 | 19.00 | 43.00 | 17.00 | 6.00 | 6.00 |
0.610 |
| Boys | 7.00 | 18.00 | 49.00 | 21.00 | 3.00 | 3.00 | |||
| 24. | Sweetened carbonated or non-carbonated drinks | Girls | 23.00 | 33.00 | 29.00 | 10.00 | 5.00 | 2.00 | 0.020 |
| sweetened carbonated or non-carbonated drinks | Boys | 14.00 | 30.00 | 26.00 | 18.00 | 9.00 | 4.00 | ||
| 25. | Energy drinks | Girls | 76.00 | 19.00 | 4.00 | 2.00 | 0.00 | 0.00 | 0.038 |
| Boys | 62.00 | 24.00 | 10.00 | 5.00 | 0.00 | 0.00 | |||
EPA—extended PA group; SPA—standard PA group; *chi² test, p ≤ 0.05.
Disclaimer/Publisher’s Note: The statements, opinions and data contained in all publications are solely those of the individual author(s) and contributor(s) and not of MDPI and/or the editor(s). MDPI and/or the editor(s) disclaim responsibility for any injury to people or property resulting from any ideas, methods, instructions or products referred to in the content. |
© 2024 by the authors. Licensee MDPI, Basel, Switzerland. This article is an open access article distributed under the terms and conditions of the Creative Commons Attribution (CC BY) license (http://creativecommons.org/licenses/by/4.0/).
Copyright: This open access article is published under a Creative Commons CC BY 4.0 license, which permit the free download, distribution, and reuse, provided that the author and preprint are cited in any reuse.


