Submitted:
24 August 2024
Posted:
26 August 2024
You are already at the latest version
Abstract
1) Background: Overweight children usually have lower levels of physical activity (PA) than their normal-weight peers. Low PA predisposes to increase fat mass in the body. The aim of this study was to evaluate the effectiveness of school-based PA intervention on anthropometric indicators and body composition of overweight and obese children during a two-year observation period, from the age of 10 to 12. (2) Materials and methods: The research included 148 children with overweight or obesity who were born in 2007. There were two groups of children of standard and elevated PA at school (SPA and EPA, 4 and 10 hours of physical education lessons a week, respectively). An anthropometric and body composition measurements were done. Body mass index (BMI), fat mass (FM), fat-free mass (FFM), skeletal muscle mass (SMM) and total body water (TBW) were determined. Totally, 5 measurements were done at intervals of 5–6 months. (3) Results: In EPA, the percentage of obese children decreased from 46% to 35.25%, and in SPA increased from 42.75% to 46%. In EPA, FM decreased from 28.65% to 26.41%, and in SPA increased from 30.31% to 31.75%. The highest increase in FFM was in EPA boys, while SPA boys recorded the highest decrease. In SPA, SMM increased by 0.43% from 38.85% to 39.28%, and in EPA by 2.51% from 40.27% to 42.78%. TBW In EPA slightly increased from 53.26% to 53.59%, and in SPA decreased from 50.70% to 49.93%. (4) Conclusions: The elevated PA at school has a positive effect on the BMI and body composition of children who are overweight or obese. Increasing the mandatory number of physical education lessons in school curricula is an efficient strategy for reducing obesity in school-aged children.
Keywords:
children
; obesity
; BMI
; body composition
; adipose tissue
; physical activity
1. Introduction
Childhood and adolescent obesity is one of the most serious public health challenges of the 21st century. The prevalence of obesity is rapidly increasing worldwide and affects societies of all countries, both developed and developing [1].
The World Health Organization (WHO) defines obesity as a chronic, recurrent disease associated with excessive body fat accumulation, which causes many health consequences [2]. According to the World Obesity Federation, in 2035 every fourth person in the world will struggle with obesity [3]. The steady increase in excess body weight among children and adolescents is particularly worrying [4]. It is estimated that in Europe every fifth child is overweight or obese, including in Poland [5]. In Poland, the situation is particularly worrying, with research showing that Polish children are gaining weight at the fastest rate in Europe [6,7]. Currently, every third eight-year-old is overweight [8,9]. It is estimated that at least 80% of obese school-age children will grow up to be obese adults [10].
One of the dominant factors in the etiology of many metabolic diseases is the excess of adipose tissue in the body [1,2,3]. Adipose tissue performs immunological, metabolic and endocrine functions associated with the secretion of adipokines, enzymes, growth factors and cytokines [11]. An increase in the amount of adipose tissue causes hormonal imbalance, leading to an increase in the release of leptin and pro-inflammatory cytokines into the circulatory system, and a decrease in the release of anti-inflammatory sdipokentin [4,5]. In connection with the above, obesity is associated with the occurrence of a state of chronic inflammation (low grade inflammation). In the state of inflammation of adipose tissue, the activity of lipoprotein lipase (LPL) also increases, which leads to an increase in the concentration of free fatty acids in blood, and dyslipidemia [3,10,11]. The inflammatory process associated with the increase in the metabolic activity of adipose cells also contributes to the development of insulin resistance [11]. The above is one of the main pathomechanisms of the development of metabolic syndrome. In addition, excess adipose tissue is associated with the activation of prothrombotic and pro-inflammatory processes, and therefore with atherogenic factors [11,12,13]. There is a correlation between excessive accumulation of adipose tissue and chronic non-communicable diseases such as diabetes, hypertension, and dyslipidemia, and a steady increase in their incidence [1,2,3,4]. Therefore, actions to counteract childhood obesity should be a major public health priority. Excess adipose tissue despite a normal BMI has been termed the normal weight obesity (NWO) syndrome [11] and studies conducted in adults have shown that obese individuals with a normal body weight are insulin resistant, suffer from hyperinsulinemia and are prone to type 2 diabetes and premature coronary artery disease.[11].
Body mass index (BMI) is commonly used to categorize body weight. In children, the interpretation of BMI is based on percentile charts [12,13]. However, BMI does not provide information on body fat mass (FM) [12,13]. There are several methods for assessing FM, densitometric techniques, primarily dual-energy X-ray absorptiometry (DXA), are considered the “gold standard” [14]. DXA is considered as a “reference” for body composition assessment because of their safety, non-invasiveness, scanning speed, and precision. However, its accuracy varies by manufacturers and softwares. This method is stationary and not suitable for field research outside the laboratory. Therefore, one of the most commonly used methods of estimating body composition, including FM, is bioelectrical impedance analysis (BIA). BIA does not measure FM, but estimates it with algorithms that consider the parameters of resistance and reactance. BIA is characterized by high accuracy and repeatability [12,13]. This method enables a non-invasive and quick estimation of body composition, including fat tissue, lean body mass, skeletal muscle mass, water content and others [15]. The body composition of children and adolescents changes with age. During puberty, usually girls show a significant increase in fat mass, while boys show a significant increase in muscle mass [16,17,18].
In obesity, too high body fat content may lead to serious health threats such as hyperlipidemia, diabetes, hypertension, lower cardiorespiratory efficiency, reduced muscle strength and physical fitness [1,2,17]. The primary task of the program for the treatment and prevention of obesity in school-aged children should be not only the reduction of body weight but, above all, the normalization of fat tissue. Increasing PA is one of the most important strategies to achieve this goal [19]. School-age children spend a significant part of the day at school. Therefore, the level of PA during school time, especially the number of hours of physical education (PE) lessons, may have a significant impact on children’s BMI and body composition [20,21,22]. The purpose of this pilot study was to evaluate the effectiveness of school-based PA intervention on anthropometric indicators and body composition of overweight and obese children during a two-year observation period, from the age of 10 to 12.
2. Materials and Methods
2.1. Participants
The pilot study was conducted from 2017 to 2019. Children from 6 elementary schools in Siedlce, a medium city in Poland, took part. There were 148 overweight and obese children in two groups. The children taking part in the study came from similar backgrounds and were similar in terms of socio-economic status.
In the first group, children took part in PE lessons for the standard amount resulting from the school curriculum, which was 4 hours a week (SPA-standard PA group; n=88, girls 50; boys 38). In the second group, children took part in a significantly elevated amount of 10 hours of PE per week (EPA-elevated PA group; n=60, girls 40; boys 20). When the study began, the children started the 4th grade of elementary school (age 10), and the study ended when the children started the 6th grade (age 12). The sampling strategy was convenience sampling; therefore, the selected groups were not equal. The sample size was justified by power analysis in the G*power software (version 3.1.9.7; Universität Kiel, Germany) [23].
Before starting the study, the children were informed about the confidentiality of the results and the purpose of the study. The project received a positive opinion from each school‘s management, teachers and parents/guardians. All parents or guardians gave written consent for their children to participate in the study. The parents declared that they would prepare the child for measurements in accordance with specific guidelines. A positive effect of parents’ involvement in preparing children for measurements has been previously demonstrated [24]. The study was approved by the Research Ethics Committee at the University of Siedlce (No. 2/2016).
The inclusion criteria for the research were: (1) overweight (BMI ≥ 85 < 95 percentile) or obesity (BMI ≥ 95 percentile), determined based on BMI percentile charts [17,25,26]; (2) good health (no newly diagnosed chronic diseases, injuries, wounds and good well-being); (3) age 10 years at the beginning of the study; (4) consent of the management, teachers, parents to take part in the study. Failure to meet any of the criteria in any measurement session, excluded from the research. Exclusion criteria were: (1) age other than 10 years at baseline; (2) lack of consent of the child or parent to take part in the study or one of the measurement sessions; (3) absence from one of the measurement sessions; (4) no promotion to the next class; (5) chronic disease; (6) having an implanted pacemaker, which could have influenced the BIA measurement result; (7) BMI other than overweight or obesity; (8) change in BMI during the study period from excessive to normal body weight; (9) hospitalization or newly diagnosed disease; (10) lower extremity injury precluding PA or disability; (11) resignation from participation in research at any time; (12) no promotion to the next grade of school; (13) injuries, wounds and feeling unwell during the measurement session.
2.3. Procedure
The research included the assessment of anthropometric parameters and body composition of school-age children with excessive body weight (overweight and obesity). The measurements were performed by a qualified and trained team of dietitians. Measurements were made at 5-6 month intervals. The measurements were carried out on the following dates: initial session–September 2017, second - May 2018, third - September 2018, fourth - May 2019, final - September 2019. Measurements were performed with the same equipment in all schools. The obtained values were referred to percentile charts appropriate for age and gender [17,24,25]. Anthropometric measurements and body composition analysis were performed according to the methodology described in our previous works [21,27].
The pilot study was conducted in accordance with the 1975 Helsinki Declaration [28]. The tests were carried out from 10 a.m. to 11 a.m. in the gym, in the presence of a physical education teacher with the teacher‘s participation, and following the guidelines necessary for accurate measurement of weight, height and body composition analysis. Parents were asked to refrain children from eating heavy and large meals after 9:00 p.m. in the evening before the measurement, and on the day of measurement, they were advised to eat a light breakfast. The research team recommended that the last organized physical activity, apart from essential housework, should not be performed at least 12 hours before the measurement. Just before the measurement, children were asked not to eat or drink until the measurement was completed [29,30].
2.4. BMI
Body weight (kg), height (cm) and BMI were determined. BMI was calculated as body weight divided by height (kg/m2). BMI percentile charts were used to interpret the results [25,26]. Measurements were performed according to standard procedures described by the International Society for the Advancement Kinanthropometry (ISAK) [31]. Height was measured in an upright position using a SECA 214 stadiometer with an accuracy of 1 cm. Weight was measured with a Tanita SC-240MA device (Tanita Cooperation, Tokyo, Japan) with an accuracy of 0.1 kg. [29,30,32]. The procedures for measuring body weight and height have been described in more detail in previous works [21,27].
2.5. Body Composition Analysis
BIA measurements were performed using the Tanita SC-240 MA (body composition analyzer. The analysis allowed for the estimation of fat mass (FM), free-fat mass (FFM); skeletal muscle mass (SMM); total body water (TBW). The collected results were indicative only because the Tanita SC-240 MA analyser did not provide the parameters of resistance, reactance, impedance, and phase angle.
The tests were always carried out between 10:00 and 11:00 a.m. while standing, following the measurement guidelines [29,30,32]. The detailed procedure related to preparing children for body composition analysis was described in previous work [27]. Reference curves for Caucasian children and adolescents were used to interpret the results [16,17]. FM% values were referred to the recommendations of McCarthy et al. (2013) [17]. The 85th percentile indicated children with excess body fat, and the 95th percentile indicated obese children [17].
2.6. Statistical Analysis
The student‘s T-test, Shapiro-Wilk test, Mann-Whitney U test, and one-way ANOVA were used to analyze the results for statistical analysis. The normality of distribution was checked with the Shapiro-Wilk test, and the assumption of homogeneity of variance was verified with the Levene test for p > 0.05. Parameters not having a normal distribution were tested using the Mann–Whitney U test. The effect size (ES) for the average for children‘s FM was calculated based on Co-hen’s d. The threshold values for ES statistics were as follows: >0.2 low, >0.5 medium, >0.8 high, >1.3 very high [33].
3. Results
3.1. Characteristics of the Group
At the beginning of the study, the children were on average 10.27 years old, and at the end they were 12.26 years old. A total of 148 children were included in this pilot study. However, due to exclusions during subsequent measurement sessions, the final analysis included the results obtained from 65 children who took part in all measurement sessions (EPA 30, SPA 35; girls 63%; boys 37%). The main reason for exclusion was absence at one of the 5 measurement sessions or a lack of willingness to participate in the measurements.
The most common reason for exclusion from the study was absence from one of the measurement sessions (SPA 25%, EPA 28%) and BMI variability during the measurements (SPA 15%; EPA 22%). 24% of boys and 20% of girls in EPA had a BMI variability from overweight to normal body weight, in SPA: 18% and 12%, respectively. Over 44% of children with obesity (SPA 42.75%; EPA 46%) and 55.62% with overweight (SPA 57.25%; EPA 54%) were included. Table 1 presents the trend of body mass category variability between the initial and final measurement.
Table 1 shows the trend of variation in body weight categories between the initial and final measurements. Significant changes in BMI categories were noted between the initial and final measurements (Table 1). SPA children were significantly more likely to change their BMI category from overweight to obese compared to EPA. About 48% of EPA children and 40% of SPA children did not change the BMI category, i.e., stayed obese or overweight throughout the study period. Throughout the study period, 25.3% of SPA children and 24.75% of EPA children were obese (p=0.034). EPA children significantly more likely than SPA changed BMI category from obesity to overweight (respectively: 21% and 11.5%; p=0.001). During the study period, 3.33% of children in the SPA group (1 girl) and 17.2% in the SPA group (6 children: 2 girls and 4 boys) changed their BMI category from overweight to normal body mass (p=0.001). No one changed their BMI category from obesity to normal body mass.
After 2 years of observation, changes were noted in the structure of both groups. In the EPA group, the percentage of obese children decreased from 46% to 35.25%, and that of overweight children increased from 54% to 59.75%. This was due to a change in the BMI category of some children from obesity to overweight. In SPA, the percentage of obese children increased from 42.75% to 46%, and that of overweight children decreased from 57.25% to 54%. It was caused by a change in the BMI category of some children from overweight to obesity.
3.2. Anthropometric Indicators
The height, body mass and BMI of children in both groups at the beginning and end of the study are presented in Table 2. In the course of the study, the children‘s body height increased on average by nearly 14 cm (EPA 13.50 cm; SPA 14.17 cm; p=0.000). The body height of girls increased by 13.98 cm (SPA 14.17 cm; EPA 13.62 cm; p=0.021), and that of boys by 13.89 cm (SPA 14.16 cm; EPA 13.34 cm; p=0.014). The weight gain of the entire group was on average 13.83 kg (SPA 14.62 kg; EPA 13.05 kg; p=0.001), including girls 13.62 kg (SPA 14.04 kg; EPA 13.21 kg; p=0.002) and boys 14.04 kg (SPA 15.20 kg; EPA 12.88 kg; p=0.041). Girls had a lower body weight compared to boys (54.91 kg vs 60.73 kg, respectively; p=0.000).
Overall, SPA girls had a higher BMI than EPA girls (Table 2). The average BMI increase in SPA girls over the entire study period was 1.80 kg/m2 and in EPA - 1.25 kg/m2 (p=0.001). SPA boys started the study with a higher BMI than EPA (SPA 25.92 kg/m2; EPA 22.65 kg/m2; p=0.000). The average BMI increase in SPA boys was 1.31 kg/m2 and in EPA boys was 1.56 kg/m2 (p=0.004). Girls had a lower BMI compared to boys (23.17 vs. 25.01 kg/m2, respectively; p=0.003).
SPA children were characterized by an average higher BMI percentile at the beginning and at the end (p=0.014). SPA boys’ BMI indicated 97 c (p=0.024), among girls an increase was noted from 90 c to 97 c (p=0.004). In EPA boys a decrease in BMI was observed from 90 c to 85 c (p=0.001), in SC girls it was at the level of 90 c (p=0.030).
3.3. Fat Tissue
Throughout the entire study period, EPA children had, on average, lower body fat content than SPA ones. In EPA, there was a average decrease in FM from 28.65% to 26.41% (p=0.014), and in SPA, an increase from 30.31% to 31.75% (p=0.025) (Figure 1). FM increased in SPA by on average of 1.44%, and in EPA decreased by 2.24% (p=0.000).
In SPA girls, FM increaded by 5.3 kg; and in EPA – by 3.22 kg (p=0.001). In SPA girls, FM increased from 31.62% to 32.65% (p=0.025), and in EPA girls, it decreased from 32.02% to 30.02% (p=0.000) (Table 3). The highest average increase in adipose tissue was recorded in SPA boys, and the lowest in EPA boys (Table 4 ). In EPA boys, FM decreased by 3.4%, and in SPA increased by nearly 2%. Girls had higher FM than boys (31.33% vs. 27.23%, respectively; p=0.000). The highest increase in FM occurred in SPA boys (2%) and the highest decrease in EPA boys (3.4%). In EPA, a decrease in body fat content was observed from 91 c to 85 c in boys and from 91 c to 85 c in girls (p=0.000), while in SPA an increase was observed from 91 c to 95 c in girls. Detailed FM values for particular measurement sessions are presented in Table 5.
The assessment of body fat content (FM) in children was interpreted based on percentile charts, where the excess FM was ≥ 85 percentile [17]. During the entire study period, overweight related to FM occurred in almost 68% of girls, including 60% of SPA and 75% of EPA (p=0.001) and about 69% of boys, 53% and 84%, respectively (p=0.000). FM obesity was observed among 43.5% of SPA children, including 47% of boys and 40% of girls (p=0.001) and 20.5% of EPA, 16% of boys and 25% of girls, respectively (p=0.000). In EPA, a decrease in the percentage of children with obesity was noted from 33.5% to 15%, while in SPA from 58.8% to 44.50% (p=0.000). Similarly to BMI, during the study period, 1 girl in the SPA group and 2 girls and 4 boys in the SPA group decreased their FM category from excess FM to normal FM (p=0.001). No one changed their FM category from obesity to normal FM.
Table 6 compares children‘s body composition with excess body fat (FM ≥ 85 percentile) between the initial and final measurements. Significant changes are visible between SPA and EPA children. In girls, SPA FM increased by 5.4 kg; and in EPA – by 4 kg (p=0.001). In SPA girls mean FM increased from 31.95% to 33.05% (p=0.025), and in EPA decreased from 32.23% to 31.20% (p=0.02000). In EPA boys mean FM decreased from 27.22% to 25.13%, and in SPA it increased from 30.61% to 32.25%. On average, girls exhibited a higher FM increase compared to boys (32.10% vs. 28.80%; p=0.010). The greatest mean increase in frequency of FM was observed in SPA boys by almost 2% The largest mean FM decrease occurred in EPA boys by over 2%.
3.4. Fat-Free Mass
Significant changes in FFM were noted between the initial and final measurements (Table 7, Figure 2). In EPA, an average FFM increased from 70.89% to 73.59% (p=0.000), and in SPA decreased from 69.70% to 68.23% (p=0.024). On average, boys had higher FFM compared to girls (72.70% vs 68.23%, respectively; p=0.000). The highest FFM was observed in EPA boys (75.60%), and the lowest in SPA girls (67.87%). Detailed FFM values in particular measurement sessions are presented in Table 7.
In EPA girls, FFM increased from 67.98% to 69.98% (p=0.047), and in SPA girls, it decreased from 68.38% to 67.35% (p=0.014). In EPA boys, FFM increased from 73.80% to 77.20% (p=0.000), and in SPA boys, it decreased from 71% to 69.11% (p=0.001). The highest increase in FFM was observed in EPA boys, and the highest decrease in FFM in SPA boys. On average, boys had higher FFM than girls (72.69% vs. 68.23%, respectively; p=0.000).
3.5. Skeletal Muscle Mass
Significant changes were observed in the SMM (Table 3 and Table 4, Figure 3). In SPA, it increased by 0.43% from 38.85% to 39.28% (p=0.147), and in EPA, it increased by 2.51% from 40.27% to 42.78% (p=0.001). In EPA girls, SMM increased from 38.54% to 40.12% (p=0.001), and in SPA girls, it decreased from 38.66% to 38.10% (p=0.024). SMM was significantly higher in EPA boys and increased by 3.44% from 42.01% to 45.45% (p=0.000), and in SPA boys by 1.41% from 39.05% to 40.46% (p=0.001). SMM increased by 12.50 kg in EPA and 6.95 kg in SPA boys (p=0.007). The highest increase in SMM was recorded in EPA boys, and the highest decrease was in SPA girls. On average, boys had a higher SMM compared to girls (41.74% vs. 38.89%, respectively; p=0.001).
3.6. Total Body Water
The total body water content changed significantly between the initial and final measurements (Table 3 and Table 4, Figure 4) In EPA, there was an average slight increase in TBW from 53.26% to 53.59% (p=0.042), and in SPA, it decreased from 50.70% to 49.93% (p=0.003). On average, boys had a slightly higher TBW than girls (53.74% vs. 50.03%, respectively; p=0.024).
In EPA girls, TBW went up from 51.95% to 52.20% (p=0.004) and in SPA girls, it went down from 50.15% to 49.62% (p=0.007) In EPA boys, TBW increased from 54.56% to 55.70% (p=0.001), and in SPA boys, it decreased from 51.25% to 50.25% (p=0.004). The highest increase in TBW occurred in EPA boys, and the highest decrease occurred in SPA boys. Overall, boys had a higher TBW content compared to girls (53.04% vs. 50.75%, respectively; p=0.002). The water content expressed in mass units increased by nearly 6.55 kg in SPA and 7.21 kg in EPA (p=0.000).
4. Discussion
Overweight and obesity among school-aged children become significant public health concerns. The health effects of obesity in children may be much more serious than in people who gained excess body weight in adulthood [6,7]. Unfortunately, in many countries, there is a lack of epidemiological knowledge and control of the phenomenon of excess body weight that would allow monitoring of the trend and reacting quickly. Increasing physical activity and limiting sedentary habits, as well as eating well, are essential for battling excess weight and corpulence in children and adolescent individuals. Obesity is a significant factor influencing anthropometric measurements and body composition. This study showed a favorable correlation between the duration of physical activity at school for overweight children and their body composition.
An adequate level of PA is an important element in maintaining the good physical condition and health of school-aged children [34,35]. All strategies that increase PA are necessary to reduce the risk of overweight and obesity in children. Unlike other works, we showed that BMI was higher in overweight school-aged boys than in girls [35,36]. Changes in BMI categories were associated with differences in body composition observed over the course of the study. This observation is consistent with the findings of other authors regarding the correlation between body weight and body composition and the relationship between BMI, adipose tissue and free-fat mass [35,36,37,38,39,40]. Among others, Tsolakis et al. (2022) showed in obese children that lower BMI was positively correlated with higher physical fitness, FFM and SMM [32].
Body fat content changes with age and is also dependent on gender. Children who are physically active typically have lower FM levels than children who are healthy and do not exercise [35,36,37]. According to recommendations, the body fat content should be below 30% for girls and below 22.5% for boys [17]. Higher FM in school-aged girls compared to boys is physiological, resulting from girls’ puberty at this age. Similar to previous studies [36,39]. We showed that girls had, on average, higher FM values than boys. After 2 years of observation, there was a systematic decrease in the FM content in children of elevated PA from 28.65% to 26.41% and an increase in standard PA ones from 30.31% to 31.75%. Miguet et al. (2020) and Mendez-Hernández (2022) and Soares et al. (2023) showed that there is a similar connection [35,41,42]. It was shown that obese adolescents achieved a visible decrease in FM after PA intervention. In the study by Ubago-Guisado et al. (2017), a lower level of FM among girls practicing sports was recorded compared to the one in our study: 28% vs. 30.73%, respectively [43]. In the study by Wang et al. (2022), the mass of adipose tissue in obese teenagers practicing sports was 15.55 kg in boys and 17.35 kg in girls, and in our study it was 13.03 kg and 19.67 kg, respectively [39]. Also, Abbott and Davies [44] and Ball et al. [45] investigated the relationship between PA and obesity in children and showed significant correlations between PA level, BMI, and fat mass. In the study by Ara et al. (2004), children who did not engage in any PA had higher FM and regional fat mass (torso, arms, and legs) compared to children who exercised, which is consistent with the results obtained in our study [46]. Studies by Cvetkovi et al. (2017) or Larsen et al. (2018) found that obese children with a BMI higher than 24 kg/m2 had bigger differences in FM [47,48]. This may indicate that regular PA in children with a higher BMI is more effective in reducing FM because of a significant increase in energy expenditure, which directly leads to the reduction of body fat content. We found that in the standard PA children, there was an increase in FM by 5.55 kg, and in the elevated PA children, there was a decrease by nearly 2.5 kg. This is in agreement with other studies involving obese children, which demonstrated a reduction of 2–3 kg in fat mass following PA intervention [39,47,48]. Our study did not consider possible changes in children‘s diet and PA outside the study protocols, which, however, could have influenced the results.
FFM depends on age and gender. Research confirms that regular PA leads to an increase in FFM, including SMM [16]. Our study also found that elevated PA children had higher FFM compared to standard PA ones (72.10% vs. 68.83%), and elevated PA children recorded a higher increase in FFM during the study. The results were similar to the studies of Ubago-Guisado et al. (2017) and Ferreira et al. (2007), which indicated that elevated PA increased FFM [43,49]. McGuigan et al. (2007) showed that obese teenagers practicing sports indicated that training longer than 14 weeks allows for a significant increase in FFM compared to children who did not participate in additional PA classes [50]. Our study reported an increase in FFM of approximately 11 kg in elevated PA children and a decrease of 9 kg in standard PA ones. Furthermore, other studies show that introducing regular PA to overweight children for a period of 5 to 10 months resulted in an increase in FFM ranging from 2.7 to 3.8 kg [51,52]. Mattoo et al. (2020) evaluated changes in TBW by BIA in children with excessive weight. In the age group 8–12, the average TBW in girls was 25.3 kg, and in boys it was 26.5 kg [53]. In our study, average TBW was lower in girls (24.03 kg) and higher in boys (28.18 kg). From ages 10 to 12, TBW increased by nearly 6.55 kg in standard PA children and 7.21 kg in elevated PA ones. However, in percentage, although TBW increased slightly in the elevated PA group from 53.26% to 53.59%, in the standard PA group it decreased from 50.70% to 49.93%. This indicated that children with excessive weight were hypohydrated, which may increase their risk of dehydration, which is also supported by other authors [54].
It is estimated that less than 30% of children and adolescents meet the global PA recommendations of at least 60 minutes of moderate-to-vigorous PA per day. Schools are an ideal setting for PA interventions, given that children spend a significant amount of time at school under the supervision of teachers [55]. School-based PA interventions programs may be effective at preventing and treating obesity [56]. They can impact many children simultaneously, including hard-to-reach groups, since most children and adolescents go to school daily. These programs have the potential to play a pivotal role not only in preventing obesity but also in promoting growth, development, fitness, mental health, and cognitive performance in children [55,56]. From a public health perspective, an increase in organized physical activity in the school curricula should be considered as a health policy option for decision-makers to reduce the risk of obesity among school-aged children and thus improve public health in the future.
This work, however, is not without limitations. One of them is the small sample size. Furthermore, this study did not consider children‘s diet and PA outside of the study protocols, which, however, could have influenced the results. Although DXA is considered the standard method for measuring FM, this method requires stationary tests. Therefore, since our tests are field-based, we decided to use the less precise BIA method. We did not assess the obesity phenotype. The study excluded children with normal weight obesity (NWO) with normal body weight and excessive FM. The body composition results obtained in this study were indicative only because the instrument used did not provide the parameters of resistance, reactance, impedance and phase angle. The nutrition education and eating habits were not analysed. The work was limited to a sample of children from Siedlce, it is worth extending the study to other age groups and larger areas. We did not assess extracurricular PA and did not check attendance at PA classes. Future studies should include an analysis of eating behaviors and socio-economic status, but this was not included in this work. Measurements of waist circumference, waist-to-height ratio, and circumferences would be also important to assess the proper development of children. Expanding the scope of the study to other age groups and larger geographical areas would be very advisable.
5. Conclusions
The elevated PA at school has a positive effect on the BMI and body composition of children who are overweight or obese. A significantly greater number of children with elevated PA at school than standard PA ones changed their BMI category from initially obese to overweight as well as from overweight to normal body mass. Throughout the study, only 3.33% of children in the standard PA group (1 child) and 17.2% in the elevated PA group (6 children) changed their BMI and FM category from overweight to normal body mass. Mean BMI and FM were higher in standard PA children than in those with elevated PA. Throughout the entire study period, there was a systematic decrease in estimated FM and BMI in children with elevated PA at school and an increase in the standard PA ones. Moreover, children with excessive body mass, especially standard PA girls, were hypohydrated, which might increase their risk of dehydration. Increasing PA at school has a positive effect on the BMI and body composition of overweight and obese children. Increasing the mandatory number of physical education lessons in school curricula may be an efficient strategy for reducing obesity in school-aged children.
Author Contributions
Conceptualization, W.K.; methodology, W.K. and K.Ł.; validation, W.K. and K.Ł.; formal analysis, K.Ł.; investigation, W.K. and K.Ł.; resources, K.Ł.; data curation, K.Ł.; writing—original draft preparation, K.Ł.; writing—review and editing, W.K.; visualization, K.Ł; supervision, W.K.; project administration, K.Ł. All authors have read and agreed to the published version of the manuscript.”
Funding
This research received no external funding.
Institutional Review Board Statement
The study was conducted in accordance with the Declaration of Helsinki, and approved by the Ethics Committee at the University of Siedlce (No. 2/2016).
Informed Consent Statement
Informed consent was obtained from all children and their parents involved in the study.
Data Availability Statement
The data supporting reported results are available on request from corresponding author. ,
Acknowledgments
The authors would like to thank all children participating in the study as well as their parents and teachers for their time and commitment.
Conflicts of Interest
The authors declare no conflicts of interest.
References
- World Health Organization. Obesity and Overweight. Available online: https://www.who.int/news-room/fact-641sheets/detail/obesity-and-overweight (accessed on 4 May 2023).
- World Health Organization. Obesity and Overweight. Available online: https://www.who.int/news-room/fact-641 sheets/detail/ obesity-and-overweight (accessed on 4 July 2023).
- World Obesity Federation, World Obesity Atlas 2023. Available online: https://data.worldobesity.org/publications/?cat=19 (accessed on 4 June 2023).
- Jebeile, H.; Kelly, A.S.; O‘Malley, G.; Baur, L.A. Obesity in children and adolescents: epidemiology, causes, assessment, and management. Lancet Diabetes Endocrinol. 2022, 10, 351–365. [Google Scholar] [CrossRef] [PubMed]
- NCD Risk Factor Collaboration (NCD-RisC). Worldwide trends in body-mass index, underweight, overweight, and obesity from 1975 to 2016: a pooled analysis of 2416 population-based measurement studies in 128·9 million children, adolescents, and adults. Lancet. 2017, 390, 2627–2642. [Google Scholar] [CrossRef] [PubMed]
- Gomula, A.; Nowak-Szczepańska, N.; Danel, D.P.; Koziel, S. Overweight trends among Polish schoolchildren before and after the transition from communism to capitalism. Econ Hum Biol. 2015, 19, 246–257. [Google Scholar] [CrossRef]
- Oblacińska, A. Rozwój fizyczny i samoocena masy ciała. In: Mazur J, Małkowska-Szkutnik, A. Pupils’ health in 2018 against the new HBSC research model. Warsaw, Instytut Matki i Dziecka. 2018, 70-81.
- Jarosz, M.; Charzewska, J.; Wolnicka, W.; et al. Nutritional status of children and adolescents - preliminary results the programme KIK/34 “Preventing overweight and obesity” in Swiss-Polish Cooperation Programme. Polish J Human Nutr. 2016, 43, 231–238. [Google Scholar]
- Fijałkowska, A.; Oblacińska, A.; Stalmach, M.; Nadwaga i otyłość u polskich 8-latków w świetle uwarunkowań biologicznych, behawioralnych i społecznych. Raport z międzynarodowych badań WHO European Childhood Obesity Surveillance Initiative (COSI). Warszawa, 2017. Available online: http://www.imid. med.pl/. (accessed on 4 July 2023).
- August, G.P.; Caprio, S.; Fennoy, I.; et al. Prevention and treatment of pediatric obesity: An endocrine society clinical practice guideline based on expert opinion. J Clin Endocrinol Metab. 2008, 93, 4576–4599. [Google Scholar] [CrossRef]
- Oliveros, E.; Somers, V.K.; Sochor, O.; Goel, K.; Lopez-Jimenez, F. The concept of normal weight obesity. Prog Cardiovasc Dis. 2014, 56, 426–433. [Google Scholar] [CrossRef]
- Brener, A.; Waksman, Y.; Rosenfeld, T.; Levy, S.; Peleg, I.; Raviv, A.; Interator, H.; Lebenthal, Y. The heritability of body composition. BMC Pediatr. 2021, 21, 225. [Google Scholar] [CrossRef] [PubMed]
- Verney, J.; Metz, L.; Chaplais, E.; Cardenoux, C.; Pereira, B.; Thivel, D. Bioelectrical impedance is an accurate method to assess body composition in obese but not severely obese adolescents. Nutr Res. 2016, 36, 663–670. [Google Scholar] [CrossRef]
- Laskey, M.A. Dual-energy X-ray absorptiometry and body composition. Nutrition. 1996, 12, 45–51. [Google Scholar] [CrossRef] [PubMed]
- Seo, Y.G.; Kim, J.H.; Kim, Y.; Lim, H.; Ju, Y.S.; Kang, M.J.; Lee, K.; Lee, H.J.; Jang, H.B.; Park, S.I.; et al. Validation of body composition using bioelectrical impedance analysis in children according to the degree of obesity. Scand J Med Sci Sports. 2018, 28, 2207–2215. [Google Scholar] [CrossRef]
- McCarthy, H.D.; Samani–Radia, D.; Jebb, S.A.; Prentice, A.M. Skeletal muscle mass reference curves for children and adolescents. Pediatr Obes. 2014, 9, 249–259. [Google Scholar] [CrossRef] [PubMed]
- McCarthy, H.D.; Cole, T.J.; Fry, T.; Jebb, S.A.; Prentice, A.M. Body fat reference curves for children. Int J Obes. 2006, 30, 598–602. [Google Scholar] [CrossRef] [PubMed]
- Borga, M.; West, J.; Bell, J.D.; Harvey, N.C.; Romu, T.; Heymsfield, S.B. Advanced body composition assessment: from body mass index to body composition profiling. J Investig Med. 2018, 66, 1–9. [Google Scholar] [CrossRef] [PubMed]
- Dettlaff-Dunowska, M.; Brzeziński, M.; Zagierska, A.; Borkowska, A.; Zagierski, M.; Szlagatys-Sidorkiewicz, A. Changes in Body Composition and Physical Performance in Children with Excessive Body Weight Participating in an Integrated Weight-Loss Programme. Nutrients. 2022, 14, 3647. [Google Scholar] [CrossRef]
- Wojtyniak, B.; Goryński, P. (red.). Sytuacja zdrowotna ludności Polskiej i jej uwarunkowania. Narodowy Instytut Zdrowia Publicznego - Państwowy Zakład Higieny. Warsaw, 2020.
- Ługowska, K.; Kolanowski, W.; Trafialek, J. The Impact of Physical Activity at School on Children‘s Body Mass during 2 Years of Observation. Int J Environ Res Public Health. 2022, 19, 3287. [Google Scholar] [CrossRef]
- Nowaczyk, M.; Cieślik, K.; Waszak, M. Assessment of the Impact of Increased Physical Activity on Body Mass and Adipose Tissue Reduction in Overweight and Obese Children. Children 2023, 10, 764. [Google Scholar] [CrossRef]
- Faul, F.; Erdfelder, E.; Lang, A.G.; Buchner, A. G*Power 3: A flexible statistical power analysis program for the social, behavioral, and biomedical sciences. Behav Res Methods. 2007, 39, 175–191. [Google Scholar] [CrossRef]
- Lisinskiene, A.; Lochbaum, M. The Coach-Athlete-Parent Relationship: The Importance of the Sex, Sport Type, and Family Composition. Int J Environ Res Public Health 2022, 19, 4821. [Google Scholar] [CrossRef]
- Kułaga, Z.; Grajda, A.; Gurzkowska, B.; Góźdź, M.; Wojtyło, M.; Świąder, A.; Różdżyńska-Świątkowska, A.; Litwin, M. Polish 2012 growth references for preschool children. Eur J Pediatr. 2013, 172, 753–761. [Google Scholar] [CrossRef]
- Kułaga, Z.; Różdżyńska, A.; Palczewska, I. Percentile charts of height, body mass and body mass index in children and adolescents in Poland—results of the OLAF study. Stand Med Pediatr. 2010, 7, 690–700. [Google Scholar]
- Ługowska, K.; Kolanowski, W. The Impact of Physical Activity at School on Body Fat Content in School-Aged Children. Int J Environ Res Public Health. 2022, 19, 12514. [Google Scholar] [CrossRef]
- Declaration of Helsinki World Medical Association Declaration of Helsinki. Bull World Health Organ. 2013, 79.
- Farbo, D.J.; Rhea, D.J. A Pilot Study Examining Body Composition Classification Differences Between Body Mass Index and Bioelectrical Impedance Analysis in Children With High Levels of Physical Activity. Front Pediatr. 2021, 9, 724053. [Google Scholar] [CrossRef]
- Orsso, C.E.; Gonzalez, M.C.; Maisch, M.J.; Haqq, A.M.; Prado, C.M. Using bioelectrical impedance analysis in children and adolescents: Pressing issues. Eur J Clin Nutr. 2022, 76, 659–665. [Google Scholar] [CrossRef] [PubMed]
- Marfell-Jones, M.; Old, T.; Steward, A.; Carter, J.E.L. International Standards for Anthropometric Assessment. ISAK: Palmerston North, New Zeland, 2012.
- Tanita SC-240MAInstruction Manual Tanita User Manual SC 240, M.A. Available online: https://www.manualslib.com/manual/1065295/Tanita-Sc-240ma.html (accessed on 12 October 2020).
- Sullivan, G.M.; Feinn, R. Using Effect Size—Or Why the P Value Is Not Enough. J Grad Med. Educ. 2012, 4, 279–282. [Google Scholar] [CrossRef] [PubMed]
- Pezoa-Fuentes, P.; Cossio-Bolaños, M.; Urra-Albornoz, C.; Alvear-Vasquez, F.; Lazari, E.; Urzua-Alul, L. ’ et al. Fat-free mass and maturity status are determinants of physical fitness perform. J Pediatr. 2023, 99, 38–44. [Google Scholar] [CrossRef]
- Méndez-Hernández, L.D.; Ramírez-Moreno, E.; Barrera-Gálvez, R.; Cabrera-Morales, M.D.C.; Reynoso-Vázquez, J.; Flores-Chávez, O.R.; Morales-Castillejos, L.; Cruz-Cansino, N.D.S.; Jiménez-Sánchez, R.C.; Arias-Rico, J. Effects of Strength Training on Body Fat in Children and Adolescents with Overweight and Obesity: A Systematic Review with Meta-Analysis. Children 2022, 9, 995. [Google Scholar] [CrossRef]
- Gutin, B.; Yin, Z.; Humphries, M.C.; Hoffman, W.H.; Gower, B.; Barbeau, P. Relations of fatness and fitness to fasting insulin in black and white adolescents. J Pediatr. 2004, 145, 737–743. [Google Scholar] [CrossRef]
- Goossens, G.H. The Metabolic Phenotype in Obesity: Fat Mass, Body Fat Distribution, and Adipose Tissue Function. Obes Facts 2017, 10, 207–215. [Google Scholar] [CrossRef]
- Logan, K.; Lloyd, R.S.; Schafer-Kalkhoff, T.; Khoury, J.C.; Ehrlich, S.; Dolan, L.M.; Shah, A.S.; Myer, G.D. Youth sports participation and health status in early adulthood: A 12-year follow-up. Prev Med Rep. 2020, 19, 101107. [Google Scholar] [CrossRef]
- Wang, Q.; Guo, H.; Chen, S.; Ma, J.; Kim, H. The Association of Body Mass Index and Fat Mass with Health-Related Physical Fitness among Chinese Schoolchildren: A Study Using a Predictive Model. Int J Environ Res Public Health 2022, 20, 355. [Google Scholar] [CrossRef]
- Tsolakis, C.; Cherouveim, E.D.; Skouras, A.Z.; Antonakis-Karamintzas, D.; Czvekus, C.; Halvatsiotis, P.; Savvidou, O.; Koulouvaris, P. The Impact of Obesity on the Fitness Performance of School-Aged Children Living in Rural Areas-The West Attica Project. Int J Environ Res Public Health 2022, 19, 11476. [Google Scholar] [CrossRef]
- Miguet, M.; Fearnbach, N.S.; Metz, L.; Khammassi, M.; Julian, V.; Cardenoux, C.; Pereira, B.; Boirie, Y.; Duclos, M.; Thivel, D. Effect of HIIT versus MICT on body composition and energy intake in dietary restrained and unrestrained adolescents with obesity. Appl Physiol Nutr Metab. 2020, 45, 437–445. [Google Scholar] [CrossRef]
- Soares, R.; Brasil, I.; Monteiro, W.; Farinatti, P. Effects of physical activity on body mass and composition of school-age children and adolescents with overweight or obesity: Systematic review focusing on intervention characteristics. J Bodywork Movement Therap. 2023, 33, 154–163. [Google Scholar] [CrossRef]
- Ubago-Guisado, E.; Mata, E.; Sánchez-Sánchez, J.; Plaza-Carmona, M.; Martín-García, M.; Gallardo, L. Influence of different sports on fat mass and lean mass in growing girls. J Sport Health Sci. 2017, 6, 213–218. [Google Scholar] [CrossRef]
- Abbott, R.A.; Davies, P.S. Habitual physical activity and physical activity intensity: their relation to body composition in 5.0-10.5-y-old children. Eur J Clin Nutr. 2004, 58, 285–91. [Google Scholar] [CrossRef] [PubMed]
- Ball, E.J.; O‘Connor, J.; Abbott, R.; Steinbeck, K.S.; Davies, P.S.; Wishart, C.; Gaskin, K.J.; Baur, L.A. Total energy expenditure, body fatness, and physical activity in children aged 6-9 y. Am J Clin Nutr. 2001, 74, 524–8. [Google Scholar] [CrossRef]
- Ara, I.; Vicente-Rodríguez, G.; Jimenez-Ramirez, J.; Dorado, C.; Serrano-Sanchez, J.A.; Calbet, J.A. Regular participation in sports is associated with enhanced physical fitness and lower fat mass in prepubertal boys. Int J Obes Relat Metab Disord. 2004, 28, 1585–93. [Google Scholar] [CrossRef]
- Cvetković, N.; Stojanović, E.; Stojiljković, N.; Nikolić, D.; Scanlan, A.T.; Milanović, Z. Exercise training in overweight and obese children: Recreational football and high-intensity interval training provide similar benefits to physical fitness. Scand J Med Sci Sports. 2018, 28, 18–32. [Google Scholar] [CrossRef]
- Larsen, M.N.; Nielsen, C.M.; Ørntoft, C.; Randers, M.B.; Helge, E.W.; Madsen, M.; Manniche, V.; Hansen, L.; Hansen, P.R.; Bangsbo, J.; Krustrup, P. Fitness Effects of 10-Month Frequent Low-Volume Ball Game Training or Interval Running for 8-10-Year-Old School Children. Biomed Res Int. 2017, 2017, 2719752. [Google Scholar] [CrossRef]
- Ferreira, I.; Boreham, C.A.; Twisk, J.W.; Gallagher, A.M.; Young, I.S.; Murray, L.J.; Stehouwer, C.D. Clustering of metabolic syndrome risk factors and arterial stiffness in young adults: the Northern Ireland Young Hearts Project. J Hypertens. 2007, 25, 1009–1020. [Google Scholar] [CrossRef]
- McGuigan, M.R.; Tatasciore, M.; Newton, R.U.; Pettigrew, S. Eight weeks of resistance training can significantly alter body composition in children who are overweight or obese. J Strength Cond Res. 2009, 23, 80–85. [Google Scholar] [CrossRef]
- Zouch, M.; Jaffré, C.; Thomas, T.; Frère, D.; Courteix, D.; Vico, L.; Alexandre, C. Long-term soccer practice increases bone mineral content gain in prepubescent boys. Joint Bone Spine 2008, 75, 41–49. [Google Scholar] [CrossRef]
- Larsen, M.N.; Nielsen, C.M.; Helge, E.W.; Madsen, M.; Manniche, V.; Hansen, L.; Hansen, P.R.; Bangsbo, J.; Krustrup, P. Positive effects on bone mineralisation and muscular fitness after 10 months of intense school-based physical training for children aged 8-10 years: the FIT FIRST randomised controlled trial. Br J Sports Med. 2018, 52, 254–260. [Google Scholar] [CrossRef]
- Mattoo, T.K.; Lu, H.; Ayers, E.; Thoma, R. Total body water by BIA in children and young adults with normal and excessive weight. PLoS One 2020, 15, 0239212. [Google Scholar] [CrossRef]
- Maffeisa, C.; Tommasi, M.; Tomaselli, F.; Spinelli, J. Fluid intake and hydration status in obese vs normal weight children. Eur J Clin Nutr. 2016, 70, 560–565. [Google Scholar] [CrossRef]
- Neil-Sztramko, S.E.; Caldwell, H.; Dobbins, M. School-based physical activity programs for promoting physical activity and fitness in children and adolescents aged 6 to 18. Cochrane Database System Rev. 2021, 9, CD007651. [Google Scholar]
- Juric, P.; Jurak, G.; Morrison, S.A.; Starc, G.; Soric, M. Effectiveness of a population-scaled, school-based physical activity intervention for the prevention of childhood obesity. Obesity 2023, 31, 811–822. [Google Scholar] [CrossRef]
Figure 1.
Average body fat content (FM) at the beginning and end of the study, %. EPA – elevated PA group; SPA - standard PA group.
Figure 1.
Average body fat content (FM) at the beginning and end of the study, %. EPA – elevated PA group; SPA - standard PA group.
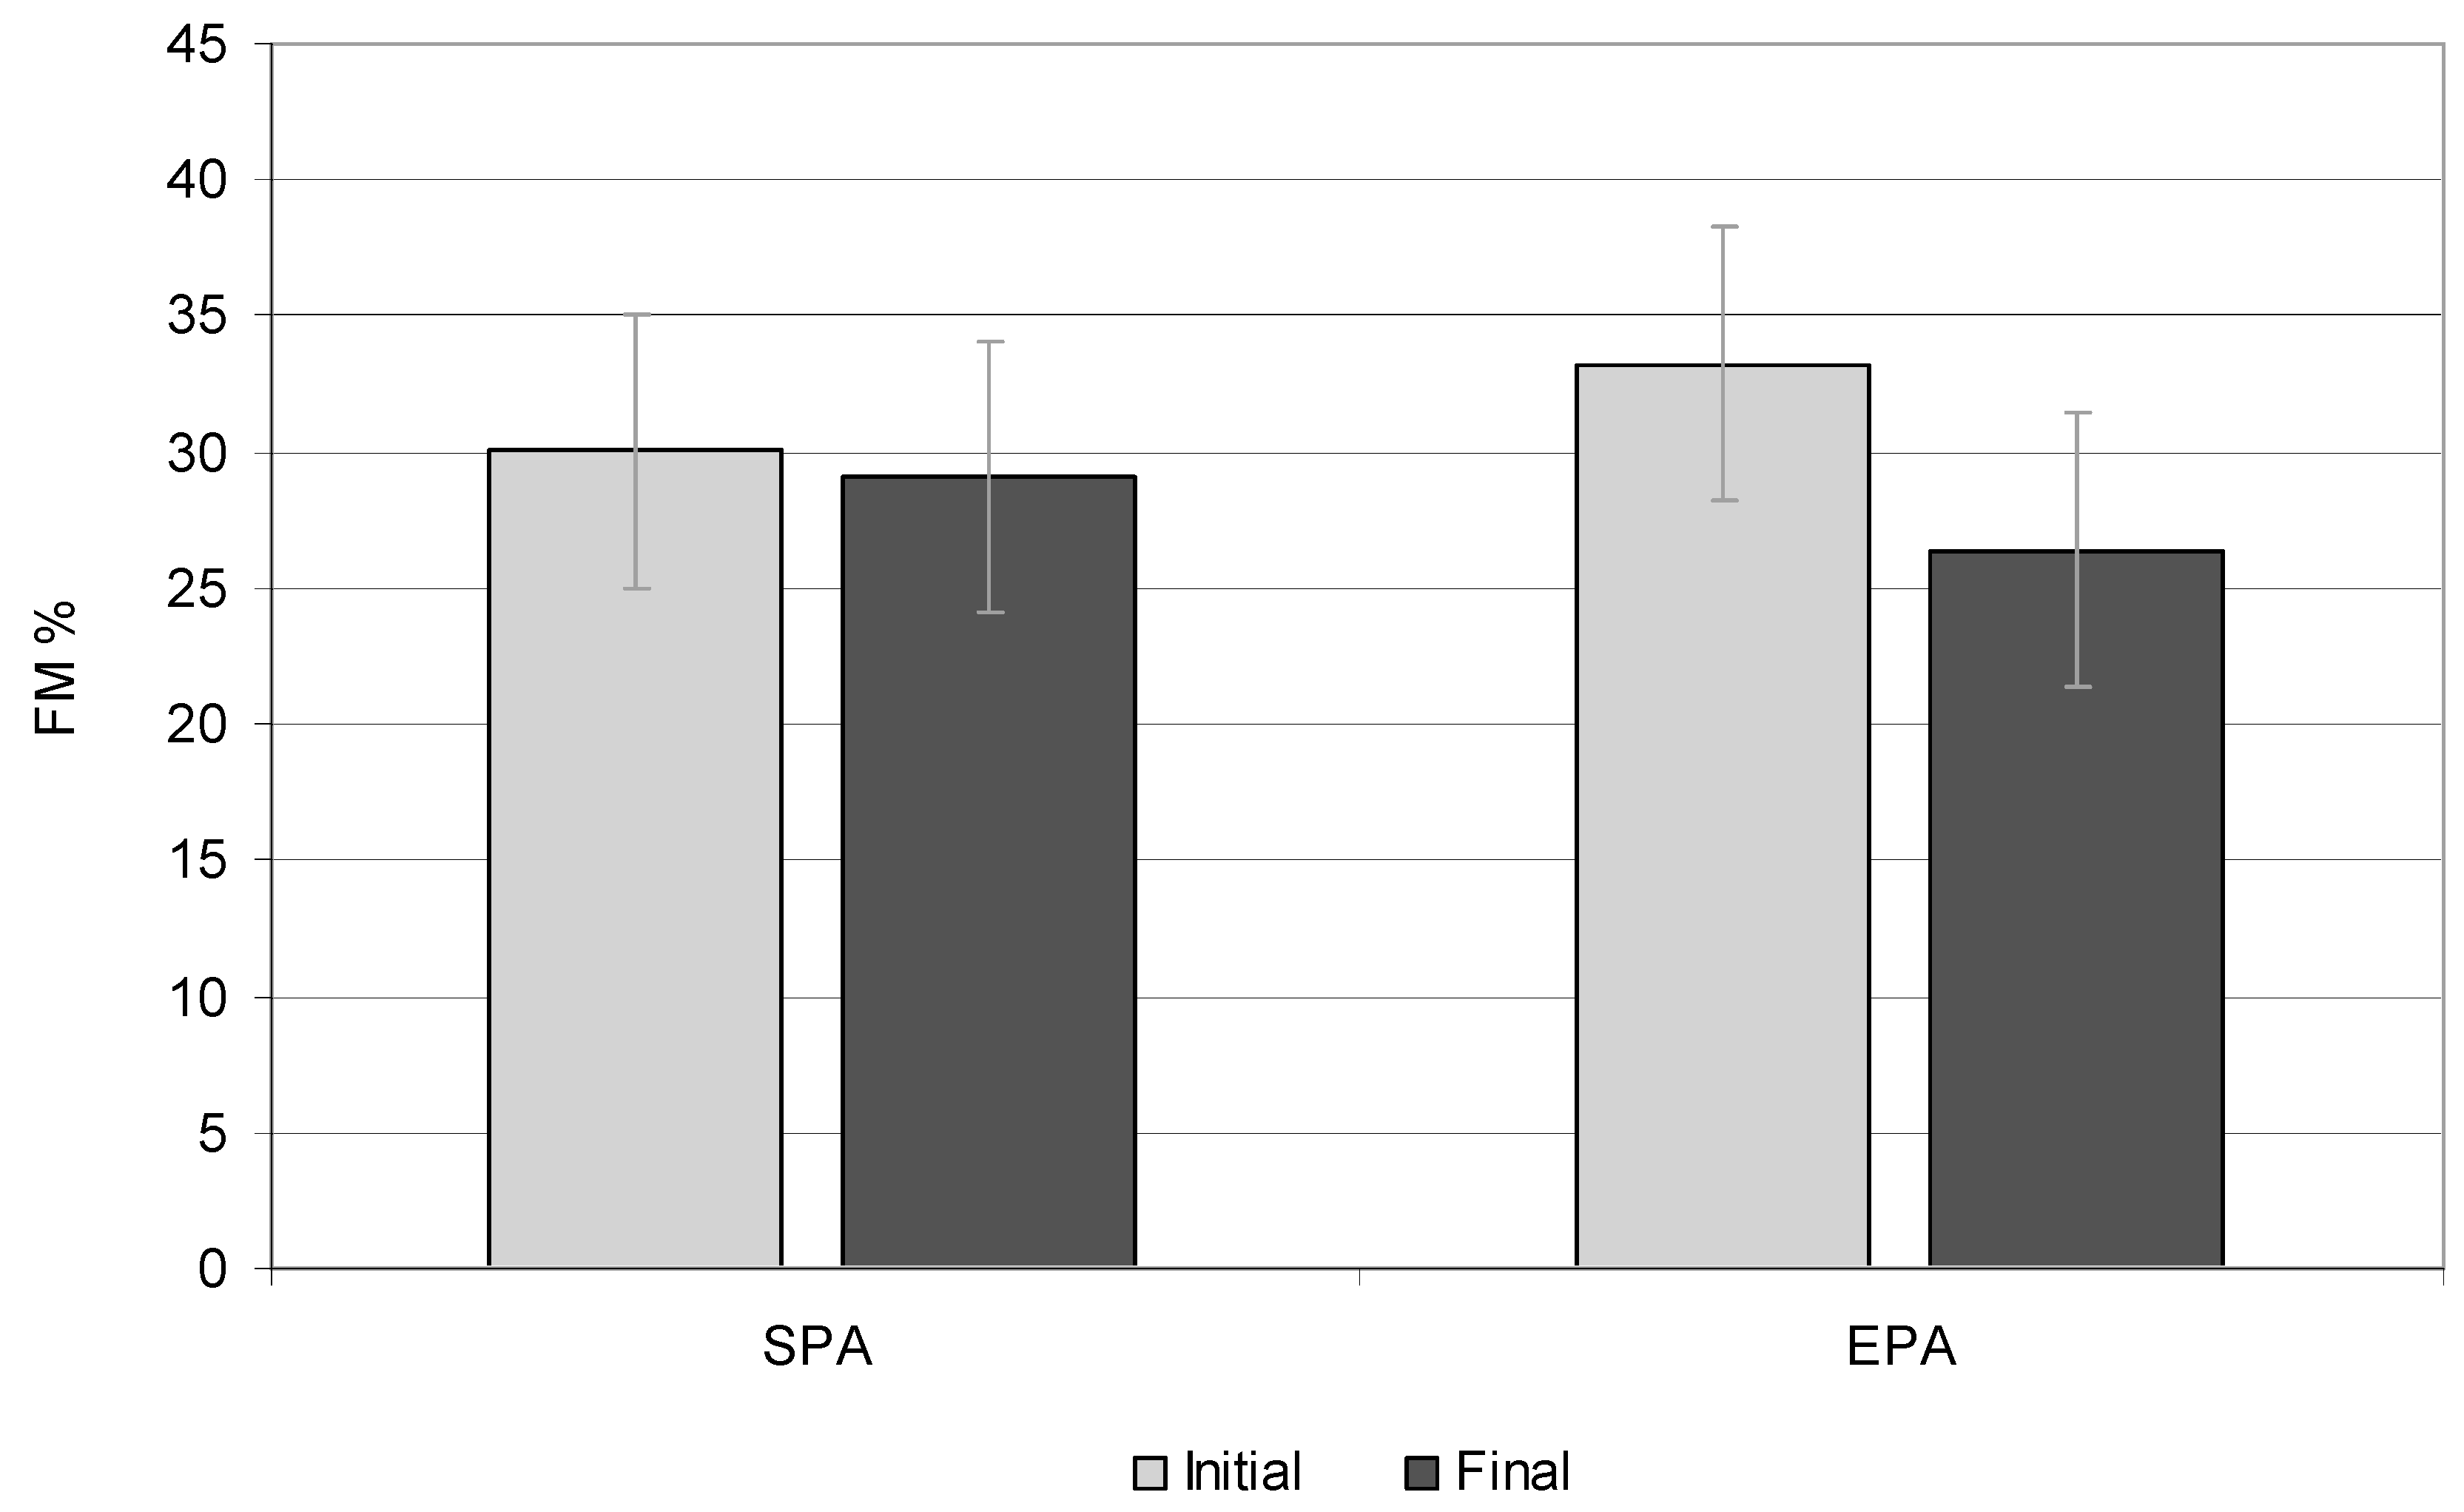
Figure 2.
Free-fat mass (FFM) at the beginning and end of the study, %. EPA – elevated PA group; SPA - standard PA group.
Figure 2.
Free-fat mass (FFM) at the beginning and end of the study, %. EPA – elevated PA group; SPA - standard PA group.
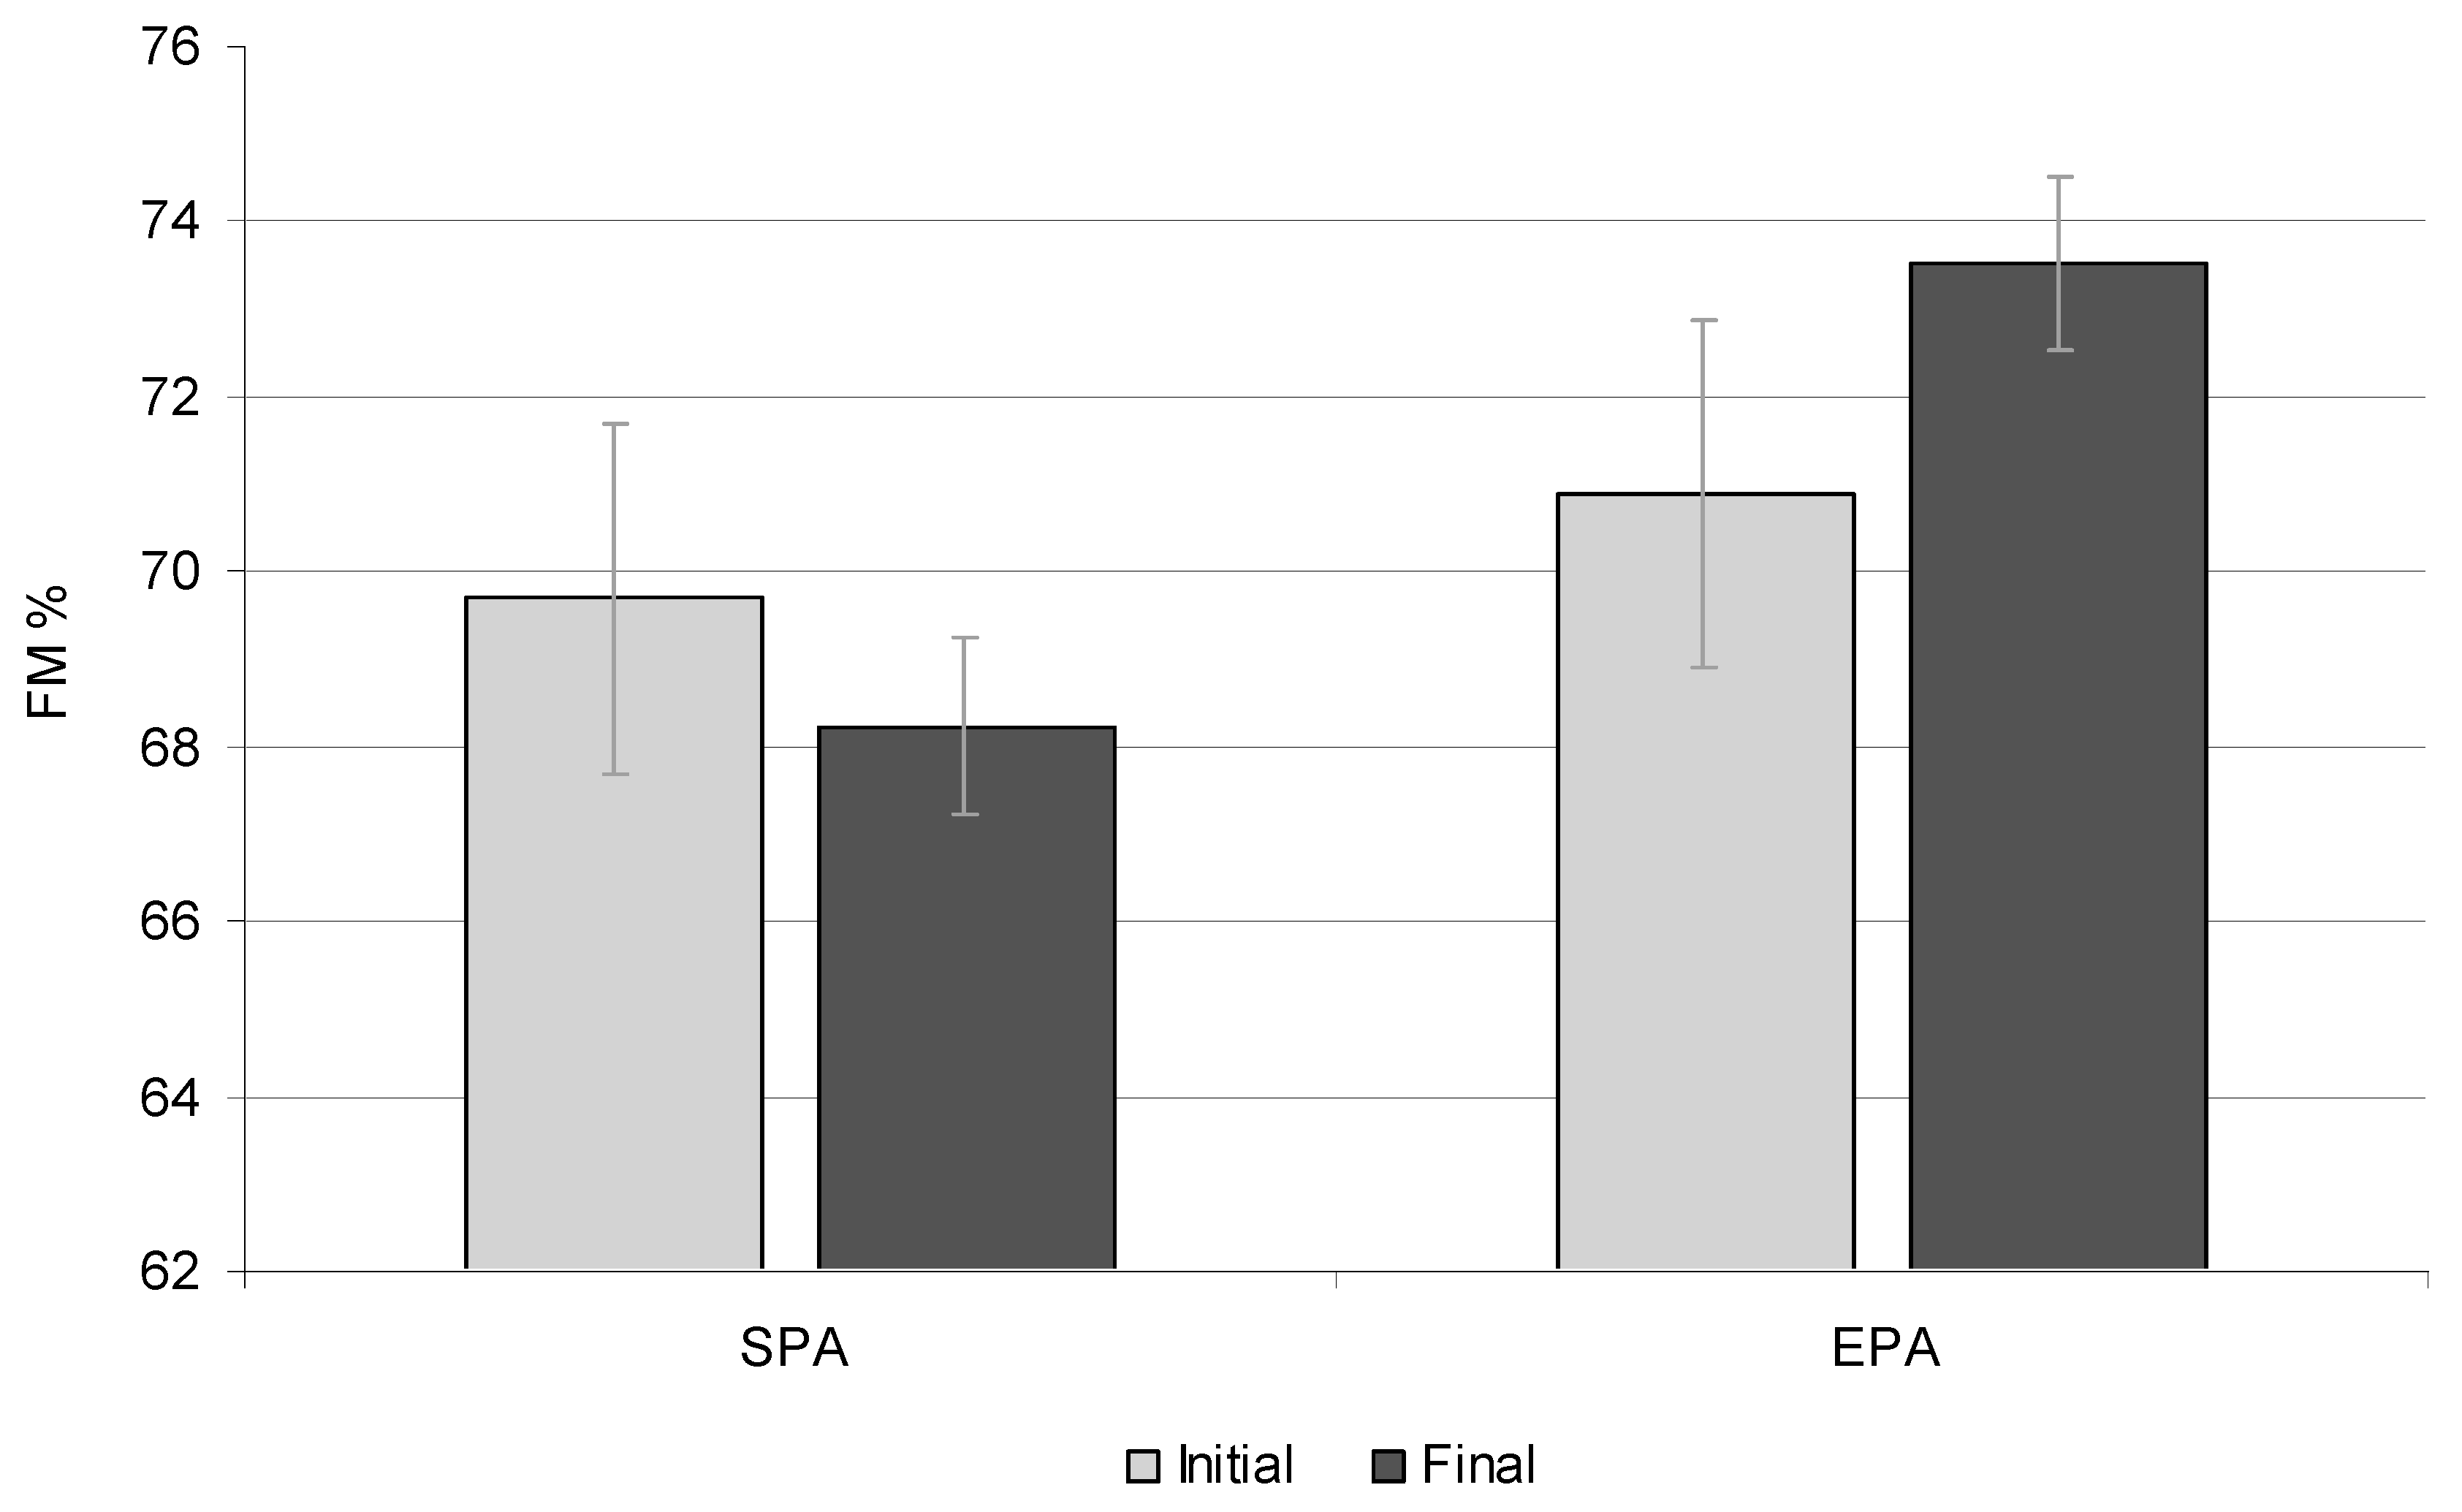
Figure 3.
Sceletal muscle mass (SMM) at the beginning and end of the study, %. EPA – elevated PA group; SPA - standard PA group.
Figure 3.
Sceletal muscle mass (SMM) at the beginning and end of the study, %. EPA – elevated PA group; SPA - standard PA group.
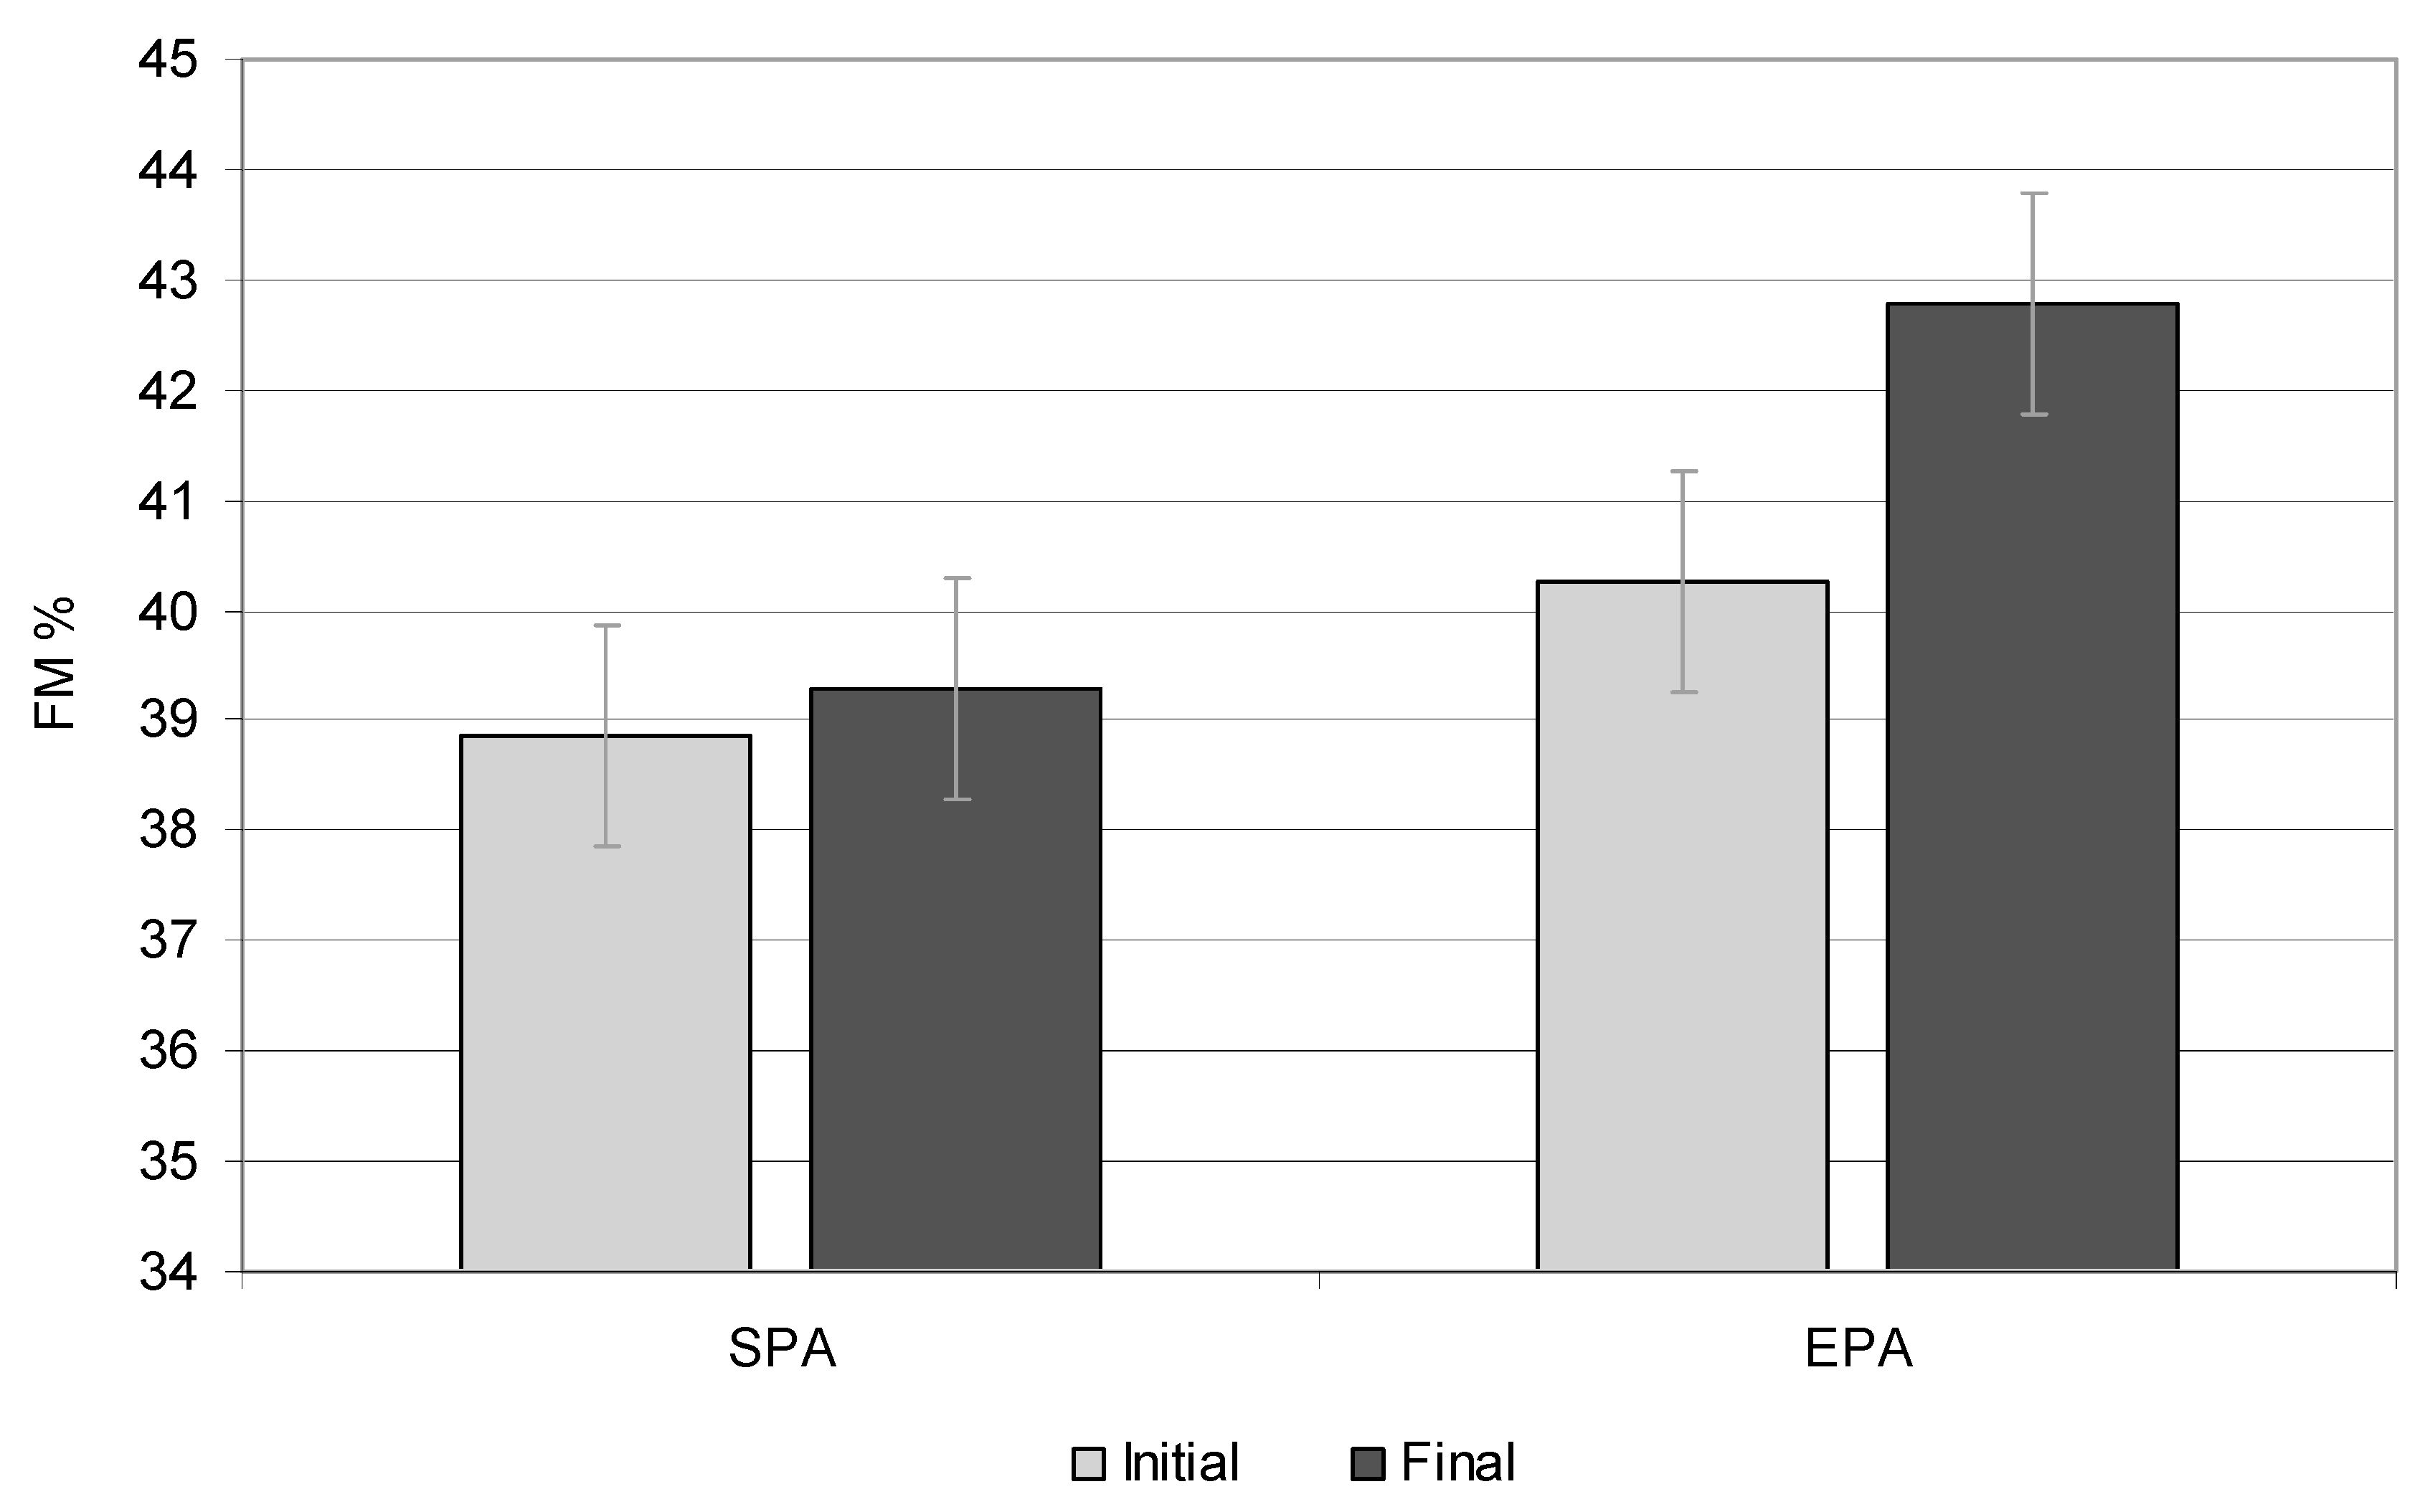
Figure 4.
Total body water content (TBW) at the beginning and end of the study, %. EPA – elevated PA group; SPA - standard PA group.
Figure 4.
Total body water content (TBW) at the beginning and end of the study, %. EPA – elevated PA group; SPA - standard PA group.
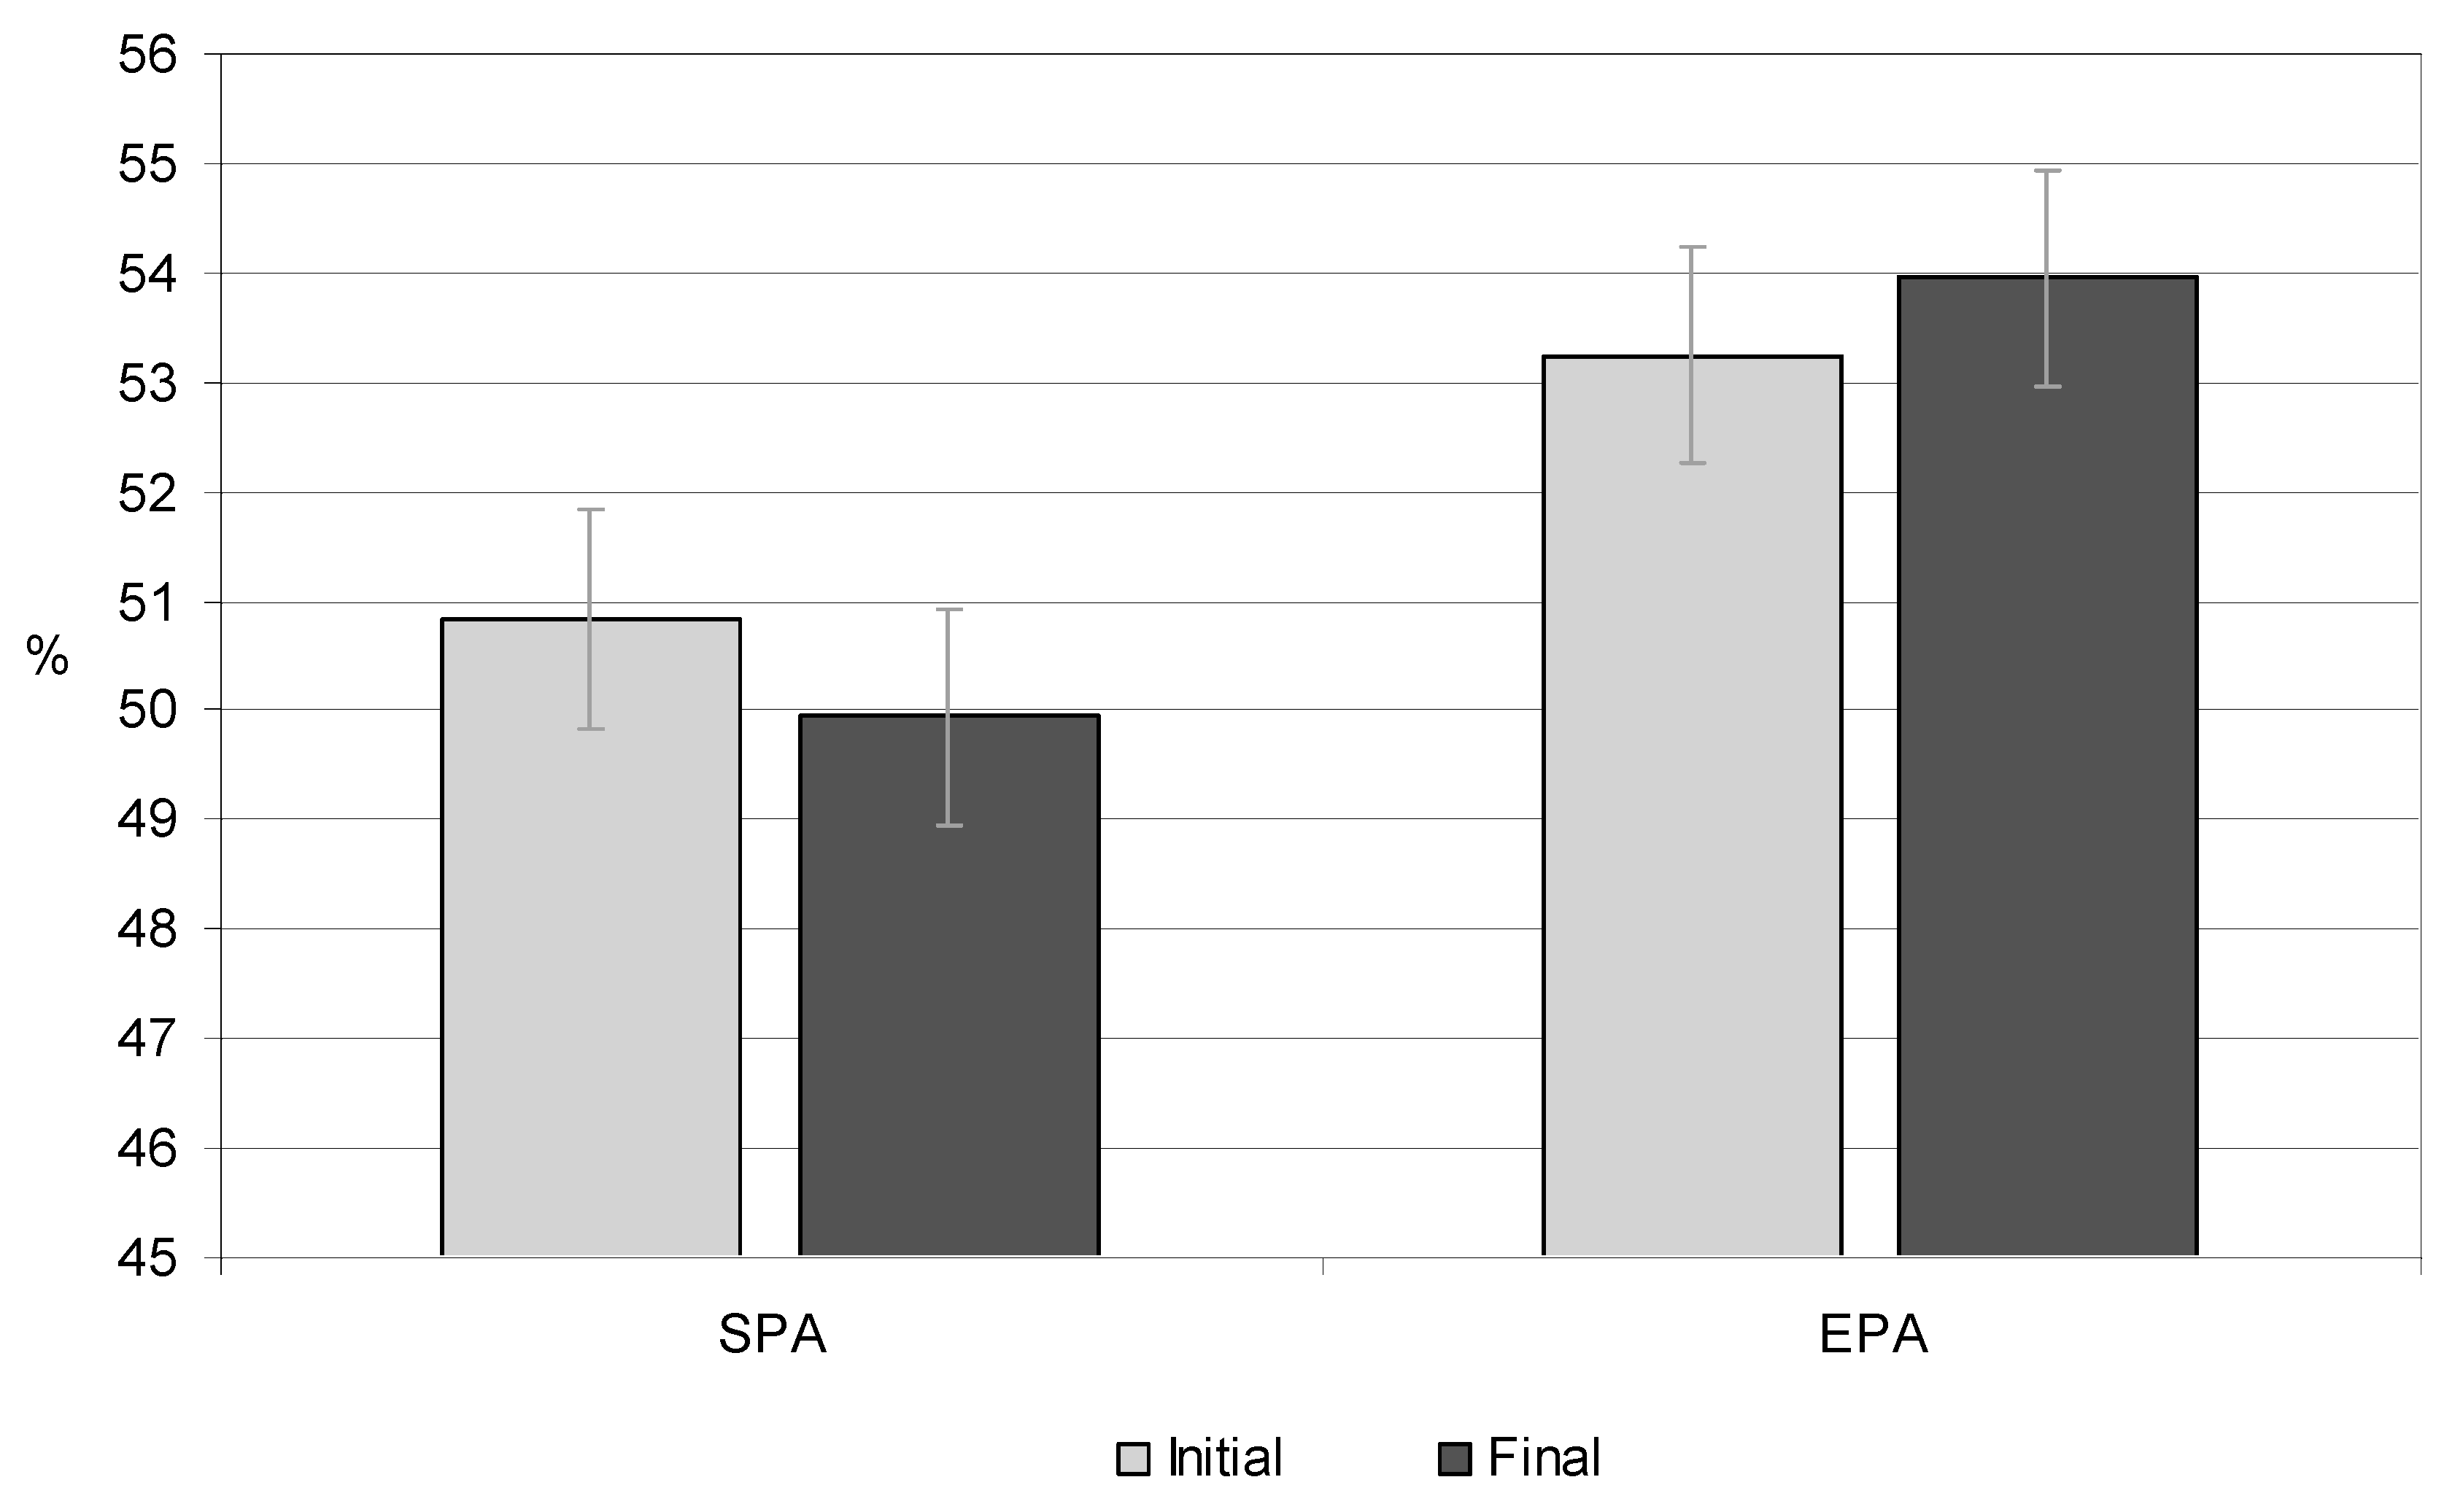

Table 1.
The BMI categories during the study period.
| Measurement session |
SPA | EPA | *p | ||||
|---|---|---|---|---|---|---|---|
| Girls | Boys | Mean | Girls | Boys | Mean | ||
| Overweight | |||||||
| - Initial | 59% | 55.5% | 57.25% | 58% | 50% | 54% | 0.030 |
| - Final | 47% | 61% | 54% | 62.5% | 67% | 59.75% | 0.021 |
| Obesity | |||||||
| - Initial | 41% | 44.5% | 42.75% | 42% | 50% | 46% | 0.045 |
| - Final | 53% | 39% | 46% | 37.5% | 33% | 35.25% | 0.050 |
| A change in the BMI category from overweight to normal | |||||||
| Entire study period | 3.33% | 0 | 3.33% | 7.71% | 11.43% | 17.14% | 0.001 |
EPA – elevated PA group; SPA - standard PA group; *p= T-test; p ≤ 0,05.
Table 2.
Comparison of anthropometric indicators of children with excessive body weight between the initial and final measurements. .
Table 2.
Comparison of anthropometric indicators of children with excessive body weight between the initial and final measurements. .
| Indicator | SPA | EPA |
Total p |
|||||||||
|---|---|---|---|---|---|---|---|---|---|---|---|---|
| initial | final | p | initial | final | p | |||||||
| Boys | Girls | Boys | Girls | Boys | Girls | Boys | Girls | |||||
| Height (cm) | 151.25 | 145.08 | 165.41 | 159.25 | 0.001 | 144.66 | 147 | 158 | 160.62 | 0.000 | 0.000 | |
| Weight (kg) | 59.98 | 47.60 | 75.18 | 61.64 | 0.012 | 47.50 | 48.67 | 60.38 | 61.88 | 0.003 | 0.001 | |
| BMI (kg/m2) | 25.92 | 22.58 | 27.23 | 24.37 | 0.162 | 22.65 | 22.41 | 24.21 | 23.66 | 0.062 | 0.042 | |
| BMI (percentile, c) | 97 c | 90 c | 97 c | 97 c | 0.032 | 90 c | 90 c | 85 c | 90 c | 0.010 | 0.014 | |
EPA – elevated PA group; SPA - standard PA group; BMI - body mass index (kg/m2); c - percentile corresponding to BMI percentile charts; p - ANOVA; p ≤ 0.05.
Table 3.
Comparison of the body composition of overweight girls between the initial and final measurements.
Table 3.
Comparison of the body composition of overweight girls between the initial and final measurements.
| Indicator | SPA | EPA | ||||
|---|---|---|---|---|---|---|
| initial | final | p | initial | final | p | |
| FM (kg) | 15.02 | 20.32 | 0.001 | 15.65 | 18.87 | 0.001 |
| FM (%) | 31.62 | 32.65 | 0.025 | 32.02 | 30.02 | 0.000 |
| FM (percentile, c) | 91 c | 95 c | 0.024 | 91 c | 85 c | 0.000 |
| FFM (kg) | 32.50 | 41.17 | 0.001 | 32.07 | 43.01 | 0.001 |
| FFM (%) | 68.38 | 67.35 | 0.051 | 67.98 | 69.98 | 0.025 |
| TBW (kg) | 23.76 | 30.21 | 0.001 | 24.30 | 31.51 | 0.014 |
| TBW (%) | 50.15 | 49.62 | 0.003 | 51.95 | 52.20 | 0.000 |
| SMM (kg) | 18.47 | 23.35 | 0.001 | 18.75 | 24.12 | 0.001 |
| SMM (%) | 38.66 | 38.10 | 0.514 | 38.54 | 40.12 | 0.000 |
EPA – elevated PA group; SPA - standard PA group; FM- fat mass (in kg); c - percentile corresponding to fat mass percentile charts; FFM- fat free mass; TBW- total body water; SMM- skeletal muscle mass; p- ANOVA; p ≤ 0.05.
Table 4.
Comparison of the body composition of overweight boys between the initial and final measurements.
Table 4.
Comparison of the body composition of overweight boys between the initial and final measurements.
| Indicator | SPA | EPA | ||||
|---|---|---|---|---|---|---|
| initial | final | p | initial | final | p | |
| FM (kg) | 17.39 | 23.19 | 0.001 | 12.43 | 13.76 | 0.001 |
| FM (%) | 29 | 30.85 | 0.000 | 26.20 | 22.80 | 0.000 |
| FM (percentile, c) | 95 | 95 | 0.452 | 91 | 85 | 0.000 |
| FFM (kg) | 42.58 | 51.98 | 0.014 | 35.66 | 46.61 | 0.014 |
| FFM (%) | 71 | 69.11 | 0.001 | 73.80 | 77.20 | 0.001 |
| TBW (kg) | 30.73 | 37.77 | 0.025 | 25.64 | 33.31 | 0.000 |
| TBW (%) | 51.25 | 50.25 | 0.012 | 54.56 | 55.70 | 0.045 |
| SMM (kg) | 22.89 | 29.84 | 0.024 | 20.57 | 33.07 | 0.001 |
| SMM (%) | 39.05 | 40.46 | 0.071 | 42.01 | 45.45 | 0.001 |
EPA – elevated PA group; SPA - standard PA group; FM- fat mass (in kg); c - percentile corresponding to fat mass percentile charts; FFM- fat free mass; TBW- total body water; SMM- skeletal muscle mass; p- ANOVA; p ≤ 0.05.
Table 5.
Children‘s fat mass (FM) in particular measurement sessions percentage (%) and mass units (kg).
Table 5.
Children‘s fat mass (FM) in particular measurement sessions percentage (%) and mass units (kg).
| Fat Mass, % (kg) | ||||||||||||||||
|---|---|---|---|---|---|---|---|---|---|---|---|---|---|---|---|---|
| Measurement session |
Average Age (Years) |
Mean* Total |
SPA | EPA | p** | ESs | ||||||||||
| Mean | Median | Min. | Max. | SD | 95% CI |
Mean | Median | Min. | Max. | SD | 95% CI |
|||||
| Average | ||||||||||||||||
| I | 10.27 | 29.48** (15.11) |
30.32 (16.20) |
30.50 | 17.50 | 47.40 | 5.61 | 4.45-7.59 | 28.65 (14.03) |
30.00 | 18.80 | 37.30 | 5.00 | 3.98-6.73 | 0.018 | 0.789 |
| II | 10.90 | 29.35 (16.01) |
30.62 (17.67) |
29.05 | 17.10 | 47.90 | 5.76 | 4.67-7.51 | 28.08 (14.35) |
28.00 | 16.60 | 38.00 | 5.42 | 4.29-7.38 | 0.029 | 0.830 |
| III | 11.27 | 29.28 (17.04) |
31.18 (19.32) |
30.10 | 18.50 | 48.00 | 6.17 | 4.93-8.25 | 27.39 (14.76) |
29.00 | 17.70 | 39.00 | 5.45 | 4.29-7.48 | 0.043 | 0.904 |
| IV | 11.90 | 29.21 (18.05) |
31.44 (20.59) |
30.50 | 18.80 | 48.50 | 6.36 | 5.18-8.23 | 26.98 (15.54) |
28.50 | 17.89 | 38.90 | 6.31 | 5.04-8.44 | 0.041 | 0.744 |
| V | 12.26 | 29.08 (19.03) |
31.75 (21.75) |
29.76 | 19.10 | 48.90 | 6.43 | 5.24-8.32 | 26.41 (16.31) |
29.30 | 16.50 | 38.50 | 5.50 | 4.35-7.49 | 0.033 | 0.643 |
| Mean from all sessions | 29.28 (17.04) |
31.06 (19.11) |
27.50 (15.00) |
0.001 | 0.320 | |||||||||||
| Girls | ||||||||||||||||
| I | 10.27 | 31.77 (15.33) |
31.62 (15.02) 91 c |
31.20 | 27.00 | 34.40 | 2.28 | 1.67-3.59 | 31.93 (15.64) 91 c |
31.87 | 27.80 | 38.30 | 3.01 | 2.24-4.58 | 0.062 | 0.322 |
| II | 10.90 | 31.33 (16.08) |
31.79 (16.21) 91 c |
31.70 | 27.60 | 37.30 | 2.88 | 2.15-4.39 | 30.87 (15.95) 91 c |
31.43 | 27.30 | 38.00 | 3.61 | 2.67-5.60 | 0.027 | 0.287 |
| III | 11.27 | 31.29 (17.34) |
31.86 (17.86) 91 c |
31.00 | 28.40 | 38.10 | 2.76 | 2.00-4.44 | 30.73 (16.83) 91 c |
30.50 | 26.40 | 37.00 | 3.31 | 2.40-5.33 | 0.033 | 0.479 |
| IV | 11.90 | 31.13 (18.28) |
32.14 (19.02) 95 c |
30.00 | 28.50 | 39.20 | 2.98 | 2.25-4.40 | 30.12 (17.56) 91 c |
30.10 | 25.80 | 37.90 | 4.07 | 3.03-6.20 | 0.025 | 0.137 |
| V | 12.26 | 31.33 (19.59) |
32.65 (20.32) 95 c |
31.35 | 28.80 | 39.60 | 3.16 | 3.16-2.40 | 30.02 (18.87) 85 c |
30.05 | 25.60 | 37.50 | 3.40 | 2.51-2.27 | 0.004 | 0.571 |
| Mean from all sessions | 31.37 (17.32) |
31.93 (17.69) |
30.73 (16.97) |
0.014 | 0.351 | |||||||||||
| Boys | ||||||||||||||||
| I | 10.27 | 27.18 (14.91) |
29.00 (17.39) 95 c |
28.45 | 17.50 | 47.40 | 7.84 | 5.68-12.63 | 25.37 (12.43) 91 c |
25.40 | 18.80 | 34.30 | 4.66 | 3.34-7.70 | 0.003 | 0.128 |
| II | 10.90 | 27.57 (15.94) |
29.85 (19.13) 95 c |
27.20 | 17.60 | 47.90 | 7.37 | 5.57-10.91 | 25.30 (12.75) 91 c |
24.40 | 17.60 | 34.10 | 5.09 | 3.61-8.65 | 0.010 | 0.274 |
| III | 11.27 | 27.27 (16.74) |
30.50 (20.79) 95 c |
27.30 | 18.50 | 48.00 | 7.97 | 5.93-12.13 | 24.05 (12.69) 85 c |
23.60 | 16.70 | 33.90 | 4.53 | 3.24-7.47 | 0.008 | 0.075 |
| IV | 11.90 | 27.30 (17.85) |
30.75 (22.17) 95 c |
26.00 | 18.80 | 48.50 | 8.00 | 6.05-11.84 | 23.85 (13.53) 85 c |
24.00 | 16.89 | 32.00 | 5.45 | 3.95-8.78 | 0.020 | 0.386 |
| V | 12.26 | 26.82 (18.47) |
30.85 (23.19) 95 c |
24.50 | 19.10 | 48.90 | 7.64 | 5.73-11.45 | 22.80 (13.76) 85 c |
24.30 | 16.50 | 31.40 | 4.71 | 3.33-8.00 | 0.032 | 0.339 |
| Mean from all sessions | 27.22 (16.78) |
30.19 (20.53) |
24.27 (13.03) |
0.001 | 0.420 | |||||||||||
EPA – elevated PA group; SPA - standard PA group; * all children, i.e., boys and girls **fat mass in percentage; c - percentile corresponding to fat mass; measurement sessions: I—September 2017; II—March 2018; III—September 2018; IV—March 2019; V—September 2019; Min.—minimum; Max.—maximum; SD—standard deviation; 95%; CI—confidence interval; ESs—Effect sizes all children ; *Mann-Whitney U Test; significant differences p ≤ 0.05.
Table 6.
The Comparison of the body composition of children with excess FM (≥ 85 percentile) between the initial and final measurements.
Table 6.
The Comparison of the body composition of children with excess FM (≥ 85 percentile) between the initial and final measurements.
| Indicator | SPA | EPA | Total p |
||||||||
|---|---|---|---|---|---|---|---|---|---|---|---|
| initial | final | p | initial | final | p | ||||||
| Boys | Girls | Boys | Girls | Boys | Girls | Boys | Girls | ||||
| BMI (kg/m2) | 26.18 | 22.34 | 27.94 | 25.16 | 0.120 | 23.12 | 22.57 | 25.12 | 24.40 | 0.002 | 0.002 |
| FM (kg) | 19.90 | 15.85 | 24.23 | 21.25 | 0.001 | 13.55 | 16.20 | 16.63 | 20.20 | 0.001 | 0.010 |
| FM (%) | 30.61 | 31.95 | 32.25 | 33.05 | 0.010 | 27.22 | 32.23 | 25.13 | 31.20 | 0.000 | 0.031 |
| FFM (kg) | 40.36 | 31.22 | 52.59 | 40.36 | 0.041 | 35.47 | 31.73 | 49.33 | 41.85 | 0.050 | 0.001 |
| FFM (%) | 67.17 | 68.13 | 66.45 | 66.58 | 0.001 | 71.95 | 65.31 | 72.90 | 67.03 | 0.002 | 0.000 |
| TBW (kg) | 29.78 | 23.16 | 38.50 | 29.61 | 0.032 | 25.81 | 24.15 | 35.00 | 30.00 | 0.000 | 0.002 |
| TBW (%) | 50.10 | 49.17 | 49.11 | 48.41 | 0.001 | 52.31 | 50.62 | 53.27 | 51.06 | 0.000 | 0.002 |
| SMM (kg) | 23.13 | 18.23 | 29.95 | 22.89 | 0.041 | 20.65 | 18.73 | 33.60 | 24.23 | 0.001 | 0.000 |
| SMM (%) | 38.75 | 38.52 | 39.95 | 37.95 | 0.050 | 41.10 | 38.37 | 42.86 | 39.25 | 0.000 | 0.001 |
EPA – elevated PA group; SPA - standard PA group; BMI - body mass index (kg/m2); FM- fat mass; FFM- fat free mass; TBW- total body water; SMM- skeletal muscle mass; p- ANOVA; p ≤ 0.05.
Table 7.
Children‘s fat-free mass (FFM) in particular measurement sessions.
| FFM, % (kg) | ||||||||||||||||
|---|---|---|---|---|---|---|---|---|---|---|---|---|---|---|---|---|
| Measurement session |
Average Age (Years) |
Mean* Total |
SPA | EPA |
p* |
ESs |
||||||||||
| Mean | Median | Min. | Max. | SD | 95% CI |
Mean | Median | Min. | Max. | SD | 95% CI |
|||||
| Average | ||||||||||||||||
| I | 10.27 | 69.80** (35.70) |
69.68 (37.54) |
69.50 | 60.50 | 74.00 | 4.30 | 4.20-6.14 | 69.97 (33.87) |
68.20 | 64.50 | 76.00 | 4.20 | 3.80-5.17 | 0.288 | 0.262 |
| II | 10.90 | 70.69 (38.36) |
69.53 (40.13) |
68.70 | 59.00 | 75.50 | 4.70 | 3.80-5.42 | 71.85 (36.59) |
70.60 | 64.00 | 76.50 | 3.41 | 3.60-5.90 | 0.013 | 0.258 |
| III | 11.27 | 70.66 (40.67) |
68.76 (42.66) |
66.90 | 60.20 | 74.00 | 3.90 | 4.18-6.30 | 72.57 (38.69) |
71.59 | 65.50 | 76.00 | 3.90 | 4.15-6.24 | 0.020 | 0.620 |
| IV | 11.90 | 70.54 (43.41) |
68.31 (44.73) |
67.20 | 57.00 | 76.00 | 5.20 | 4.80-6.50 | 72.78 (42.10) |
71.90 | 65.00 | 76.80 | 4.25 | 4.39-6.15 | 0.012 | 0.172 |
| V | 12.26 | 70.65 (45.69) |
67.95 (46.57) |
65.90 | 58.00 | 77.00 | 4.63 | 5.20-6.08 | 73.35 (44.81) |
72.12 | 66.50 | 78.50 | 4.60 | 5.18-6.14 | 0.014 | 0.087 |
| Mean from all sessions | 70.46 (40.76) |
68.83 (42.33) |
72.10 (39.21) |
0.001 | 0.241 | |||||||||||
| Girls | ||||||||||||||||
| I | 10.27 | 67.08 (32.28) |
68.27 (32.50) |
68.70 | 65.60 | 73.00 | 5.90 | 4.07-10.80 | 65.89 (32.07) |
64.00 | 64.50 | 70.50 | 4.20 | 3.80-5.17 | 0.092 | 0.508 |
| II | 10.90 | 68.96 (35.41) |
68.91 (35.30) |
67.20 | 62.70 | 73.70 | 4.30 | 2.74-8.40 | 69.01 (35.52) |
67.00 | 64.00 | 72.00 | 3.60 | 3.60-4.70 | 0.801 | 0.858 |
| III | 11.27 | 68.58 (37.61) |
67.97 (37.93) |
66.00 | 62.00 | 72.80 | 6.20 | 6.72-12.20 | 69.20 (37.30) |
68.00 | 65.50 | 71.00 | 4.10 | 4.02-6.18 | 0.098 | 0.528 |
| IV | 11.90 | 68.42 (40.27) |
67.43 (39.54) |
66.40 | 60.80 | 73.20 | 6.70 | 5.48-12.50 | 69.42 (41.00) |
68.50 | 65.00 | 72.50 | 5.20 | 3.50-6.14 | 0.047 | 0.860 |
| V | 12.26 | 68.14 (42.09) |
66.79 (41.17) |
65.80 | 61.00 | 73.00 | 7.12 | 5.40-11.70 | 69.50 (43.01) |
68.00 | 66.50 | 74.00 | 6.17 | 3.90-5.79 | 0.042 | 0.447 |
| Meanfrom all sessions | 68.23 (37.53) |
67.87 (37.29) |
68.60 (37.78) |
0.035 | 0.320 | |||||||||||
| Boys | ||||||||||||||||
| I | 10.27 | 72.52 (39.12) |
70.99 (42.58) |
69.70 | 60.50 | 74.00 | 6.40 | 3.90-5.70 | 74.05 (35.66) |
73.00 | 66.50 | 76.00 | 3.80 | 4.20-5.74 | 0.022 | 0.116 |
| II | 10.90 | 72.43 (44.34) |
70.16 (51.02) |
68.50 | 59.00 | 75.50 | 4.72 | 4.20-6.05 | 74.70 (37.66) |
72.50 | 65.80 | 76.50 | 4.20 | 3.75-5.34 | 0.036 | 0.172 |
| III | 11.27 | 72.72 (43.73) |
69.49 (47.39) |
67.90 | 60.20 | 74.00 | 5.14 | 4.80-6.20 | 75.95 (40.08) |
74.30 | 65.90 | 76.00 | 3.42 | 3.20-6.14 | 0.011 | 0.277 |
| IV | 11.90 | 72.67 (46.30) |
69.20 (49.93) |
68.70 | 57.00 | 76.00 | 5.80 | 4.60-5.80 | 76.14 (43.21) |
75.20 | 66.40 | 76.80 | 3.24 | 2.80-6.40 | 0.017 | 0.061 |
| V | 12.26 | 73.17 (49.29) |
69.14 (51.98) |
67.40 | 58.00 | 77.00 | 6.17 | 4.70-6.80 | 77.20 (46.61) |
75.90 | 68.90 | 78.50 | 4.20 | 3.15-5.79 | 0.030 | 0.128 |
| Mean from all sessions | 72.70 (44.55) |
69.79 (47.37) |
75.60 (40.64) |
0.020 | 0.351 | |||||||||||
EPA – elevated PA group; SPA - standard PA group; * all children, i.e., boys and girls; **fat free mass in percentage; measurement sessions: I—September 2017; II—March 2018; III—September 2018; IV—March 2019; V—September 2019; Min.—minimum; Max.—maximum; SD—standard deviation; 95%; CI—confidence interval; ESs—Effect sizes all children; *Mann-Whitney U Test; significant differences p ≤ 0.05.
Disclaimer/Publisher’s Note: The statements, opinions and data contained in all publications are solely those of the individual author(s) and contributor(s) and not of MDPI and/or the editor(s). MDPI and/or the editor(s) disclaim responsibility for any injury to people or property resulting from any ideas, methods, instructions or products referred to in the content. |
© 2024 by the authors. Licensee MDPI, Basel, Switzerland. This article is an open access article distributed under the terms and conditions of the Creative Commons Attribution (CC BY) license (http://creativecommons.org/licenses/by/4.0/).
Copyright: This open access article is published under a Creative Commons CC BY 4.0 license, which permit the free download, distribution, and reuse, provided that the author and preprint are cited in any reuse.


