
Submitted:
27 November 2024
Posted:
28 November 2024
You are already at the latest version
Abstract
Biological soil crusts are integral to Arctic ecosystems, playing a crucial role in primary production, nitrogen fixation and nutrient cycling, as well as maintaining soil stability. However, the composition and complex relationships between the diverse organisms within these biocrusts are not well studied. This study investigates how microbial community composition within Arctic biocrusts is influenced by environmental factors along an altitudinal gradient (106 m to 306 m). Metagenomic analyses were used to provide insights into the community composition, revealing that temperature, pH, and nutrient availability significantly shaped the community. In contrast, altitude directly did not influence the microbial composition significantly. Eukaryotic communities were dominated by Chloroplastida and Fungi, while Proteobacteria and Actinobacteria prevailed among prokaryotes. Cyanobacteria, particularly orders such as Pseudoanabaenales, Pleurocapsales, and Nostocales, emerged as the most abundant photoautotrophic organisms. Our findings highlight the impact of environmental gradients on microbial diversity and the functional dynamics of biocrusts in the Arctic.
Keywords:
Biological soil crusts
; cyanobacteria
; micro algae
; climate
; edaphic factors
1. Introduction
The Arctic region is characterised by harsh environmental conditions, such as low temperatures, short growing seasons and limited water availability, which hinder the growth of many organisms. Biological soil crusts (biocrusts) make up a large part of the vegetation in Arctic areas [1]. Biocrusts are communities of autotrophic and heterotrophic organisms such as bacteria, cyanobacteria, microalgae, lichens or bryophytes that thrive in mutual association [2]. They form a thin layer covering the soil surface, typically 5-10 mm thick, and make up a significant proportion of the total vegetation in Arctic regions. Consequently, biocrusts play a crucial role in primary production and provide numerous benefits such as soil surface stabilisation, nitrogen fixation and organic matter accumulation [2,3].
The microbial community composition of biocrusts in Arctic regions is characterised by a wide range of different species with different functions, depending on environmental and soil conditions. However, the dominant phyla are often similar and typical bacterial phyla observed in biocrusts include Actinobacteria, Acidobacteria, Cyanobacteria and Proteobacteria [4]. Photoautotrophic species such as eukaryotic green algae, bryophytes, tracheophytes and cyanobacteria play an important role in such communities and are responsible for primary production within biocrusts [1,3]. Typical algal classes found in biocrusts include Klebsormidiophyceae, Zygnematophyceae, Chlorophyceae, Trebouxiophyceae and Ulvophyceae, while common cyanobacterial orders are Nostocales, Oscillatoriales and Pseudanabaenales [5,6]. In Arctic regions, factors such as low temperatures, low soil moisture due to minimal precipitation, and limited soil nutrients restrict primary production [7]. Lichen, a symbiotic life form of fungi and algae (e.g., Trebouxia sp.), are well adapted to these harsh conditions and become more prominent as the climate becomes drier [8]. In addition, nitrogen fixation by bacteria is one of the most important sources of nitrogen in Arctic ecosystems. For example, heterocystous cyanobacteria are responsible for a large proportion of soil nitrogen fixation [9].
Svalbard is a Norwegian archipelago in the Arctic Ocean. Although it lies halfway between continental Norway and the North Pole, the climate is tempered by the North Atlantic Current. Average temperatures in Svalbard remain below 10°C throughout the summer, with the warmest months lasting from the end of May to the end of August. The winter months are characterised by temperatures dropping to an average of -10 °C. Precipitation rarely exceeds 50-60 mm per month [10]. In addition, the northern geographic location results in about 90 days of polar nights in winter, characterised by complete darkness, and about 90 days of midnight sun in summer, with the archipelago exposed to sunlight 24 hours a day [11].
Svalbard has a diverse flora with about 160 species of vascular plants, 380 mosses and 600 lichens [12]. In general, the vegetation is characterised by low-growing species that thrive in dense ground covers, with different plants coexisting in close proximity.
The objective of this study is to enhance our understanding of the microbial community composition of Arctic biocrusts and the climatic and edaphic factors influencing these communities. To achieve this, an altitudinal gradient was chosen as the basis for this study, allowing the investigation of biocrust responses to varying environmental conditions. The focus of this study was on the community composition of photoautotrophic organisms. Given the typical changes in environmental conditions with increasing altitude, we hypothesised that the harsher environmental conditions at higher altitudes will lead to a decline in larger vascular plants, resulting in distinct shifts in microbial community composition. Changes in temperature, soil moisture and soil chemistry along the altitudinal gradient are expected to be reflected in the composition of microbial communities.
2. Materials and Methods
2.1. Site Description and Sampling
The sampling sites were located on the slope of the larger mountain on Ossian Sarsfjellet in Svalbard. Four sampling sites, ranging from 101 m to 314 m, were selected for this study at different altitudes (Figure 1). Site 1 was located close to Sarsvatnet lake, Sites 2, 3 and 4 were located on the eastern side of the larger mountain on Ossian Sarsfjellet. All sites were chosen in the interior of the island to minimize the influence of the adjacent Kongsfjorden to the west and the glaciers to the east. Throughout the project the soil remained snow-free.
Three TOMST® data loggers (TOMST S.R.O., Czech Republic) were placed in the soil at each site to measure temperature and soil moisture. Temperature measurements were taken from each sensor at three different positions: T1 was measured 6 cm below the soil surface, T2 was measured directly at the soil surface and T3 represents the atmospheric temperature 15 cm above the soil surface. Measurements were taken every 15 minutes from July 13, 2023 to August 21, 2023. One sensor at Site 1 and all three sensors at Site 2 were removed from the ground due to external factors (most likely animals), consequently the data used for statistical analysis only covers the period from July 13 to August 4, 2023. Data from the meteorological station in Ny-Ålesund (station ID: SN99910) were also used for further analyses. Using a hand-held field PAM (FluorPen 100 instrument (Photon Systems Instruments, Drásov, Czech Republic)), the minimum fluorescence of the opened reaction centers of photosystem II (PSII) (F0, basal fluorescence of chlorophyll a) and the maximum fluorescence (Fm) were measured using the OJIP protocol with the following settings: flash pulse 20% and super pulse 80%, after 15 min of dark acclimation. The maximum quantum yield of PSII (QYmax = Fm-F0)/Fm) was calculated.
Three replicates of biocrust material were collected at each site. Material for DNA analysis was collected on July 13, 2023.
2.2. Vegetation Analysis
The Braun-Blanquet vegetation analysis was carried out on Ossian Sarsfjellet, Svalbard, on July 13, 2023. Three individual plots of 1 m2 were selected at each site, resulting in a total of 12 plots analysed. Individual species and the general layout and appearance of each site were recorded. In addition, the general area coverage of each species was estimated according to the scale presented in Table 1. Statistical analyses were conducted to compare the vegetation at different altitudes and identify significant differences in species composition. For statistical purposes, the Braun-Blanquet vegetation scale was converted into numerical values (Table 1).
2.3. Soil Analysis
Soil chemical analysis was carried out at the University of Rostock. Samples were dried at 45 °C for 24 h prior to analysis. Total carbon and total nitrogen were measured using the Vario EL CNS analyser (Elementar Analysensysteme GmbH, Hanau, Germany). For the measurement of total phosphorus, microwave-assisted digestion with aqua regia solution was used. The concentration was then measured by inductively coupled plasma (ICP) optical emission spectroscopy (ICP-OES Optima 8300, USA) at a wavelength of 214 mm.
Soil pH was determined electrometrically in a 0.01 M calcium chloride (CaCl2) solution with a weight/volume ratio (w/v) of 1:2.5 according to DIN ISO 10 390. Measurements were taken after 30 minutes using a pH meter (METTLER TOLEDO SevenMulti, Giessen, Germany).
Chlorophyll a content was measured by adding 0.1 g of magnesium carbonate (MgCO3) to each sample and then extracting chlorophyll a in 3 ml of 96% ethanol at 78 °C for 30 min. The concentration was measured using a spectrophotometer (Shimadzu UV-2401 PC, Kyoto, Japan) at wavelengths of 750, 696, 665, 649 and 632 nm. The final chlorophyll a content was calculated according to the given equation (1).
2.4. DNA Isolation and Sequencing
DNA was extracted from the collected biocrusts using the DNeasy Power Soil Pro Kit (QIAGEN GmbH, Hilden, Germany) according to the manufacturer’s instructions. The DNAs were further sent to the Cologne Center for Genomics (University of Cologne, Cologne, Germany), where metagenomic sequencing was conducted using the Illumina Seq6000 sequencing system (PE150). The raw reads were deposited in the Sequence Read Archive (SRA) under Project number PRJNA1189472.
2.5. Bioinformatic and Statistical Analyses
Bioinformatic analysis for metagenomics was mainly conducted using the OmicsBox software (Version 3.1.11). FASTQ quality filtering was performed using Trimmomatic (Version 0.38) [13] and the rRNAs were further extracted using SortMe-RNA [14]. Taxonomic classification of 16S and 18S rRNAs was performed using the Silva database (Version 1.9.10) as well as the Kraken2 software (Version 2.1.3), with default settings [15].
Statistical analyses were performed in RStudio (Version 4.1.3). Prior to testing, Shapiro-Wilk’s test was performed to assess normality within the dataset. If necessary, the data were square root transformed. Differences between the individual sampling sites and further parameters were tested with one- and two-ways analysis of variance (ANOVA), followed by Tukey’s HSD, with a significance threshold of p < 0.05. To visualize the distribution of reads at the different sites, a Non-Metric Multidimensional Scaling (NMDS) plot was generated, using the vegan package [16]. Additionally, the envfit function was used to fit parameters such as temperature, moisture and soil chemistry. Statistical significance was tested using ANOSIM.
For the vegetation analysis, PERMANOVA (Permutational Multivariate Analysis of Variance) was used to assess differences between the individual sampling sites (p<0.05). Statistical dispersion was checked to validate the PERMANOVA results, followed by ANOSIM for confirmation.
2.6. Calculation of the Average Dew Point
For the calculation of the average dew point, following equations were used. Initially, the saturation vapor pressure (es) was calculated using the Magnus-Tetens formula (2), here T denotes the daily average temperature [°C], measured 15 cm above the soil surface through TOMST® data loggers.
Following this, the actual vapor pressure (e) was calculated (3); RH signifies the daily relative humidity [%], measured at Ny-Ålesund station (Station ID: SN99910).
Finally, the dew point temperature (Td) was calculated (4), using the previously calculated actual vapor pressure (e).
3. Results
3.1. Environmental Parameters
Data from the weather station in Ny-Ålesund (station ID: SN99910) were used for comparison and to provide an overall picture of the meteorological conditions. Temperature and soil moisture varied between the different sites. Site 2 at 186 m a.s.l. exhibited the highest temperatures (Figure 2). On the contrary, Site 4 at 314 m a.s.l. demonstrated the lowest temperatures at all three measurement points (T1, T2, T3). The temperature values recorded above the soil surface demonstrated the most significant variation throughout the measurement period.
In July and August 2023, winds predominantly came from the east-southeast direction, with average speed around 5-6 m/s. From July 15 to July 16, 2023, weak winds were recorded (3 m/s), which intensified to the strongest winds observed on July 17, 2023, reaching speeds of 9 m/s (Suppl. Figure S1). Considering the geographical location of the four sites, Site 4 experienced the greatest exposure, aggravated by its high position on the larger mountain of Ossian Sarsfjellet.
Site 4 exhibited the highest soil moisture values, while Site 2 showed the lowest soil moisture values (Figure 3). A sudden increase in soil moisture was observed at the beginning of August. Comparing this with meteorological data from the weather station in Ny-Ålesund, it could be concluded that the increase was due to rainfall events during this period. Following the rainfall, the soil moisture levels measured at Site 3 and Site 4 remained elevated throughout the month of August.
To explain the highest soil moisture observed at Site 4, the dew point was calculated using the formulas explained in the Materials and Methods section (formulas 2,3,4). It can be assumed that on days where the temperature falls below the calculated dew point, dew formation of dew at the location is likely. Accordingly, Site 4 had the most days with possible dew formation. Conversely, Site 2 was characterised by the least overlap, in line with the measured soil moisture data.
The soil pH of the biocrusts measured at all sites showed neutral to slightly acidic conditions, ranging from 6.13 to 7.23 (Table 2). Sites 2 and 4 had a pH of around 7, which differed significantly from Sites 1 and 3, which had a pH of around 6. Site 3 had the lowest total phosphorus (TP), total carbon (TC) and total nitrogen (TN) contents and the highest carbon to nitrogen ratio (C/N) of 18.6. The chlorophyll a content of the biocrusts did not show any significant changes with increased elevation (Table 2), nor did the quantum yield capacity of photosystem II (Fv/Fm) measured with a field PAM (Table 2).
3.2. Vegetation at the Sites
At all sampling sites the vegetation consisted mainly of small vascular plants, mosses, lichens and biocrusts. A total of 26 different species were recorded (Suppl. Table S1). Of these, 12 species could be assigned to eight different families of tracheophytes, ten different species of bryophytes and four different species of lichens. Three of the 26 species could not be identified. Looking at the total number of individual species per site, there was a steady decline from Site 1 with 17 species to Site 4 with only 15. Furthermore, the overall ground cover of the species tended to decrease with increasing altitude.
The highest ground cover could be observed for Dryas octopetala, Sterecaulon alpinum, Salix polaris, Carex sp., Polygonum viviparum and one unidentified lichen species (Suppl. Table S1). Dryas octopetala had the highest ground cover with up to 50% at Site 2. While species such as Dryas octopetala, Sterecaulon alpinum, Salix polaris and Saxifraga oppositifolia were present at all four sites with rather high cover ratios, Silene acaulis was exclusive to Site 1 and the two bryophytes Thamnolia vermicularis cf. and Dicranella cf. were only recorded at Site 4. Tracheophyta exhibited a decline in abundance with increasing altitude (Suppl. Table S1), whereas lichen increased towards higher sites. In contrast, bryophyte distribution did not follow a clear gradient; instead, similar abundance patterns were observed between Sites 1 and 3, as well as between Sites 2 and 4. NMDS analysis along with PERMANOVA and ANOSIM significance tests, revealed the four sites to be representing different communities with temperature, pH, moisture content and nutrient as most important abiotic factors for explaining these differences (Figure 4).
3.3. Sequencing Overview
Metagenomic sequencing generated around 13.5 million initial reads per sample, of which 2.3% were removed after quality filtering (Suppl. Table S2). Approximately 0.2% of the quality-filtered reads consisted of rRNAs, which were used for taxonomic composition analyses.
3.4. Metagenomic Profile of the Biocrusts
Taxonomic classification of the 16S and 18S rRNA reads using the Silva database revealed a variety of taxa, with 89.2% of reads belonging to Bacteria, 6.6% to Eukaryota, 0.1% to Archaea and 3.8% unclassified (Figure 5). The highest proportion of bacterial reads (93%) was observed in Site 2, whereas Site 3 had the lowest number of bacterial reads (87%).
The dominant bacterial phyla were Actinobacteria and Proteobacteria. Actinobacteria dominated Site 1 (23.5% of total reads) and Site 2 (29% of total reads), while Proteobacteria dominated Site 3 (22.6% of total reads) and Site 4 (26.7% of total reads). Fungi were the dominant eukaryotic phyla at Sites 2, 3 and 4 (1.2, 4 and 3.1% of total reads, respectively), while Chloroplastida dominated Site 1 (3.4% of total reads). Analysis of fungal rRNA reads revealed a clear dominance of Ascomycota, accounting for up to 83% of fungal reads at Site 3 (Suppl. Figure S3a). Basidiomycota represented an average of 12% of fungal reads, while Mortierellomycota contributed approximately 9% of fungal reads. Functional guild analysis indicated a strong prevalence of saprotrophic fungi (30% of fungal reads at Sites 3 and 4) and lichenized fungi (23% of fungal reads at Site 2) (Suppl. Figure S3b). Additionally, 14 indicator taxa were identified (Suppl. Table S3a). Nine of these taxa were found at Site 3, belonging to Ascomycota (Epiglia, Sporoschismopsis, Rhytisma, Ascosphaera, Leotia, Ochrolechia, Umbilicaria) and Mucoromycota (Mortierella). Site 1 had two indicator taxa from Basidiomycota, while Site 4 had two indicator taxa from Ascomycota (Suppl. Table S3a).
NMDS analysis and ANOSIM significance test revealed significant similarities between the sites (Suppl. Figure S2), with Sites 1 and 3 displaying the greatest similarities. The similarities were driven by environmental parameters, particularly temperature, soil moisture, pH, total nitrogen and total phosphorus, and C/N ratio.
Sequences for photoautotrophic taxa were extracted from the 16S and 18S dataset, revealing that approximately 6% of all organisms recorded at the sites were classified as primary producers. Cyanobacteria were dominant at all sites, accounting for up to 84% of photoautotrophic reads, and were characterised by a non-significant increase in abundance with increasing altitude (Figure 6). In contrast, most algal groups, bryophytes and tracheophytes showed a trend of decreasing abundance at higher elevations. Site 2 exhibited a comparatively low abundance of eukaryotic photoautotrophic species (Figure 6). However, the green algae family Trebouxiophyceae showed a non-significant increase in abundance with increasing altitude from 4% to 8% of photoautotrophic reads, with the highest abundance at Site 3. A total of nine indicator species were identified among all photoautotrophic taxa, of which seven were identified as Cyanobacteria (Phormidium, Hormoscilla, Leptolyngbya and Loriellopsis) (Suppl. Table S3b).
Cyanobacterial species at all sites were predominantly composed of Pseudoanabaenales, accounting for up to 40% of the cyanobacterial population, followed by Nostocales and Gloeobacterales (Figure 7). In general, filamentous species dominated the cyanobacterial population with about 48% of cyanobacterial reads at Sites 1 and 2 and about 44% of cyanobacterial reads at Sites 3 and 4. Three unicellular orders Synechococclaes, Gloebacteriales and Chroococcodiopsiales were characterised by a steady increase in abundance from Site 1 (21% of cyanobacterial reads) to Site 4 (34% of cyanobacterial reads) (Figure 7). Heterocystous cyanobacteria (Nostocales) showed the highest abundance at Site 1 (25.5% of cyanobacterial reads), while the lowest abundance was observed at Sites 2 and 4 with about 15% of cyanobacterial reads (Figure 7). Furthermore, the taxa Nostoc sp., Petalonema sp. and Scytonema sp. were characterised by the highest abundances, averaging 4.5, 4 and 3.3% of cyanobacterial reads, respectively, across all sites. Overall, Gloeobacter sp., belonging to the order Gloeobacterales, was the most dominant species, with an abundance of up to 23.6% of cyanobacterial reads at Site 3 and approximately 9.7% of cyanobacterial reads at Sites 1,2 and 4.
4. Discussion
Environmental Conditions
The temperature data recorded at the four sites did not show a consistent decrease with increasing altitude. While Site 4 had significantly colder temperatures, the other three sites varied, with Site 2 being the warmest and Sites 1 and 3 showing intermediate values. Notably, another study conducted in Svalbard reported a similar temperature pattern across an altitudinal gradient during the summer season, while a clear decline in temperature was observed at higher elevations during the winter months [17]. This variation is likely due to geographical and topographical influences at the selected altitudes, suggesting that the altitude effect between Sites 1 and 4 may have been partly overridden by local spatial or seasonal factors. Meteorological data from the Ny-Ålesund station indicated that local wind patterns and intensities probably influenced the recorded temperatures at the different sites. On 16 July 2023, when wind speeds were low, temperatures were warmer at all sites. However, as the wind increased on 17 July 2023, temperatures dropped sharply, especially at Site 4, which was the most exposed due to its geographical characteristics. Temperature readings above the soil surface (T3) and at the soil surface (T2) showed strong daily variations due to direct exposure to environmental conditions. T3, which recorded the coldest temperatures and the greatest variations, was particularly affected by wind and solar radiation. In contrast, soil surface temperatures (T2) tended to be warmer, benefiting from the insulation provided by plant cover, solar absorption and reduced wind exposure [18,19]. Temperatures below the surface (T1) were more stable, as vegetation and soil acted as insulation, reducing sudden temperature changes [18,20].
While it is generally accepted that temperatures decrease with altitude, soil moisture is more dependent on specific local conditions [21,22,23]. Warmer temperatures promote soil evaporation, while cooler temperatures reduce it, allowing moisture to accumulate [22]. This pattern was evident in our data, with Site 4, the coldest site, having the highest soil moisture, and Site 2, the warmest site, having the lowest. In addition, higher elevations tend to receive more precipitation, which contributes to increased soil moisture. However, the study sites did not show a clear pattern of rainfall related moisture accumulation. In regions with low precipitation, alternative sources of water such as dew formation become important. Dew forms when temperatures fall below the dew point [24], and although the calculated dew points were based on data from the Ny-Ålesund weather station and may not be entirely accurate for the study sites, they were in good agreement with the measured soil moisture values, potentially reinforcing the existing environmental conditions.
Analysis of soil chemistry indicated no distinct altitudinal gradient. Instead, similarities were observed between Sites 1 and 3, as well as between Sites 2 and 4. pH values at all sites ranged from neutral to slightly acidic, which is consistent with previous studies in Svalbard [17,25]. The nutrient content generally followed an elevational pattern, with carbon and nitrogen levels increasing at higher elevations, while phosphorus content showed a slight decrease. However, this trend was less apparent at Site 3, which exhibited different nutrient characteristics compared to the other sites [21,26]. Rocks at these higher elevations can act as nitrogen hotspots by intercepting nutrient-rich precipitation [27], which may explain the elevated nitrogen levels at the rockier, higher elevation sites. In addition, colder temperatures at higher elevations slow microbial decomposition, allowing carbon and nitrogen to accumulate in the soil [26]. The C/N ratio, a common indicator of organic matter decomposition, provided further insight into nutrient dynamics. A C/N ratio of 18, as recorded at Site 3, may indicate some degree of nitrogen limitation and potentially reduced microbial activity [28]. However, since soils with C/N ratios below 20 are generally considered nutrient-sufficient, it is unlikely that severe nutrient competition between plants and microbes is occurring at these sites [28]. Site 4, with the highest soil moisture and probably the greatest exposure to precipitation and dew formation, may benefit from nutrient inputs via rainwater, with runoff potentially enriching the lower sites over time. However, the unexpectedly low nutrient content at Site 3 challenges this assumption and suggests more complex, unexplored factors influencing nutrient distribution. This variation suggests that additional variables, such as subtle shifts in community composition, geological conditions, plant-microbe interactions or specific soil characteristics, may play an important role in shaping the nutrient profile at this site.
Vegetation Reacts to Increased Altitude
The vegetation analysis carried out at the four sites showed a general decline in ground cover with increasing altitude, along with distinct patterns between species groups, as generally observed and well-studied for mountains.
Larger vascular plants (Tracheophyta) decreased in abundance with increasing altitude. Dryas octopetala, Saxifraga oppositifolia and Salix polaris were the most common species found at all four sites, highlighting their adaptability to different habitats. D. octopetala and S. oppositifolia often coexist and dominate a variety of environments in Svalbard [29]. S. polaris, which is also widespread in Svalbard, typically grows close to the ground and forms wide, spreading mats [30]. This growth pattern is common to many tracheophytes growing in Arctic tundra regions, including D. octopetala, S. oppositifolia, Cassipope tetragona, Salix reticulata and Silene acaulis. However, S. acaulis is always restricted to the lower regions of the hills and mountains that make up the terrestrial habitats of Svalbard (reference). These mat or cushion structures help protect the plants from harsh environmental conditions by trapping heat during cold periods and cooling the air in summer, thereby creating microclimates [31,32]. Another common adaptation is the growth of creeping or dwarf shrubs, which keep plants low to the ground, reducing exposure to strong winds [31,33], as seen in D. octopetala, S. polaris and S. reticulata.
Bryophytes were the most abundant at Sites 2 and 4. A similar pattern was observed in the distribution of total nitrogen and total carbon, pH and carbon/nitrogen ratio, as well as temperature and soil moisture data. Previous studies of bryophytes in the Svalbard region have shown that their abundance tends to increase with altitude, a pattern that is consistent with our results, as Sites 2 and 4 had the highest number of bryophyte species [34]. Although Site 2 may seem contradictory, Prestø’s study also indicated that bryophytes are abundant in dry habitats. This is due to their ability to absorb water and nutrients over their entire surface area, eliminating the need for a complex root system [34]. As Site 2 was the driest surveyed site, this may explain the presence of a large number of bryophytes.
Lichen species increased in abundance with altitude, accompanied by higher ground cover. A total of four lichen species were recorded across all sites, but only two could be identified as Flavocetraria nivalis and Sterecaulon alpinum. Along with cyanobacteria, eukaryotic algae and bryophytes, lichens are one of the major components of biocrusts [4,5]. However, the identification of lichen species proved to be challenging and the metagenomic data could only provide limited species information for these two lichens.
Microbial Community Composition in Arctic Biocrusts
The eukaryotic community composition at all sites was dominated by Chloroplastida and Fungi, which is consistent with previous research in Svalbard [35]. Chloroplastida are crucial for the composition of biocrusts due to their photosynthetic capabilities. In addition, the relatively high abundance of bryophytes within the eukaryotic groups is typical of Arctic tundra in this region [1]. The bacterial community in biocrusts was dominated by Proteobacteria and Actinobacteria at all sites. Although small variations in composition were observed between sites, the overall ratio of bacterial phyla remained relatively stable. This pattern is consistent with findings from studies of biocrusts under different environmental conditions [2,6].
Photoautotrophic species such as green algae, lichens, bryophytes and cyanobacteria are commonly abundant in biocrusts [4]. Across all sites, biocrusts exhibited a high diversity of green algae from classes such as Trebouxiophyceae, Chlorophyceae and Chrysophyceae, which were the most prominent among eukaryotic algae. While most green algal classes decreased in abundance with increasing altitude, Trebouxiophyceae followed the opposite trend, becoming more abundant at higher altitudes, except at Site 2. This pattern is likely driven by the well-documented symbiotic associations between these taxa and lichens [2,8], linking their increased abundance to the presence of lichen species. At Site 4 (314 m a.s.l.), where lichen-dominated biocrusts are prominent, this trend is further supported by the high abundance of Proteobacteria and Cyanobacteria, which are typically more prevalent in lichen-rich environments [36]. Further analysis of fungal guilds highlighted the prominence of lichen-dominated biocrusts at Sites 2 and 4, where lichenized fungi reached their highest abundance. The Ascomycota fungus Verrucaria was the most abundant overall, known for its symbiotic associations with green algae from the Trebouxiophyceae and Ulvophyceae taxa [37]. Trebouxiophyceae, in particular, showed elevated abundances at Site 4. Umbilicaria, a lichen species commonly found on rocks at higher elevations in Arctic climates [38,39], also exhibited increased reads, particularly at Site 3. Its photobiont, the green algae Trebouxia sp. [39], mirrored this trend, thereby supporting the known ecological association between them.
The photoautotrophic community composition at all sites was dominated by cyanobacteria, consistent with previous research highlighting their role as early colonisers, soil stabilisers and key components of biocrusts [2,4]. In contrast, bryophytes and eukaryotic green algae typically appear at later stages of biocrust development. This suggests that Sites 1 and 3 may represent more advanced stages of biocrust formation, as they had the highest abundance of these later successional groups [2,5].
The cyanobacterial community was dominated by the orders Pseudoanabaenales, Gloeobacterales and Nostocales. Filamentous species like Leptolyngbya sp., identified as an indicator species at Sites 2 and 4, play a crucial role in soil stabilization. Through the secretion of sticky extracellular polymeric substances (EPS), they promote the aggregation of soil particles, providing the basis for biocrust development [3,40]. These cyanobacteria are often dominant within biocrusts and contribute significantly to their formation and stability [41]. The order Nostocales, which includes heterocystous species such as Nostoc sp., was relatively abundant across all four sites. Heterocystous cyanobacteria are capable of fixing atmospheric nitrogen, thereby supplying essential nutrients to other soil organisms [6]. Nostoc sp. is commonly found in high abundance within Arctic biocrusts and contributes significantly to primary production [1]. Additionally, Nostoc sp. tends to thrive in habitats with elevated moisture levels [42], consistent with its high abundance at Site 4, where the highest soil moisture was recorded. Previous research has shown that while the diversity of cyanobacteria is not affected by altitude, their overall abundance tends to increase at higher altitudes [43,44]. Cyanobacteria are well adapted to more challenging conditions due to their rapid metabolic rates, resilience to water shortages, and ability to withstand extreme temperature fluctuations [44,45]. These findings are consistent with our observations, as cyanobacterial community composition showed little variation between sites, but their overall abundance increased with altitude.
Overall, the observed changes in photoautotrophic communities appear to offset each other, as no significant changes in total chlorophyll a concentration were observed at the different sites, suggesting that the rate of primary production was very similar for all sites. In agreement with this, measurements of photosynthetic capacity using a field PAM showed no differences between sites.
Although the overall community composition did not show a clear correlation with the altitudinal gradient, the abundance of different phyla reflected the environmental conditions at each site, which were influenced by the different altitudes. Previous studies have highlighted that bacterial composition is particularly sensitive to pH, with neutral soils supporting higher bacterial diversity [6,46]. The highest bacterial diversity was observed at Sites 2 and 4, both characterised by pH values close to 7. Furthermore, lower pH values were associated with a higher abundance of Acidobacteria, whereas Proteobacteria were more abundant in near-neutral soils [47]. This is consistent with our results, as Proteobacteria dominated at Sites 2 and 4, where pH levels were close to 7. Our NMDS analysis further confirmed that environmental factors such as temperature, moisture, pH, nitrogen and phosphorus content significantly influenced the community composition.
5. Conclusion
Biocrusts are essential to Arctic tundra ecosystems, supporting a wide range of organisms and contributing to key ecological processes. Given the complex roles of species within biocrusts, a complete understanding of their interactions remains a challenge. This study focused on the community composition of photoautotrophic organisms, with particular attention to cyanobacteria and eukaryotic photoautotrophs. Although elevation did not directly emerge as a dominant factor influencing microbial communities, environmental conditions played a critical role in shaping variation. The bacterial community was primarily shaped by shifts in pH, whereas the abundance of eukaryotic organisms, including vascular plants, was particularly responsive to broader environmental factors. These results highlight the complexity of Arctic biocrust micro-ecosystems and the significant influence of specific environmental conditions on their structure and function.
Supplementary Materials
The following supporting information can be downloaded at the website of this paper posted on Preprints.org. Figure S1: Wind velocity measured at Ny-Ålesund station; Figure S2: Non-Metric Multidimensional Scaling (NMDS) plot based on relative abundances of DNA sequences; Figure S3: Relative abundance of fungal taxa and fungal functional guilds across sites; Tabe S1: Overview of the vegetation analysis, Table S2: Metagenomic dataset sequencing overview; Table S3: List of fungal and photoautotrophic indicator taxa.
Author Contributions
Isabel Mas Martinez: Laboratory experiments, Formal analysis, Investigation, Methodology, Validation, Visualization, Writing - original draft. Ekaterina Pushkareva: Conceptualization, Sampling, Supervision of analysis, Methodology, Writing - review & editing; Leonie Keilholz: Vegetation analysis; Karl-Heinz Linne von Berg: Vegetation analysis; Ulf Karsten: Soil analysis, Writing - review & editing; Sandra Kammann: Soil analysis; Burkhard Becker: Conceptualization, Data analysis, Funding acquisition, Project administration, Supervision, Writing - review & editing. All authors have read and agreed to the published version of the manuscript.
Funding
This research was supported by the Alfred Wegener Institute, project number KOS175.
Data Availability Statement
All sequence reads were submitted to the NCBI database project number PRJNA1189472.
Acknowledgments
The authors would like to express their gratitude to the personnel at the AWIPEV Arctic Research Base for their support during our visits to Ny-Alesund in 2023. We are also grateful to the soil science group of Prof. Peter Leinweber at the University of Rostock for their technical and analytical support.
Conflicts of Interest
The authors declare no conflicts of interest.
References
- Pushkareva, E.; Elster, J.; Holzinger, A.; Niedzwiedz, S.; Becker, B. Biocrusts from Iceland and Svalbard: Does microbial community composition differ substantially? Frontiers in Microbiology 2022, 13, 1048522. [Google Scholar] [CrossRef] [PubMed]
- Belnap, J.; Lange, O.L. Biological Soil Crusts: Structure, Function, and Management; Springer Berlin Heidelberg: Berlin, Heidelberg, 2003. [Google Scholar]
- Weber, B.; Belnap, J.; Büdel, B.; Antoninka, A.J.; Barger, N.N.; Chaudhary, V.B.; Darrouzet-Nardi, A.; Eldridge, D.J.; Faist, A.M.; Ferrenberg, S.; et al. What is a biocrust? A refined, contemporary definition for a broadening research community. Biological Reviews 2022, 97, 1768–1785. [Google Scholar] [CrossRef] [PubMed]
- Rippin, M.; Lange, S.; Sausen, N.; Becker, B. Biodiversity of biological soil crusts from the Polar Regions revealed by metabarcoding. FEMS Microbiology Ecology 2018, 94. [Google Scholar] [CrossRef] [PubMed]
- Weber, B.; Büdel, B.; Belnap, J. Biological Soil Crusts: An Organizing Principle in Drylands; Springer International Publishing: Cham, 2016. [Google Scholar]
- Malard, L.A.; Pearce, D.A. Microbial diversity and biogeography in Arctic soils. Environmental Microbiology Reports 2018, 10, 611–625. [Google Scholar] [CrossRef]
- Zielke, M.; Ekker, A.S.; Olsen, R.A.; Spjelkavik, S.; Solheim, B. The Influence of Abiotic Factors on Biological Nitrogen Fixation in Different Types of Vegetation in the High Arctic, Svalbard. Arctic, Antarctic, and Alpine Research 2002, 34, 293–299. [Google Scholar] [CrossRef]
- Muggia, L.; Nelsen, M.P.; Kirika, P.M.; Barreno, E.; Beck, A.; Lindgren, H.; Lumbsch, H.T.; Leavitt, S.D. Formally described species woefully underrepresent phylogenetic diversity in the common lichen photobiont genus Trebouxia (Trebouxiophyceae, Chlorophyta): An impetus for developing an integrated taxonomy. Molecular Phylogenetics and Evolution 2020, 149, 106821. [Google Scholar] [CrossRef]
- Liengen, T.; Olsen, R.A. Seasonal and site-specific variations in nitrogen fixation in a high arctic area, Ny-Ålesund, Spitsbergen. Can. J. Microbiol. 1997, 43, 759–769. [Google Scholar] [CrossRef]
- Norwegian Meteorological Institute and NRK. Today’s weather forecast for your location. Available online: https://www.yr.no/en (accessed on 16 August 2024).
- Uni of Lapland. Arctic Region. Available online: https://www.arcticcentre.org/EN/arcticregion (accessed on 16 August 2024).
- Norwegian Polar Institute. Norsk Polarinstitutt. Available online: https://www.npolar.no/ (accessed on 16 August 2024).
- Bolger, A.M.; Lohse, M.; Usadel, B. Trimmomatic: A flexible trimmer for Illumina sequence data. Bioinformatics 2014, 30, 2114–2120. [Google Scholar] [CrossRef]
- Kopylova, E.; Noé, L.; Touzet, H. SortMeRNA: Fast and accurate filtering of ribosomal RNAs in metatranscriptomic data. Bioinformatics 2012, 28, 3211–3217. [Google Scholar] [CrossRef]
- Wood, D.E.; Salzberg, S.L. Kraken: Ultrafast metagenomic sequence classification using exact alignments. Genome Biol. 2014, 15, R46. [Google Scholar] [CrossRef]
- J. Oksanen; F.G. Blanchet; R. Kindt; P. Legendre; H. Wagner. Vegan: Community Ecology Package, 2015.
- Kotas, P.; Šantrůčková, H.; Elster, J.; Kaštovská, E. Soil microbial biomass, activity and community composition along altitudinal gradients in the High Arctic (Billefjorden, Svalbard). Biogeosciences 2018, 15, 1879–1894. [Google Scholar] [CrossRef]
- Molnar, P. Differences between soil and air temperatures: Implications for geological reconstructions of past climate. Geosphere 2022, 18, 800–824. [Google Scholar] [CrossRef]
- James. Is Soil Temperature Warmer Than Air? SoilThermometer.com [Online], March 26, 2023. Available online: https://soilthermometer.com/is-soil-temperature-warmer-than-air/ (accessed on 12 September 2024).
- Cheng, Q.; Zhang, M.; Jin, H.; Ren, Y. Spatiotemporal variation characteristics of hourly soil temperature in different layers in the low-latitude plateau of China. Front. Environ. Sci. 2022, 10, 1091985. [Google Scholar] [CrossRef]
- Mangral, Z.A.; Islam, S.U.; Tariq, L.; Kaur, S.; Ahmad, R.; Malik, A.H.; Goel, S.; Baishya, R.; Barik, S.K.; Dar, T.U.H. Altitudinal gradient drives significant changes in soil physico-chemical and eco-physiological properties of Rhododendron anthopogon: A case study from Himalaya. Front. For. Glob. Change 2023, 6, 1181299. [Google Scholar] [CrossRef]
- Pellet, C.; Hauck, C. Monitoring soil moisture from middle to high elevation in Switzerland: Set-up and first results from the SOMOMOUNT network. Hydrol. Earth Syst. Sci. 2017, 21, 3199–3220. [Google Scholar] [CrossRef]
- Yan, J.; Tong, M.; Liu, J.; Li, J.; Li, H. Temperature and moisture sensitivities of soil respiration vary along elevation gradients: An analysis from long-term field observations. Sci. Total Environ. 2024, 912, 169150. [Google Scholar] [CrossRef]
- Agam, N.; Berliner, P.R. Dew formation and water vapor adsorption in semi-arid environments—A review. Journal of Arid Environments 2006, 65, 572–590. [Google Scholar] [CrossRef]
- Pushkareva, E.; Pessi, I.S.; Wilmotte, A.; Elster, J. Cyanobacterial community composition in Arctic soil crusts at different stages of development. FEMS Microbiology Ecology 2015, 91. [Google Scholar] [CrossRef]
- Zhang, Y.; Ai, J.; Sun, Q.; Li, Z.; Hou, L.; Song, L.; Tang, G.; Li, L.; Shao, G. Soil organic carbon and total nitrogen stocks as affected by vegetation types and altitude across the mountainous regions in the Yunnan Province, south-western China. CATENA 2021, 196, 104872. [Google Scholar] [CrossRef]
- Göransson, H.; Edwards, P.J.; Perreijn, K.; Smittenberg, R.H.; Olde Venterink, H. Rocks create nitrogen hotspots and N:P heterogeneity by funnelling rain. Biogeochemistry 2014, 121, 329–338. [Google Scholar] [CrossRef]
- Amelung, W.; Blume, H.-P.; Fleige, H.; Horn, R.; Kandeler, E.; Kögel-Knabner, I.; Kretzschmar, R.; Stahr, K.; Wilke, B.-M. Scheffer/Schachtschabel Lehrbuch der Bodenkunde, Seventeenth edition; Springer Spektrum: Berlin, Heidelberg, 2018; ISBN 9783662558713. [Google Scholar]
- Svalbardflora. Svalbard Flora. Available online: https://svalbardflora.no/ (accessed on 23 November 2024).
- Lee, Y.K. Arctic Plants of Svalbard: What We Learn from the Green in the Treeless White World; Springer International Publishing AG: Cham, 2020; ISBN 9783030345600. [Google Scholar]
- Rønning, O.I. The flora of Svalbard; Norsk Polarinstitutt: Oslo, 1996; ISBN 8276661009. [Google Scholar]
- Plants in Alpine Regions: Cell Physiology of Adaption and Survival Strategies; Lütz, C., Ed.; Springer Vienna: Vienna, 2012; ISBN 9783709101360. [Google Scholar]
- Gehrke, B.; Kandziora, M.; Pirie, M.D. The evolution of dwarf shrubs in alpine environments: A case study of Alchemilla in Africa. Ann. Bot. 2016, 117, 121–131. [Google Scholar] [CrossRef] [PubMed]
- Prestø, T.; Lüth, M.; Hassel, K. Bryophytes of the Longyearbyen area, 2014.
- Pushkareva, E.; Elster, J.; Kudoh, S.; Imura, S.; Becker, B. Microbial community composition of terrestrial habitats in East Antarctica with a focus on microphototrophs. Frontiers in Microbiology 2023, 14, 1323148. [Google Scholar] [CrossRef] [PubMed]
- Tian, C.; Pang, J.; Bu, C.; Wu, S.; Bai, H.; Li, Y.; Guo, Q.; Siddique, K.H.M. The Microbiomes in Lichen and Moss Biocrust Contribute Differently to Carbon and Nitrogen Cycles in Arid Ecosystems. Microb. Ecol. 2023, 86, 497–508. [Google Scholar] [CrossRef]
- Thüs, H.; Muggia, L.; Pérez-Ortega, S.; Favero-Longo, S.E.; Joneson, S.; O’Brien, H.; Nelsen, M.P.; Duque-Thüs, R.; Grube, M.; Friedl, T.; et al. Revisiting photobiont diversity in the lichen family Verrucariaceae (Ascomycota). European Journal of Phycology 2011, 46, 399–415. [Google Scholar] [CrossRef]
- Wang, Y.; Li, R.; Wang, D.; Qian, B.; Bian, Z.; Wei, J.; Wei, X.; Xu, J.-R. Regulation of symbiotic interactions and primitive lichen differentiation by UMP1 MAP kinase in Umbilicaria muhlenbergii. Nat. Commun. 2023, 14, 6972. [Google Scholar] [CrossRef] [PubMed]
- He, Z.; Naganuma, T.; Faluaburu, M.S.; Nakai, R.; Kanda, H.; Uchida, M.; Imura, S.; Hahn, M.W. Bacterial phylotypes associated with rock-dwelling Umbilicaria Lichens from Arctic/Subarctic areas in North America and Northern Europe. Polar Biol 2024. [Google Scholar] [CrossRef]
- Mugnai, G.; Rossi, F.; Mascalchi, C.; Ventura, S.; de Philippis, R. High Arctic biocrusts: Characterization of the exopolysaccharidic matrix. Polar Biol 2020, 43, 1805–1815. [Google Scholar] [CrossRef]
- Williams, L.; Loewen-Schneider, K.; Maier, S.; Büdel, B. Cyanobacterial diversity of western European biological soil crusts along a latitudinal gradient. FEMS Microbiology Ecology 2016, 92. [Google Scholar] [CrossRef]
- Pushkareva, E.; Hejduková, E.; Elster, J.; Becker, B. Microbial response to seasonal variation in arctic biocrusts with a focus on fungi and cyanobacteria. Environ. Res. 2024, 263, 120110. [Google Scholar] [CrossRef]
- Pushkareva, E.; Elster, J. Biodiversity and ecological classification of cryptogamic soil crusts in the vicinity of Petunia Bay, Svalbard. Czech Polar Rep. 2013, 3, 7–18. [Google Scholar] [CrossRef]
- Janatková, K.; Reháková, K.; Doležal, J.; Simek, M.; Chlumská, Z.; Dvorský, M.; Kopecký, M. Community structure of soil phototrophs along environmental gradients in arid Himalaya. Environ. Microbiol. 2013, 15, 2505–2516. [Google Scholar] [CrossRef] [PubMed]
- Pushkareva, E.; Johansen, J.R.; Elster, J. A review of the ecology, ecophysiology and biodiversity of microalgae in Arctic soil crusts. Polar Biol 2016, 39, 2227–2240. [Google Scholar] [CrossRef]
- Tian, Q.; Jiang, Y.; Tang, Y.; Wu, Y.; Tang, Z.; Liu, F. Soil pH and Organic Carbon Properties Drive Soil Bacterial Communities in Surface and Deep Layers Along an Elevational Gradient. Frontiers in Microbiology 2021, 12, 646124. [Google Scholar] [CrossRef] [PubMed]
- Männistö, M.K.; Tiirola, M.; Häggblom, M.M. Bacterial communities in Arctic fjelds of Finnish Lapland are stable but highly pH-dependent. FEMS Microbiology Ecology 2007, 59, 452–465. [Google Scholar] [CrossRef]
Figure 1.
Geographical location of sampling sites on Ossian Sarsfjellet, Svalbard. (A) - Red arrow indicates the location of Ossian Sarsfjellet and the red star indicates the location of the weather station in Ny-Ålesund in the Kongsfjorden area. (B) - Red circles indicate the sampling sites. Maps based on TopoSvalbard courtesy of the Norwegian Polar Institute.
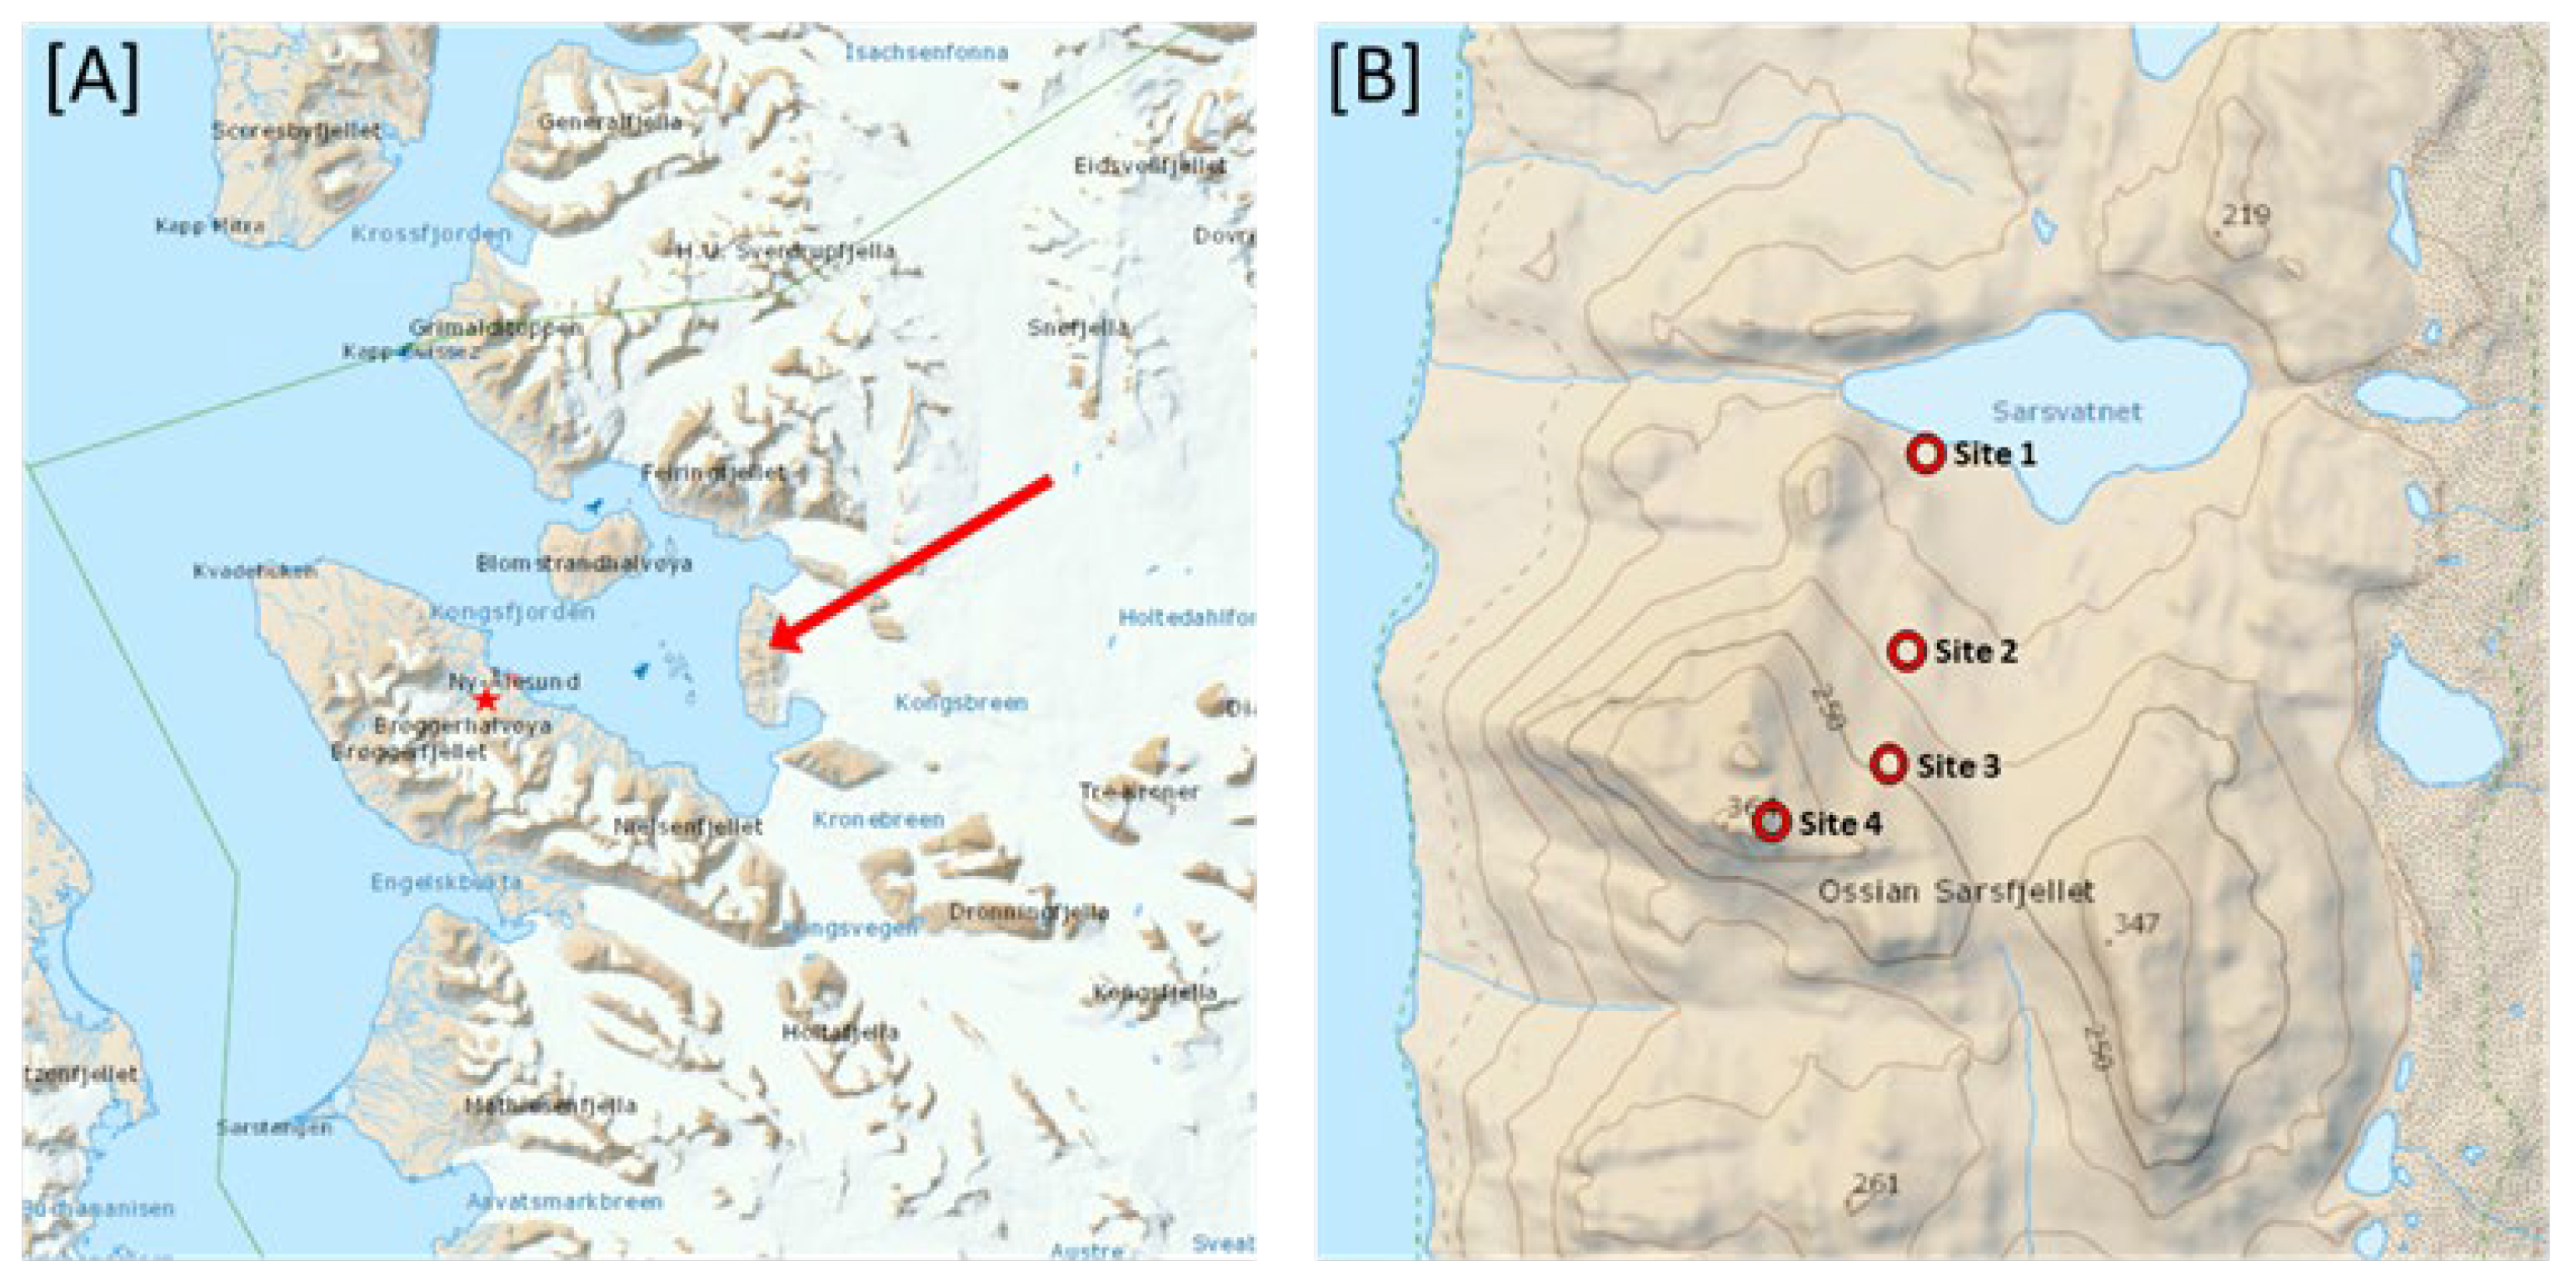
Figure 2.
Temperature data from 13.07.2023 to 04.08.2023 at the three different measurement points across the four sites. T1 = measured 6 cm below the soil surface; T2 = measured at the soil surface; T3 = measured 15 cm above the soil surface; Measurement every 15 minutes; Measured with TOMST® data loggers.
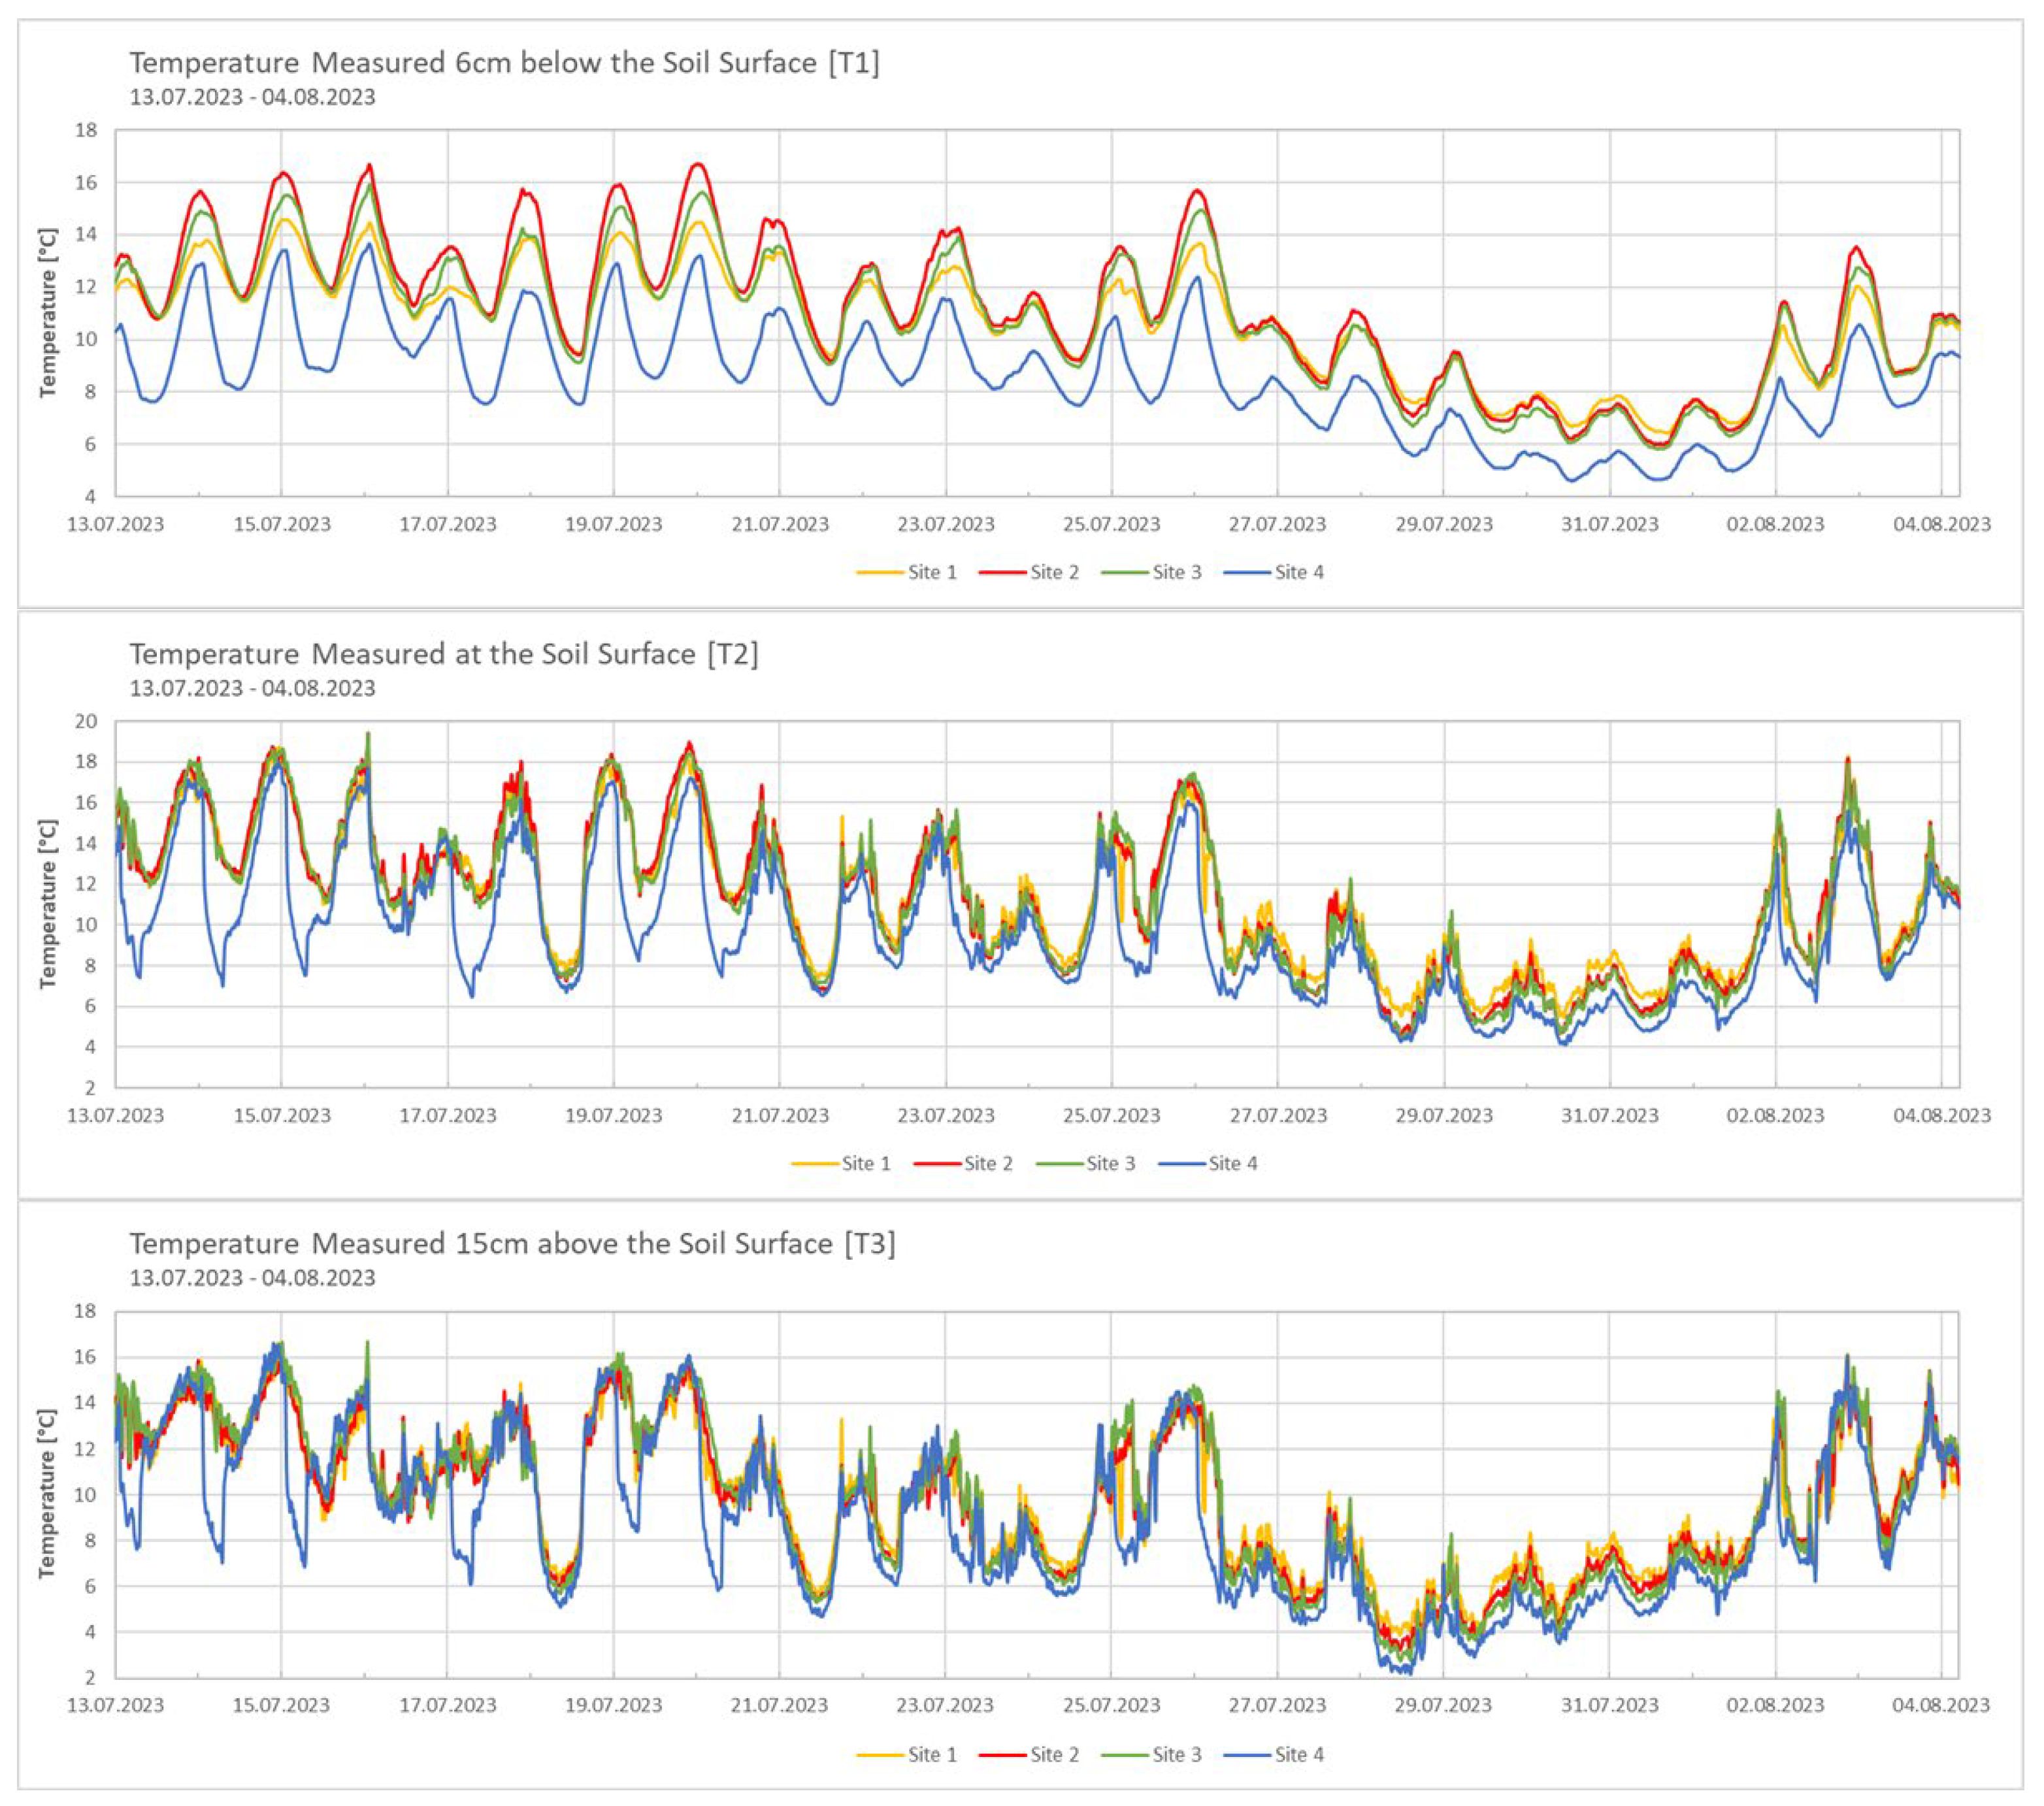
Figure 3.
Soil moisture data from 13.07.2023 to 20.08.2023 across the sites. Measured every 15 minutes; Measured with TOMST® data loggers, significant differences observed between all four sites; p-value < 0.05. Data used for statistical analysis are from 13 July 2023 to 4 August 2023 only.
Figure 3.
Soil moisture data from 13.07.2023 to 20.08.2023 across the sites. Measured every 15 minutes; Measured with TOMST® data loggers, significant differences observed between all four sites; p-value < 0.05. Data used for statistical analysis are from 13 July 2023 to 4 August 2023 only.
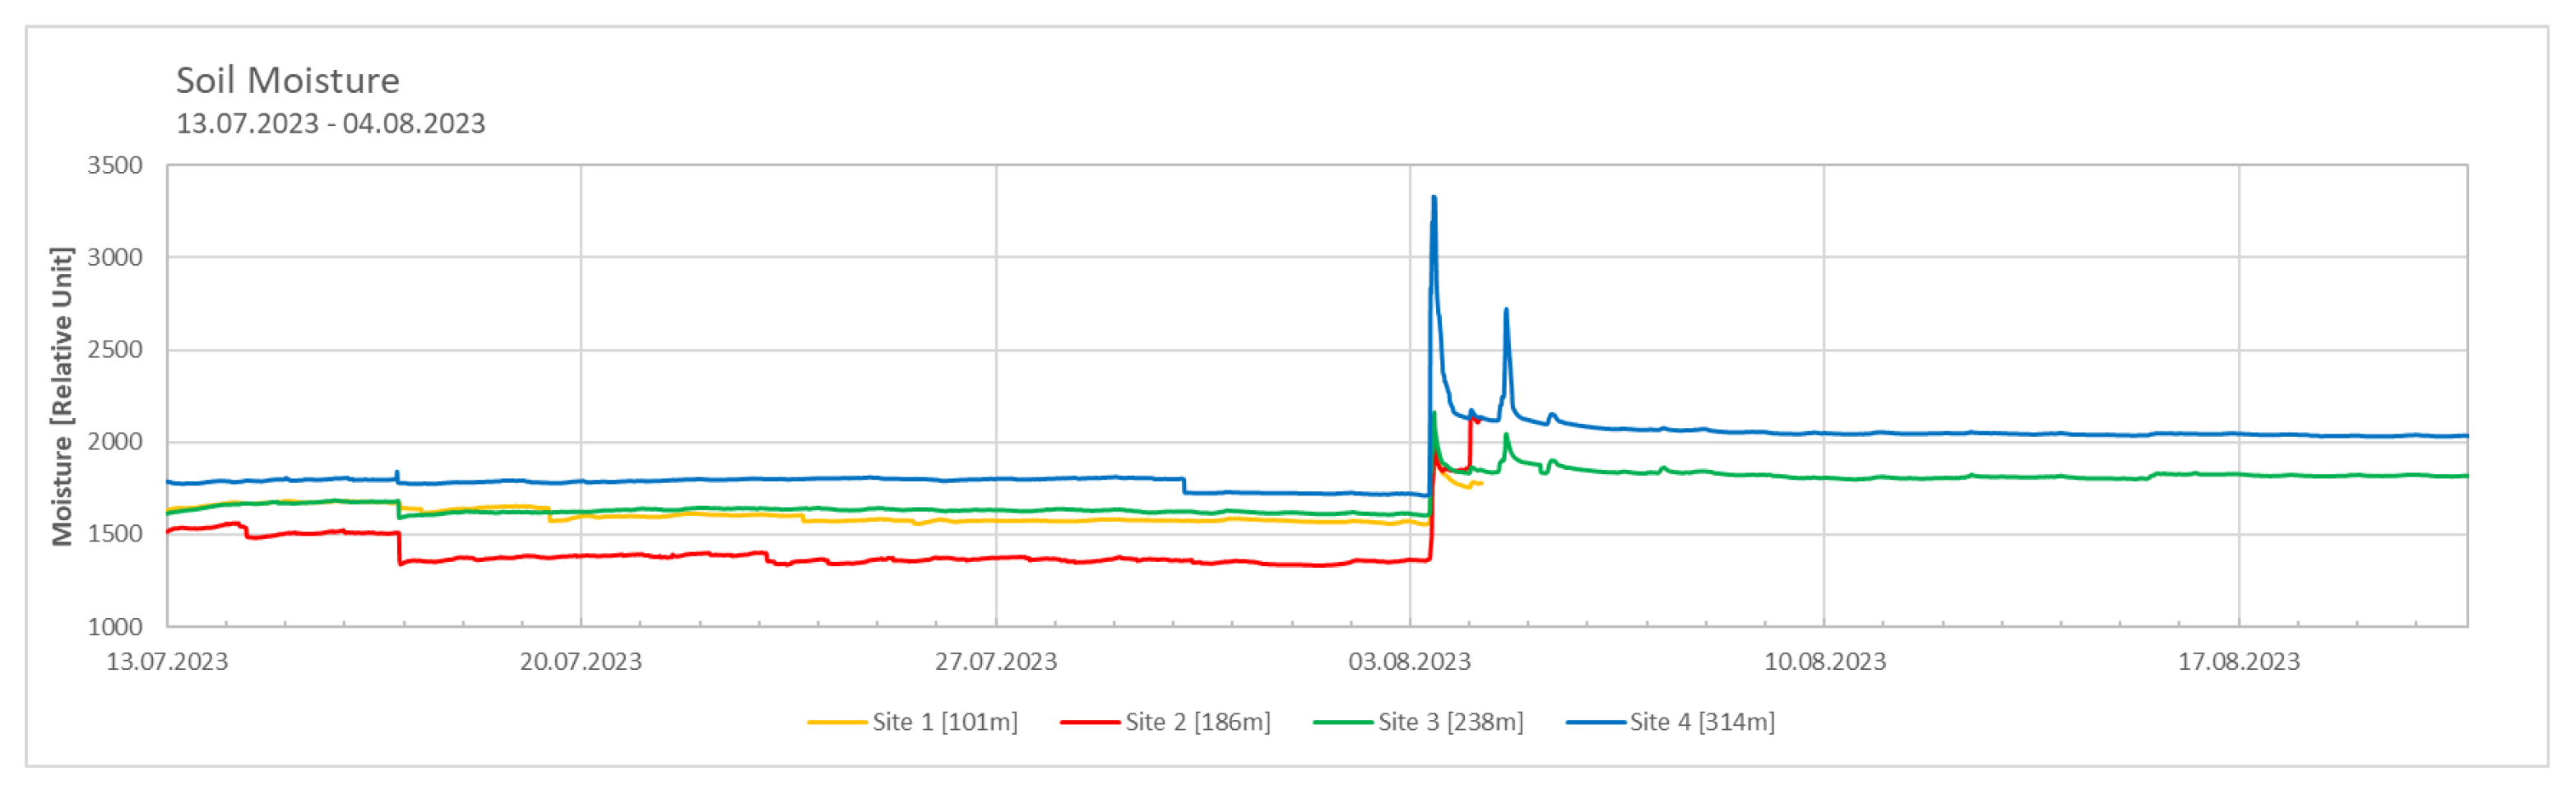
Figure 4.
Non-Metric Multidimensional Scaling (NMDS) plot based on the vegetation analysis conducted at the sites. T1 = Temperature measured 6 cm below the soil surface; T2 = Temperature measured at the soil surface; T3 = Temperature measured 15 cm above the soil surface; C.N = Carbon to nitrogen ratio; Parameters which did not show significant differences between the sites are not included, p-value < 0.05.
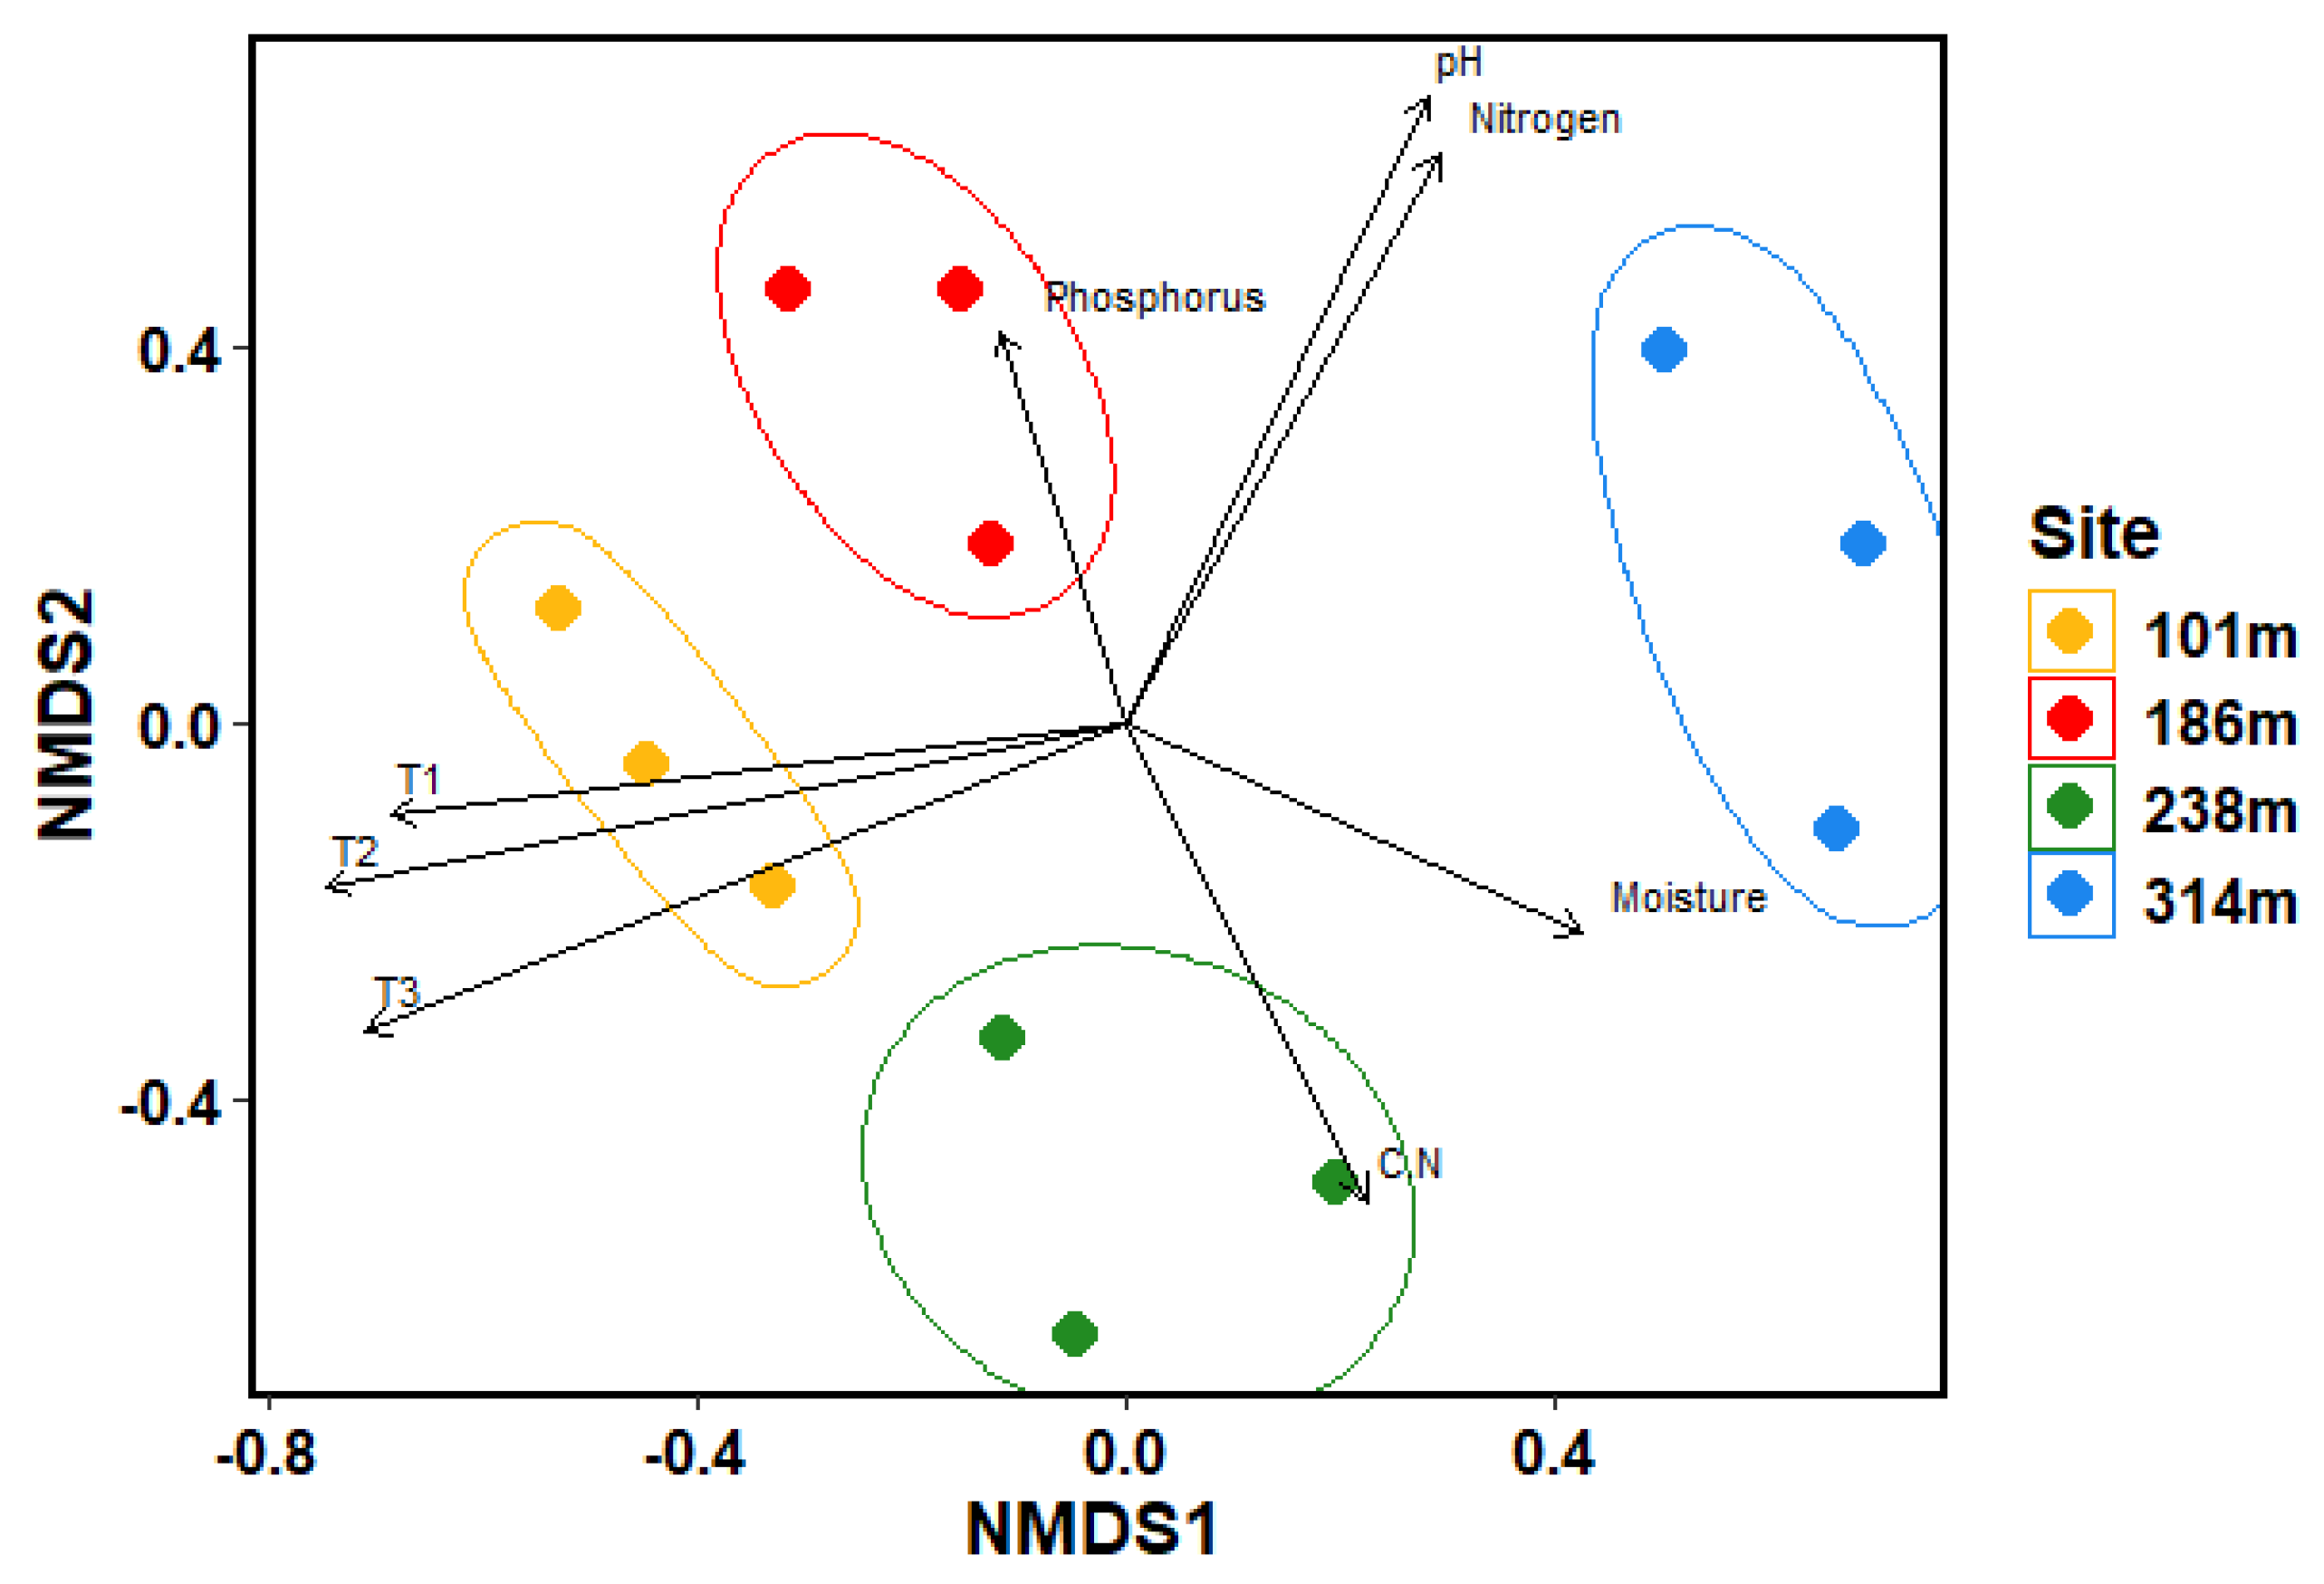
Figure 5.
Overall community composition across sites. Metagenomic 16/18 S rRNA data set analysed using Silva software; taxonomic groups with total abundance below the 0.5% threshold are grouped as ‘low abundance’; * indicates significant differences between sites based on one-way ANOVA, p-value < 0.05.
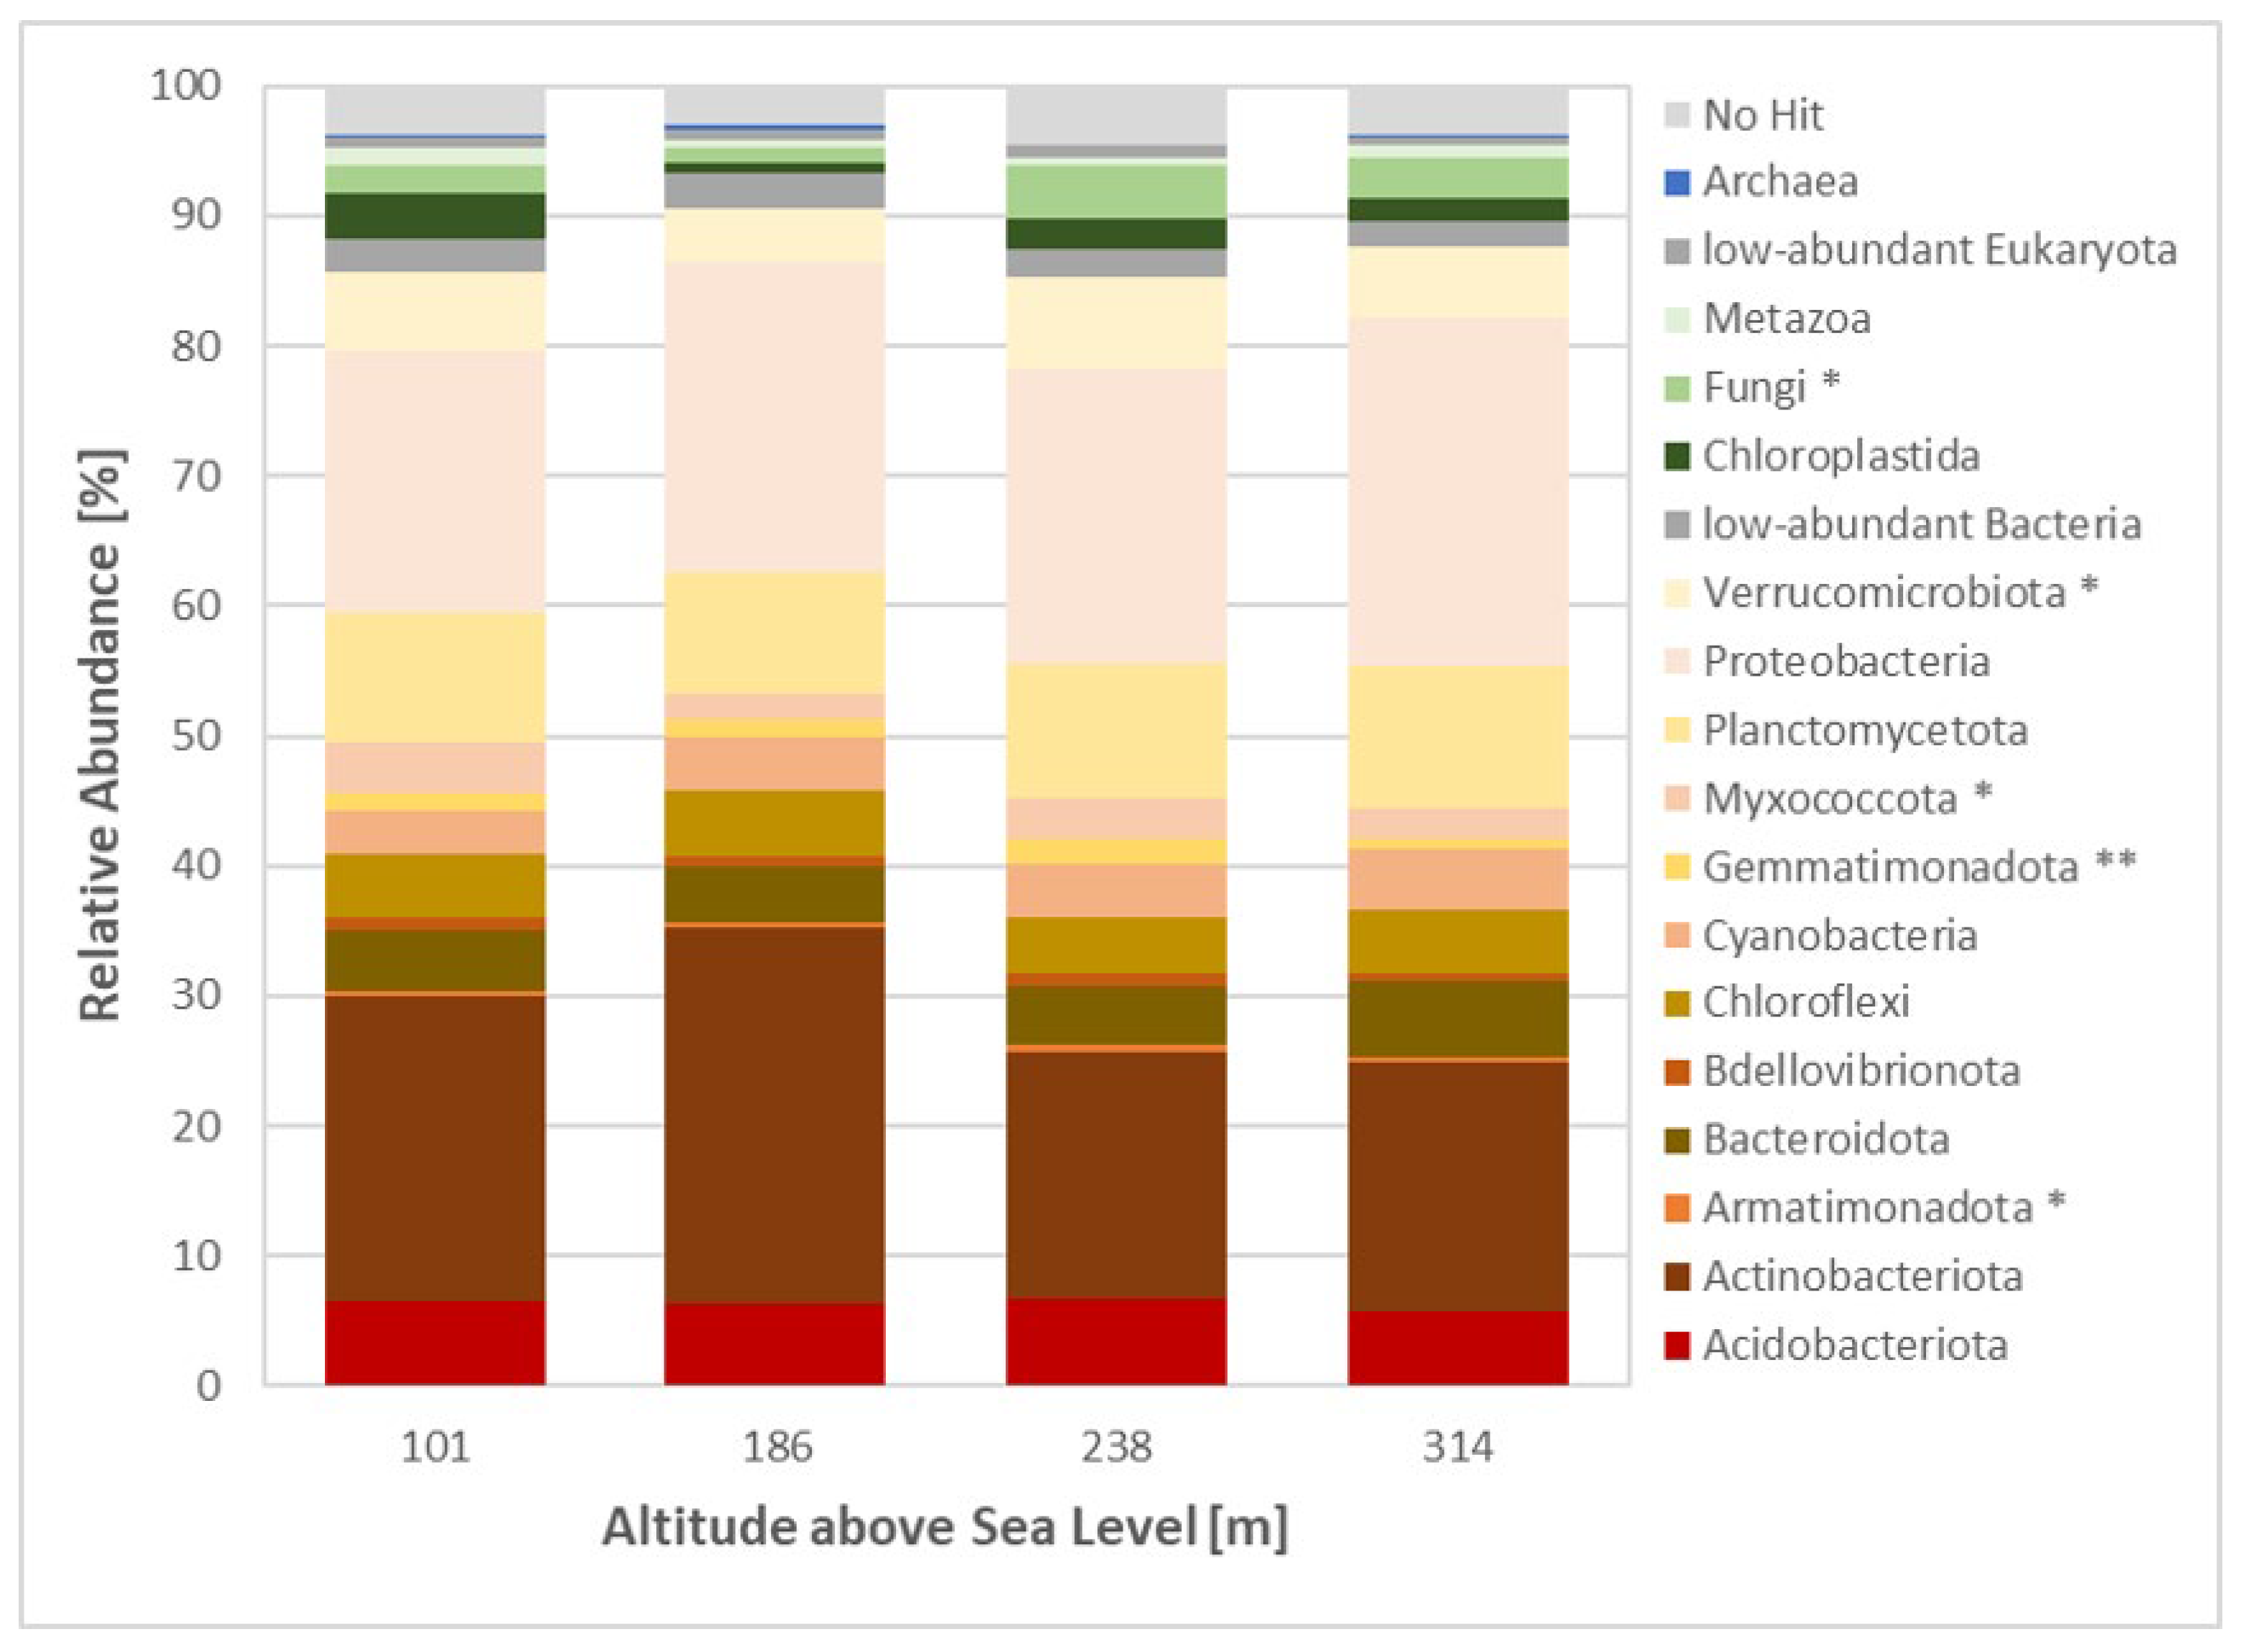
Figure 6.
Relative abundance of photoautotrophic taxa across sites. Metagenomic 16/18S rRNA data set analysed using Silva software; No significant differences were observed between the taxa, based on one-way ANOVA, p-value < 0.05.
Figure 6.
Relative abundance of photoautotrophic taxa across sites. Metagenomic 16/18S rRNA data set analysed using Silva software; No significant differences were observed between the taxa, based on one-way ANOVA, p-value < 0.05.

Figure 7.
Relative abundance of cyanobacterial orders across sites. Metagenomic 16 S rRNA data set analysed using Silva software; filamentous orders shown in orange/red; heterocystous order shown in green; unicellular orders shown in blue; * indicates significant differences between sites based on one-way ANOVA, p-value < 0.05.
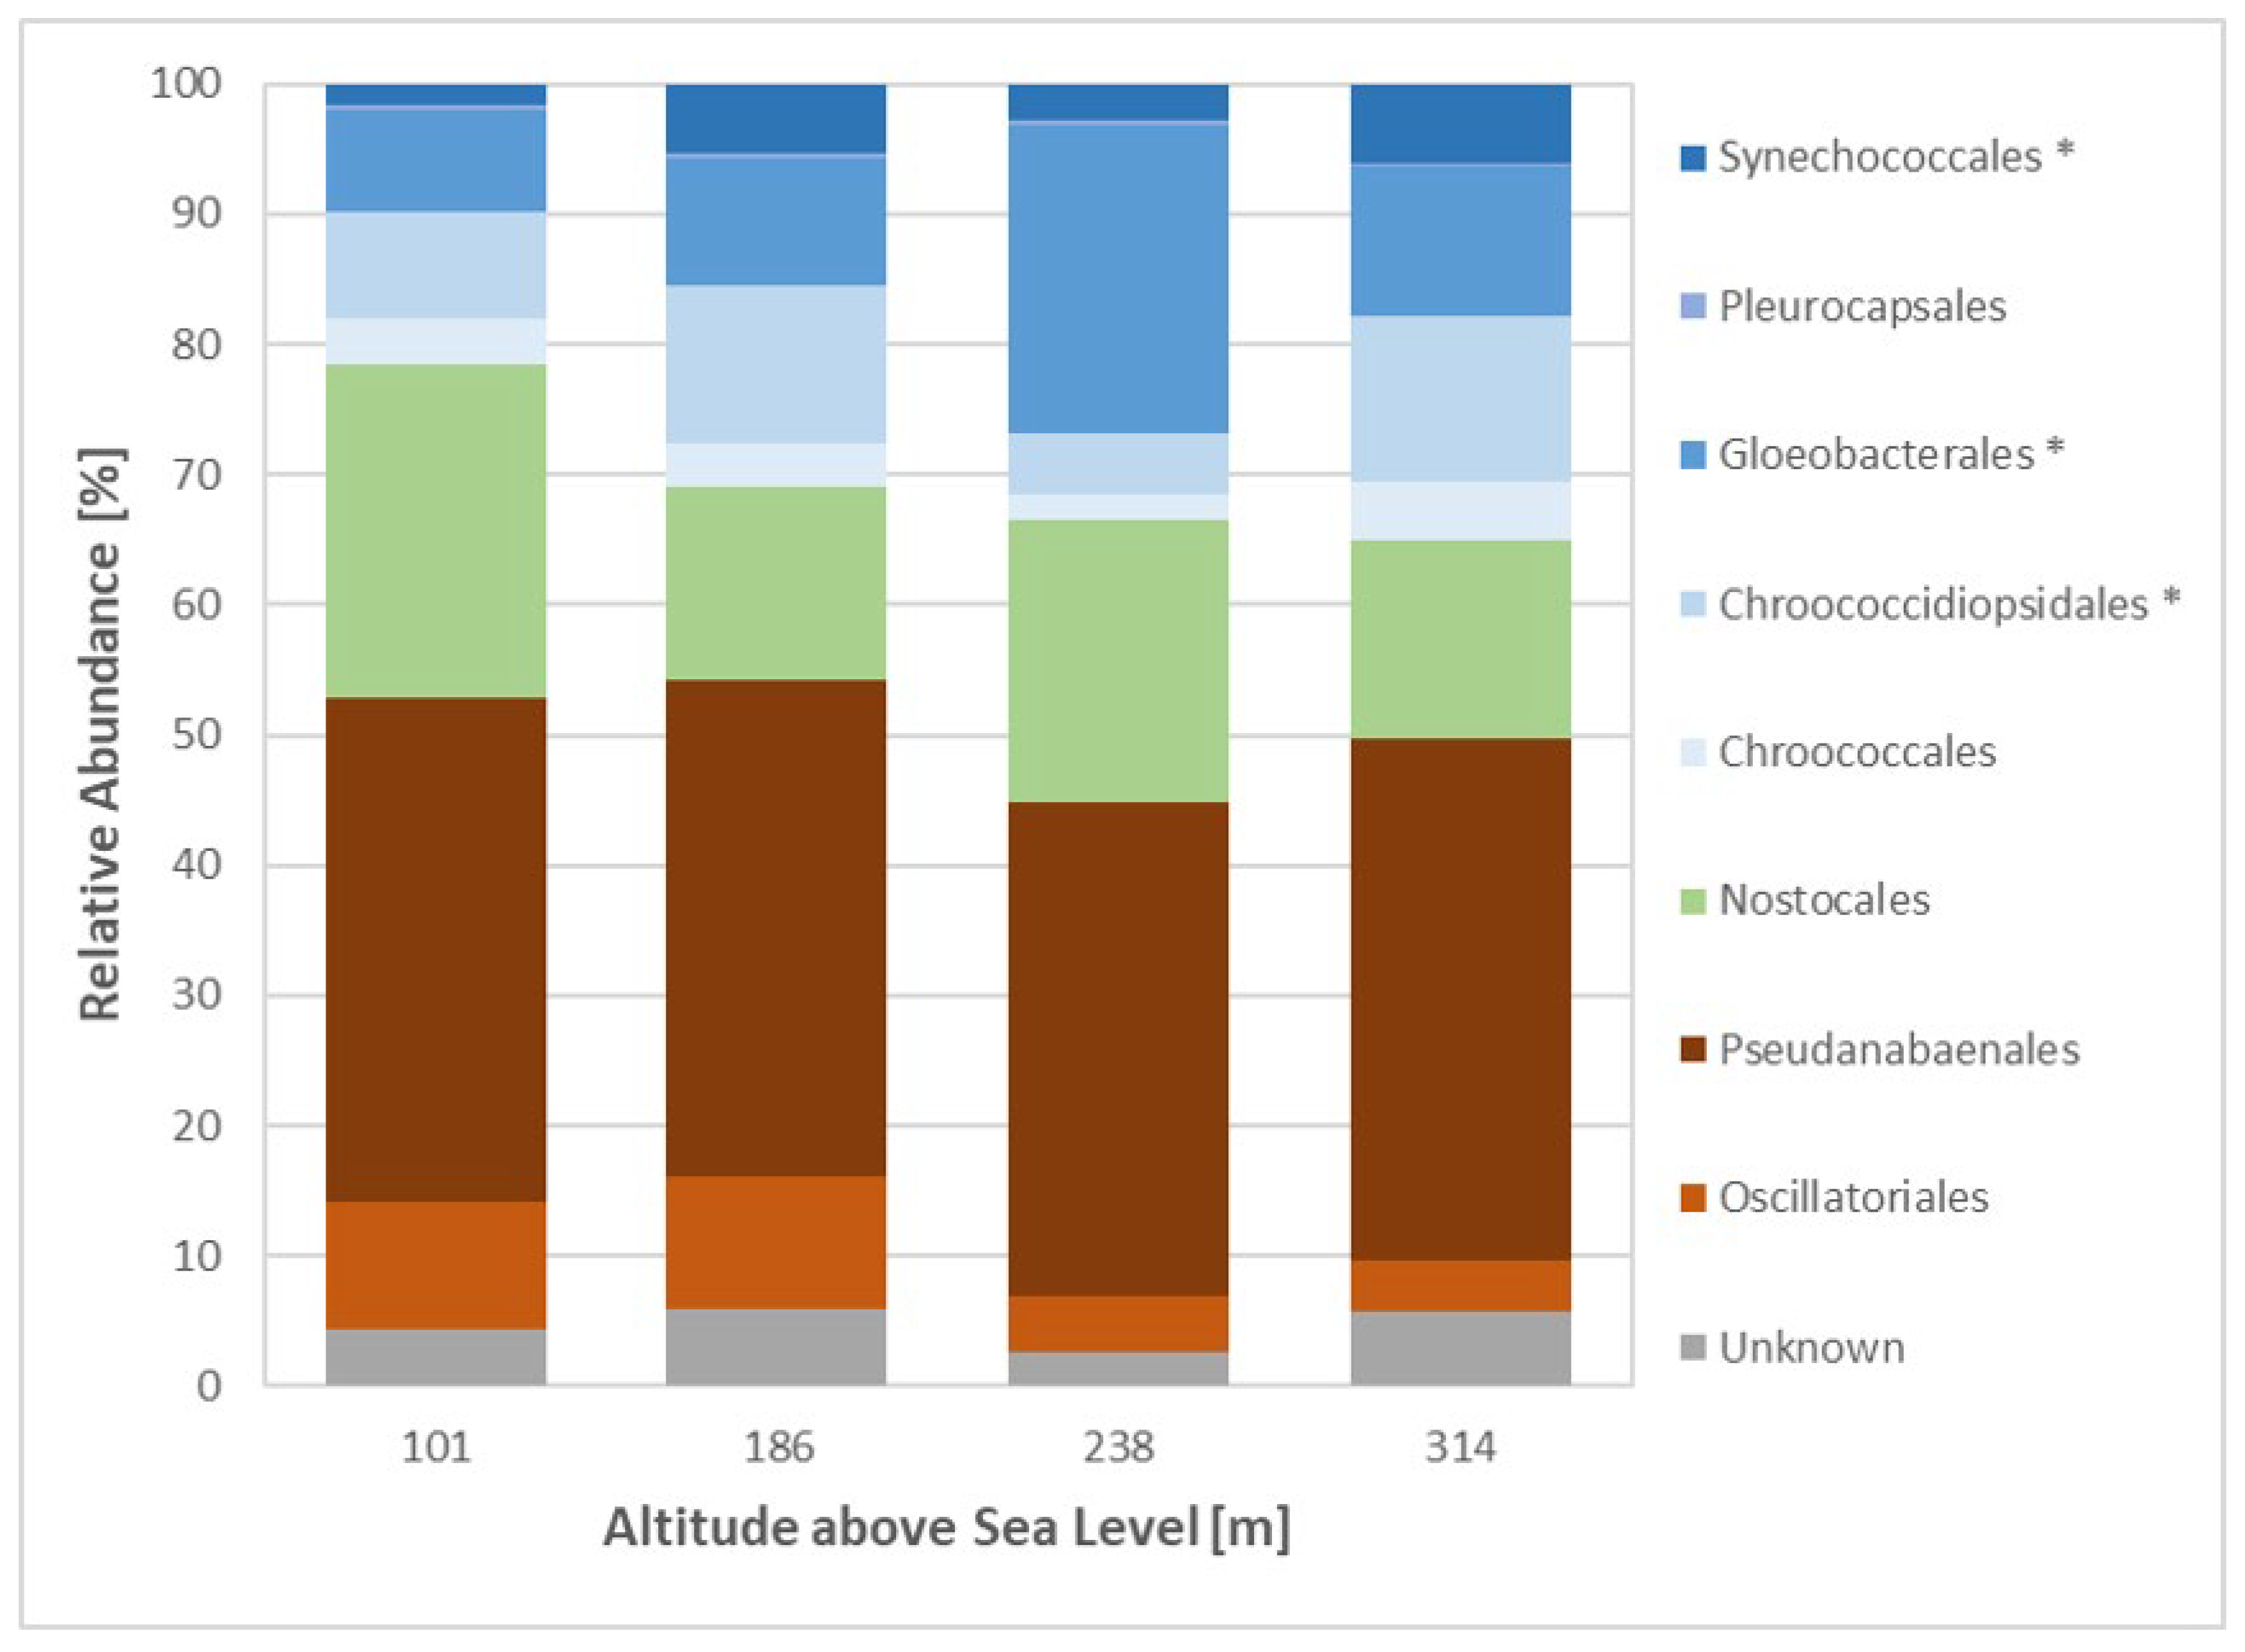

Table 1.
Scale used for the determination of soil coverage ratio of organisms on the sampling sites. Categorization according to visual assessment.
Table 1.
Scale used for the determination of soil coverage ratio of organisms on the sampling sites. Categorization according to visual assessment.
| Scale | Coverage | Numeric conversion for statistical purposes |
|---|---|---|
| 5 | > 75 % of surface | Did not occur |
| 4 | 51-75 % of surface | Did not occur |
| 3 | 26-50 % of surface | 50 |
| 2 | 5-25 % of surface | 25 |
| 1 | < 5 % of surface, but many individuals | 10 |
| + | < 5 % of surface, but few individuals | 5 |
| r | rare | 1 |
Table 2.
Description of the studied sites including soil chemistry. Same letters indicate no statistical difference between the samples according to one-way ANOVA followed by Tukey HSD post hoc test (p<0.05); TP = Total phosphorus; TN = Total nitrogen; TC = Total carbon; C/N = Carbon to nitrogen ratio; Chl a = Chlorophyll a content; Fv/Fm = quantum yield capacity of photosystem II.
| Site | GPS | Elevation m a.s.l. | pH | TP, [g/kg] | TN, [g/kg] | TC, [g/kg] | C/N | Chl a, [mg/m2] | Fv/Fm |
|---|---|---|---|---|---|---|---|---|---|
| 1 | 78.94935°N 12.48538°E | 101 | 6.26a | 0.42 a | 4.67ab | 73.30 a | 15.77ab | 183.88a | 0.343 a |
| 2 | 78.94562°N 12.48588°E | 186 | 7.28b | 0.39 a | 5.53 a | 76.33 a | 13.79 a | 151.39 a | 0.305 a |
| 3 | 78.94352°N 12.48400°E | 238 | 6.13a | 0.27 a | 3.40b | 64.80 a | 18.66b | 137.33 a | 0.353 a |
| 4 | 78.94226°N 12.47245°E | 314 | 7.13b | 0.37 a | 5.97 a | 99.60 a | 16.61ab | 215.57 a | 0.344 a |
Disclaimer/Publisher’s Note: The statements, opinions and data contained in all publications are solely those of the individual author(s) and contributor(s) and not of MDPI and/or the editor(s). MDPI and/or the editor(s) disclaim responsibility for any injury to people or property resulting from any ideas, methods, instructions or products referred to in the content. |
© 2024 by the authors. Licensee MDPI, Basel, Switzerland. This article is an open access article distributed under the terms and conditions of the Creative Commons Attribution (CC BY) license (http://creativecommons.org/licenses/by/4.0/).
Copyright: This open access article is published under a Creative Commons CC BY 4.0 license, which permit the free download, distribution, and reuse, provided that the author and preprint are cited in any reuse.


