
Submitted:
27 November 2024
Posted:
28 November 2024
You are already at the latest version
Abstract
Hospital layout significantly influences operational efficiency and patient outcomes, demanding robust tools for informed decision-making during the layout design stage. This study presents a novel Hospital Configuration Model (HCM) as the foundational component of a Hospital Design Support System (HDSS), which utilizes simulation modelling to provide evaluation mechanisms on hospital efficiencies and functionalities. The HCM integrates four critical data types—geometric, topological, semantic, and operational—into a machine-readable digital twin, enabling comprehensive spatial and procedural analyses. The HCM facilitates simulation modelling to optimize hospital layouts and predict performance metrics such as crowdingness, patient waiting times, patient walking distance, and difficulty in wayfinding. In conclusion, the HCM is the core and foundation of developing HDSS for evaluating hospital functionalities and efficiencies, and the potential applications of HCM include digital twin development, facility management, and safety enhancement.
Keywords:
Decision support systems
; Configuration Model
; Digital twin
; Hospital Layout Design
1. Introduction
The layout of a hospital has great impacts on its functionality [1,2,3,4,5]. The reasons behind this are twofold. Firstly, from the aspect of functionality, the medical procedures inside hospitals are complex. Secondly, from the aspect of configuration, hospitals are as complex as small cities, where corridors are similar to streets and functional units are similar to different land uses in cities [1,6,7,8]. Hence, when combining these two aspects, it indicates that the layout of a hospital significantly affects users’ visibility and walkability inside the hospital. When architects design a hospital, they are not merely making a building, but a system that can have many risks and problems if not treated carefully [1].
To improve the design of the system of the hospital, we propose to introduce an early operational insight into the hospital design process through the development of a Decision Support System. Namely, a Hospital Design Support System (HDSS). The HDSS is to provide reliable and transparent assessment mechanisms for predicting the performance of different hospital layout designs. To be able to provide such assessment mechanisms, we need a configuration model, which is a layout representation model of the hospital system containing four types of information, i.e., geometric information, topological information, semantic information and operational information. Table 1 gives each type of information an example.
The goal of the paper can be summarised as making a machine-readable model / digital twin of a hospital that can bring the operations of a hospital into a spatial information model as attributes. The rest of the paper is structured as follows: in the following Section 2 called Background, we look into the reasons why a Hospital Configuration Model (HCM) is essential to have as the core of an HDSS as an information system. Then in the Section 3 called Methodology, we look into the specific pieces of information content that need to be in an HCM, based on the arguments and reflections provided in the background. Afterwards, in the Section 4 called Proposal, we dive deeper into extracting the proposed pieces of essentially required information from what is typically available as data and information models on hospitals, both the Building Information Models or BIM data models and hospital Business Process Model and Notation or BPMN data models. At last, in the Section 5 called Discussion, we talk about future research, open questions and technical conventions about HCM.
2. Background
This section explains the necessity of developing an HCM as the Core of HDSS. One of the major functions of the proposed HDSS is to run simulation modelling to simulate complex dynamic situations in a hospital environment. The simulation modelling requires a configuration model as the base where simulation can be implemented. Furthermore, another major functionality of HDSS is to ensure that the configuration of a hospital fits how the hospital is operated. In other words, the space of the hospital should be laid out in a way that serves the purpose of improving hospital operations. An HCM is therefore essential to check this fitness between hospital space and medical procedures (hospital operations).
2.1. Simulation Modelling for Ex-Ante Assessment
The main point of making an HDSS is to provide mechanisms for assessing the likely impact or effect of decisions on the configuration of a hospital on some quality indicators or other quantitative outcomes of interest such as indicators of functional efficiency or crowded-ness or alike. The basic idea for devising such assessment mechanisms is developing spatial analysis procedures based on spatial queries which tend to be about spatial networks and traversals on their graph models. However, in the bigger scheme of configurational assessment, some inherently dynamic phenomena can only be properly understood through simulation modelling. There are multiple paradigms and at least two simulation modelling approaches that are commonly used for the study of complex systems. Complex System Modelling is the bigger picture in which we can view the whole case of making an HDSS because obviously, hospitals are complex socio-technical organizations that are not only complex from a spatial point of view but also from an organizational and operational point of view. It is non-trivial to understand how they work, let alone be able to come up with recommendations as to how their functionality or operational efficiency can be improved. Thus we must look into the bigger picture of simulation modelling for understanding hospitals as complex systems to approach the daunting task of HDSS development. To keep the scope of the paper manageable, however, here we only look at the necessity of having a hospital configuration model from the point of view of simulation modelling paradigms and approaches (which are not all necessarily relevant to the case of HDSS development, but for the sake of generality, we mention them all). There are four Simulation Modelling Paradigms [?]:
-
Discrete Event Simulation (DES): A Discrete-Event Simulation (DES) model is a model of a system in which events occur at specific points in time, causing changes in the system state [9]. A DES model consists of:
- –
- Discrete-event: the discrete event is the cause of the system state change. The state of the system in the DES model only changes due to the occurrence of events [10]. For example, in a hospital DES model, the patient’s walking distance in the hospital only changes if the patient moves to the next room.
- –
- Clock: The clock records the duration of the simulation. The DES model is dynamic as time is a critical variable, i.e., the state variables of the system change over simulation time [10]. For example, in a hospital DES model, the walking distance of the patient increases as the simulation time increases.
- –
- Random number generators: A random number generator can generate random variables for the DES [10], e.g., medical service time or patient inter-arrival rate.
- –
- Statistics: It summarises the results of the simulation such as average patient waiting time or average patient walking distance [10].
- –
- Ending Condition: The DES ends when the ending condition is met [10]. E.g., a hospital DES model is set to end when a certain number of patients are discharged.
The proposed HDSS can use DES to simulate patients’ medical procedures in hospitals and predict hospital performance by calculating performance indicators such as people density, patient waiting time, patient walking distance, etc. -
Agent-Based Modelling (ABM): An Agent-Based Model consists of agents and interactions between agents and between agents and the environment [11]. Agents are small computer programs that represent various types of entities [11]. For example, in a hospital ABM model, agents can be patients, nurses, doctors, etc. The environment in the ABM model can be a network graph where agents can interact [11]. The agents have several characters which are summarised as follows:
- –
- Autonomy: agents are autonomous entities that behave without guidance from central controllers, they are capable of making independent decisions [12].
- –
- Heterogeneity: agents can have various features such as ages, jobs, genders, etc [12]. For example, in a hospital ABM model, agents can have different roles such as patients, medical staff, technical staff, etc.
- –
- Active: agents are active in an ABM model because they are goal-directed, they are assigned to different goals and they need to achieve them [12]. To achieve their goals, agents are equipped with the capacity to perceive their environment and interact with other agents. Additionally, they are enabled to make logical decisions that facilitate goal attainment [12].
- –
- Interactive: agents can interact with other agents and also with the environment [12].
- –
- mobility: agents can move in the ABM environment [12]. For instance, the patient or the staff agent of a hospital ABM model can move in the environment (i.e., a graph) to achieve their goals.
- –
- Adaptation/Learning: agents can be designed to be adaptive, they can alter their states based on previous states [12]. For instance, in a hospital agent-based model, a doctor agent becomes available for new patients once they have completed treatment of the current patient.
ABM can also be applied in the proposed HDSS for studying individual behaviours, interactions between patients and staff, or patient flows in the hospital. -
Continuous Simulation: Continuous simulations are designed to model systems in which the system states change continuously over time. For example, in a hospital continuous simulation model, the patient’s length of stay increases continuously over simulation time. Continuous simulation models use differential equations or other mathematical models for defining the changing rate of the system states over time [13].Continuous simulations can be compared with DES, where state variables in continuous simulation models change continuously over time, while in DES models it changes at distinct points in time. Continuous simulations can be used for studying the spread of a contagious airborne disease (e.g., influenza or COVID-19) throughout a hospital to understand infection risk in different areas.
-
System Dynamics: System Dynamics is a type of continuous simulation that is developed for supporting policy making in complex and dynamic systems [13]. In system dynamics models, the behaviour of the system is created by the interactions between different components over time. The key components of a system dynamics model are introduced in the following:
- –
- Stocks: Stocks are accumulations of resources in a system, they represent the state of the system. [13], e.g., the number of patients in a hospital.
- –
- Flows: Flows represent the changing rates of stocks over time [13]. In a hospital, for example, the flow could be the rate at which new patients are admitted or discharged.
- –
- Information links: in a system dynamics model, information links connect stocks with flows and transfer information from a stock to the flow, it defines how a stock influences the values of the flow [13]. For example, in a hospital system dynamics model, by linking stock (i.e., number of patients in the hospital) to the flow (i.e., patient inter-arrival rate), the patient inter-arrival rate can be influenced by the current number of patients in the hospital.
System Dynamics can be applied in hospital management in terms of understanding patient flow, resource allocation, the spread of disease, etc.
and mainly two Simulation Approaches [?]:
Both of these simulation modelling approaches result in the construction of network models to be used in running the simulation model. However, the first type of network produced in signal-flow-based simulation modelling is a Directed Acyclic Graph (DAG) that is almost directly used as a computational network model. Whereas, the second type of network model produced in Equation-Based Modelling is closer to our configuration model. It is a network model that closely resembles the physical interconnections of elements in the system. It is, however, not readily a computational network model. Such a model, yet needs to be coupled with mathematical models to be converted into a simulation model. In an equation-based simulation modelling language like Modelica, this step happens thanks to the computational engine of the language but in our workflow, we have to consider this as a secondary step of modelling to be performed by the modeller for the domain-specific simulation tasks. However, discussing these details currently falls out of the scope of this paper. Instead, here we reflect on the requirements of an HCM for being applicable and useful for building various simulation models such as the four types of simulation models mentioned previously.
Reflecting on the property of the HCM from a point of view of simulation modelling: what should be the properties of HCM to be ready for simulation models? According to the previous introduction of the four types of simulation models, DES is perhaps the most suitable simulation modelling paradigm for studying the operational efficiency of hospitals. However, ABM simulation models are also used for studying stressful, chaotic, extreme or urgent situations in which the human agents might behave like herds of flocks of animals, following and interacting with each other in an extreme way. Continuous simulation models and System Dynamics models are less suitable for modelling hospital operations, because Continuous simulation models are more applicable in specific contexts such as studying the spread of contagious airborne diseases in hospitals, and System Dynamics models are more suitable for supporting designing hospital policies or management strategies. So in short, DES and ABM models are two simulation modelling paradigms that are more suitable for this research, where the ABM simulation models can be used to assess the extra-ordinary working situations and the DES to assess the ordinary working situations of the hospitals.
Ideally, our proposed HCM can cater for the needs of both of the simulation modelling approaches. This means that our HCM should have the essential spatial and operational pieces of information that can be possibly further elaborated automatically to extract higher resolution and more detailed information models as bases of such simulation models. For example, if you consider a base simple floor plate in an HCM, it can be further meshed into a high-res grid for running an ABM, only if necessary. However, it will not be necessary to keep the higher resolution detail information pieces in the HCM all the time because conceptually the high-res mesh can be generated when necessary from the more essential boundary information stored in the HCM.
2.2. Operational vs. Spatial Information
The most important reason to think about making an HDSS is to ensure that the configuration of a hospital is fit for the purpose for which the hospital is supposed to be built. This purpose can be elaborately explained as the superposition of all medical procedures that the hospital provides as services. These procedures can be abstracted as sequences consisting of operational steps. These operational steps can be related to the spatial units of a hospital and thus the sequences or medical procedures inevitably entail the transport of people (patients and staff), materials, and equipment inside the hospital. Therefore, the challenge of operational management of the hospital will end up having a significant aspect of transport planning and operations research in a spatial sense. In conclusion, it can be said that the problem of designing an optimal hospital configuration is about the fitness of the hospital configuration for the medical procedures that are supposed to take place through the spatial layout of the hospital. Figure 1, Figure 2 and Figure 3 illustrate some representative examples of medical procedures in real-world hospitals, and Figure 5 shows the ideal configuration obtained from these medical procedures. For further explanation on how to achieve the ideal hospital configuration from the hospital medical procedures, please see Section 3.2.
3. Research Methodology
This section is about what we need to have in an HCM and why. An HDSS is essential for designing a better hospital system, as it can quantitatively and systematically evaluate the design. A configuration model is a prerequisite for developing the HDSS because it contains spatial and non-spatial information about the hospital for evaluation. This section first talks about the required information in an HCM by introducing the use cases of an HDSS. It then introduces essential data needed in Hospital ARC Models, which are simplified equivalents of HCM. Lastly, this section discusses the required four types of data in an HCM, each type of data is explained with a detailed example.
3.1. Use Cases of HDSS
This section explains what we envisaged to be the use cases of the HDSS and concludes the list of necessary information in an HCM based on the desired functionalities of HDSS. The kind of information we need is not readily available in any existing file/information model. We are proposing a software application for assessing, managing or optimizing hospital configurations, in the first logical step in developing such software is to have clear ideas about information processing, and operations within the system.
To demonstrate the functionality and utility of the proposed HDSS, several use cases are described as examples by answering the following questions: who would be the user of the HDSS? What questions can the HDSS answer? And at what stage of a project can these questions be answered? The required information for each use case is also summarized. However, this list is not meant to be and cannot possibly be exhaustive.
- Use case 1: The architect can use the HDSS to semi-automatically create a hospital layout at the layout design stage of a new project, or optimize the hospital layout of an existing project. For this use case, the operational information of patients’ medical procedures in the hospital is needed for obtaining an Activity Relations Charts (ARC) Model (for further explanations please see Section 3.2). Thus, the HCM should contain the operational information on patients’ medical procedures in the hospital.
- Use case 2: The Architect can use this HDSS to assess the safety of the hospital environment during the layout design stage. The environment’s safety can be measured by the visibility and accessibility of spatial units within the hospital. As the visibility increases, the nurse can supervise bigger areas and hence the safety of the environment is also improved. A network graph consisting of nodes and edges is needed for this function, where each node represents a spatial unit of the hospital and each edge connecting two nodes represents the adjacent relationship between the two nodes. Hence, the HCM of the HDSS should contain the topological information of a network graph.
- Use case 3: The hospital director can use HDSS to check if the hospital will be overcrowded during the layout design stage. For this use case, we need the topological information of the network graph, we also need to incorporate semantic information into the graph by assigning the area of each spatial unit to its corresponding node, so that the average people density in the room/spatial unit can be computed to indicate the crowdedness.
- Use case 4: The hospital director can use this system to check if the patient waiting time will be too long in a new hospital project during the layout design stage. In this use case, the graph is again needed, we also need to integrate semantic information into the graph by assigning the name of each spatial unit (e.g., `central waiting’ or `registration’, etc.) to its corresponding node. The patient’s waiting time will be from the time the patient enters the waiting room till the time the patient enters the diagnosis room.
- Use case 5: The head nurse can use this system to check if patients’ walking distances will be too long in a new hospital project during the layout design stage. For this use case, we need the operational information of patients’ medical procedures for obtaining the optimal patient paths with the shortest distance. We also need the topological information of the network graph of the hospital. Furthermore, it is necessary to incorporate semantic information into the graph by assigning the name of each spatial unit to its corresponding node. This will enable the identification of specific patient paths within the graph. Finally, it is essential to integrate geometric information into the graph by assigning 3D coordinates to each node. This will allow for the calculation of the distances along the patient’s path.
- Use case 6: The architect can use this system to check how difficult it will be for first-time visitors to find their way in a hospital project during the layout design stage. For this function of measuring the difficulty in wayfinding, the extra walking distance will be the criteria of measurement. Hospital space is large and complicated, when first-time visitors enter the hospital to look for their destinations, they might get lost and go to several wrong places before arriving at their destinations. Hence their actual travel journey will be different from the optimal journey (i.e., the shortest path), the difference between the shortest path’s distance and the patient’s actual travel journey’s distance will indicate how difficult it is for patients to find their way. This use case requires the same information as the use case 5.
- Use case 7: The hospital director can use this system to develop a digital twin for simulating the operational management of the existing hospital during the operation and maintenance stage. A digital twin can help hospital directors assess the impact of changes on system performance and predict the result of specific medical procedures [16]. For this use case, the needed information is the topological information of the hospital graph and the operational information such as the patient journey.
In summary, the HCM of the HDSS requires four main types of information: operational information such as patient paths in the hospital, the topological information such as the hospital’s network graph, the semantic information such as each room’s name and area, and geometric information such as each room’s location presented by a 3D coordinate. Each type of information is explained with an example in Table 1.
3.2. ARC Model
As mentioned in use case 1 of Section 3.1, Activity Relations Charts or ARC Models [17] can be thought of as the simplified graph-theoretical equivalents (or excerpts) of the HCMs. These ARC Models are practically large square matrices that denote complex directed graphs, which put numbers indicating the relative importance of links in terms of frequencies of travel/transport between spatial/operational units of a hospital. Thus, it is clear that these ARC Models form the basis of configurational approaches to the design and optimization of hospital layouts in computational design [18]. However, there is little in the scientific or professional literature about how these ARC Models can be made systematically. Here we propose a conceptual process for building these ARC Models in a participatory process in consultation with the directors and planners of hospitals. The idea is to construct the ARC model in multiple logical steps by collating or superimposing multiple operational "paths" consisting of nodes that represent spatial/operational stations or operational milestones and links that indicate the smallest operational/procedural actions and their temporal duration (these attributes may or may not be used later on for building Discrete Event Simulation models [18,19]). Our proposed method is based on the idea of compiling a list of operational/spatial stations (rooms) and conducting a workshop/survey with the stakeholders to collect their proposed operational paths consisting of chains/sequences of these spatial/operational units. By putting together these paths, literally by adding the graph adjacency matrices representing these paths, we can then construct the main ARC model and its directed adjacency matrix in one go. If desired, this graph can then be row-normalized to extract the relative importance of the links between 0 and 1 [?].
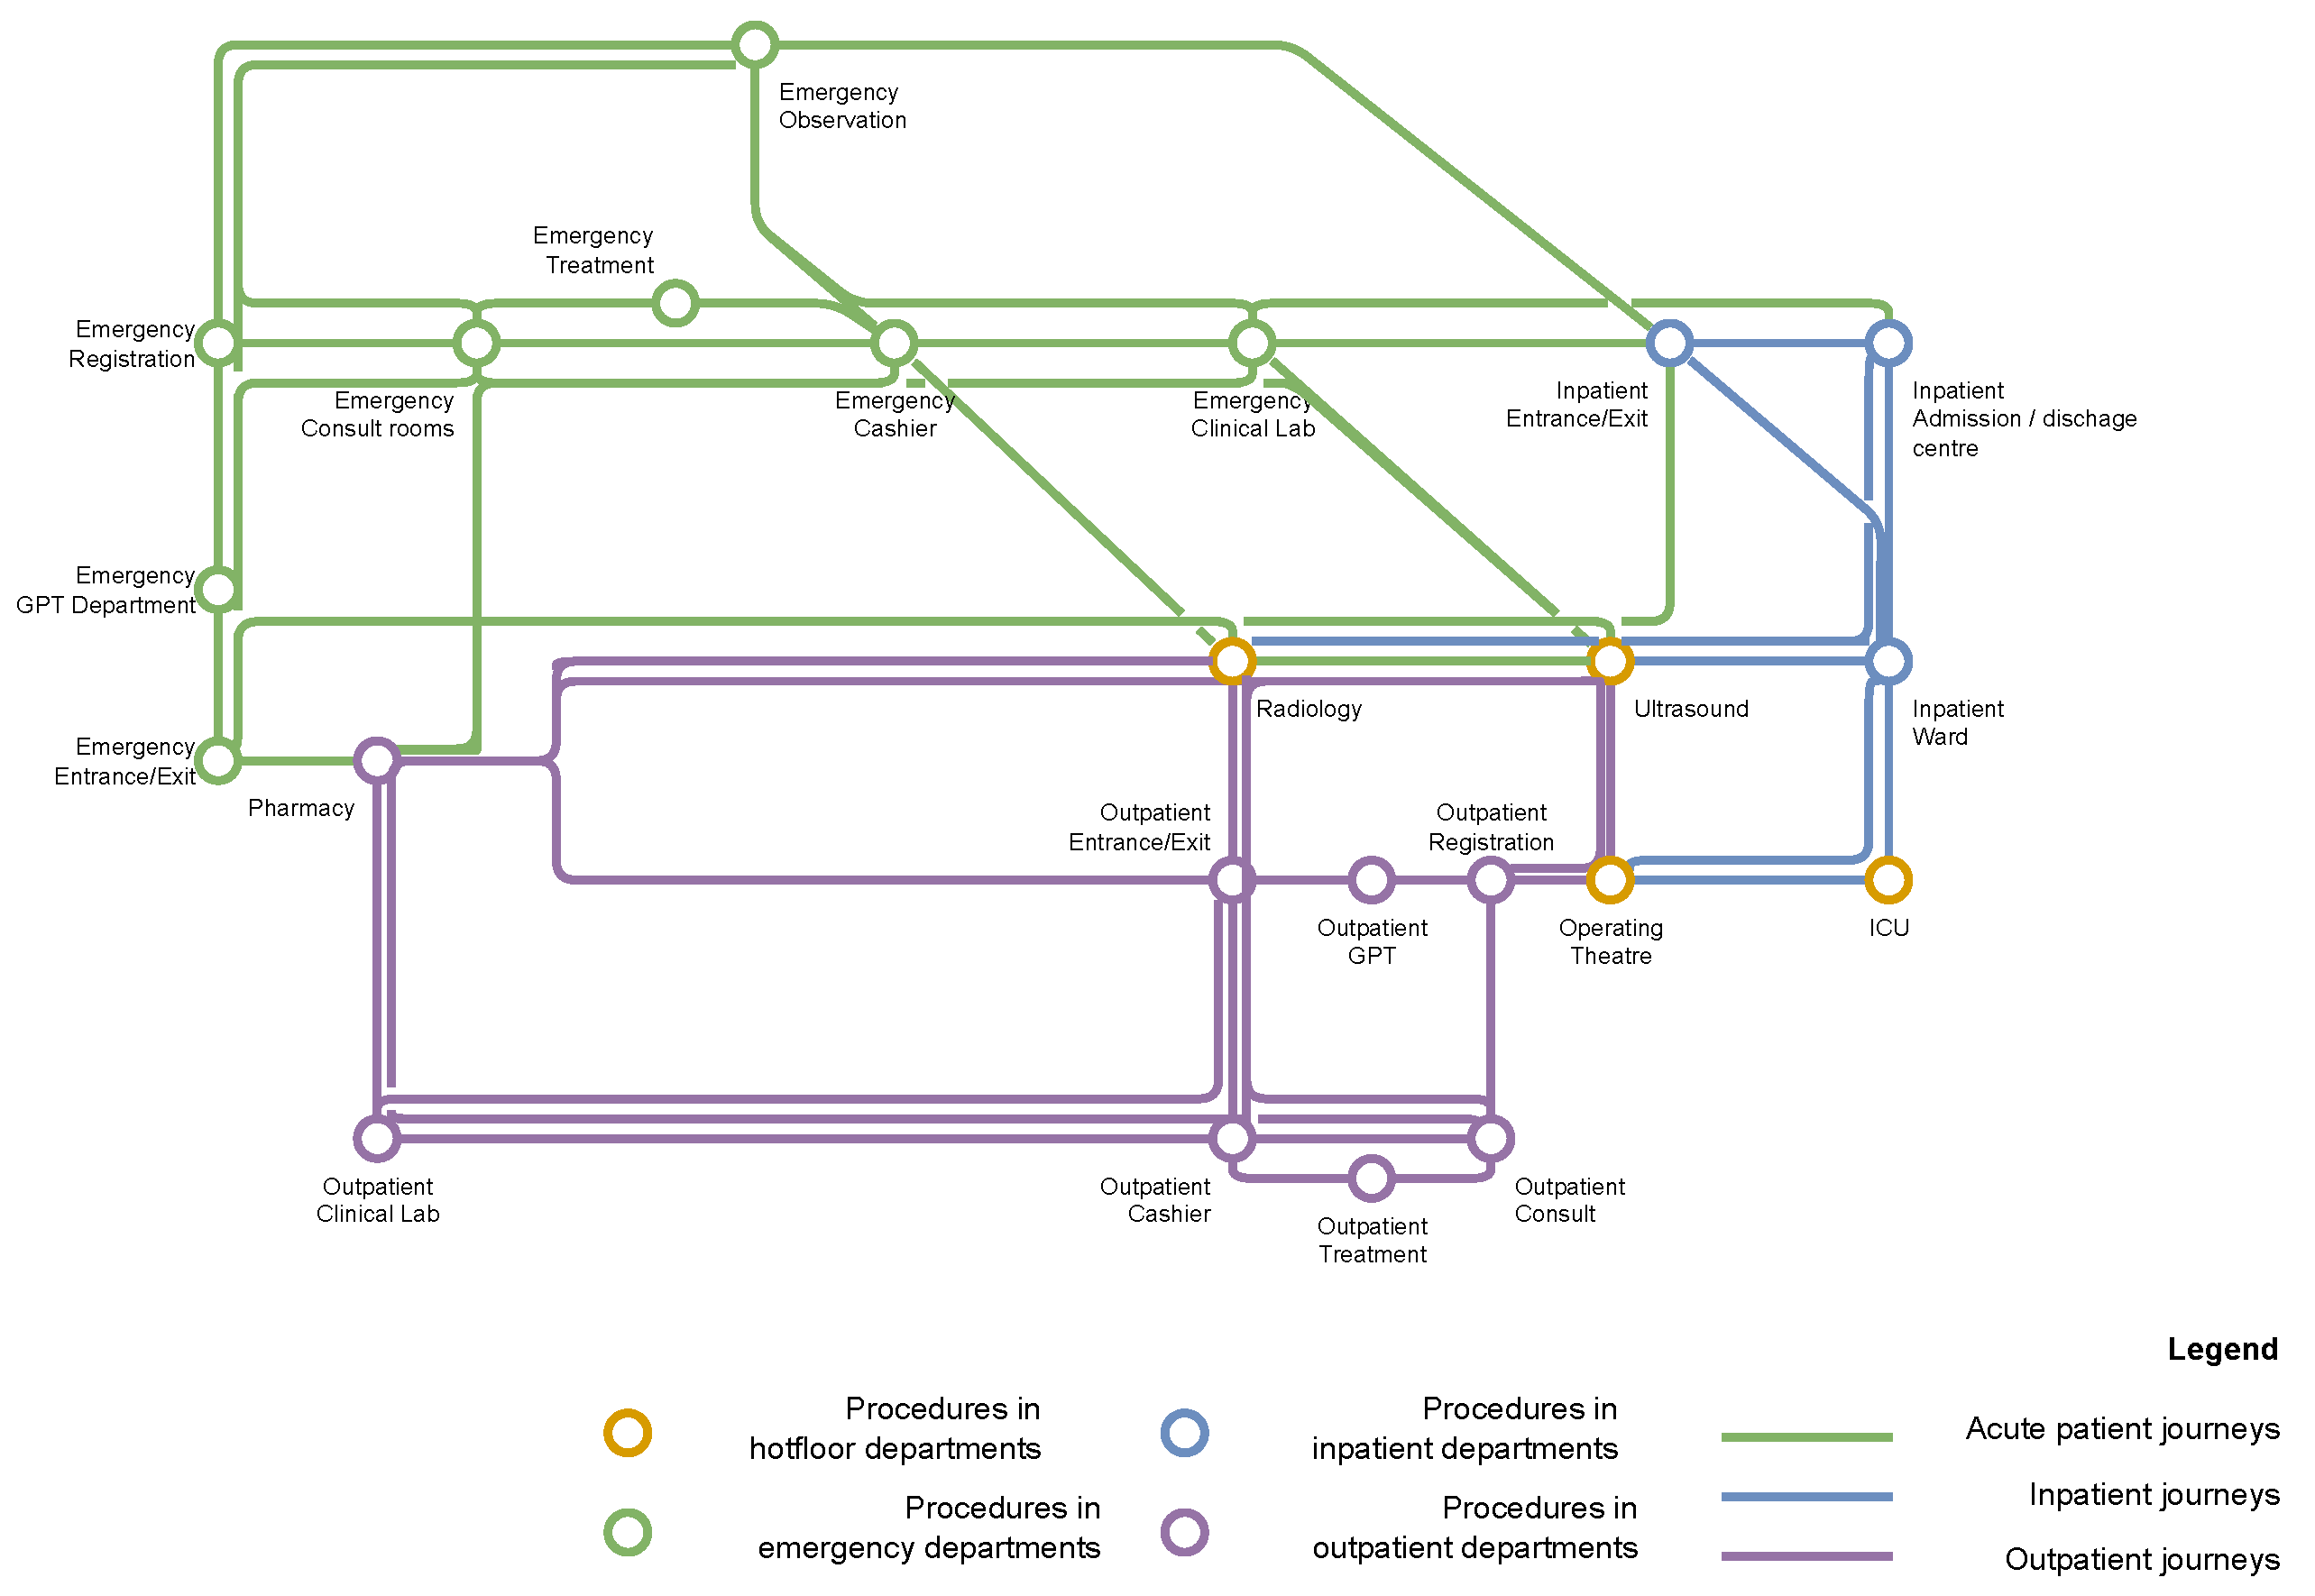
Figure 1, Figure 2, Figure 3, Figure 4, and Figure 5 together provide an illustrative example of the process for building the ARC models. Specifically, Figure 1, Figure 2 and Figure 3 are the proposed operational paths in the form of BPMN models. BPMN model is the industry standard that uses flow charts for modelling and illustrating processes in complex systems [20]. These BPMN models (or flow charts) show all the space-related procedures included in the patient journeys in outpatient, inpatient and emergency departments of a real-world hospital. Based on the flow charts, an Activity Relations Chart can be formed as illustrated in Figure 4, where rows and columns are labelled by space-related procedures in the flow charts, and entries indicate the relationships between any two pairs of the procedures. The relations are ranging from 0 to 1. If there is no connection between two procedures, the relation is 0. If the connection between two procedures exists, the relation is larger than 0 and is calculated according to the frequency of transitions between procedures. The higher the number is, the more adjacent the two procedures want to be to each other.
It can be noticed that the ARC model itself is a weighted graph, where each cell in the first row/column is a node, and the entries of the ARC model are the edges associated with weights ranging from 0 to 1. This graph can be represented in a more visual way, namely, a metro network diagram as illustrated in Figure 5, where each procedure is represented by a circle (node) and the connections between different procedures are represented by lines (edges). Pairs of procedures with stronger connections (i.e., higher numbers in the ARC model) are put close to each other in this diagram. By indicating and visualizing which procedures want to be adjacent to each other, these ARC models and the metro network diagram can aid in use case 1 of the HDSS, where hospital layouts need to be designed or optimized.
Figure 1.
Patients’ Paths in Outpatient Department of Panyu Central Hospital, image source: [?]
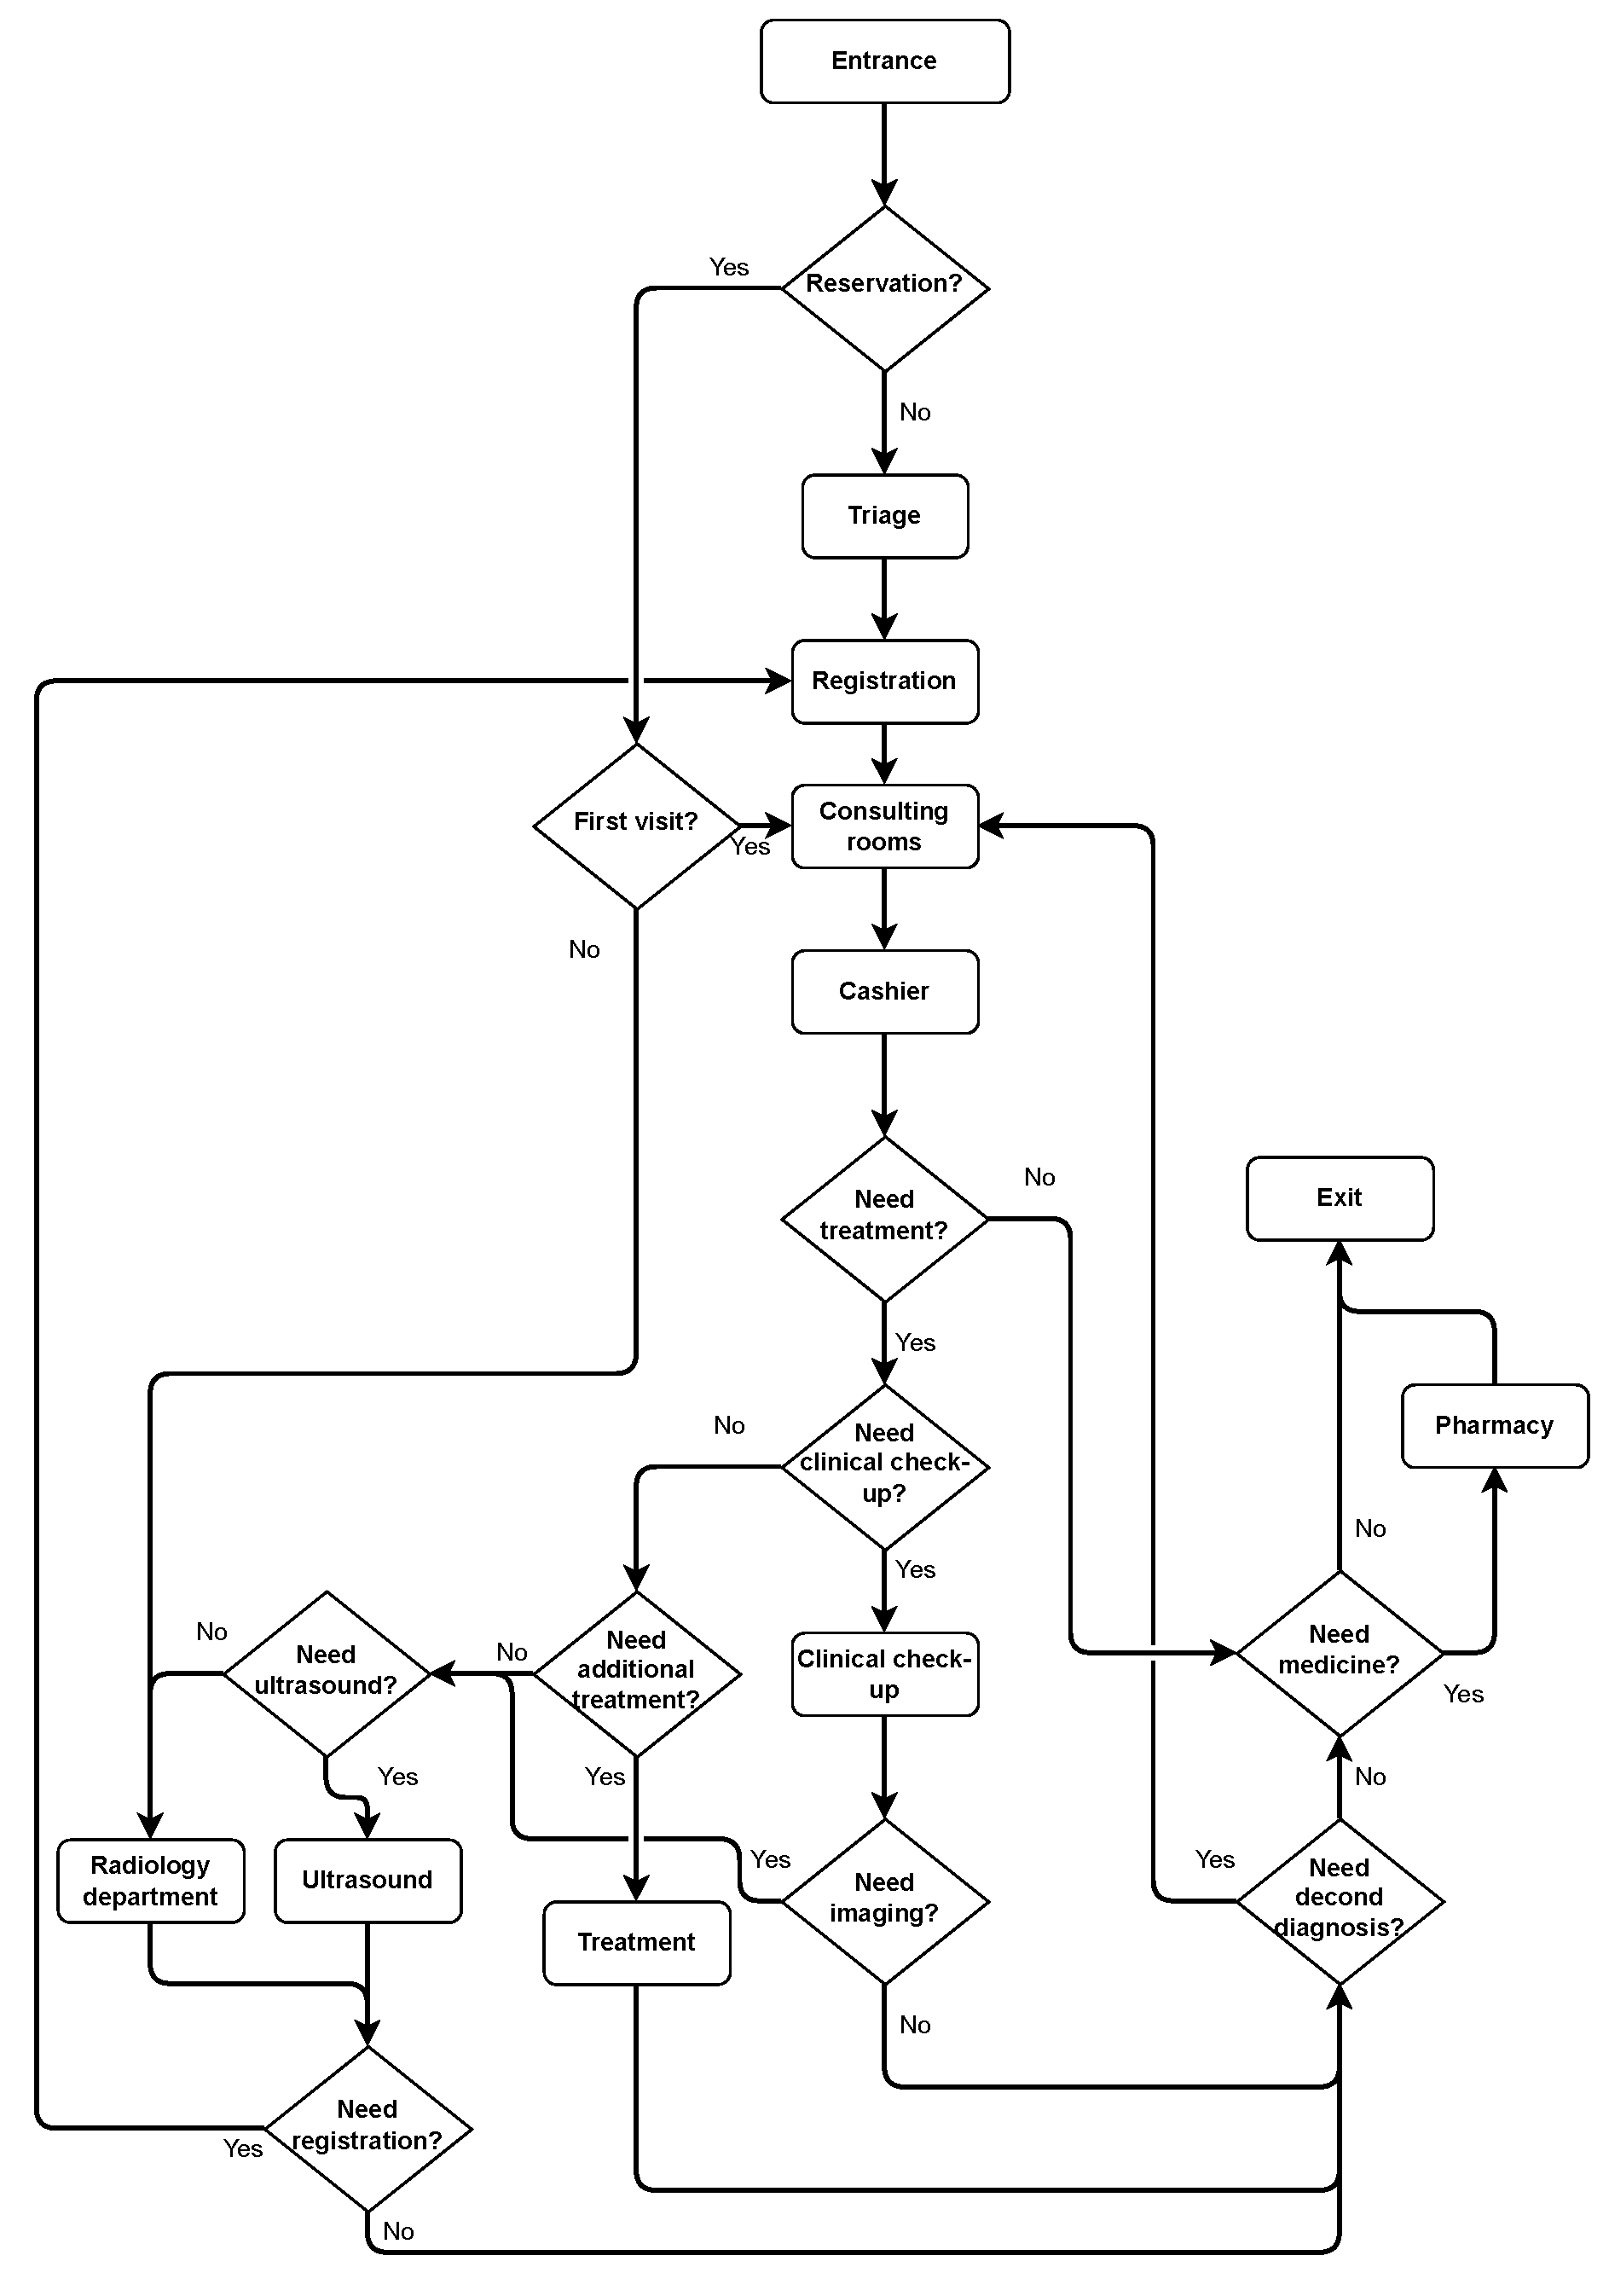
Figure 2.
Patients’ paths in Inpatient Department of Panyu Central Hospital, image source: [?]
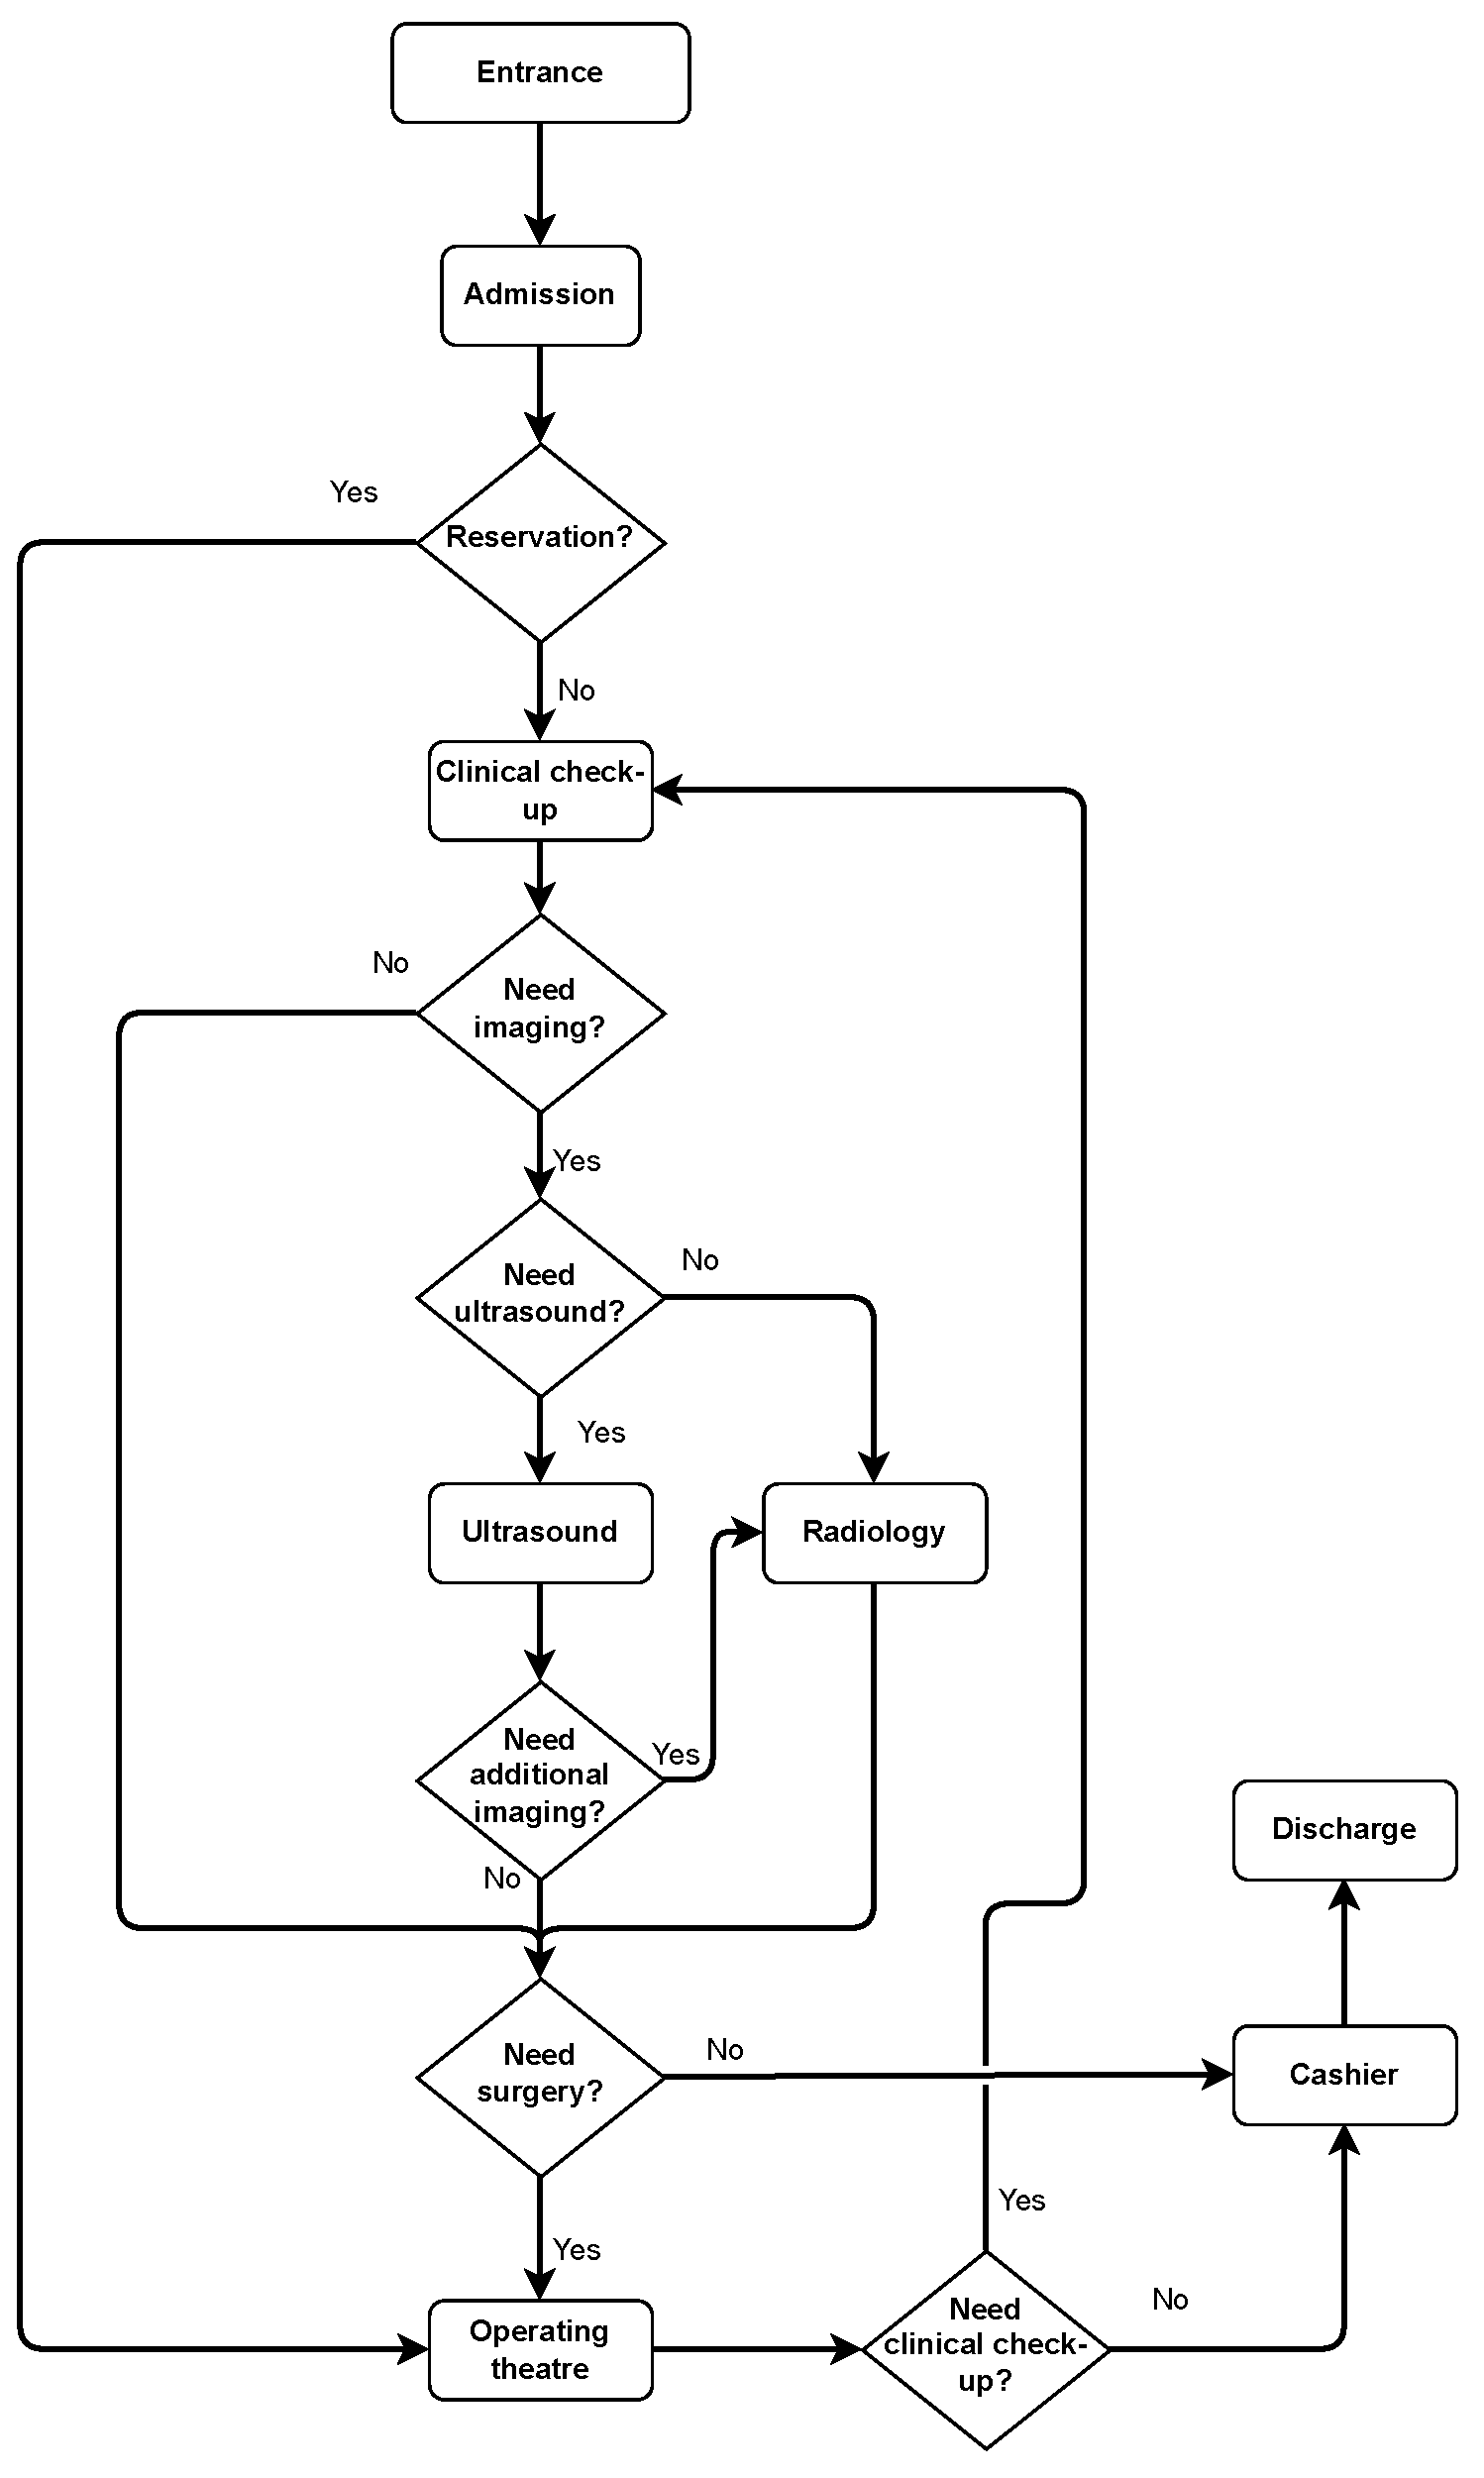
Figure 3.
Patients’ paths in Emergency Department of Panyu Central Hospital, image source: [?]
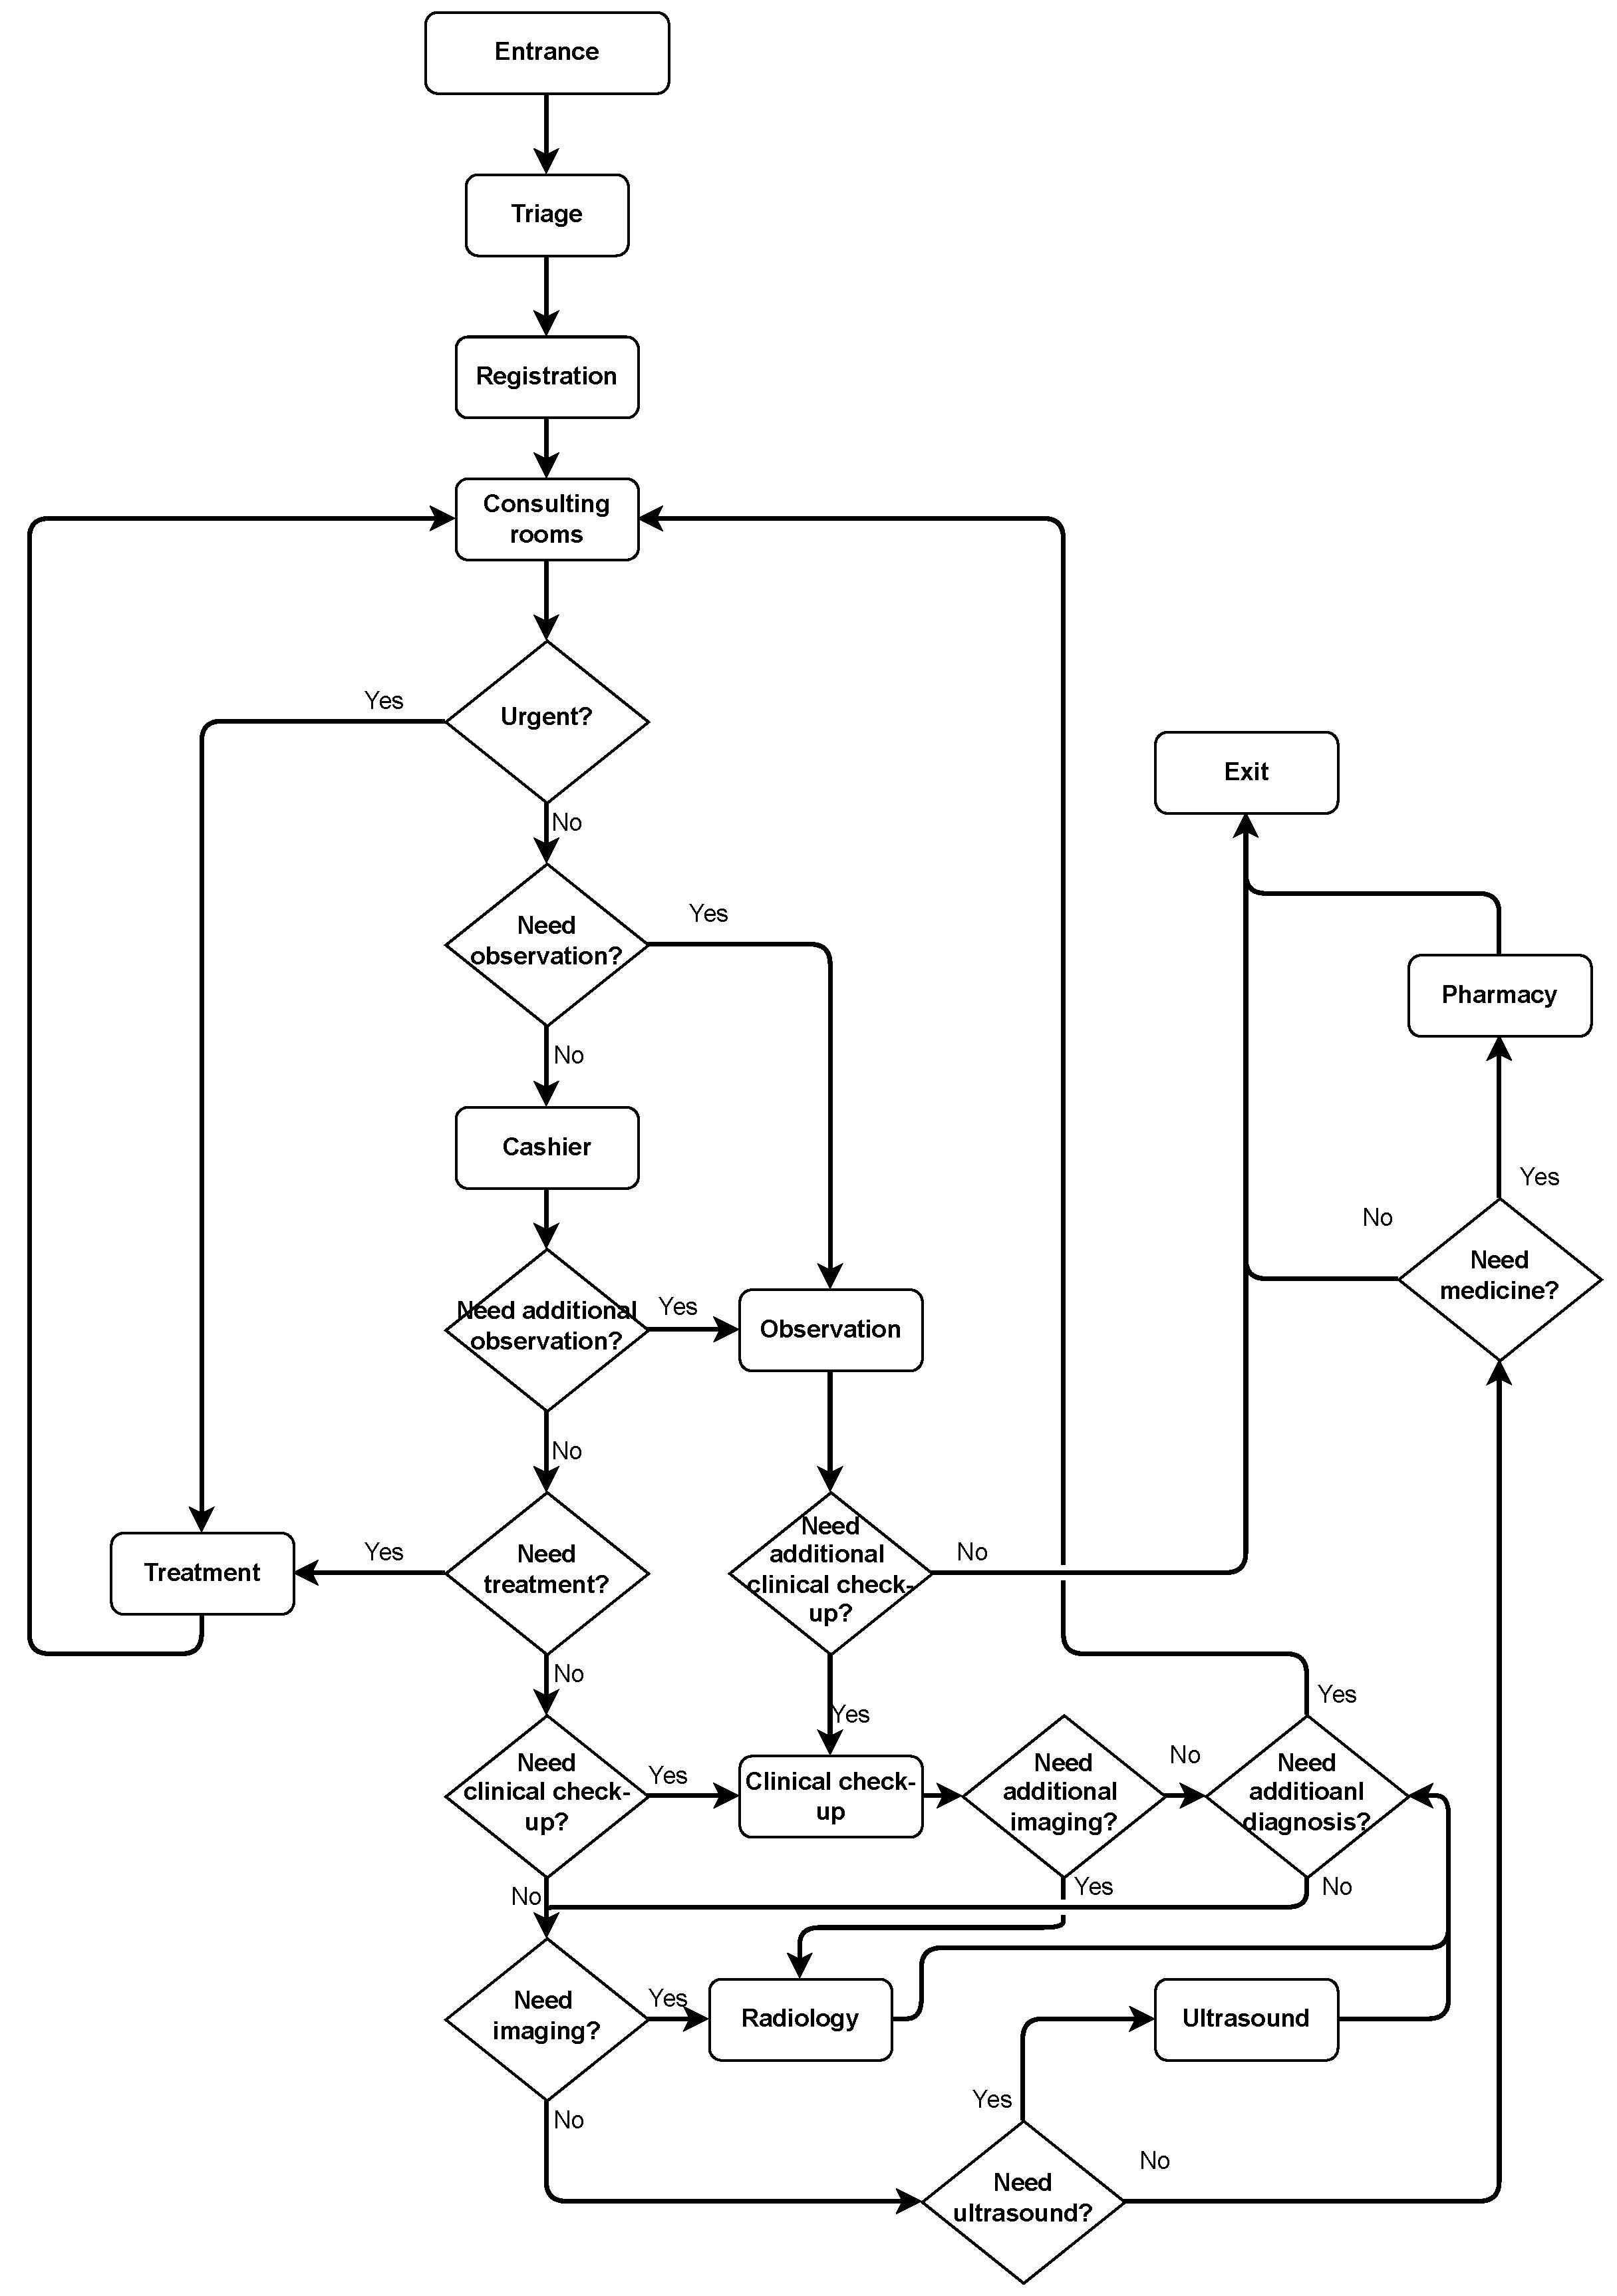
Figure 4.
Activity Relationship Chart of procedures in Panyu Central Hospital, image source: [?]
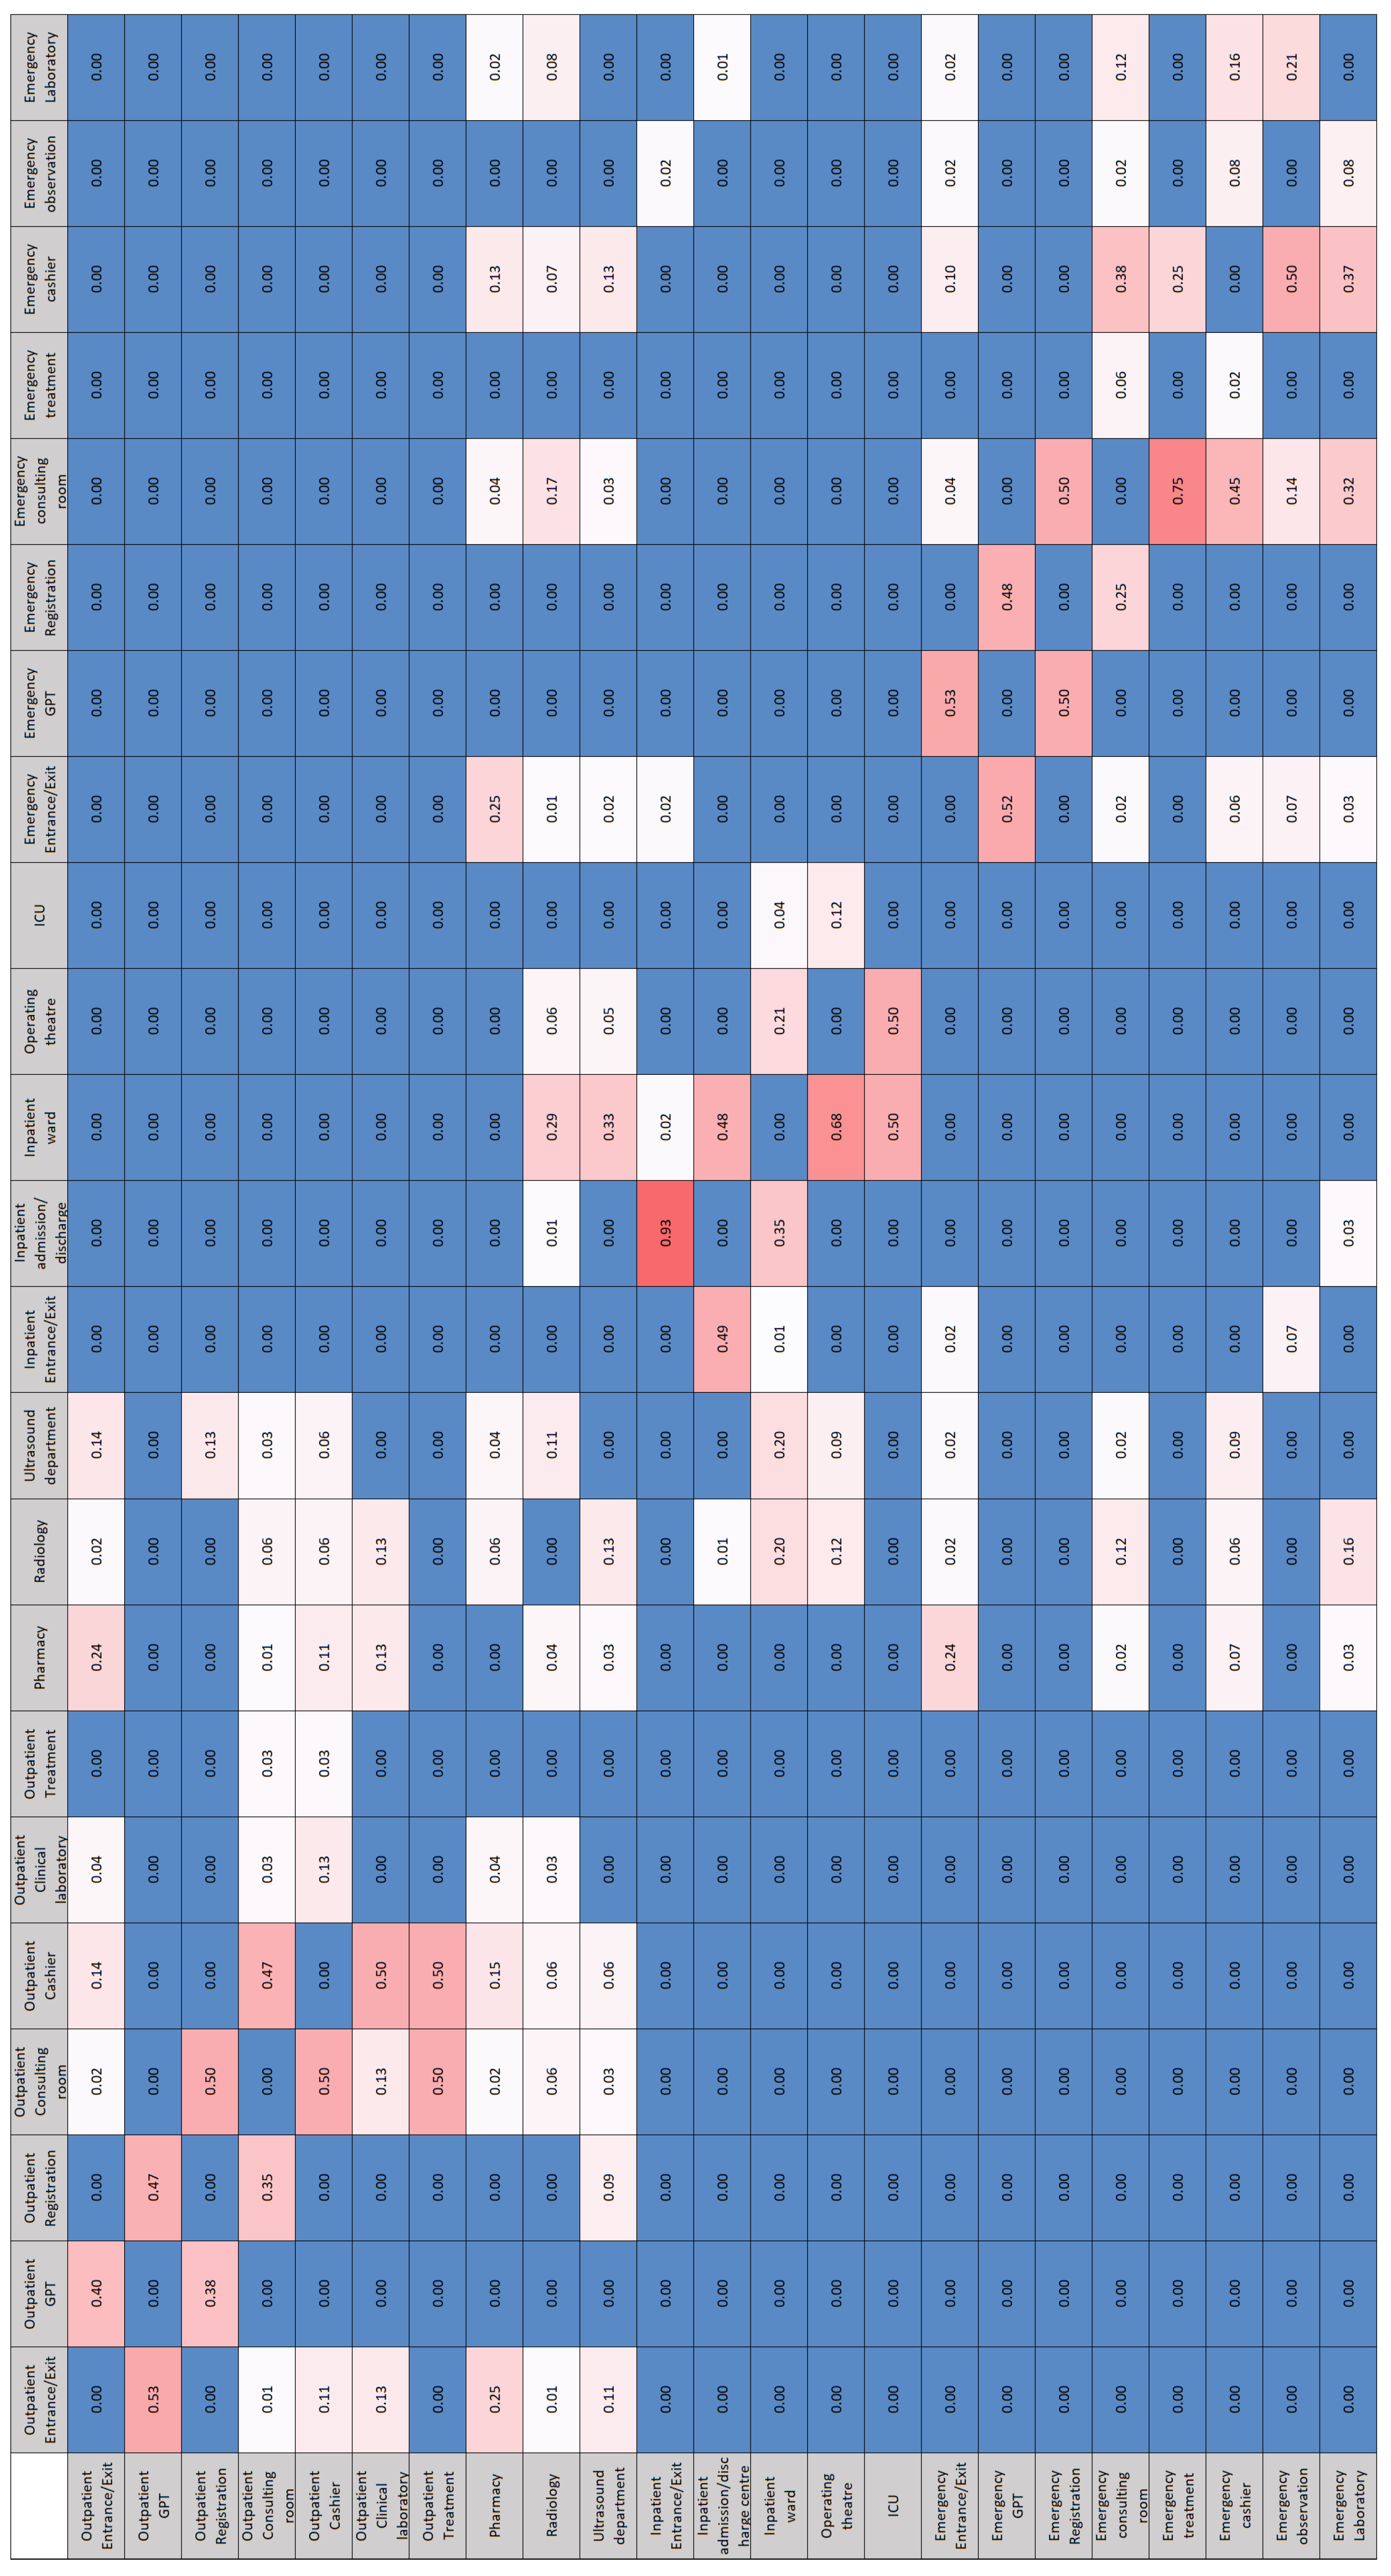
Figure 5.
Metro Network Diagram of Patient Paths in Panyu Central Hospital
3.3. Hospital Configuration Model
According to the HDSS’s use cases and functionalities introduced in Section 3.1, we can conclude what data are needed in a Hospital Configuration Model. As illustrated in Figure 6, a Hospital Configuration Model contains spatial and non-spatial information. The spatial information can be further divided into two types, namely, topological information and geometric information. The topological information is a network graph of the hospital layout. The graph consists of nodes and edges, where each node represents a spatial unit (e.g., room, corridor, etc.) and an edge connects two nodes if these nodes’ corresponding spatial units are adjacent. For a simplified example of a hospital graph, please see topological information in Table 1. The geometric information includes data about mathematical coordinates and shapes of spaces. For example, a room’s boundary consists of a list of vertices with 3D coordinates (see geometric information in Table 1), and the 3D coordinates of a room’s corresponding node representing the room’s location.
The non-spatial information can be further divided into the type of semantic information and the type of operational information. The semantic information involves the semantic data such as room name, room area, person ID, etc. (see semantic information in Table 1). The operational information holds data related to the operations of the hospital system, e.g., the specific medical procedure each patient needs to go through within the hospital (see operational information in Table 1). Section 4.4 explains how we extract the four types of information from available sources such as BIM/IFC models and BPMN models to form the HCM. In the HCM, all types of information are connected in a logical way, the dashed lines in Figure 6 show relationships between different classes, e.g., the relationship named `Person uses rooms’ indicates specific rooms that a person uses. Ideally, we will have consistency among spatial information, semantic information and operational information, to make the operational management in a hospital straightforward.
4. Proposal
In this section, we discuss how we extract the required information of our HCM from what is typically available as data and information models. We first introduced the available data and information models, which include two types, i e., the type of spatial information models such as Building Information Models (BIM), Industry Foundation Classes (IFC), and IndoorGML, and the type of operational information in the form of Business Process Model and Notation (BPMN) data models. We then introduced our methodologies of extracting data from these data models to build the HCM.
4.1. Hospital BIM and IFC Models
Building Information Modelling (BIM) consists of designing and using the digital 3D model of buildings with the aim of supporting architectural planning, design, construction, operation, maintenance, refurbishing and demolition [21]. BIM is widely used in the Architecture Engineering and Construction (AEC) domain for aiding the design and construction stages of an architectural project [21].
One typical challenge about BIM is that different BIM software has different file formats that do not always support one another, which causes interoperability problems when exchanging files [21]. To solve this problem, the buildingSMART consortium has invented the industry foundation classes (IFC) as a common and open format for exchanging BIM models [21].
Due to the wide application of BIM/IFC in the AEC domain, most digital 3D models of hospitals are BIM/IFC models. Hence, we will use hospital BIM/IFC files as source files for extracting geometric, topological and semantic information for the HCM.
4.2. IndoorGML
BIM/IFC models are very complex and contain much information that is irrelevant to geospatial applications and research [22]. They integrate geometric, spatial, structural, and material information across different stages of a building’s life cycle. The information we need for the use cases and functionalities of the HDSS is only a small part of the entire information in the BIM/IFC model, the rest of the information is irrelevant to our research purpose. Hence, for simplicity and convenience reasons, we only need to extract relevant information from BIM/IFC models and abandon the rest.
We can extract IndoorGML files from BIM/IFC models. IndoorGML is an Open Geospatial Consortium (OGC) standard used for the description of 3D indoor spaces and facilitating applications such as indoor navigation [22]. IndoorGML files provide geometric, topological, and semantic information about indoor spaces which suits the aim of our research [?].
IndoorGML models have two main parts, one is Primal Space Features and the other is Node-Relation Graph [?]. PrimalSpaceFeatures divides the indoor space of a building into cells, cells are representations of rooms and corridors. Node-Relation Graph describes the relations among these cells (i.e., whether two cells are adjacent). PrimalSpaceFeatures is further divided into CellSpace and CellSpaceBoundary, where CellSpace is the smallest spatial unit of a building such as room, corridor and staircase, etc., and CellSpaceBoundary is the door in a building. Node-Relation Graph is also divided into two modules, i.e., nodes and edges. A node is the dual of the corresponding CellSpace (room) or CellSpaceBoundary (door), and an edge connects two nodes if the two corresponding CellSpace (or CellSpaceBoundary) of the nodes are adjacent. Figure 7 gives an illustration of the four modules of the IndoorGML, and Figure 8 is an example of the IndoorGML model extracted from the open-source hospital IFC model used in this research, where the red Node-Relation Graph is embedded in the transparent Primal Space Features.
Although IndoorGMLs seem suitable for our research, it has several challenges and drawbacks that are not conducive to this research:
- There is a lack of available IndoorGML files in the industry because according to the literature study conducted in Section 4.4.1, there are no appropriate tools for generating correct IndooGML files. Furthermore, IndoorGMLs are encoded in XML (eXtensible Markup Language) format [?], which is complex, highly hierarchical, cumbersome to manage, and unpopular for web applications [21].
- While IndoorGML is designed to support applications in indoor navigation and facility management, effective execution of these tasks typically requires integration with additional data, such as operational information and enriched semantic information. However, IndoorGML files currently face the challenge of lacking this critical supplementary information.
Hence, IndoorGML itself cannot meet our research requirements. To deal with the above challenges, we first developed our tool for semi-automatically generating correct IndoorGML files from BIM/IFC models, the generated IndoorGML files are further parsed into JSON (JavaScript Object Notation) format [?], which is a more popular format due to its readability and edit-ability. Our tool can also integrate operational and semantic information into IndoorGML’s spatial information to make the later simulation modelling feasible [23].
4.3. Hospital BPMN Models
Since hospital BIM/IFC and IndoorGML models do not contain operational information such as medical processes or patient journeys, we need to collect this information from other sources. In this research, we extract the operational information for the HCM from business process model notation (BPMN) models. BPMN is an industrial standard for modelling business processes, it uses flow charts to visualize the steps included in the business process [20]. It is a common approach to model hospitals’ medical processes using BPMN [20,24]. Hospitals as complex systems have very complicated processes involving different users and multiple steps taking place in different places. Hence, BPMN is a perfect method to model these processes, and we will use BPMN models as our source files for extracting operational information of these medical processes into the HCM.
In this research, we selected representative hospital operational information about patient journeys from Peng’s study [?] and manually modelled this information into BPMN models. The automatic generation of BPMN models falls out of the scope of this paper. However, we propose that an expert (such as an Industrial Engineer or someone familiar with Operations Research) should systematically extract such information from textual and visual documents concerning the operational management and service design of a hospital to construct multiple BPMN models to describe the main procedural workflows in a hospital. Figure 1, Figure 2, and Figure 3 are BPMN models that we built for modelling the medical processes in outpatient, inpatient, and emergency departments in a real-world hospital. We used these three BPMN models as our source files for extracting the operational information into the HCM. Section 4.4.2 explains how we extract operational information from these BPMN models.
4.4. From Hospital IFC Model to HCM
This research developed software to automatically generate a configuration model from an IFC model for the evaluation of the hospital’s functionality and efficiency. The generation workflow includes two main steps. The first step is converting the hospital IFC model to the IndoorGML model. The second step is to build the HCM from the IndoorGML file. Figure 9 depicts the workflow of converting the Hospital IFC Model to the HCM.
4.4.1. From IFC to IndoorGML
To the best of our knowledge, there is currently no suitable tool for converting IFC to IndoorGML. Diakite et al. [22] developed a tool for automatically generating IndoorGML models from the IFC Model using C++. However, the generated IndoorGML files do not include any semantic information, which is inadequate for our research. Tong and Zheng [25] developed a tool for transforming IFC models to IndoorGML files using Autodesk’s Revit and Dynamo, McNeel’s Rhino and Grasshopper, and Python. The IndoorGML files generated by this tool have semantic information. However, the tool only works for modularized buildings with simple geometries (i.e., rectangular-shaped rooms with four sides). Since hospitals are complex buildings with rooms and corridors of all kinds of irregular shapes, this tool is not suitable for our research. Intratech [?] developed a plugin for AutoCAD and Revit for extracting IndoorGML. However, IndoorGMLs generated by this plugin also lack semantic information, and this plugin relies on proprietary formats.
Our software is inspired by Tong and Zheng’s work but is more generalized and works for more complex buildings with rooms of irregular shapes.
As Illustrated in Figure 9, the workflow of generating IndoorGML files starts with extracting relevant information from the IFC model using Autodesk’s Revit and Dynamo. Three groups of data (i.e., room names, boundaries and areas, stair boundaries, and door locations) are taken out of IFC for building IndoorGML’s geometric and semantic information. The extracted data can be further used to generate IndoorGML’s topological information (i.e., Node-Relation Graph), but because Dynamo and Grasshopper use different data structures to store data, the data from Dynamo needs to be first processed in Python so it is readable by Grasshopper. Once the data is imported into Grasshopper, the scripts in Grasshopper read the data and generate a Node-Relation Graph of the IndoorGML model. The data exported from Grasshopper again needs to be processed in Python so they can be read by other Python libraries to write an IndoorGML file. Since the IndoorGML file has an XML-based exchanged format [26], we use etree [?], an XML library for Python, to write the IndoorGML file. The processed geometric, topological and semantic information are read by the Python generator and turned into XML-formatted output (i.e., IndoorGML). For more implementation details about the software such as the scripts in Dynamo, Grasshopper and Python please refer to [23].
4.4.2. From IndoorGML to HCM
The development of the HCM follows the design pattern of model-view-controller (MVC). MVC is the most common design pattern for developing software or User Interfaces [?]. This pattern divides the program logic into three separate yet interconnected parts, i.e., data model, view, and controller [?]. Figure 10 presents the interrelationships among three parts of the MVC. The data model component of MVC is a data structure, which contains all the raw data of the project [?]. In the case of the HCM, the data model is derived from the IndoorGML file and carries all the geometric, topological, semantic and operational information of a hospital system. The view component of MVC presents the model’s information to the users [?]. It contains functions to access the data model and organize the data more logically so that humans can easily read them. We have developed view functions of our HCM according to the use cases introduced in Section 3.1 for users to easily query relevant information. The controller component of MVC serves as an intermediary between the model and the view. It listens to the event triggered by the view and makes a response to the model (e.g., adding or changing information to the data model) [?]. In the following text, We demonstrate how we obtain the data model of the HCM, develop view codes to extract information from the data model and put them in a human-readable manner, and develop controller codes to add or edit contents in the data model.
-
Obtaining the Model part of the HCMFigure 9 shows that the development of the data model for the HCM includes parsing the IndoorGML file into a JavaScript Object Notation (JSON) file [?]. The parser for IndoorGML used in this study is developed by Ledoux [28]. With this parser, all the information in the IndoorGML (e.g., cell spaces, cell space boundaries, nodes and edges) is parsed into a JSON file as the data model.
-
Developing the View part of the HCMThe information presented by the view codes should be a mathematical construct about sets and relations, these relations are graphs, so most of our view functions should output sets and graphs or hyper-graphs (Mesh is a hyper-graph and the edge in a face is considered to be a hyper-edge). According to the use cases demonstrated in Section 3.1, we developed view codes to extract the following information: a mesh (hyper-graph) describing the geometrical information (i.e., the PrimalSpaceFeatures) in the IndoorGML model, a graph showing the topological information (i.e., the Node-Relation Graph) in the IndoorGML model, a set of room names and room areas showing the semantic information of the hospital in the IndoorGML model, and another set of hospital departments and all the rooms within their respective departments, which shows the semantic information of the hospital’s organizational structure. Last but not least, a set of lists demonstrating the operational information of patient journeys in the hospital.The mesh output is obtained using the COMPAS library in Python, COMPAS is an open-source framework designed for computational research in the field of architecture, engineering, digital fabrication and construction [29]. Users can use the view code to generate and visualize the mesh geometry to get a view of how the IndoorGML model of the building looks like. The graph output is obtained by developing Python scripts using the NetworkX library, a Python package made for creating, manipulating, and analysing complex networks[30]. Users can use the view code to obtain the network graph which will be the base for running the simulation modeling. The simulaiton modeling is one of the core functionalities of HDSS as mentioned in use cases 4, 5, and 6. Figure 8 is a visualization of the mesh output and graph output generated from the open-source hospital IFC model [?], where the red graph is embedded in the transparent mesh. The set output of room names and room areas is a Python dictionary [?], where the room name is the key and the room area is the value. Users can use the view code to obtain all the room areas, which can aid in addressing use case 3. Specifically, in the later simulation modelling step, once the room area and the number of people in the room are known, it will be straightforward to assess the room’s crowdedness by calculating the people’s density in the room. The set output of departments and rooms is also a Python dictionary, where the key is each department in the hospital, and the value is the group of all rooms included in the department. Figure 11 shows the Python code to implement this function of organizing all rooms in the hospital into their respective departments and Table 2 shows the resulting Python dictionary of hospital departments and rooms. The extracted operational information related to patient journeys in the hospital are Python lists. For extracting this information, we first turned the BPMN models (Figure 1, Figure 2 and Figure 3) into multiple lists (e.g., see Input data list in Table 3), where each element in the list is a space-related procedure in the BPMN (i.e., rounded-corner rectangle in the flow charts Figure 1, Figure 2, and Figure 3), and the entire list is a complete medical procedure in the BPMN flow chart (i.e., the procedure starts with patient entering the hospital and ends with patient leaving hospital). Subsequently, we developed view codes to identify the corresponding room names of list elements based on the extracted semantic information of hospital departments and rooms (Table 2). For example, the element `registration’s’ corresponding room name in the semantic information Dictionary is `RECEPTION1B13’. The view codes find the corresponding room names for each element in the list and put all corresponding room names into a new list (e.g., see Output data list in Table 3). The new lists contain extracted operational data on patient journeys, which can serve as input for HDSS simulation modelling, e.g., this data enables determining the shortest path for patients/agents in DES or ABM simulations. Table 3 provides an example of the input data list generated from the BPMN model and an example of the output data list of operational information generated from the input data list. It is to be noticed that one element in the input data list might have multiple corresponding room names in the output data list, this is because in a hospital there can be multiple rooms for the same function. For example, the element `diagnosis’ in the input list has twelve corresponding room names (`INTERACTIONSTATION1D07’, `INTERACTIONSTATION1D08’, etc.) in the output data list because, in the selected hospital BIM model, there are twelve rooms all serving the same function of diagnosis. Hence, the patient can have twelve options when choosing the diagnosis room and there will be twelve different potential paths for the patient to complete the same patient journey. For more implementation details of the view codes’ Python scripts please refer to this paper [23] or this repository.
-
The Controller part of the HCMThe controller codes we envisage are for updating the data model, in other words, adding/changing information to the data model. Once the simulation is complete, we need to update the data model by adding the dis-aggregated simulation results and aggregated evaluation results to the data model, so that users can easily view them. For example, once the simulation is finished and we know each room’s people density, we need to add this attribute to the dictionary that describes the room’s information. Table 4 provides an example for illustrating how one part of the data model has been changed before and after the controller code adds information to it. Besides adding the dis-aggregated information, we also propose controller codes for adding aggregated information such as average people density, average patient walking distance, average patient waiting time and average patient’s extra walking distance.Another example of controller code is for updating the data model’s network graph. The original network graph only contains topological information, the controller codes can integrate semantic and geometric information into the graph. For example, assigning each node its corresponding room name, area, and 3D coordinate. By adding such information to the graph, the graph can aid in the simulation modelling such as finding the shortest path in the graph according to the patient journey data list (output data list in Table 3), calculating the distance along the shortest path, and calculating the people density in a room.
5. Discussion
This study first introduced the importance of an HDSS for quantitatively and systematically assessing the efficiency and functionality of hospitals, it then argues why an HCM is essential as the core of an HDSS. Based on the required information in the HCM, we explained our methodology of semi-automatically generating configuration models for hospitals from BIM/IFC models. The methodology has two parts, the first part includes the conversion of hospital BIM/IFC models to IndoorGML models, and the second part pertains to the automatic generation of HCM from the IndoorGML model. The following sub-sections discuss the future research, open questions, and utilization outlook of HCM.
5.1. Future Research
Our future research and development endeavours focus on the development of HDSS prototypes, which use an HCM as input and implement operational simulation models for assessing the accessibility of services and the efficiency of mobility. Another potential direction for future research is to establish a standard way of extracting hospital operational information (e.g., medical procedures) into a data model using the methods of BPMN.
5.2. The Utilization Outlook of HCMs
The potential utilization of HCMs is summarized as follows:
- An HCM can be used for space optimization by providing the basis to study relationships and flows between different space units.
- Together with the operational information, an HCM can be used as a digital twin for simulating and monitoring the daily operations of a hospital, e.g. in operational management and in facility management
- An HCM can help improve the safety of a building by optimizing the placement of guards or cameras to ensure maximum coverage while keeping the lowest number of guards/cameras within the building.
- An HCM can be augmented with 3D information (after the hospital is realized) to help build a model for indoor navigation and way-finding.
We can conclude that a specific type of information model, dubbed a Hospital Configuration Model (HCM) is needed to collate spatial and operational information concerning the planned procedures in a hospital as a core of a class of information systems called Hospital Design Support Systems (HDSS). In this paper, we introduced and proposed some constructs that need to be embodied into an HCM with an outlook towards the envisaged use cases for an HDSS. It is only natural that when prototyping an HDSS we might realize that we need to revise our HCM but such revisions are quite common and necessary in Design Science Research [31,32]. For now, given the outlook of usage of the HDSS, the most essential information to be squeezed into an HCM are the spatial, configuration, semantic, and operational pieces of information as introduced in the paper.
Author Contributions
Conceptualization, Zhuoran Jia and Pirouz Nourian; methodology, Zhuoran Jia and Pirouz Nourian; software, Zhuoran Jia and Pirouz Nourian; validation, Zhuoran Jia; formal analysis, Zhuoran Jia and Pirouz Nourian; investigation, Zhuoran Jia; resources, Zhuoran Jia and Pirouz Nourian; data curation, Zhuoran Jia; writing—original draft preparation, Zhuoran Jia; writing—review and editing, Pirouz Nourian; visualization, Zhuoran Jia; supervision, Pirouz Nourian, Peter Luscuere, and Cor Wagenaar; project administration, Peter Luscuere and Cor Wagenaar. All authors have read and agreed to the published version of the manuscript.
Funding
This research received no external funding.
Data Availability Statement
The original data presented in the study are openly available in IFC2BCM.
Conflicts of Interest
The authors declare no conflicts of interest.
Abbreviations
The following abbreviations are used in this manuscript:
| HDSS | Hospital Design Support System |
| HCM | Hospital Configuration Model |
| DES | Discrete-Event Simulation |
| ABM | Agent-Based Modelling |
| DAG | Directed Acyclic Graph |
| ARC | Activity Relations Charts |
| BPMN | Business Process Model Notation |
| MVC | Model-View-COntroller |
| JSON | JavaScript Object Notation |
References
- Jia, Z.; Nourian, P.; Luscuere, P.; Wagenaar, C. Spatial decision support systems for hospital layout design: A review. 67, 106042. [CrossRef]
- Chraibi, A.; Kharraja, S.; Osman, I.; El Beqqali, O. A Mixed Integer Programming formulation for solving Operating Theatre Layout Problem: a Multi-goal Approach. Journal Abbreviation: Proceedings of 2013 International Conference on Industrial Engineering and Systems Management, IEEE - IESM 2013 Publication Title: Proceedings of 2013 International Conference on Industrial Engineering and Systems Management, IEEE - IESM 2013.
- Ulrich, R.; Quan, X.; Joseph, A.; Choudhary, R.; Zimring, C. The Role of the Physical Environment in the Hospital of the 21 st Century: A Once-in-a-Lifetime Opportunity.
- Burgio, L.D.; Engel, B.T.; Hawkins, A.; McCormick, K.; Scheve, A. A Descriptive Analysis of Nursing Staff Behaviors in a Teaching Nursing Home: Differences Among NAs, LPNs, and RNs. 30, 107–112. [CrossRef]
- Peponis, J.; Zimring, C.; Choi, Y.K. Finding the Building in Wayfinding. 22, 555–590SAGE Publications Inc. [CrossRef]
- Al-Sharaa, A.; Adam, M.; Amer Nordin, A.S.; Mundher, R.; Alhasan, A. Assessment of Wayfinding Performance in Complex Healthcare Facilities: A Conceptual Framework. 14, 16581, Number: 24 Publisher: Multidisciplinary Digital Publishing Institute. [CrossRef]
- Jiang, S.; Verderber, S. On the Planning and Design of Hospital Circulation Zones. 10, 124–146. [CrossRef]
- Pouyan, A.E.; Ghanbaran, A.; Shakibamanesh, A. Impact of circulation complexity on hospital wayfinding behavior (Case study: Milad 1000-bed hospital, Tehran, Iran). 44, 102931. [CrossRef]
- Hillier, F.S.; Lieberman, G.J. Introduction to operations research, tenth edition ed.; McGraw-Hill Education. Section: xxx, 1010 pages : illustrations ; 27 cm.
- Leemis, L.M.; Park, S.K. Discrete-event Simulation: A First Course; Pearson Prentice Hall. Google-Books-ID: UDwZAQAAIAAJ.
- Elsenbroich, C.; Gilbert, N. Agent-Based Modelling. In Modelling Norms; Elsenbroich, C.; Gilbert, N., Eds.; Springer Netherlands; pp. 65–84. [CrossRef]
- Crooks, A.T.; Heppenstall, A.J. Introduction to Agent-Based Modelling. In Agent-Based Models of Geographical Systems; Heppenstall, A.J.; Crooks, A.T.; See, L.M.; Batty, M., Eds.; Springer Netherlands; pp. 85–105. [CrossRef]
- Law, A.M. Simulation Modeling and Analysis; McGraw-Hill. Google-Books-ID: 6cC_QgAACAAJ.
- Documentation, S. Simulation and Model-Based Design.
- Modelica Association. Modelica Language Specification.
- Semeraro, C.; Lezoche, M.; Panetto, H.; Dassisti, M. Digital twin paradigm: A systematic literature review. 130, 103469. [CrossRef]
- Gozali, L.; Widodo, L.; Nasution, S.; Lim, N. Planning the New Factory Layout of PT Hartekprima Listrindo using Systematic Layout Planning (SLP) Method Planning the New Factory Layout of PT Hartekprima Listrindo using Systematic Layout Planning (SLP) Method; Vol. 847. Journal Abbreviation: IOP Conference Series: Materials Science and Engineering Publication Title: IOP Conference Series: Materials Science and Engineering. [CrossRef]
- Cubukcuoglu, C.; Nourian, P.; Tasgetiren, M.F.; Sariyildiz, I.S.; Azadi, S. Hospital layout design renovation as a Quadratic Assignment Problem with geodesic distances. 44, 102952. [CrossRef]
- çubukçuoğlu, C.; Nourian, P.; Sariyildiz, I.; Tasgetiren, M. Optimal Design of new Hospitals: A Computational Workflow for Stacking, Zoning, and Routing. 134, 104102. [CrossRef]
- Ruiz, F.; Garcia, F.; Calahorra, L.; Llorente, C.; Gonçalves, L.; Daniel, C.; Blobel, B. Business process modeling in healthcare. 179, 75–87.
- Ohori, K.A.; Ledoux, H.; Peters, R. 3D modelling of the built environment.
- Diakite, A.A.; Díaz-Vilariño, L.; Biljecki, F.; Isikdag, Ü.; Simmons, S.; Li, K.; Zlatanova, S. IFC2INDOORGML: AN OPEN-SOURCE TOOL FOR GENERATING INDOORGML FROM IFC. XLIII-B4-2022, 295–301. Conference Name: XXIV ISPRS Congress “Imaging today, foreseeing tomorrow”, Commission IV - 2022 edition, 6–11 June 2022, Nice, France Publisher: Copernicus GmbH. [CrossRef]
- Jia, Z.; Nourian, P.; Luscuere, P.; Wagenaar, C. Ifc2bcm: A Tool for Generating Indoorgml and Building Configuration Model from Ifc. [CrossRef]
- Kassim, S.A.; Gartner, J.B.; Labbé, L.; Landa, P.; Paquet, C.; Bergeron, F.; Lemaire, C.; Côté, A. Benefits and limitations of business process model notation in modelling patient healthcare trajectory: a scoping review protocol. 12, e060357. [CrossRef]
- Tong, Z.; Zheng, H. Generation Scheme of IndoorGML Model Based on Building Information Model. In Proceedings of the Phygital Intelligence; Yan, C.; Chai, H.; Sun, T.; Yuan, P.F., Eds. Springer Nature, pp. 225–234. [CrossRef]
- Ledoux, H. ARE YOUR INDOORGML FILES VALID? VI-4-W1-2020, 109–118. Conference Name: ISPRS TC IV3rd BIM/GIS Integration Workshop and 15th 3D GeoInfo Conference 2020 (Volume VI-4/W1-2020) - 7–11 September 2020, London, UK Publisher: Copernicus GmbH. [CrossRef]
- Mohd Nor, R.; Jalaldeen, M.; Razi, M.; Zakaria, A.; Safiuddin, A.; Fakhri, A.; Zulaiha, P.; Saat, A. Cloudemy: Step into the Cloud.
- Ledoux, H. indoorjson/software/ig2ij at master · tudelft3d/indoorjson · GitHub.
- many others, T.V.M.a. COMPAS: A framework for computational research in architecture and structures. [CrossRef]
- Aric, A. Hagberg, Daniel A. Schult.; Pieter J. Swart. Exploring network structure, dynamics, and function using NetworkX. In Proceedings of the Proceedings of the 7th Python in Science Conference (SciPy2008). pp. 11–15.
- March, S.T.; Smith, G.F. Design and natural science research on information technology. 15, 251–266. [CrossRef]
- Peffers, K.; Tuunanen, T.; Rothenberger, M.A.; Chatterjee, S. A Design Science Research Methodology for Information Systems Research. 24, 45–77. [CrossRef]
Figure 6.
An UML diagram illustrating data included in a Hospital Configuration Model
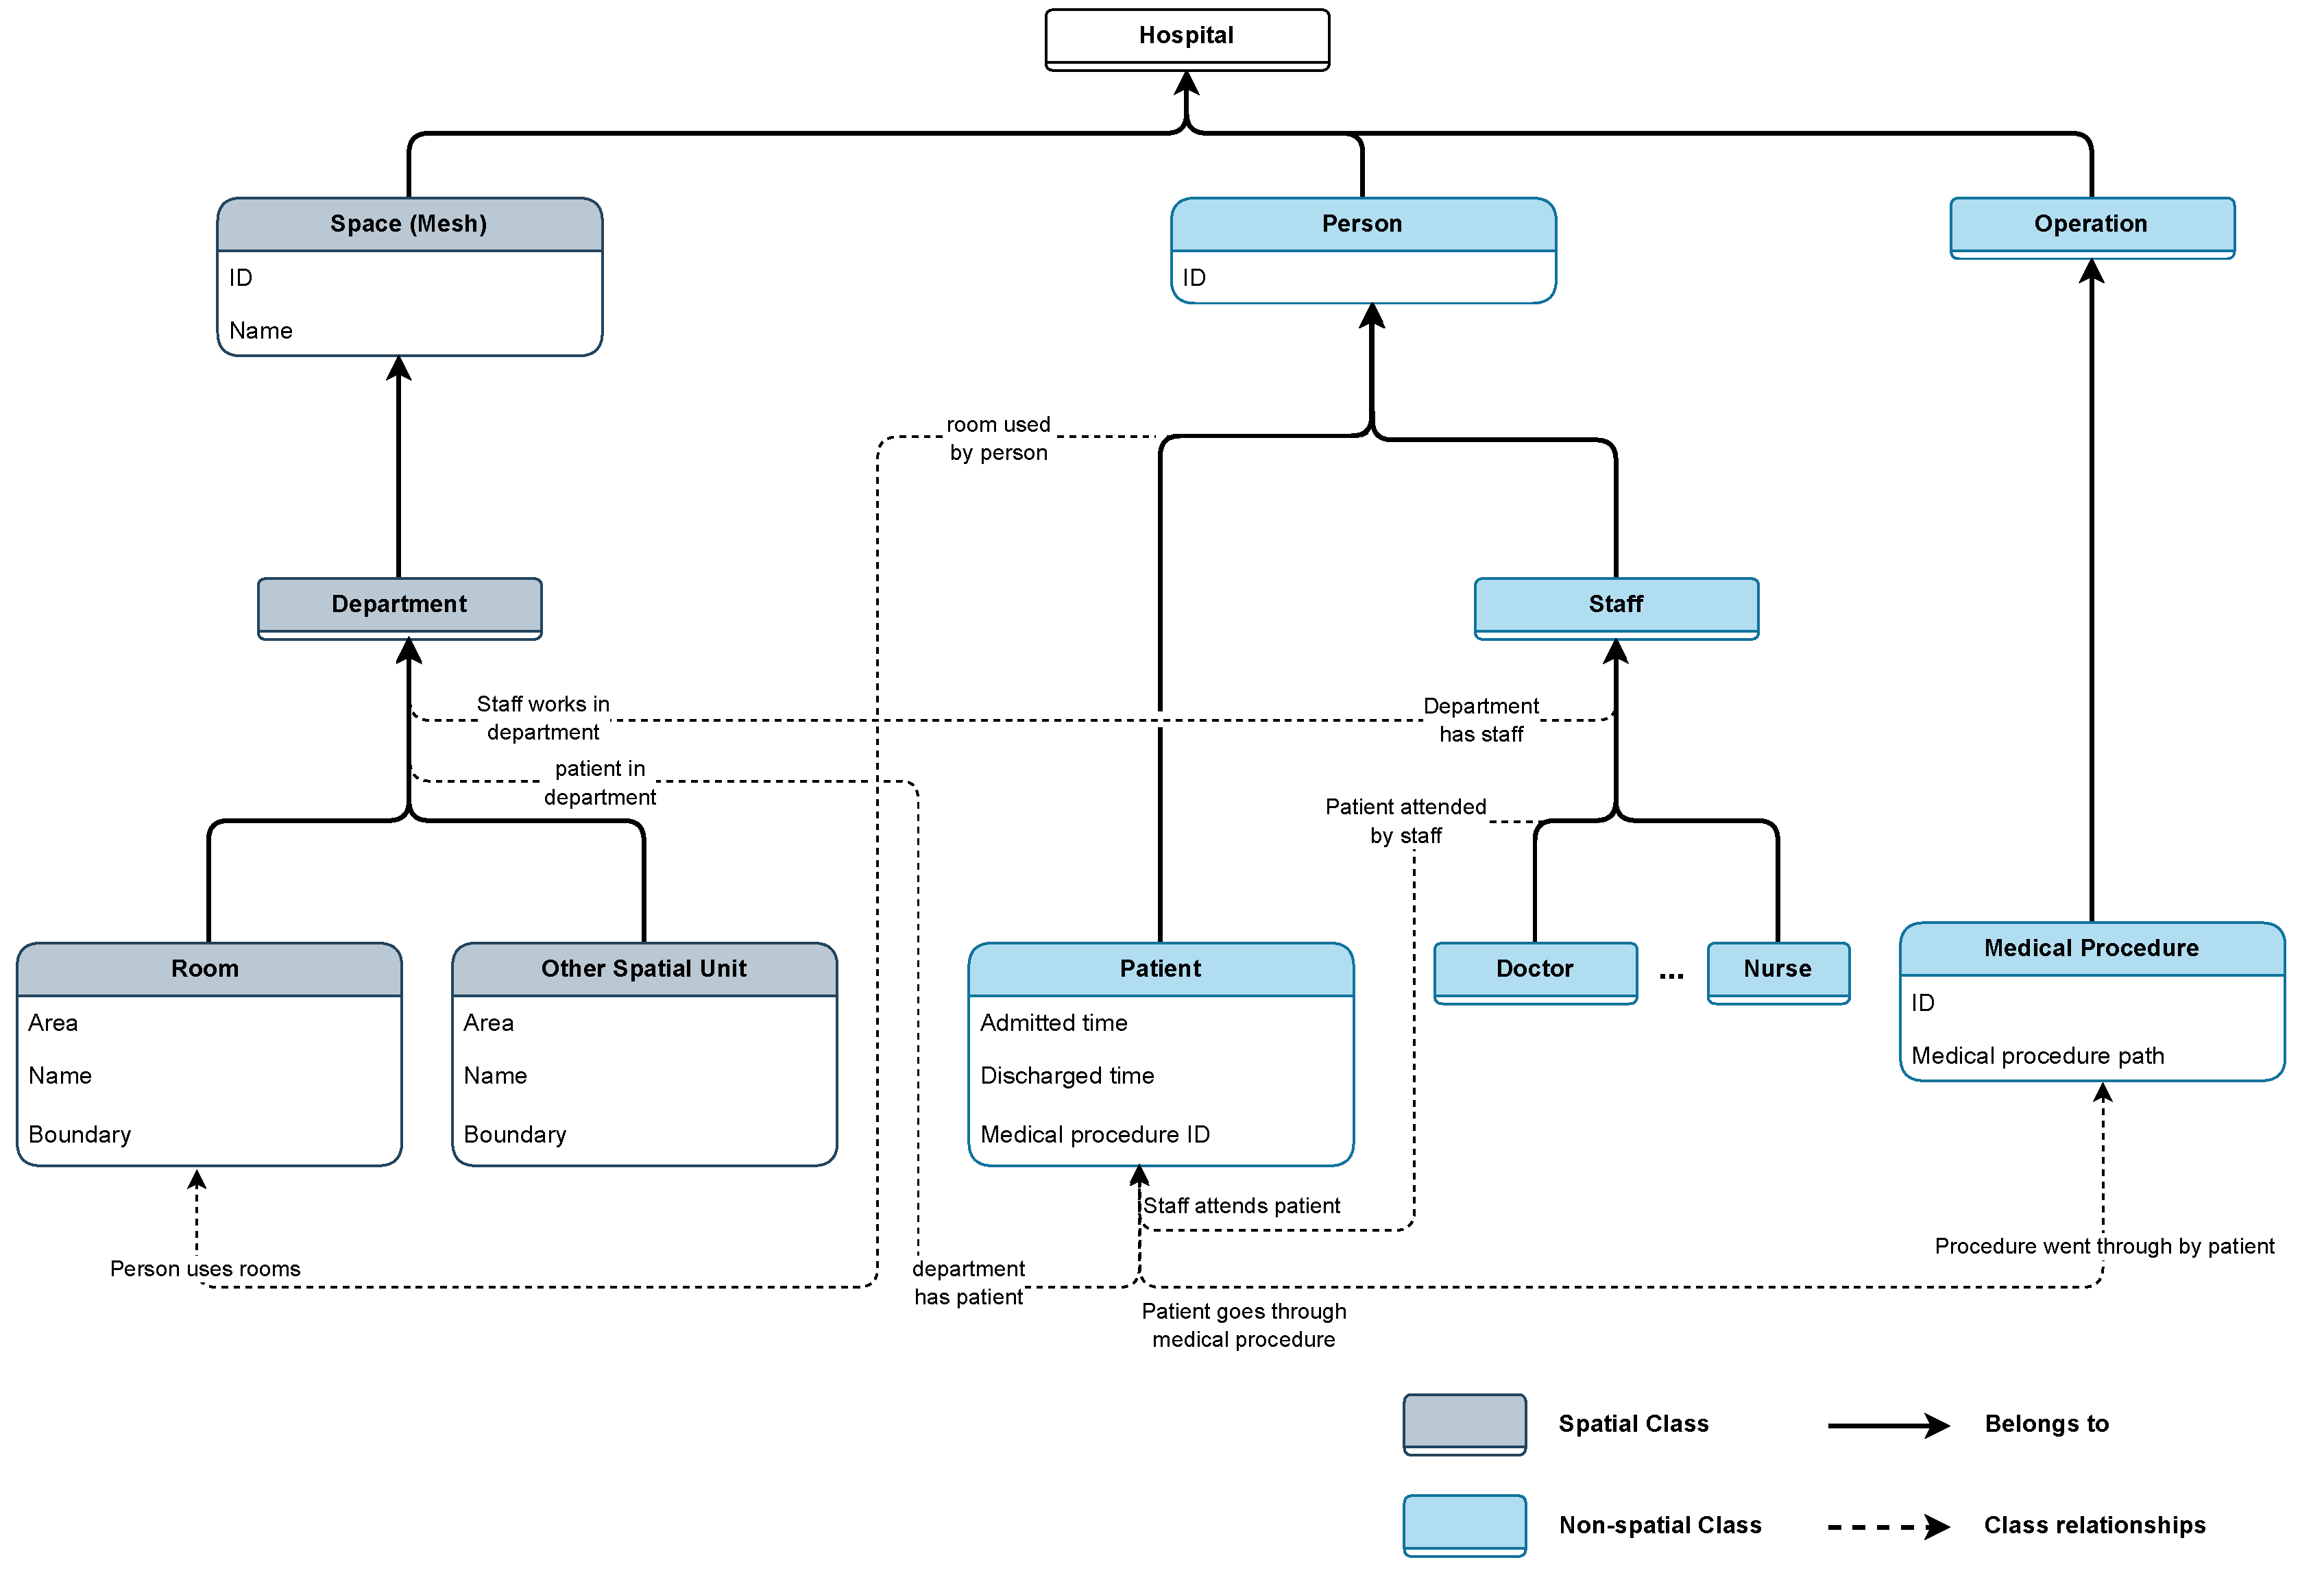
Figure 7.
An illustration of IndoorGML’s data structure
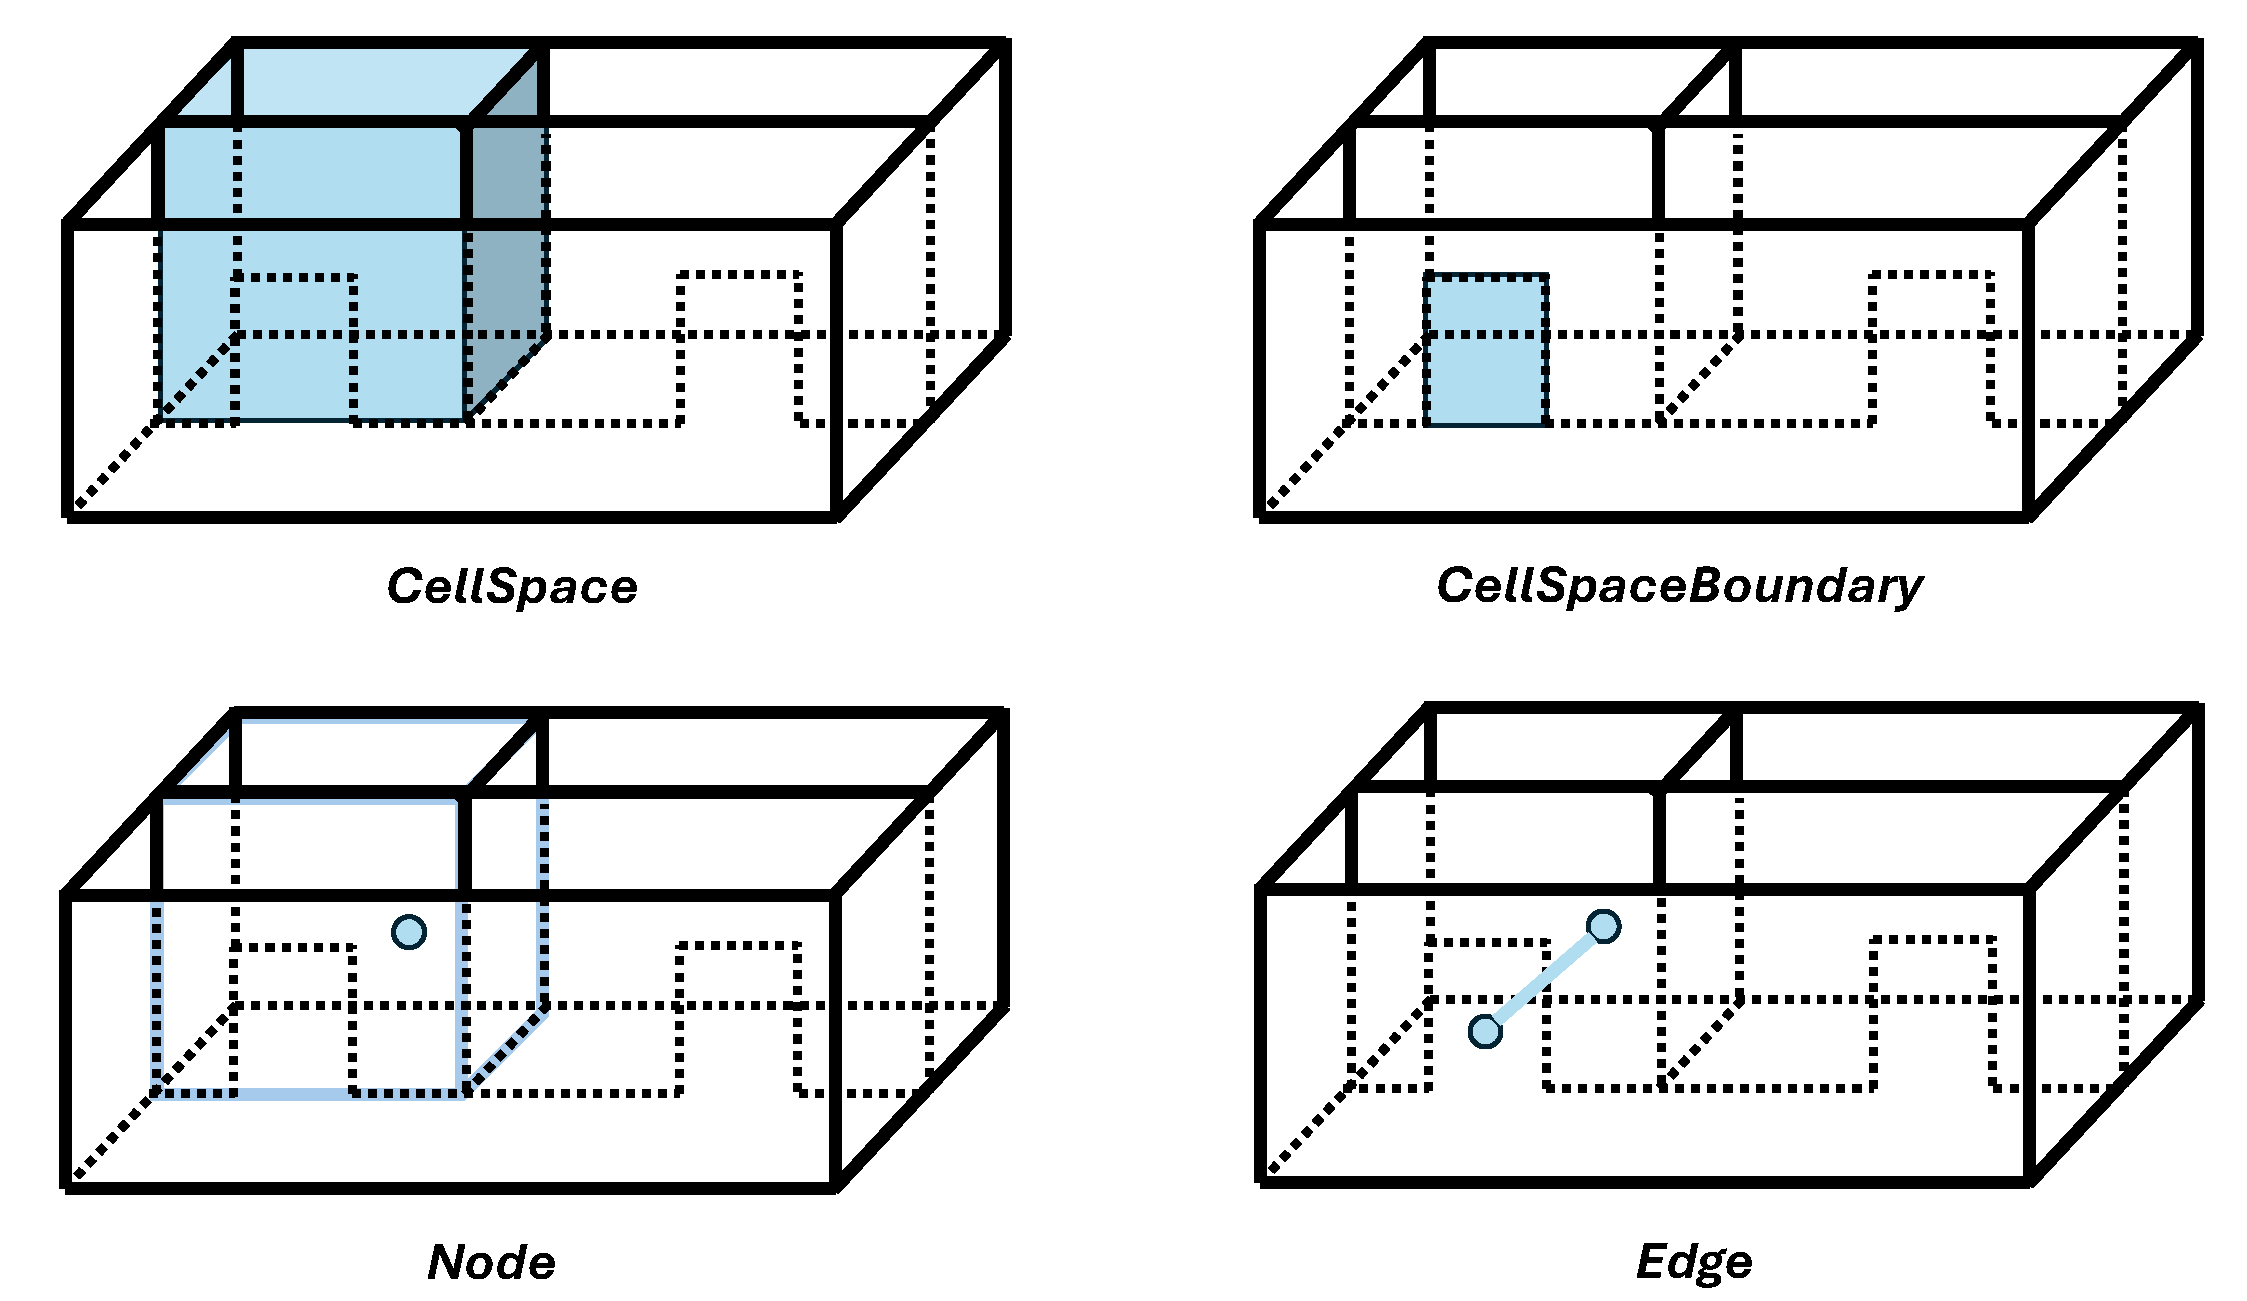
Figure 8.
An example of hospital IndoorGML model, image source: [23]
Figure 8.
An example of hospital IndoorGML model, image source: [23]

Figure 9.
The workflow from Hospital IFC Model to Hospital Configuration Model, source: [23]
Figure 9.
The workflow from Hospital IFC Model to Hospital Configuration Model, source: [23]
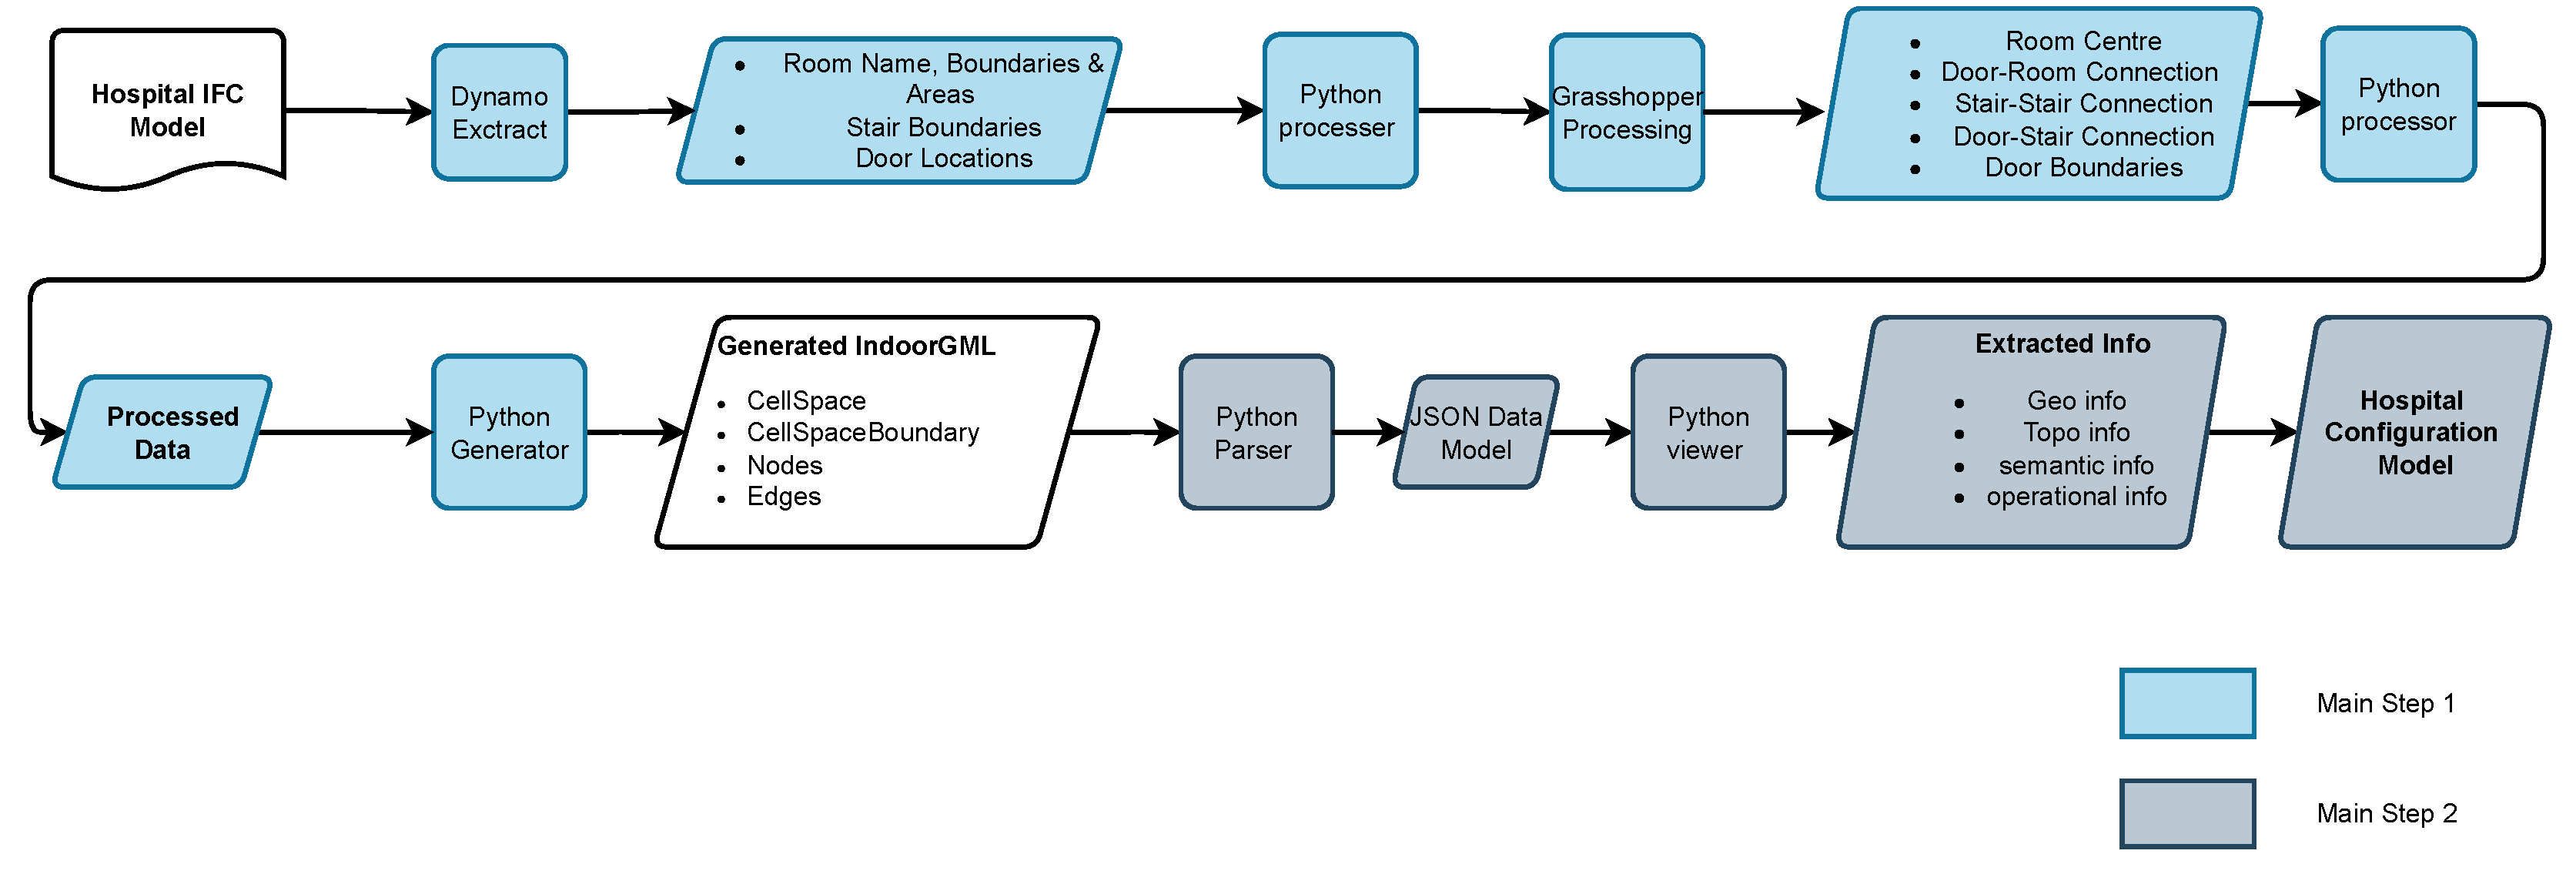
Figure 10.
The basic architecture of MVCl, image source [27]
Figure 10.
The basic architecture of MVCl, image source [27]
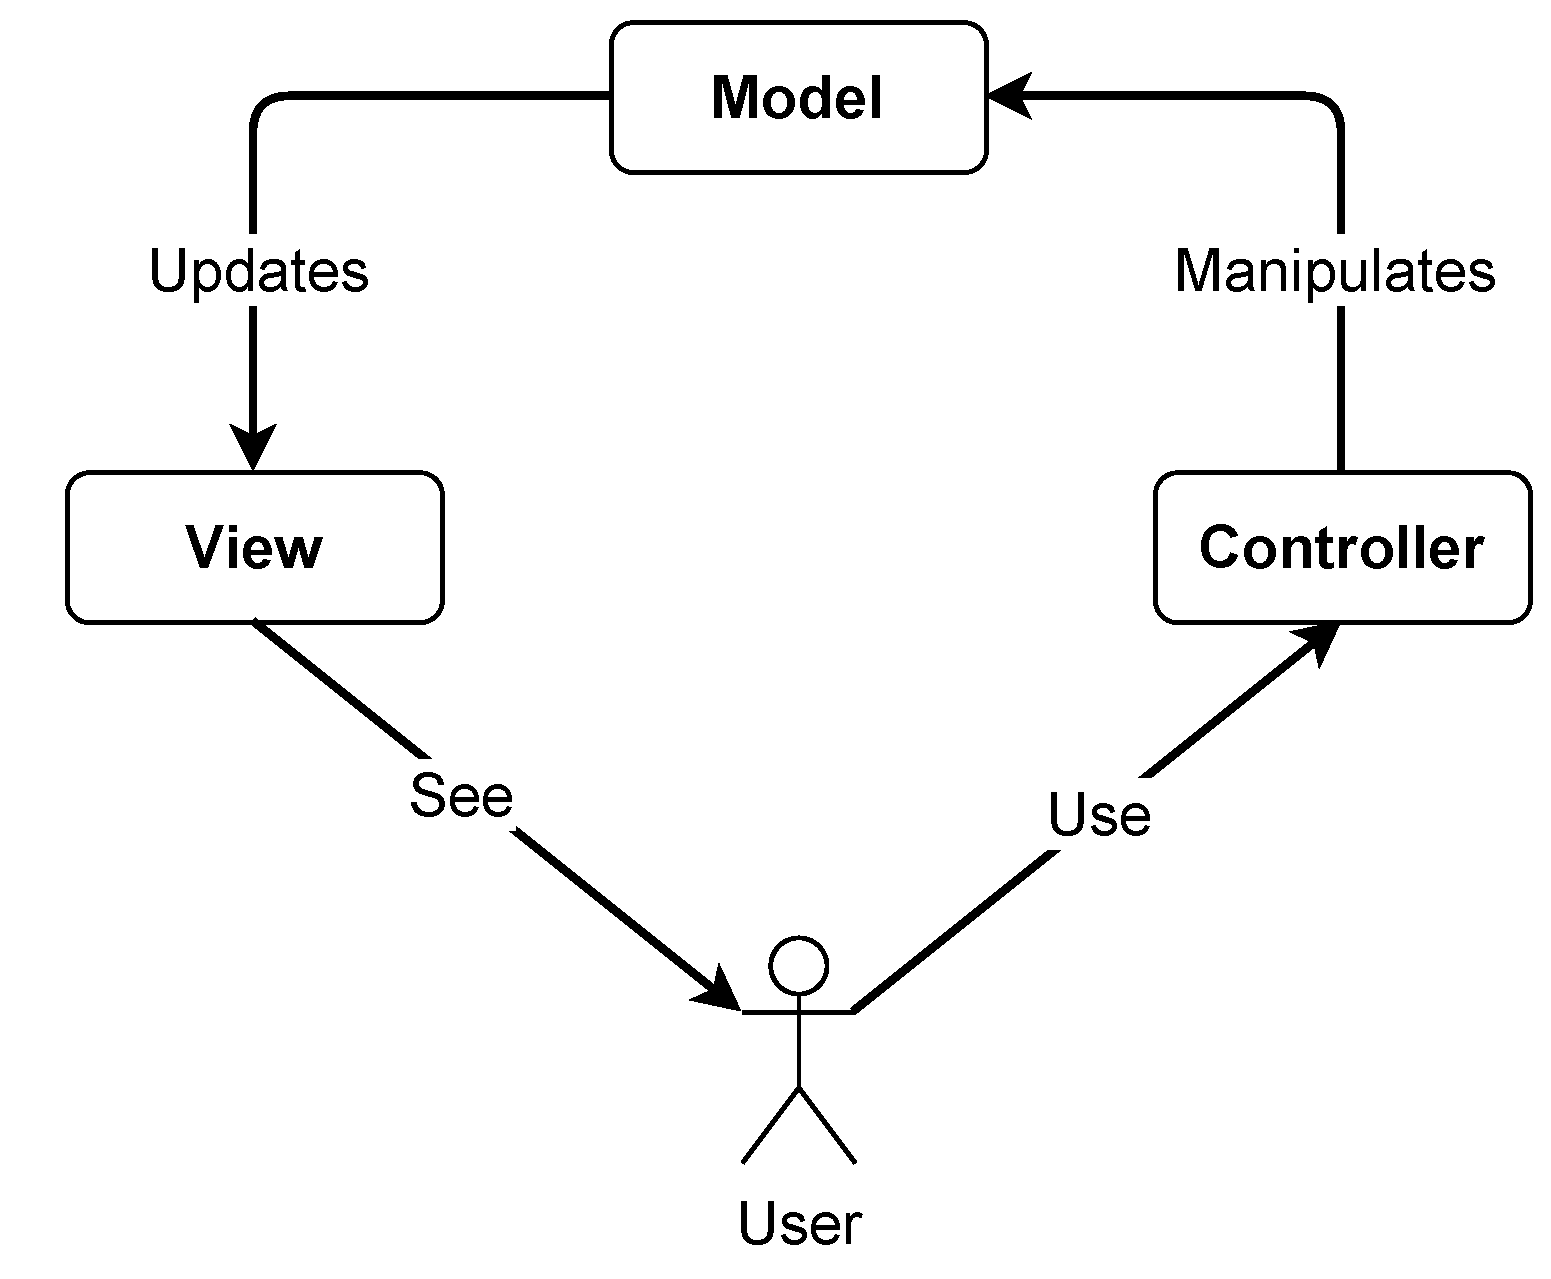
Figure 11.
View function for extracting semantic information, source: [23]
Figure 11.
View function for extracting semantic information, source: [23]
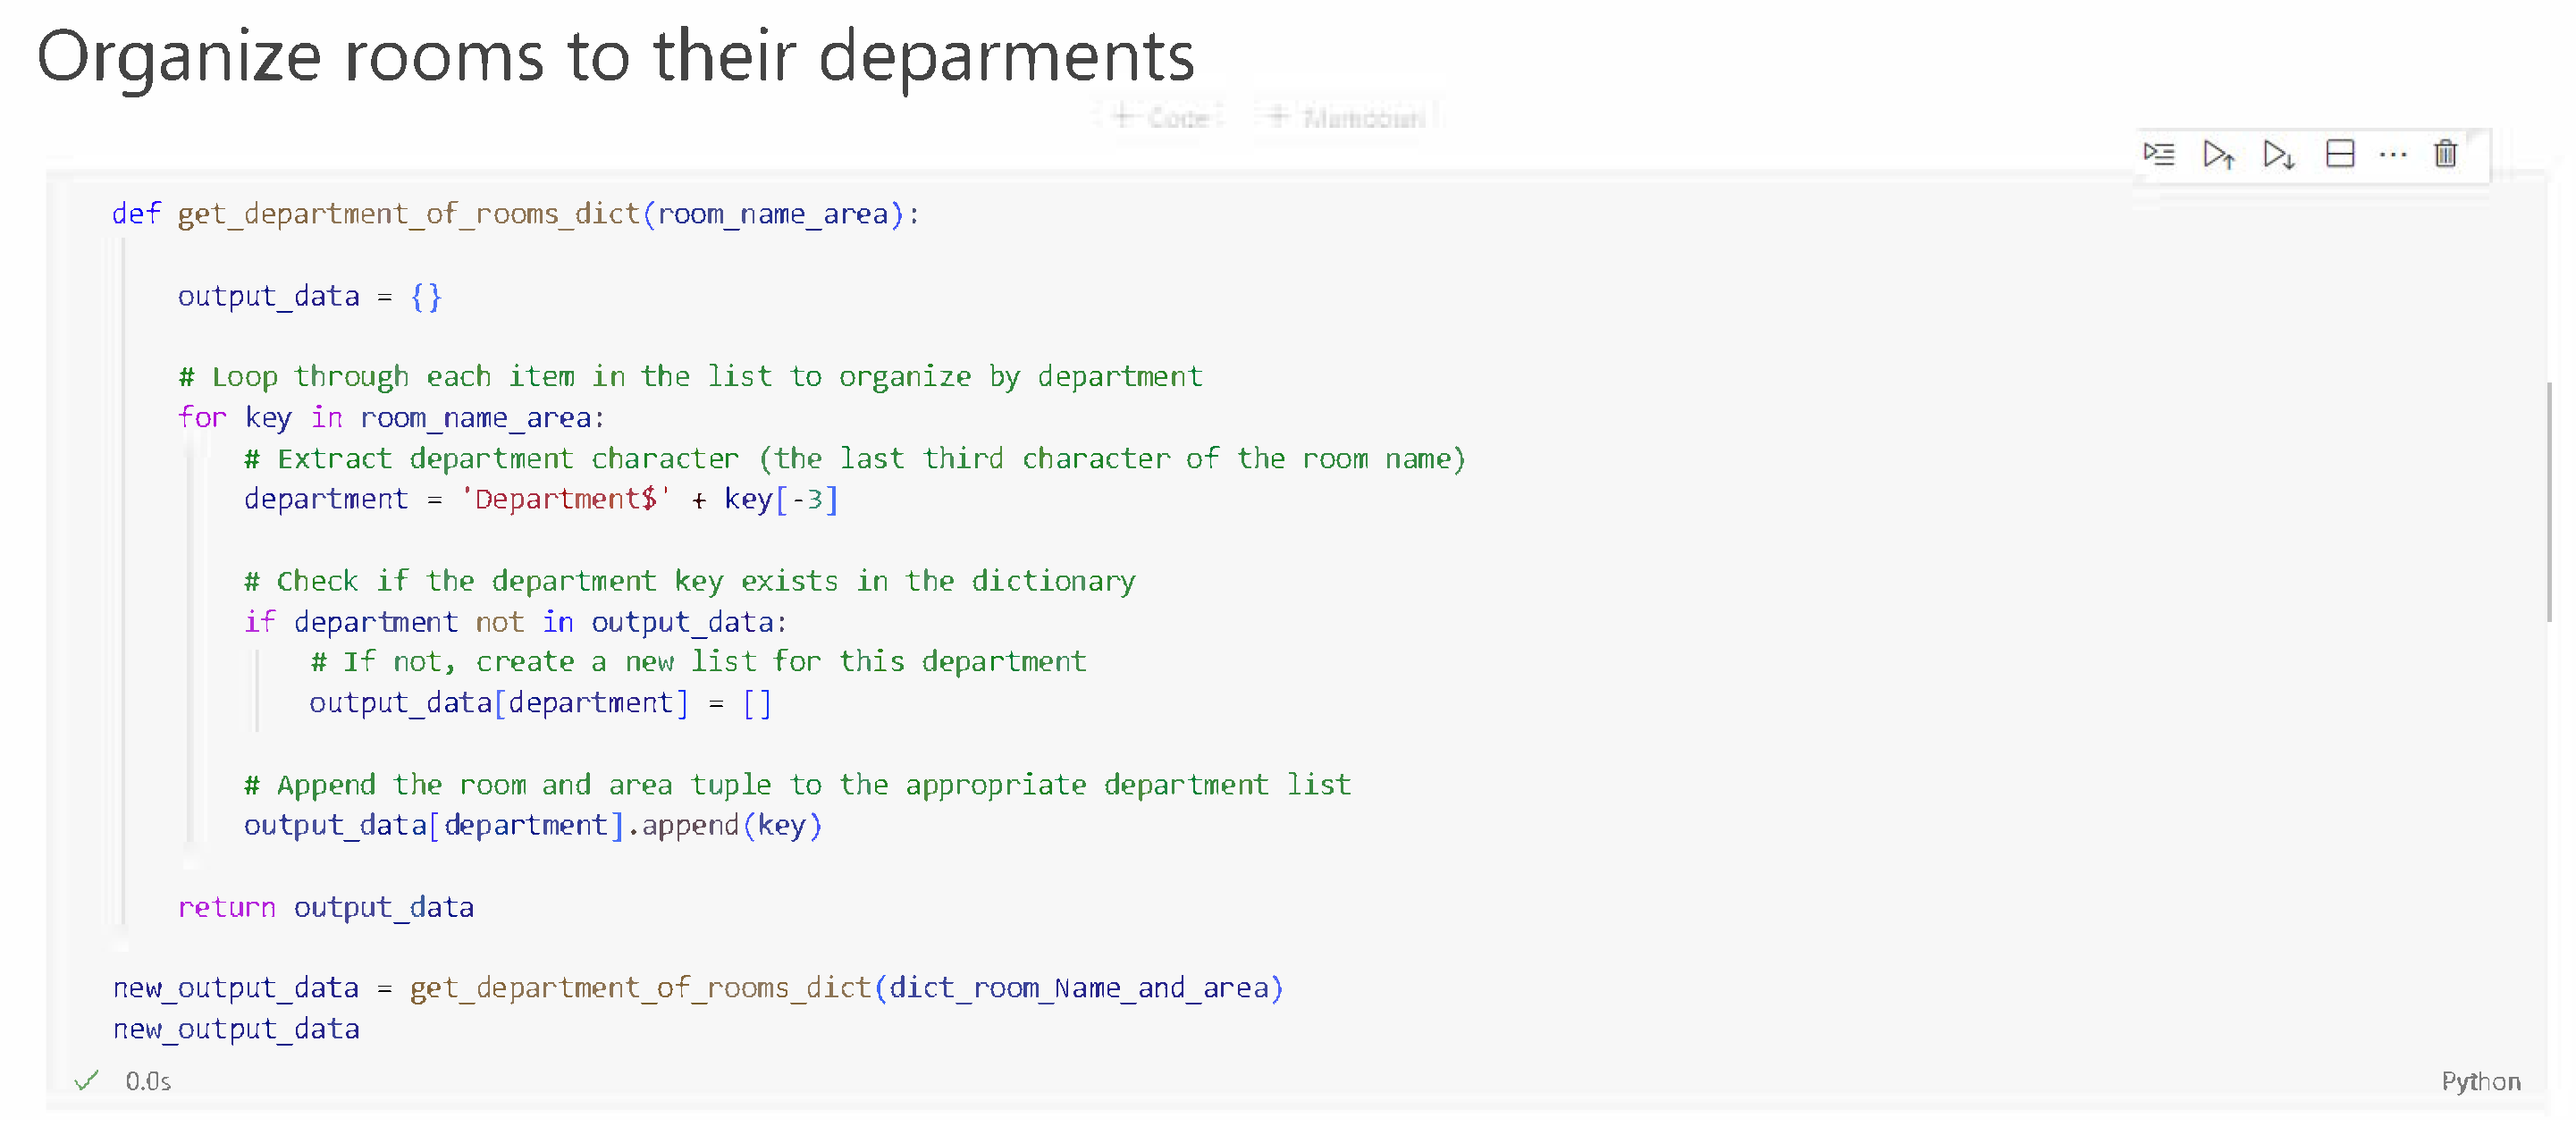

Table 1.
Examples of four types of information in a Hospital Configuration Model
| Information Type | Explanation | Example |
|---|---|---|
| Geometric Information |
Room boundary consisting of a series of 3D points |
{’central_waiting’: [’-20,34,4’,’-20,29,4’,’, ’-19,29,4’,’-19,39,4’,’-20,34,4’]} |
| Topological Information |
A Network Graph consisting of nodes and edges |
{’Graph1’: [{"node1": {"id": "R1"}, "node2": {"id": "R3"}, "edge1":{"id": "e1"}}]} |
| Semantic Information |
Room Name | {’Department$Imaging’: [’Central_waiting’]} |
| Operational Information |
A patient journey through the hospital ( a series of rooms that the patient need to attend) |
{’patient_journey_1’: [’Entrance/Exit’,’Registration’, ’consulting’,’Entrance/Exit’]} |
Table 2.
Extracted semantic information of the HCM, notice: for simplicity reasons, the information shown here is incomplete, for a complete version of the information please see this repository.
Table 2.
Extracted semantic information of the HCM, notice: for simplicity reasons, the information shown here is incomplete, for a complete version of the information please see this repository.
| Departments & Rooms |
|---|
| {Department$A’: [’CENTRALWAITING1AC1’,’CORRIDOR2AC3’,’PHARM.DISP.1A16’, ’CORRIDOR2AC1’,’DENTALWAITING2A11’, ... ’X-RAYALCOVE2A12-A’]} |
| {’Department$B’: [’CORRIDOR1BC2’,’LAB1B04’,’CORRIDOR1BC4’, ... ’RECEPTION1B01’,’RECEPTION1B13’,’TECHOFFICE2B9’]} |
| {’Department$D’: [’WAITING/ACTIVITYAREA1DC1’,’MAINMECHANICALROOM2D05’, ... ’INTERACTIONSTATION1D11’,’INTERACTIONSTATION1D07’, ’INTERACTIONSTATION1D08’,’INTERACTIONSTATION1D09’, INTERACTIONSTATION1D28’,’INTERACTIONSTATION1D34’, ’INTERACTIONSTATION1D35’, ... ’COMPUTERROOM2D04A’]} |
| ... |
Table 3.
Source data and output data of HCM’s operational information, source: [23]
Table 3.
Source data and output data of HCM’s operational information, source: [23]
| Input data list | Output data list |
|---|---|
| origianl_medical_path_1 = [’registration’,’triage’,’waiting’, ’diagnosis’,’medicine’] |
medical_path_1 = [’RECEPTION1B13’, ’WTSandMEAS.ROOM1D15’, ’WTSandMEAS.ROOM1D30’, ’WAITING/ACTIVITYAREA1DC1’, ’INTERACTIONSTATION1D11’, ’INTERACTIONSTATION1D07’, ’INTERACTIONSTATION1D32’, ’INTERACTIONSTATION1D02’, ’INTERACTIONSTATION1D13’, ’INTERACTIONSTATION1D36’, ’INTERACTIONSTATION1D10’, ’INTERACTIONSTATION1D08’, ’INTERACTIONSTATION1D09’, ’INTERACTIONSTATION1D28’, ’INTERACTIONSTATION1D34’, ’INTERACTIONSTATION1D35’, ’PHARM.DISP.1A16’] |
Table 4.
An example showing how controller codes add information to the data model (Please note the data of people density in this example is hypothetical)
Table 4.
An example showing how controller codes add information to the data model (Please note the data of people density in this example is hypothetical)
| Room Attributes | |
|---|---|
| Before | {’CENTRALWAITING’: {’area’: ’127’}, ’WAITING/ACTIVITYARE’: {’area’: ’178’}, ...} |
| After | {’CENTRALWAITING’: {’area’: ’127’, ’people density’: ’0.9’}, ’WAITING/ACTIVITYARE’: {’area’: ’178’, ’people density’: ’1.0’}, ...} |
Disclaimer/Publisher’s Note: The statements, opinions and data contained in all publications are solely those of the individual author(s) and contributor(s) and not of MDPI and/or the editor(s). MDPI and/or the editor(s) disclaim responsibility for any injury to people or property resulting from any ideas, methods, instructions or products referred to in the content. |
© 2024 by the authors. Licensee MDPI, Basel, Switzerland. This article is an open access article distributed under the terms and conditions of the Creative Commons Attribution (CC BY) license (http://creativecommons.org/licenses/by/4.0/).
Copyright: This open access article is published under a Creative Commons CC BY 4.0 license, which permit the free download, distribution, and reuse, provided that the author and preprint are cited in any reuse.


