
Submitted:
23 February 2025
Posted:
24 February 2025
You are already at the latest version
Abstract
The development of primary healthcare facilities facilitates a balanced distribution of medical resources, relieving pressure on large hospitals by enhancing these facilities, thus optimizing resource allocation. Such equitable distribution not only improves the accessibility and fairness of healthcare services, but also supports their sustainable growth. This study introduces a spatial resilience framework that evaluates transmission, diversity, and stability from a spatial resilience perspective. Focusing on Harbin's main urban area's primary healthcare facilities, methods such as Gaussian-Based Two-Step Floating Catchment Area (2SFCA), network analysis-based service radius, walking impedance, and overlap analysis are utilized for spatial distribution analysis. Findings indicate significant variance in facility transmission, with Daoli, Nangang, and Xiangfang Districts showing higher accessibility, Songbei and Daowai Districts exhibiting lower transmission. The road network capacity decreases from the urban center towards the periphery in a diminishing pattern. Local Indicators of Spatial Association (LISA) identifies areas with demand-supply mismatches, primarily in northern Xiangfang District and southern Songbei District, while overall spatial connection remains balanced. Based on these findings, we propose strategic enhancements for medical facilities of corresponding levels, offering insights for similar large cities seeking to refine their primary healthcare spatial layout.
Keywords:
spatial resilience
; primary care facilities
; Ga2SFCA
; network analysis
; resilience evaluation
1. Introduction
In recent years, the acceleration of urbanization has led to a marked increase in urban spatial systems' sensitivity to external pressures, significantly enhancing their vulnerability [1]. In this context, the development of robust and resilient urban systems has emerged as a critical focus in the research and practice of urban planning [2]. Among these systems, the network of medical facilities plays a vital role in maintaining urban safety and health, highlighting its increasing importance. Directly tied to the fundamental health needs of the population, the healthcare facility system is essential for the continuity and stability of urban activities. In the face of sudden public health emergencies [3], a well-developed medical facility system can respond quickly and effectively reduce the threat of disasters to residents' lives and health, thereby ensuring the seamless operation of various urban functions. However, conventional planning and layout approaches for medical facilities tend to be inflexible, rendering them ill-equipped to cope with complex [4], dynamic, and unpredictable pressure scenarios. This rigidity significantly constrains the overall enhancement of urban resilience.
In the phase of high-quality development, primary healthcare facilities should move beyond their inherent functional constraints, and integrate more closely with efforts to enhance urban resilience [5]. By fostering collaborative interactions between primary healthcare and other urban systems, cities can more effectively respond to various shocks, maintain normal operations, and facilitate continual renewal and evolution [6]. Specifically, we should employ medical buildings to improve social living conditions while protecting lives and health, thereby creating a comprehensive system that incorporates healthcare, environmental, and social dimensions. See Figure 1.
In this study, the medical resources in the main urban area of Harbin are grouped according to the Health Statistics Yearbook. National healthcare institutions are divided into four categories: hospitals, primary medical institutions [7], specialized public health institutions, and other facilities. This research focuses specifically on primary healthcare institutions, within the central area of Harbin's urban district. For this analysis, outpatient departments and clinics (medical offices) [8] within primary healthcare are merged into a single category referred to as "clinics." Consequently, the subjects of this study encompass three types: community health centers[9], community hospitals, and clinics. These categories are further delineated into hierarchical levels based on the classification of healthcare resources and service scope: community health centers, community hospitals, and clinics[10].
In prior studies,a number of papers published in 2023 utilized statistical analysis to investigate the impact of accessibility on walking trip probability and duration[11]. M. Das and B. Dutta assessed slum populations, existing healthcare facilities (HCF), and slum communities characterized by low geographical accessibility. They developed an analytical model for regions located outside the coverage of existing healthcare institutions (HCF)[12]. The paper uses cities as case studies, such as Beijing, as an example for research, proposed a novel framework constructed from multisource data to analyze regional accessibility within urban healthcare systems, placing particular emphasis on prevalent diseases among the elderly. They gathered online registration data to evaluate the capacity of healthcare service supply, while considering the impact of the service scope offered by these facilities[13]. In 2024, related papers used a two-step floating catchment area method to measure pedestrian accessibility to urban parks, revealing significant geographic disparities[14].
From a holistic perspective, existing research rarely examines healthcare access from the multiple dimensions of residents' needs. There has been little extension from the intrinsic characteristics of resilience to detailed analyses, and the optimization of healthcare layouts frequently lacks practical implementation. Firstly, concerning the choice of research methods and perspectives, most studies tend to focus on the diverse and multidimensional demands of residents seeking medical treatment[15]. However, there is a notable scarcity of studies that incorporate resilience theory into the analysis of residents' healthcare systems. Consequently, it is necessary to conduct more in-depth research on the actual operation of medical institutions at different regions and levels. By leveraging modern technological approaches such as big data analysis, it is crucial to propose actionable and targeted optimization strategies. Furthermore, there should be an emphasis on specific studies addressing the practical implementation of layout optimization, with the objective of constructing a more efficient, equitable, and resilient healthcare environment for residents[16].
Using the Gaussian two-step attenuation method to deeply analyze residents' walking impedance, the average value and standard deviation of medical transmission in various areas of the main urban district of Harbin were calculated[17]. This data effectively quantifies the distance costs that residents in different areas must incur to access medical services[18]. Through the analysis of cold and hot spot clustering, the disparities in the richness of medical resources and their distribution capabilities among various regions were visually assessed, providing essential evidence for understanding how healthcare resources are allocated across different areas. While assessing citizens' healthcare options, the full service radius study also examines healthcare service coverage. To more accurately identify unstable areas within the healthcare distribution, an overlapping analysis of service radii was conducted[19], supplemented by LISA, which identified regions that necessitate additional medical facilities. Finally, building on the aforementioned analyses, optimization strategies for the layout of medical facilities were proposed[20], alongside a thorough discussion of specific implementation approaches for these strategies. The entire research process and framework are illustrated in Figure 2, which has been refined based on the resilience characteristics framework. This framework adopts an analytical perspective on the distribution of healthcare resources from the standpoint of residents seeking medical care, allowing for a more comprehensive and in-depth understanding of the medical resource distribution in Harbin's main urban area. Furthermore, this analytical approach also considers social life and has attempted spatial resilience-based layout optimization, thus providing valuable references and insights for future urban planning and healthcare resource allocation[21].
2. Materials and Methods
2.1. Scope of the Study
Harbin, the capital city of Heilongjiang Province, located in the northeastern part of the country, near the Russian border. As an important city in China, Harbin holds significant geographical, cultural, and historical importance. It consists of 18 administrative districts, including 9 urban districts, 2 county-level cities, and 7 counties. This study, utilizing satellite map data from 2023, focuses on the main urban area of Harbin, specifically examining five administrative districts: Xiangfang, Nangang, Daoli, Daowai, and Songbei, all located within the Fourth Ring Road, covering an area of 589.03 square kilometers. Traditional planning for medical facilities primarily relies on land use functions and population metrics[22], often neglecting the actual needs of residents. In response, Harbin has actively promoted the development of private medical institutions, leading to the establishment of a diversified healthcare service system that meets the varying levels and demands for medical services[23].This is also the reason for selecting Harbin as the research area.
As illustrated in Figure 3, the terrain of the study area displays a traditional spatial structure, characterized by a ring-radiation pattern within the main urban center of Harbin. This main urban area is situated along the Fourth Ring Road, which has been progressively expanding in the north-south direction in conjunction with the highway. In the north, it connects to the urban center via Heihe Road, while to the south, it is linked through the Jingha Expressway. This spatial configuration significantly supports the flow of information within Harbin. The focus of this study is on the urban built-up area of the main urban district as its research scope (see Figure 3).
2.2. Data Collection and Preprocessing
The data sources utilized in this study include: (1) Administrative division data, transportation network data, and medical facility point data for the main urban area of Harbin. The ARCGIS software is used to further process the transportation network data, facilitating subsequent analysis of road traffic capacity. After clipping, the administrative division data yields regional raster data. The CAD-based road network map is processed, followed by on-site surveys and spatial network simulations to update the road data. This road data reconstructs the actual three-dimensional connectivity of the spatial network, thus enhancing the authenticity and accuracy of the research. Additionally, building vector data and population distribution data illustrate the extent of urban spatial demand for medical facilities, providing an objective representation of the supply-demand relationship within the urban context. The points of interest for healthcare service facilities reflect the distribution of supply points, objectively depicting the service areas of tertiary medical facilities. Medical facility point data was sourced from Gaode Map, identifying a total of 244 community health centers, 184 community health service stations, and 872 community clinics within the study area, clipping the administrative division data also generates regional raster data.

Table 1.
Data sources and applications.
| serial number | A class of data | Category 2 data | Data source | Apply |
| 1 | Geographic information class | Points of interest for various medical and health service facilities in Harbin(POI) | AutoNavi map, Harbin Municipal Health Commission official website | Get the regional distribution of medical service levels for analysis. |
| 2 | Administrative division data | Download in the National Geographic Information Resource Directory service system. | Build an analyzable base map of your data. | |
| 3 | Ration | Population data of the central urban area of Harbin | Data from the 7th Population Census published on the government network | Calculate the demand for and accessibility to medical facilities in each district based on population. |
| 4 | The scale of the medical facility level | The official website of the Health Commission and other government departments | Explore the functional layout and complementarity of facilities of different scales and their service capacity and coverage. | |
| 5 | Number of patients in medical facilities, occupancy of hospital beds, and quality of medical services | The official website of the Health Commission and other government departments | Reflect on the actual operation and service effect of medical facilities. | |
| 6 | Resident health data | The official website of the Health Commission and other government departments | Analyze the role of primary healthcare facilities in residents' health management. | |
| 7 | Transportation | Transportation network data | OpenStreetMap official website | Use this data as a base map to establish data connections with facility data and analyze accordingly. |
| 8 | Architecture | Architectural outline | OpenStreetMap official website |
(2) Other Data: healthcare data, and related reports. The correlation between the data is shown in Figure 4.
(3) There is a significant shortage of data on the service capacity of primary healthcare facilities in Harbin, particularly regarding relevant medical resource data at the municipal level, such as the number of beds and healthcare personnel. When calculating the regional average transport values, the service capacities for health centers, community hospitals, and clinics are assigned values of 200, 100, and 5, respectively, based on the existing literature[24].
2.2.1. Road Network Data and Points of Interest
The study covers an area of 589.03 square kilometers.The road network data includes information such as the type, length, width, and intersection locations of roads, covering the network structure of major roads, secondary roads, branches, and highways in the city. In Figure 4, various colors, icons, and sizes are employed to represent different types of healthcare resources. This approach facilitates the analysis of the distribution density of medical resources, clearly highlighting regions with abundant and scarce resources. The paper examines the causes of these disparities and the influencing factors. Furthermore, it proposes measures and recommendations aimed at improving and optimizing the allocation of medical resources (see Table 2).
2.2.2. Building Contour Data and Population Data
Building contour information can be obtained through satellite imagery data; population data can be obtained through the regular release of population figures by statistical bureaus, including total population, population by age groups, gender distribution, and other detailed information. The density of building outlines can serve as an indicator of population distribution within a region. Areas characterized by a high number of buildings and complex profiles typically have a greater population density, resulting in a larger resident count and a more diverse range of healthcare needs. When designing medical facilities, population distribution and urban development should be considered.
In the main urban area, Red lines divide the polygonal building or complex. Figure 5 clearly illustrates the spatial distribution and shape characteristics of the buildings, showing that their distribution within the region is relatively concentrated (see Figure 6).
The following charts clearly illustrate the quantity of healthcare resources at different levels within the designated zones, along with the population figures. This presentation facilitates a clearer understanding of population distribution and trends (see Figure 7).
2.2.3. Create Spatial Analysis Units
Healthcare resources were classified into health centers, community hospitals, and clinics, after which the road network data was integrated with the Point-of-Interest (POI) data for these healthcare facilities. The study area was divided into 2,482 grids, each with a side length of 500 meters. A mask was generated to exclude the water body of the Songhua River. Spatially connect POI data to the grid to count facilities in each grid and within it. The results revealed that among the 2,482 grids, 1,968 were found to be empty (see Figure 8).
2.3. Research Methods
2.3.1. OD Distance Cost Impedance Analysis
Building on the assessment of walking accessibility between residents' demand points and healthcare resources, the connectivity of Harbin’s healthcare resource network was evaluated. Data regarding origin points, destination points, and network datasets was collected. An Origin-Destination (OD) cost matrix was then constructed using GIS software, reflecting the ease of access from each demand point to each healthcare resource point. Path accessibility was analyzed according to the OD cost matrix. A hierarchical analysis was subsequently performed based on the results obtained, aimed at optimizing the allocation of healthcare resources[25].
2.3.2. Gaussian Two-Part Mobile Search Method
The article chooses to use the Gauss two-step moving search method, compared to traditional methods, can find the optimal solution to the problem more quickly, improving both search efficiency and accuracy. In the following analysis, this method is related to specific data comparisons and can provide more precise solutions.
The Gaussian two-step moving search method[26] was introduced by Dai in 2010, with the following general expression:
In this expression, ( Ai ) represents the accessibility of demand point i to healthcare resources, while ( Sj ) indicates the service capacity of healthcare facility point j, typically represented by metrics such as the number of beds or physicians. ( Dk ) refers to the demand for medical services; in this study, the resident population is utilized as a proxy for healthcare demand. The variable ( dij ) denotes the distance or time cost between supply point j and demand point i, and f(dij) represents the Gaussian distance decay function, which can be further expressed as follows:
where ( d0 ) signifies the threshold of the search range. Based on related literature, the threshold ( d0 ) is set at 1500 meters for community health centers, 1000 meters for community health service stations, and 500 meters for community clinics[27].
2.3.3. Service Scope Analysis Based on Network Analysis
Based on the current state of healthcare resources in the main urban area of Harbin, the three tiers of medical resources requiring analysis were determined. Reasonable service radii were established based on the actual conditions of these healthcare resources. Utilizing network analysis tools, an analysis of the medical resource points was conducted, resulting in the delineation of service areas. In instances where multiple healthcare resource points have overlapping service areas, it is essential to apply mutually exclusive treatment or merging of these areas. The results of the analysis were visualized to facilitate an intuitive understanding of the service coverage[28].
2.4. Research Routes
According to the six fundamental characteristics of resilience (defined as the capacity of healthcare resources to recover from external impacts), resilience at the level of residents seeking medical care can be represented by a stable healthcare network, the provision of multiple pathways for accessing medical resources, and the ease of resource sharing among healthcare facilities. Spatially, resilience is reflected in three characteristics: stability, transmissibility, and diversity[29].
Stability refers to the spatial heterogeneity of grassroots medical facilities; a stable healthcare environment can enhance the utilization rate of these facilities, and bolster the overall stability of the healthcare system. Diversity denotes an increased range of access to primary medical facilities within a reasonable walking distance for residents. Transmission demonstrates how easy it is for patients to access primary healthcare resources[30]. The framework illustrating the relationship between resilience and primary healthcare facilities is presented in Figure 9. (See Figure 9)
3. Analysis
3.1. Quantitative Analysis of Medical Transferability
3.1.1. Analysis of the Difficulty of Residents to Obtain Medical Resources on Foot
This section provides a detailed visualization of pedestrian accessibility in the main urban area of Harbin, clearly illustrating the varying levels of walking accessibility across different districts. Such visualizations serve as a useful reference for residents' daily movement. As shown in Figure 10, different colors are employed to indicate the accessibility of medical resources. The red areas signify locations where walking access for residents is relatively easy, whereas the green areas indicate locations that present greater challenges to pedestrian access. (Refer to Figure 10)
A thorough analysis of Figure 9 reveals that Nangang District exhibits the highest walking accessibility to medical resources, allowing residents to easily access medical services. Daoli District also demonstrates a high level of walking accessibility. Xiangfang District and Songbei District show moderate levels of accessibility; while walking in these areas is somewhat more challenging than in the first two districts, it remains generally acceptable. Conversely, Daowai District presents relatively low walking accessibility to medical resources, requiring residents to exert more effort to obtain medical services.
3.1.2. SDNA Analyzes the Road Traffic Potential of the Main Urban Area
(1) The analysis of road access potential is a form of network centrality, similar to proximity and intermediacy. It evaluates the difficulty of navigating from each road to all possible destinations within a specified radius, thereby assessing the strength of the road network's accessibility in the surveyed area[31]. Through an analysis of the road network in the main urban area of Harbin, road accessibility is categorized and visualized as high, relatively high, medium, poor, and very poor, represented by a gradient of colors as shown in Figure 11. The results indicate that the road access potential in Harbin's main urban area diminishes gradually from the center outward. By administrative district, Daoli District, Nangang District, and Xiangfang District have higher road accessibility, while Daowai District and Songbei District exhibit lower accessibility, with Songbei District displaying particularly significant differences compared to other districts. (Refer to Figure 11)
(2) The fishnet grid displays POI functional area identification results as particular values due to medical resource allocation and spatial relationships. The values are categorized into five levels. Figure 11 shows that POI distribution is clear in the urban core but weakens outside the third ring road in the central urban region. Facilities become more dispersed, resulting in longer distances and higher costs for seeking medical services. The results shown in this figure correspond to those in Figure 10; areas with higher density exhibit higher average transportability, while areas with lower density have reduced average portability. (Refer to Figure 12)
3.1.3. Gaussian Attenuation Function Analysis
Referencing relevant literature, the d0 values are set as follows: 1500m for community health centers, 1000m for community health service stations, and 500m for clinics. Using medical facilities as the center and d0 as the search radius, calculate the number of residents Dk within the search area and the distance dkj from residents to hospitals. This allows us to determine the transportability value of medical facilities concerning spatial distance costs[32]. The relative portability conditions among different regions in Harbin's main urban area are presented in Table 3. (Refer to Table 3)
From Table 3, the average value and analysis of transmission in each administrative region are as follows:
(1) The analysis of travelability values indicates that the main urban area displays a distribution pattern in which Daoli District, Nangang District, and Xiangfang District have higher transportability, while Songbei District and Daowai District have lower transportability. The road carrying capacity reflects a characteristic that gradually weakens from the center to the periphery. The ranking of accessibility is as follows: Nangang > Daoli > Xiangfang > Songbei > Daowai, with Daowai and Songbei Districts showing the lowest values, particularly in Songbei District, where transportability is notably low.
(2) In the analysis of peak regions, Nangang District shows relatively low accessibility discrepancies. This is attributed to its close proximity to the main urban area, high population density, and a dense road network that predominantly occupies the center of Harbin's main urban area, providing Nangang District with a notable advantage in transportability. The transmission standard deviation in Daowai District is high due to its extensive unoccupied areas and low street transmission.
(3) Overall, the analysis reveals significant differences in accessibility values among Daowai, Songbei, and Xiangfang Districts, resulting in varying levels of convenience for residents in accessing medical services within these three districts.
3.2. Quantitative Analysis of the Diversity of Medical Pathways
3.2.1. Analysis of the Concentration of Medical Facilities
Cold and hot spot analysis effectively identifies spatial clustering areas of medical resources, providing a clear visual representation of their distribution across different regions[33]. This analysis highlights areas with ample medical resources and those that are comparatively lacking. Investments in hot spot regions can be increased to enhance the quality and efficiency of healthcare services. In contrast, cold spot areas require greater support for healthcare resources, improved medical facilities, and service conditions to adequately meet the healthcare needs of local residents. (Refer to Figure 13)
(1)The distribution of medical resources in the main urban area of Harbin reveals a significant negative z-score of -3.090031, with a p-value of less than 0.5, indicating pronounced clustering of medical facility locations.
(2) The figure demonstrates that the cold and hot spot clusters are primarily situated in Nangang District, Xiangfang District, and Songbei District. Conversely, Daoli District and Daowai District yield insignificant results. Thus, it can be concluded that the facility points in Nangang District, Xiangfang District, and Songbei District are of considerable significance. In the distribution of primary healthcare facilities, Songbei District shows a notable clustering of general hospitals, primarily due to the scarcity of grassroots medical facilities in that area, despite having a limited number of general hospitals. The majority of relatively high values are concentrated within Xiangfang District.
3.2.2. Buffer Analysis Based on Multiple Service Radii
The maximum allowable distance for residents when seeking medical care is defined as the service radius, which establishes the service network and areas (polygons) of medical service facilities. This framework quantifies the diversity of these facilities within a spatial context[34]. When integrated with cluster points, it enables a comprehensive analysis of healthcare service distribution (see Figure 14).
(1) The figure illustrates that the service radius of medical assistance facilities in Songbei District and Daowai District predominantly extends to 3000 meters, offering limited diversity in healthcare options. This situation results in prohibitively high walking costs for residents seeking medical care. In contrast, Xiangfang District, Daoli District, and Nangang District feature a lower frequency of 3000-meter service radii, combined with a wider variety of available options, which in turn lowers the walking costs for residents. Notably, Nangang District presents the most medical care choices and the lowest walking costs for its residents.
To enhance clarity regarding the distribution of healthcare resources across different levels, the service area ranges have been connected using a fishnet spatial layout, as illustrated in Figure 15.
(2) From the perspective of the range within which medical facilities are established, the fishnet map indicates that there are a total of 398 clinics situated within the service range accessible to residents of 0 to 1500 meters. However, an additional 455 clinics are located in the blank area between 1501 and 3000 meters. This data reveals that nearly half of the clinics are easily reachable for residents in their vicinity, while the remaining clinics require residents to traverse some distance within the 1501-3000 meter range. The clinics occupying the blank area are primarily concentrated in the southwestern sector of Daoli District and the central zone of Songbei District, resulting in limited diversity in the routes residents can take to access clinics.
(3) Within the service range of 0 to 2000 meters, the fishnet map shows that 137 community hospitals are established within this accessible range, while 107 clinics are found in the blank area between 2001 and 3000 meters. The data suggests that over half of the community hospitals are situated in areas that are easily accessible for nearby residents, while the others still fall within the 2001-3000 meter range. It is noteworthy that the diversity of path choices for residents accessing community hospitals in Daowai District is relatively limited.
(4) In the 0 to 3000 meter service range, the distribution of health clinics is rather balanced, corresponding well with the reachability for residents. Within this range, residents benefit from a diverse array of pathways to access health clinics.
The quantities of clinics, community hospitals, and health clinics within their respective service areas are compiled in Table 4, allowing for a clearer perspective on the concentration of medical resources.
3.3. Analysis of the Stability of the Medical Network
3.3.1. Spatial Autocorrelation Analysis
Based on the analysis of experimental data presented in Figure 15, the spatial structure of the road network demonstrates a tendency to converge, exhibiting a notable clustering effect. In particular, the Moran's I value for the global autocorrelation analysis of total depth space is 0.774045, significantly exceeding the critical threshold of 0. This indicates a strong positive correlation among spatial units. Furthermore, the global Z value amounts to 22.724167, considerably surpassing the significance level of 1.65, thereby reinforcing the significance of the observed spatial autocorrelation. Meanwhile, both the global and partial p-values are recorded at 0.0000, which is effectively indistinguishable from zero, thus confirming the statistical significance of these findings.These indicators collectively demonstrate that the spatial distribution of the road network is highly concentrated, resulting in significant spatial heterogeneity within the main urban area of Harbin. This observation reflects the convergence trend of the spatial structure and highlights distinct clustering features (see Figure 16).
(1) The spatial autocorrelation analysis reveals a total of 11 areas of high and low concentration within Xiangfang District, with the Changjiang Road Street and Heping Road Street being the most prominent. These streets are located in the heart of Harbin's main urban area and are home to a lot of large hospitals and medical facilities. In the southern part of Songbei District, there are two identified areas of high and low concentration, primarily on the northern side of the Songhua River, where there is a higher density of higher education institutions and the resident population is relatively small. For the identified unreasonable areas, it is essential to conduct a thorough analysis of the current situation, including aspects such as population mobility and road conditions, to inform the addition of medical facilities of appropriate levels to the respective land parcels.
(2) While Songbei District broadly meets the healthcare service needs of its permanent residents, the spatial distribution of medical facilities is uneven. The stability of the medical facility network is not strongly evident, largely due to the numerous university campuses that host their own medical service facilities, resulting in a sparse and uneven distribution of medical resources catering to the permanent population.
3.3.2. Overlay Analysis
Utilizing the service radii of medical facilities at three different levels (500, 1000, and 1500 meters), assess the service coverage of the main urban area's medical facility spatial layout using overlay and reclassification analysis. A higher score in this evaluation indicates a more stable medical facility system within the respective region (see Figure 17).
Based on the foregoing analysis, it can be concluded that the stability of the medical facility system is relatively strong in the following areas: Daoli District, the northwestern part of Xiangfang District, the southwestern part of Daowai District, the western part of Songbei District, and Nangang District. Conversely, the stability of the medical facility system is weaker in the northern part of Xiangfang District, the southern part of Songbei District, and the eastern part of Daowai District. In the subsequent optimization process, it is crucial to focus on enhancing the resilience of the medical facility system in these identified areas (see Figure 18).
4. Conclusions and Optimization Plan
4.1. Conclusions
This article analyzes the distribution of grassroots medical facilities in the main urban area of Harbin from three dimensions: the transmissibility of residents' distances to medical treatment, the diversity of treatment options, and the stability of the healthcare system[35]. The main conclusions are as follows:
(1)Regarding the accessibility of residents' distances to medical treatment, there are significant differences among various administrative districts. The most convenient area is Nangang District, as it is located in the main urban region, resulting in a significantly higher level of convenience compared to other areas. In contrast, both Songbei District and Daowai District are not very convenient due to the current state and functionality of the land, this causes an uneven distribution of basic healthcare resources, making medical care inconvenient for residents.
(2)An analysis of the diversity of treatment options reveals an overall balanced pattern; however, due to the limited number of medical facilities in Songbei District and Daowai District, these areas show a trend of fewer diverse choices. In the southwestern region of Daoli District and the center of Songbei District, residents have limited diversity in their paths to clinics. Additionally, community hospitals established in Daowai District offer few diverse path choices for residents to reach them.
(3)An analysis of the stability of the healthcare system reveals that the H-L area is primarily distributed in the southern part of Songbei District, with over ten data points indicating areas of inefficiency. Overall, these points mainly occupy two concentrated regions. The consistency of the medical facility system in the northern part of Xiangfang District, the southern part of Songbei District, and the eastern part of Daowai District is relatively poor.
4.2. Optimization Analysis
4.2.1. Optimization Strategy
(1)On the transmissibility of medical treatment : To significantly enhance the accessibility of grassroots hospitals in urban areas, improve the convenience of medical services for residents, and bolster overall spatial resilience, it is necessary to strategically increase medical resources in areas with low accessibility values and poor healthcare accessibility. Most streets within Songbei District and Daowai District face significantly low average accessibility, meaning that local residents encounter substantial difficulties in obtaining basic medical services. As a result, based on this practical consideration, priority should be given to optimizing the allocation of grassroots medical resources in these two critical regions: Songbei District and Daowai District.
(2)On the diversity of medical path choices : Songbei District and Daowai District exhibit a distinct lack of diversity in available paths to healthcare, which restricts residents' flexibility and convenience when addressing different medical needs. Based on detailed analytical results, targeted strategies can be proposed: Clinics are needed in the southern half of Daoli District, the center section of Songbei District to address inhabitants' primary healthcare needs. In contrast, Daowai District should focus on increasing the number of community hospitals to provide more comprehensive and specialized medical services.
(3)On the spatial equity matching pattern : The high-demand, low-supply (H-L) areas are primarily concentrated in the southern part of Songbei District. Due to high population density and significant medical demand, this area suffers from a striking imbalance between supply and request, driven by the relative scarcity of existing medical resources. Simultaneously, both the southern part of Songbei District and the eastern part of Daowai District are faced with insufficient medical facilities, necessitating the supplementation and upgrading of resources in subsequent development phases.
4.2.2. Demand and Resilience Conclusions
The analysis of medical service demand can primarily be assessed through two indicators: the total quantity of service requirement and the characteristics of service demand[36]. The medical service demand as a whole is determined based on the population and morbidity rates in different subdivisions of Harbin's main urban area[37]. Service demand density, on the other hand, refers to the total number of individuals with medical needs per unit area within each community[38]. The relevant calculation formulas are as follows:
Among them: Q represents the aggregate quantity of patients in the area for two weeks; c represents the total population of the area[39]; a represents the two-week prevalence rate of 1%(data source 《2008 China Health Service Survey 》 ); d represents the demand density of medical services in each region; Sk denotes the area of the K region[40].
Using these two calculation formulas, the demand density for various districts in Harbin's main urban area can be derived. As illustrated in the diagram, the demand density rankings among the districts are as follows: Daoli District (low) < Nangang District (relatively low) < Daowai District (medium) < Songbei District (relatively high) < Xiangfang District (high). (See Figure 19).
In order to better reflect the comprehensive visualization of the transferability, path diversity, and stability of medical facilities across different regions in Harbin's main urban area, as well as the resilience of medical resources, a geometric interval classification system has been employed. The resilience of healthcare facilities is categorized into four levels: “Good” (4), “Relatively Good” (3), “Medium” (2), and “Poor” (1). The quantity presented corresponds to the number of grids occupied by the facilities, as shown in Table 5.
Table 5 indicates that the number of grids with good accessibility to medical facilities in the main urban area accounts for the majority, totaling 996. Among these grids, there are the most first-level medical facilities, amounting to 69. The number of grids at the relatively good level is 713. Overall, it can be concluded that the resilience level of healthcare facilities in Harbin's main urban area is relatively good.
After conducting a spatial join of the data, images were created to visually represent the spatial conditions within various regions of Harbin's main urban area. The resilience is categorized into four levels: 0 (low), 1 (medium), 2 (high), and 3 (higher), as illustrated in Figure 20.
From the figure, it can be observed that the southern part of Daoli District, the northeastern part of Nangang District, and the northern part of Xiangfang District exhibit the best resilience of medical facilities. These areas represent the economic and cultural center of Harbin's main urban area, characterized by high population density and the greatest number of first-level medical facilities, making them the regions with the optimal resilience of healthcare construction sites within the study area. Thus, it is evident that the overall resilience of medical facilities in Harbin's main urban area is relatively good.
The regions with better resilience are primarily located at the intersections of various districts, where population density is high and there are 29 medical facilities at the health clinic level. Additionally, due to the relatively developed transportation network in Harbin's main urban area, while these regions may not compete with the central area, their medical facility resilience remains good, allowing for convenient access to medical services.
Regions with moderate resilience are essentially areas that extend outward from the regions with the best resilience, mainly located in the northeastern part of Daoli District, the eastern part of Nangang District, and the eastern part of Xiangfang District. However, benefiting from the advantage of geographical distance, the resilience of medical facilities in these areas is at a moderate level.
Regions with poor resilience of medical facilities are found in the western part of Daoli District, the northern part of Songbei District, and the southeastern part of Daowai District. These areas are mostly located at the border between the main urban area and other townships, resulting in a greater distance from the central urban area, which contributes to the relatively poor resilience of medical facilities.
4.3. Optimize the Scheme
(1)Based on the analysis above, the southern part of Songbei District is characterized by its relatively independent entertainment areas, such as Ice and Snow World and Sun Island. Due to the presence of too many university campuses, there is a predominance of transient population over permanent residents. The area benefits from convenient transportation, including Metro Line 2 and efficient bus services. Considering the distribution of functional areas, it is evident that, apart from commercial entertainment zones, most areas are mixed-use and public office districts, primarily situated along major transportation routes. For such grids, in major traffic arteries and densely populated office areas, tertiary medical facilities,clinics should be added to enhance their service capacity, enabling them to meet and address basic medical needs, as well as the healthcare needs of tourists.
(2)In the eastern part of Daowai District, there should be an increase in secondary medical facilities—community hospitals. This area is situated in congested, older residential neighborhoods and has a large permanent resident population but fewer transient residents. Located within the Gongxingdun Street of Chengguan District, there is currently only one tertiary clinic in the region; however, its resilience index is commendable, and transportation is convenient. New large medical facilities cannot be constructed in this type of area, but residents can easily access tertiary medical points. Therefore, it is recommended to establish additional tertiary medical facilities to meet daily medical needs.
(3)The Changjiang Road and Heping Road streets in Xiangfang District serve as major activity areas for transient populations, characterized largely by mixed-use developments that combine commercial entertainment, public offices, and residential living. Medical resources are concentrated here, with close proximity to universities and several neighborhoods. The residential communities are located around Wanda Plaza, primarily featuring dining facilities along the streets, with fewer service-oriented establishments. Given the presence of large medical facilities in the vicinity, it is critical to guide residents in urban core neighborhoods to seek tiered treatment. For minor ailments and light conditions, residents could utilize secondary and tertiary medical facilities located near their residences. Additionally, efforts should be made to strengthen the service capacities of these secondary and tertiary fac ilities by increasing the number of medications, beds, and doctors available, thus alleviating the strain on primary medical facilities. Therefore,to serve the increased floating population, secondary and tertiary medical facilities should be added. (See Figure 21)
5. Conclusions
This paper initiates with an examination of resilience characteristics and proposes the fundamental features of urban spatial resilience. By reflecting on the needs of urban residents, it introduces a grassroots medical and resilience framework based on "internal stability - diversity - high mobility." Through comprehensive analysis of various levels of facilities data, the paper explores the current status of medical facility distribution, concentration, accessibility, and optimization of layouts in unreasonable areas. Addressing these unreasonable regions while considering factors such as population mobility, road traffic potential, service capacity of resources, and the primary functions of land parcels, the study designs an optimized layout plan for the addition of medical facilities. The proposed optimization plan is more aligned with practical realities; the analysis of the three identified unreasonable areas, in conjunction with actual road conditions and surrounding service facilities, renders the results more convincing.
Although there is a wealth of data on medical facility locations in this study, there are instances within the site recommendation assessments where quantitative data support is lacking. Specifically, data on the number of beds and service capacity of medical facilities are missing, which decreases the persuasive power of the recommendations. Future methodologies will emphasize the integration of multi-source data and other approaches, fully addressing the reasonableness of recommended layouts, the availability of supporting data, and the absence of patient activity trajectory data. This will enhance the optimization capability for the site selection of medical facilities.
Author Contributions
B.W. and M.S. contributed to the conception and design of the study. B.W. organized the database. M.S. performed the statistical analysis. B.W. wrote the first draft of the manuscript. M.S. wrote sections of the manuscript. All authors have read and agreed to the published version of the manuscript.
Funding
Please add: This work was supported by China Association of Higher Education "2023 Annual Higher Education Scientific Research Planning Project" (Grant No.23DF0405), Heilongjiang Provincial Association of Higher Education 2023 Higher Education Research Project(Grant No.23GYBJ006),and the Fundamental Research Funds for the Central Universities (Grant No.2572024DZ31).
Data Availability Statement
Not applicable.
Acknowledgments
This work was supported by China Association of Higher Education "2023 Annual Higher Education Scientific Research Planning Project" (Grant No.23DF0405), Heilongjiang Provincial Association of Higher Education 2023 Higher Education Research Project(Grant No.23GYBJ006),and the Fundamental Research Funds for the Central Universities (Grant No.2572024DZ31).
References
- Liu, Z.; Liu, H.; Azmi, F.N.; et al. A novel dynamic evacuation risk assessment model of healthcare facilities during fire scenarios. J. Build. Eng. 2024, 98, 111129. [Google Scholar] [CrossRef]
- Rui, G.; Lu, J.; Peng, Z.; et al. Thermal comfort of healthcare facilities in China: A review. Build. Environ. 2024, 265, 111927. [Google Scholar]
- Leitch, S.; Wei, Z. Improving spatial access to healthcare facilities: an integrated approach with spatial analysis and optimization modeling. Ann. Oper. Res. 2024, 341, 1057–1074. [Google Scholar] [CrossRef]
- Jamshidmofid, M.; Olfati, M.; Sadrizadeh, S.; et al. Solar-assisted clean steam generator, a cleaner production approach for sustainable healthcare facilities. J. Clean. Prod. 2024, 452, 142132. [Google Scholar] [CrossRef]
- Jablonska, J.; Furmanczyk, J. Healing Architecture in Mental Health Facilities in the New European Bauhaus Context. Buildings 2024, 14. [Google Scholar] [CrossRef]
- Marco, G.; Marika, F.; Stefano, A.; et al. A research method for locating community healthcare facilities in Italy: how to guarantee healthcare for all. J. Integr. Care 2024, 32, 98–114. [Google Scholar]
- Banke-Thomas, A.; Wong, K.L.M.; Olubodun, T.; et al. Geographical accessibility to functional emergency obstetric care facilities in urban Nigeria using closer-to-reality travel time estimates: a population-based spatial analysis. Lancet Glob. Health 2024, 12, e848–e858. [Google Scholar] [CrossRef]
- Dell'Olio, L. The X-Minute City: Analysing Accessibility to Essential Daily Destinations by Active Mobility in Seville. Land 2024, 13. [Google Scholar] [CrossRef]
- Ndonky, A.; Loum, S.; Ndour MM, M. Geographical Accessibility to Basic Infrastructures and Services in Rural Senegal: The Case of the Niakhar Area. J. Geogr. Inf. Syst. 2024, 16, 24. [Google Scholar] [CrossRef]
- Guo, C.; Zhou, W.; Jing, C.; et al. Mapping and measuring urban-rural inequalities in accessibility to social infrastructures. Geogr. Sustain. 2024, 5, 41–51. [Google Scholar] [CrossRef]
- Tao, S.; He, S.Y.; Chen, X.; et al. Walking accessibility to non-work facilities and travel patterns in suburban new towns. Cities 2023. [Google Scholar] [CrossRef]
- Das, M.; Dutta, B.; Roy, U.; et al. Spatial accessibility modeling to healthcare facilities in the case of health shocks of Midnapore municipality, India. GeoJournal 2023, 1–24. [Google Scholar] [CrossRef] [PubMed]
- Liu, Z.; Li, S.; Chen, W.Y. Examining Accessibility to Medical Resources for Urban Older Adults with Common Diseases Using Multisource Data: A Case Study of Beijing. J. Urban Plan. Dev. 2023, 149, 5023031.1–5023031.13. [Google Scholar] [CrossRef]
- Cracu, G.M.; Schvab, A.; Prefac, Z.; et al. A GIS-based assessment of pedestrian accessibility to urban parks in the city of Constana, Romania. Appl. Geogr. 2024, 165. [Google Scholar]
- Nelson D R. Adaptation and resilience: responding to a changing climate. Wiley Interdiscip. Rev. Clim. Change 2011, 2, 113–120.
- Berkes, F.; Ross, H. Taylor & Francis Online:: Community Resilience: Toward an Integrated Approach - Society & Natural Resources - Volume 26, Issue 1. Society & Natural Resources An International Journal [2024-12-16].
- Jennings W, Lodge M.Anticipating Risks and Organising Risk Regulation: Critical infrastructures, resilience and organisation of mega-projects: the Olympic Games. 2010.
- Yining, Z.; Guolei, Z.; Yanjun, L.; et al. Matching of Residential and Commercial Space in Shrinking Cities from the Perspective of Supply and Demand: A Case Study of Yichun City,China. Chinese Geography: English Edition, 2022(003):032.
- Fan, X.; Liu, C.; Li, Y.; et al. Study on the layout of light rapid transit station connecting bus line based on GIS network analysis -- Taking Glasgow City as an example. IOP Publishing Ltd, 2024.
- Alhayan, F.; Pennington, D.; Ayouni, S. Twitter use by the dementia community during COVID-19: a?user classification and social network analysis. Online information review, 2023.
- Zhao, Y.; Zhao, P.; Luo, T.; et al. Network Analysis Reveals Regional Disparity inCOVID-19 Policymaking//China National Conference on Big Data and Social Computing. Springer, Singapore, 2024.
- Hossain N U I. Infrastructure Resilience: Bibliometric and Network Analysis. Eng. Proc. 2024, 76. [Google Scholar] [CrossRef]
- Vanli, T.; Akan, T. Mapping synergies and trade-offs between smart city dimensions: A network analysis. Cities 2023, 142, 1.1–1.32. [Google Scholar] [CrossRef]
- Xiangzhi, Z.; Youpeng, L. Layout Optimization of Cultural Facilities in Agglomerated and Mixed Residential Areas: A Case Study of Wanghailou District in Tianjin. New Archit. 2023. [Google Scholar]
- Salah, M.; Khallaf, R.; Elbeltagi, E.; et al. Construction Site Layout Planning: A Social Network Analysis. Buildings 2023, 13. [Google Scholar] [CrossRef]
- Lai, Y.; Wang, P.; Wen, K. Exploring the Impact of Public Spaces on Social Cohesion in Resettlement Communities from the Perspective of Experiential Value: A Case Study of Fuzhou, China. Buildings 2024, 14. [Google Scholar] [CrossRef]
- Edwards, D.J. AI-Driven BIM Integration for Optimizing Healthcare Facility Design. Buildings 2024, 14. [Google Scholar] [CrossRef]
- Wei, L.; Lu, Y.; Lu, X.; et al. Research on the village layout optimization in China's developed areas based on daily life circles. Environ. Sci. Pollut. Res. 2024, 31. [Google Scholar] [CrossRef] [PubMed]
- Ren, Q.; Ku, Y.; Wang, Y.; et al. Research on design and optimization of green warehouse system based on case analysis. J. Clean. Prod. 2023, 388. [Google Scholar] [CrossRef]
- Ren, Q.; Sun, M. Exploring the Quantitative Assessment of Spatial Risk in Response to Major Epidemic Disasters in Megacities: A Case Study of Qingdao. Int. J. Environ. Res. Public Health 2023, 20. [Google Scholar] [CrossRef] [PubMed]
- Jin, A.; Li, G.; Yu, Y.; et al. Establishment of hospital resilience framework in urban China: insight from Wuhan City. Comput. Urban Sci. 2022, 2, 1–17. [Google Scholar] [CrossRef]
- Comprehensive Optimization Framework for Low Impact Development Facility Layout Design with Cost–Benefit Analysis: A Case Study in Shenzhen City, China. ACS ES T Water 2022, 2, 63–74. [CrossRef]
- Li, G.; Liu, J.; Giordano, A. Robust optimization of construction waste disposal facility location considering uncertain factors. J. Clean. Prod. 2022, 353, 131455. [Google Scholar] [CrossRef]
- Liu, Q.; Chen, Y.; Hu, W.; et al. Underground Logistics Network Design for Large-Scale Municipal Solid Waste Collection: A Case Study of Nanjing, China. Sustainability 2023, 15. [Google Scholar] [CrossRef]
- Sun, M.; Jiao, X. Quantitative Identification Study of Epidemic Risk in the Spatial Environment of Harbin City. Sustainability 2023, 15. [Google Scholar] [CrossRef]
- Ming, S.; Qingxiang, M. Using spatial syntax and GIS to identify spatial heterogeneity in the main urban area of Harbin, China. Front. Earth Sci. 2022, 10. [Google Scholar]
- Zhou, W.; Ming, D.; Lv, X.; et al. SO–CNN based urban functional zone fine division with VHR remote sensing image. Remote Sens. Environ. 2020, 236, 111458. [Google Scholar] [CrossRef]
- Yang, Y.; Li, Y.; Katharina, K.; et al. Urban design attributes and resilience: COVID-19 evidence from New York city. Build. Cities 2021, 2, 618. [Google Scholar] [CrossRef]
- Shi, C.; Liao, L.; Li, H.; et al. Which urban communities are susceptible to COVID-19? An empirical study through the lens of community resilience. BMC Public Health 2022, 22, 1–15. [Google Scholar] [CrossRef] [PubMed]
- Amaya, V.; Moulaert, T.; Gwiazdzinski, L.; et al. Assessing and qualifying neighborhood walkability for older adults: construction and initial testing of a multivariate spatial accessibility model. Int. J. Environ. Res. Public Health 2022, 19, 1808–1826. [Google Scholar] [CrossRef] [PubMed]
Figure 1.
Definition of medical facilities.
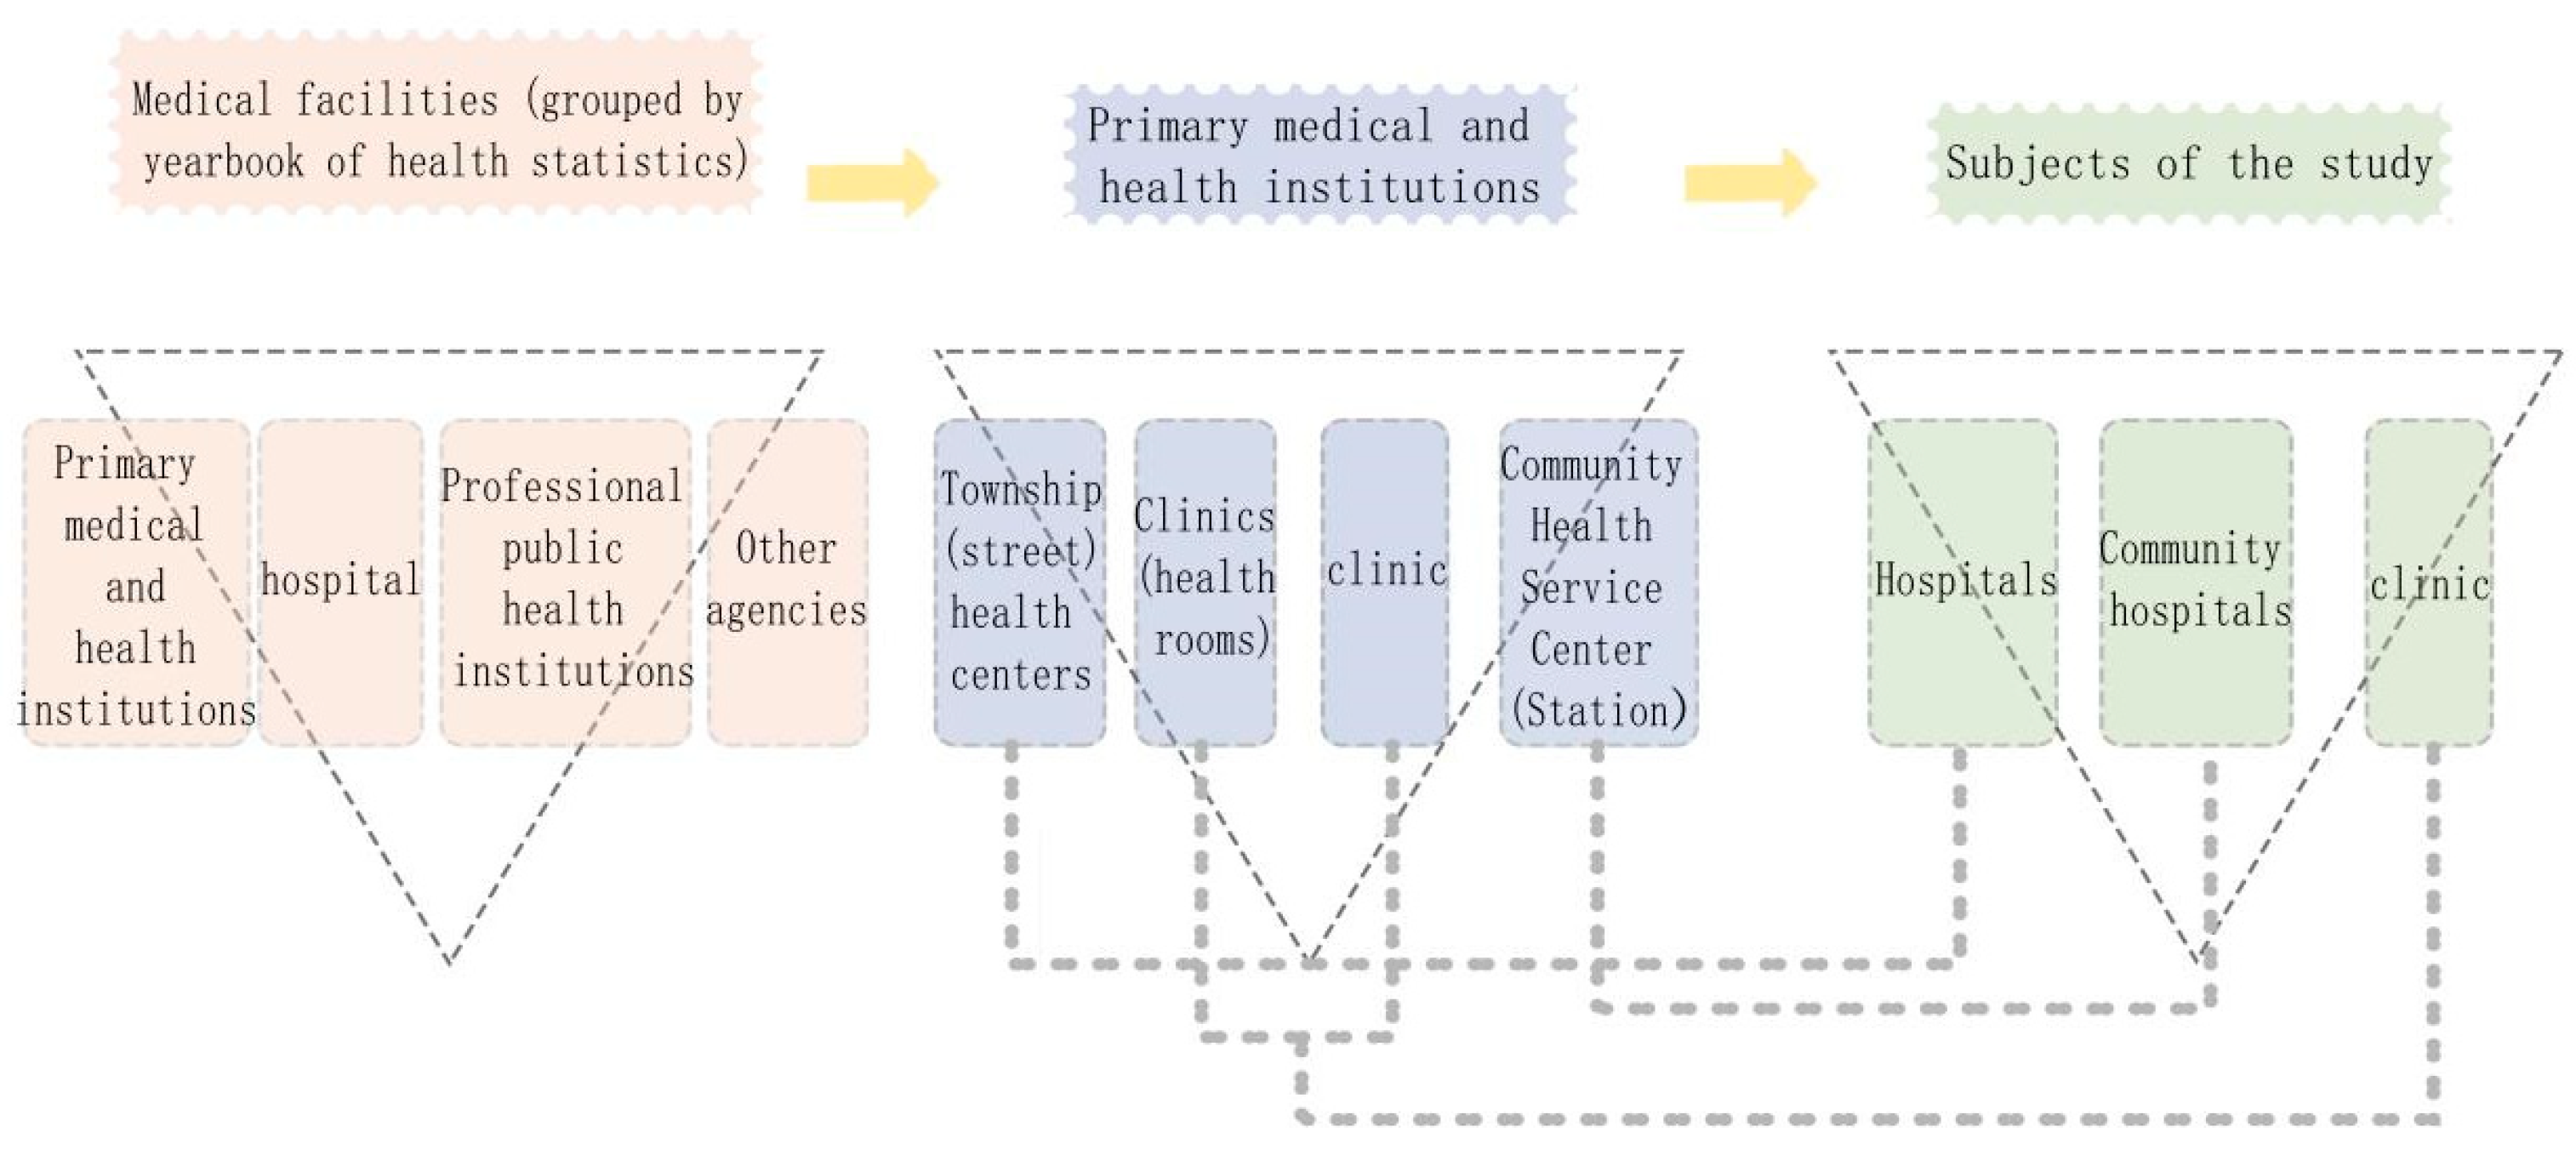
Figure 2.
Framework of the research process.
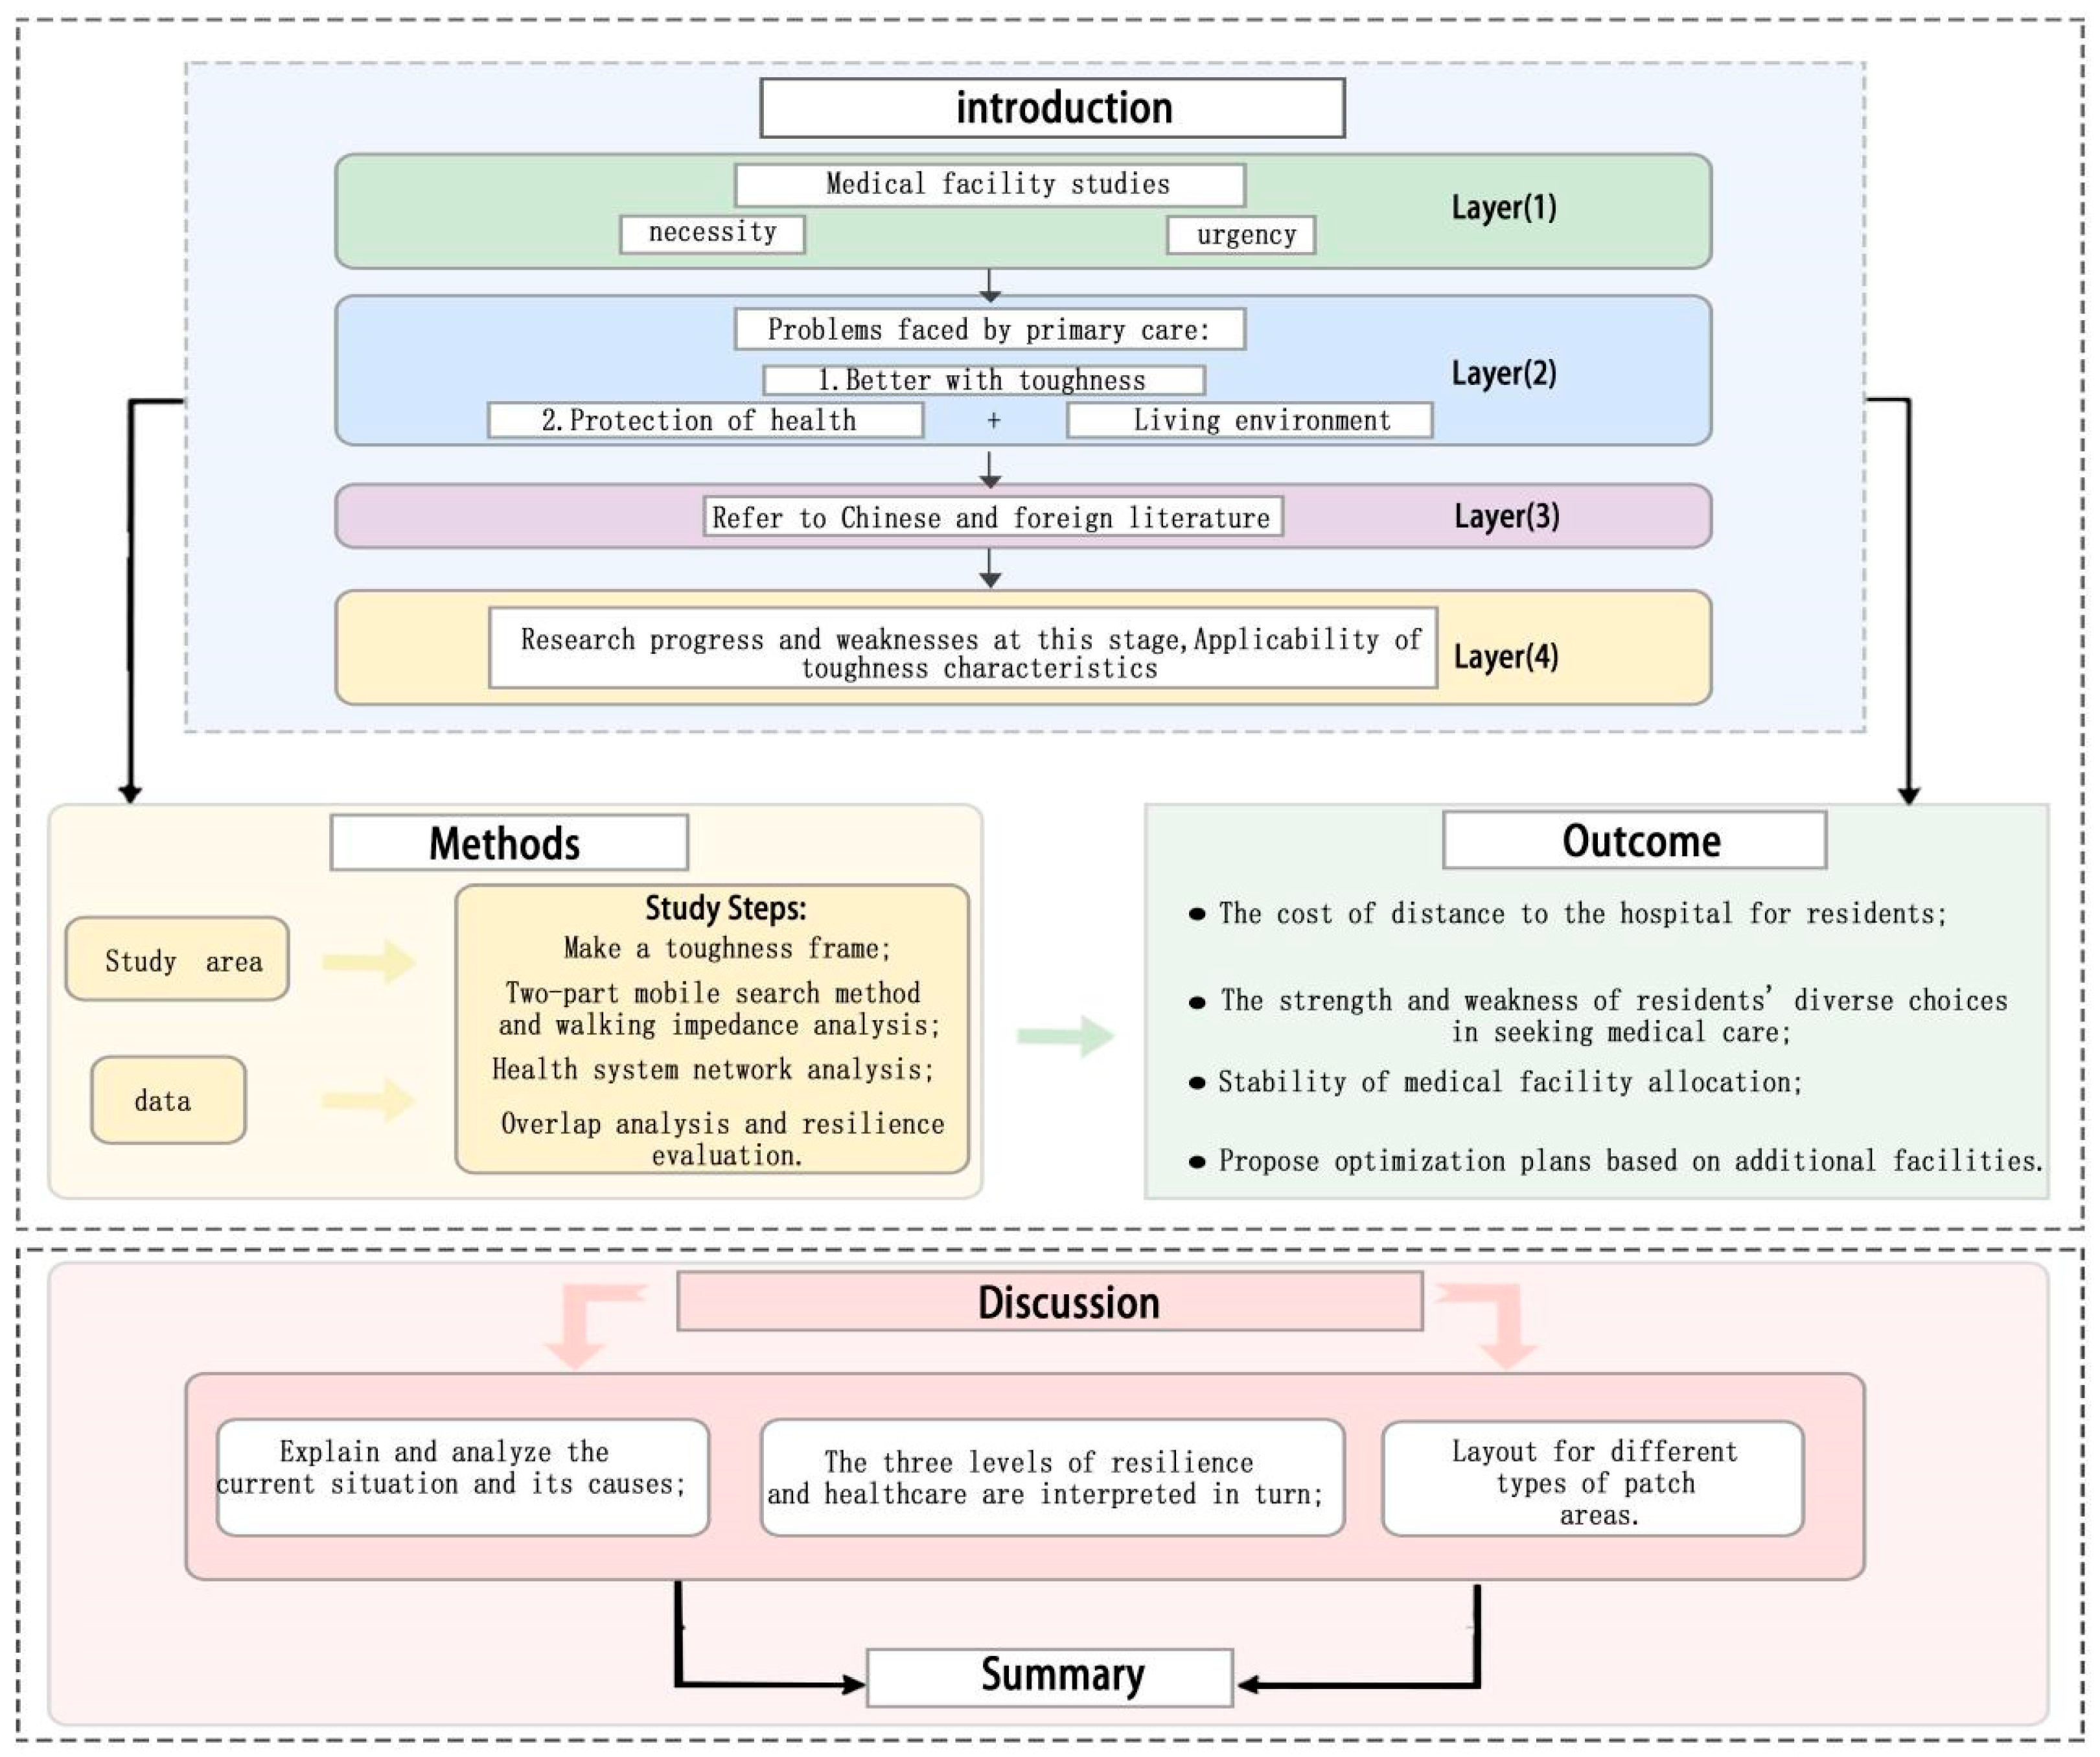
Figure 3.
Scope of the study, the central urban area of Harbin.
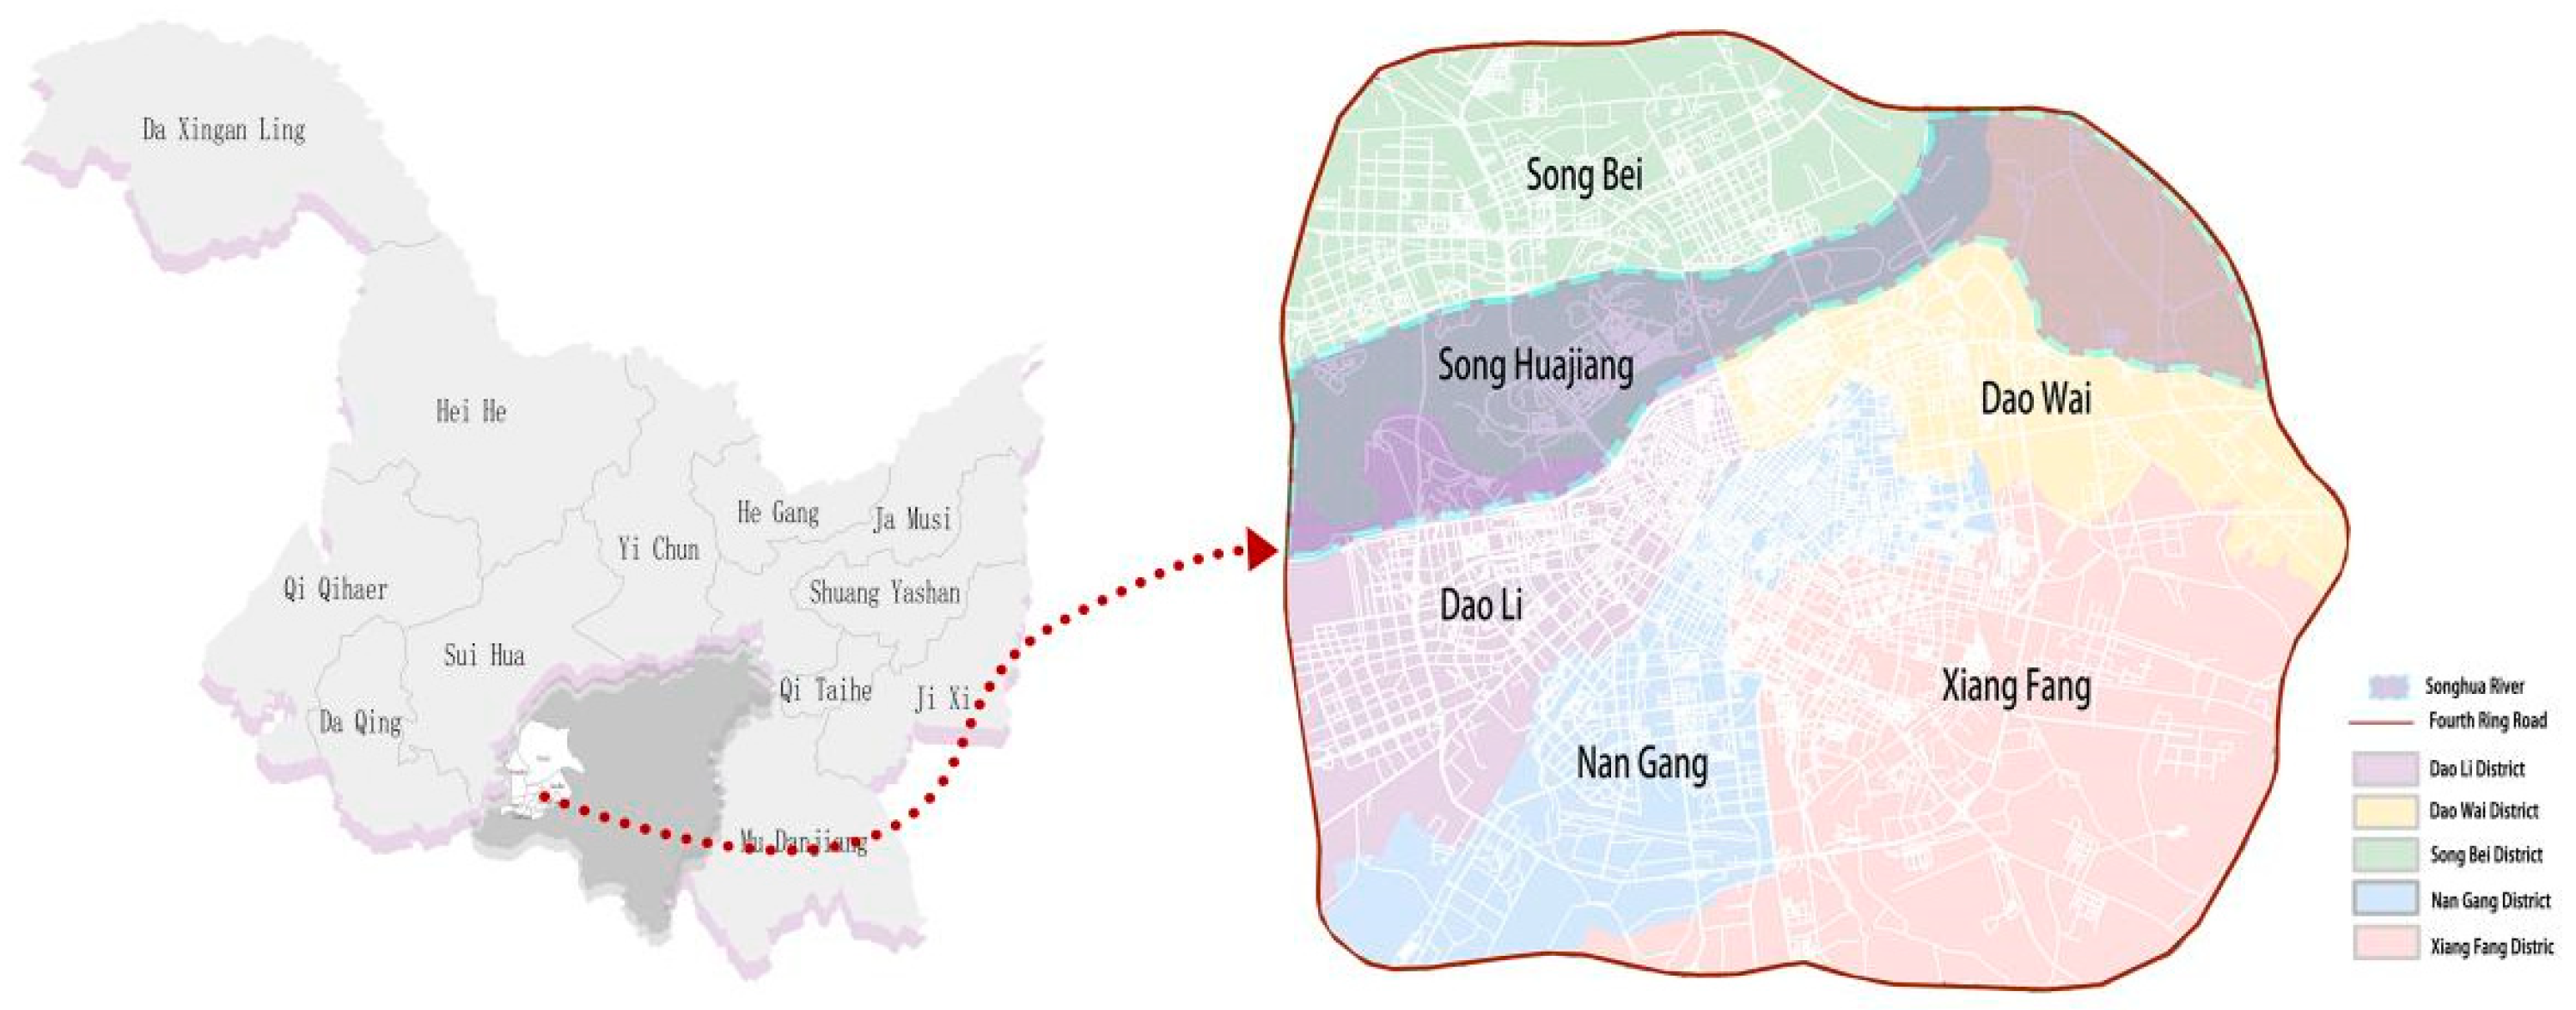
Figure 4.
Correlations between data.
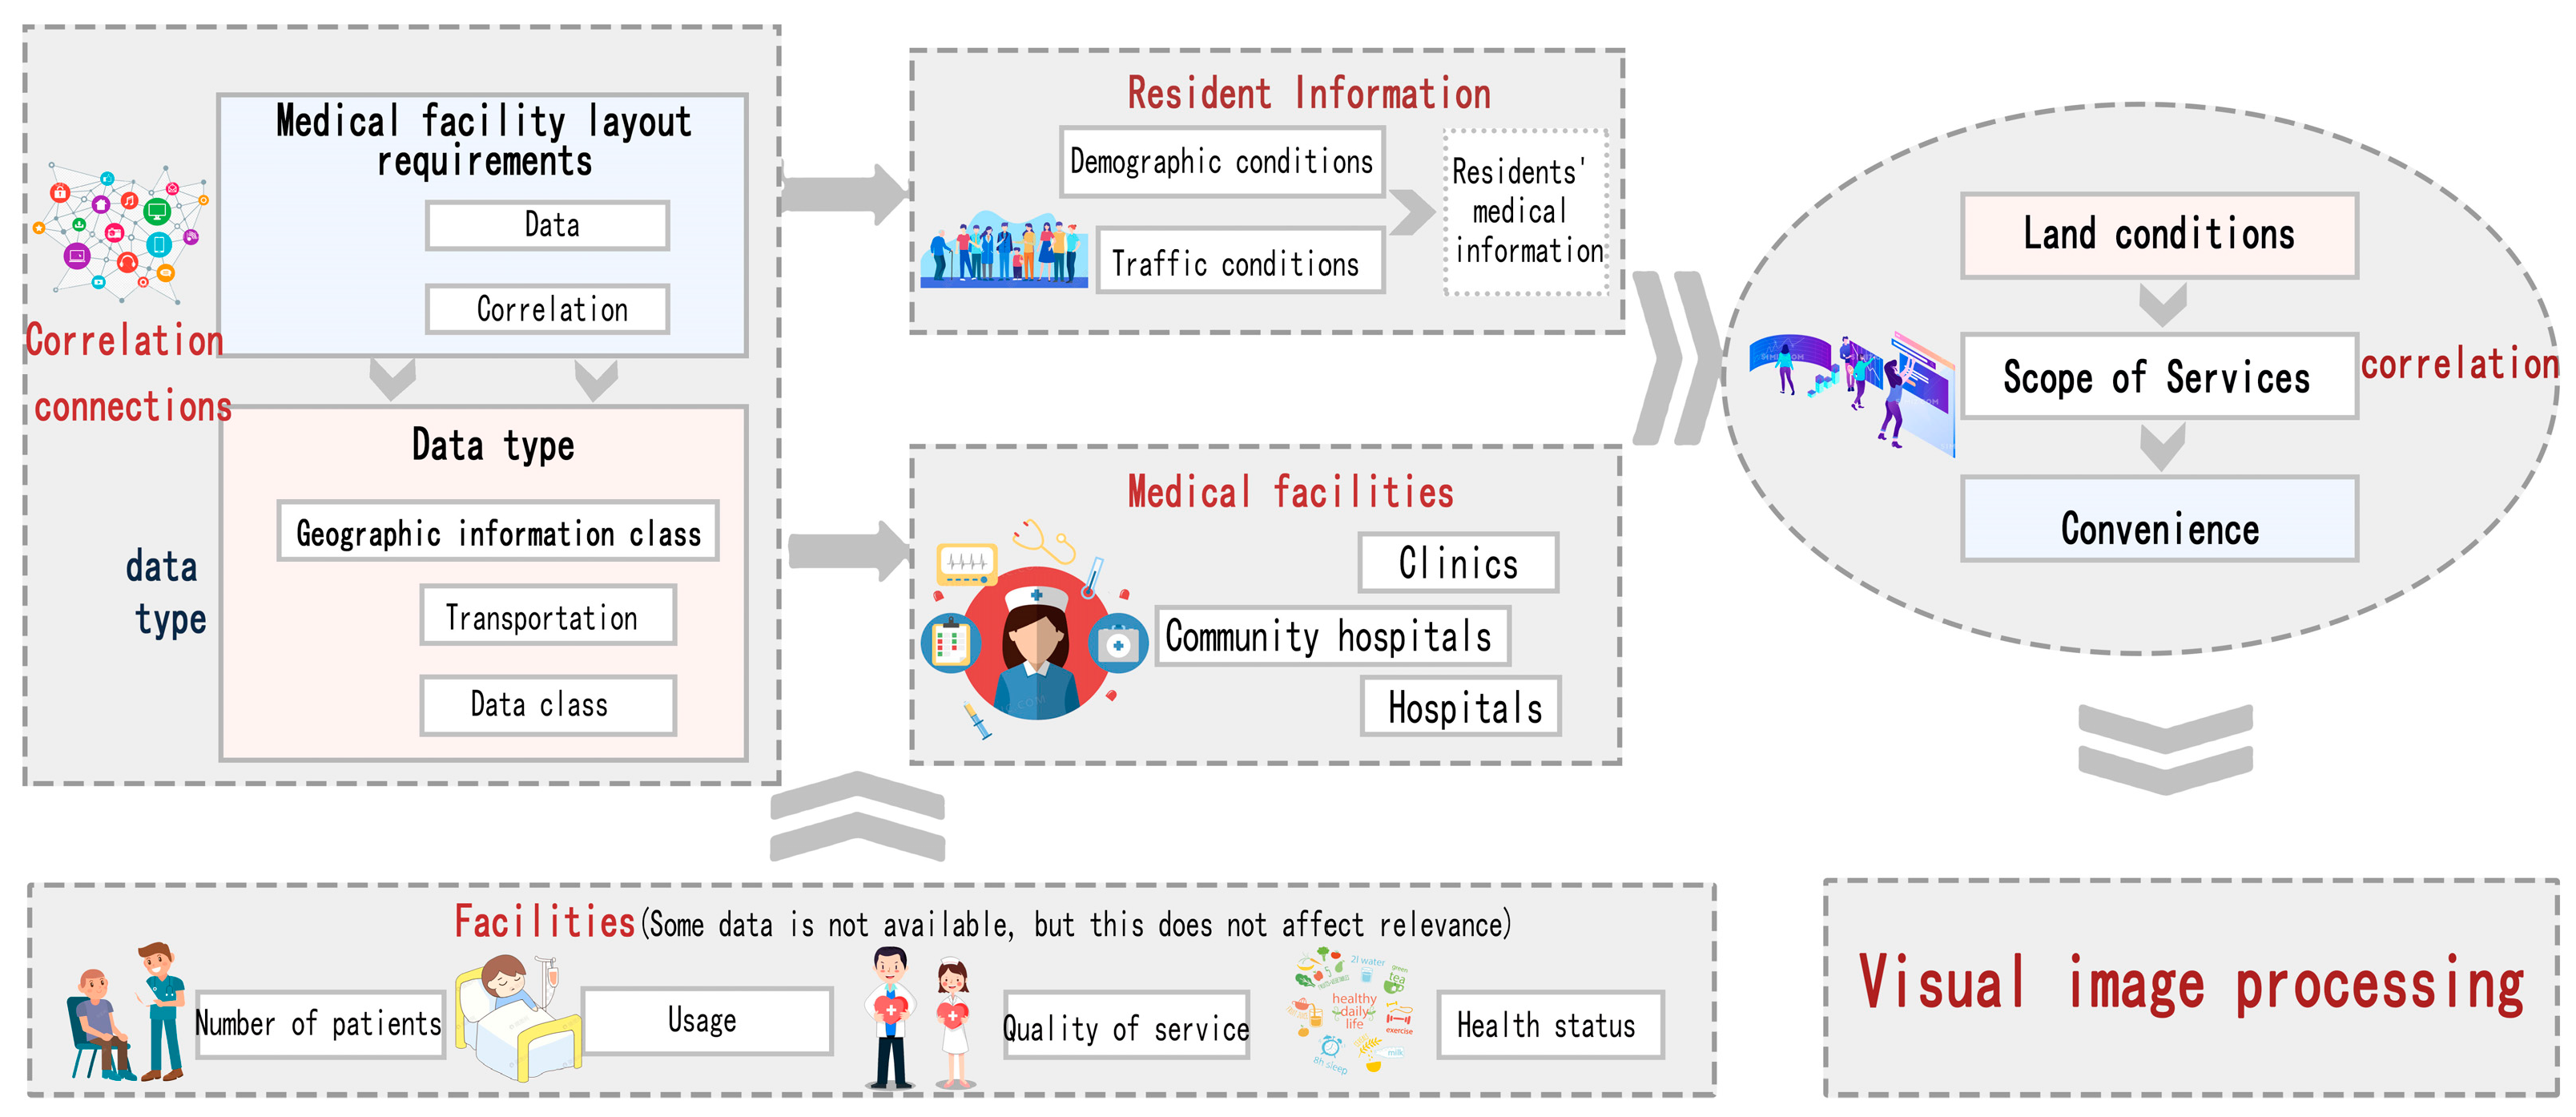
Figure 5.
(a)Database map(b)Distribution of medical resources.
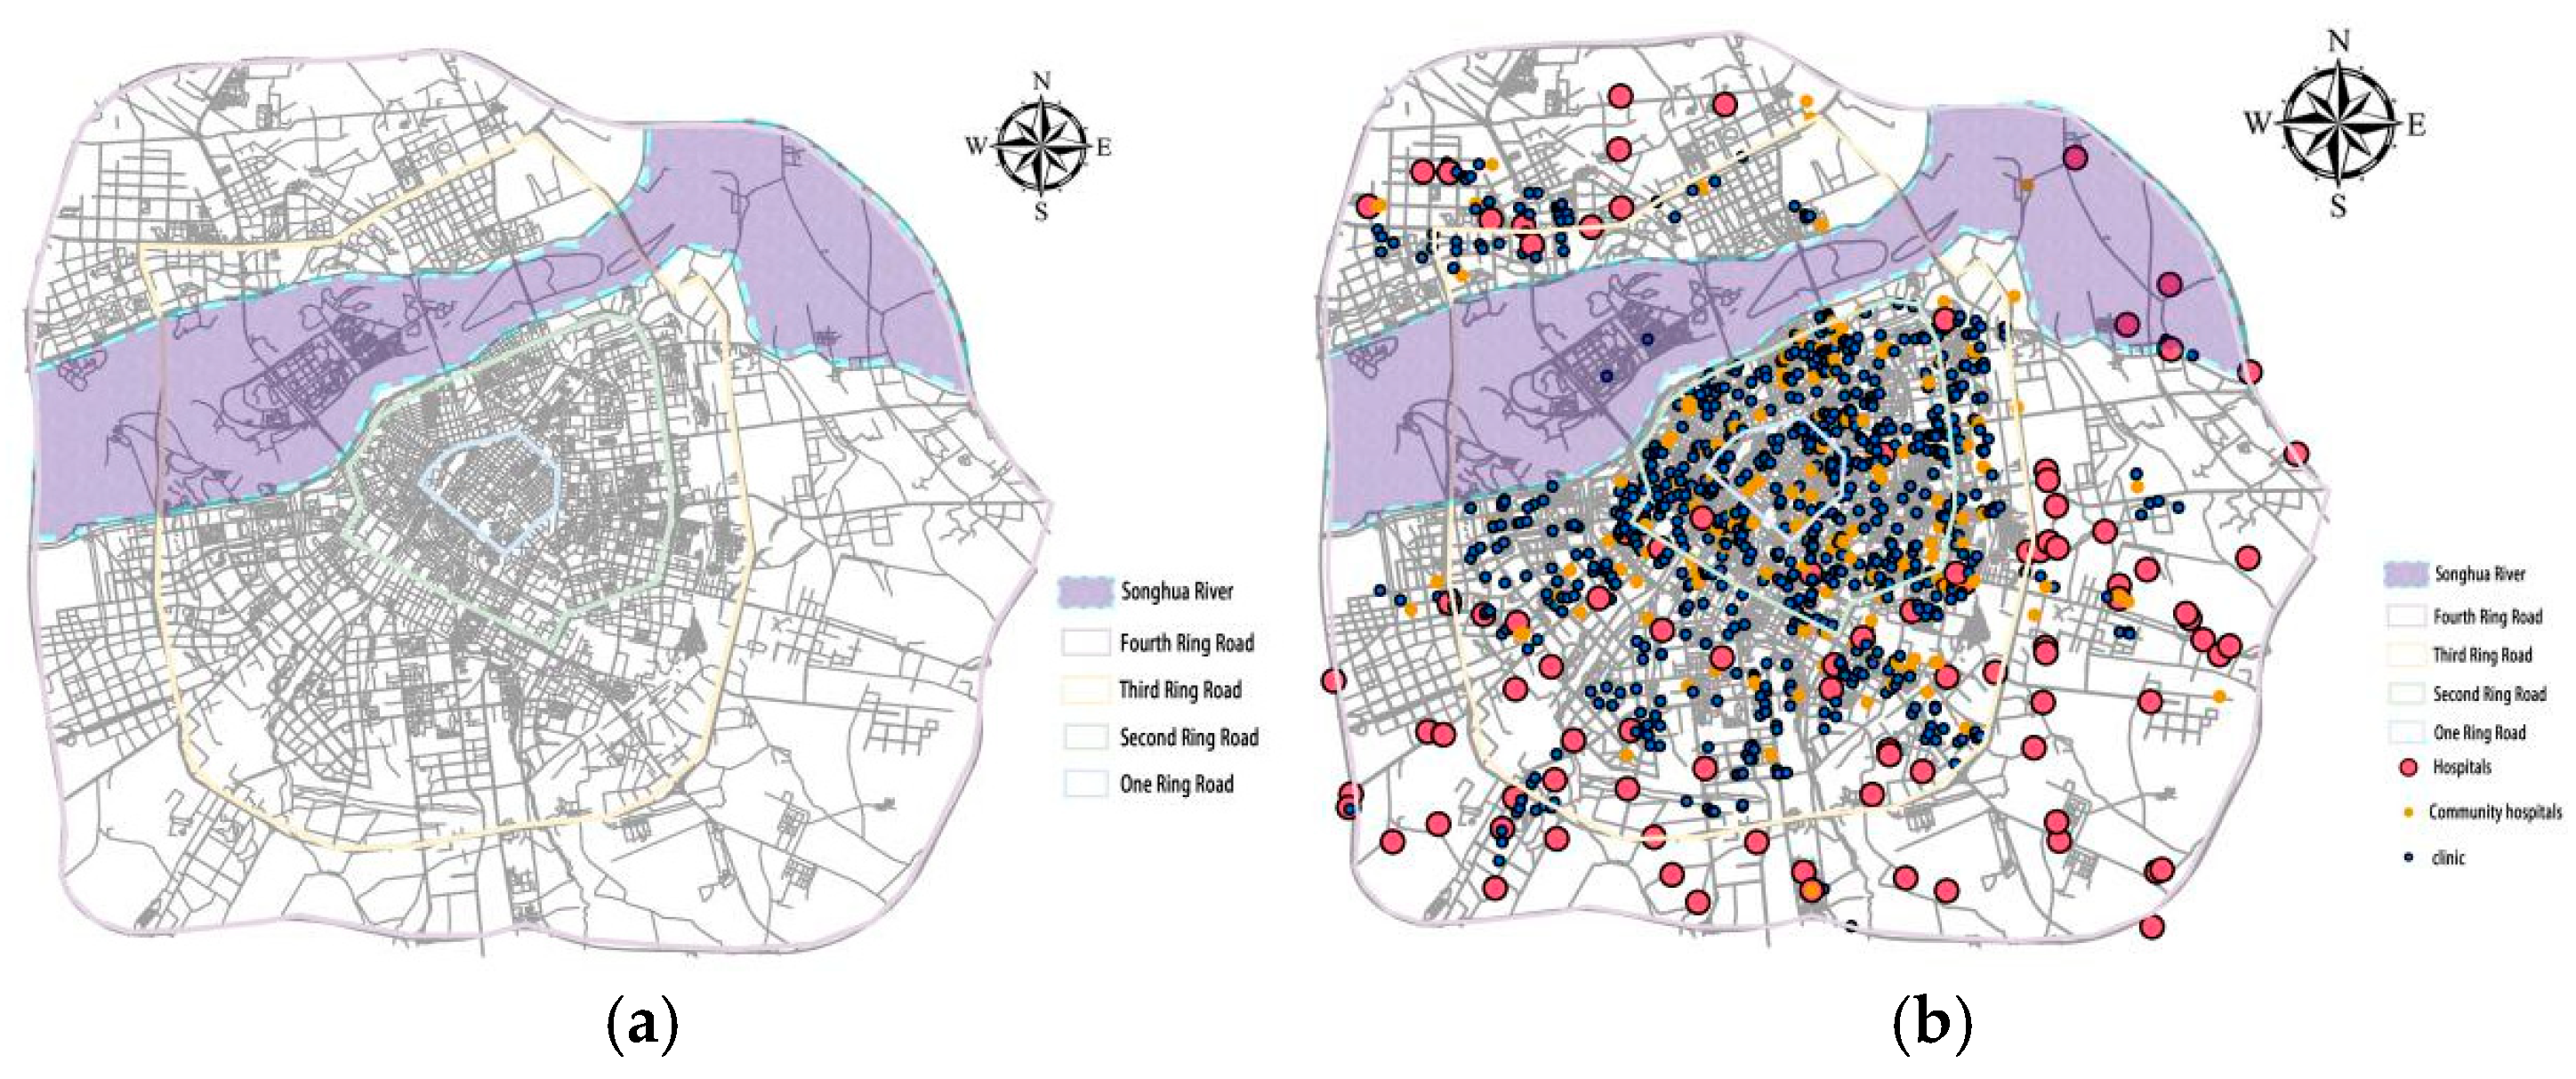
Figure 6.
Outline of the building(Note:The diagram shows the number of buildings with different numbers distributed around landmark buildings, and analyzes the distribution relationship between medical resources and buildings).
Figure 6.
Outline of the building(Note:The diagram shows the number of buildings with different numbers distributed around landmark buildings, and analyzes the distribution relationship between medical resources and buildings).
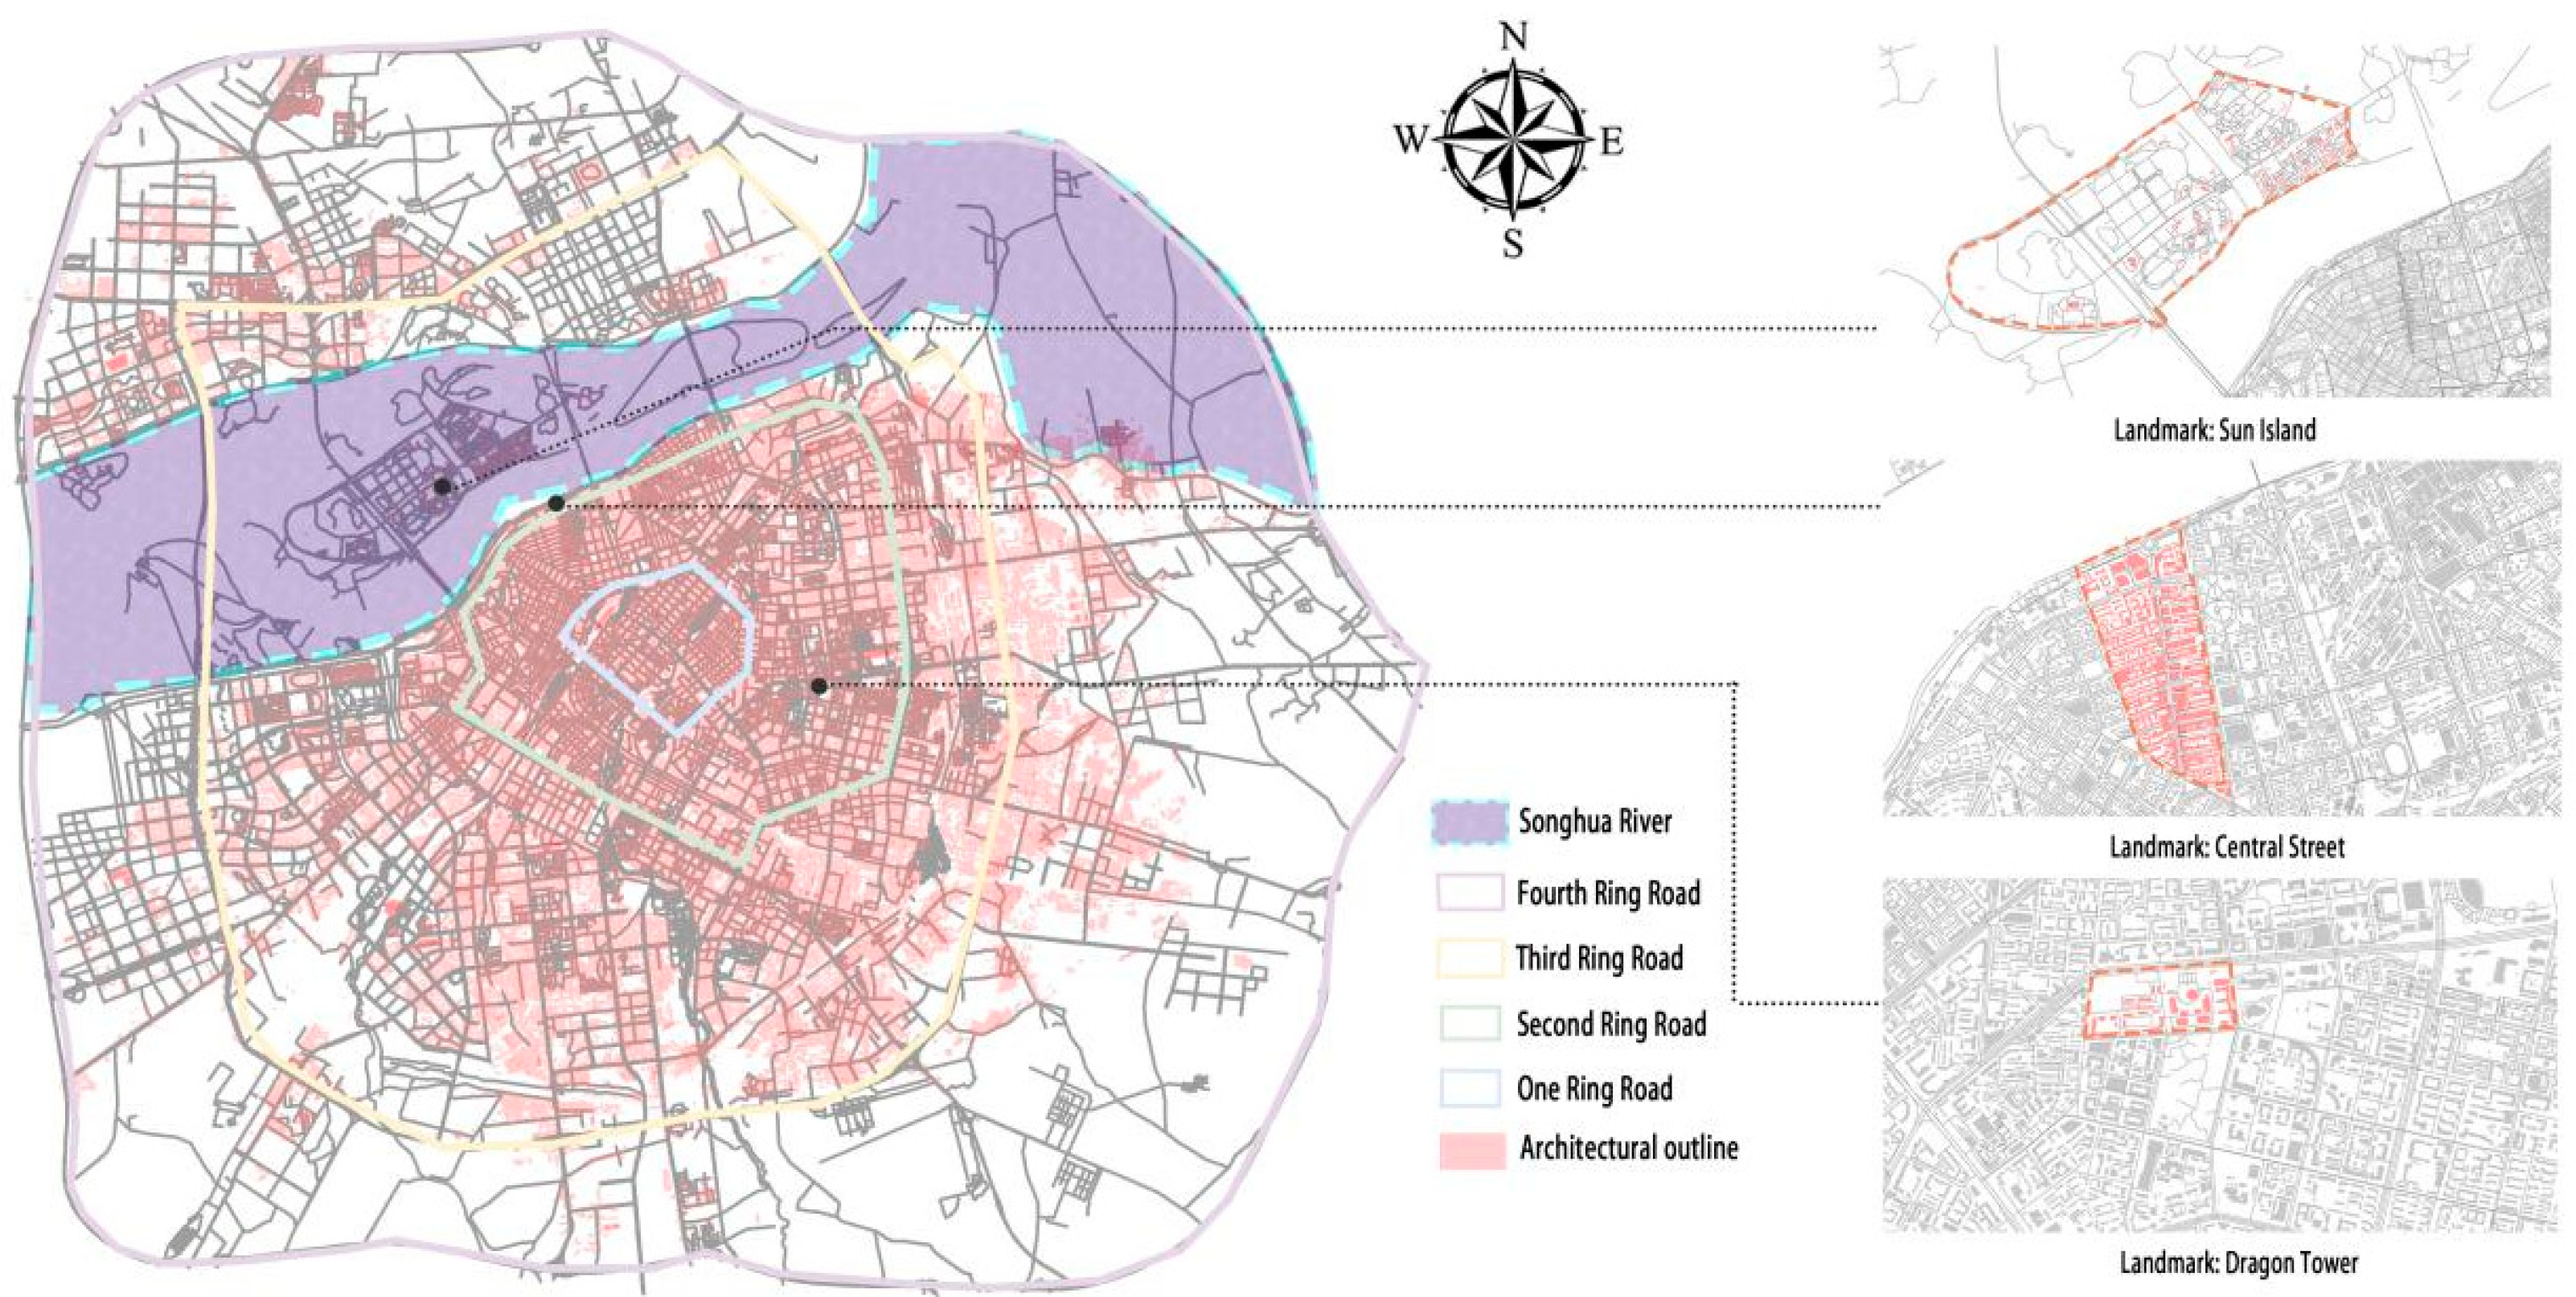
Figure 7.
Medical resource and population analysis charts(Note: This figure compares resources and population for demand and transmission analysis.).
Figure 7.
Medical resource and population analysis charts(Note: This figure compares resources and population for demand and transmission analysis.).
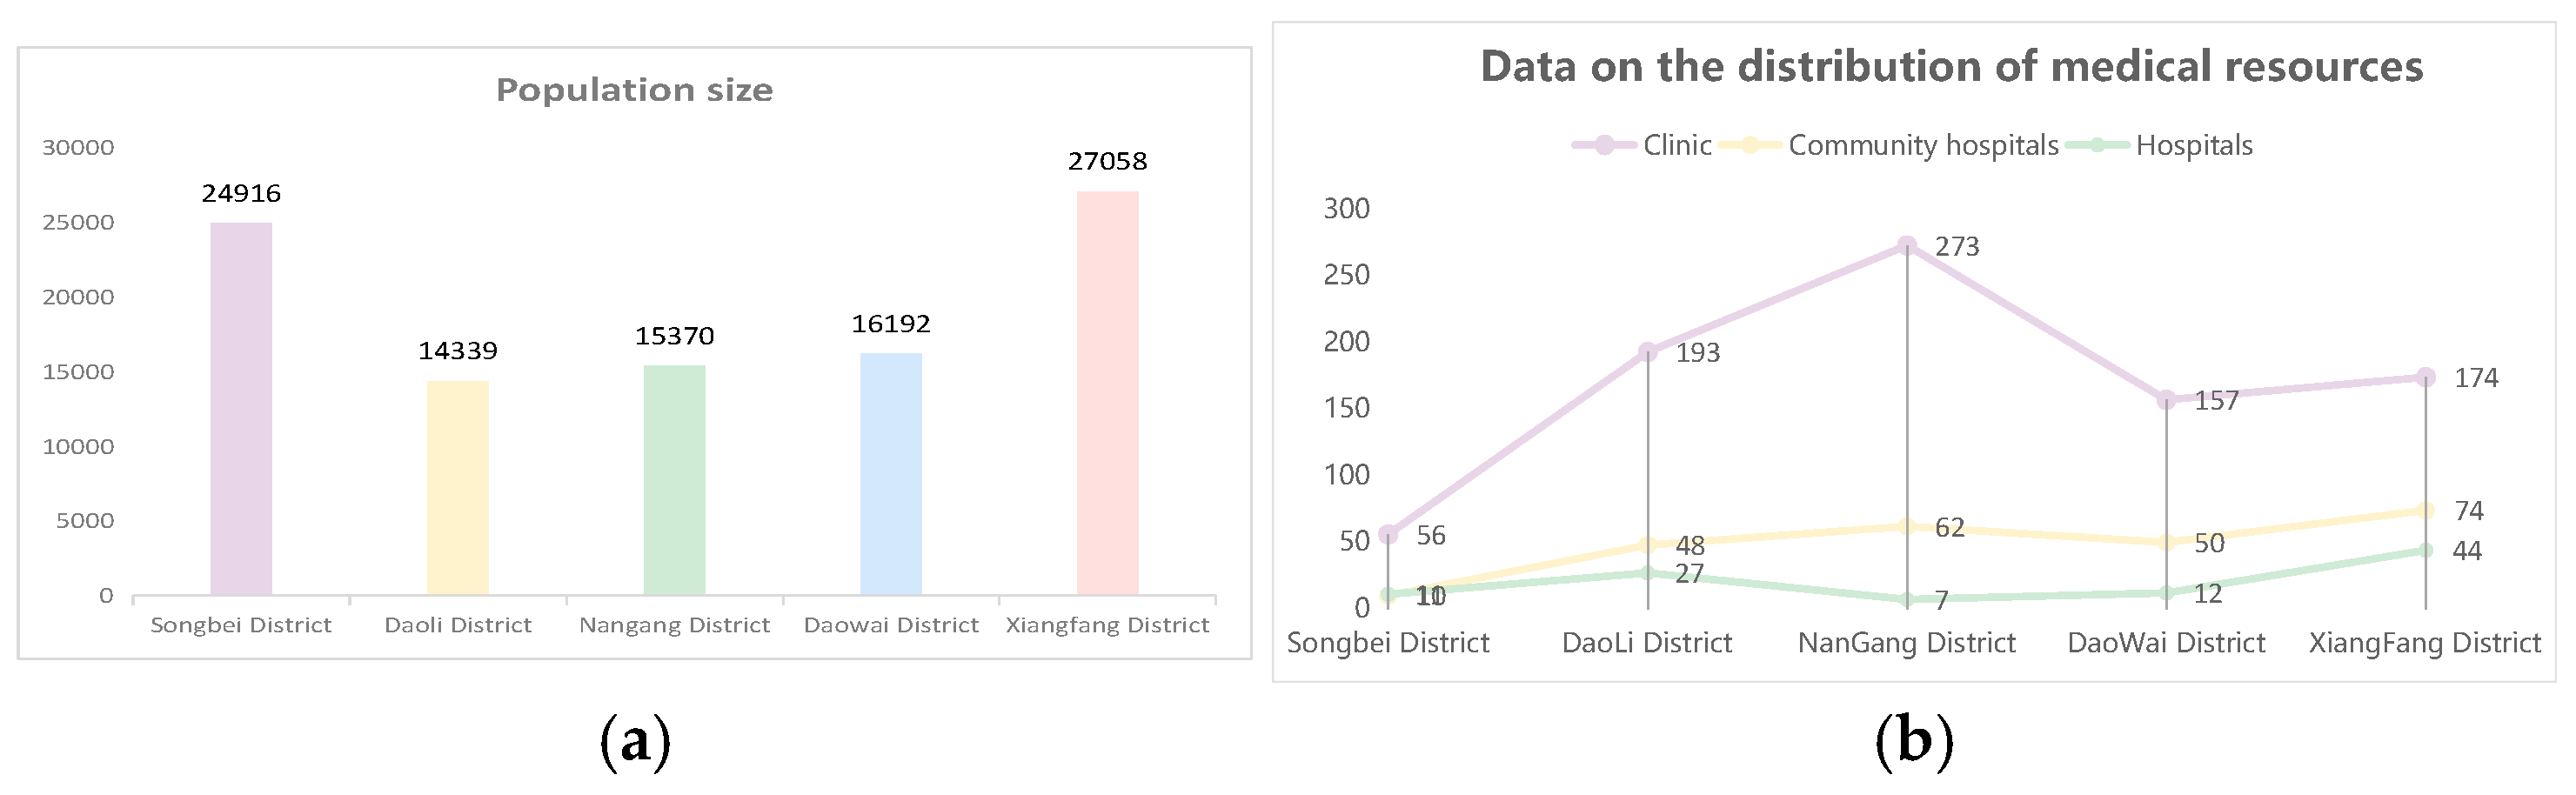
Figure 8.
Fishing net spatial analysis unit.
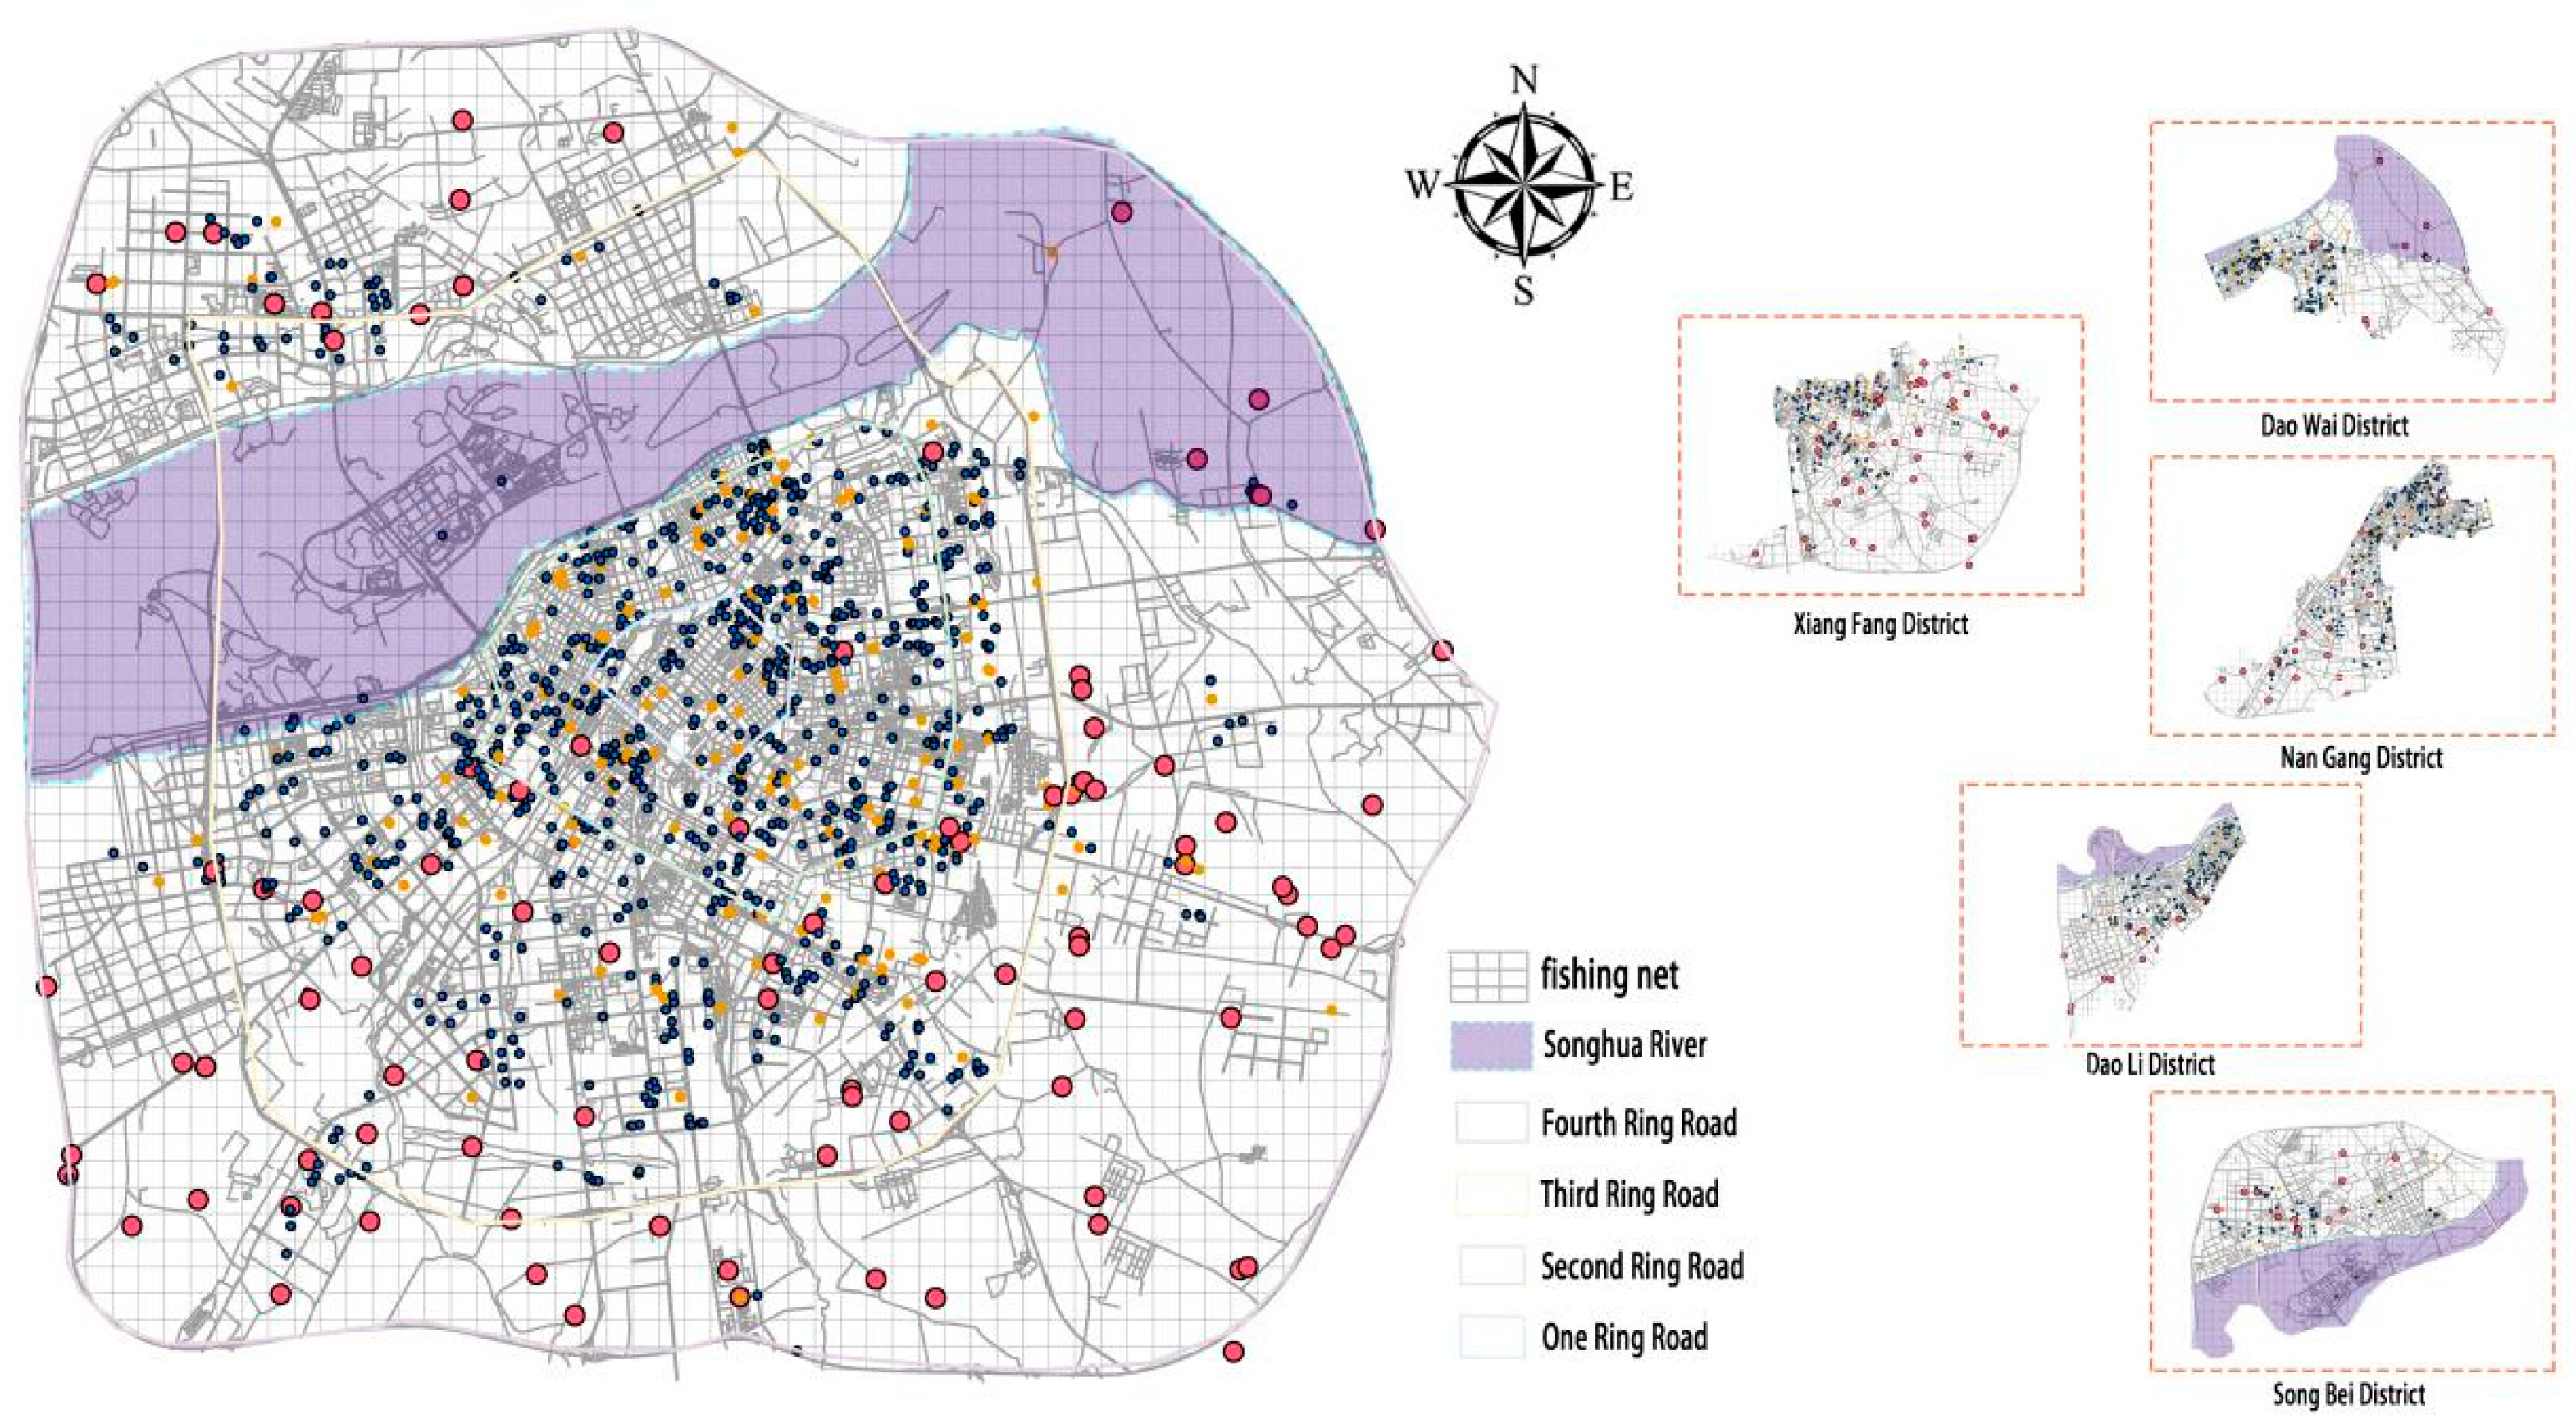
Figure 9.
Resilience and the framework of primary care facilities.
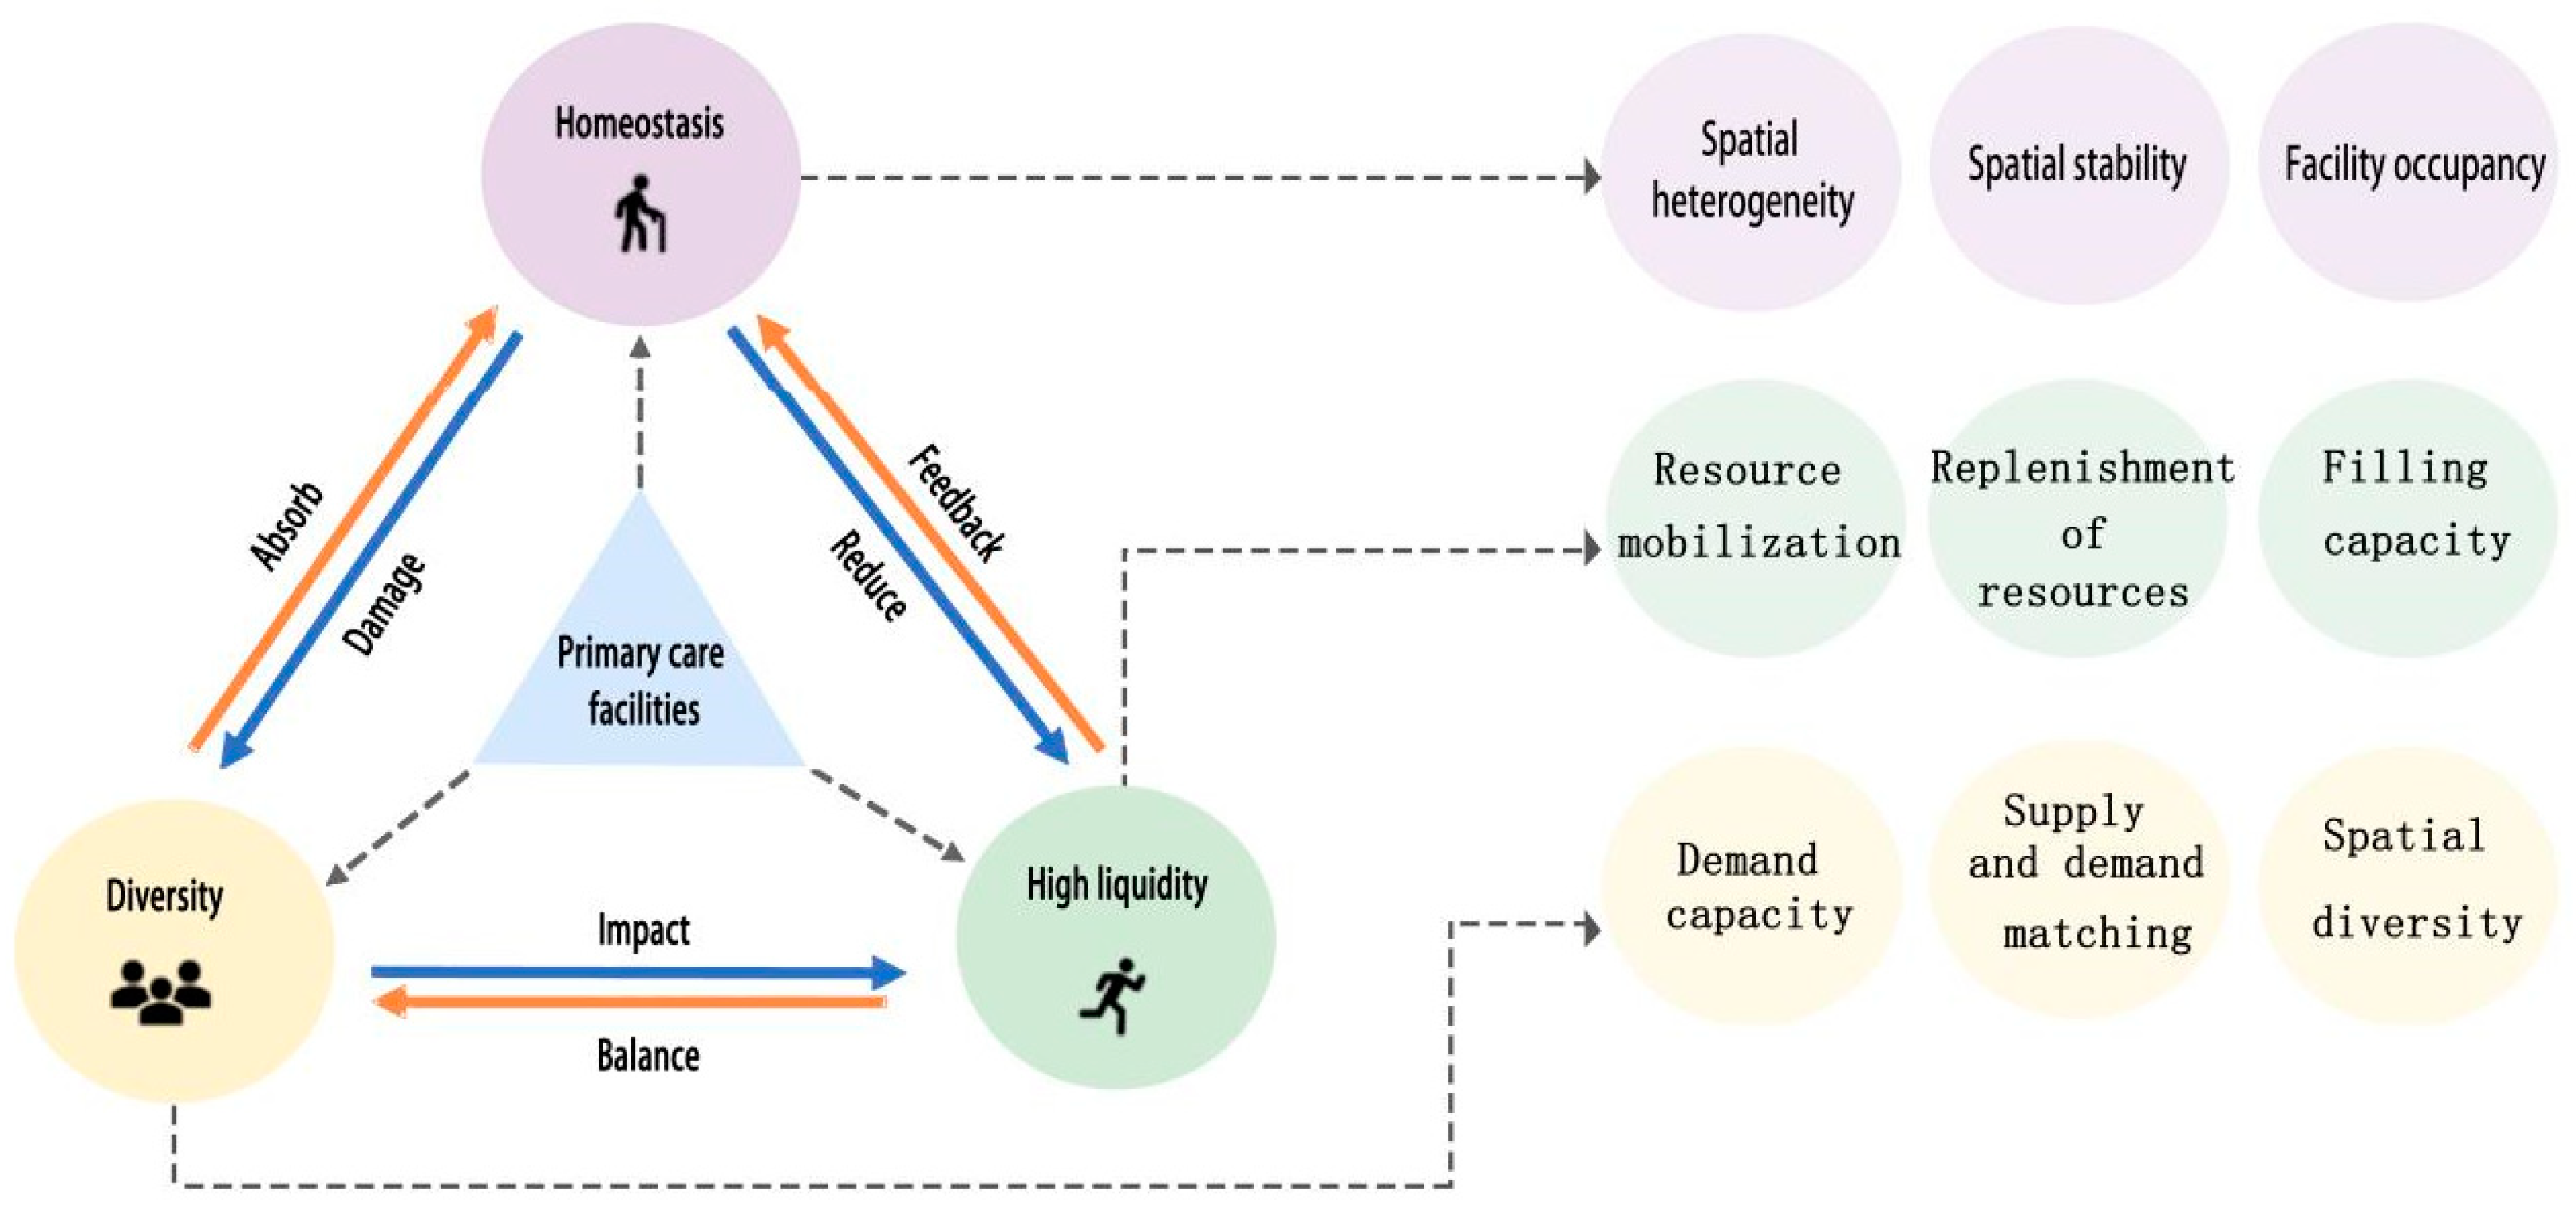
Figure 10.
(a)Pedestrian impedance analysis map of urban areas(b)Regional walking impedance analysis map.
Figure 10.
(a)Pedestrian impedance analysis map of urban areas(b)Regional walking impedance analysis map.
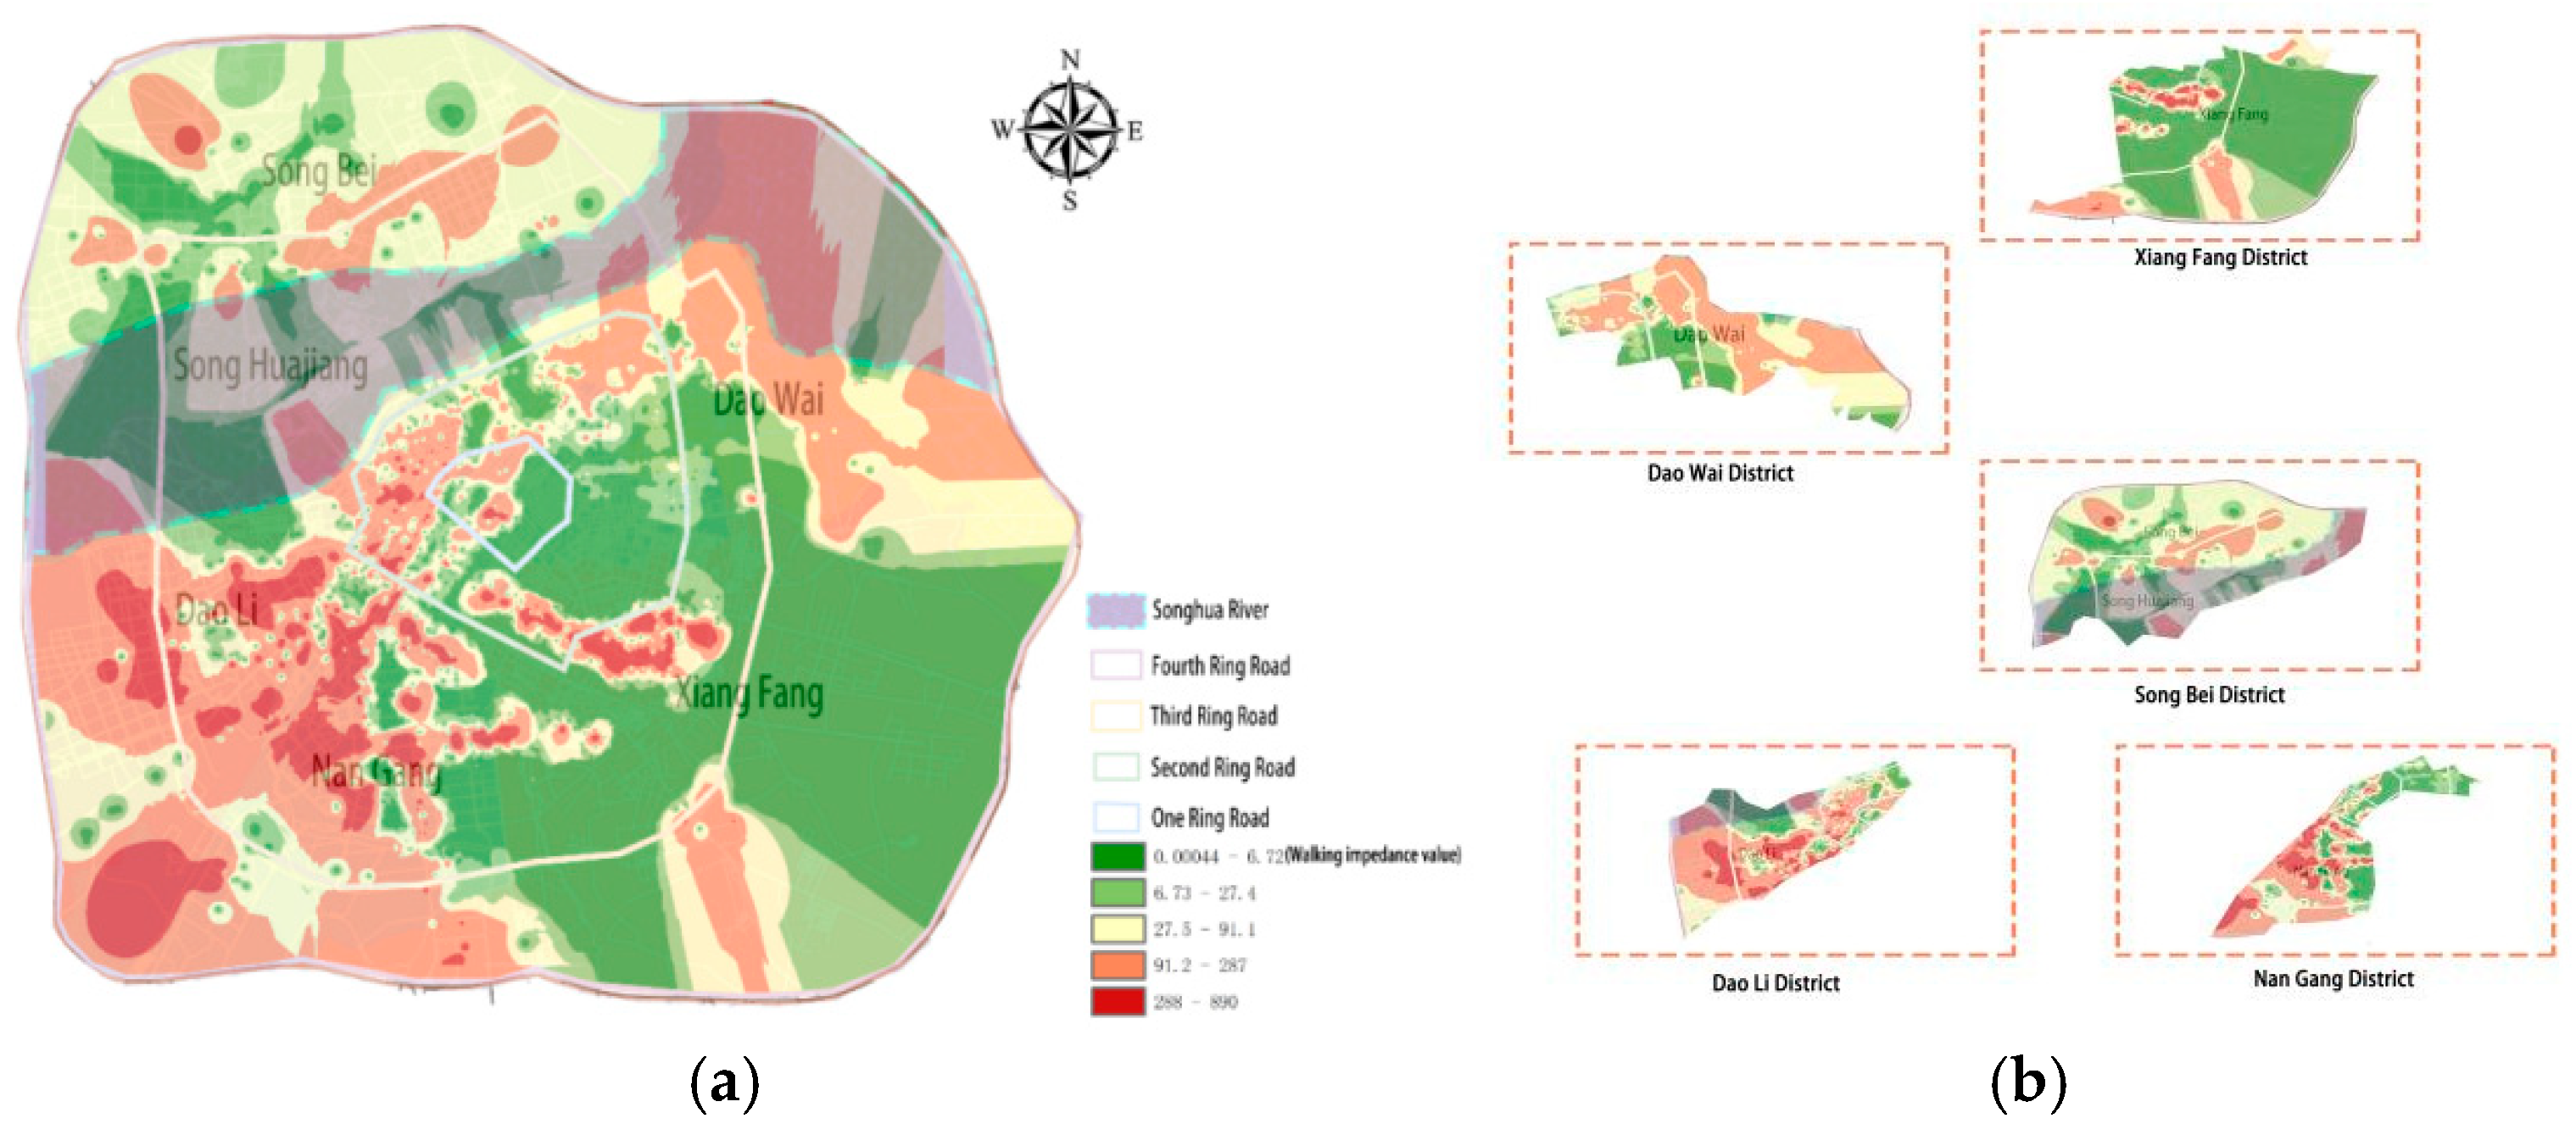
Figure 11.
(a)The area with the best road capacity(b)Regional road capacity analysis.
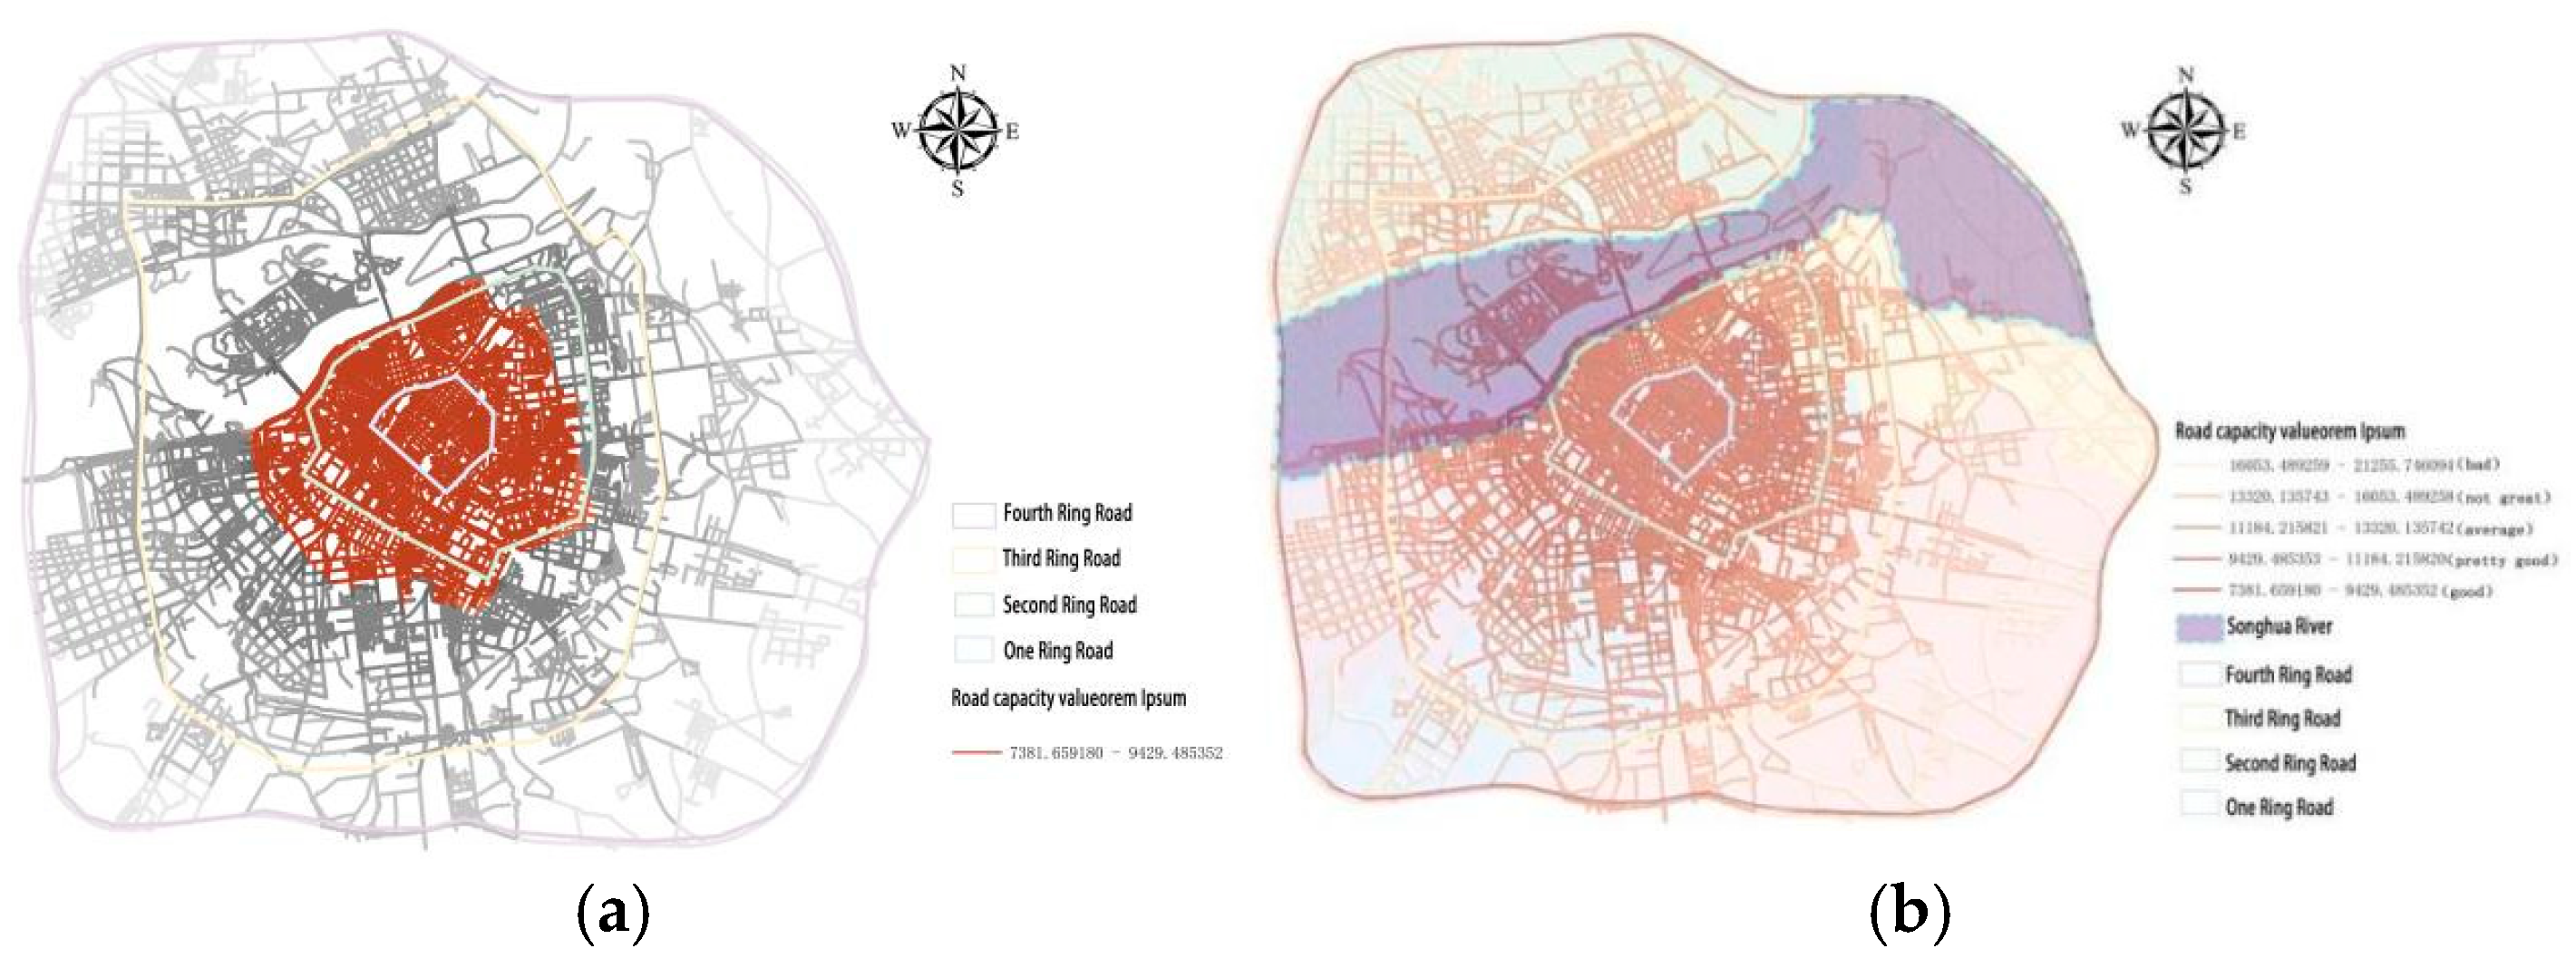
Figure 12.
(a)Distribution of the number of medical resources in the grid(b)Population distribution in a region(Note:In the diagram, it can be clearly seen that there are four areas with high concentration of medical resources).
Figure 12.
(a)Distribution of the number of medical resources in the grid(b)Population distribution in a region(Note:In the diagram, it can be clearly seen that there are four areas with high concentration of medical resources).
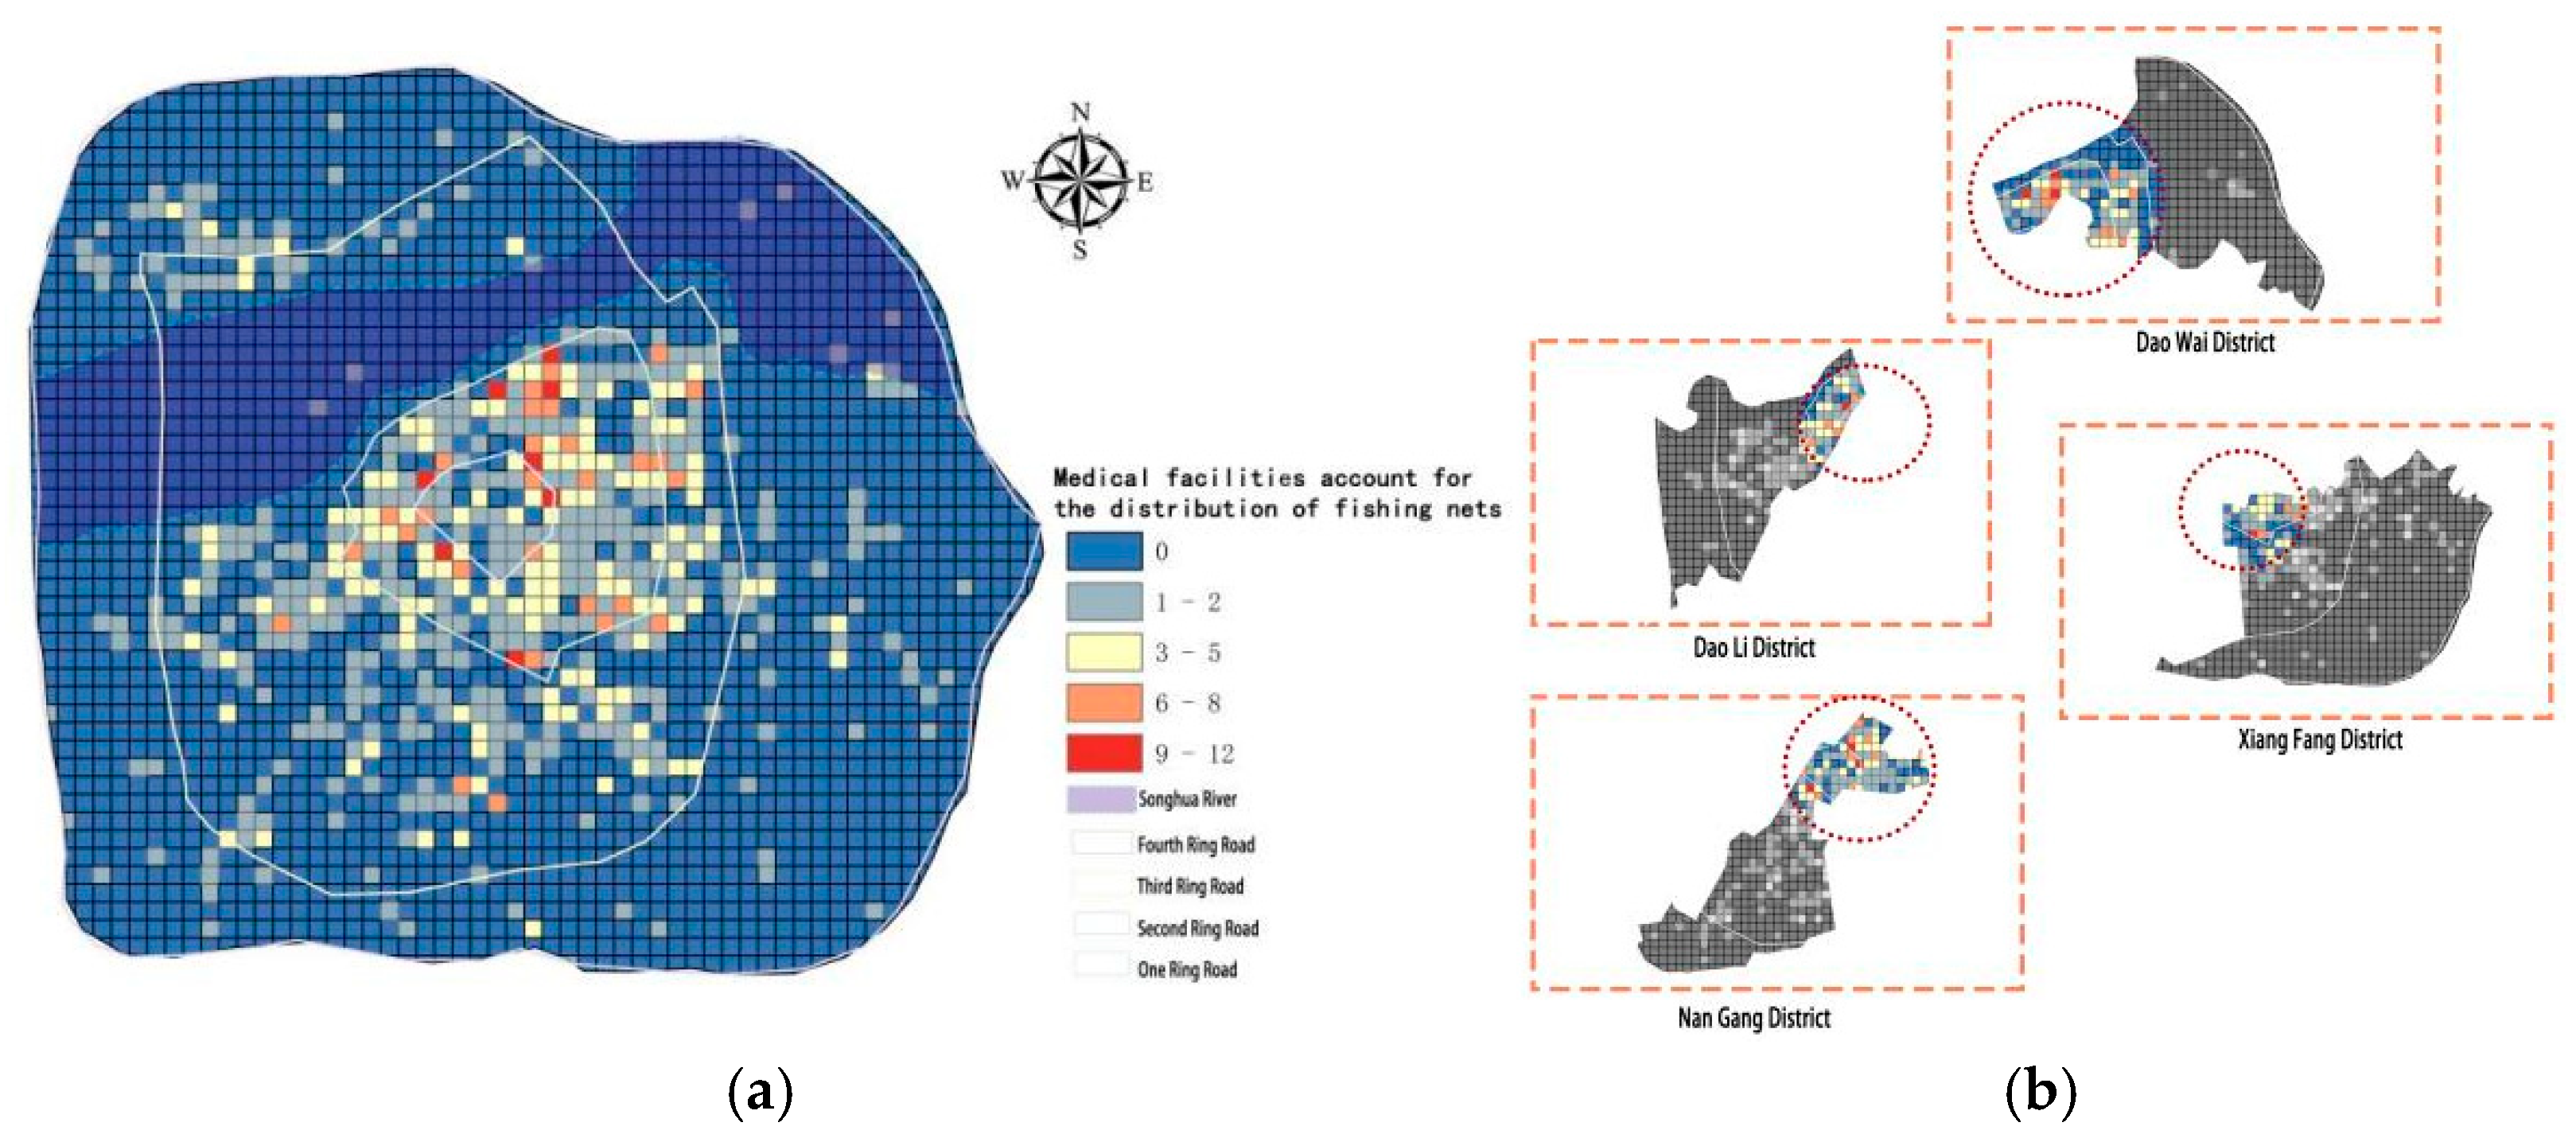
Figure 13.
(a)Analysis of the degree of concentration of medical facilities(b)Analysis of the Concentration Index of Medical Facilities.
Figure 13.
(a)Analysis of the degree of concentration of medical facilities(b)Analysis of the Concentration Index of Medical Facilities.
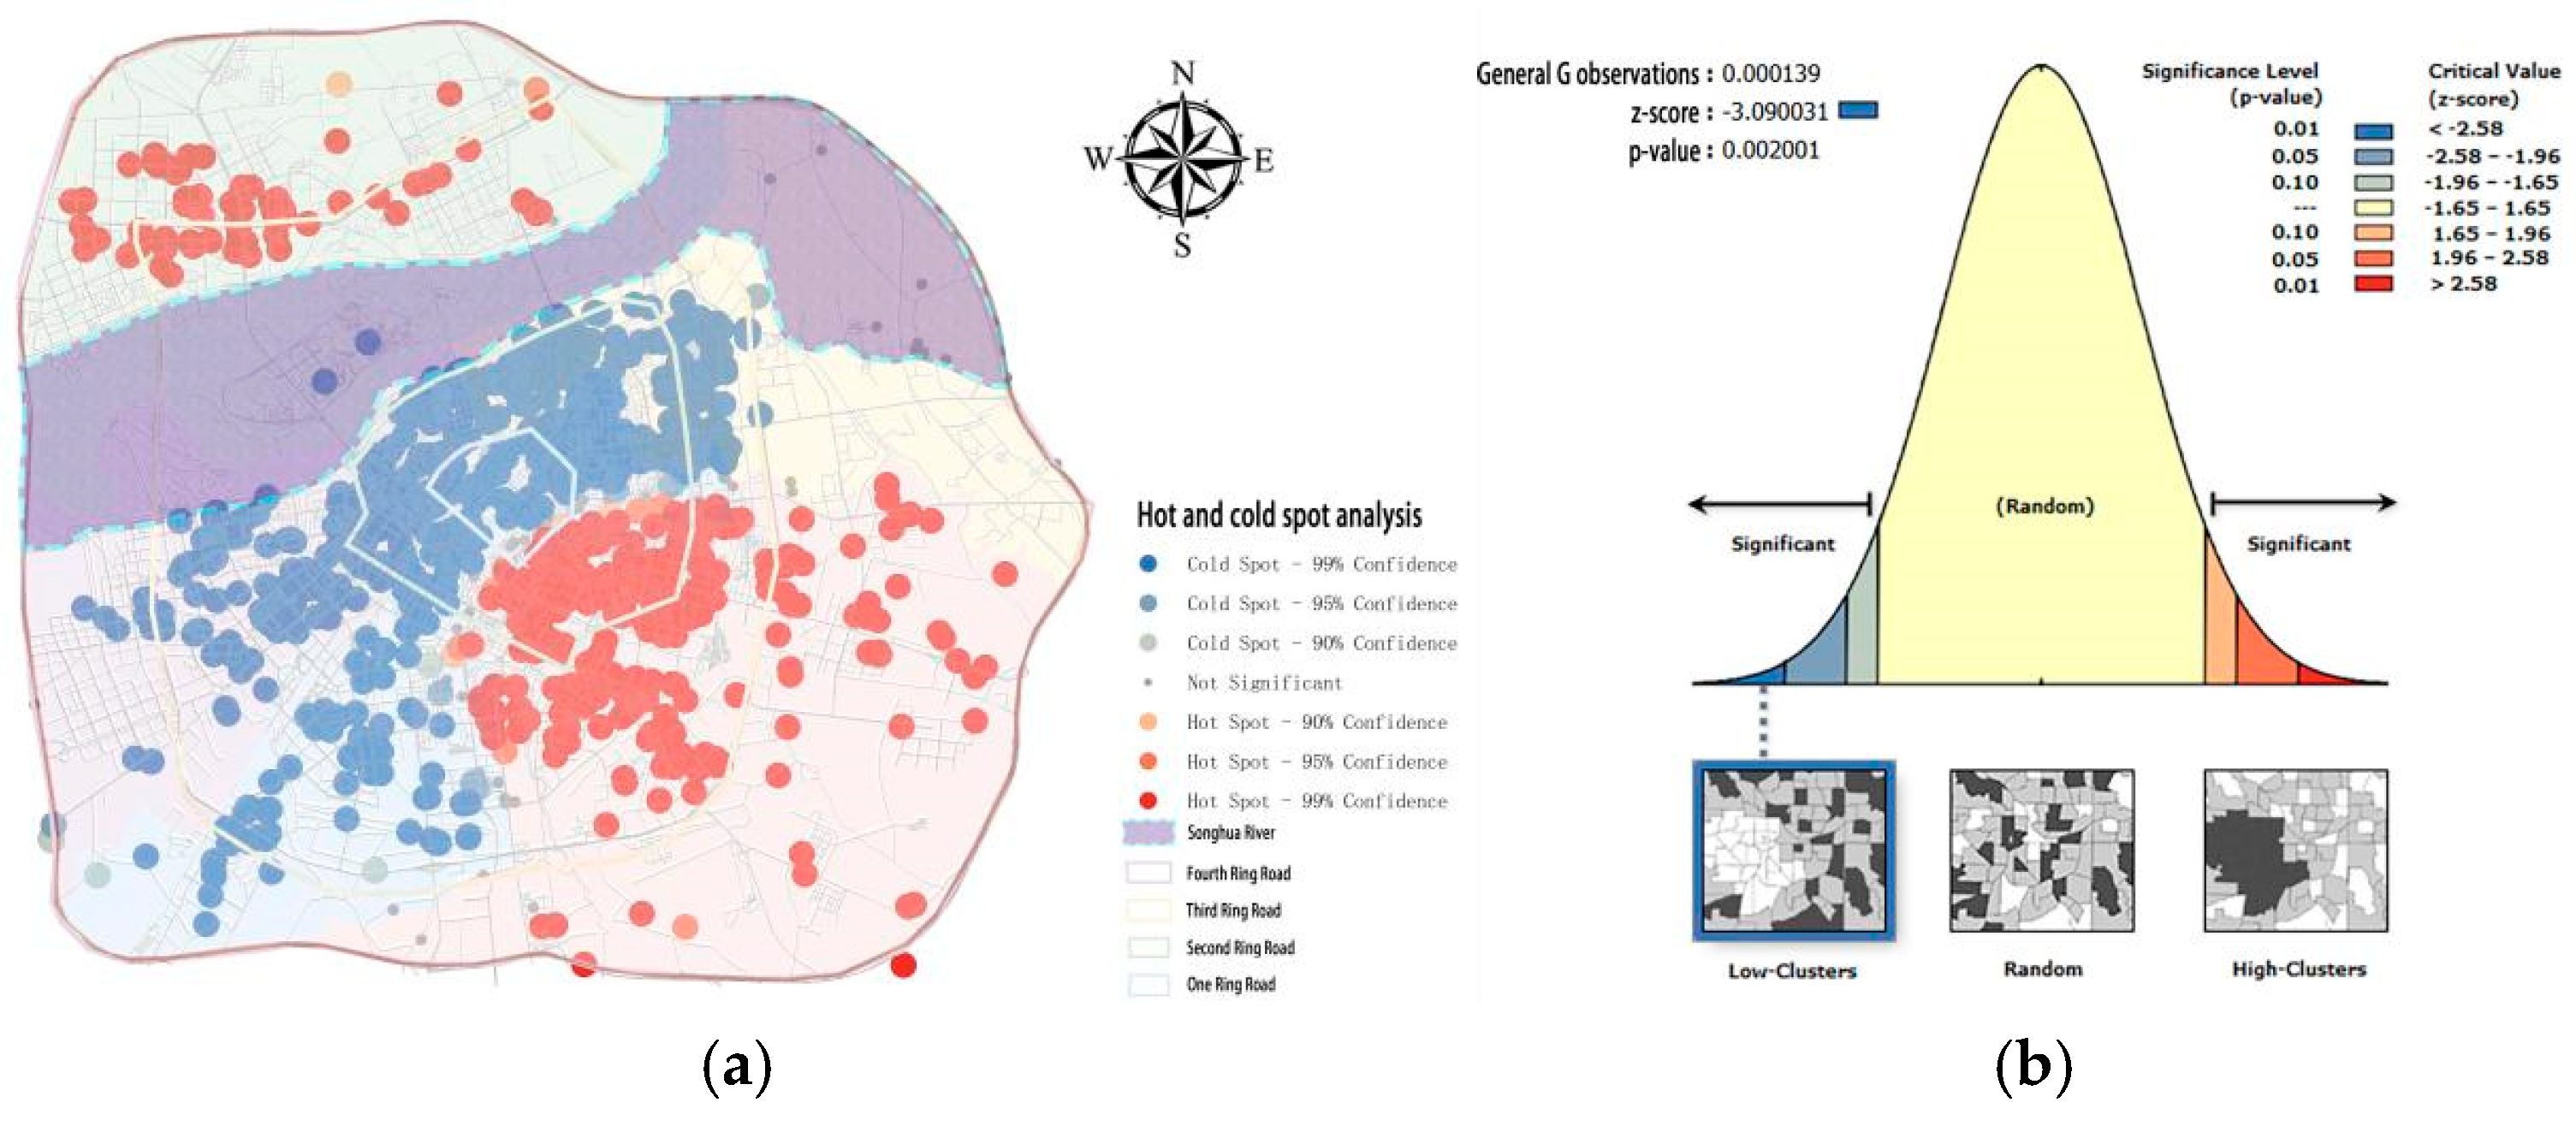
Figure 14.
(a)Analysis of urban service radius(b)Regional service radius analysis.
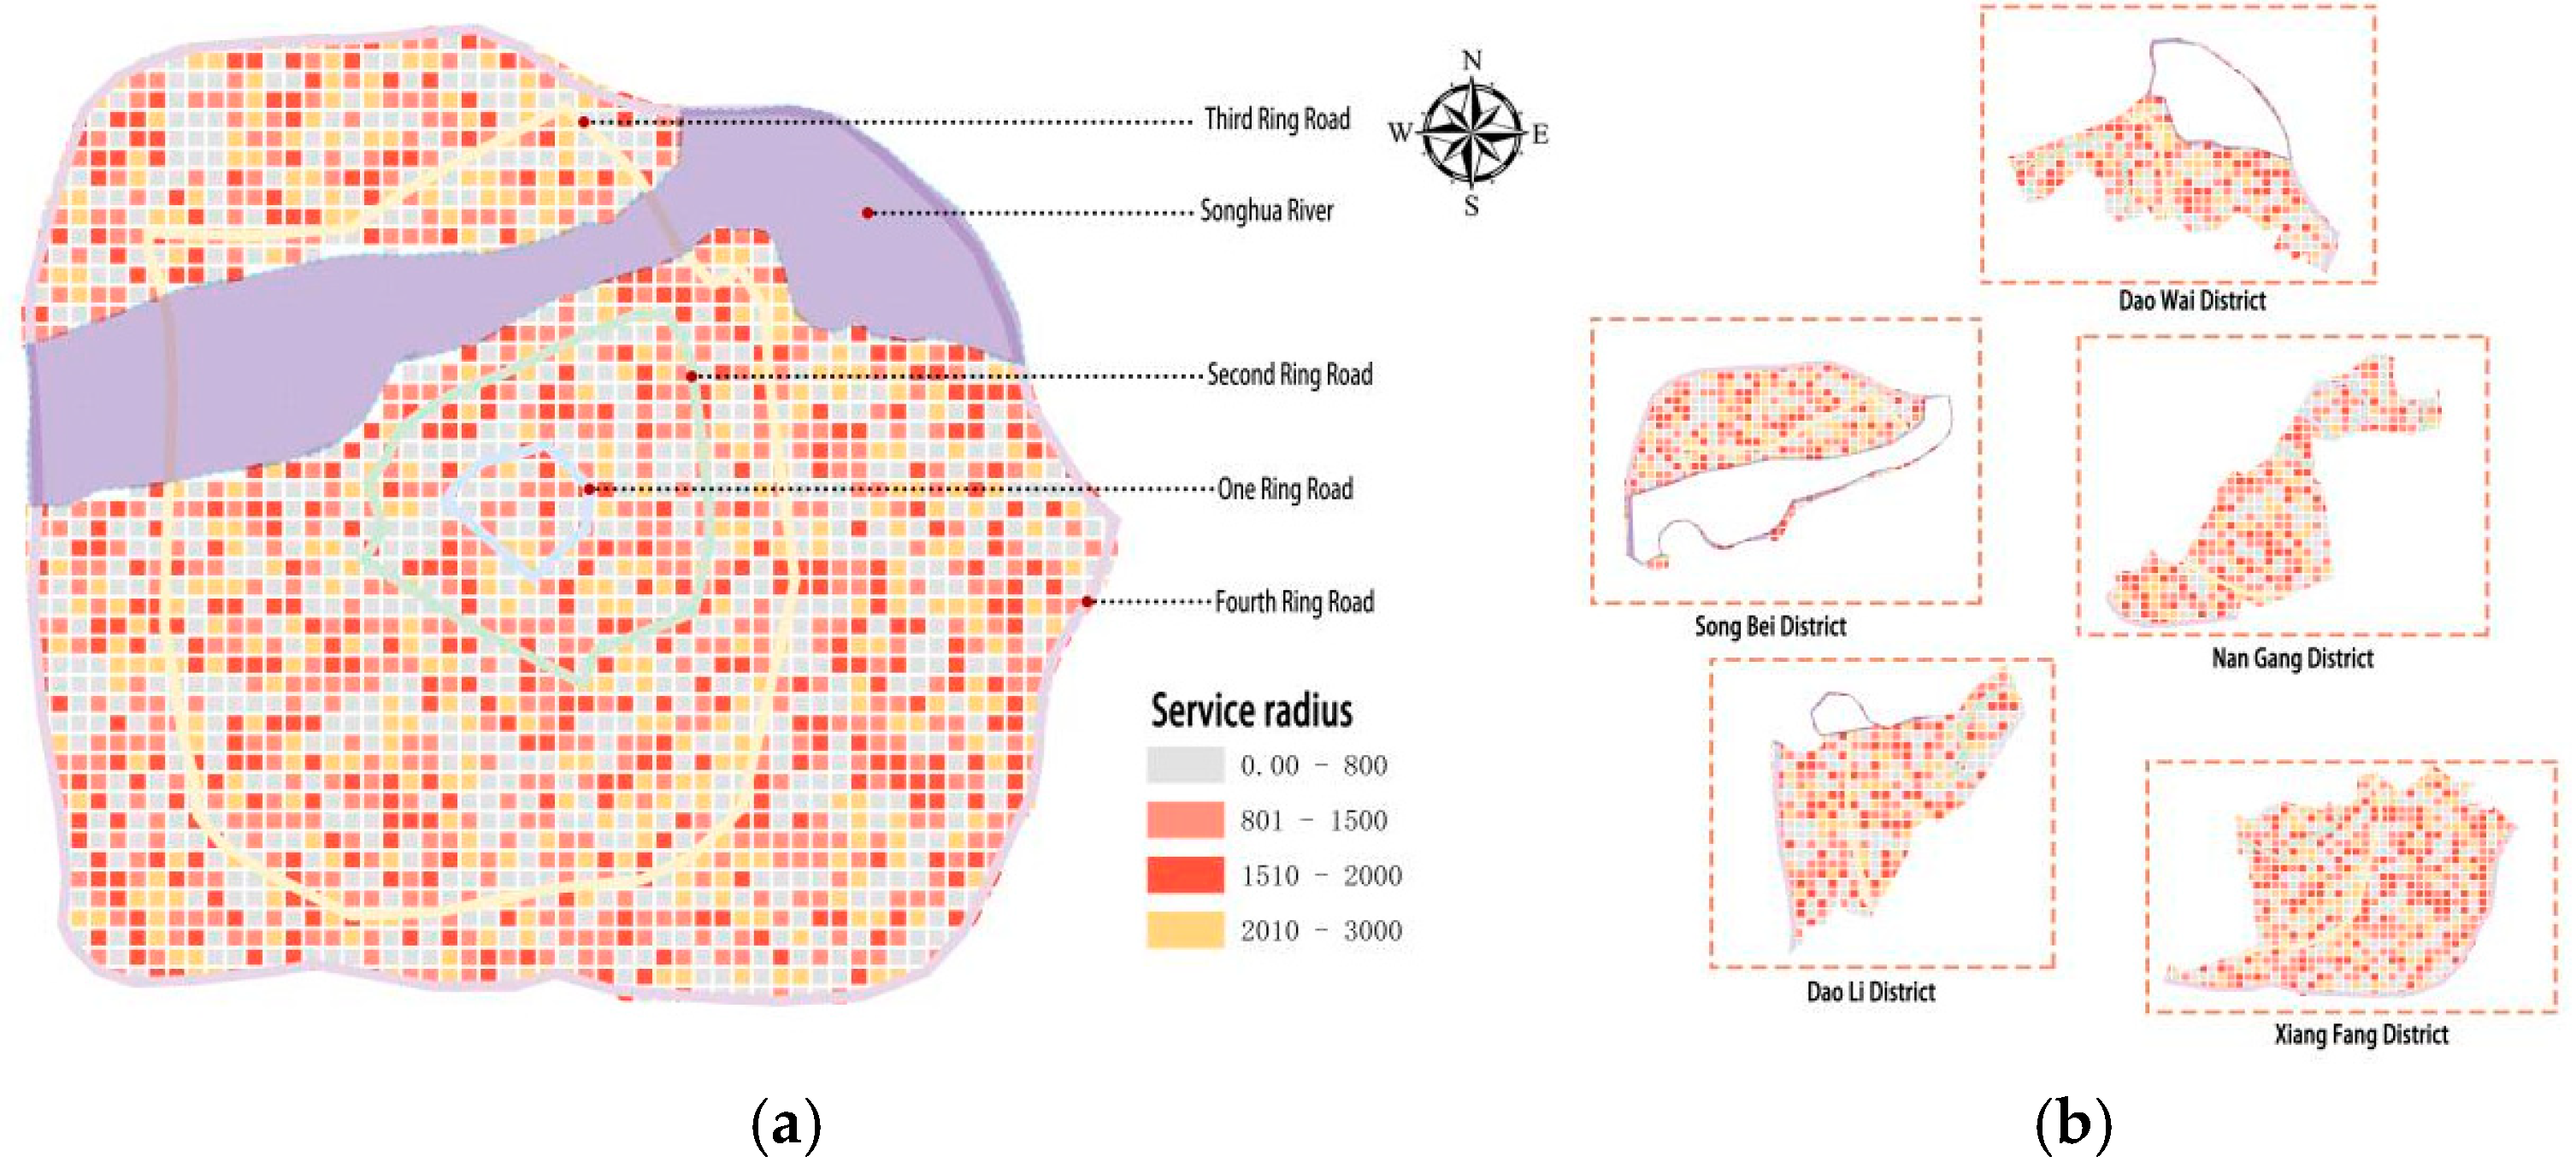
Figure 15.
(a)Analysis of the radius of clinic services(b)Community Hospital Service Radius Analysis(c)Analysis of the service radius of the health center.
Figure 15.
(a)Analysis of the radius of clinic services(b)Community Hospital Service Radius Analysis(c)Analysis of the service radius of the health center.

Figure 16.
(a)Spatial autocorrelation analysis(b)Spatial autocorrelation index analysis.
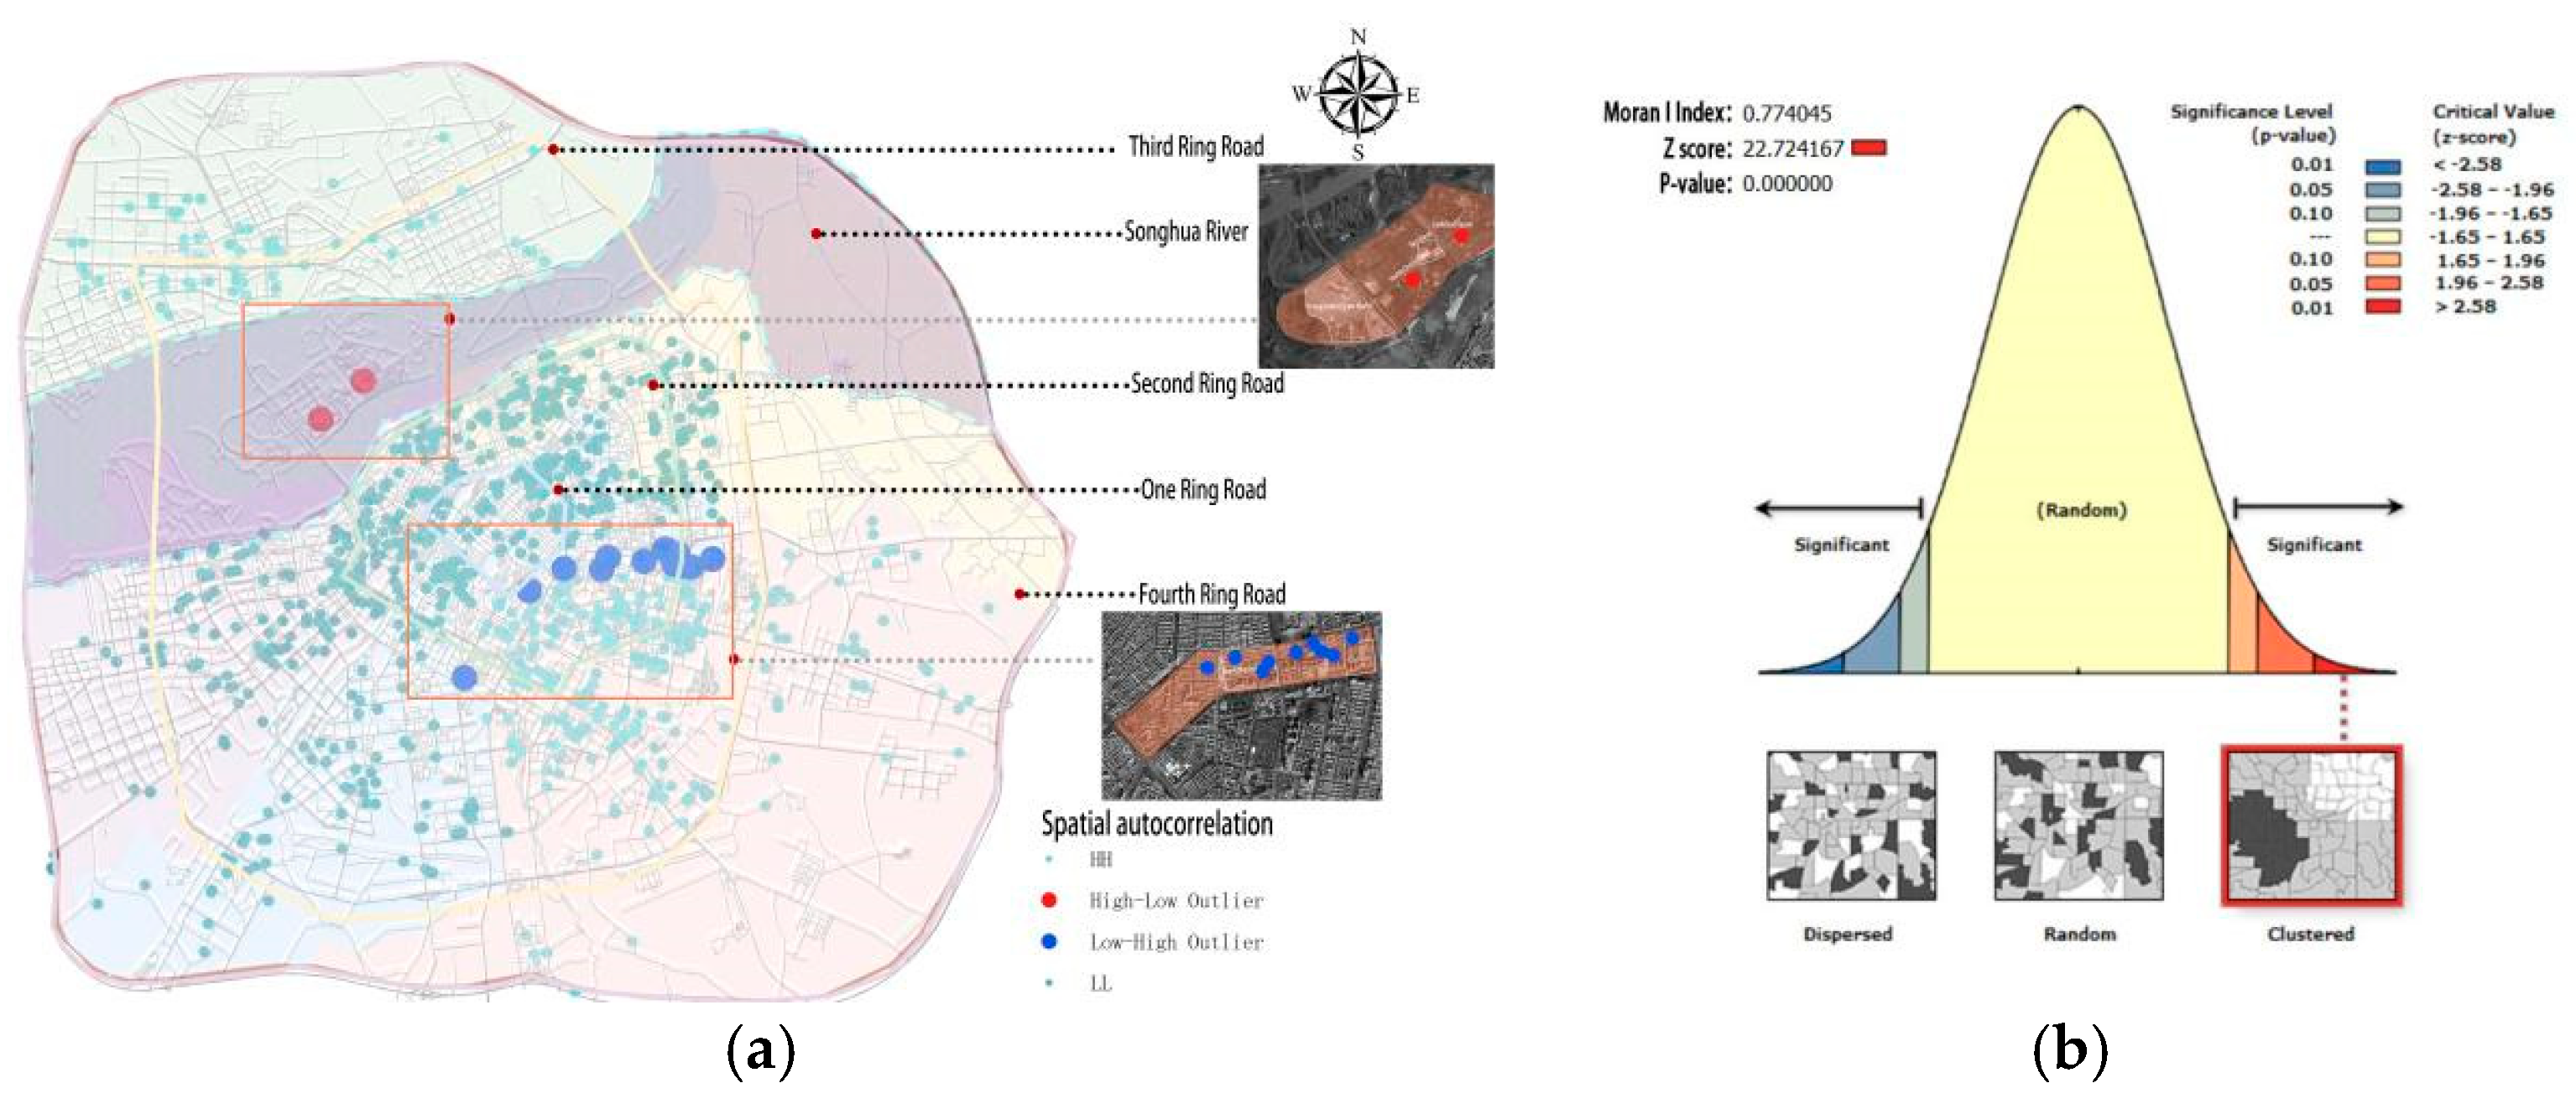
Figure 17.
(a)500 meters of medical resource stability(b)1000 meters of medical resource stability(c)1500 meters of medical resource stability.
Figure 17.
(a)500 meters of medical resource stability(b)1000 meters of medical resource stability(c)1500 meters of medical resource stability.
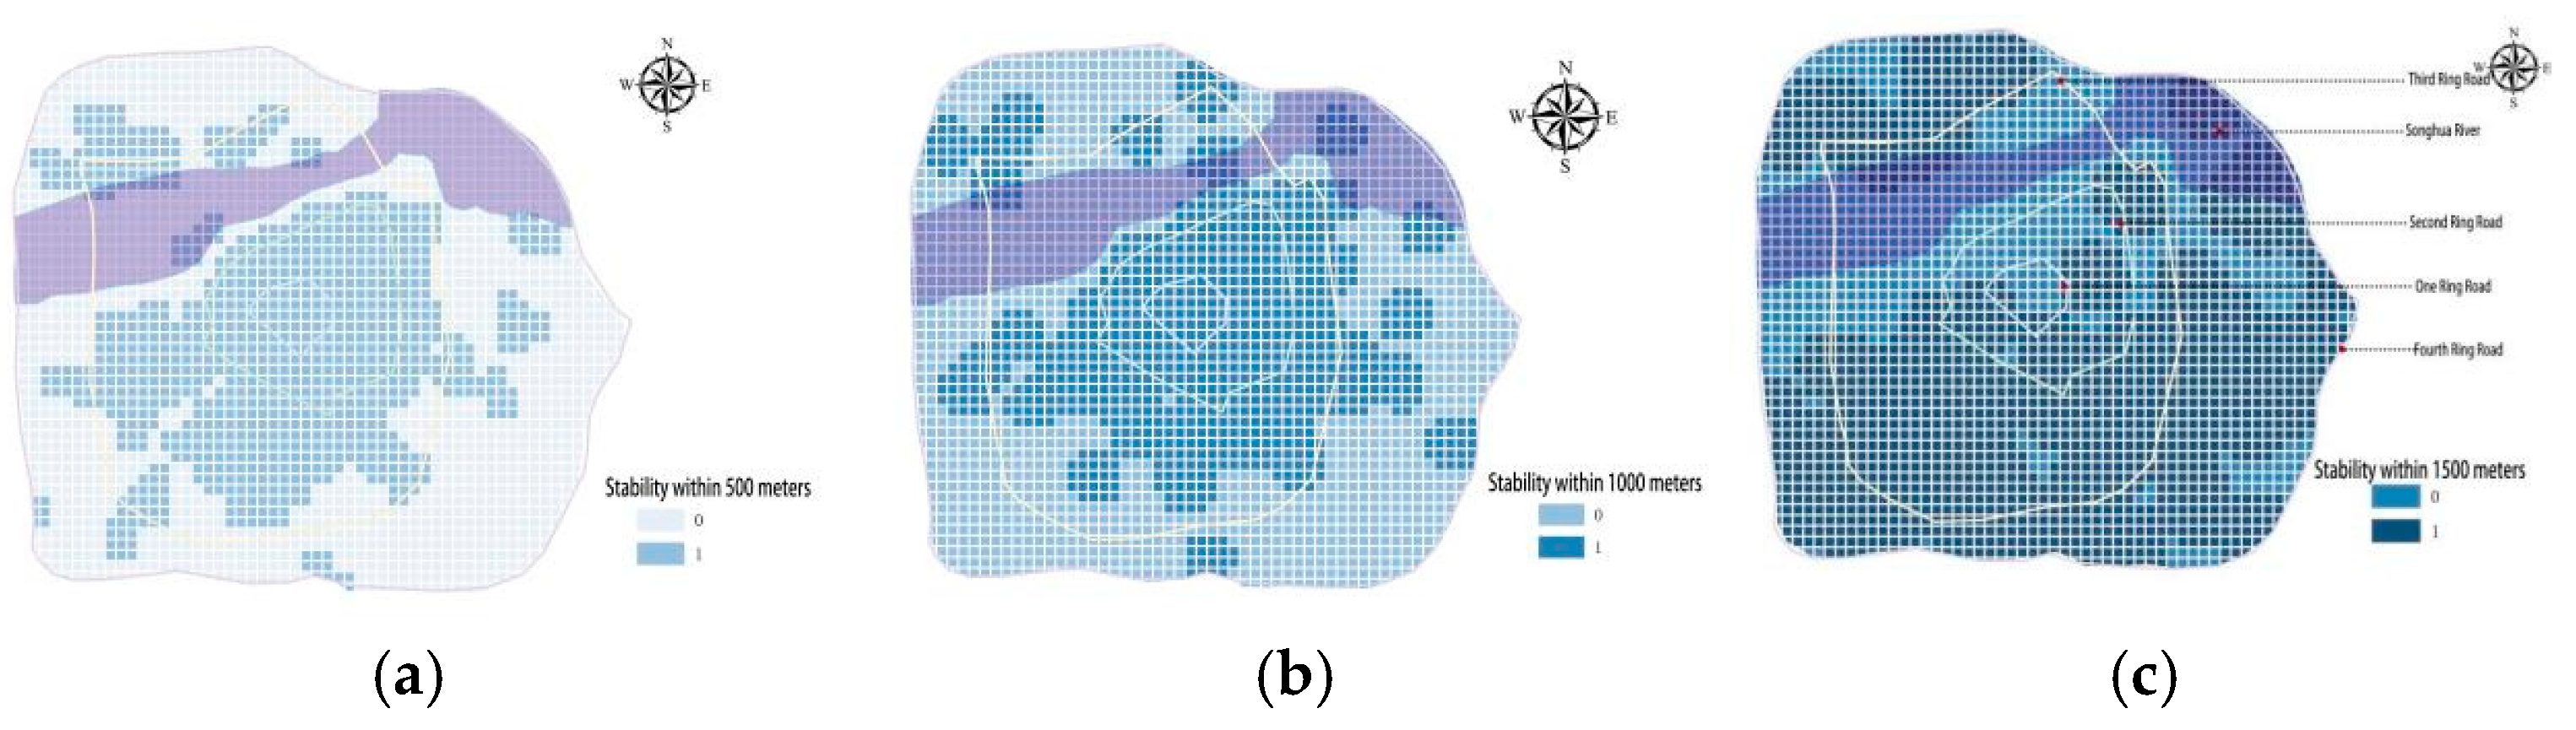
Figure 18.
(a)Stability map of urban areas(b)Regional stability map.
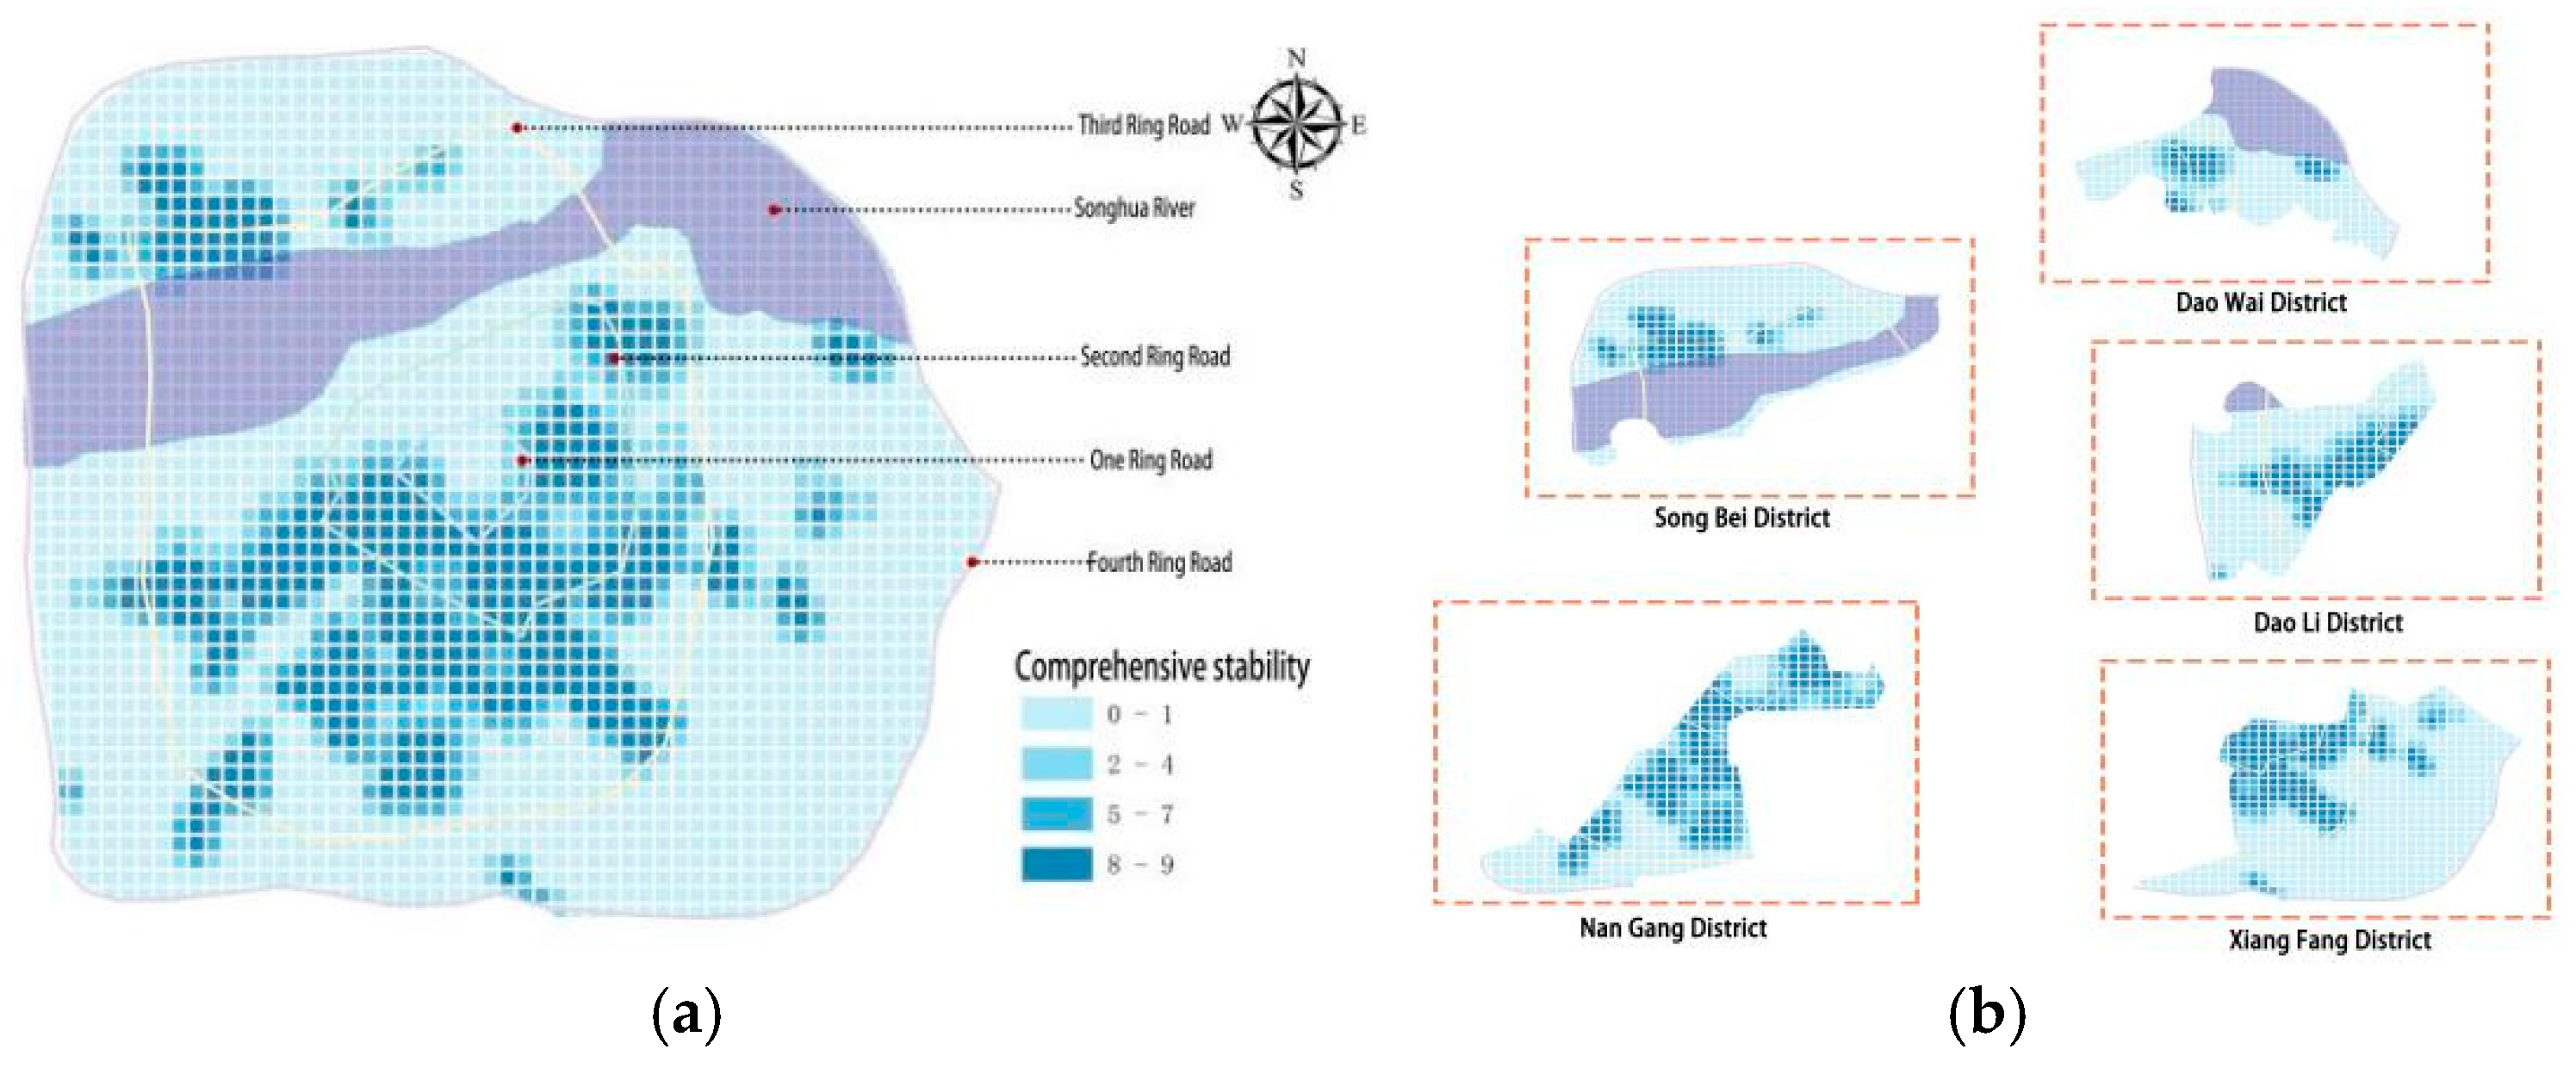
Figure 19.
(a)Map of disease demand density in the same area(b)Map of disease demand density in urban areas.
Figure 19.
(a)Map of disease demand density in the same area(b)Map of disease demand density in urban areas.
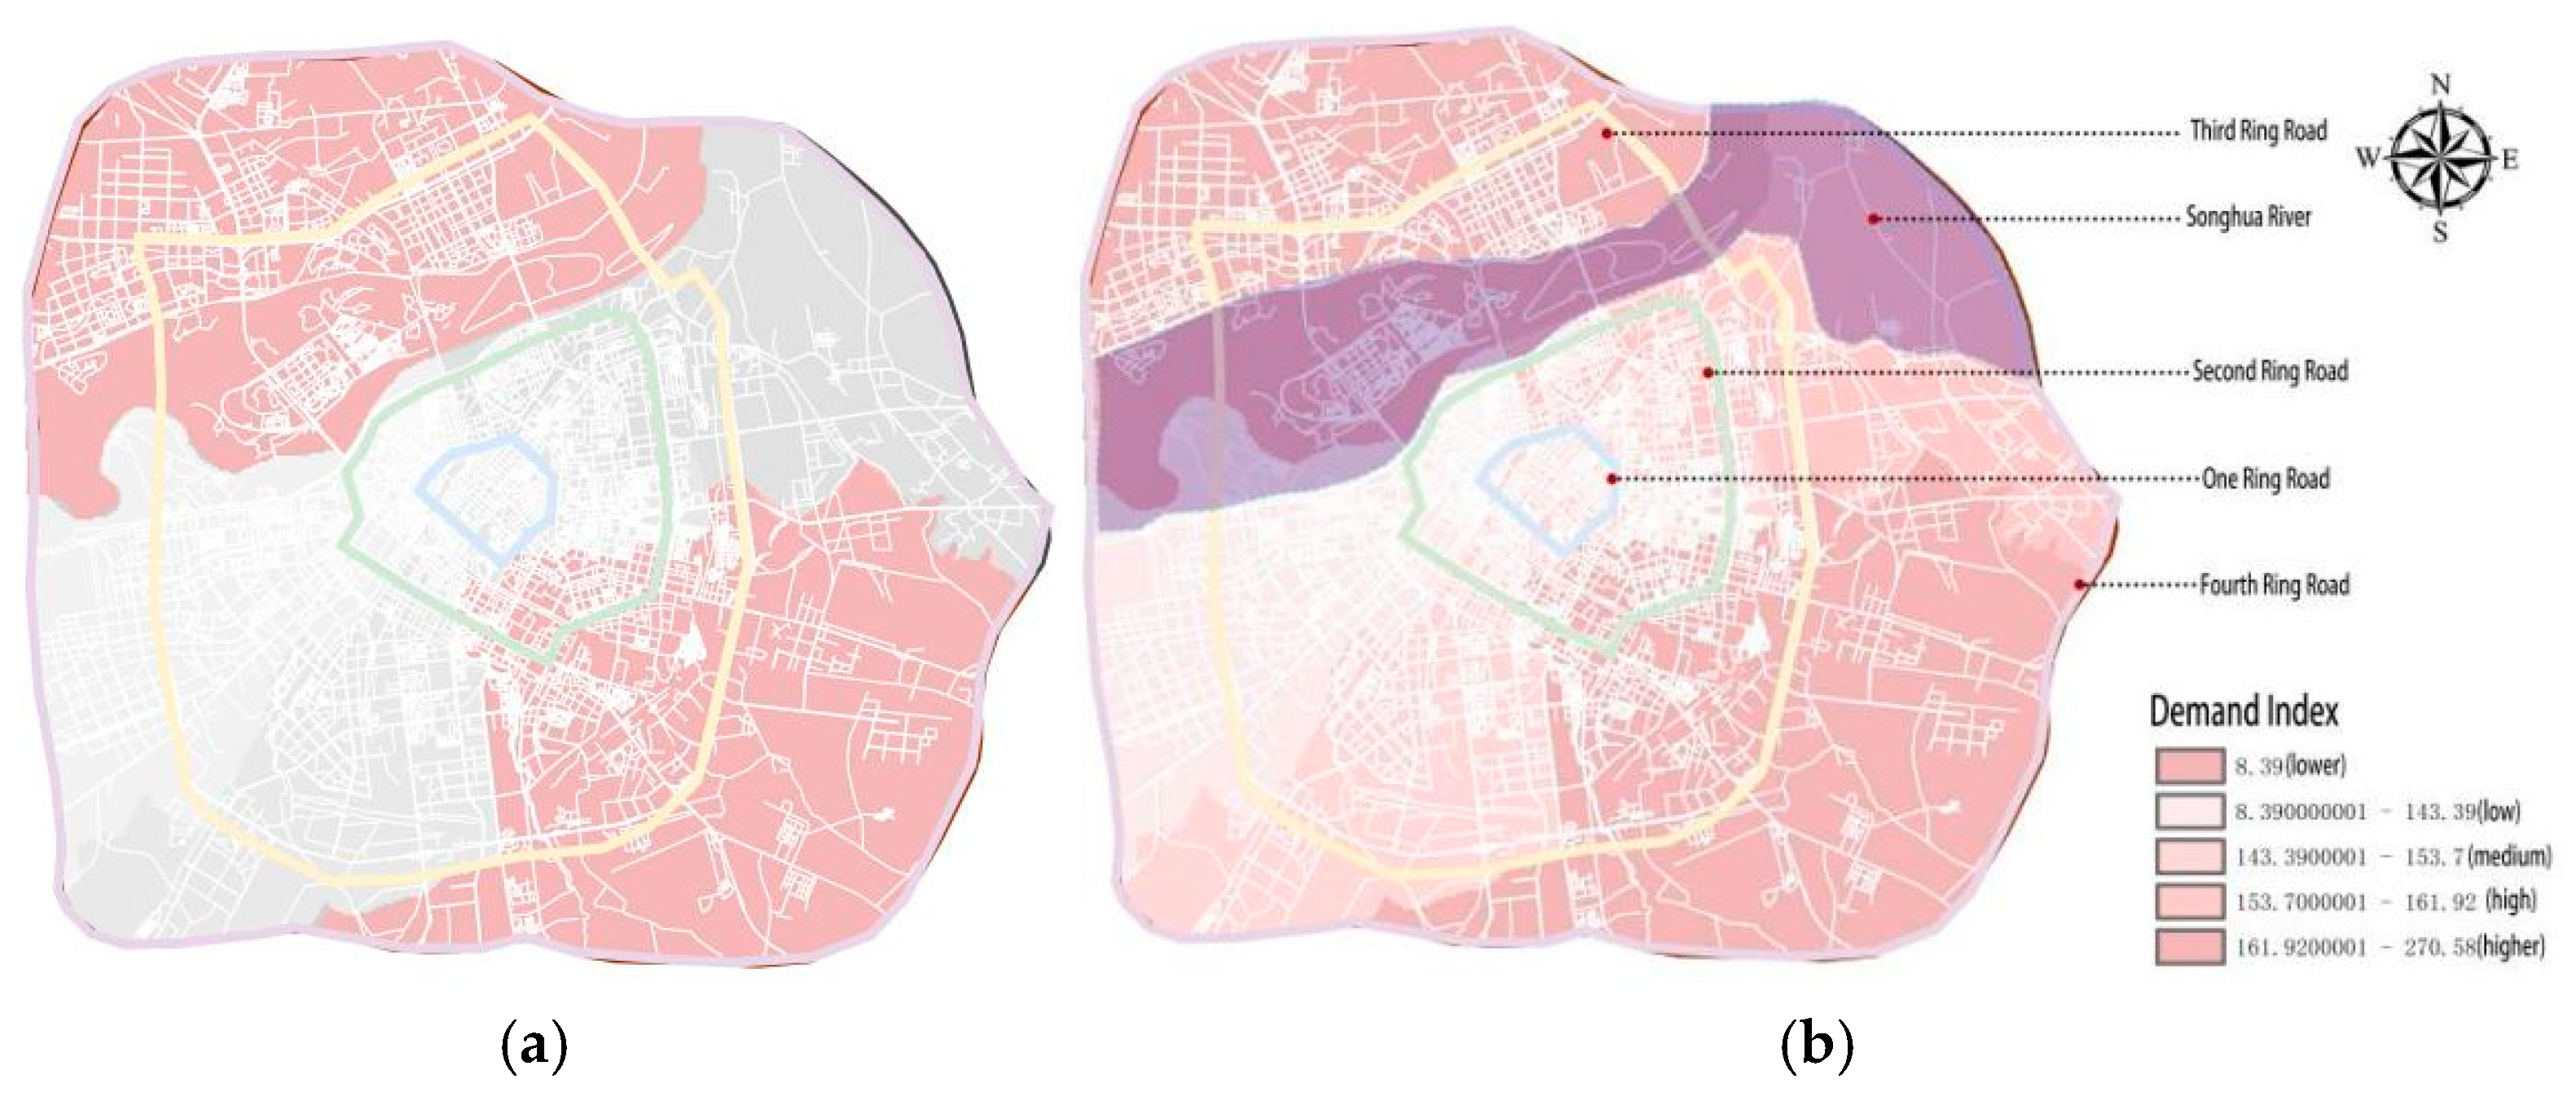
Figure 20.
(a)Resilience map of urban medical resources(b)Resilience map of regional medical resources.
Figure 20.
(a)Resilience map of urban medical resources(b)Resilience map of regional medical resources.
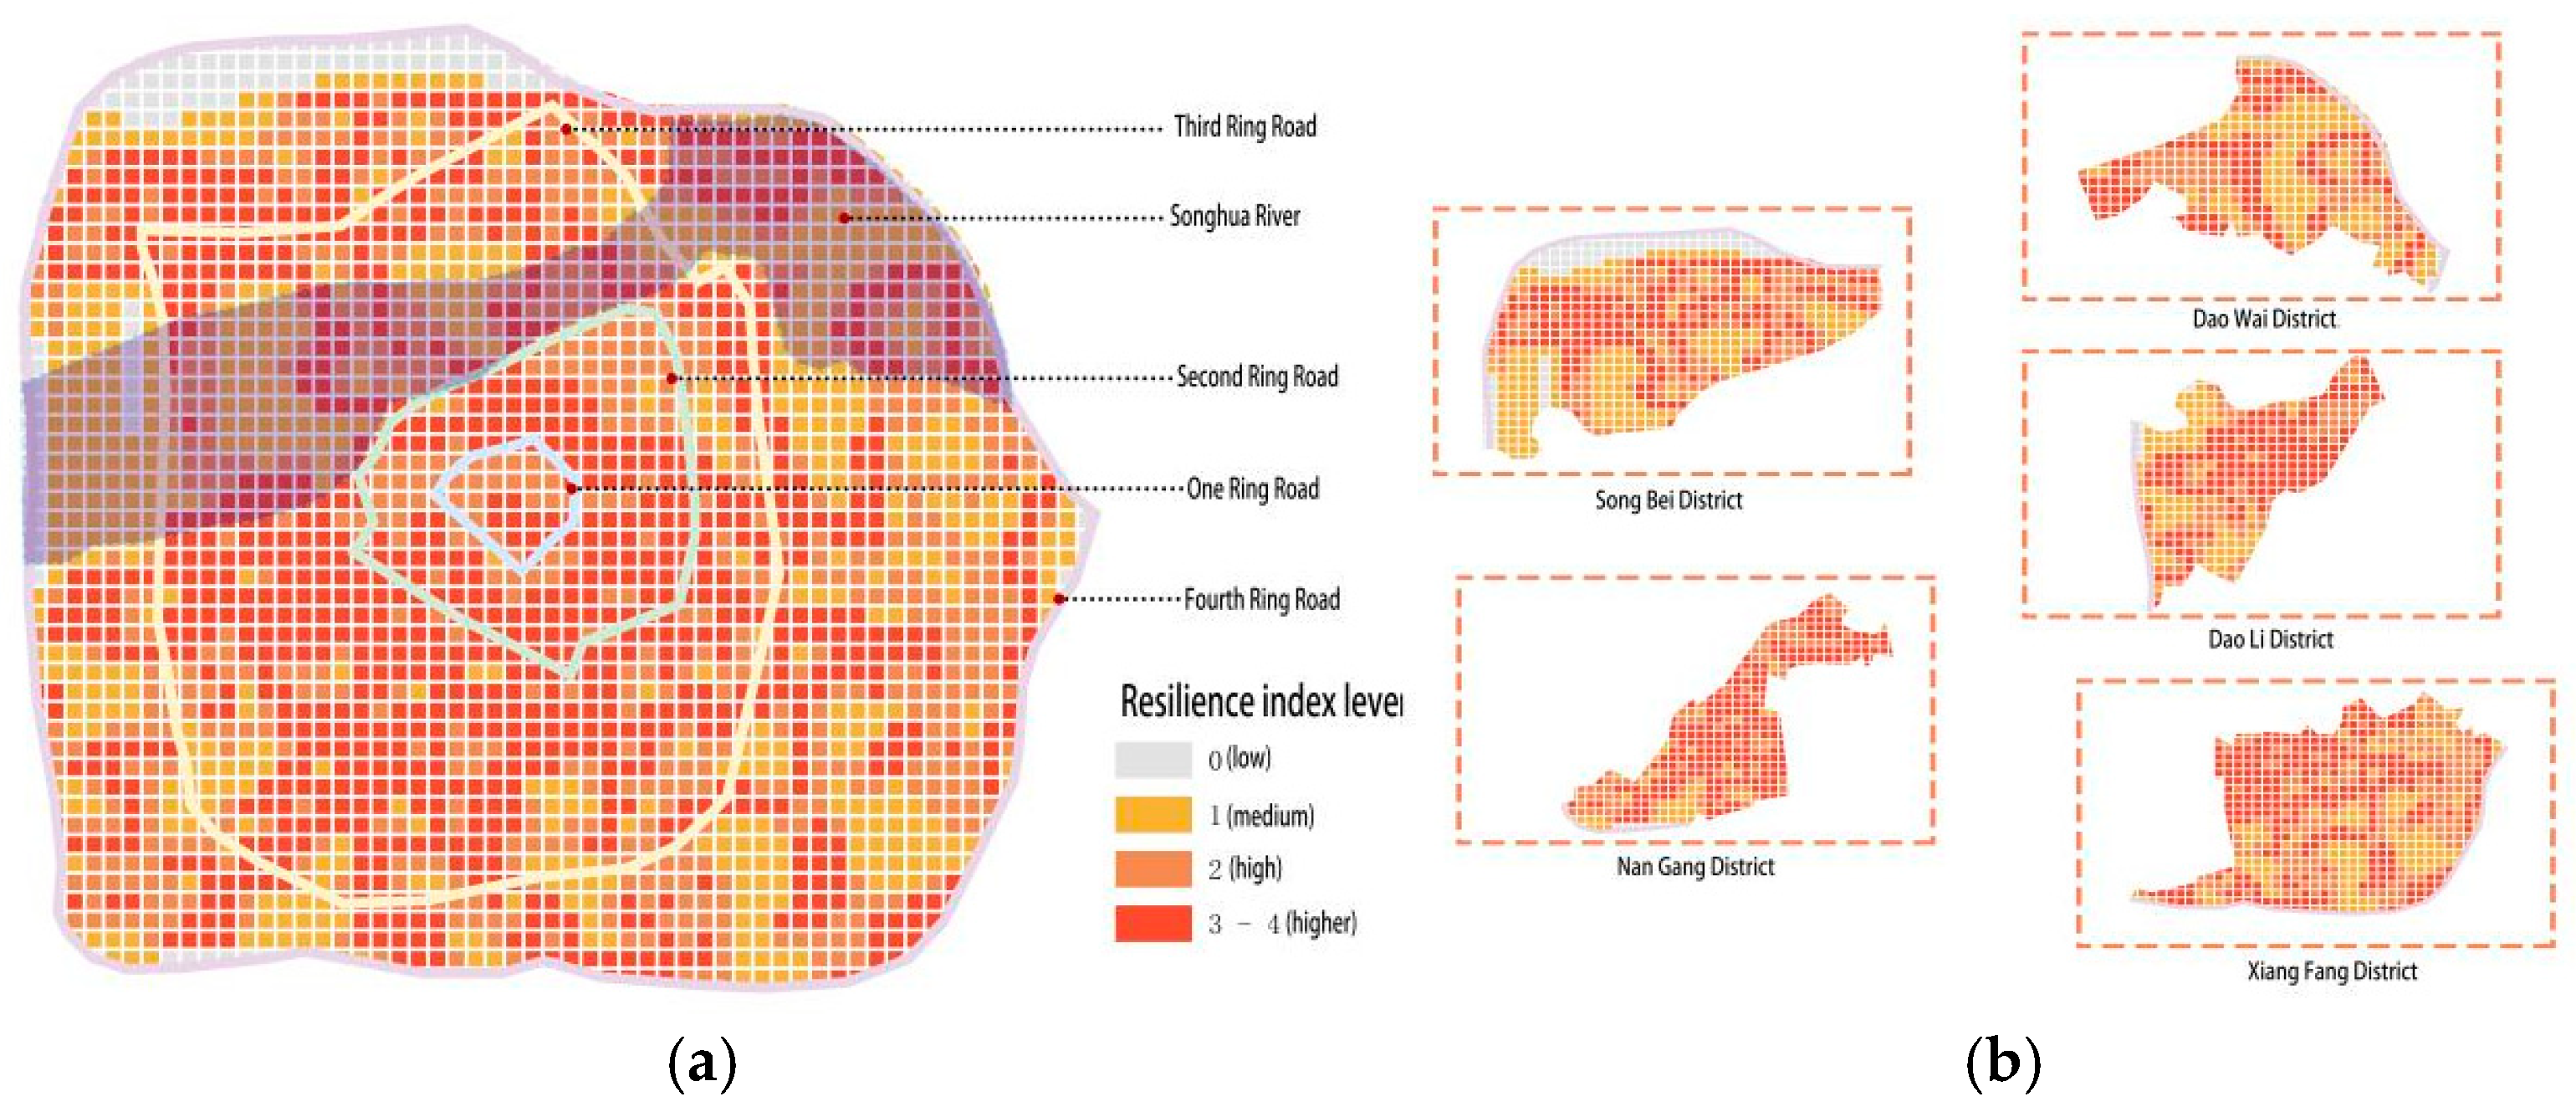
Figure 21.
Optimization diagram.
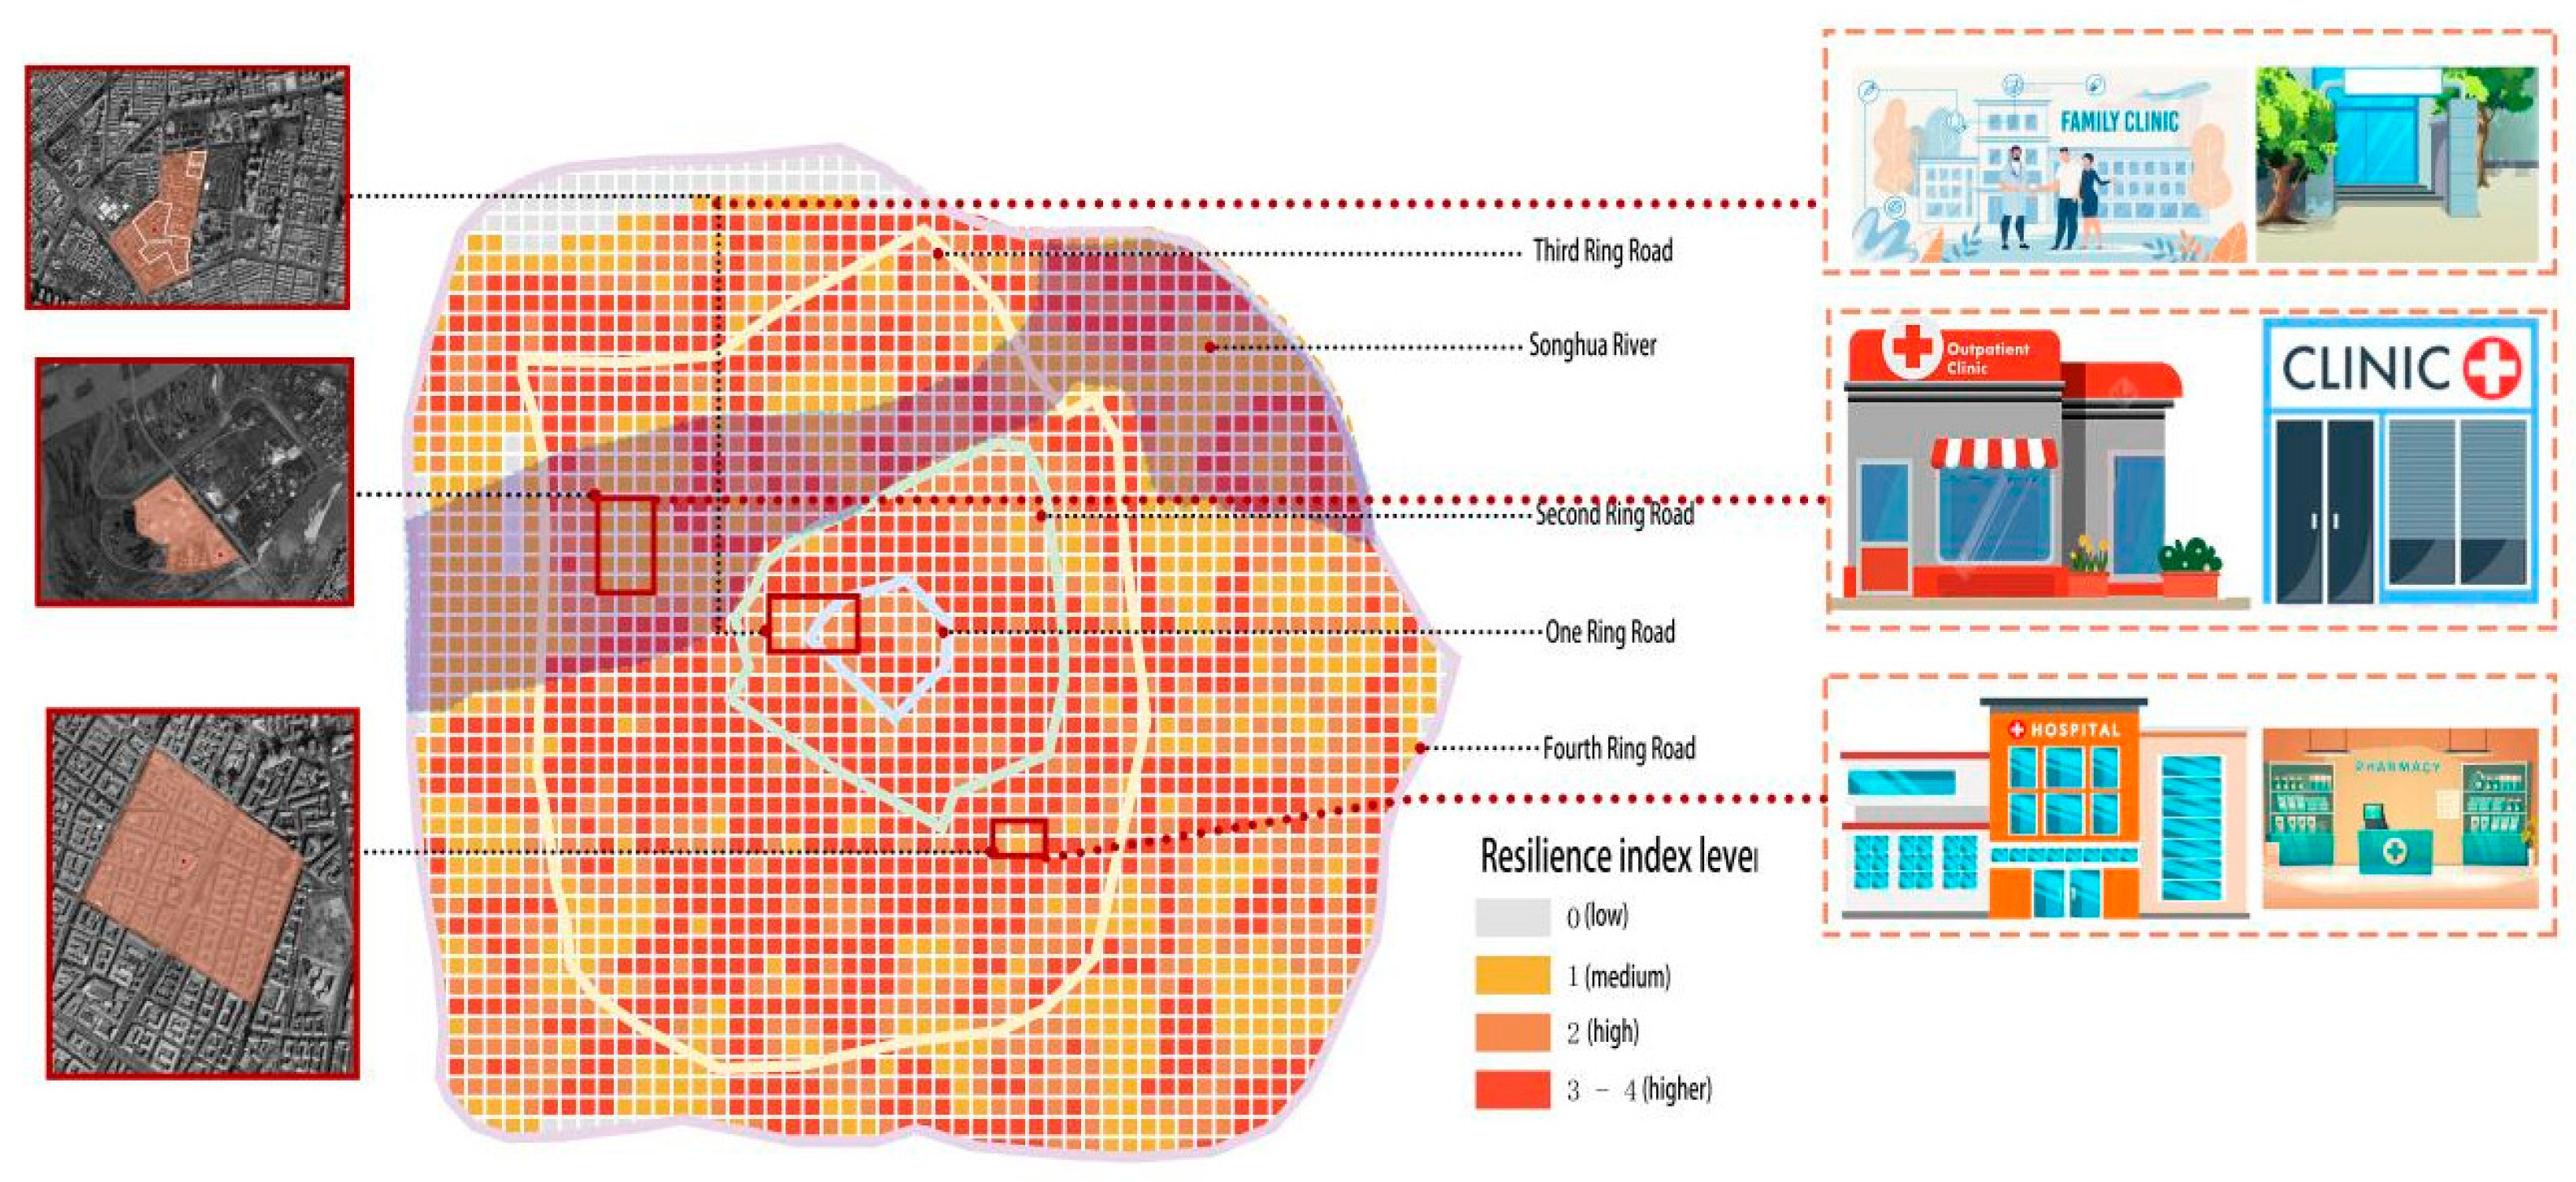
Table 2.
Proportion of medical resources.
| Medical facilities | Number of POIs | Percentage |
| Hospitals | 101 | 8.43% |
| Community hospitals | 244 | 20.37% |
| Clinic | 853 | 71.20% |
Table 3.
Quantitative results of accessibility by administrative region.
| Region | Transfer value | Transmission difference |
| Daoli District | 0.005163 | 0.004837 |
| DaoWai District | 0.002285 | 0.007715 |
| NanGang District | 0.009024 | 0.000976 |
| Songbei District | 0.003957 | 0.006043 |
| XiangFang District | 0.004062 | 0.005938 |
Table 4.
The distribution of medical resources in the service area.
| Medical resources | 0—800meters | 801——1500meters | 1501——2000meters | 2001——3000meters |
| clinic | 228 | 170 | ||
| Community hospitals | 44 | 51 | 42 | |
| Hospitals | 23 | 34 | 26 | 18 |
Table 5.
Classification of the resilience level of medical facilities in the main urban area of Harbin.
Table 5.
Classification of the resilience level of medical facilities in the main urban area of Harbin.
| Toughness level | Number of meshes | Number of medical facilities | Number of first-class medical facilities |
| good(4) | 996 | 785 | 63 |
| Relatively good(3) | 713 | 329 | 29 |
| medium(2) | 613 | 64 | 9 |
| poor(1) | 160 | 0 | 0 |
Disclaimer/Publisher’s Note: The statements, opinions and data contained in all publications are solely those of the individual author(s) and contributor(s) and not of MDPI and/or the editor(s). MDPI and/or the editor(s) disclaim responsibility for any injury to people or property resulting from any ideas, methods, instructions or products referred to in the content. |
© 2025 by the authors. Licensee MDPI, Basel, Switzerland. This article is an open access article distributed under the terms and conditions of the Creative Commons Attribution (CC BY) license (http://creativecommons.org/licenses/by/4.0/).
Copyright: This open access article is published under a Creative Commons CC BY 4.0 license, which permit the free download, distribution, and reuse, provided that the author and preprint are cited in any reuse.


