Submitted:
27 November 2024
Posted:
28 November 2024
You are already at the latest version
Abstract
To enable envisaging the impact of the developed multi-objective optimal sizing dynamic system model on the conceptual design and sizing of the hybrid system, its results are compared versus those obtained from a single-objective PSO-Based hybrid system model that only minimises the levelized cost of energy. Results for this comparative analysis are obtained by applying both the single and multi-objective developed PSO-based dynamic hybrid system models on the same case study grid-connected building within Robert Gordon university campus in Aberdeen. Optimisation results showed that when minimising only the LCOE for consumers, the optimal sizing of the hybrid system components is found to be 1000 kW PV system, 932 kW electrolyser, 22.7 kg H2 storage tank and 242 kW fuel cell system, with the levelized cost of energy 0.366 £/kWh and grid dependency of 40%. On the other hand, when using the developed multi-objective optimal sizing model to minimise both the LCOE and the building carbon footprint, the optimal sizing of the hybrid system components is found to be 3187.8 kW PV system, 1000 kW electrolyser, 106.1 kg H2 storage tank and 250 kW fuel cell system, with a relatively good levelized cost of energy of 0.5188 £/kWh and grid dependency reduced to 33.33%.
Keywords:
Hybrid Renewable-Hydrogen Energy Systems
; Optimal Sizing Model
; Particle Swarm Optimisation
; Levelized Cost of Energy
; Carbon Footprint
; Cost-Optimisation Function
; Cost &Footprint Optimisation Function
1. Introduction
Hybrid Renewable-Hydrogen Energy Systems (HRHESs) are systems which integrate hydrogen energy storage (HES) with renewable sources to allow an energy storage medium for the excess in renewable production in the form of a clean fuel that can be used later when needed during the renewable none or deficit production. This stored green H2 can be either used in a fuel cell to supply the load demand with electrical energy when needed or can be used directly as a fuel for heating purposes or fuelling vehicles [1]. The accurate sizing, energy management and real-world simulation of such a dynamic hybrid system within grid-integrated buildings represent key challenges for its wider deployment. In this context, researchers have developed single-objective optimisation models [2,3,4,5,6] that allow the optimal sizing and energy management of stand-alone or grid-connected HRHESs while aiming in their optimisation only cost-minimisation. However, in their models, they did not consider the dynamic behaviour of the electrolyser in response to the varying renewable energy input nor the dynamic behaviour of the fuel cell in response to the dynamic availability of hydrogen in the storage tank. Further research routes have developed multi-objective optimization models for grid-integrated HRHESs while aiming in their optimisation various aspects. Gharibi et al. [7] developed a model that allows the optimal sizing and power exchange of a grid-connected hybrid system combining diesel generator, PV arrays, and fuel cell, while aiming the optimisation of cost, reliability, and renewability. However, their system modelling has notable limitations since the electrolyser is modelled using fixed molar flow rate of hydrogen production, that is failing to capture dynamic performance changes under variable operating conditions due to fluctuating renewable inputs. Additionally, their fuel cell model does not incorporate electrochemical losses, such as activation, ohmic, or concentration losses, which are critical for accurately predicting the system efficiency and output power. Abdelshafy et al. [8] developed a model that allows the optimal sizing of a grid-connected desalination power plant powered from hybrid renewables including PV, wind, battery, HES and diesel backup, while aiming minimizing cost and carbon emissions. However, their system modelling reflects oversimplifications given that the electrolyser and fuel cell models relied on fixed efficiency assumptions, neglecting real-time performance variations due to fluctuating renewable inputs, storage levels, electrochemical losses and varying load demands. Fonseca et al. [9,10] developed a multi-criteria optimisation model that allows the optimal design of a distributed energy system incorporating PV panels, battery and HES while aiming the optimisation of cost, carbon emissions and sustainability aspects. However, again their modelling assumes constant efficiencies for energy conversion units including electrolyser and fuel cell throughout their operation. Furthermore, key aspects such as the faraday efficiency and the irreversible losses were completely overlooked, limiting the model's ability to predict the actual hydrogen production and consumption rates under real-world scenarios, as well as the energy losses and the overall system efficiency.
In summary, based on the conducted review, a considerable research effort is seen done in this area, however, they tended to focus on modelling the energy management among the hybrid system components with less focus on their real-world dynamics. The optimization of hybrid system sizing highly depends on the mathematical models used for the hybrid system components. The previously presented research often relied on using simplistic hybrid system modelling which lacked the consideration of the electrochemical dynamic behaviour of electrolysers and fuel cell systems under transient variations imposed by the intermittent renewables as well as the load changes. This therefore represents a key standard deviation from finding a real-world optimal sizing solution. Therefore, it is essential to use dynamic mathematical models that represent the real-world H2 production by electrolysers and the real-world H2 consumption by fuel cells to allow accurately sizing the storage capacity required and accordingly avoiding the oversizing associated with additional costs and space requirements.
This paper addresses this gap in the knowledge by developing a multi-objective PSO-based dynamic system model for optimally sizing hybrid PV-H2 energy systems. In the developed model, a multi-objective PSO algorithm is integrated within a novel precise dynamic hybrid system model that takes into consideration the electrochemical losses occurring under the influence of transient load variations and their impact on the output of electrolysers and fuel cell systems. The multi-objective optimisation is performed with respect to two objectives: minimising the consumer’s LCOE as well as minimising the building carbon footprint. To enable envisaging the impact of using the multiple optimisation criteria on the hybrid system conceptual design sizing, a single-objective optimal sizing model was firstly developed for minimising the consumer’s LCOE, then the multi-objective optimal sizing model was developed for simultaneously minimising both the consumer’s LCOE along with the building carbon footprint. Both the developed single-objective and multi-objective optimal sizing models were then implemented on the same case study building within the Robert Gordon University (RGU) campus in Aberdeen, to enable visualising the difference in the system sizing. Results from both models were presented and critically analysed with an in-depth discussion.
2. The Proposed Hybrid PV-H2 Energy System
The proposed hybrid PV-H2 energy system consists of a solar photovoltaic (PV) system, a water electrolyser, a pressurized H2 storage tank, and a fuel cell. The energy management mechanism adopted in the developed system model is designed to ensure that the building's energy needs are primarily met with green energy; and therefore, the solar PV system and the fuel cell represent the main power sources serving the building energy demands. When the sunlight is available, the building's demands are mainly supplied by the PV system via an inverter, while any solar energy excess is used to produce green H2 using the electrolyser. The produced H2 is stored as pressurized gas in a tank for later use by the fuel cell. When the sunlight is limited or unavailable, the stored H2 is used in powering the fuel cell to cover any remaining energy demand. If the PV system and fuel cell cannot fully meet the building’s demand with green energy, then the utility grid is allowed to serve the demand that is unmet by the green energy supply (i.e., PV system or fuel cell). Any non-utilised excess in PV energy is sold back to the grid to generate additional revenue. Figure 1 illustrates the proposed hybrid PV-H2 energy system with the implemented energy management mechanism.
3. Formulating the Objective Functions and Constraints for The Optimal Sizing of Hybrid PV-H2 Energy Systems
In the optimal sizing of hybrid renewable energy systems, the formulation of objective function depends on the design goals which could be technical, economic, or environmental goals. In terms of technical goals, the reliability of the energy system is the main concern. A hybrid energy system is reliable when it is capable to provide enough power supply to a load demand over a certain period [11]. Referring to the proposed hybrid PV-H2 energy system, the system reliability is considered through the energy balancing mechanism which was set to enforce feeding the load demand by green energy supply and only the load demand that is unmet by green energy supply is fed from the utility grid. With the technical aspect already considered, the objective function for optimizing the proposed hybrid PV-H2 energy system sizing is therefore formulated to consider the economic and environmental aspects. The nature of the objective function depends on the scope of the investors (i.e. whether their focus is financial benefits and/or environmental outcomes). To allow meeting different decision-making aims, both single-objective and multi-objective optimisation functions are considered in this paper to allow separate and simultaneous minimization of the system costs and carbon footprint.
3.1. Formulating Single-Objective Cost-Optimisation Function for Optimally Sizing Hybrid PV-H2 Energy Systems From an Economic Prospect
When optimally sizing the proposed hybrid PV-H2 energy system from an economic prospect, the main objective is to minimize the LCOE of the total energy consumed, which is given by equation (1). The decision variables are the sizes of the system components, which includes the PV system size, electrolyser size, H2 storage tank size, and fuel cell size. The objective is to determine the optimal hybrid system sizing that can minimize the LCOE of the total energy consumed.
Where is the levelized cost of energy (£/kWh), is the net present costs of component (j) in (£), represents each individual component in the hybrid system, is the total number of hybrid system components, is the cost of grid import (£), is the revenue from selling non-utilized solar energy excess to the grid (£), is the hourly building load demand, is the capital recovery factor [4,5,7], is the real interest rate and is the project lifetime.
To enable calculating the LCOE as given by equation (1), a detailed ‘Cost Model’ is developed for calculating the net present cost of the hybrid system components. The NPC of each individual hybrid system component is given by equations (3) to (8) [8] and considers several factors: this includes the component's capital cost, the component’s operation and maintenance costs over the project's lifetime, the component’s replacement cost if the component's lifespan is shorter than the project's lifetime, and the component’s salvage value. The latter denotes for the generated revenue from the component’s remaining lifespan at the end of project lifetime. Therefore, the NPC of each individual hybrid system component is the sum of the component’s capital cost, operation and maintenance costs and replacement cost minus the component’s salvage value.
Where; and are the capital cost and the operation and maintenance cost of component (j) per unit rating (£/kW), respectively, is the size of component (j) (kW), is the total replacement cost of component (j) (£), and is the salvage value of component (j) (£), is the replacement cost of component (j) per unit rating (£/kW), is the lifespan of component (j) (yr.), and is the number of replacements of component (j) over the project lifetime rounded down to nearest integer, is the remaining lifespan of component (j) at the end of the project lifetime (yr.) and is the duration of replacement of component (j) (yr.).
The cost of importing electricity from the utility grid and the revenue generated from selling non-utilised solar energy excess to the utility grid are determined using equations (9) and (10).
Where; (t) is the hourly tariff rate of electricity purchase from the utility grid considering variable Day/Night tariff rates, is the tariff rate of grid feed-in electricity, is the power imported from the utility grid at time step (t), and is the non-utilised solar power excess at time step (t).
3.2. Formulating Multi-Objective Cost & Footprint Optimisation Function for Optimally Sizing Hybrid PV-H2 Energy Systems From Both Economic and Environmental Prospects
A key controversial issue in designing hybrid renewable energy systems is to achieve lowest CO2 emissions with lowest cost. For optimally sizing the proposed hybrid PV-H2 energy system from both economic and environmental prospects, the first objective is to minimise the LCOE of the total energy consumed as emphasised in Section 3.1, while the second objective is to minimise the carbon footprint of the building considered. This can be measured in terms of the amount of CO2 emissions eliminated upon integrating the proposed hybrid system within the building considered. The more the CO2 emissions eliminated, the more the environmentally friendly the building is. Instead of maximizing the eliminated CO2 emissions, the CO2 emissions can be minimised through reducing the grid energy import requirements (i.e., minimise dependency on the utility grid). Therefore, the grid dependency ratio (GDR) which is defined as the fraction of load demand that is served from the utility grid over the total load demand, is set as the second objective function to be minimised. Equation (11) is used to calculate the system’s GDR which is proportional to the CO2 emissions associated with the grid energy import requirements, therefore minimising this factor will consequently minimise the building’s carbon footprint.
Where; is the grid dependency ratio, and is the building load demand at time step (t).
The multi-objective cost &footprint optimisation function proposed for optimising the sizing of the hybrid PV-H2 energy system from both economic and environmental prospects simultaneously minimize the LCOE of the total energy consumed as the economic metric and the building’s GDR as the environmental metric. The overall objective function is constructed considering the weighted sum method which allows assigning each objective a weighting factor based on its relative importance (i.e. priority) for the decision maker [12].
The decision variables remain the sizes of PV system, electrolyser, H2 storage tank and fuel cell, however the objective is to determine the optimal hybrid system sizing that can simultaneously minimize the LCOE along with the building’s GDR.
Both the single-objective and multi-objective functions are subject to the inequality constraint given by equation (12). This constraint represents the boundary limitations of each decision variable (i.e., each individual component in the hybrid system) from which the range of feasible solutions is encountered [4,5,7,8].
Where; , are respectively the minimum and maximum boundary sizes of component (j). This constraint applies for each of the 4 decision variables (i.e., the PV system size, electrolyser size, H2 storage tank size and fuel cell size).
4. Development of Both the Single-Objective and Multi-Objective Optimal Sizing Models
In this research work, the PSO algorithm is used with both the single-objective and multi-objective optimisation functions detailed earlier in section 3. To allow the optimal sizing of the hybrid PV-H2 energy system while considering the real-world dynamics of its individual components, the PSO algorithm is integrated with a newly developed precise dynamic system model which is detailed in earlier research work [13]. The following subsection will provide a brief overview of the PSO algorithm implemented in this study.
4.1. The PSO Algorithm
The PSO algorithm is inspired by the animal behaviour of creatures such as birds or fishes, searching for food or corn by adjusting their positions and velocities within a search space [14]. These animals move as a "swarm" which denotes for the irregular movement of individuals in a search space. Each partner in the swarm is called a "particle" [8]. The particles in the swarm update their positions and velocities using equations (13) and (14) [15], based on both their personal experiences and their neighbourhood experiences, towards the global optimal solution.
Where;is the number of particle in the swarm, is the iteration number, is the velocity of particle () at iteration (), is the best position for particle () based its personal experience at iteration (), referred as Personal best, is the best position achieved by the entire particles in the swarm at iteration (), referred as Global best, is the position of particle () at iteration (), are acceleration constants controlling the movement of particles towards and , , are random numbers ranging from (0-1), is the inertia weight factor, , are the minimum and maximum inertia weights and is the maximum number of iterations.
For optimally sizing the hybrid PV-H2 energy system either from an economic prospect, or from both economic and environmental prospects, each particle's position is represented by a specific configuration of the hybrid system's sizing consisting of the following 4 decision variables: the PV system size, the electrolyser size, the H2 storage tank size, and the fuel cell size.
4.2. Integrating the PSO Algorithm with the Newly Developed Precise Dynamic Hybrid PV-H2 Energy System Model for Optimising the Hybrid System Sizing From Both Economic and Environmental Prospects
Both the single-objective and multi-objective optimal sizing models are developed by implementing the PSO algorithm on the precise dynamic model of real-world hybrid PV-H2 energy systems pre-developed in [13], which incorporated a set of mathematical models for modelling the electrochemical characteristics of the individual hybrid system components and their operational management according to the energy balancing mechanism emphasized earlier in Section 2. The following steps are performed for minimising the single-objective or the multi-objective optimisation functions:
- Step 1: Filtration of the Initial Particles’ Positions
- Before beginning to minimise the relevant objective function, the initial search space is subject to filtration process so that at least 40% of the building’s load demand is met by clean energy (i.e., PV system or fuel cell). An initial configuration of the hybrid system sizing is generated from the range of feasible solutions then this initial configuration is tested through applying on it the precise dynamic hybrid system model described in [13] to determine the portion of the load demand supplied by clean energy. If this portion is 40% or more, the configuration is accepted as the initial generation. If not, the system sizing is repeatedly re-generated until at least 40% of the load demand is covered by clean energy.
- Step 2: Identification of Personal Best and Global Best of Filtered Initial Positions
- The relevant objective function is then computed for each filtered particle’s position and evaluated to determine the particle’s personal best and the global best position , which are then used to update the filtered initial particles’ positions and velocities using (13) and (14), respectively.
- Step 3: Application of Position Control on Updated Particles’ Positions
- To ensure that the updated values of the hybrid system sizing configuration (i.e., each decision variable in ) remain within their predefined minimum and maximum limits, a position control mechanism is applied as follows: If the updated decision variable lies between these boundaries then the updated value of this variable is retained, while if the updated decision variable exceeds its boundaries it reverts to its value from the previous iteration.
- Step 4: Identification of Personal Best and Global Best of Updated Particles’ Positions
- The relevant objective function is computed for each updated particle’s position through re-applying on it the precise dynamic hybrid system model detailed in [13]. The computed objective function for each updated particle’s position is then evaluated to update the particle’s personal best and global best position .
- Step 5: Update of Particles’ Positions and Velocities
- Equations (13) and (14) are used to update the particles’ positions and velocities using the updated values of and .
- Step 6: Check the Algorithm Closing Condition
- If the iteration loop exhausts, then terminates. Otherwise, repeat from step 3 to 6.
5. Applying the Developed Single-Objective and Multi-Objective Optimal Sizing Models: Case Study of Robert Gordon University Campus Building in Scotland
Both the single and multi-objective optimal sizing models are applied on a grid-connected case study building within RGU campus in Aberdeen, Scotland, to enable supporting the university carbon reduction initiative aiming to significantly reduce its emissions from energy and consumables. The case study grid-connected building was selected to be the Riverside Building (RB) which covers three schools and a learning centre. With the help of RGU Estates, the data of the building energy consumption were carefully collected on an hourly basis throughout one-year timescale and used in the developed models to enable optimising the sizing of the hybrid PV-H2 energy system components to meet the single or the multiple-objective optimisation criteria depending on the choice of the decision maker.
5.1. Data Collection
The hourly data collected for the building energy consumption is as shown in Figure 2a. The building’s yearly energy consumption is 1487 MWh, the building’s average hourly power consumption is 170 kW and the building’s peak hourly power consumption is 274 kW. The hourly data of atmospheric conditions at the building location (Aberdeen city) are as shown in Figure 2b. These include the hourly data of solar irradiance and ambient temperature at the building location, and they are collected from PVGIS web interface.
Table 1 includes all the data required to run both the developed single-objective and multi-objective optimal sizing models. These include the cost parameters required to compute the net present cost of each hybrid system component, with per-unit cost parameters derived from market data in [7], the lifetimes of the hybrid system components [4,7,16], the project lifetime and the real interest rate considered in this study. Table 2 shows the tariff rates for purchasing electricity from the utility grid and the grid feed-in tariff rates. It should be noted that the data collected for the grid tariff rates and grid feed-in tariff rates are based on the electricity prices of the RGU's UK energy provider for North-Scotland considering day and night tariffs [17], while the grid feed-in tariff corresponds to the Smart Export Guarantee (SEG) export rate from the same energy provider [18]. The parameters used for the precise dynamic modelling of the electrolyser, H2 storage tank, and fuel cell can be found in [13].
5.2. Results and Discussions
The PSO algorithm is applied on RB using a population size of 20 particles and a maximum number of iterations of 50. Table 3 shows the optimal sizing results of the hybrid PV-H2 energy system suited for RB using both the single-objective optimal sizing model for minimizing the LCOE and the multi-objective optimal sizing model for simultaneously minimizing the LCOE along with the building’s carbon footprint. From Table 3, it can be seen that when using the single-objective optimal sizing model for minimizing the LCOE, the optimal hybrid system sizing is found to be 1000 kW PV system, 932 kW electrolyser, 22.7 kg pressurised H2 storage tank and 242 kW fuel cell. The LCOE corresponding to this optimal hybrid system sizing is found to be 0.366 £/kWh while the corresponding building’s GDR is found to be 40%. On the other hand, when using the multi-objective optimal sizing model for simultaneously minimizing both the LCOE and the building carbon footprint, the optimal hybrid system sizing is found to be 3187.8 kW PV system, 1000 kW electrolyser, 106.1 kg H2 storage tank and 250 kW fuel cell system. The LCOE corresponding to this optimal hybrid system sizing is found to be 0.5188 £/kWh while the building’s GDR is reduced to 33.33%. Compared to the results obtained from the single-objective optimal sizing model, it can be seen that the LCOE is quite higher when using the multi-objective optimal sizing model because of minimising the GDR in addition to minimising the LCOE. The higher LCOE is because of the higher capacities of hybrid system components needed to allow increasing the clean energy supply for achieving less grid dependency of 33.33% (i.e., 66.67% of total annual load demand has to be fed by clean energy supply).
Figure 3 shows the convergence of fitness function obtained from the single-objective optimal sizing model for minimising the LCOE. As can be seen from Figure 3, the LCOE dropped from about 0.405 £/kWh at the filtered initial hybrid system sizing to 0.366 £/kWh at the optimal hybrid system sizing, thus achieving about 9.6% reduction in the LCOE after almost 20 iterations. Figure 4 illustrates the pareto-front characteristic of the multi-objective optimal sizing model showing a trade-off between the LCOE and the building’s GDR. It is obvious from the chart that decreasing the building’s GDR is associated with an increase in the LCOE and vice-versa.
Figure 5 shows the monthly PV energy production obtained from the optimal hybrid system sizing when using the single-objective optimal sizing model. From Figure 5, the total annual PV energy production is found to be 876.28 MWh when using the single-objective optimal sizing model, out of which 536.4 MWh were fed to the building load demand while the remainder (i.e., 339.8 MWh) was harnessed by the electrolyser. It is further noticed that no PV energy excess is sold to the utility grid when using the single-objective optimal sizing model meaning the annual PV energy production has been fully utilised for feeding the building load demand and the electrolyser to generate green H2.
Figure 6 shows the monthly PV energy production obtained from the optimal hybrid system sizing when using the multi-objective optimal sizing model. From Figure 6, the total annual PV energy production is found to be 2793.45 MWh when using the multi-objective optimal sizing model, out of which 709.81 MWh were fed to the building load demand, 1726.5 MWh were harnessed by the electrolyser and the remainder of non-utilised PV energy excess is sold to the utility grid (i.e., about 357.13 MWh). Compared to results of the single-objective optimal sizing model, the annual PV energy production highly increased when using the multi-objective optimal sizing model given that higher capacity of PV system is obtained from the multi-objective optimal sizing model as listed in Table 4. It can be seen that in the multi-objective optimisation, the PSO algorithm increases the capacity of the PV system to enable more clean energy supply and to allow harnessing more PV surplus by the electrolyser and thus increasing the H2 availability for the fuel cell consumption. When using the multi-objective optimal sizing model, it can be seen that about 61.8% from annual PV production were harnessed by the electrolyser (i.e., 1726.5 MWh out of 2793.45 MWh) while when using the single-objective optimisation algorithm, only 38.7% from annual PV production were harnessed by the electrolyser (i.e. 339.8 MWh out of 876.28 MWh). In terms of the PV energy excess sold to the utility grid, it can be seen that the multi-objective optimisation has allowed for about 12.7% from annual PV energy production to be sold to the utility grid as result of the higher PV system capacity, thus increasing the revenue from selling the non-utilised PV energy excess and allowing to maintain the system’s LCOE at a reasonable value.
Figure 7 compares the monthly H2 production by the electrolyser obtained from the optimal hybrid system sizing when using the single-objective optimal sizing model versus the one obtained from the optimal hybrid system sizing when using the multi-objective optimal sizing model. Compared to the single-objective optimisation, the total annual H2 production by the electrolyser is noticeably increased when using the multi-objective optimisation algorithm given that more PV surplus power becomes available for green H2 generation (10,290 kg of H2 is produced by the electrolyser annually from PV surplus production when using the multi-objective optimisation algorithm while only 1,823.5 kg of H2 is produced by the electrolyser annually from PV surplus production when using the single-objective optimisation algorithm).
Figure 8 compares the monthly fuel cell energy production obtained from the optimal hybrid system sizing when using the single-objective optimal sizing model versus the one obtained from the optimal hybrid system sizing when using the multi-objective optimal sizing model. From Figure 8, the annual energy production by the fuel cell system increased from 50.98 MWh when using the single-objective optimisation to 281.73 MWh when using the multi-objective optimisation given that more H2 becomes available for the fuel cell consumption. Indeed, the percentage of annual load demand served by the fuel cell soared from about 3.4% when using the single-objective optimisation to about 18.94% when using the multi-objective optimisation, thus reducing the load dependency on the grid supply and accordingly reducing the environmental impact.
Figure 9 compares the monthly grid energy import obtained from the optimal hybrid system sizing when using the single-objective optimal sizing model versus the one obtained from the optimal hybrid system sizing when using the multi-objective optimal sizing model. The annual energy imported from the utility grid is seen decreased from about 900 MWh when using the single-objective optimal sizing model to 495.8 MWh when using the multi-objective optimal sizing model. It is worth stating that the load’s grid dependency is decreased from about 40% when using the single-objective optimisation to 33.33% when using the multi-objective optimisation meaning that about 66.7% of CO2 emissions could be eliminated upon applying the multi-objective optimisation technique.
6. Conclusions
In this paper, a single-objective and multi-objective optimisation dynamic system models are developed to enable the real-world modelling and the optimal sizing of hybrid PV-H2 energy system within grid-connected buildings from either an economic prospective only or from an economic and environmental perspectives. Both models were developed by implementing the PSO algorithm on the precise dynamic system model that takes into consideration the real-world electrochemical dynamic behaviour of the individual hybrid system components. The results obtained from the single-objective sizing optimisation model have attained an economically feasible optimal hybrid system sizing (1000 kW PV system, 932 kW electrolyser, 22.7 kg H2 storage tank and 242 kW fuel cell system) with a LCOE of 0.366 £/kWh and a grid dependency maintained at 40%. On the other hand, the results obtained from the multi-objective optimisation model have realised a more environmentally friendly hybrid system sizing (3187.8 kW PV system, 1000 kW electrolyser, 106.1 kg H2 storage tank and 250 kW fuel cell system) with less grid dependency of 33.33%, while holding the LCOE at a slightly higher reasonable value of 0.5188 £/kWh. The analysis of the results obtained from the application of both the single-objective and multi-objective models on the same case study building has enabled envisaging the impact of the optimisation criteria on the conceptual design of the hybrid system.
Further research work should look into optimising the sizing of the hybrid renewable-hydrogen energy systems from other prospects (like maximizing the turn around efficiency of the H2 energy conversion to electricity or minimising other sustainability criteria like the water consumption of the electrolyser). It is also recommended to investigate other options of green H2 usage (so instead of converting it back to electricity, it might be more efficient to use it directly for heating purposes or for fuelling vehicles within the building).
Author Contributions
Conceptualization, A.I.A. and D.A.; methodology, A.I.A and D.A.; software, A.I.A.; validation, A.I.A.; formal analysis, A.I.A.; investigation, A.I.A.; resources, A.I.A and D.A.; data curation, A.I.A.; writing—original draft preparation, A.I.A.; writing—review and editing, D.A. and N.S; visualization, A.I.A., D.A. and N.S.; supervision, D.A. and N.S.; project administration, D.A.; funding acquisition, A.I.A. and D.A. All authors have read and agreed to the published version of the manuscript.
Funding
This research is part of studentship no. ENG20-02, funded by the School of Engineering at Robert Gordon University, Aberdeen, United Kingdom.
Data Availability Statement
Data are contained within the article.
Acknowledgments
The authors would like to thank RGU Estates for providing the actual load data of the RB to conduct this study.
Conflicts of Interest
The authors declare no conflict of interest. The funders had no role in the design of the study; in the collection, analyses, or interpretation of data; in the writing of the manuscript; or in the decision to publish the results.
References
- Ceylan, C.; Devrim, Y. Green hydrogen based off-grid and on-grid hybrid energy systems. Int J Hydrogen Energy 2023, 48, 39084–39096. [Google Scholar] [CrossRef]
- Oyewole, O.L.; Nwulu, N.I.; Okampo, E.J. Optimal design of hydrogen-based storage with a hybrid renewable energy system considering economic and environmental uncertainties. Energy Convers Manag 2024, 300, 117991. [Google Scholar] [CrossRef]
- Bernoosi, F.; Nazari, M.E. Optimal sizing of hybrid PV/T-fuel cell CHP system using a heuristic optimization algorithm. 34th International Power System Conference, PSC 2019, Institute of Electrical and Electronics Engineers Inc.; 2019, p. 57–63. [CrossRef]
- Singh, S.; Chauhan, P.; Singh, N.J. Capacity optimization of grid connected solar/fuel cell energy system using hybrid ABC-PSO algorithm. Int J Hydrogen Energy 2020, 45, 10070–10088. [Google Scholar] [CrossRef]
- Mokhtara, C.; Negrou, B.; Settou, N.; Bouferrouk, A.; Yao, Y. Design optimization of grid-connected PV-Hydrogen for energy prosumers considering sector-coupling paradigm: Case study of a university building in Algeria. Int J Hydrogen Energy 2021, 46, 37564–37582. [Google Scholar] [CrossRef]
- Zhang, G.; Shi, Y.; Maleki, A. ; A. Rosen, M. Optimal location and size of a grid-independent solar/hydrogen system for rural areas using an efficient heuristic approach. Renew Energy 2020, 156, 1203–1214. [Google Scholar] [CrossRef]
- Gharibi, M.; Askarzadeh, A. Size and power exchange optimization of a grid-connected diesel generator-photovoltaic-fuel cell hybrid energy system considering reliability, cost and renewability. Int J Hydrogen Energy 2019, 44, 25428–25441. [Google Scholar] [CrossRef]
- Abdelshafy, A.M.; Hassan, H.; Jurasz, J. Optimal design of a grid-connected desalination plant powered by renewable energy resources using a hybrid PSO–GWO approach. Energy Convers Manag 2018, 173, 331–347. [Google Scholar] [CrossRef]
- Fonseca, J.D.; Commenge, J.-M.; Camargo, M.; Falk, L.; Gil, I.D. Multi-criteria optimization for the design and operation of distributed energy systems considering sustainability dimensions. Energy 2021, 214, 118989. [Google Scholar] [CrossRef]
- Fonseca, J.D.; Commenge, J.-M.; Camargo, M.; Falk, L.; Gil, I.D. Sustainability analysis for the design of distributed energy systems: A multi-objective optimization approach. Appl Energy 2021, 290, 116746. [Google Scholar] [CrossRef]
- Luna-Rubio, R.; Trejo-Perea, M.; Vargas-Vázquez, D.; Ríos-Moreno, G.J. Optimal sizing of renewable hybrids energy systems: A review of methodologies. Solar Energy 2012, 86, 1077–1088. [Google Scholar] [CrossRef]
- Yang X-S. Chapter 14 - Multi-Objective Optimization. In: Yang, X.-S. Yang X-S. Chapter 14 - Multi-Objective Optimization. In: Yang, X.-S.; editor. Nature-Inspired Optimization Algorithms, Oxford: Elsevier; 2014, p. 197–211. [CrossRef]
- Atteya, A.I.; Ali, D.; Sellami, N. Precise Dynamic Modelling of Real-World Hybrid Solar-Hydrogen Energy Systems for Grid-Connected Buildings. Energies (Basel) 2023, 16. [Google Scholar] [CrossRef]
- Kennedy, J.; Eberhart, R. Particle swarm optimization. Proceedings of ICNN’95 - International Conference on Neural Networks, vol. 4, 1995, p. 1942–8 vol.4. [CrossRef]
- Eberhart, Shi, Y. Particle swarm optimization: developments, applications and resources. Proceedings of the 2001 Congress on Evolutionary Computation (IEEE Cat. No.01TH8546), vol. 1, 2001, p. 81–6 vol. 1. [CrossRef]
- Bucher, C.; Wandel, J.; Joss, D. Life Expectancy of PV Inverters and Optimisers in Residential PV Systems. 8th World Conference on Photovoltaic Energy Conversion, Milano: 2022, p. 865–73.
- EDF. Government Energy Price Guarantee prices n.d. https://www.edfenergy.com/sites/default/files/government_energy_price_guarantee_prices._standard_variable_deemed_and_welcome._credit_meters.pdf (accessed , 2024). 24 May.
- EDF. Smart Export Guarantee n.d. https://www.edfenergy.com/energy-efficiency/smart-export-tariff (accessed , 2024). 24 May.
Figure 1.
Schematic Diagram of the Proposed Hybrid PV-H2 Energy System.
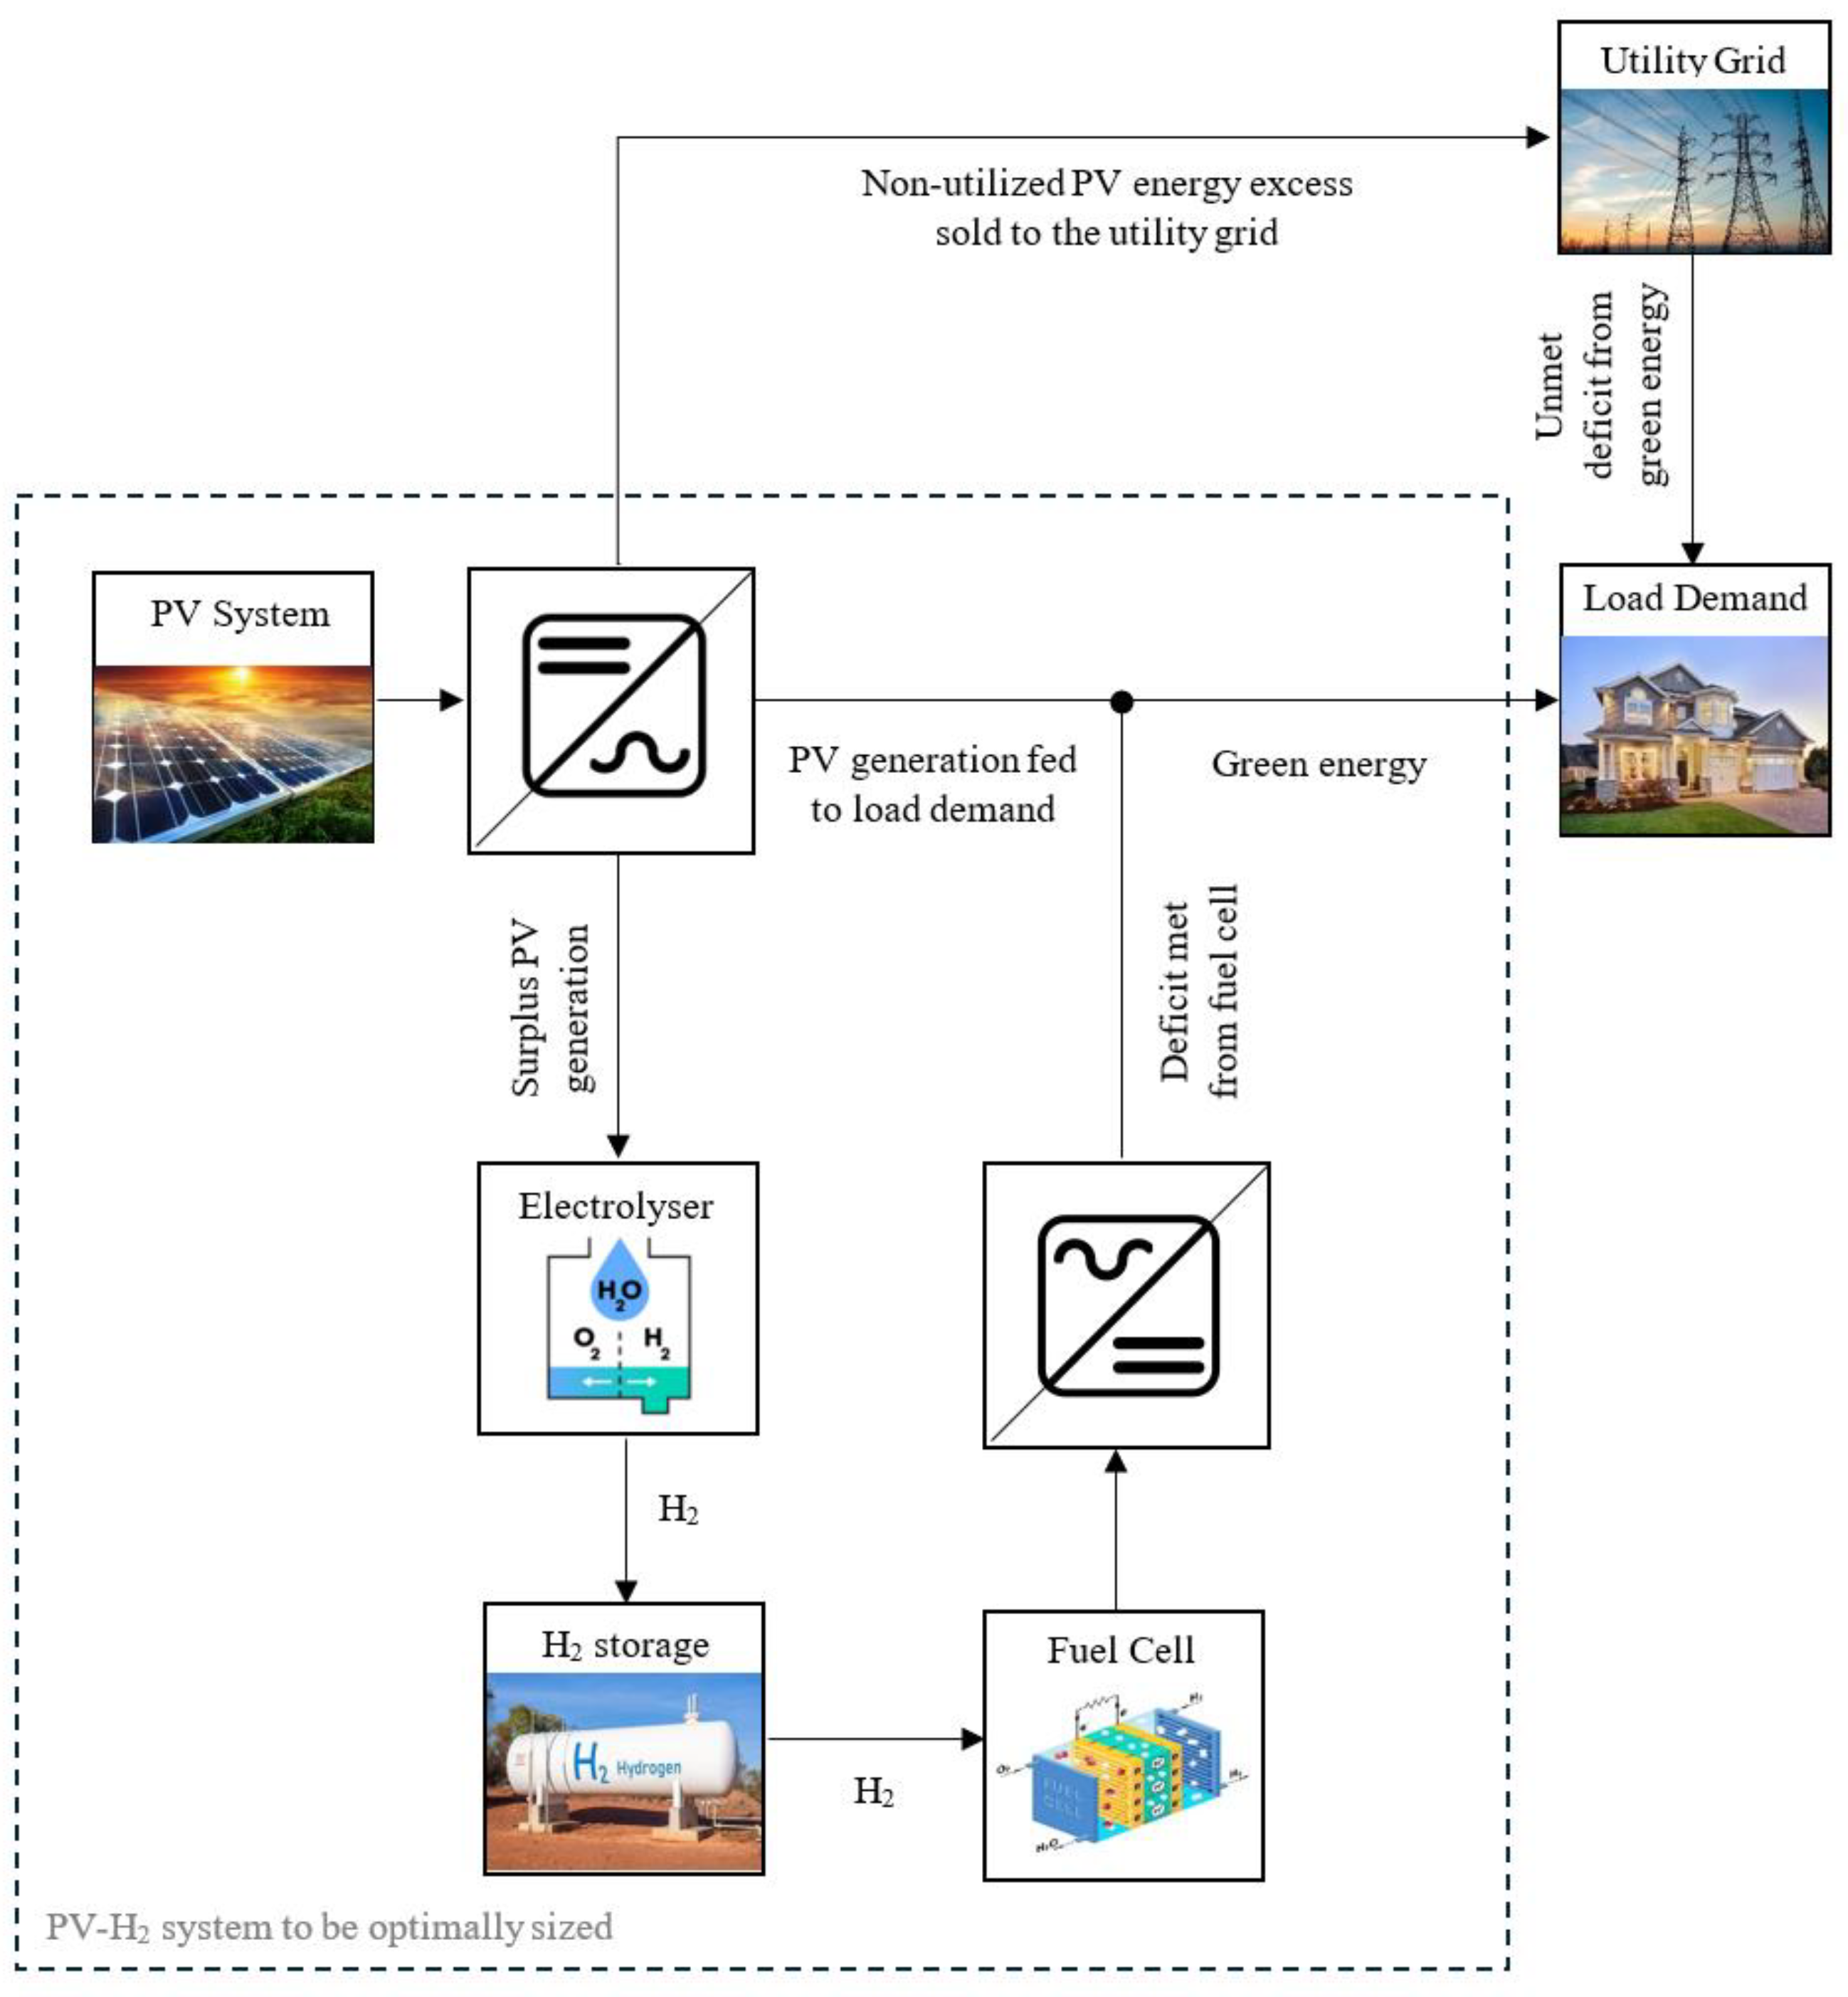
Figure 2.
a) The Hourly Data Collected for RB's Energy Consumption Over One Year Timescale, (b) The Hourly Data Collected for the Solar Irradiance and the Ambient Temperature at the Building Location (Aberdeen City) Over One Year Timescale.
Figure 2.
a) The Hourly Data Collected for RB's Energy Consumption Over One Year Timescale, (b) The Hourly Data Collected for the Solar Irradiance and the Ambient Temperature at the Building Location (Aberdeen City) Over One Year Timescale.
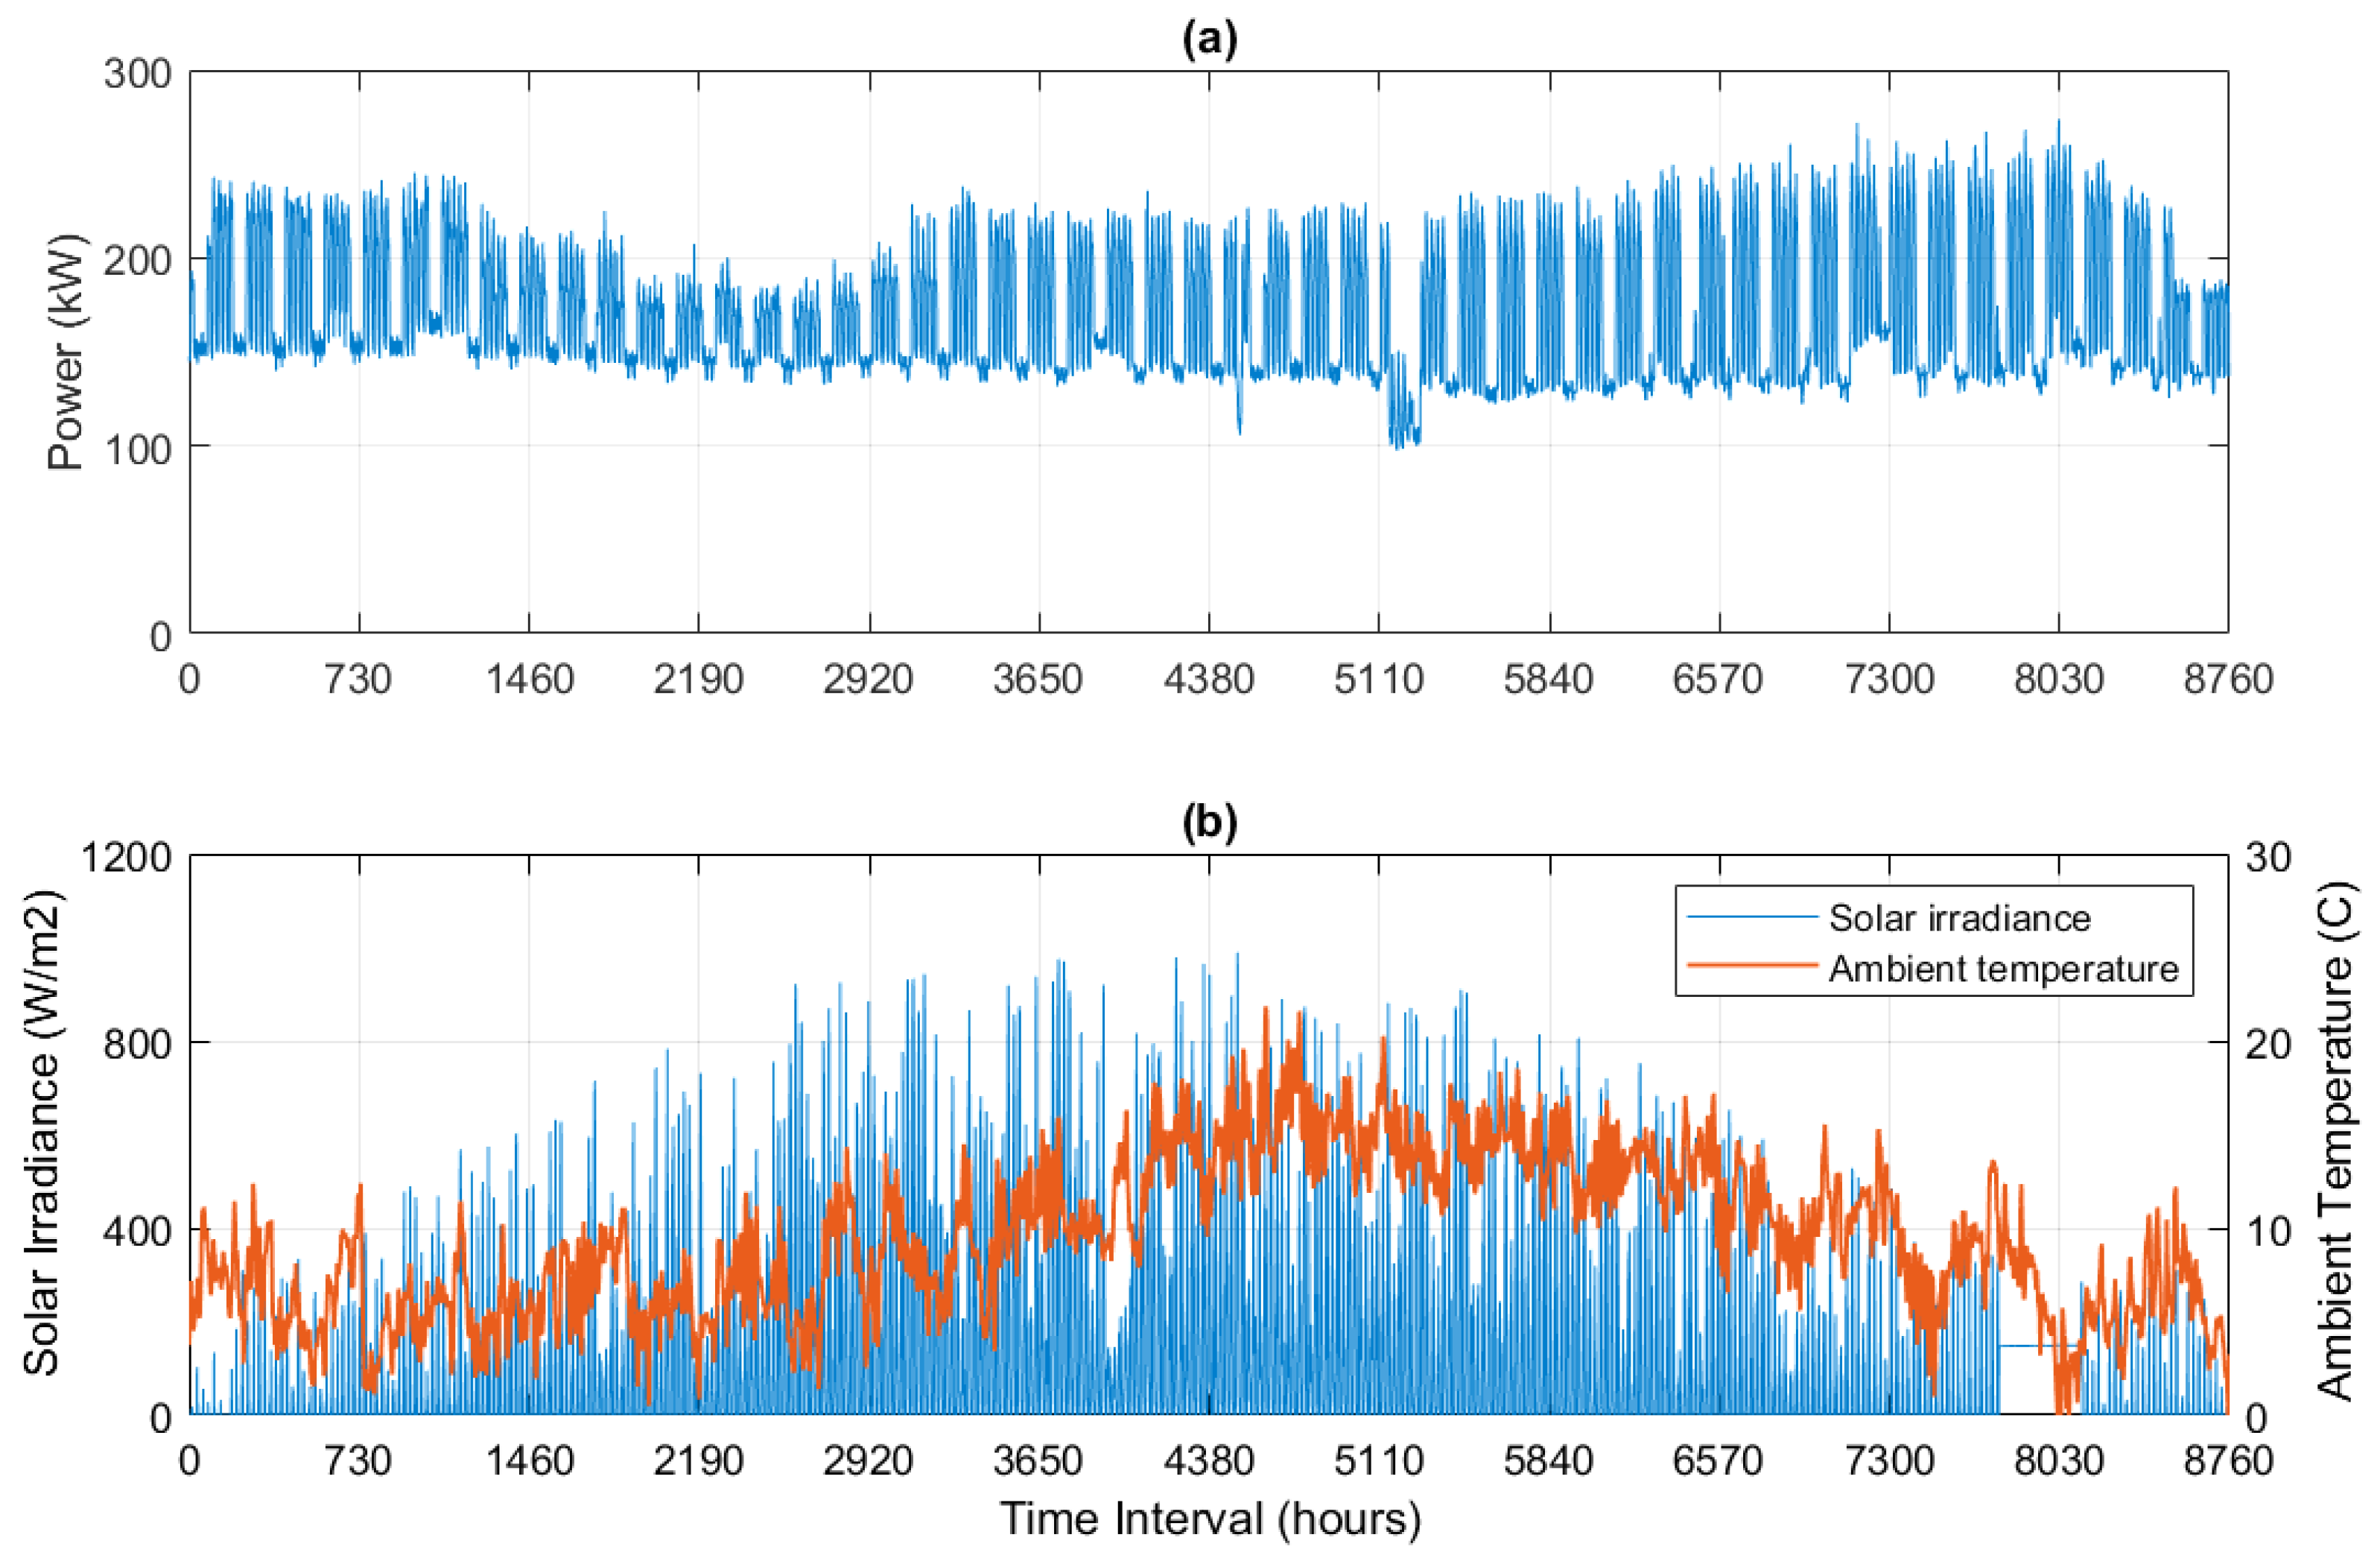
Figure 3.
Convergence of Fitness Function of the Single-Objective Optimal Sizing Model.
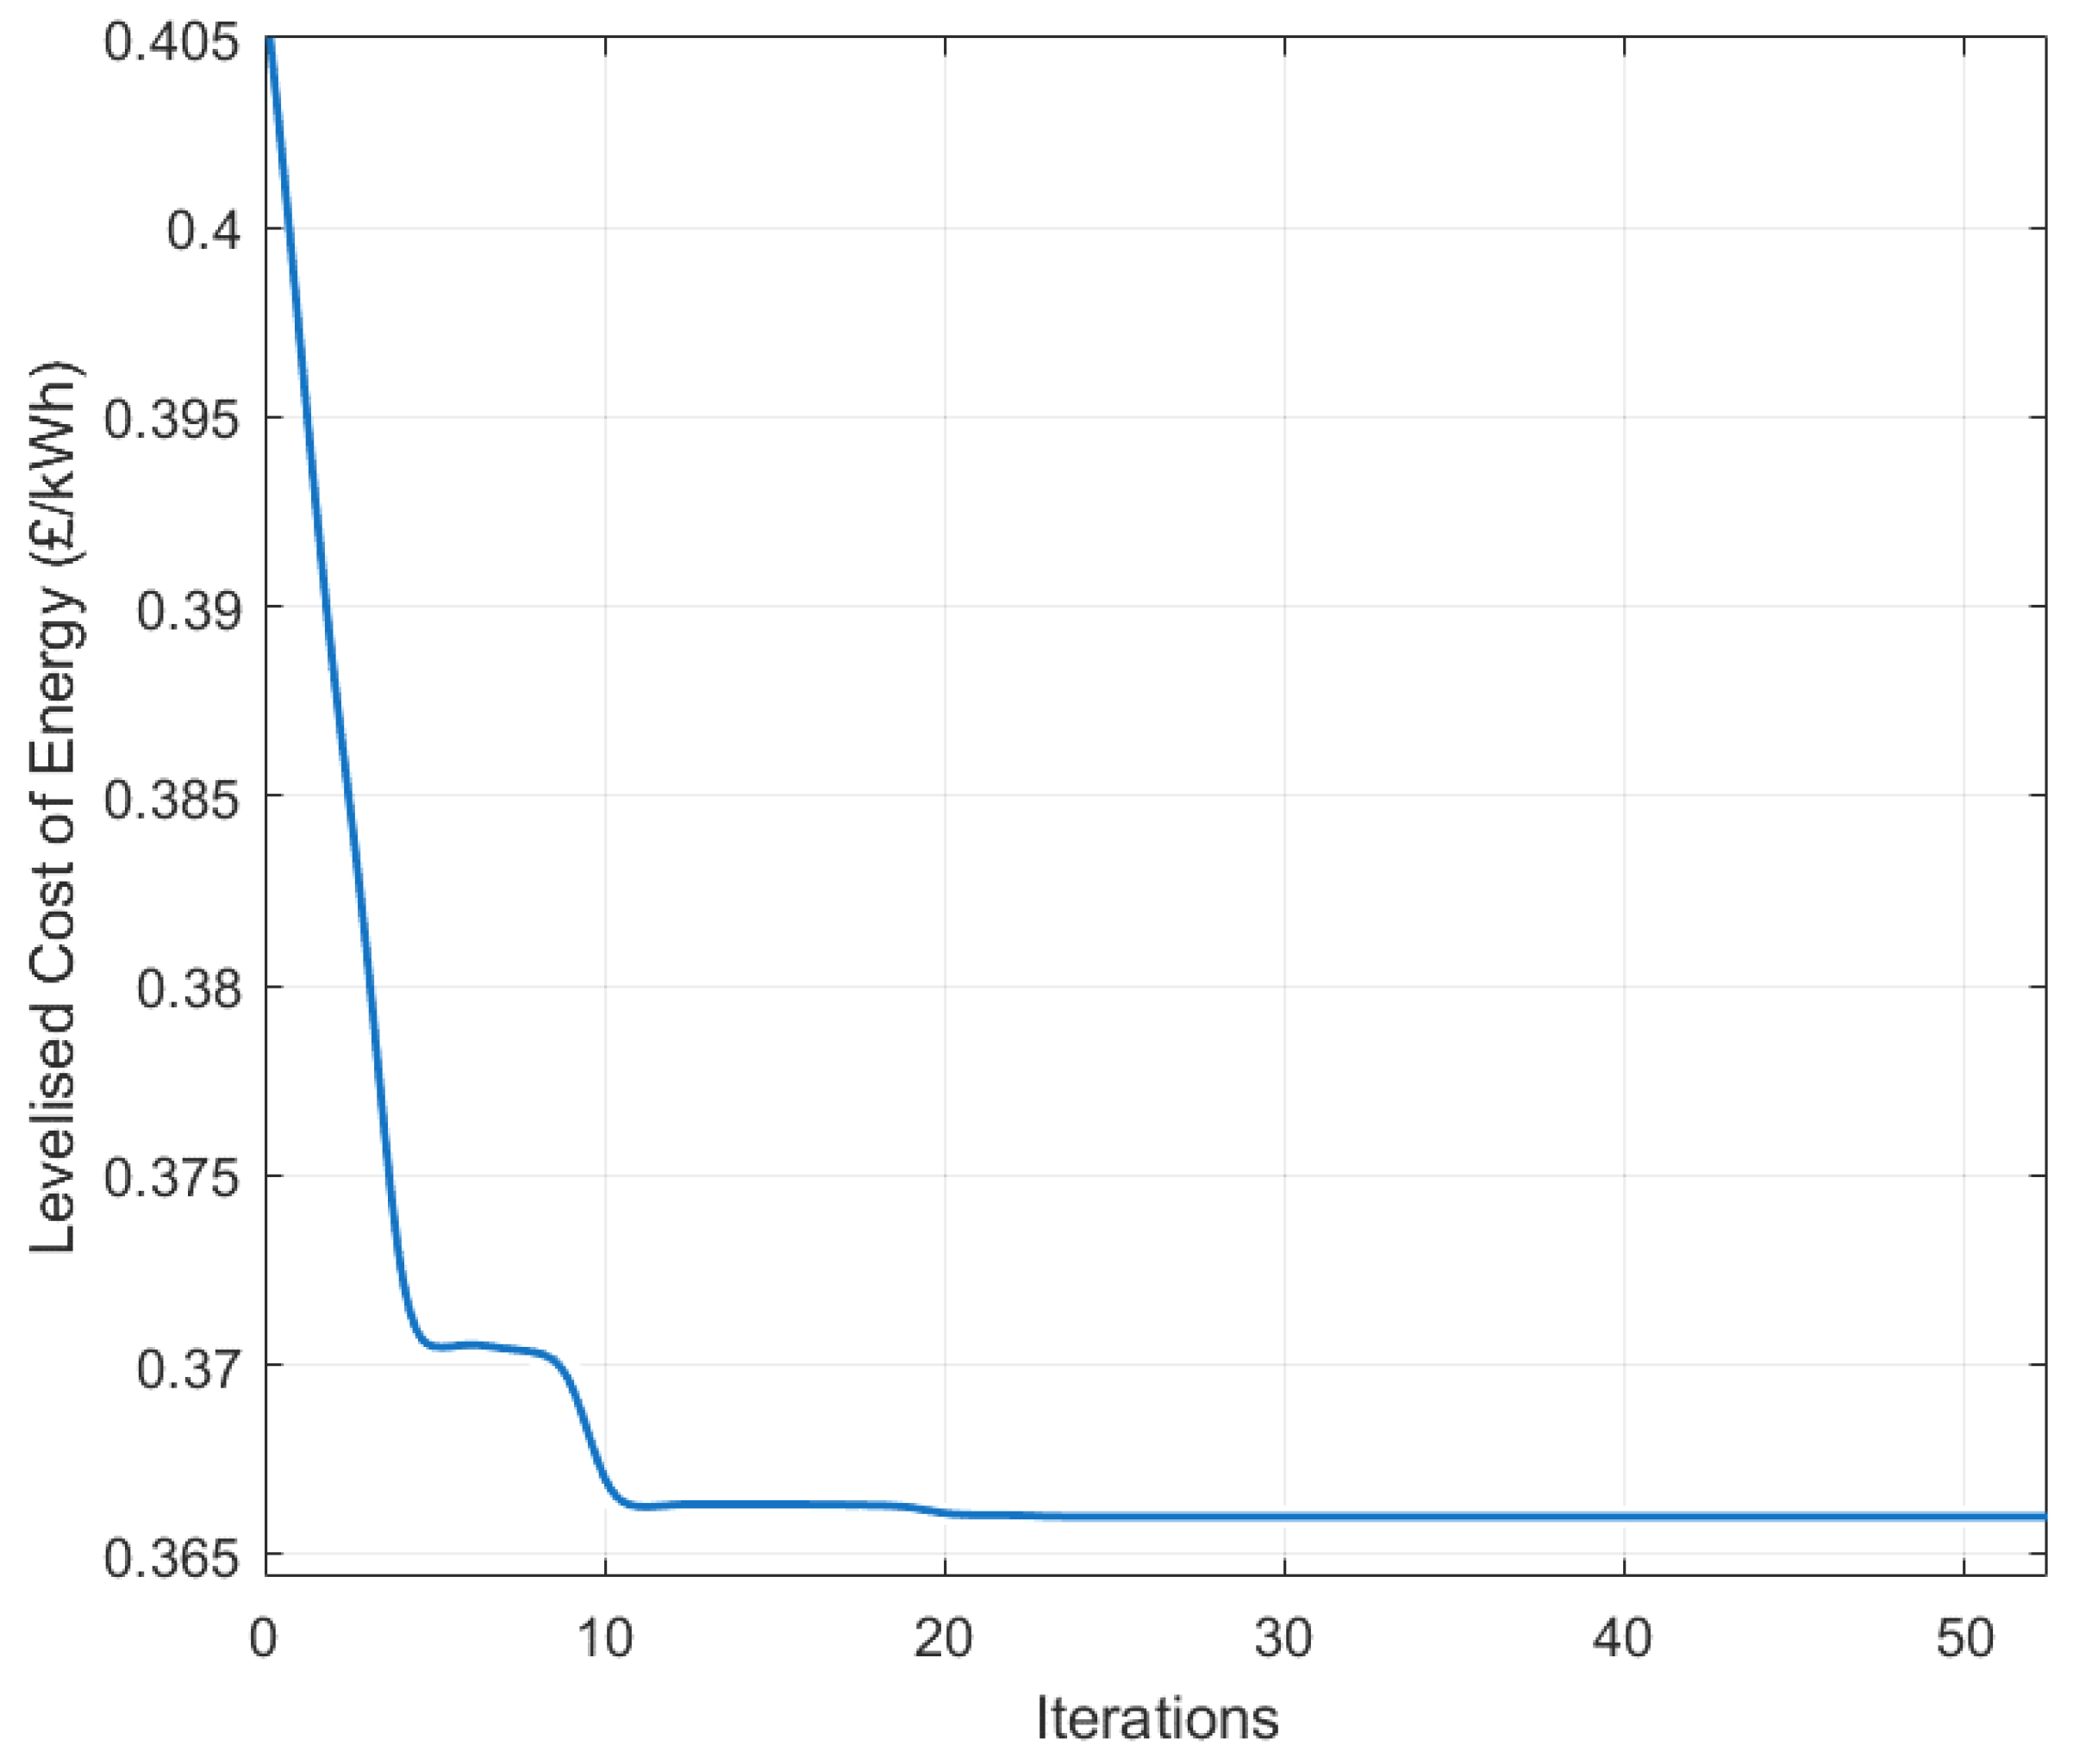
Figure 4.
Pareto-front Characteristic of the Multi-Objective Optimal Sizing Model.
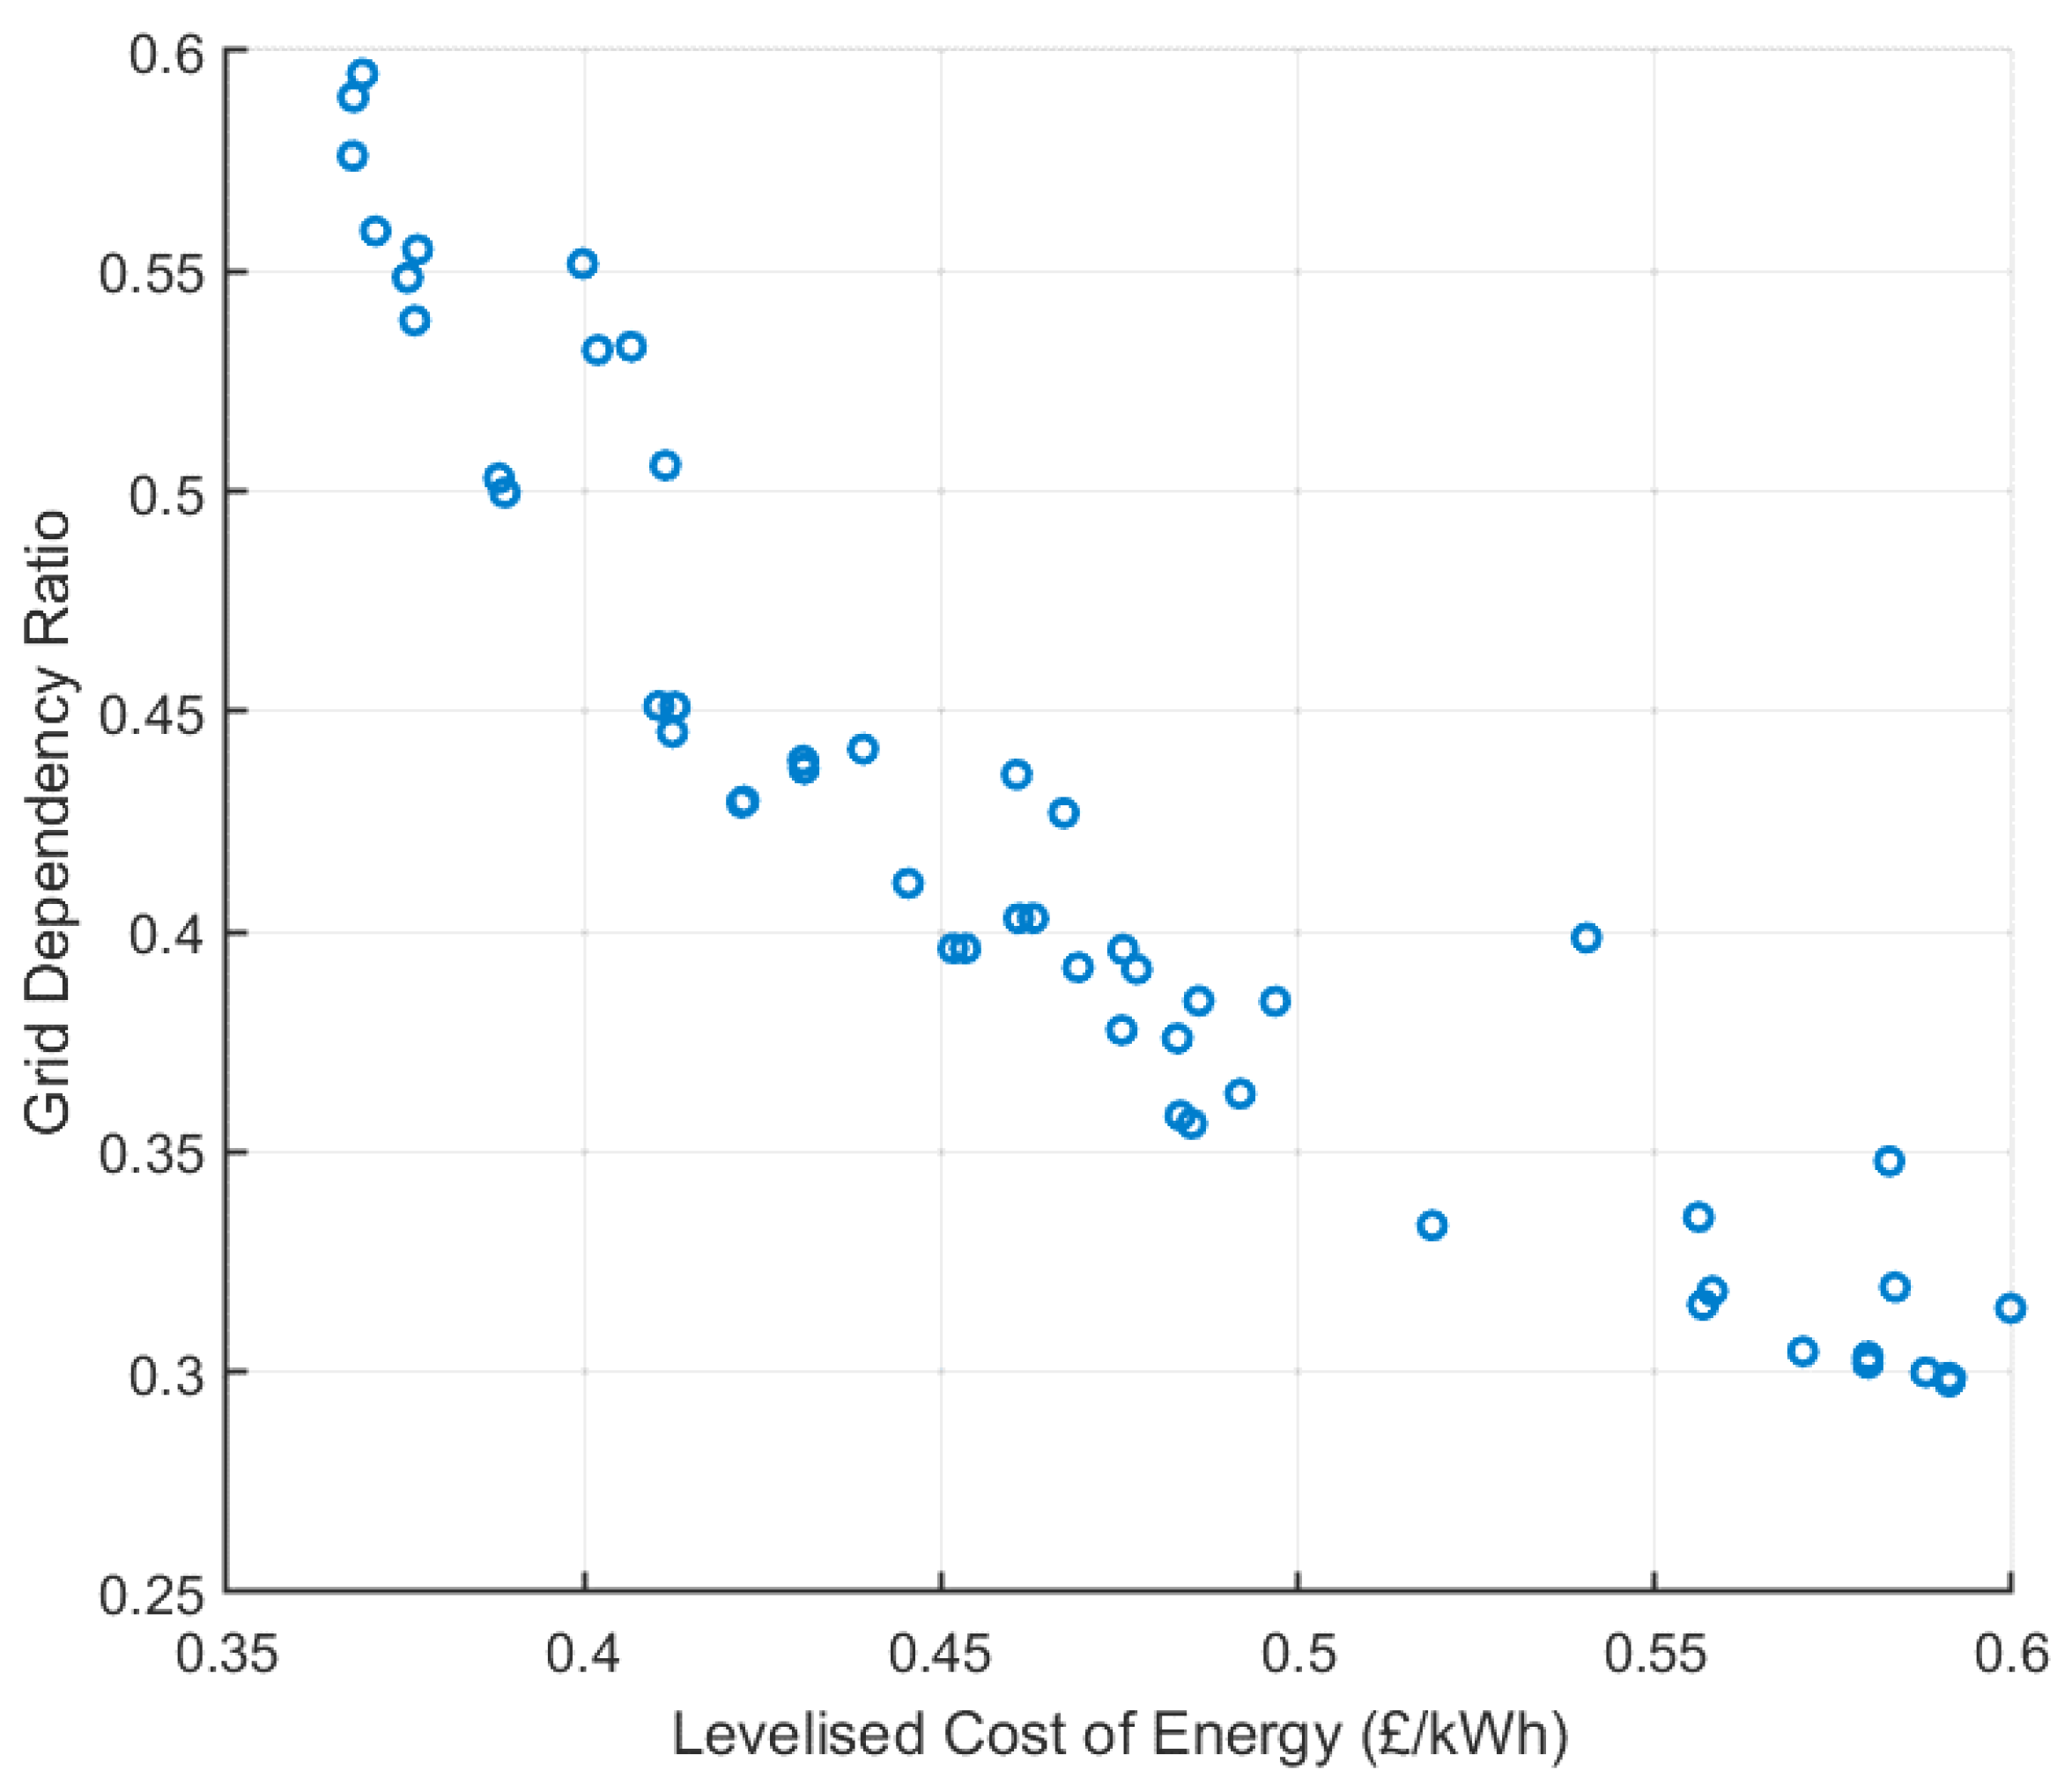
Figure 5.
Monthly PV Energy Production Obtained from the Optimal Hybrid System Sizing When Using the Single-Objective Optimal Sizing Model.
Figure 5.
Monthly PV Energy Production Obtained from the Optimal Hybrid System Sizing When Using the Single-Objective Optimal Sizing Model.
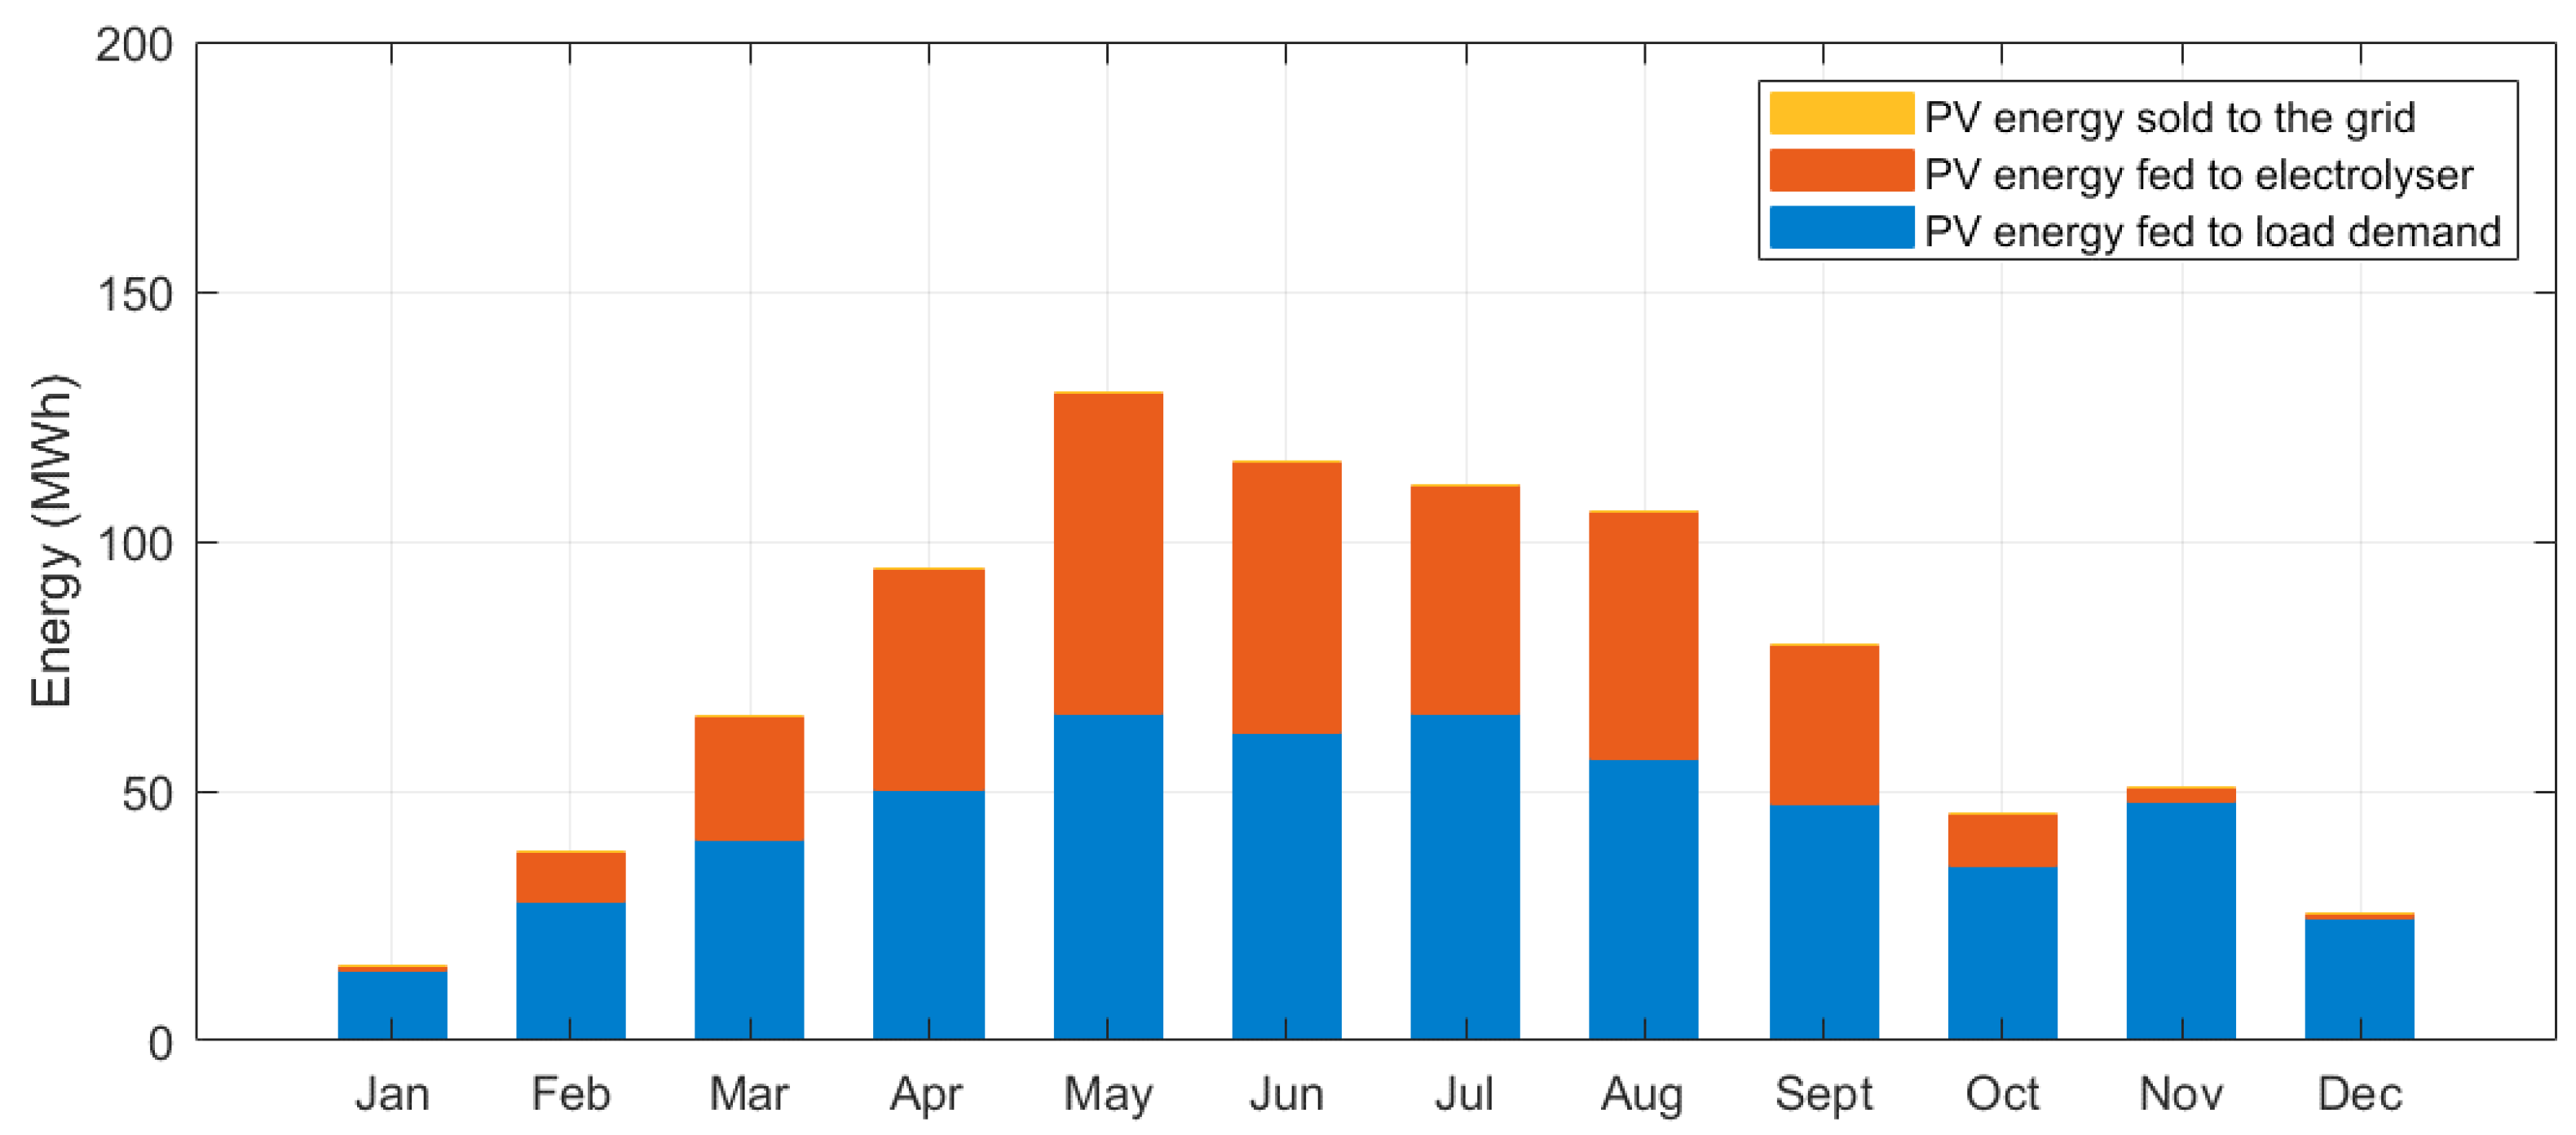
Figure 6.
Monthly PV Energy Production Obtained from the Optimal Hybrid System Sizing When Using the Multi-Objective Optimal Sizing Model.
Figure 6.
Monthly PV Energy Production Obtained from the Optimal Hybrid System Sizing When Using the Multi-Objective Optimal Sizing Model.
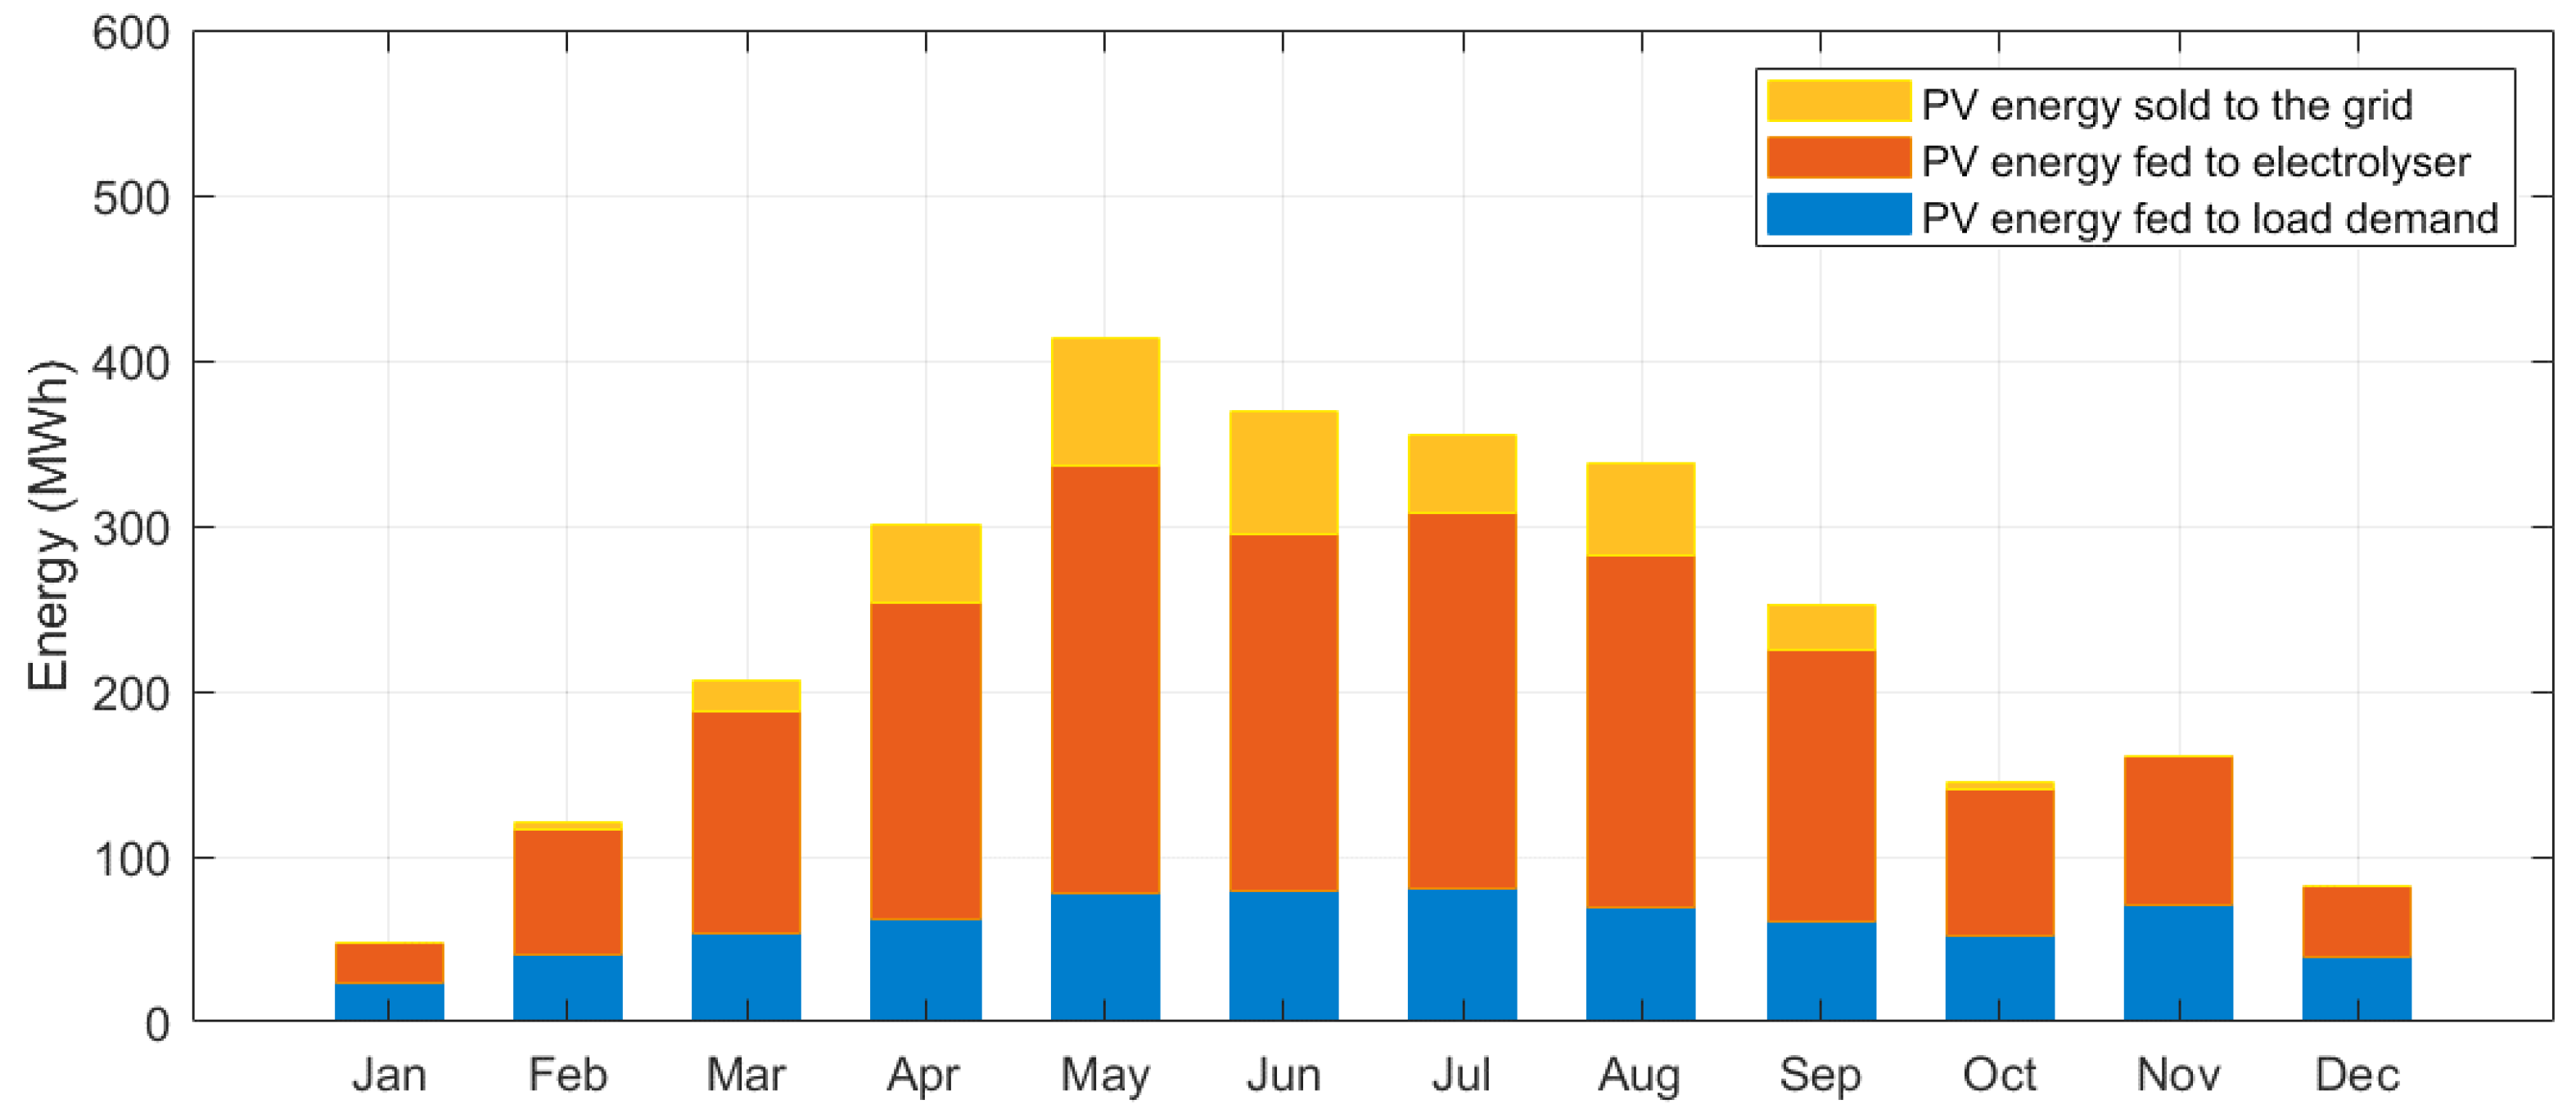
Figure 7.
Monthly H2 Production Obtained from the Optimal Hybrid System Sizing When using the Single-Objective Optimal Sizing Model Versus those Obtained from the Optimal Hybrid System Sizing When using the Multi-Objective Optimal Sizing Model.
Figure 7.
Monthly H2 Production Obtained from the Optimal Hybrid System Sizing When using the Single-Objective Optimal Sizing Model Versus those Obtained from the Optimal Hybrid System Sizing When using the Multi-Objective Optimal Sizing Model.
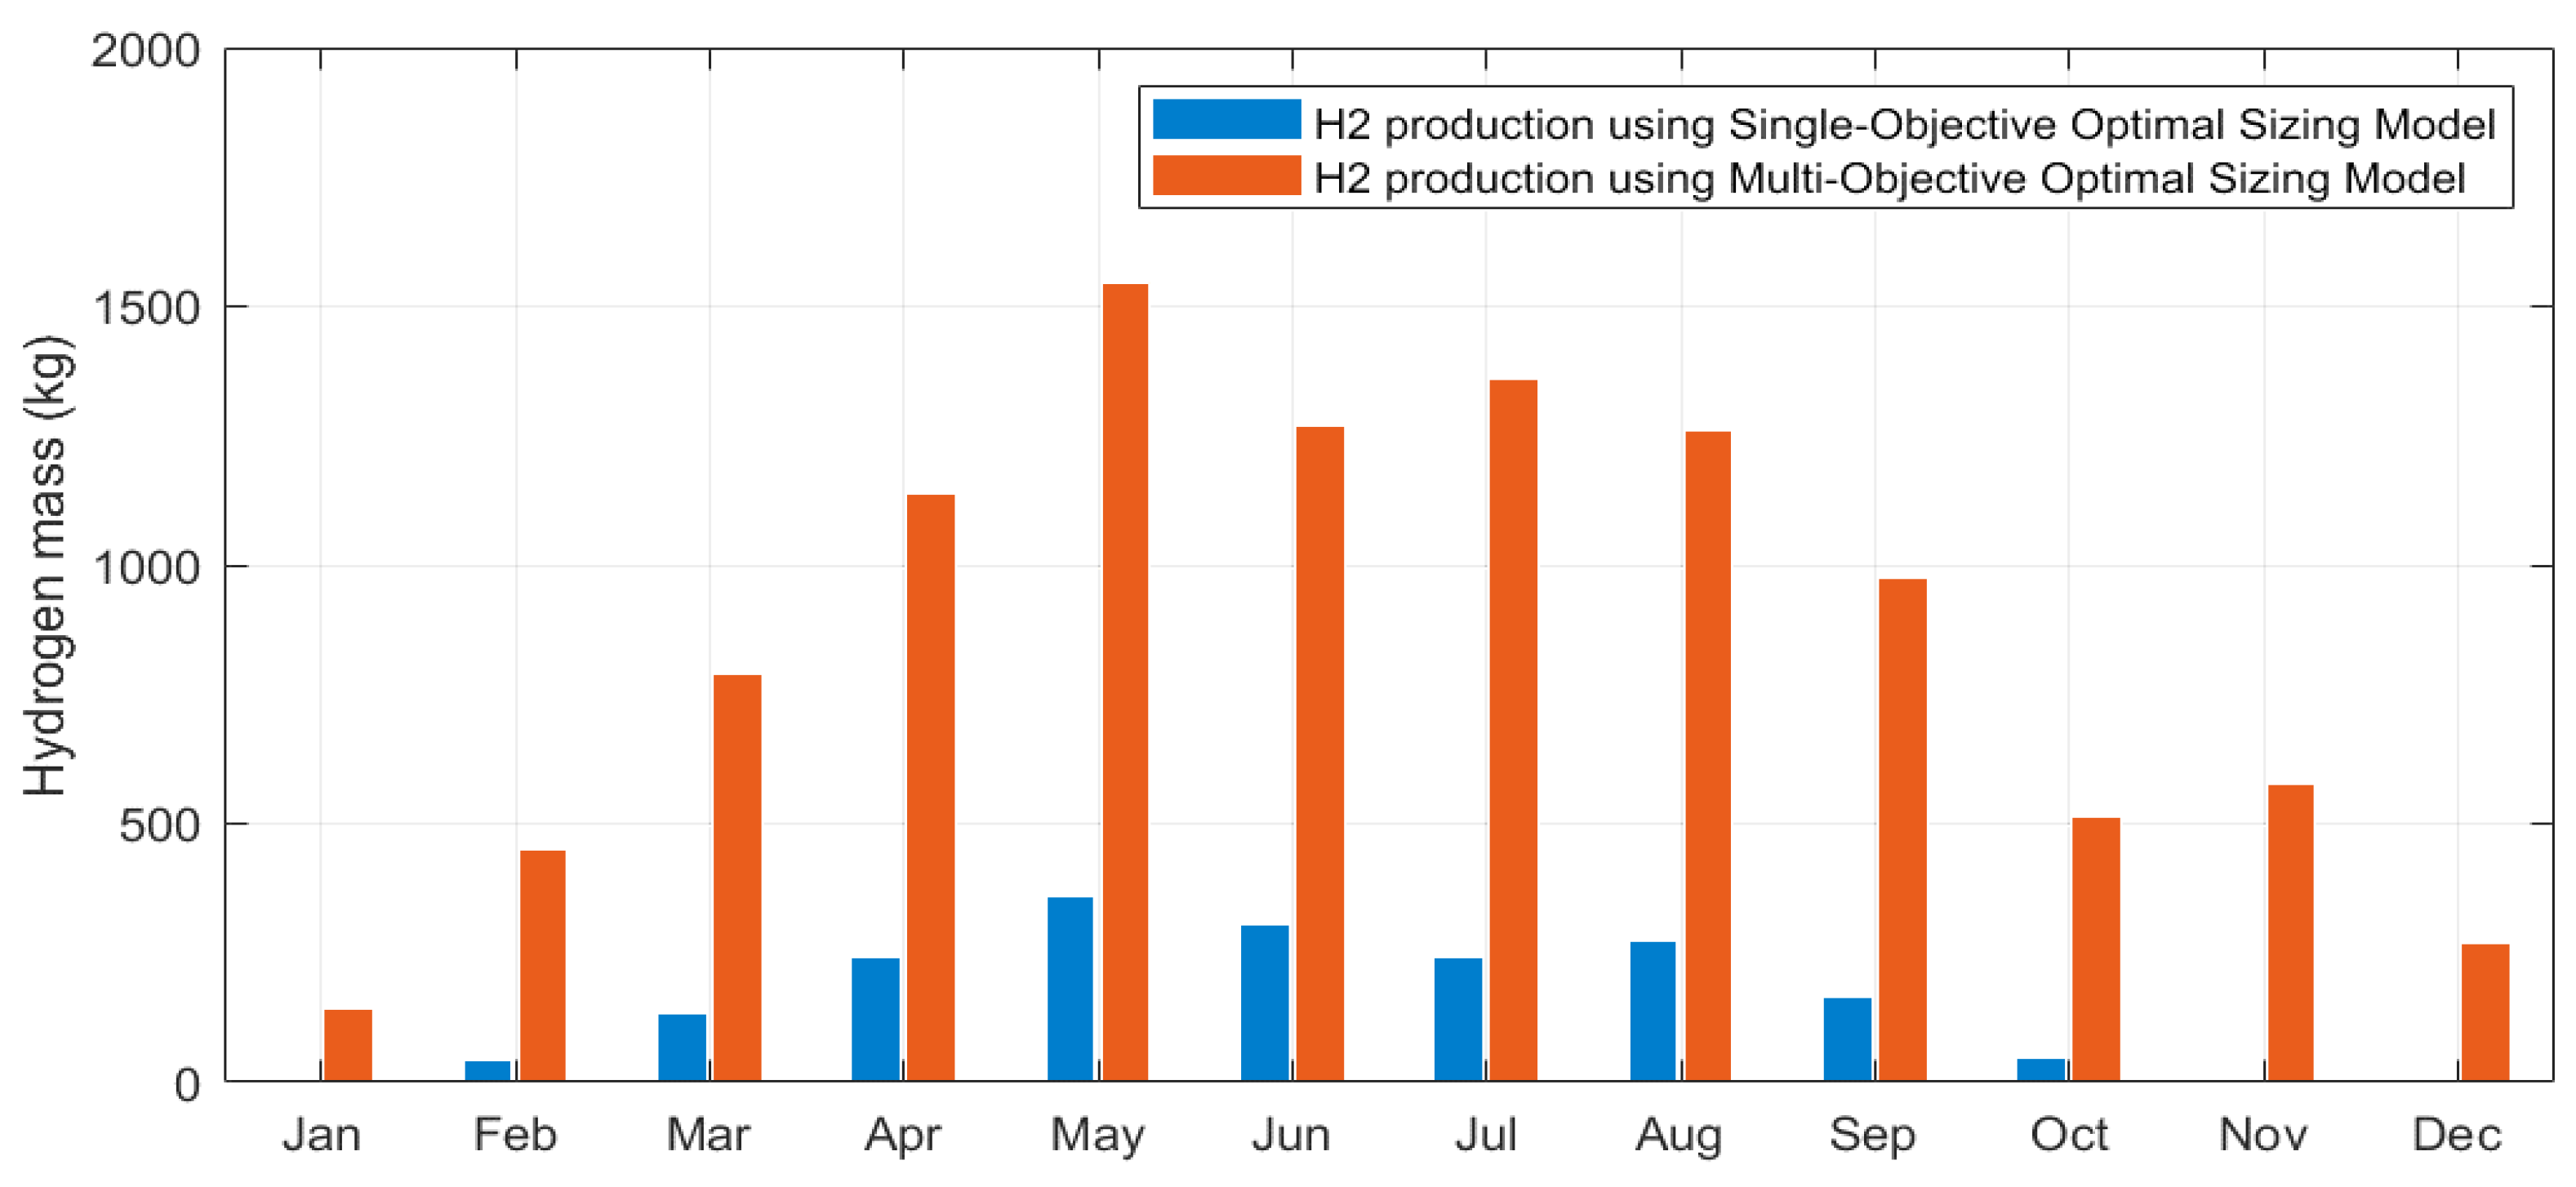
Figure 8.
Monthly Fuel Cell Energy Production Obtained from the Optimal Hybrid System Sizing When using the Single-Objective Optimal Sizing Model Versus the One Obtained from the Optimal Hybrid System Sizing When using the Multi-Objective Optimal Sizing Model.
Figure 8.
Monthly Fuel Cell Energy Production Obtained from the Optimal Hybrid System Sizing When using the Single-Objective Optimal Sizing Model Versus the One Obtained from the Optimal Hybrid System Sizing When using the Multi-Objective Optimal Sizing Model.
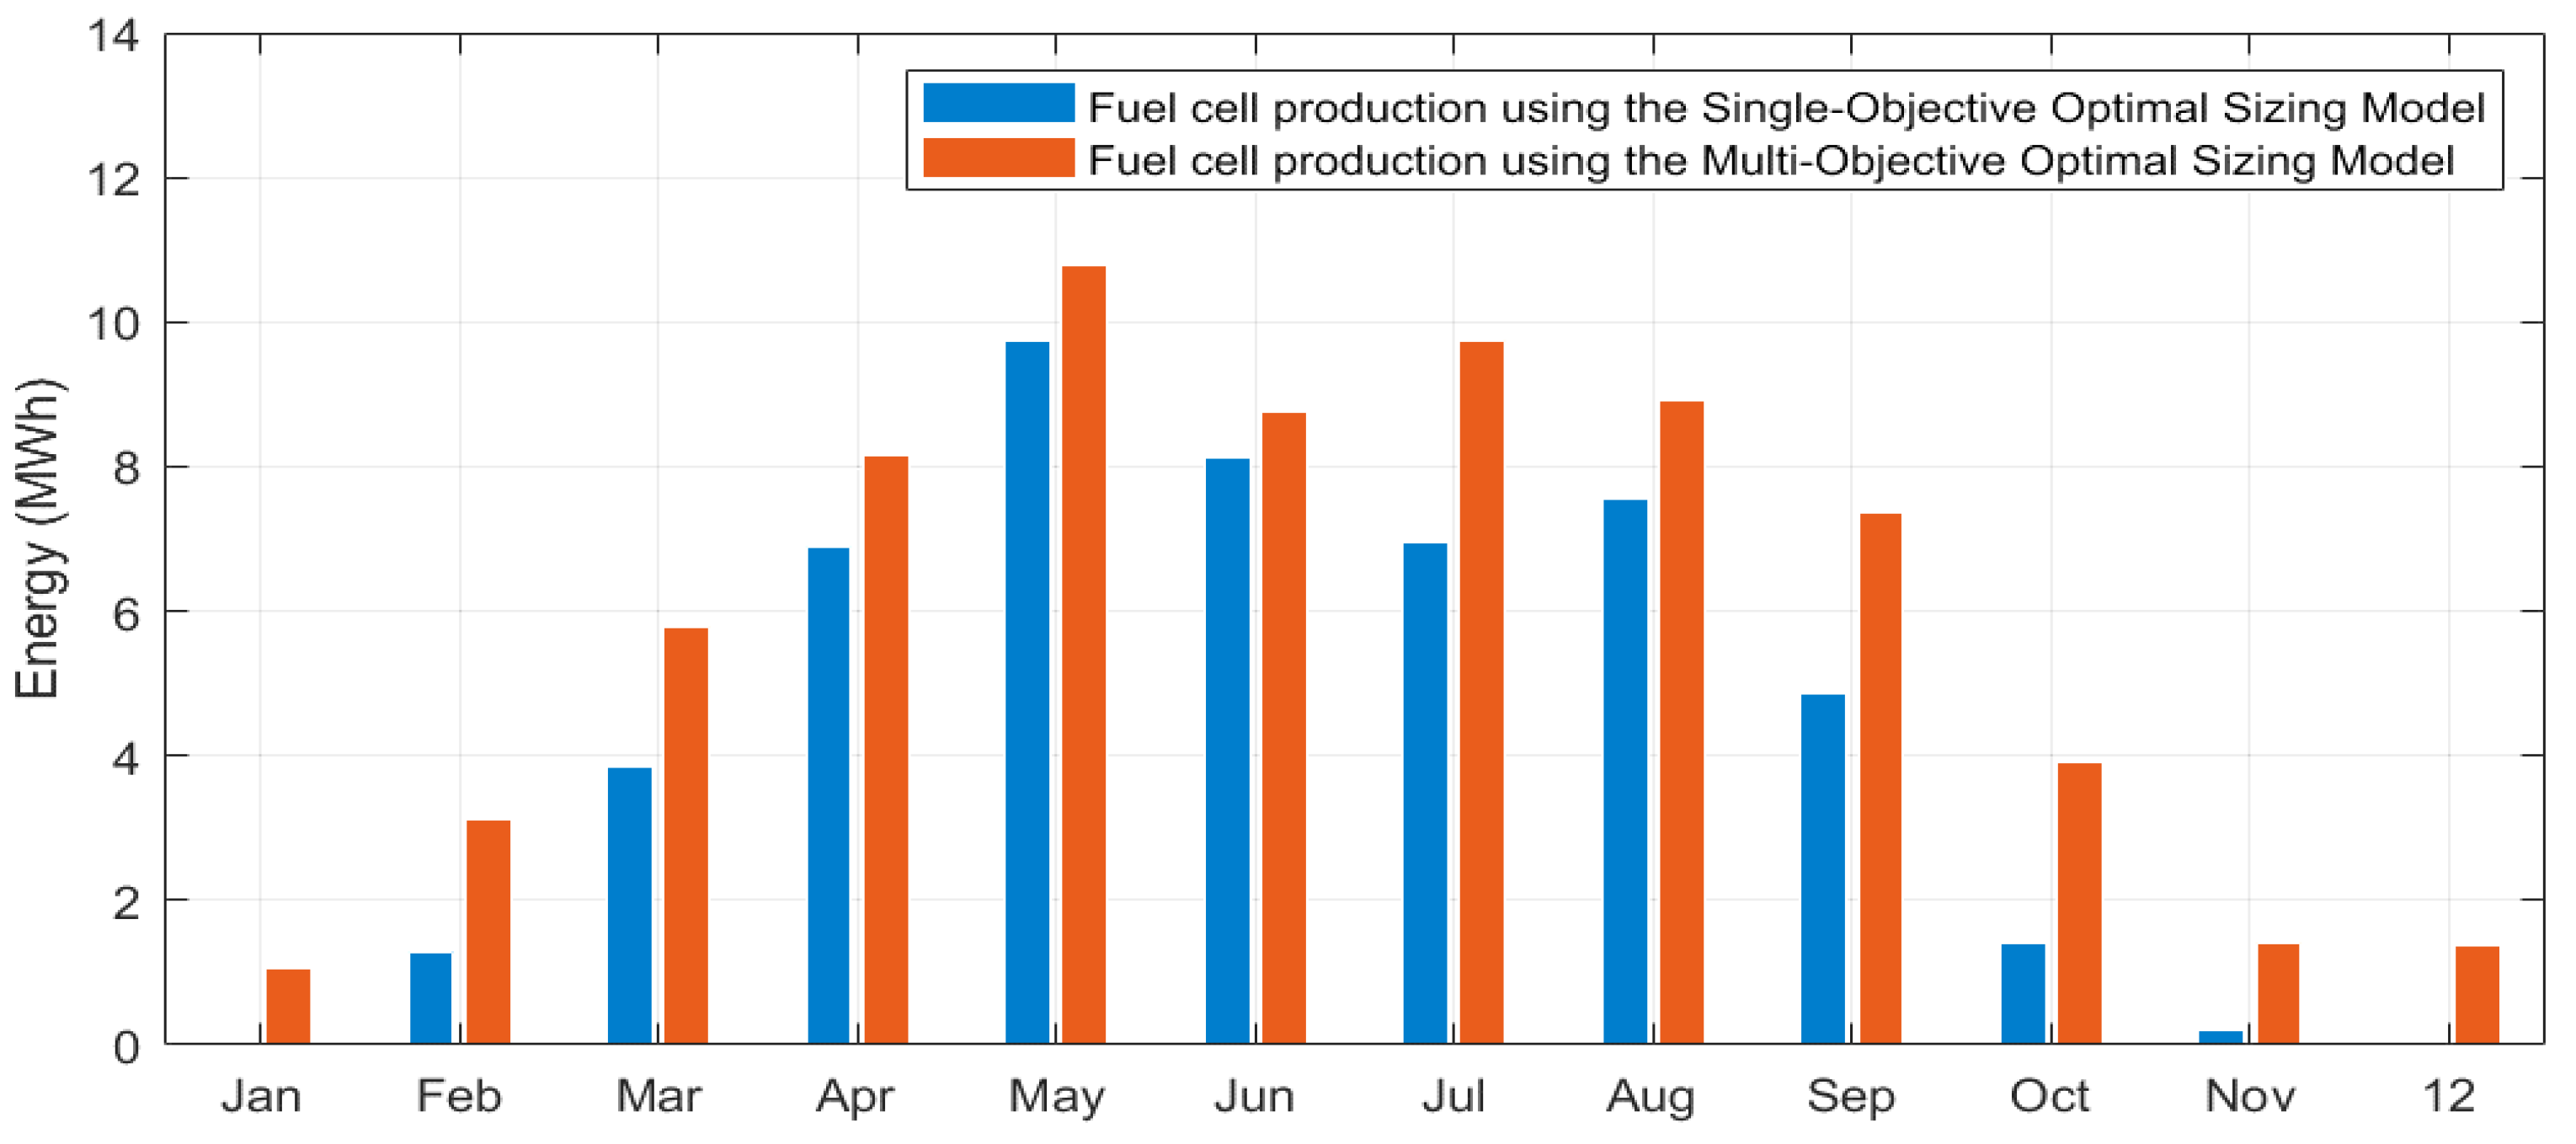
Figure 9.
Monthly Grid Energy Import Obtained from the Optimal Hybrid System Sizing When using the Single-Objective Optimal Sizing Model Versus the One Obtained from the Optimal Hybrid System Sizing When using the Multi-Objective Optimal Sizing Model.
Figure 9.
Monthly Grid Energy Import Obtained from the Optimal Hybrid System Sizing When using the Single-Objective Optimal Sizing Model Versus the One Obtained from the Optimal Hybrid System Sizing When using the Multi-Objective Optimal Sizing Model.
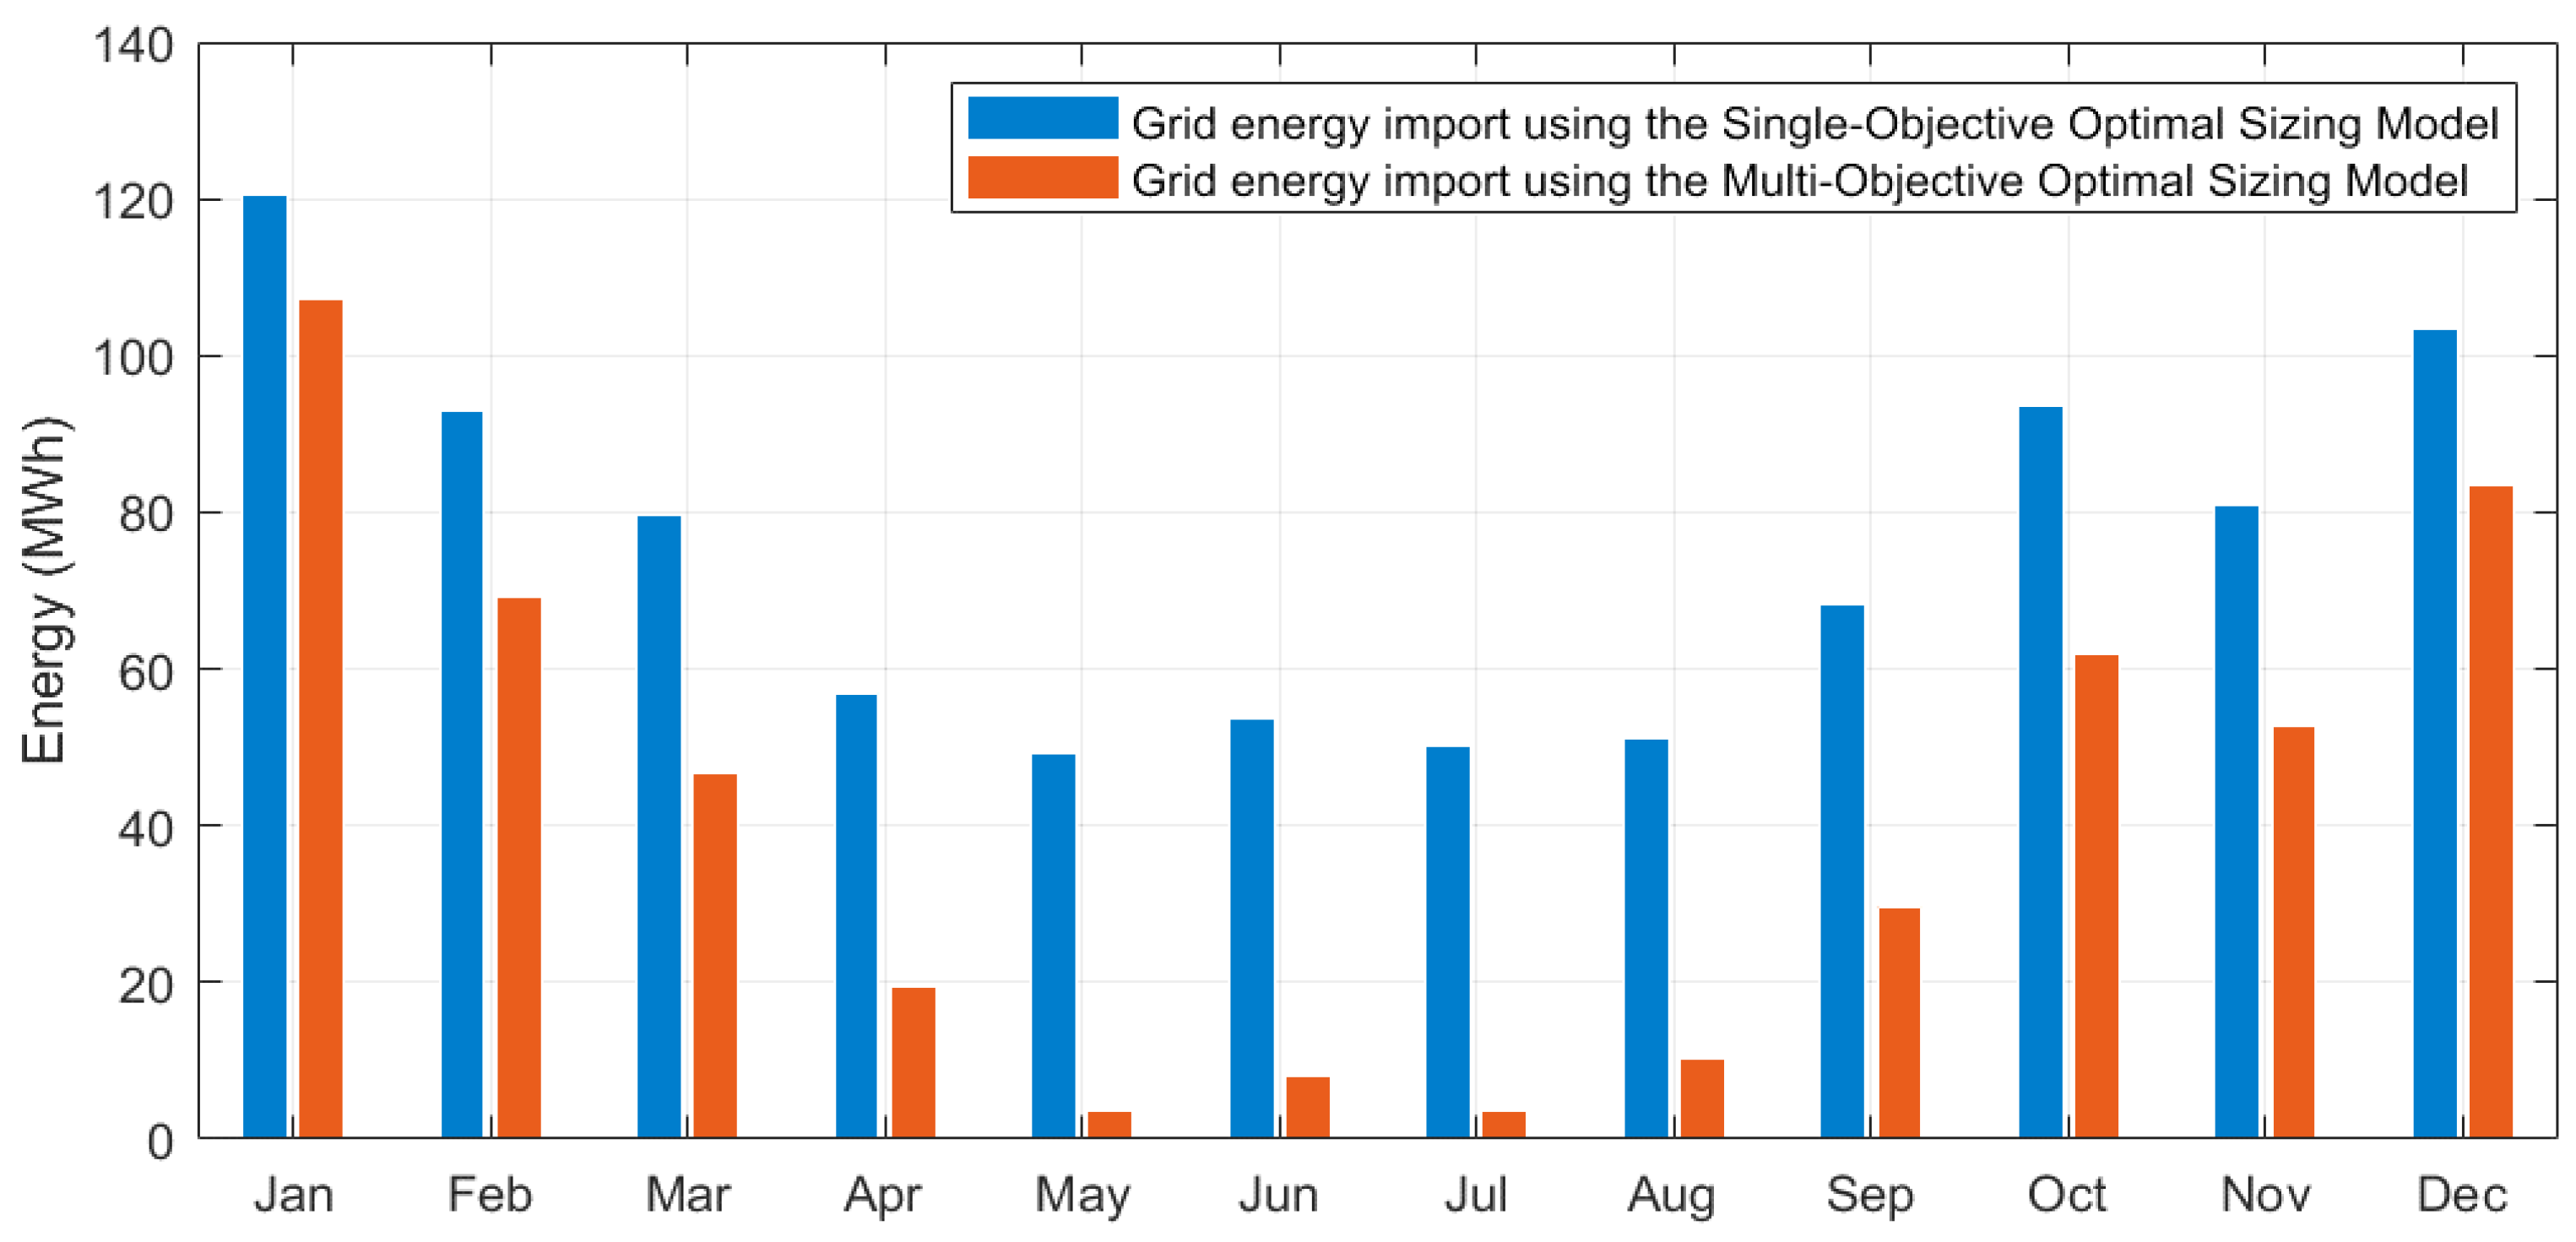

Table 1.
Data Required for Running Both the Single-Objective and Multi-Objective Optimal Sizing Models.
Table 1.
Data Required for Running Both the Single-Objective and Multi-Objective Optimal Sizing Models.
| Parameter | Description | Value |
|---|---|---|
| Capital cost of PV system per unit rating | 1440 £/kW | |
| Operation and maintenance cost of PV system per unit rating | 28.8 £/kW | |
| Replacement cost of PV system per unit rating | 1440 £/kW | |
| Lifetime of PV system | 20 years | |
| Capital cost of electrolyser per unit rating | 1600 £/kW | |
| Operation and maintenance cost of electrolyser per unit rating | 32 £/kW | |
| Replacement cost of electrolyser per unit rating | 1200 £/kW | |
| Lifetime of electrolyser | 15 years | |
| Capital cost of H2 storage tank per unit rating | 528 £/kg | |
| Operation and maintenance cost of H2 tank per unit rating | 10.56 £/kg | |
| Replacement cost of H2 storage tank per unit rating | 528 £/kg | |
| Lifetime of H2 storage tank | 20 years | |
| Capital cost of fuel cell per unit rating | 2400 £/kW | |
| Operation and maintenance cost of fuel cell per unit rating | 48 £/kW | |
| Replacement cost of fuel cell per unit rating | 2000 £/kW | |
| Lifetime of fuel cell | 50,000 hours | |
| Capital cost of PV inverter and fuel cell inverter per unit rating, respectively | 80 £/kW | |
| Operation and maintenance cost of PV inverter and fuel cell inverter per unit rating, respectively | 1.60 £/kW | |
| Replacement cost of PV inverter and fuel cell inverter per unit rating, respectively | 80 £/kW | |
| Lifetime of PV inverter and fuel cell inverter, respectively | 15 years | |
| Project lifetime | 20 years | |
| Real interest rate | 8% | |
Table 2.
Tariff Rates of Grid Electricity Purchase and Grid Feed-in Electricity Based on Prices of RGU’s UK Energy Provider.
Table 2.
Tariff Rates of Grid Electricity Purchase and Grid Feed-in Electricity Based on Prices of RGU’s UK Energy Provider.
| Parameter | Description | Value |
|---|---|---|
| Tariff rate for grid electricity purchase | Day rate (7.00 – 12.00 am): 0.4598 £/kWh | |
| Night rate (12.00-7.00 am): 0.1420 £/kWh | ||
| Tariff rate of grid feed-in electricity | 0.056 £/kWh | |
Table 3.
Results of both the Developed Single-Objective and Multi-Objective Optimal Sizing Models for RB.
Table 3.
Results of both the Developed Single-Objective and Multi-Objective Optimal Sizing Models for RB.
| Parameter | Single-Objective Optimal Sizing Model’s Results | Multi-Objective Optimal Sizing Model’s Results |
|---|---|---|
| PV system size (kW) | 1000 | 3187.8 |
| Electrolyser size (kW) | 932 | 1000 |
| H2 storage tank size (kg) | 22.7 | 106.1 |
| Fuel cell system size (kW) | 242 | 250 |
| LCOE (£/kWh) | 0.366 | 0.5188 |
| GDR (%) | 40% | 33.33% |
Disclaimer/Publisher’s Note: The statements, opinions and data contained in all publications are solely those of the individual author(s) and contributor(s) and not of MDPI and/or the editor(s). MDPI and/or the editor(s) disclaim responsibility for any injury to people or property resulting from any ideas, methods, instructions or products referred to in the content. |
© 2024 by the authors. Licensee MDPI, Basel, Switzerland. This article is an open access article distributed under the terms and conditions of the Creative Commons Attribution (CC BY) license (http://creativecommons.org/licenses/by/4.0/).
Copyright: This open access article is published under a Creative Commons CC BY 4.0 license, which permit the free download, distribution, and reuse, provided that the author and preprint are cited in any reuse.


