Preprint
Article

This version is not peer-reviewed.

Identification of Endometriosis Pathophysiologic-related Genes Based on Meta-analysis and Bayesian Approach

A peer-reviewed article of this preprint also exists.

Submitted:

27 November 2024

Posted:

27 November 2024

You are already at the latest version

Abstract

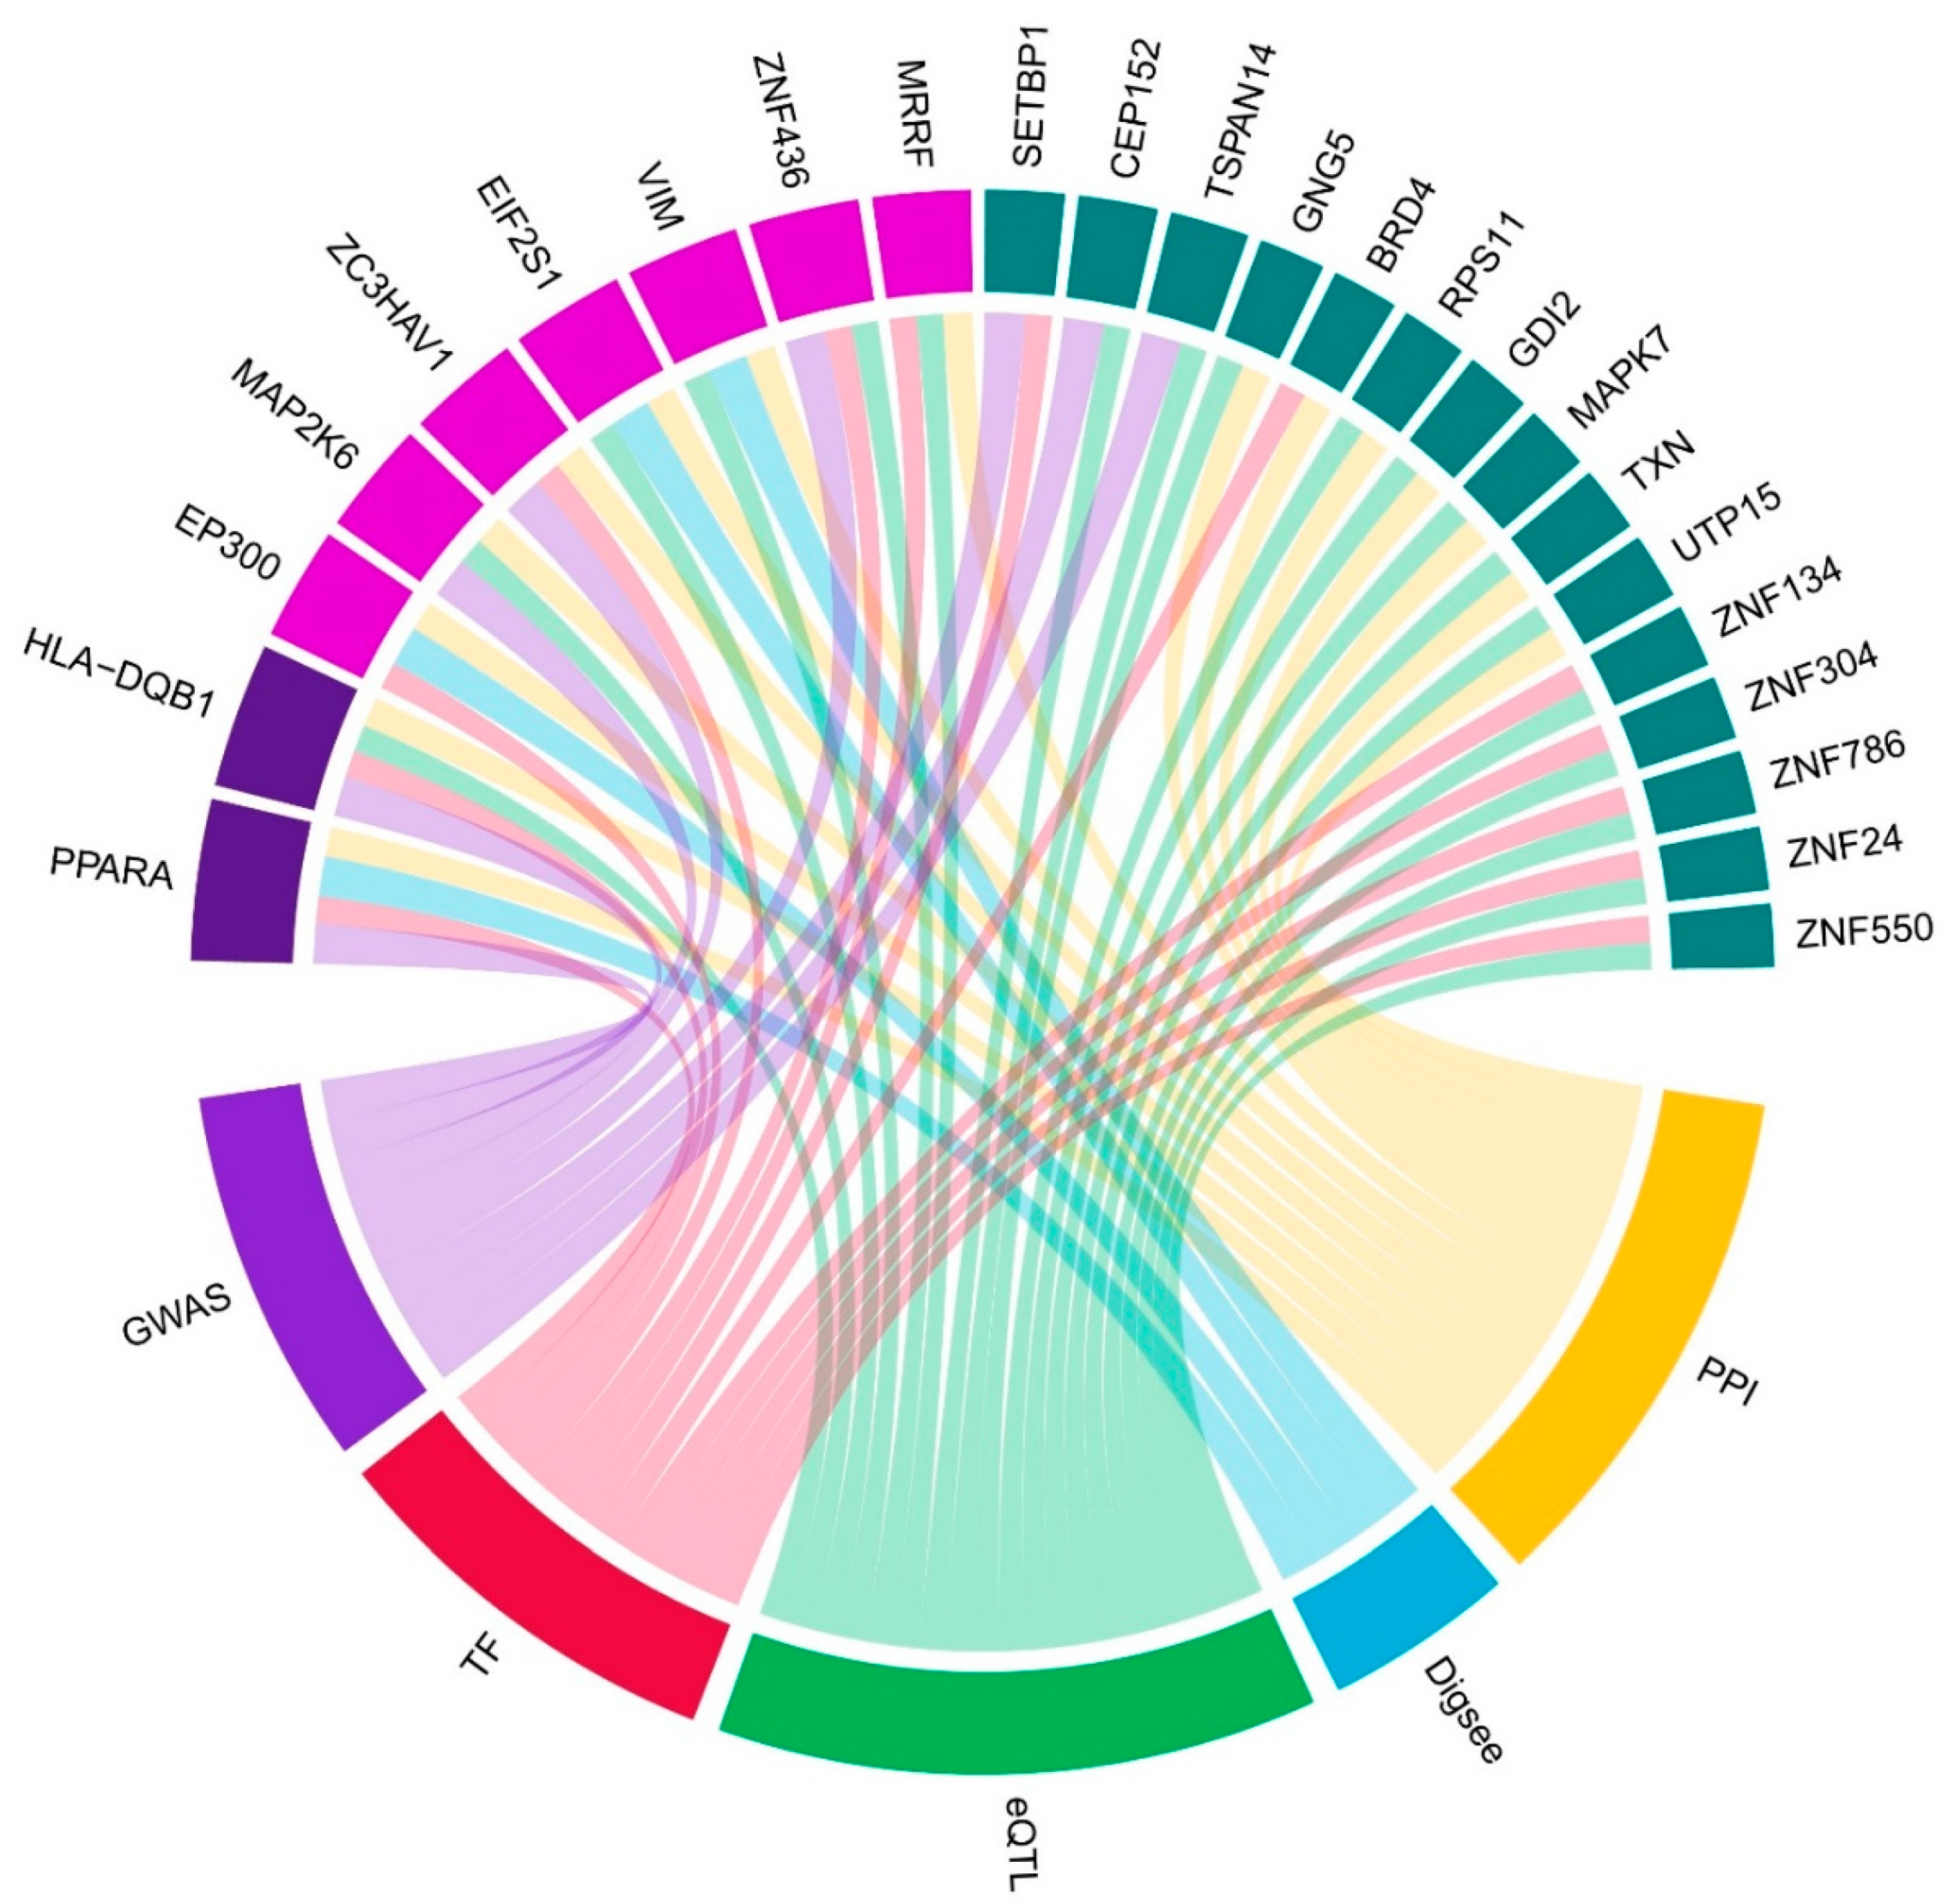
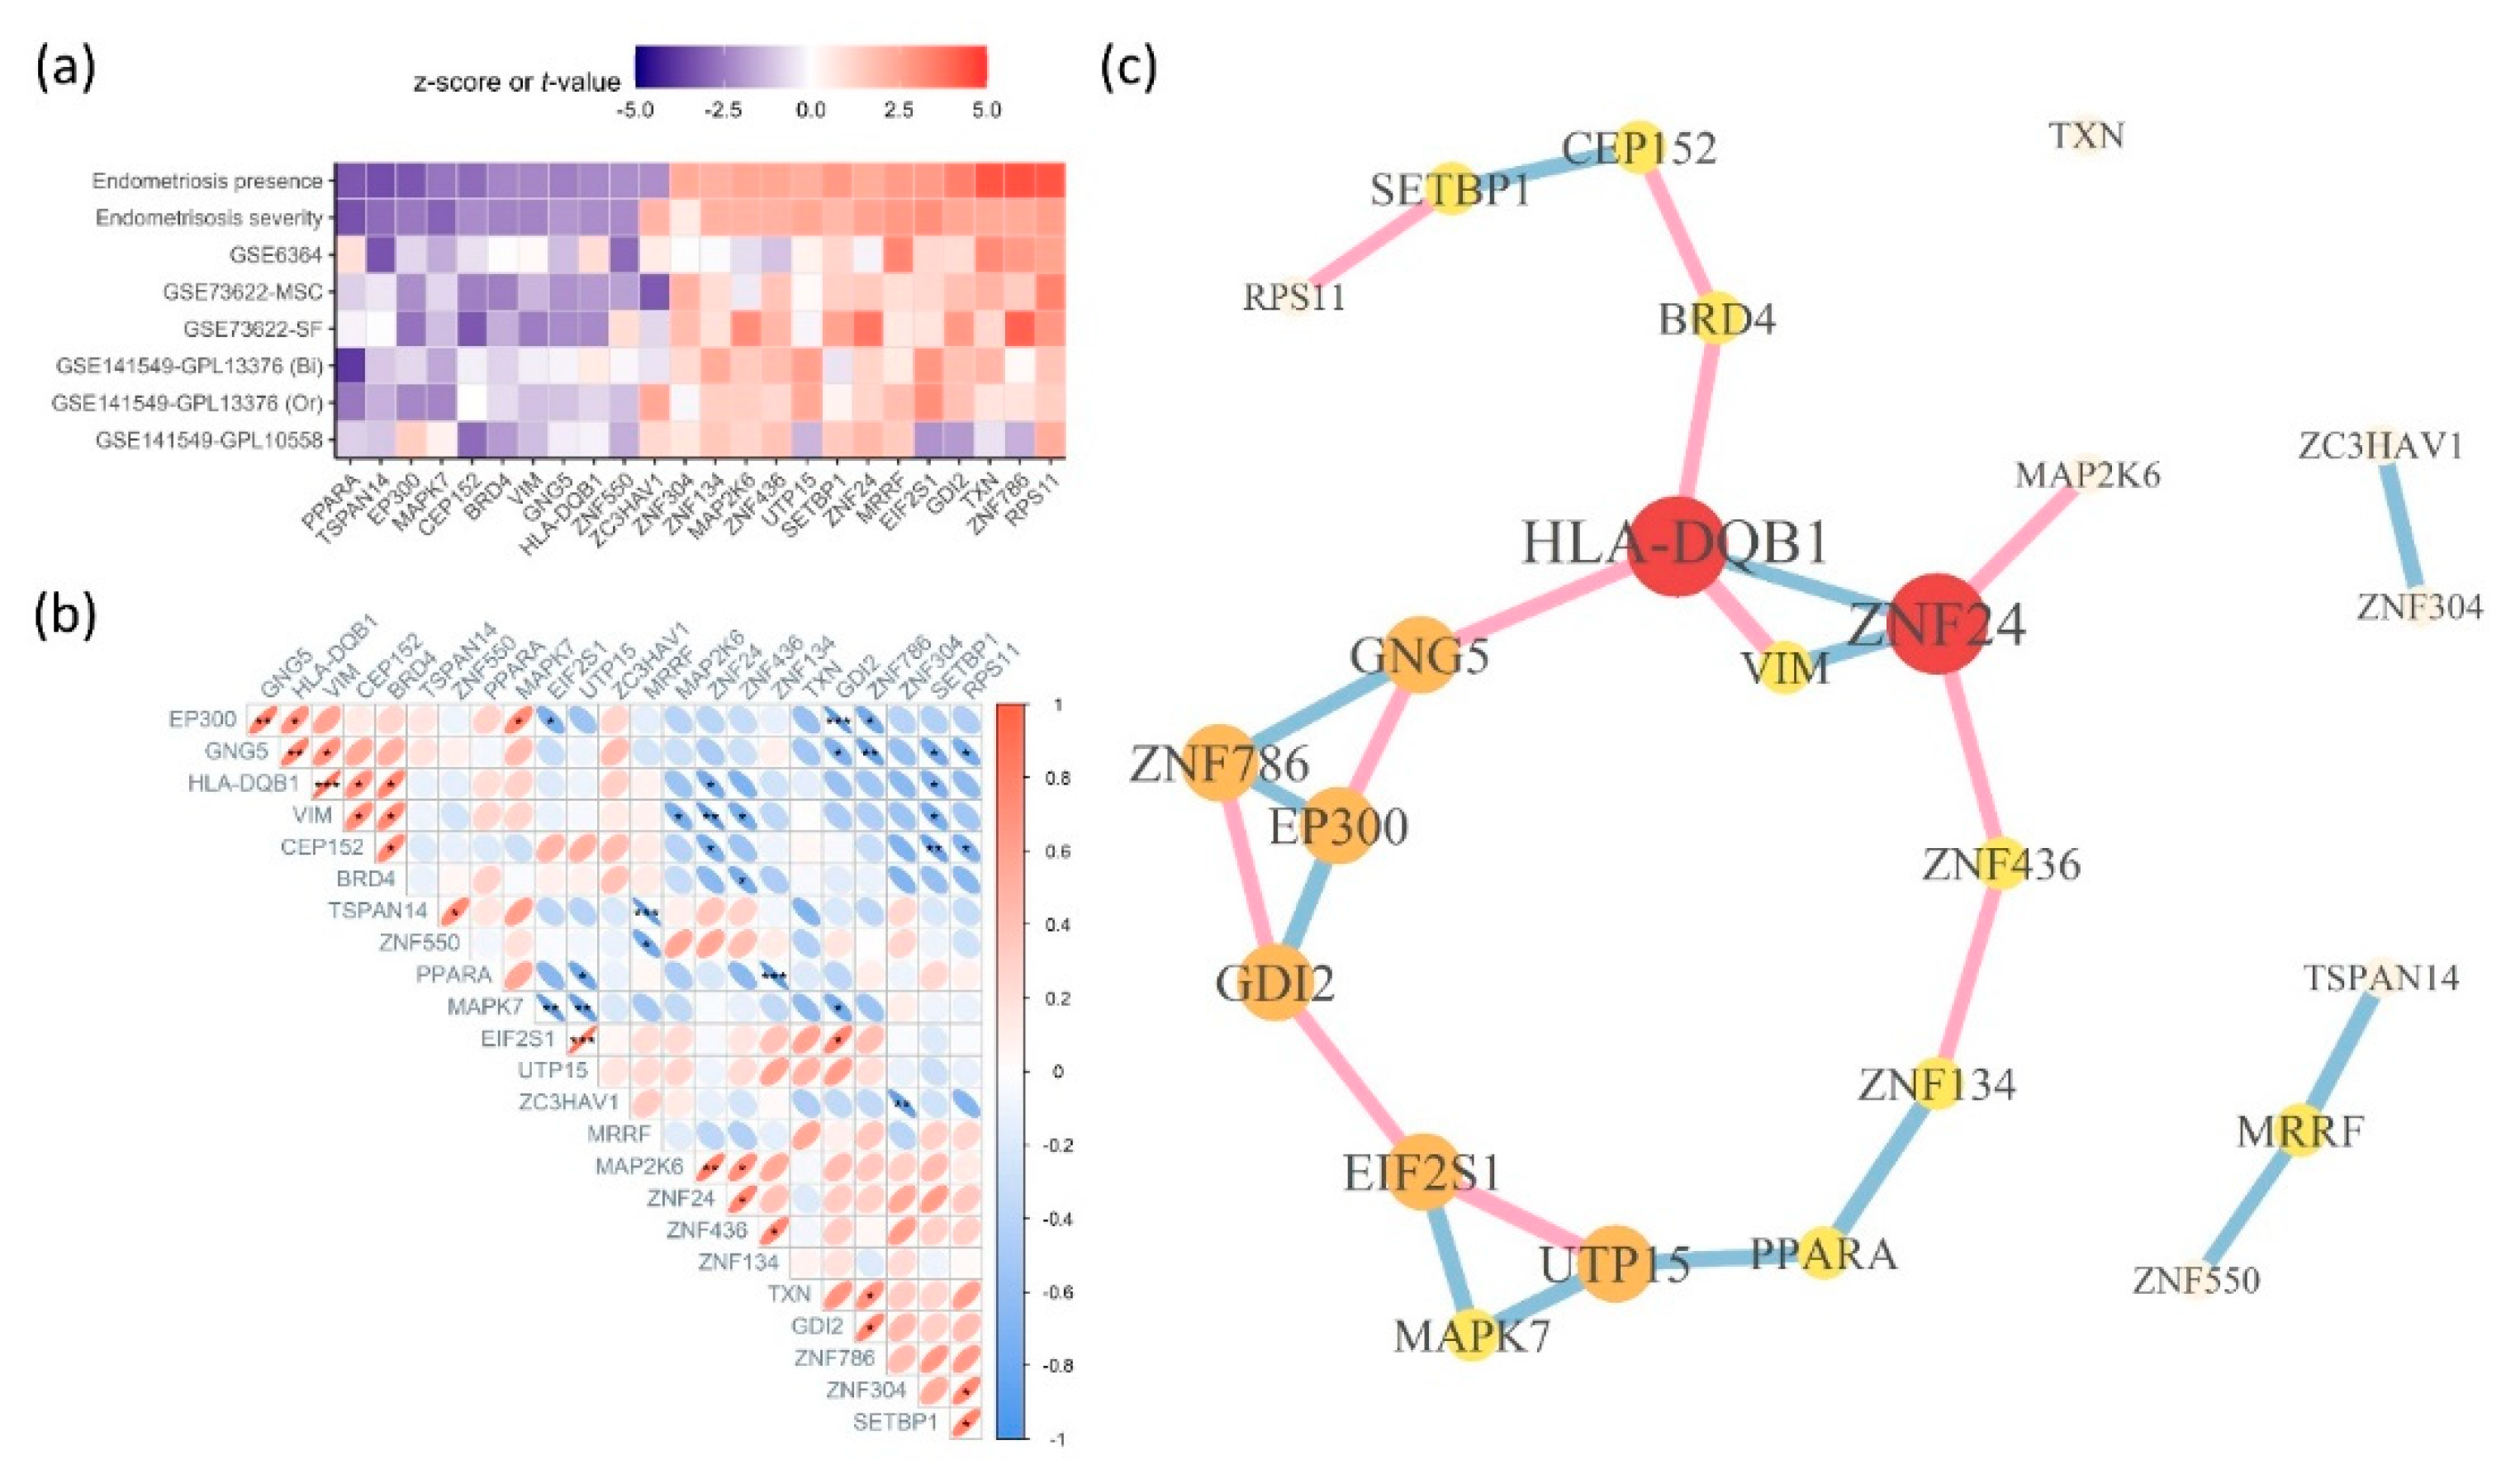
Endometriosis is a complex disease with diverse etiologies, including hormonal, immunological, and environmental factors; however, its exact pathogenesis remains unknown. While surgical approaches are the diagnostic and therapeutic gold standard, identifying endometriosis-associated genes is a crucial first step. Endometriosis-related five gene expression studies were selected from the available datasets. Approximately, 14,167 genes common to these five datasets were analyzed for differential expression. Meta-analyses utilized fold-change values and standard errors obtained from each analysis, with the binomial and continuous datasets contributing to the endometriosis presence and endometriosis severity meta-analysis, respectively. Approximately, 160 genes showed significant results in both meta-analyses. For Bayesian analysis, endometriosis-related single nucleotide polymorphisms (SNPs), the human transcription factor catalog, uterine SNP-related gene expression, disease-gene databases, and interactome databases were utilized. Twenty-four genes, present in at least three or more databases, were identified. Network analysis based on Pearson's correlation coefficients revealed HLA-DQB1 gene with both a high score in the Bayesian analysis and a central position in the network. Although ZNF24 had a lower score, it occupied a central position in the network, followed by other ZNF family members. Bayesian analysis identified genes with high confidence that could support discovering key diagnostic biomarkers and therapeutic targets for endometriosis.

Keywords: 
;  ;  ;  

1. Introduction

Endometriosis is an enigmatic disease characterized by the presence of endometrial glands and stroma outside the uterine endometrium, inhabiting diverse locations, including the ovaries, peritoneum, and extraperitoneal organs [1]. Endometriosis, characterized by a prevalence of as high as 10% among women of reproductive age, gradually progresses and evolves into a chronic inflammatory condition. Medical treatments for endometriosis, such as gonadotropin-releasing hormone agonists, dienogest, and oral contraceptives, along with surgical treatments often cause a reduction in functional ovarian tissue and ovarian reserve, making pregnancy challenging for both natural conception and assisted reproductive techniques [1,2].
Endometriosis manifests as a complex condition with an intricate etiology, weaving together a tapestry of hormonal, immunological, and environmental influences [1]. The preeminent conceptualization of diverse pathophysiological frameworks emerged from the work of John A. Sampson in 1927 [3]. He postulated that the endometrial tissue enters the peritoneal cavity through retrograde menstruation, a process in which expelled endometrial fragments traverse the fallopian tubes, affix, and infiltrate the peritoneal epithelium. Inadequate immune responses may permit the persistence and proliferation of these implants, thereby preventing effective clearance from the implantation sites [1,4]. Another theory of the pathophysiology of endometriosis involves metaplasia of the coelomic epithelium, which is believed to contribute substantially to the development of endometriosis, primarily induced by environmental factors. Although retrograde menstruation in women is a universal physiological phenomenon during the reproductive period, coupled with the observation that only approximately 10% develop endometriosis, this suggests an interplay of diverse factors, including altered cellular immunity, metastasis, genetic underpinnings, environmental influences, and a complex mode of inheritance marked by interactions between specific genes and the environment [1,4,54].
Given the exceedingly intricate pathophysiology of endometriosis, researchers are yet to establish definitive biomarkers for diagnosis [5]. Although laparoscopic surgery has traditionally been considered the gold standard for diagnosing endometriosis [11,12], it is no longer routinely performed for diagnostic purposes. With medical treatment, independent of surgical intervention, constituting a substantial portion of therapeutic approaches, the need non-invasive diagnostic methods distinct from historical approaches have increased; however, they require high specificity [2,11]. Similar to other complex diseases of multifactorial origin, the identification of genes associated with high-penetrance endometriosis remains elusive. Genetic exploration holds promise for the identification of critical pathophysiological pathways [2,11]. In this study, we analyzed gene expression data related to endometriosis from open databases and identified genes associated with the presence and severity of the disease using Bayesian analysis (Figure 1).

2. Results

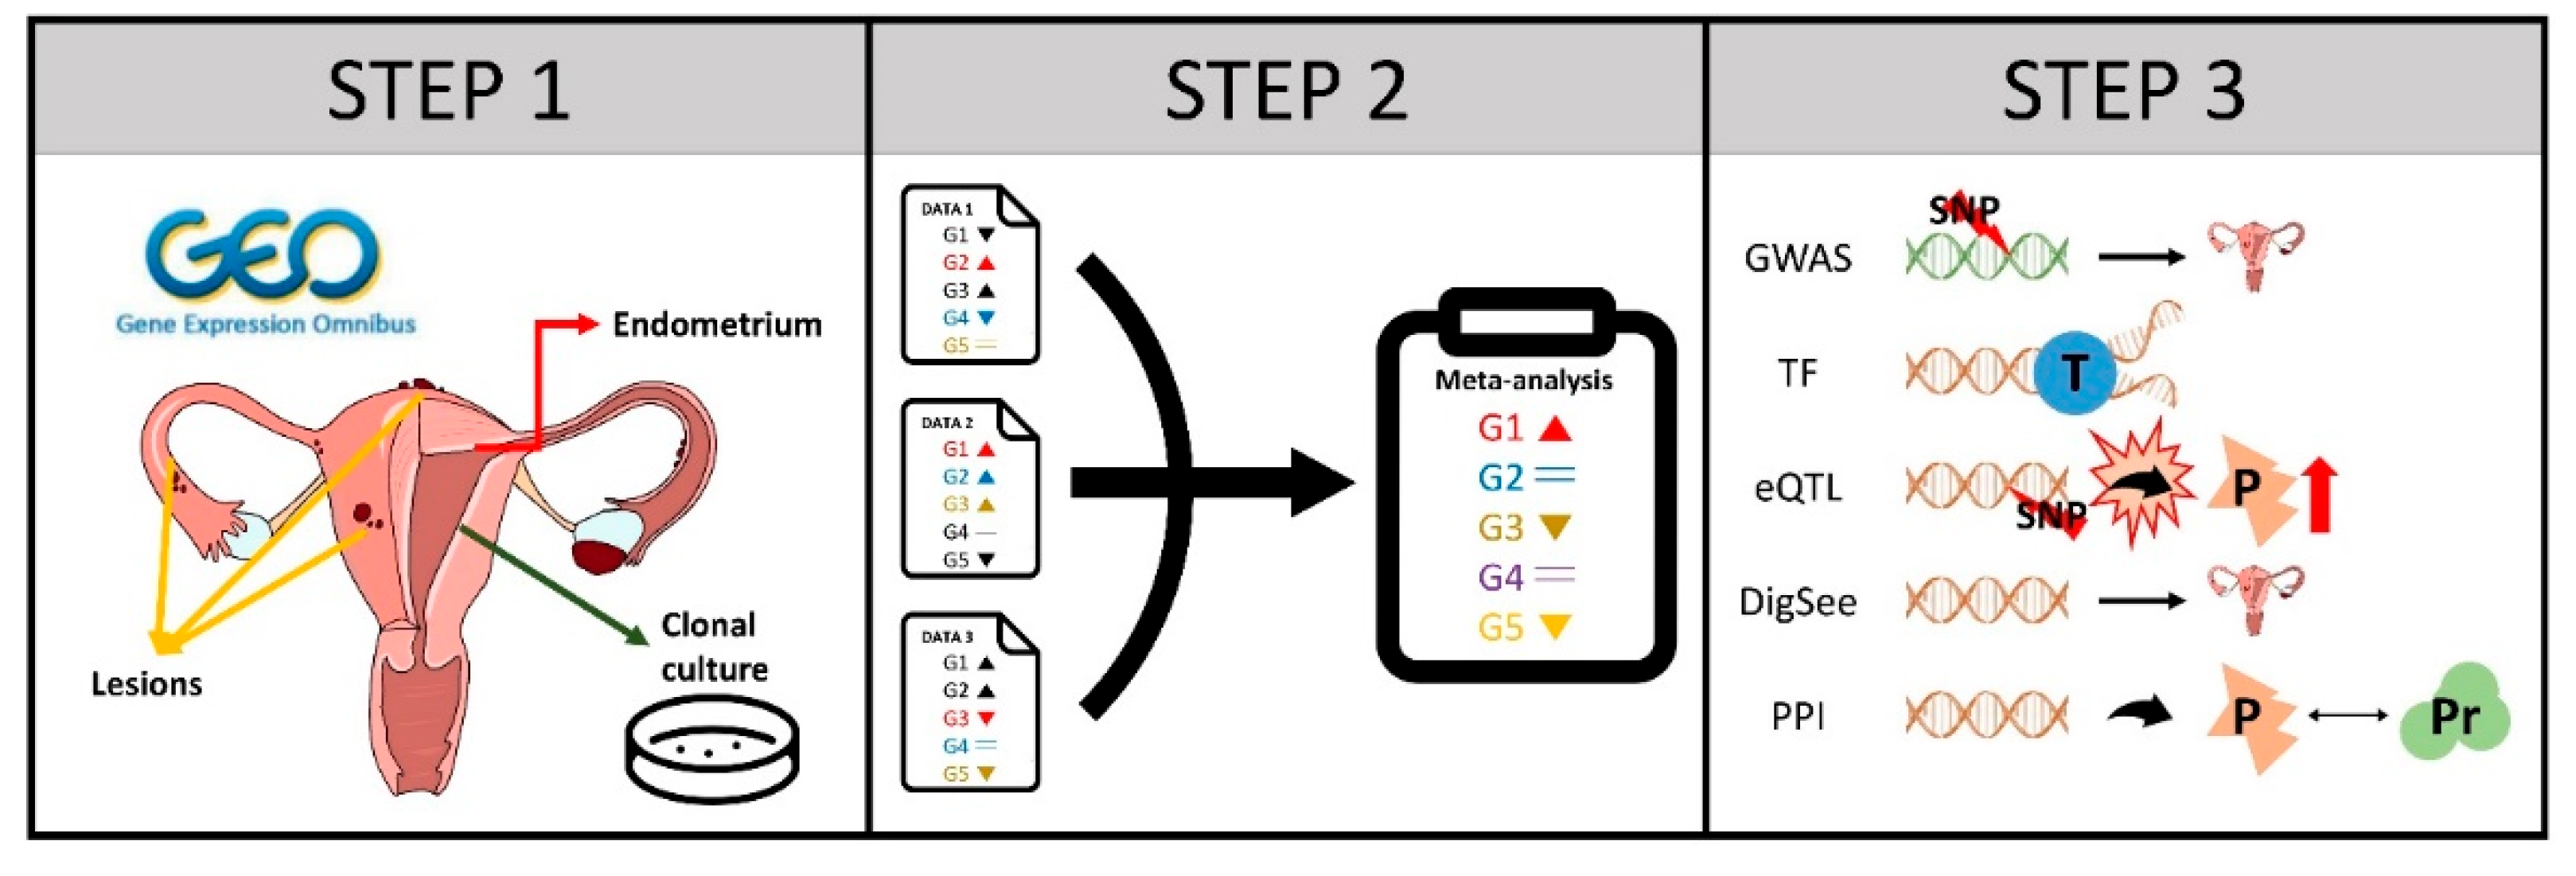
2.1. Data Exploration and Selection

Obstetrics and gynecology specialists selected data from the Gene Expression Omnibus (GEO) for the meta-analysis. GSE6364 was used to analyze gene expression in endometrial tissue from patients with moderate-to-severe endometriosis and a control group. Similarly, GSE73622 examined gene expression in endometrial tissue samples from a patient-control study in which researchers reprogrammed collected cells into endometrial mesenchymal stem cells (MSC) and subsequently differentiated them into endometrial stromal fibroblasts (SF) using progesterone. GSE141549 explored gene expression in endometrial and peritoneal tissues from patients with endometriosis and healthy women as well as in various lesions within the peritoneal cavities of patients. Uniquely, data from 115 patients were analyzed on a separate platform (GPL10558), while data including from additional 53 controls were analyzed on the GPL13376 platform. Analysts excluded data from the control group in GSE141549-GPL13376 if medication usage or menstrual cycle details were not recorded.

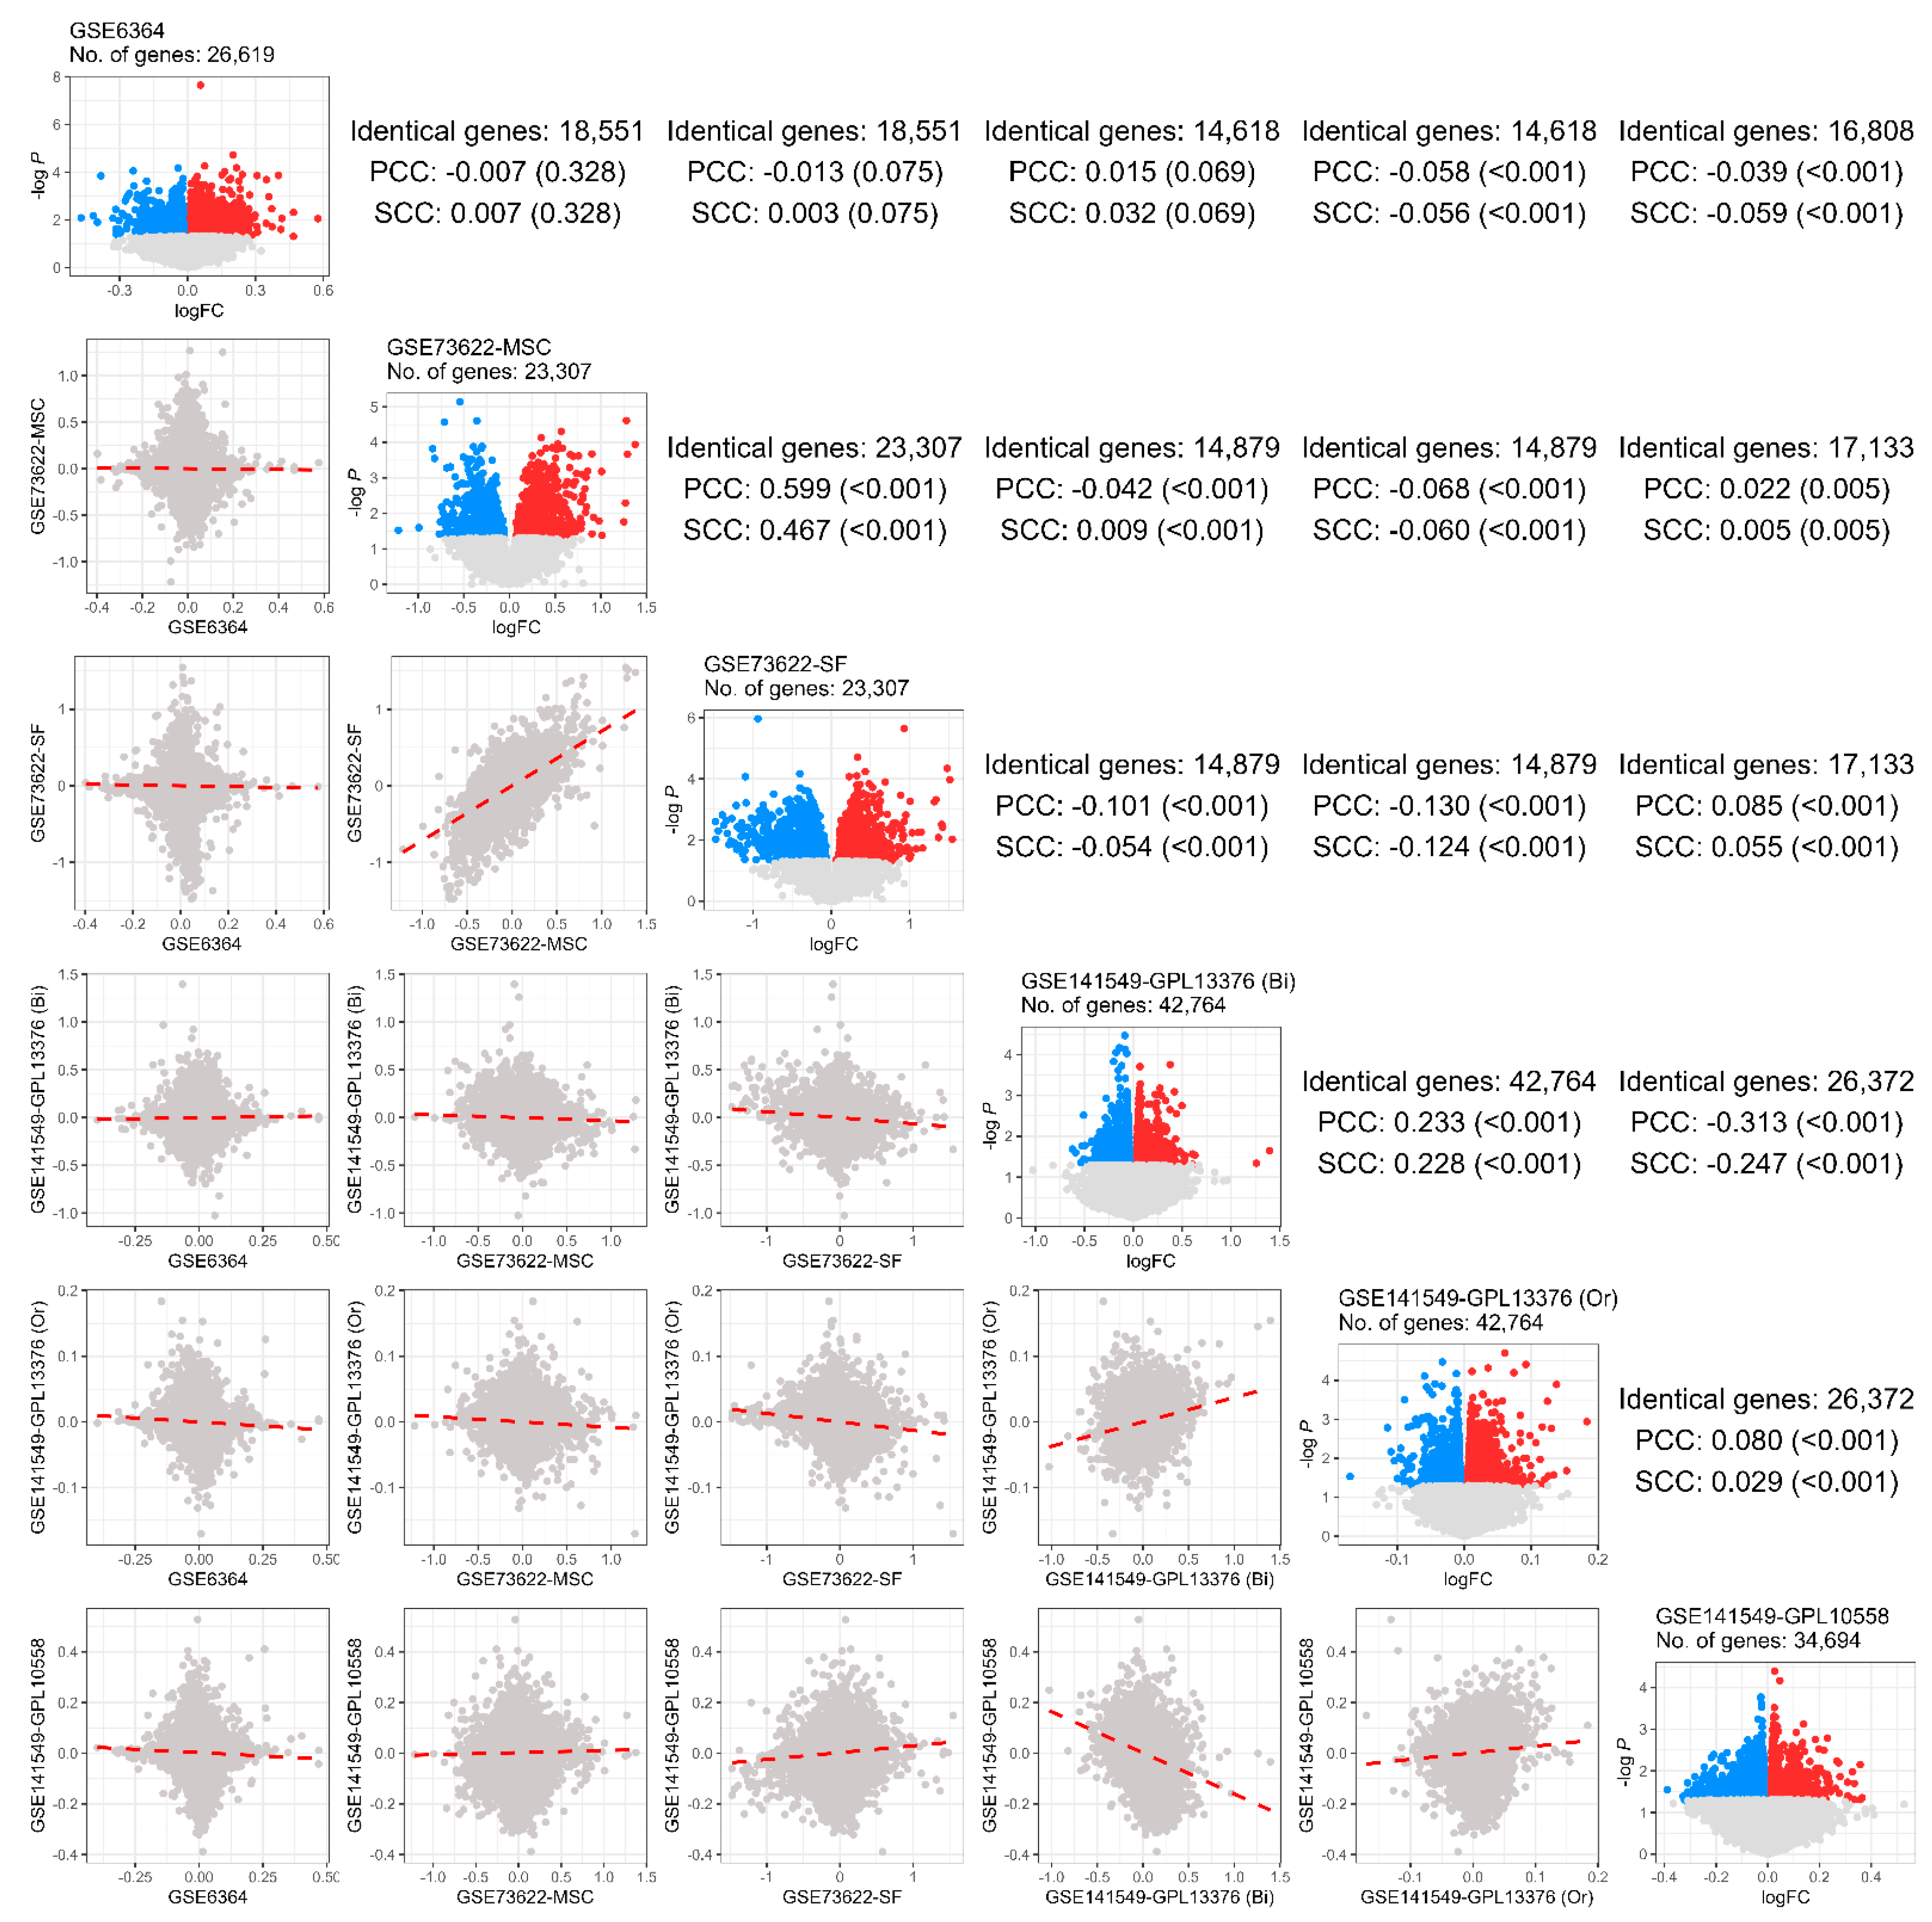
2.2. Differential Expression Analysis
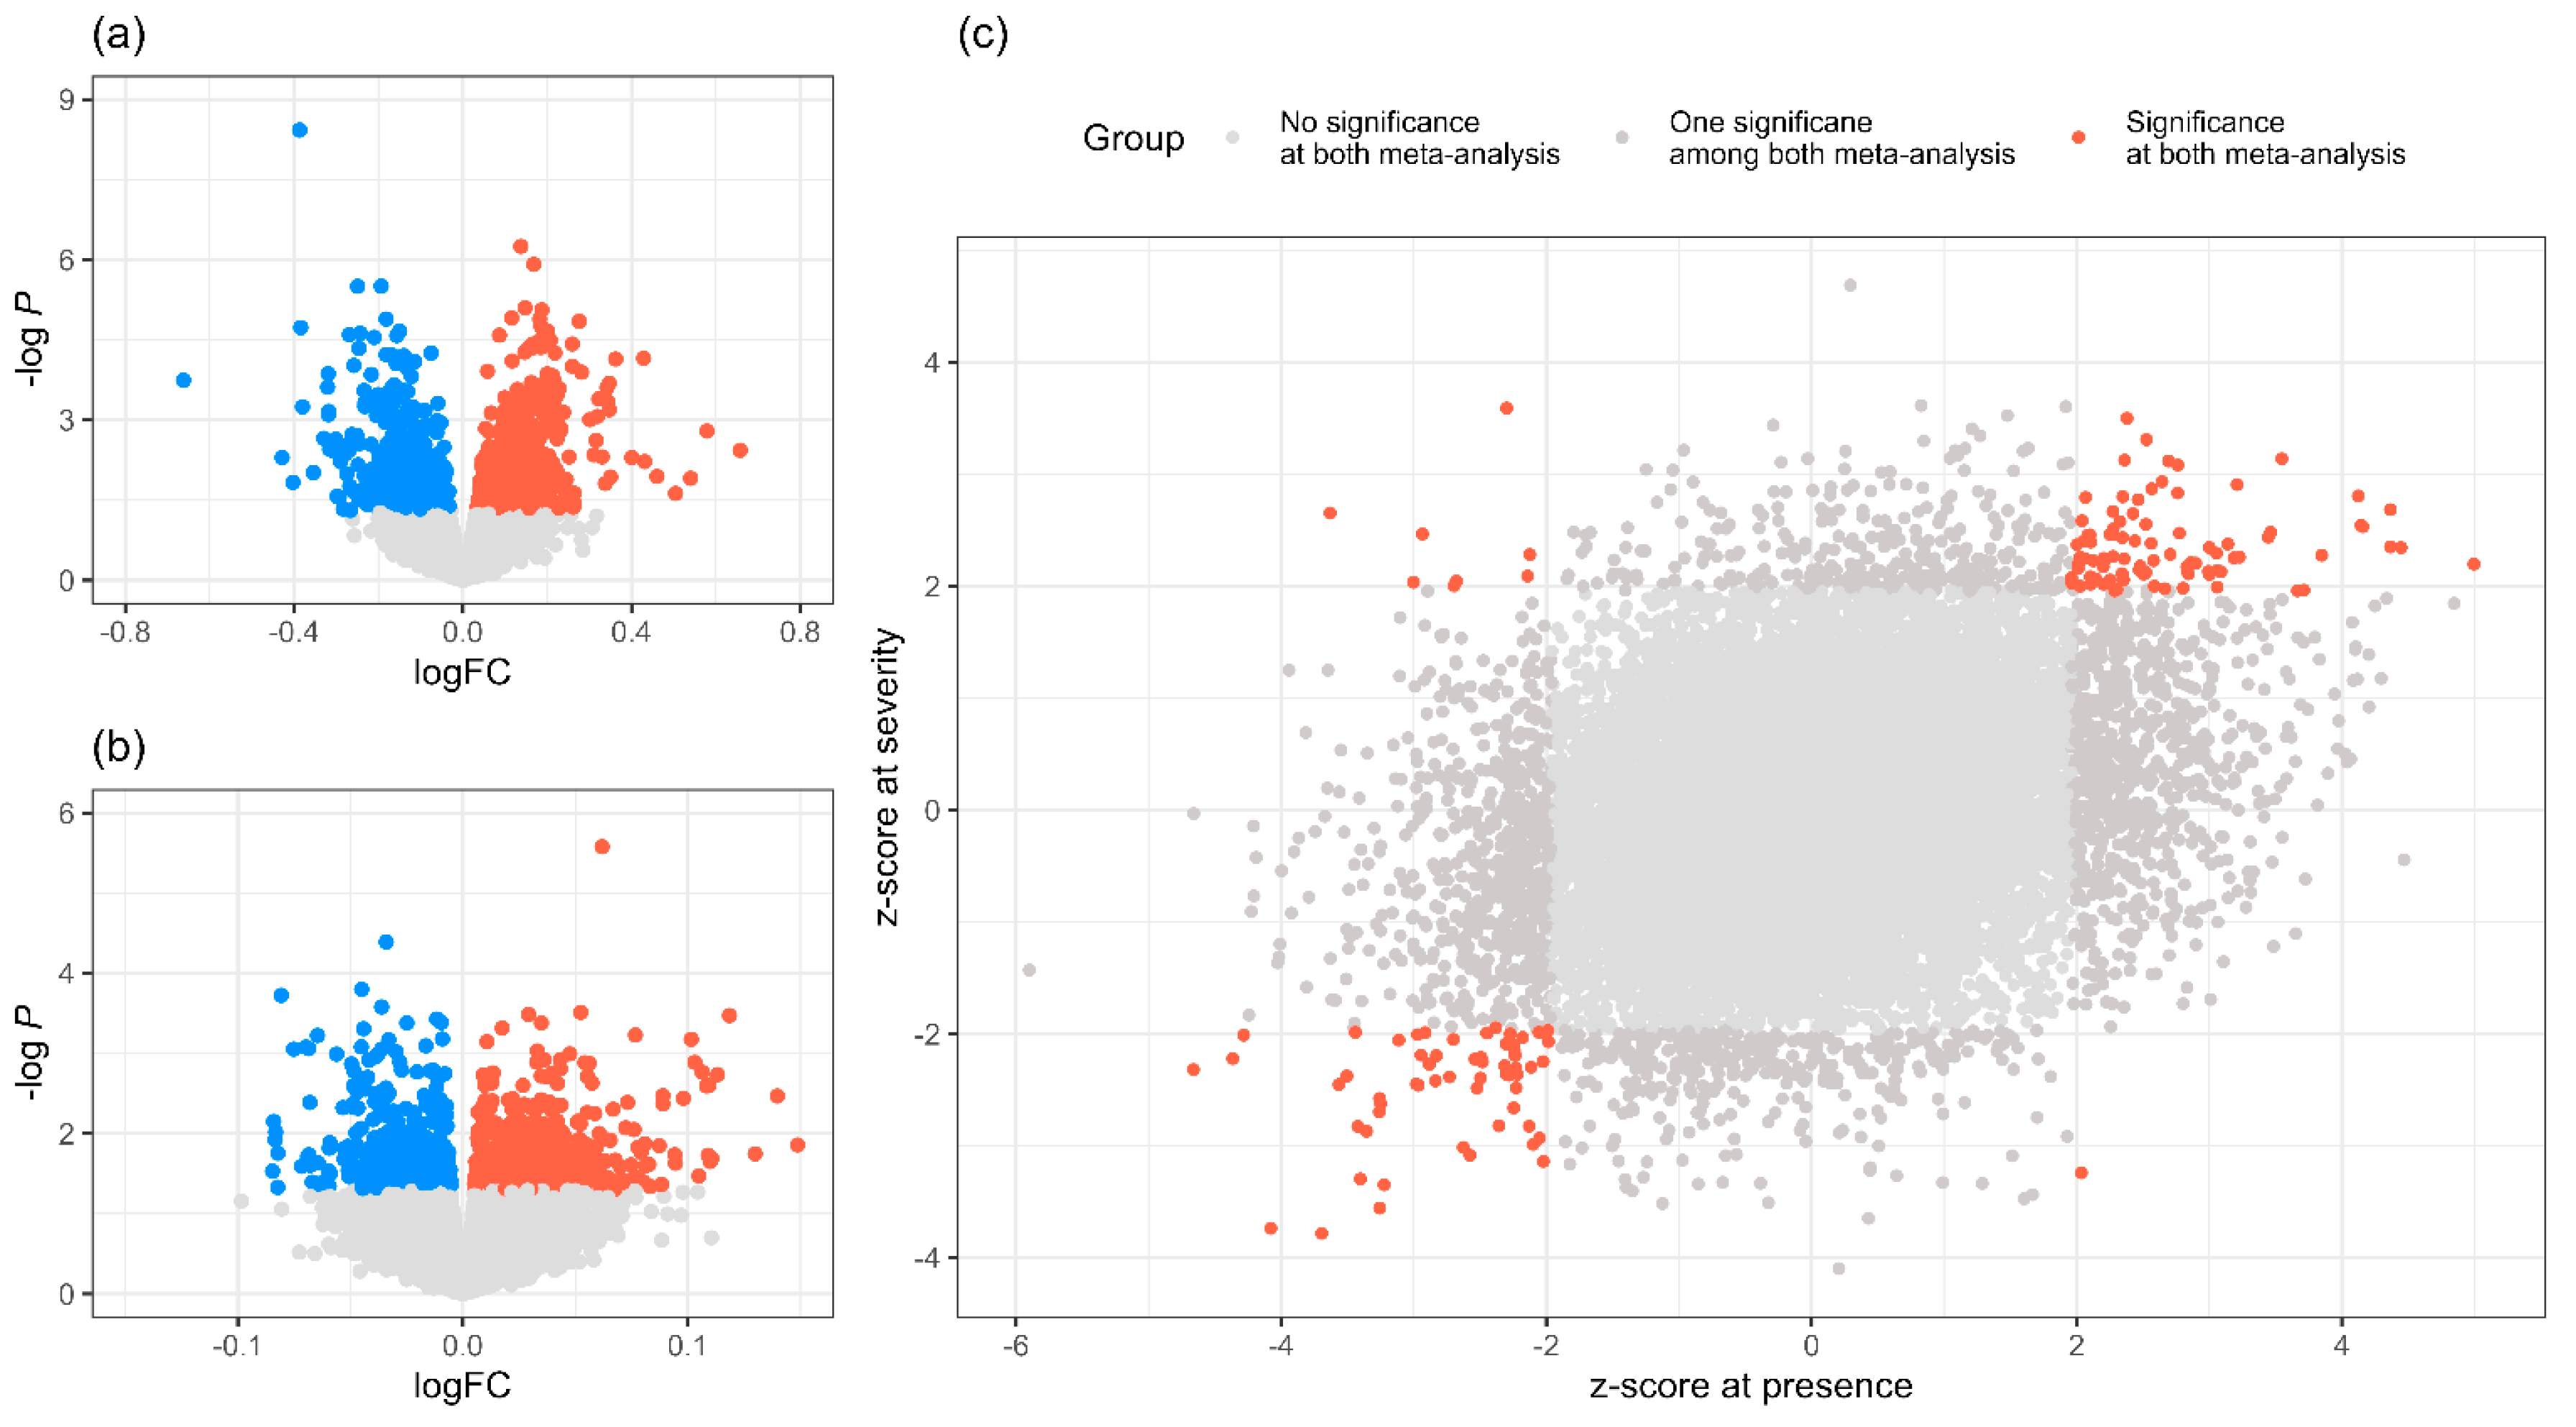
A laboratory medicine specialist conducted gene expression analyses across all five GSE datasets. Given that GSE6364 contains data with gene expression values exceeding 8,000, the analysis utilized log-transformed values. Each GSE sample was trimmed using the NormalizeQuantile. Trimmed data were subjected to principal component analysis (PCA) to identify any batch effects, and any identified batches were designated as confounders during the limma analysis [13].
GSE141549-GPL10558 and GSE141549-GPL13376 include the disease grade results for each patient. These two datasets can be used to analyze disease progression. To analyze the genes associated with endometriosis, we adjusted for GSE141549-GPL13376 and generated a binomial distribution for the patient-control groups instead of using continuous variables for disease grades. Consequently, the GSE6364, GSE73622-MSC, GSE73622-SF, and GSE141549-GPL13376 datasets acquired binomial distributions, allowing us to calculate fold-change (FC) values for the presence of endometriosis. Enrichment analyses were performed using Gene Ontology [14] and the Kyoto Encyclopedia of Genes and Genomes [15]. When common genes between differentially expressed genes (DEGs) and genes within the enrichment pathway were revealed, the false discovery rate (FDR) was calculated. A variety of pathways, including lipid metabolism, protein degradation, cell metabolism, and mRNA signaling (Figure S1–6), were identified in each GSE dataset.
Figure 2 compares the FC distribution across the five GSE datasets and the FC correlation for the same genes identified in the two GSE datasets. A positive FC correlation was observed only between the GSE73622-MSC and GSE73622-SF datasets, which used the same platform as the experimental group. However, GSE141549-GPL13376 and GSE141549-GPL10558, although both were sourced from endometriosis tissues of the same patients and used different platforms, showed a negative correlation in FC for the same observed genes. This difference, attributed to GSE141549-GPL13376 focusing on presence and GSE141549-GPL10558 focusing on severity, led us to separate the meta-analyses for presence and severity.

2.3. Meta-Analysis

The results of the meta-analysis for presence, which are based on binomial groups, cannot be directly used for the severity meta-analysis. However, by transforming the controls and patients into continuous groups with values of 0 and 1, respectively, they were included in the severity analysis. Additionally, the GSEs used for presence analysis were indirectly incorporated into the severity analysis. Each gene had log fold-change (logFC) and standard error (SE) data for each GSE, which were used to perform the meta-analysis using METAL based on the inverse variance-weighted average method (IVW) [16]. Analysis using METAL provided the z-scores and P for each gene. DEGs which p less than 0.05 were related to cellular responses and protein degradation through pathway enrichment analysis (Figure S7–8). Genes that were significant (P < 0.05) had a z-score absolute value greater than 1.96. Approximately, 160 genes had a z-score of less than 1.96 in both meta-analyses (Figure 3).

2.4. Bayesian Analysis of Endometriosis Severity Related Genes

For the 160 genes filtered by the P obtained from the meta-analyses results, Bayesian analysis was applied to identify endometriosis-related upstream genes. Based on a scoring matrix consisting of five types of prior knowledges: Genome wide association study (GWAS) for SNP-associated with the development of endometriosis [6]; human transcription factors (TFs) catalog that affect transcription of pathological genes [7]; SNP-associated with gene expression (eSNP) as known as expression quantitative trait loci (eQTL) that affect the amount of pathological protein expression [8]; DigSee from disease-gene database [9]; and interactome database containing protein-protein interactions (PPI) of proteins made from pathological genes with other proteins [10], the genes were scored based on the number of datasets in which they were included, and the confirmed genes with higher scores were selected as priority genes.
The final list contained 24 genes, with the highest priority PPARA and HLA-DQB1 genes colored in purple. Magenta was selected for three Bayesian datasets, including EP300, MAP2K6, ZC3HAV1, EIF2S1, VIM, ZNF436, and MRRF, and the green color was set for the next ranking including SETBP1, CEP152, TSPAN14, GNG5, BRD4, RPS11, GDI2, MAPK7, TXN, UTP15, ZNF134, ZNF304, ZNF786, ZNF24, and ZNF550. (Figure 4). Higher levels indicated a stronger association with the pathogenesis of endometriosis.

2.5. Correlation and Network Analysis

Pearson correlation analysis of the 24 genes was conducted based on the t-values identified from the six GSE datasets, and 21 gene pairs with P below 0.05 were identified (Figure 5b). This analysis revealed a major cluster consisting of 19 genes and several individual genes surrounding these clusters (Figure 5c). The major cluster was centered on HLA-DQB1 and ZNF24. In particular, HLA-DQB1 scored high in the Bayesian analysis (Figure 4). PPARA, which received the highest score in Bayesian analysis, was depicted as the surrounding gene paired with ZNF134 and UTP15. The ZNF family, which includes highly upstream genes (Figure 5a), lies together, whereas ZNF24 is mainly centered on HLA-DQB1.

3. Discussion

The treatment of endometriosis remains challenging even with the use of specific combinations of medical, surgical, and psychological approaches. Infiltration into various organs, including the uterus, ovaries, and pelvic reproductive organs as well as the rectosigmoid colon, bowel, peritoneum, and diaphragm, complicates management and contributes to high recurrence rates. Meta-analyses and systematic reviews have shown that pain recurs in 20.5% of cases at three years and 43.5% at five years, whereas the recurrence of lesions larger than 10 mm is reported in 9% and 28% of cases, respectively [12]. Severe forms of endometriosis, such as deep infiltrative endometriosis, cause chronic pelvic pain, dysmenorrhea, and dyspareunia, significantly reducing quality of life. It also leads to infertility, which affects women across multiple life stages [5]. As a chronic inflammatory disease with high recurrence rates, severe forms of endometriosis, including deep and extra-abdominal endometriosis, require new therapeutic approaches beyond the traditional medicosurgical treatments. Our analysis provides a novel perspective on the severe forms of endometriosis that continue to recur despite existing treatments, and offers an alternative understanding of this condition.
The comparative analysis of gene expression profiles between pathological and healthy tissues is a robust methodology that provides valuable insights into the underlying cellular processes implicated in the etiology of various diseases. This approach serves as the cornerstone for comprehending the molecular intricacies that drive pathological conditions [17]. Previous studies have analyzed the changes in gene expression associated with endometriosis using various microarray platforms. Some studies have compared gene expression between endometriotic lesions and normal endometrial tissues [18,19]. In certain studies, comparisons were made between gene expression in patients with endometriosis and healthy controls [20,21].
HLA-DQB1, also known as major histocompatibility complex class II DQ beta 1, is located on the short arm of chromosome 6 at position 21.31. Fagerberg et al. demonstrated that HLA-DQB1 was expressed at low levels in all tissues, particularly in the lungs, lymph nodes, and spleen [22]. Typically, specific genotypes of HLA-DQB1 been studied with respect to the development of autoimmune diseases [23,24]. However, a recent study by Xu et al. revealed that increased methylation of HLA-DQB1 is associated with rheumatoid arthritis [25]. In our study, Bayesian analysis was conducted following differential expression analysis, allowing for the identification of significant genes without determining whether they were upstream or downstream. This approach has yielded important insights, suggesting that endometriosis may also be classified as an autoimmune disease, indicating a significant achievement in understanding its pathogenesis.
PPARA, referred to as peroxisome proliferator-activated receptor alpha, is located on the long arm of chromosome 22 at position 13.31. Fagerberg et al. revealed that PPARA is weakly expressed in all organs, but high levels are observed in the kidney, heart, and small intestine [22]. The activation of PPARA is well-known to be associated with lipid metabolism [26], and lipid agonists are being explored for their therapeutic effects in various diseases based on this mechanism [27]. PPARA scored highly in the Bayesian analysis as a gene linked to obesity. In this study, PPARA was identified to be downstream of endometriosis. However, given that lipid metabolism has not been strongly associated with endometriosis, the connection between PPARA and endometriosis is thought to be more related to angiogenesis in endometriotic lesions, as recently reported by Pergialiotis et al. [28], rather than lipid metabolism.
The zinc finger protein family has been linked, either individually or collectively, to a variety of diseases, including adenocarcinoma, squamous cell carcinoma, and Parkinson's disease [29,30,31,32], highlighting the lack of a clearly defined pathogenic mechanism. However, in this study, several ZNF family members were identified upstream and formed part of the main cluster in the network analysis. Well-known genes such as HLA-DQB1 and PPARA, which seem unrelated, were found to be downstream, whereas genes from the ZNF family, for which the specific pathogenic mechanisms remain unknown, were upstream. This intricately woven network, in which seemingly disparate genes come together in a synergistic relationship, was revealed in this study. This suggests that endometriosis should be viewed from a completely new and different perspective than that of previous studies.

4. Materials and Methods

4.1. Pre-Processing

The expression values of the downloaded GSE datasets were adjusted to ensure that the maximum and minimum values were within a consistent range. When the maximum values were excessively large, log transformation was applied. Because a log transformation cannot be performed for negative values, an appropriate constant was added to all values to ensure that the minimum value was greater than zero before the transformation. The data were normalized to ensure that each sample exhibited a consistent distribution of expression values [13]. PCA was conducted to examine the clustering patterns of the samples and assess the relationship between various factors included in the sample information. Factors showing strong correlations were identified as potential confounders.

4.2. Differenctial Expression Analysis

After reviewing the sample information, patient and control groups were designated. For differential expression analysis, factors identified as confounders during preprocessing were incorporated into the model design, and the limma package was used for analysis [13]. The results provided FC between the patient and control groups for each gene, presented as log values. Additionally, P and t-values were analyzed. As the product of the t-value and SE equals logFC, the SE was manually calculated. P and logFC were used to generate volcano plots.

4.3. Meta-Analysis

The GSE6364, GSE73622-MSC, and GSE73622-SF datasets provide gene expression values for both healthy individuals and patients, allowing for binomial differential expression analysis. GSE141549-GPL13376 also included both healthy individuals and patients with the disease stage recorded, enabling both binomial and continuous differential expression analysis. GSE141549-GPL10558 included only patients, allowing for continuous differential expression analysis based on the disease stage. Meta-analysis of the presence of endometriosis was performed using four GSE datasets suitable for binomial analysis. For endometriosis severity, a meta-analysis was conducted by integrating two GSE datasets suitable for continuous differential expression analysis with the results of the endometriosis-presence meta-analysis. Because the present meta-analysis results pertained to the control and patient groups, they were reassigned as 0 and 1, respectively, and then transformed into a continuous scale for meta-analysis. A meta-analysis was conducted using previously obtained logFC and SE values from the METAL program [16]. p and z-scores were calculated for each gene.

4.4. Bayesian Analysis

Bayesian analysis was used to identify the upstream genes associated with endometriosis through evidence collection. The five databases used as evidence included GWAS, TFs, eQTL, DigSee, and PPIs.
The statistical summary related to endometriosis obtained from the GWAS catalog contained information regarding genetic variation by calculating the relationship between SNPs and disease occurrence using logistic regression [6]. This database identifies SNP-trait associations through literature searches, and then extracts reported traits, significant SNP-trait associations, and sample metadata.
The TF catalog was derived from the study by Lambert et al. [7], who identified human transcription factors and their functional characterization based on the important role of TFs as master regulators of chromatin and transcription. This database contains 2,765 genes for which proteins were examined manually by assembling lists of inferred TFs from multiple sources, and 1,639 genes were identified as actual TFs based on validated experiments.
Genomic variants in uterine tissues extracted using the gene expression quantification method at the transcriptomic level were retrieved from the eQTL catalog [8]. This database provides statistical results for cis-eQTLs, which indicate the association between gene expression and SNPs, calculated by linear regression.
DigSee is a search engine that applies text-mining methods to MEDLINE abstracts for cancer-related research on gene-disease interactions [9]. By entering the keyword endometriosis in the search engine, 847 disease-related genes were identified.
The PPI network information was acquired from the STRING database [10]. STRING is a large database and search engine that collects materials on functional associations from publicly accessible sources, such as individual high-throughput studies. Seven lines of evidence support STRING's use of public data as an information base: three prediction streams based on genomic contextual information, and one each for co-expression, text mining methods, experiment-based data, and previously curated pathway and protein complex knowledge.

4.5. Correlation and Network Analysis

Pearson's correlation analysis was conducted on the 24 upstream genes identified in the Bayesian analysis, using t-values from the six differential expression analyses (Figure 2) and z-scores from the two meta-analyses (Figure 3a and 3b). In the correlation analysis, only the top 5% and bottom 5% of the derived degrees were used to form the edges of each node, which were then applied to the network analysis.

5. Conclusions

Selecting specific genes and validating their pathophysiological roles in analyzing gene-disease associations requires extensive time and labor [33]. This study integrated the results from multiple gene expression studies and conducted differential analyses of gene presence in patient-control comparisons and severity associations in stage analysis. This approach systematically narrowed down 160 genes from over 20,000 based on evidence. Furthermore, Bayesian analysis was employed to identify upstream genes. The regulatory genes identified through this process demonstrated substantial statistical significance from the perspective of data analytics. Although experimental validation of the roles of these genes in disease development is still required, this study established a strong foundation by identifying key genes for future research, making a significant contribution to the field.

Supplementary Materials

The following supporting information can be downloaded at the website of this paper posted on Preprints.org. Figure S1: Cell signaling pathways of differentially expressed genes (DEGs) at GSE6364; Figure S2: Cell signaling pathways of differentially expressed genes (DEGs) at GSE73622-MSC; Figure S3: Cell signaling pathways of differentially expressed genes (DEGs) at GSE73622-SF; Figure S4: Cell signaling pathways of differentially expressed genes (DEGs) at GSE141549-GPL13376 (Bi); Figure S5: Cell signaling pathways of differentially expressed genes (DEGs) at GSE141549-GPL13376 (Or); Figure S6: Cell signaling pathways of differentially expressed genes (DEGs) at GSE141549-GPL10558; Figure S7: Cell signaling pathways of differentially expressed genes (DEGs) at endometriosis presence meta-analysis; Figure S8: Cell signaling pathways of differentially expressed genes (DEGs) at endometriosis presence meta-analysis.

Author Contributions

Conceptualization, J. K. and T. L.; Methodology, T. L., S. H. and K.A.; Validation, K.A. and J. O.; formal analysis, T. L.; investigation, K.A.; resources, J. K. and S. J. C.; data curation, J. K. and T. L.; writing—original draft preparation, J. K. and T. L.; writing—review and editing, K.A., J. K., and J. O.; visualization, K.A.; supervision, S. J. C.; project administration, Y. U. All authors have read and agreed to the published version of the manuscript.

Funding

This study received no external funding.

Institutional Review Board Statement

Not applicable.

Informed Consent Statement

Not applicable.

Data Availability Statement

The data presented in this study are available in Gene Expression Omnibus (GEO) at https://www.ncbi.nlm.nih.gov/geo/, reference number GSE6364, GSE73622, GSE141549. These data were derived from the following resources available in the public domain: https://www.ncbi.nlm.nih.gov/geo/query/acc.cgi?acc=gse6364; https://www.ncbi.nlm.nih.gov/geo/query/acc.cgi?acc=gse73622; https://www.ncbi.nlm.nih.gov/geo/query/acc.cgi?acc=gse141549.

Acknowledgments

None.

Conflicts of Interest

The authors declare no conflict of interest.

References

  1. Giudice, L.C.; Kao, L.C. Endometriosis. Lancet 2004, 364, 1789–1799. [Google Scholar] [CrossRef] [PubMed]
  2. Raja, M.H.R; Farooqui, N.; Zuberi, N.; Ashraf, M.; Azhar, A.; Baig, R.; Badar, B.; Rehman, R. Endometriosis, infertility and MicroRNA's: a review. J. Gynecol. Obstet. Hum. Reprod. 2021, 50, 102157. [Google Scholar] [CrossRef] [PubMed]
  3. Sampson, J.A. Peritoneal endometriosis due to the menstrual dissemination of endometrial tissue into the peritoneal cavity. Am. J. Obstet. Gynecol. 1927, 14, 422–469. [Google Scholar] [CrossRef]
  4. Burney, R.O.; Giudice, L.C. Pathogenesis and pathophysiology of endometriosis. Fertil. Steril. 2012, 98, 511–519. [Google Scholar] [CrossRef] [PubMed]
  5. Horne, A.W.; Missmer, S.A. Pathophysiology, diagnosis, and management of endometriosis. BMJ 2022, 379, e070750. [Google Scholar] [CrossRef]
  6. Backman, J.D.; Li, A.H.; Marcketta, A.; Sun, D.; Mbatchou, J.; Kessler, M.D.; Benner, C.; Liu, D.; Locke, A.E.; Balasubramanian, S.; et al. Exome sequencing and analysis of 454,787 UK Biobank participants. Nature 2021, 599, 628–634. [Google Scholar] [CrossRef]
  7. Lambert, S.A.; Jolma, A.; Campitelli, L.F.; Das, P.K.; Yin, Y.; Albu, M.; Chen, X.; Taipale, J.; Hughes, T.R.; Weirauch, M.T. The human transcription factors. Cell 2018, 172, 650–665. [Google Scholar] [CrossRef]
  8. Lonsdale, J.; Thomas, J.; Salvatore, M.; Phillips, R.; Lo, E.; Shad, S.; Hasz, R.; Walters, G.; Garcia, F.; Young, N.; et al. The Genotype-Tissue Expression (GTEx) project. Nat. Genet. 2013, 45, 580–585. [Google Scholar] [CrossRef]
  9. Kim, J.; Kim, J.-J.; Lee, H. An analysis of diease-gene relationship from Medline abstracts by DigSee. Sci. Rep. 2017, 7, 40154. [Google Scholar] [CrossRef]
  10. Szklarczyk, D.; Kirsch, R.; Koutrouli, M.; Nastou, K.; Mehryary, F.; Hachilif, R.; Gable, A.L.; Fang, T.; Doncheva, N.T.; Pyysalo, S.; et al. The STRING database in 2023: protein-protein association networks and functional enrichment analyses for any sequenced genome of interest. Nucleic Acids Res. 2023, 51, D638–D646. [Google Scholar] [CrossRef]
  11. Szaflik, T.; Romanowicz, H.; Szyłło, K; Kołaciński, R.; Michalska, M.M.; Samulak, D.; Smolarz, B. Analysis of long non-coding RNA (lncRNA) UCA1, MALAT1, TC0101441, and H19 expression in endometriosis. Int. J. Mol. Sci. 2022, 23, 11583. [CrossRef]
  12. Bozdag, G. Recurrence of endometriosis: risk factors, mechanisms and biomarkers. Womens Health (Lond) 2015, 11, 693–699. [Google Scholar] [CrossRef] [PubMed]
  13. Lee, T.; Hwang, S.; Seo, D.M.; Shin, H.C.; Kim, H.S.; Kim, J.-Y.; Uh, Y. Identification of cardiovascular disease-related genes based on the co-expression network analysis of genome-wide blood transcriptome. Cells 2022, 11, 2867. [Google Scholar] [CrossRef] [PubMed]
  14. The Gene Ontology Consortium, The gene ontology resource: 20 years and still GOing strong. Nucleic Acids Res. 2019, 47, D330–D338. [CrossRef] [PubMed]
  15. Kanehisa, M.; Goto, S. KEGG: Kyoto Encyclopedia of Genes and Genomes. Nucleic Acids Res. 2000, 28, 27–30. [Google Scholar] [CrossRef]
  16. Willer, C.J.; Li, Y.; Abecasis, G.R. METAL: fast and efficient meta-analysis of genomewide association scans. Bioinformatics 2010, 26, 2190–2191. [Google Scholar] [CrossRef]
  17. Trevino, V.; Falciani, F.; Barrera-Saldaña, H.A. DNA microarrays: a powerful genomic tool for biomedical and clinical research. Mol. Med. 2007, 13, 527–541. [Google Scholar] [CrossRef]
  18. Borghese, B.; Mondon, F.; Noël, J.-C.; Fayt, I.; Mignot, T.-M.; Vaiman, D.; Chapron, C. Gene expression profile for ectopic versus eutopic endometrium provides new insights into endometriosis oncogenic potential. Mol. Endocrinol. 2008, 22, 2557–2562. [Google Scholar] [CrossRef]
  19. Hever, A.; Roth, R.B.; Hevezi, P.; Marin, M.E.; Acosta, J.A.; Acosta, H.; Rojas, J.; Herrera, R.; Grigoriadis, D.; White, E.; et al. Human endometriosis is associated with plasma cells and overexpression of B lymphocyte stimulator. Proc. Natl. Acad. Sci. U. S. A. 2007, 104, 12451–12456. [Google Scholar] [CrossRef]
  20. Tamaresis, J.S.; Irwin, J.C.; Goldfien, G.A.; Rabban, J.T.; Burney, R.O.; Nezhat, C.; DePaolo, L.V.; Giudice, L.C. Molecular classification of endometriosis and disease stage using high-dimensional genomic data. Endocrinology 2014, 155, 4986–4999. [Google Scholar] [CrossRef]
  21. Zhao, L.; Gu, C.; Ye, M.; Zhang, Z.; Han, W.; Fan, W.; Meng, Y. Identification of global transcriptome abnormalities and potential biomarkers in eutopic endometria of women with endometriosis: a preliminary study. Biomed. Rep. 2017, 6, 654–662. [Google Scholar] [CrossRef] [PubMed]
  22. Fagerberg, L.; Hallström, B.M.; Oksvold, P.; Kampf, C.; Djureinovic, D.; Odeberg, J.; Habuka, M.; Tahmasebpoor, S.; Danielsson, A.; Edlund, K.; et al. Analysis of the human tissue-specific expression by genome-wide integration of transcriptomics and antibody-based proteomics. Mol. Cell Proteomics 2014, 13, 397–406. [Google Scholar] [CrossRef] [PubMed]
  23. Miyadera, H. , Tokunaga, K. Associations of human leukocyte antigens with autoimmune disease: challenges in identifying the mechanism. J. Hum. Genet. 2015, 60, 697–702. [Google Scholar] [CrossRef] [PubMed]
  24. Ramgopal, S.; Rathika, C.; Malini, R.P.; Murali, V.; Arun, K.; Balakrishnan, K. Critical amino acid variations in HLA-DQB1* molecules confers susceptibility to autoimmune thyroid disease in south India. Genes. Immun. 2019, 20, 32–38. [Google Scholar] [CrossRef] [PubMed]
  25. Xu, J.; Chen, H.; Sun, C.; Wei, S.; Tao, J.; Jia, Z.; Chen, X.; Lv, W.; Lv, H.; Tang, G.; et al. Epigenome-wide methylation haplotype association analysis identified HLA-DRB1, HLA-DRB5 and HLA-DRB1 as risk factors for rheumatoid arthritis. Int. J. Immunogenet. 2023, 50, 291–298. [Google Scholar] [CrossRef]
  26. Seitz, H.K. , Moreira, B., Neuman, M.G. Pathogenesis of alcoholic fatty liver a narrative review. Life (Basel) 2023, 13, 1662. [Google Scholar] [CrossRef]
  27. Wang, N.; Zhao, Y.; Wu, M.; Li, N.; Yan, C.; Guo, H.; Li, Q.; Li, Q.; Wang, Q. Gemfibrozil alleviates cognitive impairment by inhibiting ferroptosis of astrocytes via restoring the iron metabolism and promoting antioxidant capacity in type 2 diabetes. Mol. Neurobiol. 2024, 61, 1187–1201. [Google Scholar] [CrossRef]
  28. Pergialiotis, V.; Frountzas, M.; Fasoulakis, Z.; Daskalakis, G.; Chrisochoidi, M.; Kontzoglou, K.; Perrea, D.N. Peroxisome proliferator-activated receptor alpha (PPAR-α) as a regulator of the angiogenic profile of endometriotic lesions. Cureus 2022, 14, e22616. [Google Scholar] [CrossRef]
  29. Zhu, L.; Tu, D.; Li, R.; Li, L.; Zhang, W.; Jin, W.; Li, T.; Zhu, H. The diagnostic significance of the ZNF gene family in pancreatic cancer: a bioinformatics and experimental study. Front. Genet. 2023, 14, 1089023. [Google Scholar] [CrossRef]
  30. Jia, D.; Li, L.; Wang, P.; Feng, Q.; Pan, X.; Lin, P.; Song, S.; Yang, L.; Yang, J. ZNF24 regulates the progression of KRAS mutant lung adenocarcinoma by promoting SLC7A5 translation. Front. Oncol. 2022, 12, 1043177. [Google Scholar] [CrossRef]
  31. Wang, Z.; Sun, A.; Yan, A.; Yao, J.; Huang, H.; Gao, Z.; Han, T.; Gu, J.; Li, N.; Wu, H.; et al. Circular RNA MTCL1 promotes advanced laryngeal squamous cell carcinoma progression by inhibiting C1QBP ubiquitin degradation and mediating beta-catenin activation. Mol. Cancer 2022, 21, 92. [Google Scholar] [CrossRef] [PubMed]
  32. Santiago, J.A.; Potashkin, J.A. Evaluation of RNA blood biomarkers in individuals at risk of Parkinson's disease. J. Parkinsons Dis. 2017, 7, 655–660. [Google Scholar] [CrossRef] [PubMed]
  33. Strande, N.T.; Riggs, E.R.; Buchanan, A.H.; Ceyhan-Birsoy, O; DiStefano, M.; Dwight, S.S.; Goldstein, J.; Ghosh, R.; Seifert, B.A.; Sneddon, T.P.; et al. Evaluating the clinical validity of gene-disease associations: an evidence-based framework developed by the clinical genome resource. Am. J. Hum. Genet. 2017, 100, 895–906. [CrossRef]
Figure 1. Scheme for identification of genes associated with endometriosis. (STEP 1) A multi-disciplinary team including obstetrics and gynecology doctors, bioinformatics experts, and laboratory medicine doctors conducted literature and database reviews to select candidate transcriptome datasets related to endometriosis. The GSE6364 dataset analyzed gene expression in endometrial tissues from control groups and patients with moderate-to-severe endometriosis (indicated by red arrows). Similarly, GSE73622 differentiated endometrial mesenchymal stem cells and endometrial stromal fibroblasts) from the endometrial tissue using progesterone to analyze gene expression (indicated by green arrows). GSE141549 examined endometrial and peritoneal tissues as well as various lesions in the peritoneal cavity of patients with endometriosis and healthy women (indicated by yellow arrows). (STEP 2) The algorithm conducts a differential expression analysis on datasets from the three GSE studies. A meta-analysis using the inverse variance-weighted method identified genes that were ultimately associated with endometriosis. (STEP 3) Bayes method is implemented to identify the endometriosis upstream genes using five lines of external evidences: 1) genome-wide association studies (GWAS) on single nucleotide polymorphism (SNP) associated with disease occurrence [6]; 2) transcription factors (TF) affecting the transcription (T) of pathological genes [7], which identifies genes related to pathophysiology; 3) expression quantitative trait loci (eQTL) reflecting the expression of SNP related to pathological proteins [8]; 4) disease-gene database as known as DigSee [9]; and 5) protein-protein interaction (PPI) data showing interactions between pathological proteins (P) and other proteins (Pr) [10].
Preprints 141002 g001
Figure 2. Comparison of global endometriosis-related signatures among five transcriptomic datasets. Volcano plots placed in the diagonal panels indicate cohort-specific endometriosis-related signatures (FC between two conditions or among three statuses). The specified order of GSE datasets: GSE6364, GSE73622-MSC, GSE73622-SF, GSE141549-GPL13376, and GSE141549-GPL10558 was followed, with volcano plots from differential analysis for each dataset arranged diagonally in the center. In the volcano plots, dots represent genes, with those having a P of 0.05 or higher shown in pale gray. Among the significant genes, red indicates upregulated genes, while blue means downregulated genes. Values placed in the upper triangle panels indicate the degree of correlation matched with the lower triangle plots evaluated by PCC and SCC. The P for each correlation coefficient appear in parentheses. A gray dot of correlational plots located in lower triangle panels denotes a single identical gene contained in both gene expression datasets, and the matched red dashed line describes the correlation between two dataset obtained from linear regression. Abbreviations, FC, fold-change; MSC, mesenchymal stem cell; SF stromal fibroblast; PCC, Pearson’s correlation coefficient; SCC, Spearman’s correlation coefficient; Bi, binomial; Or, ordinal.
Preprints 141002 g002
Figure 3. Identification of the endometriosis-related genes based on meta-analysis (a) The IVW-based meta-analysis combined the four lists of global FC between the presence and absence of endometriosis of four gene expression datasets (GSE6364, GSE73622-MSC, GSE73622-SF, and GSE141549-GPL13376). (b) The IVW combined the two lists of endometriosis severity-related signatures (GSE141549-GPL13376 and GSE141549-GPL10558) with the meta-analyzed FC related to endometriosis presence (Figure 3a). (c) A Scatter plot indicates the comparison of meta-analyzed z-scores between presence and severity. A point represents an individual gene, and red points (about 160 genes) denote cases having 1.96 or more z-scores in both binomial (x-axis) and step-wise (y-axis) statuses. Abbreviations: IVW, inverse variance-weighted average method; FC, fold-change.
Preprints 141002 g003
Figure 4. Identification of regulators related to endometriosis based on Bayesian approach. Cells placed on the upper panel indicate candidate regulators. The colors of each cell are determined based on the strength of external evidence. Cells on the lower panel indicate the prior knowledge section of the Bayesian approach. The prior knowledge includes multiple lines of external evidence, including endometriosis-related SNPs (GWAS) [6], the human TF catalog [7], uterus eSNP (eQTL) [8], disease-gene database (DigSee) [9], and interactome database [10]. Abbreviations: SNP, single nucleotide polymorphism; GWAS, genome-wide association study; TF, transcription factor; eSNP, SNP associated gene expression; eQTL, expression quantitative trait loci.
Preprints 141002 g004
Figure 5. Identification of network patterns among the 24 upstream endometriosis meta genes. (a) The first and second rows represent the z-score calculated by IVW in METAL [10]. The z-scores in the first and second rows are the meta-analyzed combined endometriosis presence and severity signatures, respectively. The order of genes was determined by calculating the average of two z-scores. The third to sixth rows reveal notable binomial distribution (Bi) of endometriosis presence. The seventh to eighth rows show significant ordinal distribution (Or) of endometriosis severity. (b) Colors, direction, density, and shape were colored differently according to Pearson’s Correlation Coefficient (PCC) values between the upstream meta genes. *, **, and *** indicate P less than 0.05, 0.01, 0.001, respectively. (c). Gene network is constructed based on the PCC matrix (Figure 5b) and cut-off (P < 0.05). Red, Orange, yellow, and khaki points indicate genes having 4 or more, 3, 2, and 1 or less of the number of interactions, respectively. The size of gene labels varies according to their significance. The color of the edges is determined by the PCC, with positive values shown in pink and negative values in skyblue, while smaller P results in thicker edges.
Preprints 141002 g005
Disclaimer/Publisher’s Note: The statements, opinions and data contained in all publications are solely those of the individual author(s) and contributor(s) and not of MDPI and/or the editor(s). MDPI and/or the editor(s) disclaim responsibility for any injury to people or property resulting from any ideas, methods, instructions or products referred to in the content.
Copyright: This open access article is published under a Creative Commons CC BY 4.0 license, which permit the free download, distribution, and reuse, provided that the author and preprint are cited in any reuse.
Prerpints.org logo

Preprints.org is a free preprint server supported by MDPI in Basel, Switzerland.

Subscribe

Disclaimer

Terms of Use

Privacy Policy

Privacy Settings

© 2025 MDPI (Basel, Switzerland) unless otherwise stated