
Submitted:
26 November 2024
Posted:
27 November 2024
You are already at the latest version
Abstract
The sensitivity of the agricultural production system to short- and long-term climate variations significantly affects the availability and prices of food resources, raising relevant issues of sustainability and food security. To evaluate the vulnerability of crop yield to climate fluctuations and to determine whether it changes over time, we conducted a statistical analysis focusing on one of the main crops in the Abruzzo region (central Italy): grape. The study spans the four provinces of Abruzzo and involves the analysis of temperature, precipitation and grape yield over the sixty-year period from 1952 to 2014. Our findings reveal a climatic trend in the region, shifting from temperate to temperate-arid conditions, along with an increasing correlation between crop yield and climatic fluctuations. This suggests a rising sensitivity of the agricultural productive system to climate fluctuations over time. Despite progressively growing yields in the agricultural production system, the increase in sensitivity to climatic fluctuations indicates an inability to maintain high performance under unfavorable climatic conditions. On the other hand, yield fluctuations consistently pose a potential threat to market equilibria.
Keywords:
Climate variations
; Crop yield
; Climatic trend
; Correlation analysis
; Climate adaptation
; Sustainability
1. Introduction
Short- and long-term climate variations raise important sustainability issues, due to their potential economic and social impacts. These impacts are related to fluctuations in agricultural yields, volatility in prices and production costs of essential food resources, affecting their availability to the population [1,2,3,4]. In this context, studying local climate is crucial for effective management of the agricultural production sector.
The Mediterranean region, including Italy, is particularly vulnerable to current and future climate changes due to its transitional position between warm and temperate climates and its complex orography [5,6,7,8]. In central Italy, several studies have identified climate trends associated with significant increases in average and extreme temperatures [9,10,11,12]. Among the various indices used to describe climatic conditions [13,14,15,16], the Standardized Precipitation Index (SPI) and the Standardized Precipitation Evapotranspiration Index (SPEI) are among the most frequently utilized [17]. Recent studies have analyzed the correlations of these indices with anomalies in crop yields in different regions of the world [18,19,20,21,22,23,24].
While numerous studies have examined the long-term interactions between climate variations and crop production, including the role of carbon emissions from land use [25] and climate adaptation strategies [26,27,28,29,30], the impacts of short-term climate fluctuations on agricultural systems, and their variation over time, have received less attention. While studies like Mazhar et al. [31] and Ostberg et al. [32] have explored this topic, the time-varying sensitivity of agricultural systems to climate change and its implications for price stability remain understudied. A few notable exceptions include Tran et al. [33], who investigated the effects of year-to-year climate variability on agricultural commodity prices in a competitive market, and Iizumi and Ramankutty [34], who examined the impact of climate change on crop yield variability. Similarly, Segerstrom [35] analyzed the volatility of coffee prices in relation to climate change. However, the literature on this topic remains limited. To address this gap, further research is needed to explore the temporal dynamics of short-term climate fluctuations on crop yields and develop standardized methods for monitoring the response of agricultural systems. Ultimately, these monitoring techniques could be extended to probabilistic forecasting of yields and market prices.
In the present study, we carried out a statistical analysis involving grape yield and climatic time series to identify changes in the sensitivity of the agricultural production system to climate variability over time. In studying the response of the crop production system to climate fluctuations, it is important to consider that such system is characterized by a complex interplay of ecosystem, technical and engineering solutions, and economic variables (Figure 1). In the event of unfavorable climatic conditions, a series of technical solutions (e.g., irrigation, frost protection, etc.) may be implemented to mitigate the negative effects and optimize yield, albeit at a cost. However, these technologies may not always be sufficient to achieve desired crop yield targets, and their use depends on an economic viability assessment. The crop production system can be viewed as a dynamic system constituted by three sub-systems (Figure 1): (i) land ecosystem (LE), (ii) interventions (INT) and (iii) economic viability condition (EC). The input is a climatic variable, described by an opportune index, which provides the input I1, and the output is the crop yield value. I1 is the input for the sub-systems LE and INT. The EC sub-system produces a second input (I2) for LE, which is intentionally anticorrelated with I1, in order to minimize the effects of unfavorable climatic conditions and optimize the output.
Therefore, our analysis studies the agricultural production system as it presents itself, i.e., inclusive of all ecosystem-related, technological and financial variables. Here we analyze only the input (climate indices) and output (agricultural yield) variables of this system. In other words, the production system is studied here according to a black-box model, i.e., in terms of input-output relationships, while the existence and interactions of other state variables are acknowledged, but these are not quantified.
The effects of climate change on agricultural systems are complex and highly variable, depending on factors such as region, farming system and specific crop. Moreover, the primary drivers of yield variability–whether it's mean values, variability, or extremes of temperature and precipitation–are often not known a priori (e.g., [3]). Additionally, impacts can be both direct and indirect, with the latter including effects such as pest outbreaks and disease propagation [3].
This study contributes to a broader research project that investigates the relationships between climate variables and agricultural yields at the provincial scale for key crops in the Abruzzo region (central Italy), including wheat, olive, and grape [23,24]. While Guerriero et al. [24] conducted a detailed regression analysis between climate indices and wheat yields, pointing out a sensitivity trend over time, this study focuses on grape production. Comparing these two crops is particularly interesting given their distinct market dynamics. Wheat, primarily used for basic food products, is traded on global markets. In contrast, grapes are often associated with high-quality local products (e.g., wine), with prices influenced by factors such as varietal characteristics and regional reputation. This study lays the groundwork for future research on the impact of climate variability on market prices. Given the unique characteristics of grape varieties in the study area, analyzing grape production can provide valuable insights into the relationship between climate and market prices.,
To address these research questions about the impact of short-term climatic fluctuations on grape production, we conducted a correlation analysis between climate indices (SPI and SPEI on one, three and sux months, estimated for different months of the year) and grape yield deviations from expected values over the period 1952-2014. Our analysis aims to (i) identify trends in correlation with specific climate indices, which can be interpreted as changes in system sensitivity, (ii) determine the most influential climate indices over time and so (iii) pinpoint the most sensitive phenological stages, and (iv) provide a comprehensive picture of the effectiveness of climate adaptation strategies in the Abruzzo grape production system.
2. Materials and Methods
2.1. The study area
The study area includes the four provinces of the Abruzzo region, which covers approximately 11,000 km2 in central Italy (Figure 2). This region is characterized by a Mediterranean climate with a marked areal variability, due to its complex geomorphological settings. Such structure is the result of a tectonic activity that peaked in the Neogene and is still ongoing, accompanied by intense seismic activity and ground deformation [36,37], which has conferred an orography characterized by alternating mountain chains and valleys, oriented NW-SE [38]. Consequently, Abruzzo spans a wide range of altitudes, from coastal to high mountain environments, which can be distinguished in: (i) the internal mountainous belt, presenting complex orography (Figure 2) and characterized by various micro-climates, with a prevalent continental climate, showing hot summers and cold winters; (ii) the external hilly and coastal strip (Figure 2), characterized by a more uniform mediterranean climate, with hot summers and mild winters. The provinces of Chieti, Teramo and Pescara include both coastal and internal hilly and mountainous areas. The Province of L'Aquila is the most inland and exhibits a more complex geomorphological structure and a wider distribution of climates.
The region studied has a well-developed agricultural sector, which has seen significant increases in crop yields and production over the past sixty years. Crop production is concentrated in the coastal areas and inland plains. Abruzzo exports agricultural products such as grape, olive and wheat, as well as high-price processed products such as olive oil and wine. Grape production is primarily concentrated in the province of Chieti, which accounts for about three-quarters of the total regional production.
The statistical analysis of grape production can provide valuable information into the interaction between climate and the production system, providing insights for optimizing investments under unfavorable climatic conditions.
2.2. The utilized data set
The climate analysis presented in this study is based on time series of daily and monthly termo-pluviometric data, provided by the official publications of Regional Hydrographic Services [39,40], recorded in 37 stations appropriately selected and uniformly distributed across the regional territory, covering the period from 1952 to 2014.
2.3. Statistical anaysis
Based on the climatic data, the following analyses were carried out: (i) climate classification using Péguy climographs, (ii) calculation of SPI and SPEI indices, over the studied time range (1952-2014), at one, three and six months, for different months of the year, and (iii) correlation analysis between these indices and grape production in the Chieti province.
The Péguy classification has been carried out over two thirty years’ time ranges, 1952-1982 and 1983-2014, in consideration of different trend patterns in termo-pluviometric and crop yield data [23].
Variations in crop yields over time depend on various factors beyond climate, such as new management practices, mechanization, etc., which have led to an overall yield increase in recent decades. To isolate the variation due to climate, detrended and standardized values were calculated for yields (e.g., [19]). Detrending consists in considering, for each annual yield value, the difference (or residual) of detected value compared to that associated with a linear regression line (i.e., trend), defined in the thirty-year period (1952-1982 or 1983-2014) to which it belongs. From these residuals, the Standardized Yield Residual Series (SYRS) is obtained:
where r represents the residual, m is the mean of the residuals and s is their standard deviation. Note that the use of the standardized variable does not imply the assumption of a particular probability distribution (e.g., Normal), but represents here only a convenient method of producing dimensionless data.
SYRS = (r – m) / s,
We then conducted several time series regression analyses for the Chieti province, comparing the grape SYRS with monthly, quarterly, and semi-annual SPI and SPEI indices, calculated over the months of the year going from March to December. The analysis was performed by calculating the Pearson coefficient between SYR and the considered SPI or SPEI index in a certain month, on rolling 30-year windows, spanning the period from 1952 to 2014. By way of example, the first time window covered the time range 1952–1981, the second 1953–1982, and so on. This procedure provided a time series of correlation coefficients for each considered index and month of the year.
A linear regression model was selected for the correlation analysis between SYRS and SPI/SPEI. Although this model provides a less accurate description of the relationship between these variables compared to a parabolic model (e.g., [19]), it offers the advantage of providing additional insights into the effects of climate fluctuations. A positive correlation indicates that drought is a limiting factor for crop yield, while a negative correlation suggests that excessive moisture is the limiting factor. In other words, the absolute value of the Pearson coefficient indicates the weight of climatic fluctuation, with respect to all other causes, in affecting crop yield, whereas its sign the way in which this impact.
The several time series of correlation values achieved provide useful insights about the response of the productive system to climatic fluctuations, including ordinary and extreme events. To account for missing data (at the years 1984, 2001, 2004, 2005), we extended the window size when necessary, ensuring a sample size of 30. Statistical significance was assessed using Student's t-test at the 10% and 1% levels. For a sample size of 30, these significance levels correspond to absolute critical values of 0.30 and 0.46, respectively. A correlation coefficient exceeding 0.30 (in absolute value) indicates a less than 10% probability of a spurious correlation, while a value greater than 0.46 suggests a highly significant relationship between the two series. The main steps of our analysis are summarized in Figure 3.
3. Results
3.1. Grape yield in the Chieti province
This study analyzed total grape production in the province of Chieti, encompassing both table and wine grapes. Figure 4a illustrates the total grape production (tons/hectare) in the four provinces of Abruzzo, highlighting the concentration of the overall regional production in the province of Chieti. Additionally, the dashed line represents wine grape production in Chieti. Despite being fragmented and discontinuous, data points highlight a significant increase in the production of higher-quality wine grapes over the studied period from 1952 to 2014. This production picture indicates that the province of Chieti has invested more heavily in intensive grape production compared to the provinces of L'Aquila, Teramo, and Pescara, where such production is secondary to other crops such as wheat or olive. For these reasons, our statistical analysis focused on the production in the province of Chieti, where the grape production system demands a high level of performance.
Over the study period (1952-2014), grape yields in the Chieti province exhibited an overall increase according to a composite trend, which can be divided into two 30-year sub-periods: 1952-1982 and 1983-2014 (Figure 4b). Yields showed a significant upward trend in the first period and a slight downward trend in the second. Figure 4c, which illustrates the results of the detrending process (Section 2.3), indicates that the variability of grape yields did not change significantly over the entire study period (1952-2014). In other words, grape yield has exhibited enhancements in terms of overall increase but not in terms of reduction of year-to-year fluctuations.
3.2. Integrated analysis of climatic and crop yield data
The climatic analysis revealed that daily maximum and minimum temperatures show a slow but statistically significant increasing trend (significance > 10%, according to the Mann-Kendall test; Guerriero et al., 2023), in the second thirty years period. Furthermore, the climate exhibits a systematic shift from temperate to temperate-arid. Figure 5 illustrates an example of maximum and minimum daily temperature (yearly average) trends and climate classification according to the Péguy criterion, with related shift, for the provinces of L'Aquila – in which the changes are more evident - and Chieti.
The correlation analysis between fluctuations in crop yield and climate indices highlighted an overall increase in the Pearson coefficient (in absolute value) over time in the Chieti province. Figure 6 shows the results of the correlation analysis between grape yield and drought indices for such province. The symbols SPI1, SPI2, SPI3 in Figure 6, denote the one-month, quarterly and half yearly SPI indices, whilst the column number denotes the month in which the index is calculated. The same applies to the SPEI indices. The correlation was calculated over five successive time windows, each approximately 30 years wide. For each time window, we constructed a panel in which each cell represents a specific SPI/SPEI index calculated for a particular month (March to December). Cell color indicates the level of significance. Light-colored cells (red or blue) denote a correlation with 10% significance (i.e., a likely existing correlation), whilst dark red or blue with 1% significance (i.e., strong correlation). It is recalled that positive or negative correlation does not inherently indicate a favorable or unfavorable climate impact, but whether drought or excessive humidity is a limiting factor for yield
We remark here that the main aim of this study is the identification of systematic variations, over time, of the correlation between fluctuations in crop production and in drought indices. In the panels of Figure 6a we observe an overall increase of the correlation - which is evidenced by an increase of the number of colored cells - between SPI/SPEI indices and grape yield, over time. Furthermore, a shift of colored cells is observed towards the August-October months, which allows us to identify the index showing the most pronounced rise in correlation, i.e., the quarterly SPEI (and SPI) of September, whose time series and trend are illustrated in Figure 6b.
4. Discussion
4.1. Interpretation of the statistical results
The achieved time series of correlation values corresponding to consecutive time windows (Section 2.3.) have provided key information about the relationship between climatic oscillations and crop yield fluctuations, within a framework of climate shifting towards a more warm-arid condition.
- i.
- These have revealed a changing sensitivity to climate fluctuations. The observed overall increase in the correlation coefficients in absolute value over time can be interpreted as a greater vulnerability of the grape production system to climatic fluctuations.
- i.
- These have pointed out shifting vulnerabilities over the month of the year. The migration of the highest correlation values from the spring season towards the autumn one can shed light on the specific phenological stages that become increasingly important in terms of the climate vulnerability of yield.
- i.
- The trends of the various observed correlation coefficients point out that the quarterly SPI and SPEI of September are becoming the most impactful drought indices, as these show the most pronounced and consistent trend over time. The trend analysis of the dominant index provides a useful tool for monitoring and potentially predicting climate-induced short-term yield variations [24].
Comparing our findings for grape yields to those of wheat in the Abruzzo region [24] reveals striking similarities. Both crop systems have experienced increased yields over time, particularly notable and persistent for wheat. However, this trend has not been accompanied by a reduction in year-to-year fluctuations. These fluctuations are of particular interest as they highlight the system's inability to maintain high performance under unfavorable climatic conditions. Fluctuations in crop yields, even positive ones, can disturb the complex market equilibria involving producers, distributors, investors, and consumers. By way of example, uncontrolled price volatility can lead to temporary increases that burden consumers or temporary decreases that harm producers, distributors, or other stakeholders such as investors, insurance companies, etc.
The analysis presented in this study complements previous research on grape production [43,44] and other crops [24,45] in central Italy and other parts of Europe [18], providing additional insights into how agricultural yields respond to short-term climate fluctuations. By integrating these findings, we can develop a more comprehensive understanding of the impact of both short- and long-term climate variability on agricultural productivity.
Our statistical analysis suggests that climate adaptation strategies in the Abruzzo grape production system, similar to those observed for wheat, have improved overall annual production but have not mitigated the effects of short-term climate fluctuations.
4.2. Limitations of this study and perspectives for future research
A limitation of this study is the incomplete dataset, which extends only to 2014. This limitation is due to challenges in obtaining complete meteorological (for all 37 monitoring stations) and agricultural production data. To ensure a dataset with minimal interruptions, we analyzed the period from 1952 to 2014. Additionally, due to data availability constraints for grape yield, we considered total grape production, encompassing both table and wine grapes, despite their different yields and varying cultivated areas over time in Abruzzo. While detrending helped to mitigate the effects of these variations, use of a more comprehensive dataset covering a longer period, including separate data for table and wine grapes, would be beneficial for a more in-depth analysis in future research.
Additionally, our analysis was focused on the province of Chieti, as a previous study [23] indicated that the other provinces in Abruzzo, where grape cultivation is a secondary production, exhibited lower correlations between grape yield and climate indices. While this allowed for a more in-depth analysis, it limits our understanding of spatial variability in the region.
This study, besides providing insights into the evolution of relationship between climate and grape yield, could furnish useful bases for developing probabilistic forecasting models, as illustrated by Guerriero et al. [24]. Nevertheless, such an endeavor requires careful consideration of model selection and validation, which will be subject for future research. Finally, integrating our results with models of price variation, similar to those employed by Tran et al. [33] or also [28,35], would provide a more comprehensive understanding of the economic implications of climate variability on the grape sector.
5. Conclusions
In this study, we conducted a statistical analysis involving climatic data and indices (SPI and SPEI), and grape yields on a provincial scale in the Abruzzo Region, covering the time range from 1952 to 2014.
Over the investigated sixty years, the climate in the region is shifting towards more warm-arid conditions. An overall increasing correlation between grape yields and drought indices has been observed, which can be interpreted as a signal of increasing yield vulnerability to year-to-year climatic fluctuations, within a framework of changing climate.
The period of the year, and corresponding phenological phase, when grape yield in the Chieti province is becoming more sensitive to climate fluctuations is between August and October, with the September quarterly SPI and SPEI indices exhibiting the most pronounced upward trend of the correlation coefficient. On the contrary, in the spring season correlation values exhibited a decrease over time.
The statistical approach here illustrated furnishes a comprehensive picture of the evolving climate–yield relationship for the studied province, so providing a robust framework for monitoring climate impacts on crop yields and for a rational agricultural sector management and planning. The observed correlation increase is indicative of the grape production system adaptation to climate change, resulting in enhanced overall yields but not offsetting the effects of short-term climate fluctuations.
Author Contributions
Conceptualization, V.G..; methodology, V.G.; formal analysis, V.G., A.R.S., B.D.L., M.D.B., M.T.; investigation, V.G., A.R.S., B.D.L., M.D.B., M.T.; data curation, A.R.S., B.D.L., M.D.B.; writing–original draft preparation, V.G.; writing–review and editing, V.G..; visualization, V.G., A.R.S.; supervision, A.R.S. and M.T. All authors have read and agreed to the published version of the manuscript.
Funding
This research was funded by Ministry of Economic Development (MiSE), Italy, Grant Id: C19C20000520004.
Institutional Review Board Statement
Not applicable.
Informed Consent Statement
Not applicable.
Data Availability Statement
Name of the code/library: Data_Set_Grape_SYR_SPI-SPEI_.xlsx.Contact: vincenzo.guerriero@univaq.it; vincenzo.guerriero@unina.it Software required: MS Office or equivalentProgram size: 186 KB The data are available for downloading at the link: https://github.com/vincenzo-guerriero/Grape_Abruzzo_SYR_SPI_SPEI_Time_SeriesTemperature and precipitation data have been published in the Annals of the Italian National Hydrographic and Mareographic Service and are available, upon request, in digital form from the corresponding regional offices. Agricultural data from more recent years have been published by ISTAT in the Annals of Agricultural Statistics and are available in digital form in the ISTAT database http://dati.istat.it, accessed on 15 August 2023.
Acknowledgments
The authors thank the Editor and anonymous Reviewers for their constructive comments, which have provided a valuable guidance to improve the manuscript quality. The research leading to these results has received funding from the Italian Ministry of Economic Development (MiSE) under the project “SICURA–CASA INTELLIGENTE DELLE TECNOLOGIE PER LA SICUREZZA”. The research described in this paper has been developed in the framework of the research project National Centre for HPC, Big Data and Quantum Computing - PNRR Project, funded by the European Union - Next Generation EU.
Conflicts of Interest
The authors declare no conflict of interest.
References
- Abbass, K.; Qasim, M.Z.; Song, H.; Murshed, M.; Mahmood, H.; Younis, I. A review of the global climate change impacts, adaptation, and sustainable mitigation measures. Environ. Sci. Pollut. Res. 2022, 29, 42539–42559. doi:10.1007/s11356-022-19718-6.
- Holleman, C., Rembold, F., Crespo, O., Conti, V. (2020). The impact of climate variability and extremes on agriculture and food security – An analysis of the evidence and case studies. Background paper for The State of Food Security and Nutrition in the World 2018. FAO Agricultural Development Economics Technical Study No. 4., FAO, Rome. https://doi.org/10.4060/cb2415en.
- FAO. The state of food and agriculture 2016: climate change, agriculture and food security. Rome (2016). Available online: https://www.fao.org/3/a-i6030e.pdf (accessed on 11 November 2024).
- Lobell, D.B., Gourdji S.M. (2012) The Influence of Climate Change on Global Crop Productivity. Plant Physiology, 160, 4, https://doi.org/10.1104/pp.112.208298.
- Giorgi, F.; Lionello, P. (2008). Climate change projections for the Mediterranean region. Glob. Planet. Change, 63, 90–104. https://doi.org/10.1016/j.gloplacha.2007.09.005.
- Michaelides, S.; Karacostas, T.; Sánchez, J.L.; Retalis, A.; Pytharoulis, I.; Homar, V.; Romero, R.; Zanis, P.; Giannakopoulos, C.; Bühl, J.; et al. (2018). Reviews and perspectives of high impact atmospheric processes in the Mediterranean. Atmospheric Res., 208, 4–44. https://doi.org/10.1016/j.atmosres.2017.11.022.
- Fioravanti, G.; Piervitali, E.; Desiato, F. (2019). A new homogenized daily data set for temperature variability assessment in Italy. Int. J. Clim., 39, 5635–5654. https://doi.org/10.1002/joc.6177.
- Tuel, A.; Eltahir, E.A. (2020). Why is the Mediterranean a climate change hot spot? J. Clim., 33, 5829–5843.
- Scorzini, A.R.; Leopardi, M. (2018). Precipitation and temperature trends over central Italy (Abruzzo Region): 1951–2012. Theor. Appl. Clim., 135, 959–977. https://doi.org/10.1007/s00704-018-2427-3.
- Aruffo, E.; Di Carlo, P. (2019). Homogenization of instrumental time series of air temperature in Central Italy (1930-2015). Clim. Res. 77, 193–204. https://doi.org/10.3354/cr01552.
- Caporali, E.; Lompi, M.; Pacetti, T.; Chiarello, V.; Fatichi, S. (2021). A review of studies on observed precipitation trends in Italy. Int. J. Climatol. 41, E1–E25. https://doi.org/10.1002/joc.6741.
- Curci, G.; Guijarro, J.A.; Di Antonio, L.; Di Bacco, M.; Di Lena, B.; Scorzini, A.R. (2021). Building a local climate reference dataset: Application to the Abruzzo region (Central Italy), 1930–2019. Int. J. Clim., 41, 4414–4436. https://doi.org/10.1002/joc.7081.
- Palmer, W.C. Meteorological Drought; US Department of Commerce, Weather Bureau: Washington, DC, USA, 1965; Volume 30.
- McKee, T.B.; Doesken, N.J.; Kleist, J. (1993). The relationship of drought frequency and duration to time scales. In Proceedings of the 8th Conference on Applied Climatology, Anaheim, CA, USA, 17–22; Volume 17, No. 22, pp. 179–183.
- Narasimhan, B.; Srinivasan, R. (2005). Development and evaluation of Soil Moisture Deficit Index (SMDI) and Evapotranspiration Deficit Index (ETDI) for agricultural drought monitoring. Agric. For. Meteorol., 133, 69–88. https://doi.org/10.1016/j.agrformet.2005.07.012.
- Vicente-Serrano, S.M.; Beguería, S.; López-Moreno, J.I. (2010). A Multiscalar Drought Index Sensitive to Global Warming: The Standardized Precipitation Evapotranspiration Index. J. Clim., 23, 1696–1718. https://doi.org/10.1175/2009jcli2909.1.
- World Meteorological Organization (WMO); Global Water Partnership (GWP). Handbook of Drought Indicators and Indices; Svoboda, M., Fuchs, B.A., Eds.; Integrated Drought Management Programme (IDMP), Integrated Drought Management Tools and Guidelines Series 2; World Meteorological Organization (WMO) and Global Water Partnership (GWP): Geneva, Switzerland, 2016. ISBN 978-92-63-11173-9.
- Gunst, L.; Rego, F.M.C.C.; Dias, S.M.A.; Bifulco, C.; Stagge, J.H.; Rocha, M.S.; Van Lanen, H.A.J. (2015). Links between Meteorological Drought Indices and Yields (1979–2009) of the Main European Crops; Technical Report No. 36; DROUGHT-R&SPI Project: Wageningen, The Netherlands.
- Potopová, V.; Boroneanţ, C.; Boincean, B.; Soukup, J. (2016). Impact of agricultural drought on main crop yields in the Republic of Moldova. Int. J. Clim., 36, 2063–2082. https://doi.org/10.1002/joc.4481.
- Peña-Gallardo, M.; Vicente-Serrano, S.M.; Domínguez-Castro, F.; Beguería, S. (2019). The impact of drought on the productivity of two rainfed crops in Spain. Nat. Hazards Earth Syst. Sci., 19, 1215–1234. https://doi.org/10.5194/nhess-19-1215-2019.
- Peña-Gallardo, M.; Vicente-Serrano, S.M.; Domínguez-Castro, F.; Quiring, S.; Svoboda, M.; Beguería, S.; Hannaford, J. (2018). Effectiveness of drought indices in identifying impacts on major crops across the USA. Clim. Res. 2018, 75, 221–240. https://doi.org/10.3354/cr01519. Agric. For. Meteorol., 249, 107–119. https://doi.org/10.1016/j.agrformet.2017.11.024.
- Bezdan, J.; Bezdan, A.; Blagojević, B.; Mesaroš, M.; Pejić, B.; Vranešević, M.; Pavić, D.; Nikolić-Đorić, E. (2019). SPEI-Based Approach to Agricultural Drought Monitoring in Vojvodina Region. Water, 11, 1481. https://doi.org/10.3390/w11071481.
- Guerriero, V.; Scorzini, A.R.; Di Lena, B.; Iulianella, S.; Di Bacco, M.; Tallini, M. (2023). Impact of Climate Change on Crop Yields: Insights from the Abruzzo Region, Central Italy. Sustainability, 15, 19, 14235. https://doi.org/10.3390/su151914235.
- Guerriero, V.; Scorzini, A.R.; Di Lena, B.; Di Bacco, M.; Tallini, M. (2024). Measuring variation of crop production vulnerability to climate fluctuations over time, illustrated by the case study of wheat from the Abruzzo region (Italy). Sustainability, 16, 15, 6462. https://doi.org/10.3390/su16156462.
- Zhang, Z., Jin, G. (2024). Spatiotemporal differentiation of carbon budget and balance zoning: Insights from the middle reaches of the Yangtze River Urban Agglomeration, ChinaSpatiotemporal differentiation of carbon budget and balance zoning: Insights from the middle reaches of the Yangtze River Urban Agglomeration, China. Applied Geography, 167, 103293. https://doi.org/10.1016/j.apgeog.2024.103293.
- Lobell, D.B., Field C.B. (2007) Global scale climate–crop yield relationships and the impacts of recent warming. Environ. Res. Lett., 2, 014002, https://doi.org/10.1088/1748-9326/2/1/014002.
- Kang, Y., Khan, S., Ma, X. (2009). Climate change impacts on crop yield, crop water productivity and food security – A review. Progress in Natural Science, 19, 12, 1665-1674, https://doi.org/10.1016/j.pnsc.2009.08.001.
- Moore, F.C., Baldos U.L., Hertel, T. (2017) Economic impacts of climate change on agriculture: a comparison of process-based and statistical yield models. Environ. Res. Lett., 12 065008, https://doi.org/10.1088/1748-9326/aa6eb2.
- Carrasco Azzini, G., Conti, V., Holleman, C., Smulders, M. 2022. Best practices in addressing the major drivers of food security and nutrition to transform food systems. Background paper for The State of Food Security and Nutrition in the World 2021. FAO Agricultural Development Economics Technical Study, No. 23. Rome, FAO. https://doi.org/10.4060/cc2622en.
- Teng, J., Hou, R., Dungait, J.A.J. et al. (2024) Conservation agriculture improves soil health and sustains crop yields after long-term warming. Nat Commun 15, 8785. https://doi.org/10.1038/s41467-024-53169-6.
- Mazhar N., Sultan, M., Amjad D. (2020) Impacts of rainfall and temperature variability on wheat production in district Bahawalnagar, Pakistan from 1983-2016. Pakistan Journal of Science, 72, 4, https://doi.org/10.57041/pjs.v72i4.261.
- Ostberg, S. and Schewe, J. and Childers, K. and Frieler, K. (2018) Changes in crop yields and their variability at different levels of global warming. Earth System Dynamics, 9, 2, https://doi.org/10.5194/esd-9-479-2018.
- Tran, A.N.; Welch, J.R.; Lobell, D.; Roberts, M.J.; Schlenker, W. Commodity prices and volatility in response to anticipated climate change. In Proceedings of the Annual Meeting of Agricultural & Applied Economics Association, Seattle, USA, 12–14 August 2012. https://doi.org/10.22004/ag.econ.124827.
- Iizumi T., Ramankutty N. (2016). Changes in yield variability of major crops for 1981–2010 explained by climate change. Environ. Res. Lett., 11, 034003, https://doi.org/10.1088/1748-9326/11/3/034003.
- Segerstrom, T.M. (2016). Global Climate Change, Fair Trade, and Coffee Price Volatility. Gettysburg Economic Review, 9, 6, https://cupola.gettysburg.edu/ger/vol9/iss1/6.
- Sciortino, A., Marini, R., Guerriero, V., Mazzanti, P., Spadi, M., Tallini, M. (2024a). Satellite A-DInSAR pattern recognition for seismic vulnerability mapping at city scale: insights from the L’Aquila (Italy) case study. GIScience & Remote Sensing, 61, 1, https://doi.org/10.1080/15481603.2023.2293522.
- Sciortino, Guerriero, V., A., Marini, R., Spadi, M., Mazzanti, P., Tallini, M. (2024b). Geological and Hydrogeological Drivers of Seismic Deformation in L'Aquila, Italy: Insights from InSAR Analysis. Geomatics, Natural Hazards and Risk. [CrossRef]
- Carminati, E., Lustrino, M., Cuffaro, M., Doglioni, C., 2010. Tectonics, magmatism and geodynamics of Italy: What we know and what we imagine. In: (Eds.) Marco Beltrando, Angelo Peccerillo, Massimo Mattei, Sandro Conticelli, and Carlo Doglioni, The Geology of Italy: tectonics and life along plate margins, Journal of the Virtual Explorer, Electronic Edition, ISSN 1441-8142, volume 36, paper 9, https://doi.org/10.3809/jvirtex.2010.00226.
- Annali idrologici della Regione Abruzzo, Ufficio Idrografico e Mareografico–Pescara. Available online: https://www.regione.abruzzo.it/content/annali-idrologici?page=2 (accessed on 15 August 2023).
- Annali idrologici della Regione Campania, Centro Funzionale Multirischi della Protezione Civile Regione Campania, Annali idrologici e altre pubblicazioni del compartimento di Napoli del S.I.M.N. Available online: http://centrofunzionale.regione.campania.it/#/pages/documenti/annali (accessed on 15 August 2023).
- 41. ISTAT, Biblioteca Digitale-Annuario di statistica agraria. Available online: (https://ebiblio.istat.it/SebinaOpac/resource/annuario-di-statistica-agraria/IST0010796 (accessed on 15 August 2023).
- ISTAT, dati-agricoltura-coltivazioni-superfici e produzione. Available online: http://dati.istat.it (accessed on 15 August 2023).
- Teslić, N.; Zinzani, G.; Parpinello, G.P.; Versari, A. Climate change trends, grape production, and potential alcohol concentration in wine from the “Romagna Sangiovese” appellation area (Italy). Theor. Appl. Climatol. 2018, 131, 793–803. doi: 10.1007/s00704-016-2005-5.
- Di Carlo, P.; Aruffo, E.; Brune, W.H. Precipitation intensity under a warming climate is threatening some Italian premium wines. Sci. Total Environ. 2019, 685, 508–513. doi: 10.1016/j.scitotenv.2019.05.449.
- Orlandi, F.; Rojo, J.; Picornell, A.; Oteros, J.; Pérez-Badia, R.; Fornaciari, M. Impact of Climate Change on Olive Crop Production in Italy. Atmosphere 2020, 11, 595. doi: 10.3390/atmos11060595.
Figure 1.
The agricultural productive system viewed as a simple dynamic system, constituted by three main subsystems.
Figure 1.
The agricultural productive system viewed as a simple dynamic system, constituted by three main subsystems.
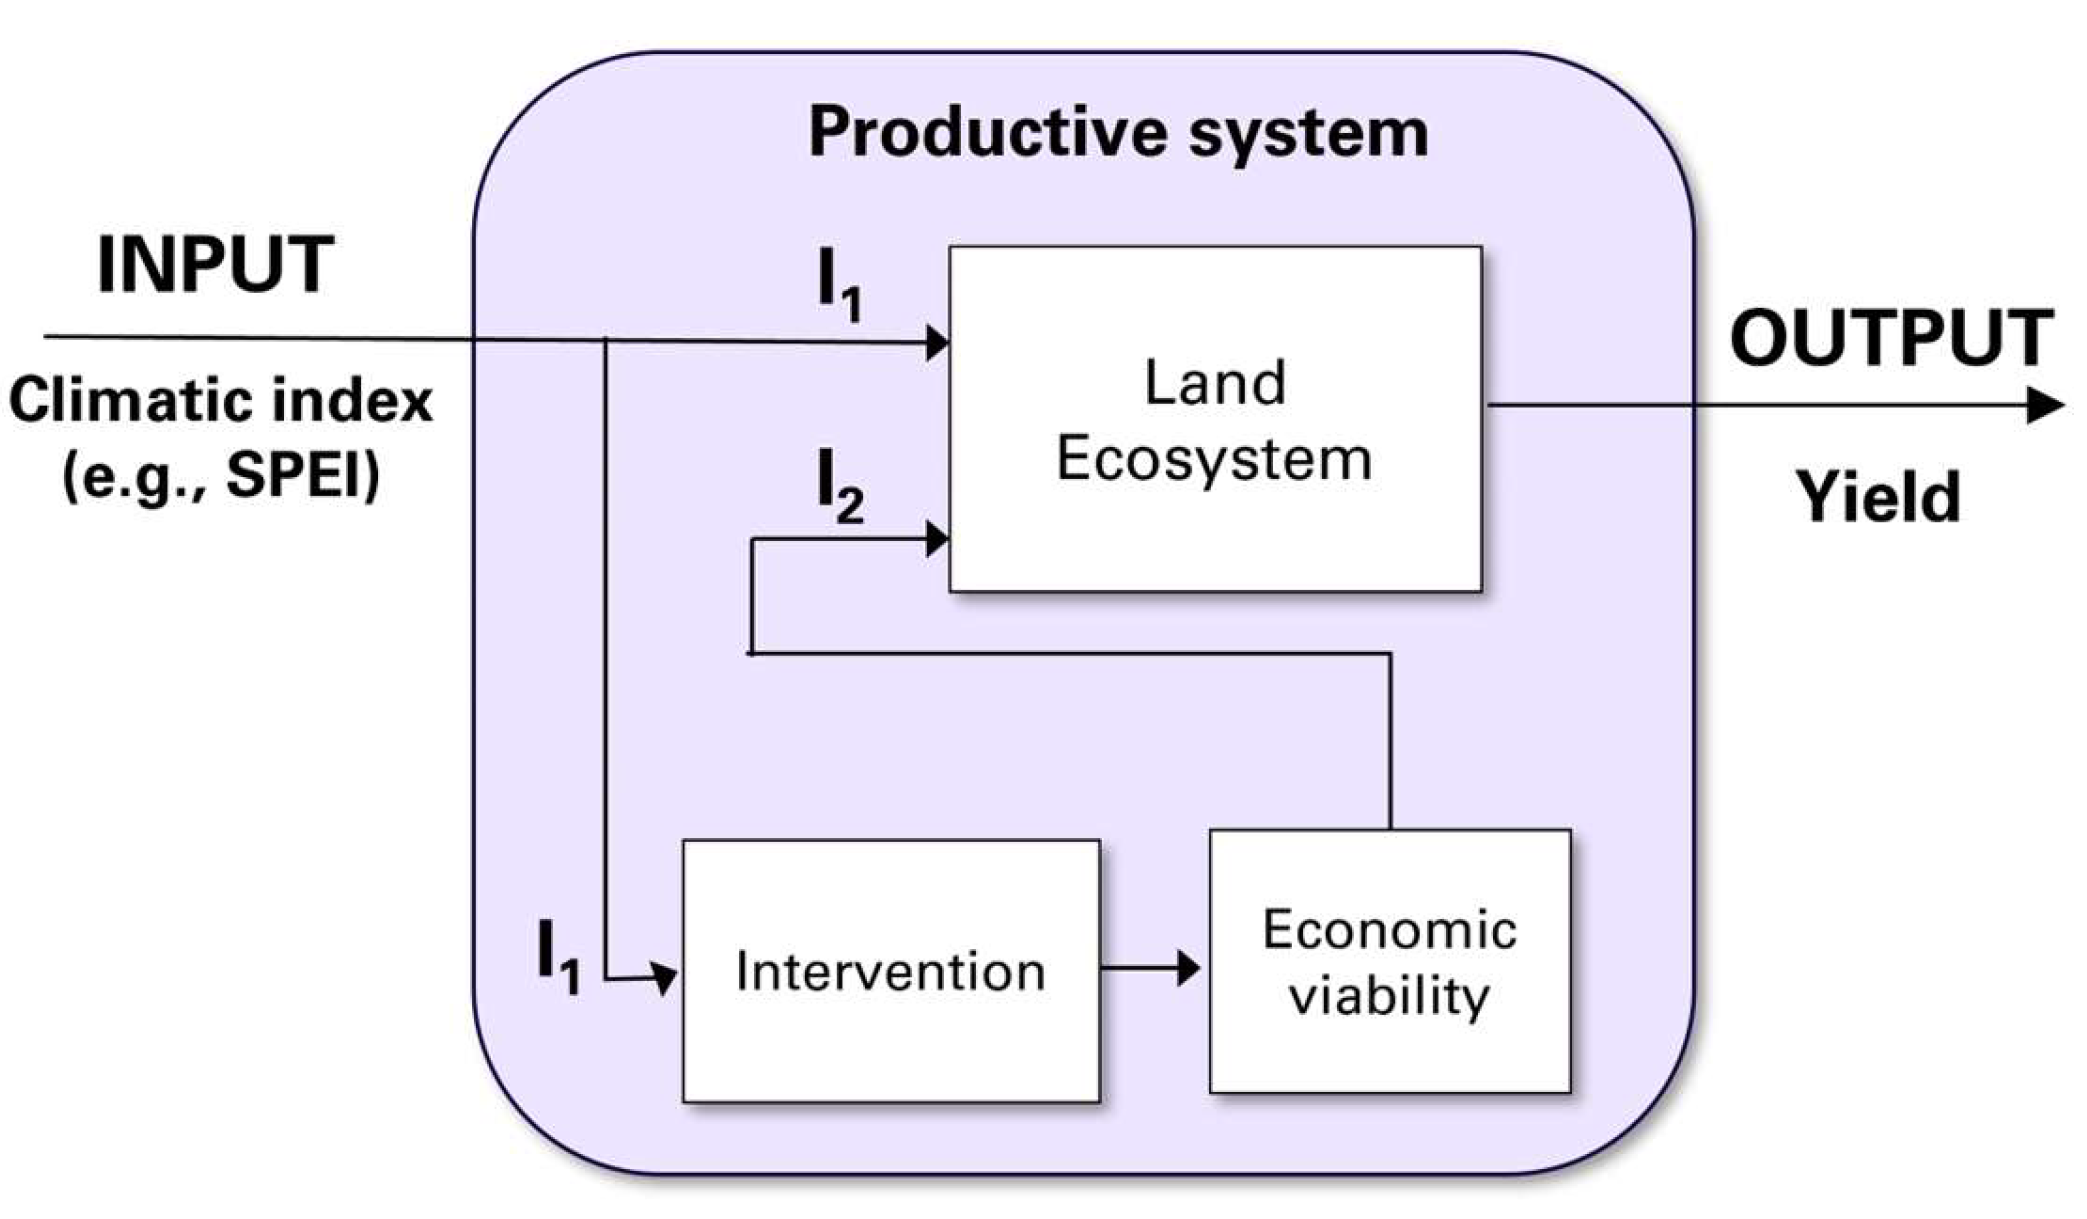
Figure 2.
Location and land use of the study area. From [23] modified.
Figure 2.
Location and land use of the study area. From [23] modified.
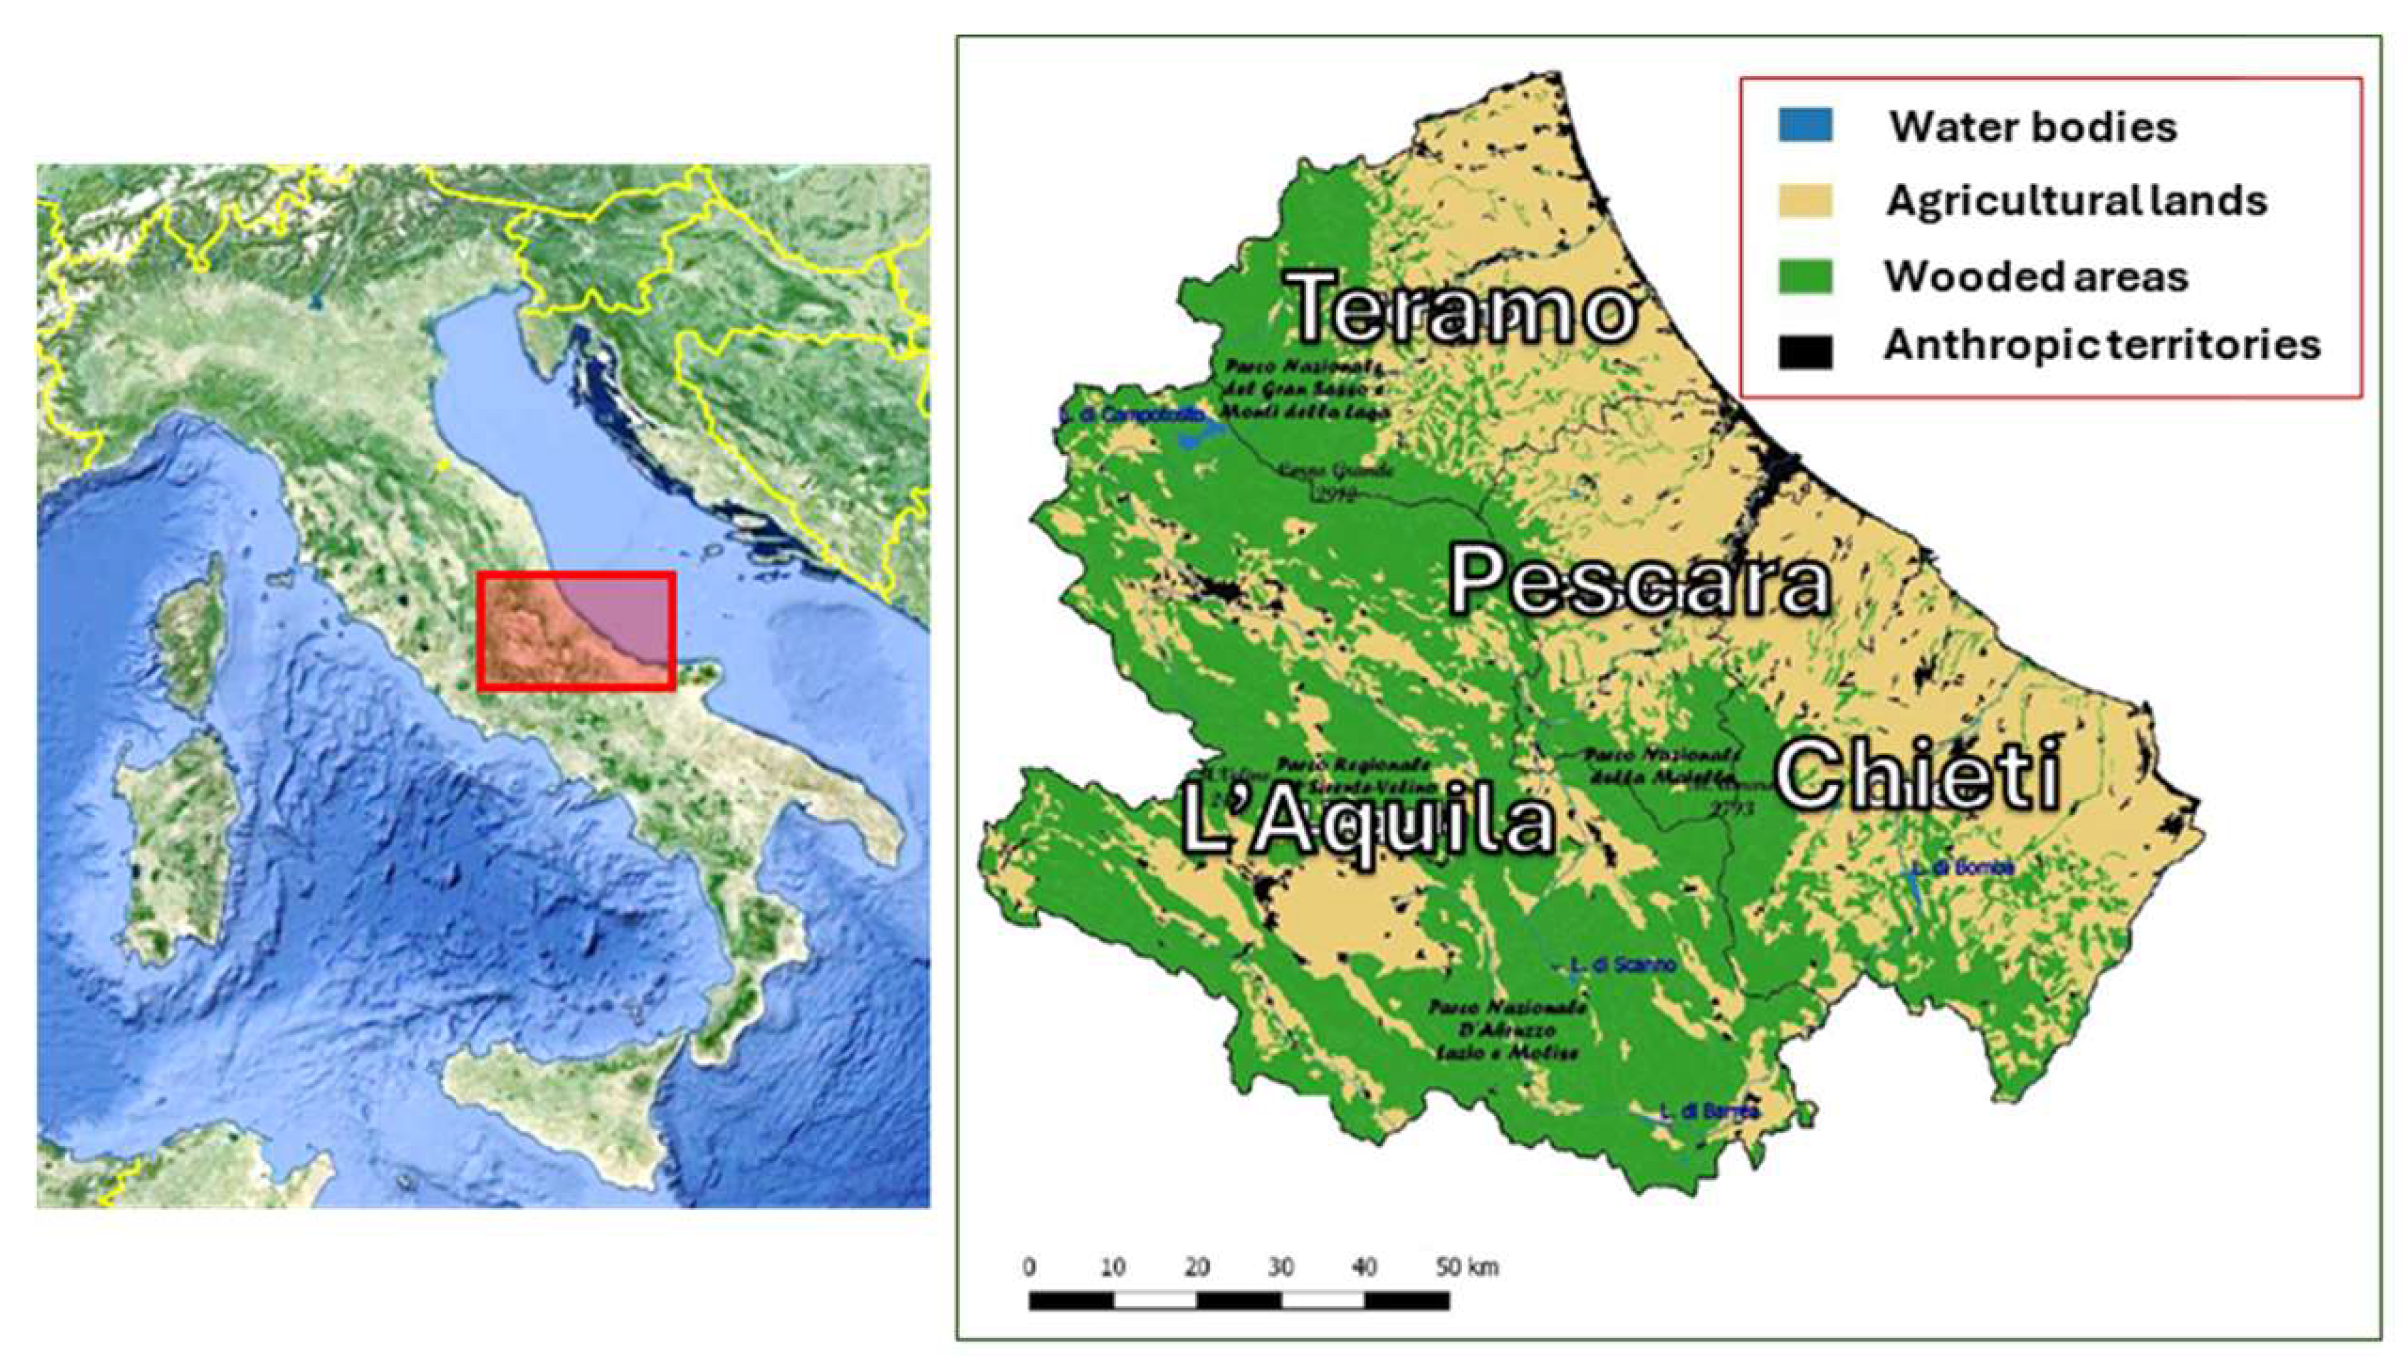
Figure 3.
(a) Flowchart summarizing the analysis process. (b) Example of correlation analysis between SYRS and quarterly SPEI (SPEI3) of September, for grape in the Chieti province, over the time range 1960-1990.
Figure 3.
(a) Flowchart summarizing the analysis process. (b) Example of correlation analysis between SYRS and quarterly SPEI (SPEI3) of September, for grape in the Chieti province, over the time range 1960-1990.
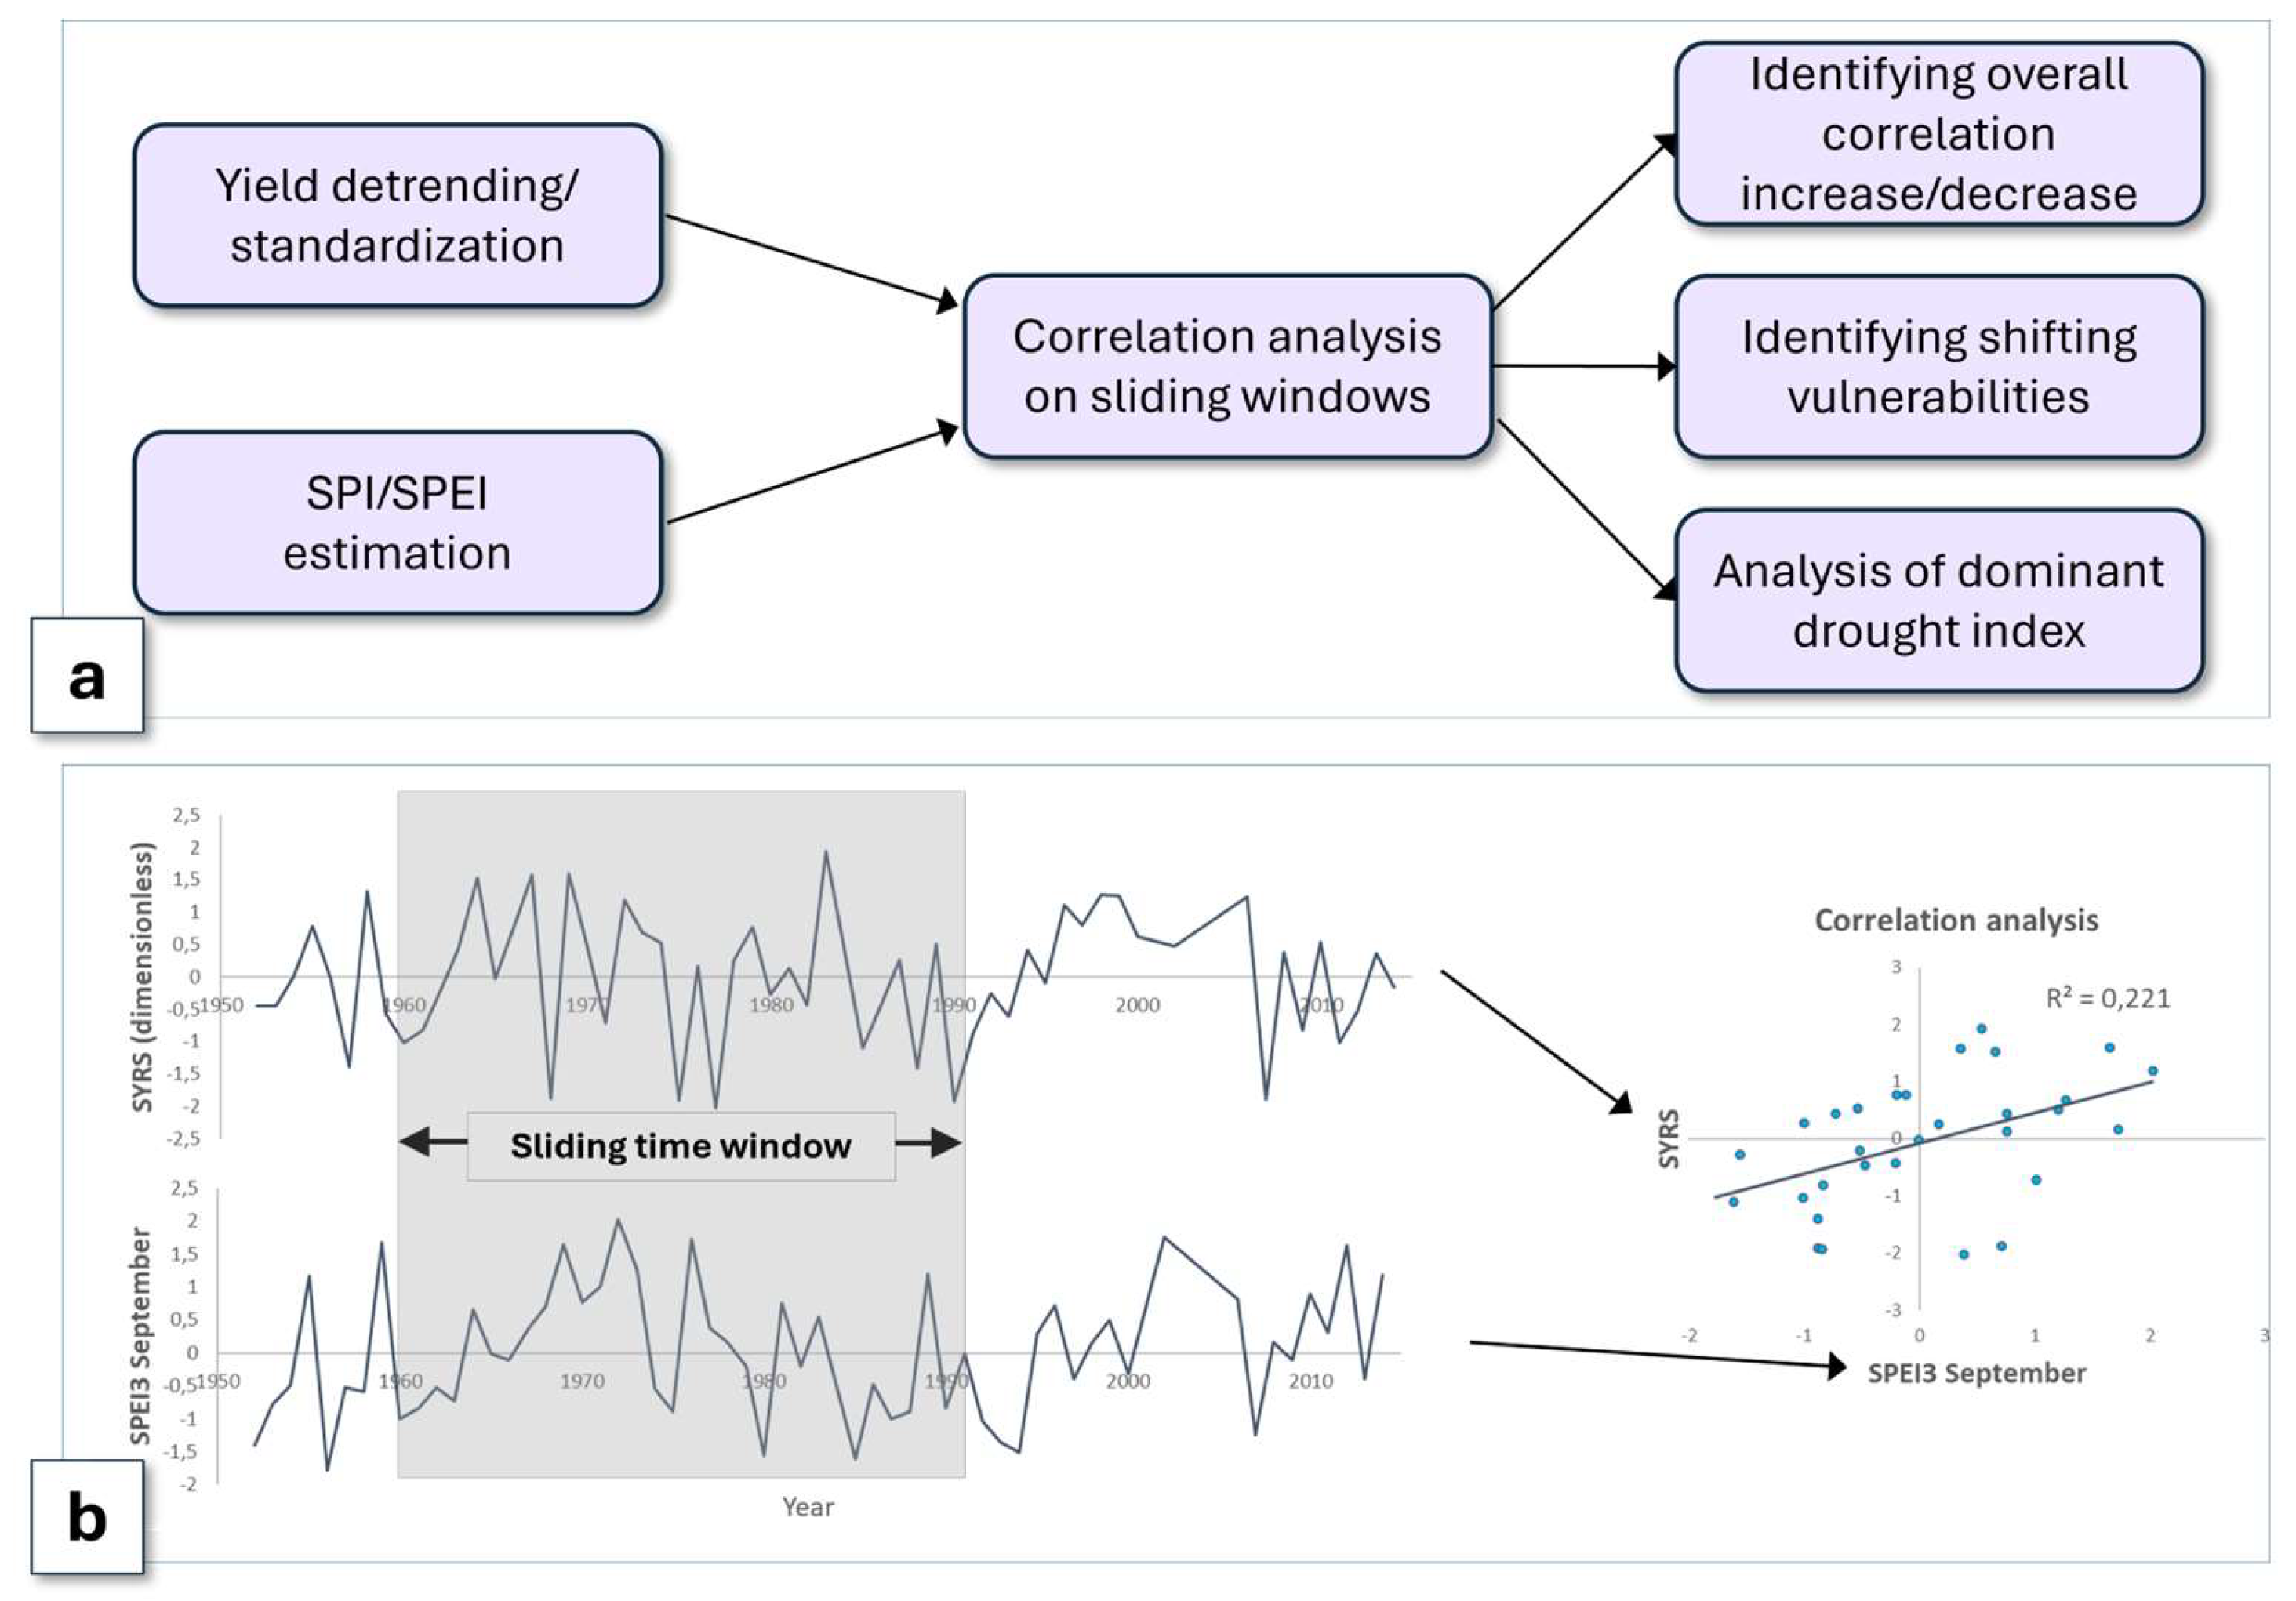
Figure 4.
(a) Time series of total grape production (tons) in the four Abruzzo provinces. Red dashed line denotes the only wine grape produced in Chieti province. (b) Crop yield (t/h) of the Chieti province grape. (c) Time series of standardized yield residuals for grape yield.
Figure 4.
(a) Time series of total grape production (tons) in the four Abruzzo provinces. Red dashed line denotes the only wine grape produced in Chieti province. (b) Crop yield (t/h) of the Chieti province grape. (c) Time series of standardized yield residuals for grape yield.
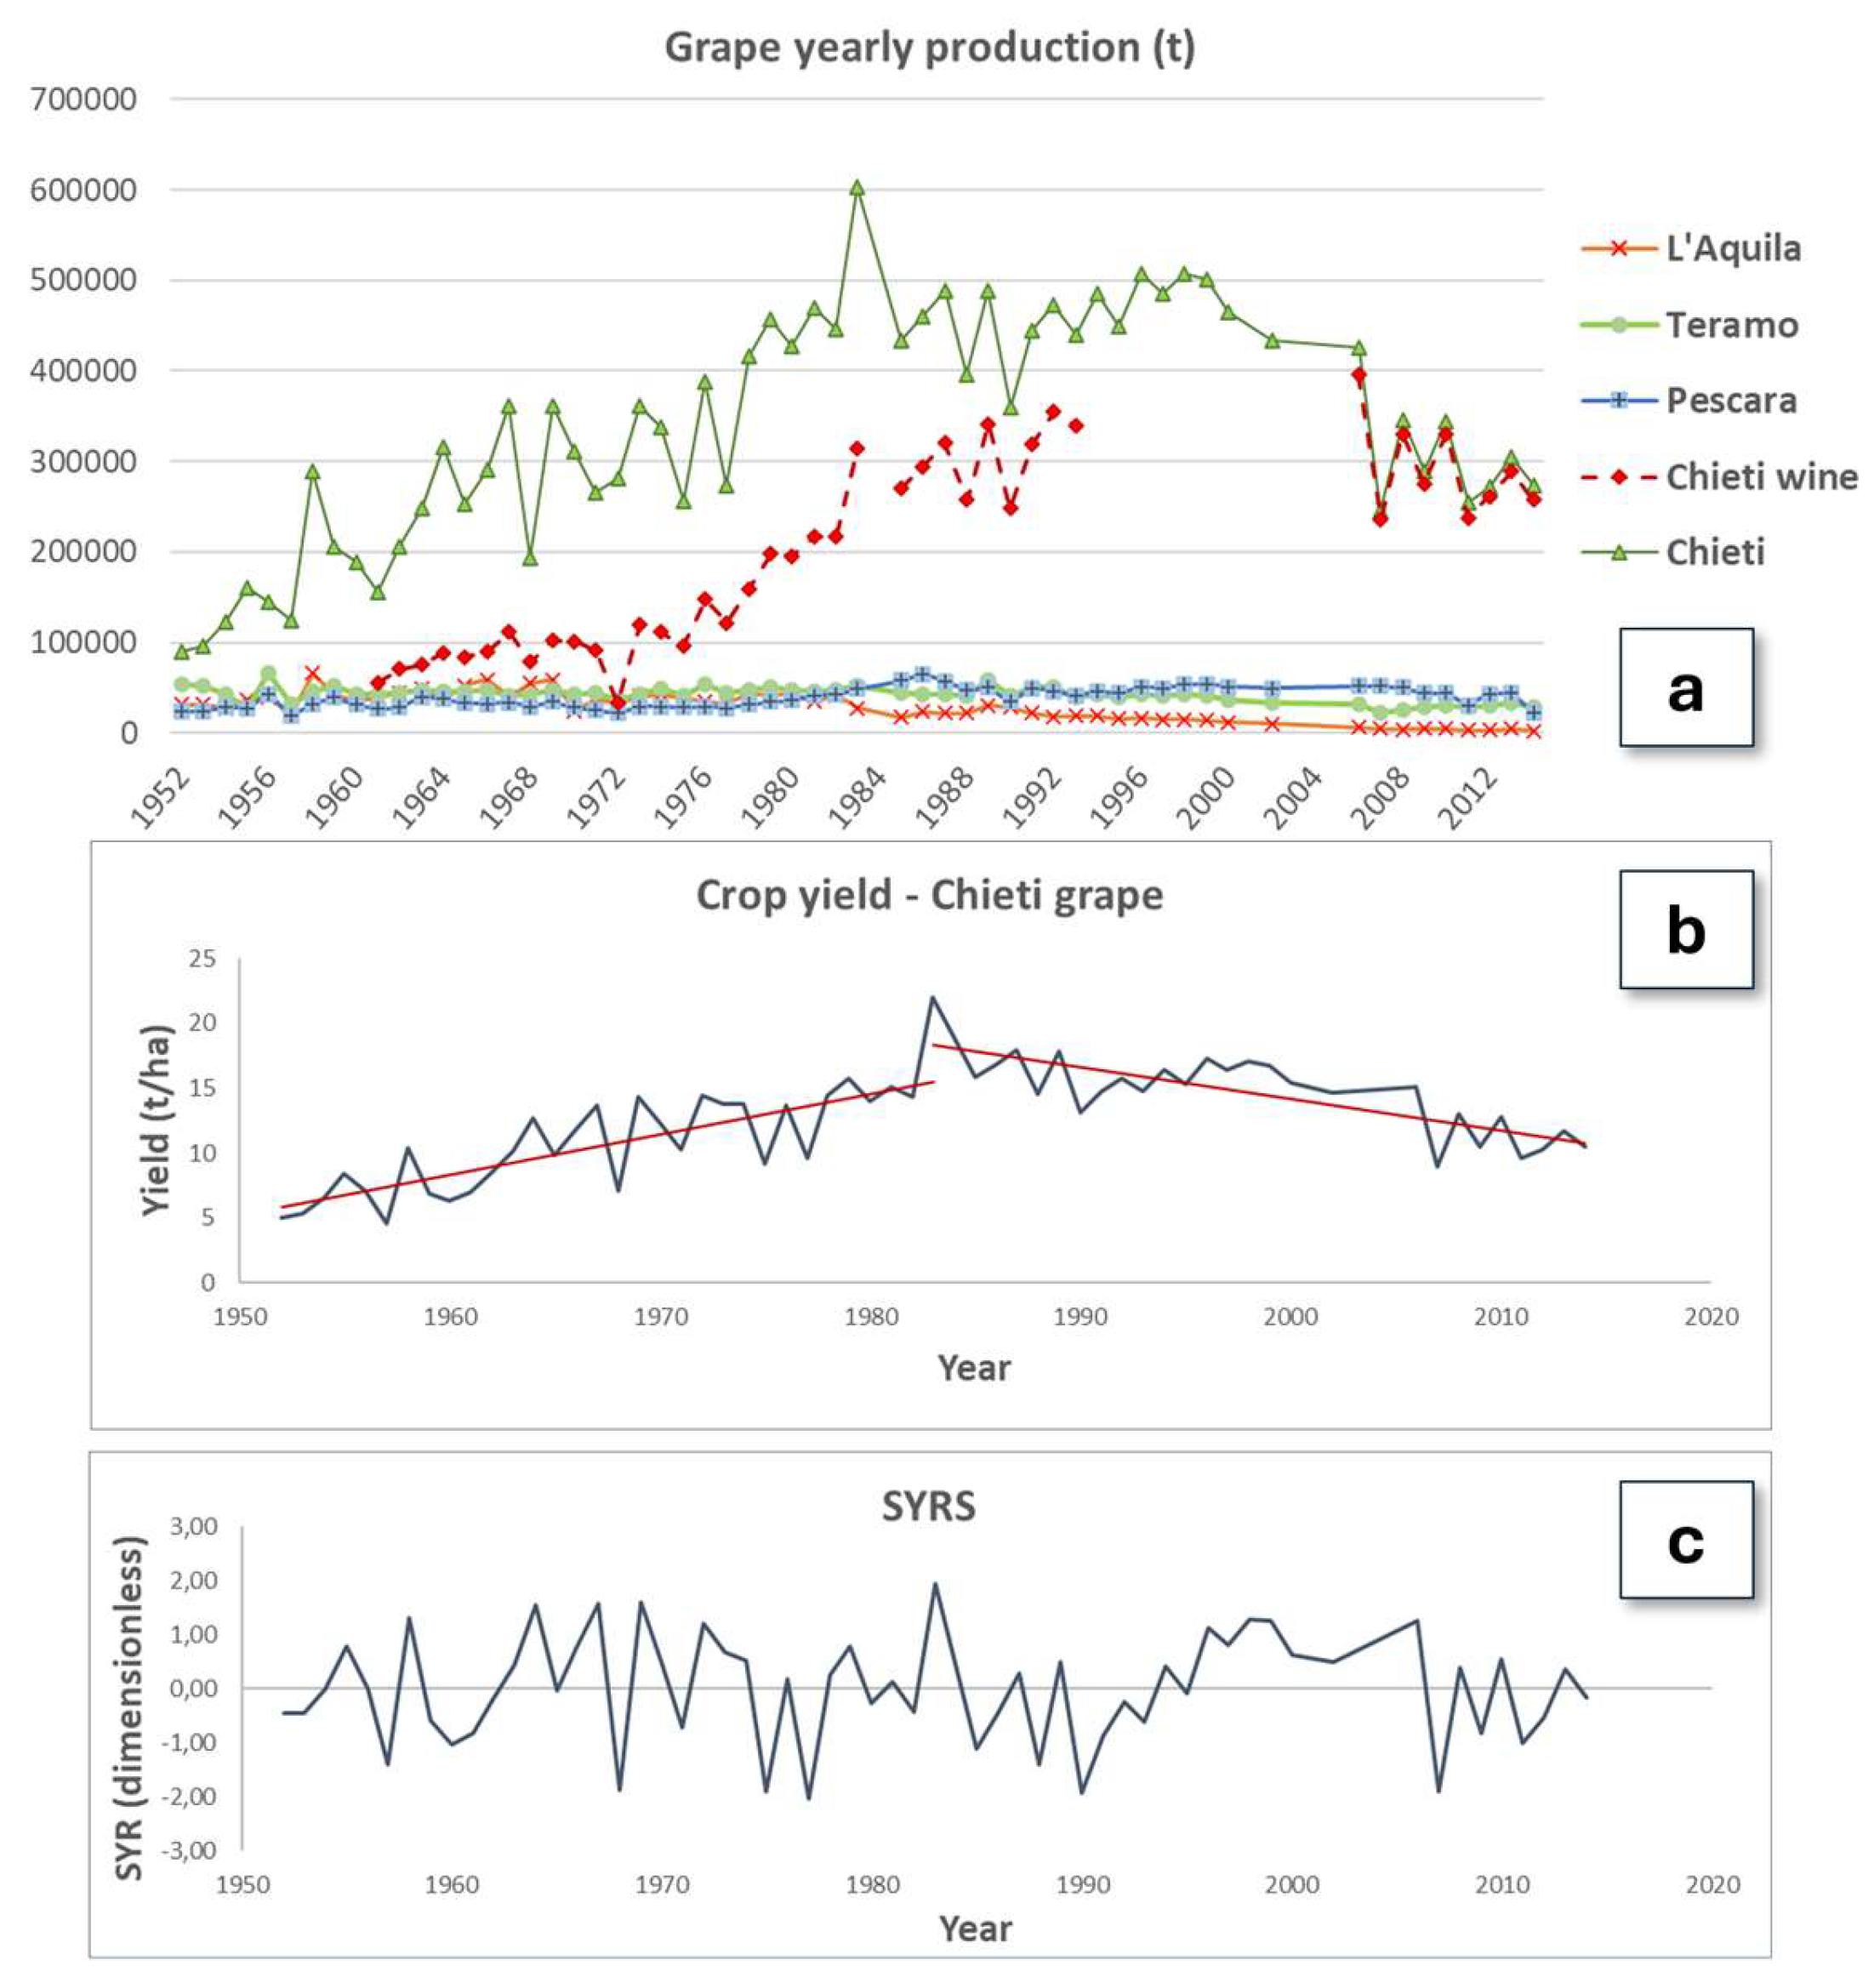
Figure 5.
Time series of maximum and minimum daily temperatures and Péguy climate classification, in the two considered time ranges, 1952-1982 and 1983-2014, for L’Aquila and Chieti provinces. Dotted lines denote trendlines over about thirty-year time ranges (from Guerriero et al., 2023, modified).
Figure 5.
Time series of maximum and minimum daily temperatures and Péguy climate classification, in the two considered time ranges, 1952-1982 and 1983-2014, for L’Aquila and Chieti provinces. Dotted lines denote trendlines over about thirty-year time ranges (from Guerriero et al., 2023, modified).
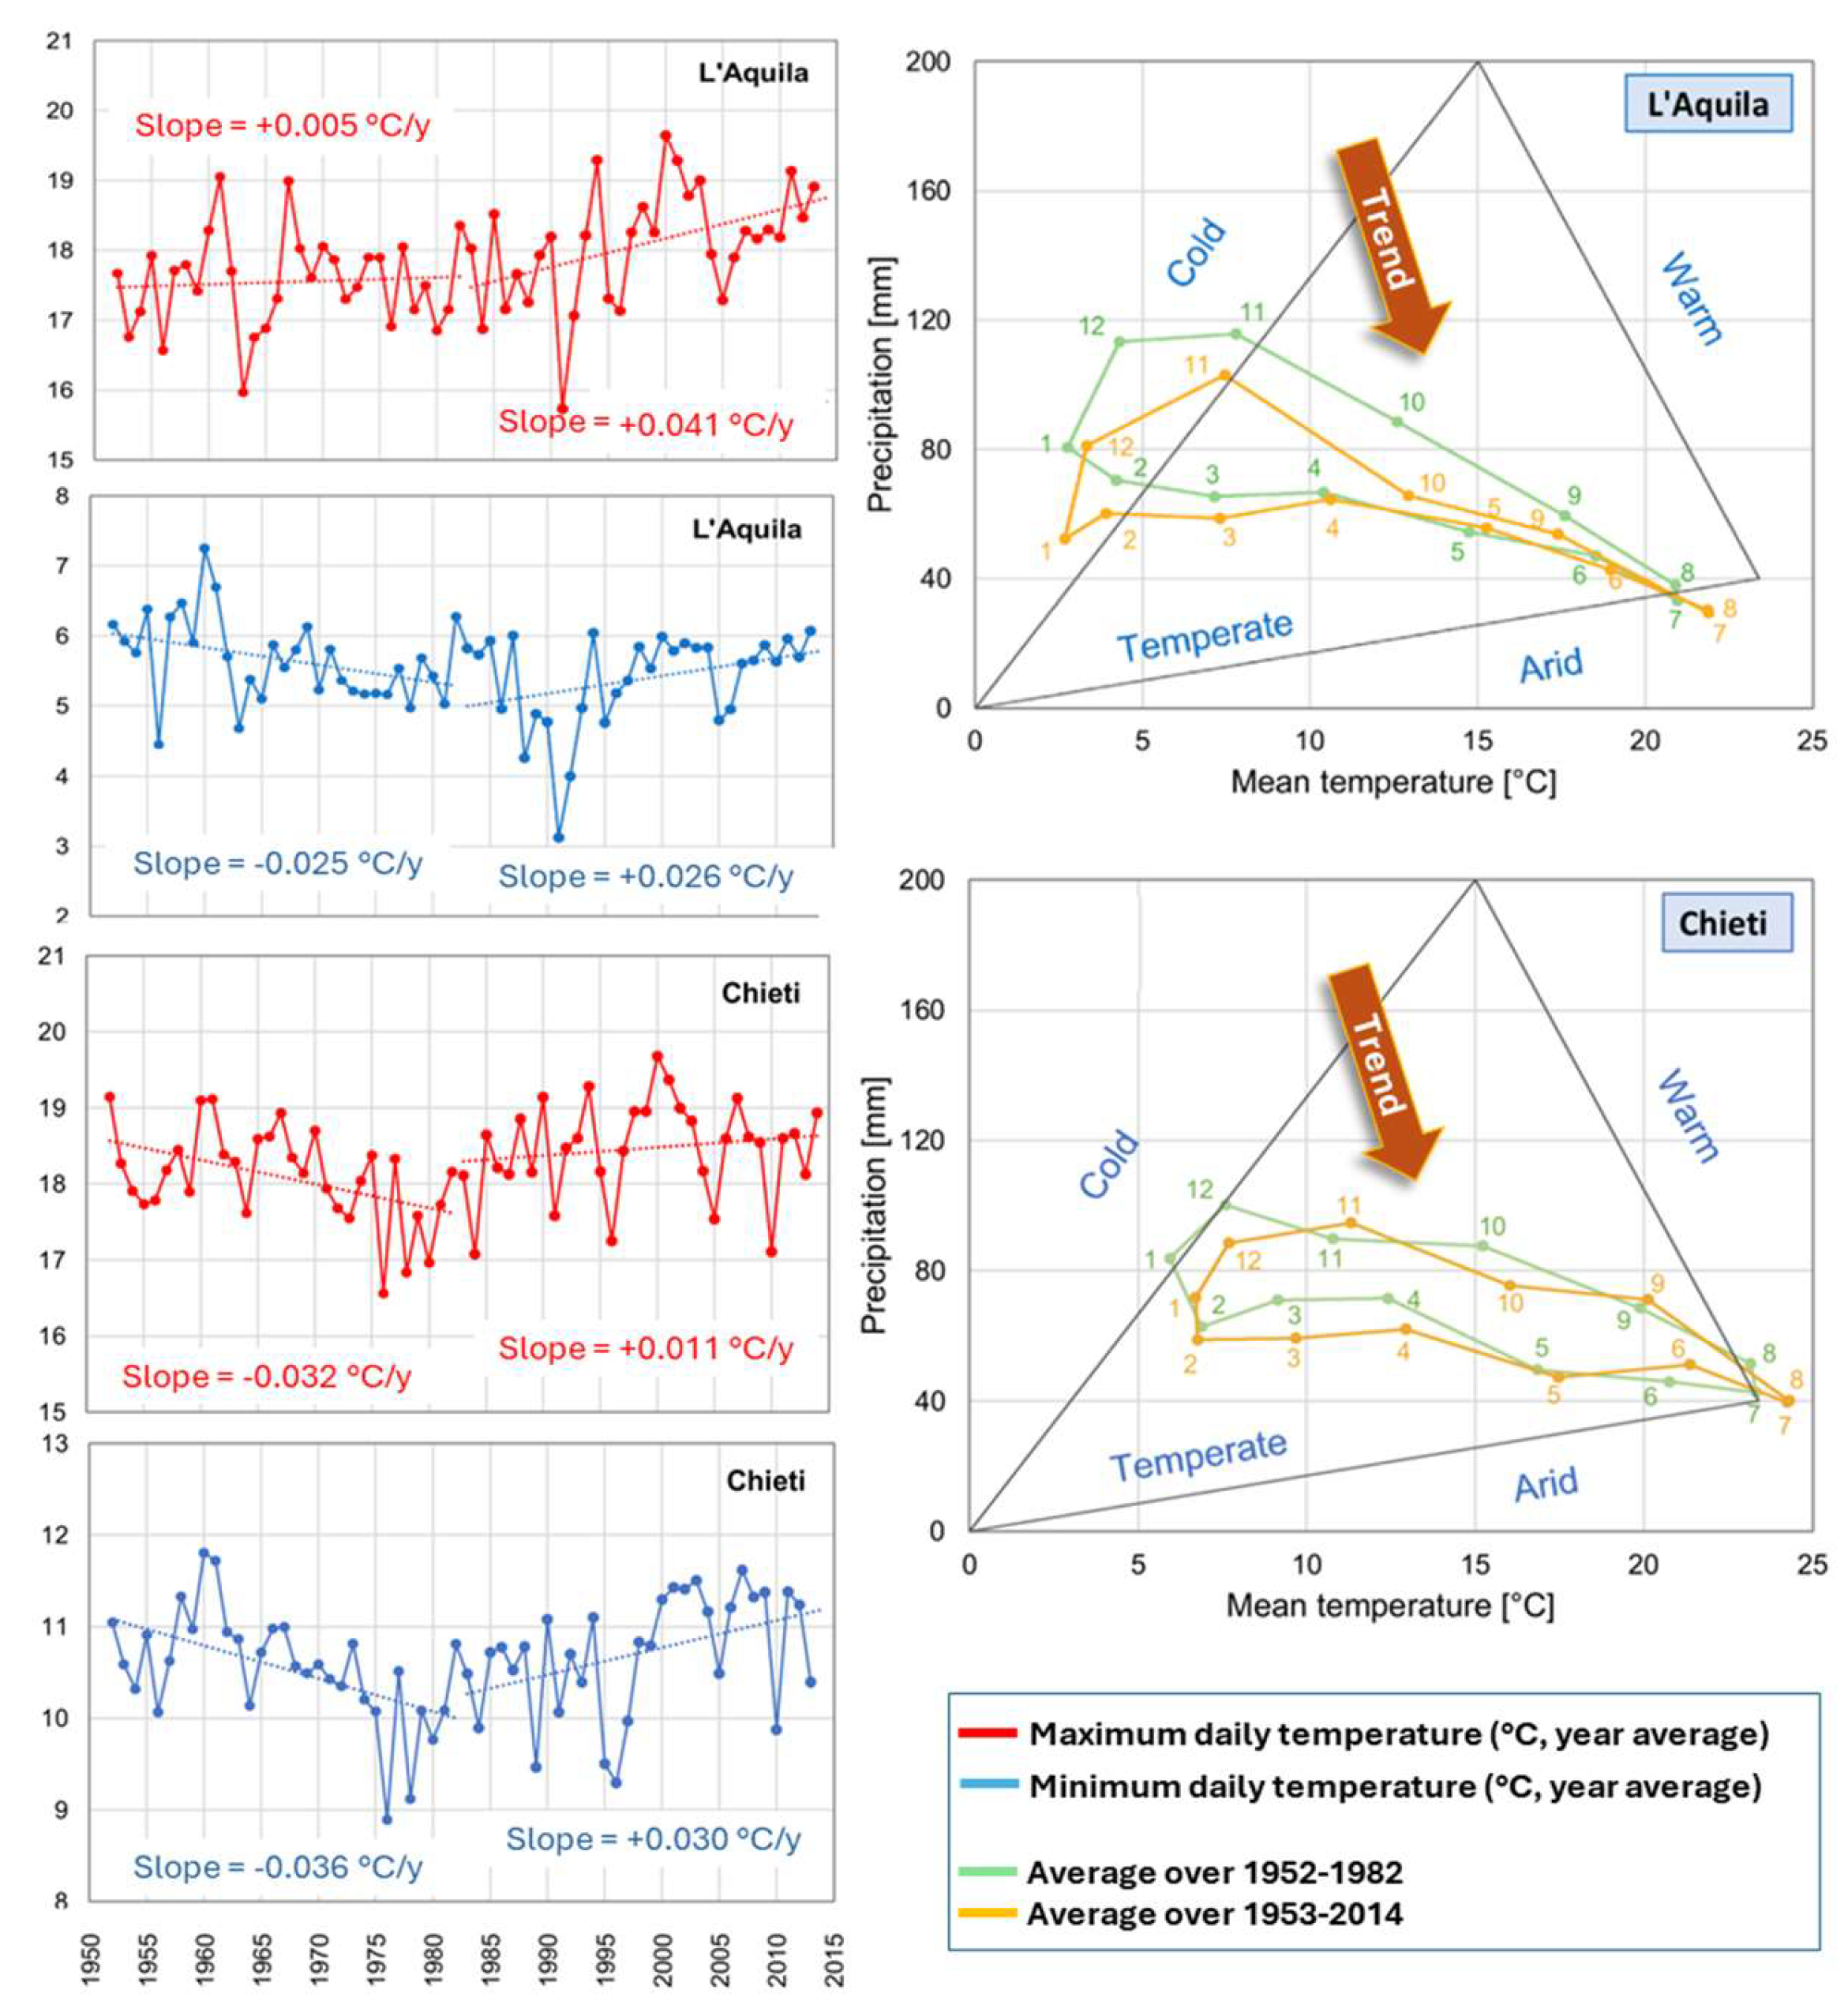
Figure 6.
(a) Identified correlation coefficients between detrended crop yield (SYRS) and relevant SPI and SPEI indices for grape in the province of Chieti and for five sequential time windows. The correlation thresholds (absolute) values of 0.3 and 0.46 are associated to statistical significance of 10% and 1%, respectively. An increase in the number of colored cells, and mainly of dark red or blu ones, denotes a growing correlation between crop and climatic oscillations. (b) Correlation values between SYRS and SPEI3 of September, calculated in a time window, thirty years sized, sliding over the whole studied time range (1952-2014), with trendline.

Disclaimer/Publisher’s Note: The statements, opinions and data contained in all publications are solely those of the individual author(s) and contributor(s) and not of MDPI and/or the editor(s). MDPI and/or the editor(s) disclaim responsibility for any injury to people or property resulting from any ideas, methods, instructions or products referred to in the content. |
© 2024 by the authors. Licensee MDPI, Basel, Switzerland. This article is an open access article distributed under the terms and conditions of the Creative Commons Attribution (CC BY) license (http://creativecommons.org/licenses/by/4.0/).
Copyright: This open access article is published under a Creative Commons CC BY 4.0 license, which permit the free download, distribution, and reuse, provided that the author and preprint are cited in any reuse.


