
Submitted:
13 March 2024
Posted:
14 March 2024
You are already at the latest version
Abstract
Climate change is challenging the agricultural sector worldwide. The pressure exerted by the altered thermal conditions drives the zonal shift for various cultivations. This study presents the multiyear analysis of the Growing Degree Days (GDD) index over the Northern Mediterranean Basin (NMB), focused on the high-value vine cultivation derived from the E-OBS dataset. To handle this extensive environmental dataset, R-language scripts and packages were applied, along with the capabilities of the GIS software. The investigated time period spans from 1969 to 2018, and the performed analysis indicates a broad shift/expansion in areas of GDD exceeding 2000 heat units. The extracted results specify the viticultural areas where the GDD index surpasses the suitable values for vine cultivation, owing to the increase of the thermal stress risk. In addition to mapping areas with GDD ≥ 2000, spatial calculations of the surface of areas meeting this criterion per country in the study area were made. In the northern parts of the NMB, the rise of the GDD index values indicates the establishment of vine plantations in the future.
Keywords:
Climate change
; agroclimate
; agroclimatic indices
; viticulture
; viticultural zoning
1. Introduction
A great number of surveys have extensively explored the relationship between agriculture and climate, given that atmospheric conditions are crucial factors influencing crop growth and development [1,2,3,4,5]. Variations in atmospheric conditions such as temperature, relative humidity, and precipitation may limit crop growth and productivity in the future. Latest-generation crop and climate models project markedly more pessimistic yield responses for major crops (e.g., maize, soybean, and rice) with climate impacts expected to occur before 2040 [6]. Therefore, the diverse spatial variability of climatic parameters [7,8] necessitates regionally focused and crop-specific research.
Viticulture, in particular, represents an integral constituent of the Mediterranean agricultural sector in direct financial terms and as a cultural factor [9,10]. Globally, vineyards are distributed among 34 countries, whereas Europe accounts for 53 % of the viticultural area, which is concentrated in Spain, France, Italy, and Portugal [11].
Temperature is the predominant driver of grapevine development and growth as it principally controls the evolution of fundamental phenophases (e.g., bud break, flowering, veraison, maturity) [12,13,14,15] and determines, therefore, viticultural production in terms of quality and quantity [10,16,17,18]. In addition, temperature plays a leading role in constraining the spatial/geographical distribution of grapevines, which may be overturned by the year 2100, as has been widely documented in projection investigations [10,18,19,20].
Although the vine is one of the most resilient crops to climate change (CC) [21], the latter is expected to form more xerothermic conditions over specific areas of the Northern Mediterranean Basin (henceforth NMB), such as the southeastern and central Europe, the Adriatic coastal countries and the Balkans [22,23,24,25] (. Temperature records with emphasis on viticultural areas reveal that from 1950 to 2000, the mean growing season temperature has already increased by approximately 1.6–1.8 °C in Europe and 1.2–1.4 °C globally [26,27].
Most recent CC projections by Sgubin et al., 2023 [28] have revealed a northward shift up to 3° and 8° of latitude of suitable viticultural regions under the RCP4.5 and RCP8.5 emission scenarios, respectively. These shifts may result in a net expansion of the total suitable areas of 33% under the RCP4.5 and 45% under the RCP8.5, with the concomitant area loss of traditional wine regions of approximately 20% and 55% for the respective scenarios. The authors concluded that viticultural production is majorly threatened by the suitability loss over the typical-traditional winegrowing regions, the reduction of which appears as non-linear.
Parallel to CC, extreme meteorological events (e.g., heatwaves, high-temperature incidents, droughts, floods) are becoming more frequent (significant probability increase) and severe [29], negatively impacting main viticultural European regions (e.g., yield reductions due to heatwaves and frost growing-period events) [30,31], also threatening their future fate [32]. Thus, it is of utmost importance to investigate yet model the changing agroclimatic conditions which have been projected to affect the NMB’s viticultural sector’s productivity in terms of quality and quantity, phenology timing of the vine, and of the viticultural areas’ geographical distribution [18].
Given that viticultural production is directly affected by the consequences of CC, it is imperative for the research community to develop and share accurate and user-friendly information and tools. A group of essential research studies has already been published using the advantage of datasets such as Agri4Cast, ERA, E-OBS, and other atmospheric big datasets [33,34,35,36].
Additionally, a wide range of agroclimatic indices have been developed to establish a connection between the atmospheric and agricultural environments on a climatic timescale [37,38,39,40]. These indices often quantify the thermal environment during crop growth making them vital for applications on various agricultural aspects such as the evaluation of agrometeorological conditions and related trends for staple crops [41,42,43,44], the estimation of the agrometeorological requirements on the plant phenology’s principal stages [45], the assessment and projections on agroclimatic suitability as on the evolution of viticultural zoning [46,47,48,49], the prediction of abiotic and biotic hazards in fruit production [50], for yield-production prediction [51,52], but even for policy and decision making and the implementation of adaptation strategies [53,54,55].
One of the most performant, simplest, and commonly utilized agroclimatic indexes is the growing degree days (GDD), which is related to the growth cycle of plants since it incorporates air temperature, which constitutes a widely available and highly effective atmospheric parameter [56,57,58]. The concept of heat units or thermal time was introduced by Reaumur in 1730, who recognized the significance of the accumulated heat as a critical ecophysiological factor for plants and as an important determinant of crop productivity [59,60]. GDD is based on the idea that the plant’s development will take place provided that the air temperature exceeds a specific base value for a certain time-period (number of days). Thus, each plant type best develops over its own specific base temperature (Tbase) [50].
For over 30 years, numerous agroclimatic studies have been based on the GDD requirements specified for a wide variety of crops, considering physiological characteristics, phenological observations, and growth stages [61,62,63,64,65,66,67], while variations in the GDD values have been exploited as significant indications of the CC effects on plants [68,69,70,71]. Therefore, the GDD index may be regarded as a classic, well-established, and applicable agroclimatic index due to its widespread and long-term use and its undemanding calculation based on accessible air temperature parameters.
Given the projected NMB’s vulnerability to Climate Change [18,22,23,72], numerous surveys of the aforementioned nature have been undertaken for the Basin’s traditional viticultural regions based on the GDD index. Phenology’s behavior assessment, modeling, seasonal forecasting, future projections, and past-future trends [73,74,75,76,77,78]; the impact of climate on harvest time; harvest variation and harvest period prediction [79,80]; growing season’s weather conditions description, thermal-climatic characterization appear as the most common aspects of scientific interest with matters on phenology and production quantity and quality aspects playing a leading role.
To our knowledge, from the conducted bibliographic review, most researchers are concentrated on specific country regions. At the same time, no scientific work has been documented regarding the spatial shifting of viticultural zones, mostly over the entire Northern Mediterranean territory, based on calculations of the GDD index during past timeframes. Thus, by focusing on the expected spatiotemporal alteration of the traditional viticultural regions over the NMB (Albania: AL, Bosnia-Herzegovina: BA, Bulgaria: BG, Croatia: HR, Cyprus: CY, France: FR, Greece: GR, Italy: IT, Montenegro: ME, N. Macedonia: MK, Portugal: PT, Romania: RO, Serbia: RS, Slovenia: SI, Spain: ES) and by also considering the aforementioned present and future wine-growing climatic constraints owing to the CC’s thermal warming, we proceeded to an examination attempt on the evolution of the entire areas’ agroclimatic trends for vine cultivation. Our investigation was performed over intervals, covering an extended and relatively recent past time frame (1969–2018) aiming to discover a probable shifting/ expansion of the surveyed viticultural zones.
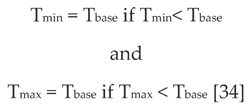
Following this objective, we estimated and visualized the distribution changes of the viticultural regions belonging to the NMB and corresponding to the crucial annual threshold (2000 heat units) of the critical and commonly applied GDD agroclimatic index. The GDD’s calculation derived from the highly accurate (of high spatial resolution ~10x10 km) atmospheric E-OBS dataset for three 10-year intervals: 1969–1978 (P1: Period 1), 1989–1998 (P2: Period 2) and 2009–2018 (P3: Period 3). The study aimed at illustrating (1) the spatial distribution of the areas that meet GDD values greater than 2000 units over the entire NMB at the P1, P2, and P3; (2) the kilometric evolution of the same areas (with GDD > 2000 units) per individual country at the P1, P2, and P3.
2. Materials and Methods
The selected area is the NMB which consists of 15 European countries (Albania: AL, Bosnia-Herzegovina: BA, Bulgaria: BG, Croatia: HR, Cyprus: CY, France: FR, Greece: GR, Italy: IT, Montenegro: ME, N. Macedonia: MK, Portugal: PT, Romania: RO, Serbia: RS, Slovenia: SI, Spain: ES) and constitutes a major epicenter of the vine world.
For the study, the high spatiotemporal resolution (~10x10 km) dataset of Ε-OBS (v19.0e) was utilized. As several comparison studies have revealed that the E-OBS comprises a considerably accurate and confident dataset [33,35] already exploited in a wide variety of related research [36,47,81]. For the calculation of the GDD, the following traditional/canonical formula [59] was applied based on the daily data of the E-OBS.
The calculations involve the 1950–2018 timeframe, and the input parameters are the daily minimum (Τmin) and maximum (Tmax) air temperature. The base temperature (Tbase) was set at 10oC. The starting point of the growing period was set for April, and its completion at the end of October. The equation (1) is utilized with the following adjustments:
3. Results and Discussion
The GDD accumulates in the thermal environment, which is fundamental for the biological cycle of crops. The crucial threshold for the vines is defined as 2000 GDD (annually), but there is also ‘cool–clixara mates’ viticulture even under agroclimatic conditions of less than 1000 GDD [84]. In order to examine the spatial evolution of the zones with GDD ≥ 2000 heat units, related maps (Figure 1, Figure 2 and Figure 3) of the time periods (P1: 1969–1 978; P2: 1989–1998; P3: 2009–2018) were produced. In addition, multiple barplots of the total surface with GDD ≥ 2000 for the individual countries included in the NMB are presented in Figure 4. It is of high importance to pinpoint that the GDD values are only one of the crucial factors of the atmospheric yet environmental requirements for successful vine cultivation in terms of quantity and quality. So, the values of the GDD exceeding the 2000 units are not evidence of environmental suitability for cultivation, given that the farmers should also consider supplementary parameters, e.g., the frost frequency, the thermal stress, the soil texture and fertility, and the water availability of the area.
As depicted by the purple-colored surfaces in Figure 1, the areas fulfilling the GDD ≥ 2000 criterion for the P1: 1969–1978 occur mainly in the southern part of the NMB. To the right, this part includes the half-southern coastline of the Italian Peninsula (IT), the Adriatic shoreline of Albania (AL), Montenegro (ME), Croatia (HR), a significant surface of mainland Greece (GR), and the country’s islands and almost the whole of Cyprus (CY). Moving to the right, parts of the NMB with GDD > 2000 at P1 involve the southern regions of Spain (ES) and Portugal (PT) (Iberic Peninsula), with the majority concentrated in the former country. It is worth mentioning that the E-OBS dataset for P1 didn’t detect the GDD ≥ 2000 zone in the traditional wine regions of northern France (FR) and Romania (RO).
The areas with GDD ≥ 2000 during the next time frame (P2: 1989–1998) are illustrated by the brown-colored parts of the investigated territory (Figure 2), indicating an expansion to higher altitudes and latitudes. More specifically, results for this period indicate more extended areas over the northern part of Italy (IT) (the valley from Milan to Venice) and the entire Peninsula’s coastline, along with a wider occupation of the Sicily and Sardinia Islands. New areas fulfilling the GDD criterion appear at P2, such as the Mediterranean shore of France (FR) and great parts of central and northeastern Spain (ES) (the Catalonia subregion), along with an extended area concentrated in the southern half of Portugal (PT).
The third period (P3: 2009–2018), involving the green-colored surfaces (Figure 3), indicates a significant expansion of the areas with GDD ≥ 2000 towards the northern regions, such as the area over Bulgaria (BG)–Romania (RO) boarders and the neighboring to the black sea parts of Romania (RO). The GDD ≥ 2000 areas are also spread over some mountainous landscapes of Greece (GR), mainly in the western part of the country. It is also denoted that, in P3, parts of Greece (GR) previously (P2, Figure 2) corresponding to the thermal units’ criterion, do not comply with the GDD threshold for grapevine cultivation (e.g., the entire island of Crete, eastern Peloponnese, and Attica). The most significant advancements of the regions with GDD ≥ 2000 are demonstrated over the eastern and northern Italian territory (IT), with a significantly wider occupation of the latter, which is also the case for the south shoreline of France (FR) and the southern and eastern parts of Spain (ES). It is also apparent that in the 2009–2018 period, almost all of Sardinia Island appeared favorable to winegrape cultivation.
The area (covered by GDD ≥ 2000) per country (Figure 4) reveals the phenomenon’s evolution with time. It is very important to mention that the E-OBS dataset has some gaps (empty cells), mainly in the perimeter during the last 15 years of the studied timeframe. To avoid serious inaccuracies and false conclusions, removing the pixels with non-complete series of data was considered appropriate. This intervention justifies the reduction of the covered area from the second (P2) to the third period (P3). In North Macedonia (MK) and Greece (GR), no climate cooling is recorded. The multiple bar plots in Figure 4 indicate a steady increase in the surface area under agroclimatic conditions of GDD ≥ 2000 due to CC. All the above findings are corroborated with previous related research, which indicates extensive shifting of GDD and vine areas to northern (in Europe) and higher areas [10,34,54,85,86,87]. Albania (from 4900 to 8800 km2), Montenegro (1100 to 2100 km2), Croatia (from 1300 to 8400 km2), and Bulgaria (from 300 to 6600 km2) are among the countries demonstrating relatively significant surface increases with GDD ≥ 2000, especially between the P1 and P3 intervals.
At this point, it is highlighted that there is a lack of scientific work on the spatiotemporal distribution of viticultural areas falling into the critical condition of GDD ≥ 2000 for the entire NMB and furthermore on the evolution of the viticultural zoning during past time frames. Most studies focus on demonstrating the index’s (along with other thermal accumulating indices) past and future trends and, majorly, at a regional scale. The outcomes, however, of such investigations confirm a future continuation of the northward and at higher elevation shifting trend of areas with GDD ≥ 2000, which has been previously demonstrated at P2 and P3 (Figure 2 and Figure 3, respectively) and were thus considered appropriate to be included in the discussion.
Europe
The aforementioned viticultural areas’ expansion trends have demonstrated a temporal potential future continuation by considering the scientific outcomes of surveys involving the projected CC by the end of the century. In these surveys, CC appears to be a major modification factor in present conditions in the current regions (favorable for winemaking), resulting in the emergence of new potential wine-producing areas. Malheiro et al. (2010) [88] have analyzed the impact of the projected future climatic changes on the European viticultural geography based on several bioclimatic indices, including the LGS (Length of the growing season), calculated as the number of days with mean temperatures above 10°C (GDD). The researchers concluded that the projected future CC might demarcate new potential areas for viticulture in western and central Europe. Santos et al. (2012) [89] have computed the Winkler index (GDD in °C) over Europe by using the E-OBS gridded daily temperature data set for the years 1950 to 2009. Resulting figures depicting the mean pattern of the index in 1950−2009 and the differences in the medians of the index between 1980−2009 and 1950−1979, have revealed significant increasing trends of the index and, particularly in the southwestern part of the continent and mainly over the Iberian Peninsula, France (FR) and Italy (IT)). Tóth and Végvári (2016) [90] have calculated the potential future area loss for the leading wine-producing countries in Europe, namely Portugal (PT), Spain (ES), France (FR), and Italy (IT). Their predictions using a pessimistic scenario (A1B) for 2050 and 2080, revealed an approximate loss of 2 to 48% accompanied by the northward shifting of the Mediterranean winegrowing regions. Similarly, Cardell et al. (2019) [91] have studied the prospects of agroclimatic indices (including the GDD) future evolution linked to viticultural zoning across Europe based on observed data (daily max and min temperatures from E-OBS dataset) and projected features (RCMs from the European CORDEX project under the RCP4.5 and RCP8.5 emission scenarios). The survey’s outcomes suggested negative effects on the wine grape growing in southern Europe but significant northward extensions of high-quality viticulture areas in the territory’s western and central parts.
By exploiting the formulation of GDD classed into the Winkler index, Moriondo et al. (2013) [92] have predicted the potential spatial expansion and/or shift of the possible grapevine cultivated area in 2020 and 2050 under the A2 and B2 SRES scenarios over the European domain. Results exhibited progressive shifts of the current wine growing areas to the north–northwest of their original ranges and the expansion or contraction of the viticultural regions owing to alterations in the region’s suitability for grapevine cultivation. The effect of climate warming was more evident in the southern regions of the NMB, which was attributed to the gradual disappearance, starting in 2020, of the climatic factors’ combination that had benefited the formation of wine production suitability of these regions in the present period (a period when the investigation was conducted). A significant number of grapevine regions over Spain (ES), Portugal (PT), and France (FR) were projected to lose suitability in inland areas. Some of the wine regions demonstrated shifts to higher elevations typically associated with area limitations. Characteristic cases are those of the Chianti area (northwestern Italy (IT)), which, for 2020, it was found to move from an average elevation of 211m a.s.l. to 450 and 455 m a.s.l. (A2 and B2) with a reduction of 83% and 77% of its area, respectively. Similar shifts resulted in La Mancha (central Spain (ES)) where a progressive shift to higher elevation (e.g., northward shifting by 0.9° to 1.6° Lat N in A2) was found to be accompanied by a large decrease in area in both scenarios.
Balkans
In their survey on the spatiotemporal estimation of the vine cultivations’ GDD in the Balkans region, Charalampopoulos et al. 2021 [34] have mapped the suitable areas for viticulture in the year 2020 based on the criterion of GDD ≥ 2000. The respective regions corresponded to the entire southern part of the Balkans and, more precisely, the coastal zone of Albania (AL), Montenegro (ME), Croatia (HR), and Slovenia (SI), together with Southern Romania (RO), which are also the case in the present study’s mapping results by 2018 for the same region (P3, Figure 3). Contrary to their findings, however, in the current investigation, the GDD criterion’s fulfillment resulted in a far lesser area of North Macedonia (MK), Serbia (RS), and Bulgaria (BG).
Individual Countries
Jones et al. (2005) [27] have conducted a climatic analysis over a long time series of at least 50 years (from 1952 to 2004) on European wine-growing areas located in France (FR), Italy (IT), Spain (ES) and have highlighted the increases in heat accumulation indices. They evidenced an average warming of 1.7 ◦C during the growing season and an average increase of the GDD by 245 units, e.g., for Colmar, Reims (northeastern France), Bordeaux (southwestern France), and Conegliano Veneto (northeastern Italy).
France (FR)
The calculations show a substantial GDD increase in France (from 5700 to 22100 km2). Our results are in line with previous published research. So, temperature warming during the past decades (between 1960 and 2010) has been demonstrated by Neethling et al. (2012) [93] for the northwestern parts of France (FR) (Loire Valley). The authors denoted increases in the GDD, which reached up to the maximum value of 360 units. Xu et al. (2012) have investigated the differences between the projected (the 2030s) and recent past (the 1970s) growing-season degree days (GDD) in Burgundy (eastern France (FR)). The research findings indicated a systematic strong increase of the GDD owing to the alterations in the growing season mean temperature and its spatial distribution. According to the authors, this trend allows potential regions best suited for sustainable premium wine production to move northward and towards higher elevations. Kurtural and Gambetta (2021) [94] have shown the substantial warming of the Bordeaux region in southwestern France (FR) from 1950 to 2020, contributing thus to a positive evolution of the average wine quality. Although the annual growing degree day (GDD) evolution (from approximately below 1500 annual units in 1950 to over 2000 units in 2020) with values markedly increasing in the early 1980s, the authors have expressed concerns about the ripening relationships (fruit-based metrics) which are ‘reaching a plateau’ and may thus lead to a turning point in traditional viticultural regions. For the same region (Bordeaux, southwestern France), Baciocco et al. (2014) [95] have computed the growing season GDD index from 1961 to 2009. Similar to P1 and P2 (Figure 1 and Figure 2, respectively) mean GDD didn’t display values over the 2000 units. Calculations of the GDD have also been performed by Davis et al. (2019) [96] based on data recorded over the Dijon (Côte-d’Or department, eastern France) for the 1961–2015 period. The index’s mean across all years revealed thermal accumulation of 1271 units (< 2000) as occurring for all examined periods (Figure 1, Figure 2 and Figure 3).
Italy (IT)
Eccel et al. (2016) [97] have reported significant changes in the mean thermal conditions during the growing season (higher GDD), which have led to substantial shifts in traditional winegrape areas in Trentino (Italian Alps). New climatic suitability is projected (2006–2070 period under the RCP 4.5 and RCP 8.5) for the mountain areas above 450 m a.s.l. Particularly for the white grapevine varieties (Müller Thurgau), while no wine growing limitations are projected for the lower altitude areas. Pallotti et al. (2022) [98] have characterized the seasonal (April to October) climate trends of the Matelica area (central Italy (IT)) for a period of almost thirty years (1989–2016). Based on the heat summation data (Winkler index; sum of GDD), the highest value of 1814 units was registered for the decade 1999–2008, with a mean value of 1748 units for the entire period (1989–2016), for which it was underlined that it exceeded the recorded in the years 1950 to 2000 by about 200 units. However, for the investigated area, values never exceeded the 2000 units as depicted in the examined periods of Figure 1, Figure 2 and Figure 3. As illustrated for northwestern Italy (Figure 3), GDD values < 2000 units were also estimated by Rocchetti et al. (2021) [99] for the Piacenza viticultural region (northern Italy) throughout the 8-year period from 1998 to 2005, where the highest value reached the 1975 thermal units. In their three-year survey (2017, 2018, and 2019) over four of south Tyrol’s locations (the northernmost point of Italy (IT)), Michelini et al. (2021) [100] have reported ranges of the GDD from 1603.1 to 1972.5 < of the 2000 units, as has also been demonstrated for the same region by the year 2018 (Figure 3). Teslić et al., 2017 [101] have detected climate shifts in the periods 1961−1990 and 1986−2015 over the viticultural appellation areas of the Emilia-Romagna region (northern Italy). A significant increase in the GDD value has been detected for the entire region, with an exhibited total trend of 371.98 units (6.1 units per year). Gentilesco et al. (2023) [102] have estimated an increase of the mean GDD value (or Winkler index) across the Apulia Region (southern Italy (IT)) from 2106 to 2368 units. This also applies to the present research, given the area’s correspondence to the GDD > 2000 threshold in all the investigated periods (Figure 1, Figure 2 and Figure 3). The authors also denoted the potential existence of areas still suitable for quality viticulture by 2081–2100 (based on the Shared Socioeconomic Pathway SSP2–4.5), mainly in the higher altitudes of the Murgia plateau, the Gargano promontory and the Pre–Apennine area. By using temperature observations from the E-OBS gridded dataset, Massano et al. (2023) [103]have estimated the heat accumulation during the growing season (GDD index) at the regional scale over a previous time scale of 39 years (1980–2019) in Italy (IT). In their results on the climate–productivity relationship, the authors mention that the GDD’s trend (units increase per year) reflects the country’s general temperature increase, with the region of Sicilia displaying a significant decreasing trend in vineyard area (-2.16 10^3 ha/year). Lanari et al. (2022) [104] have calculated heat accumulation over a period of 13 years (2007–2019) in eastern-central Italy’s Marche region in different periods of the grapevine annual cycle. The average GDD was higher than 2000 (2036) for the April- October interval, as illustrated in Figure 3 for P3. Vigl et al. (2017) [105] have assessed the potential extent of grape cultivation in the South Tyrolean Alps (northern Italy (IT)) by exploiting the Winkler Index (growing season’s mean daily temperature sum) for the years 2001 to 2013. The average values of the index were lower than the 2000 oC values for all examined locations, while the highest values were illustrated for the southern part of the entire area.
Spain (ES)
Moral et al. (2016) [106] have analyzed the potential effects of CC on the Winkler index (based on the GDD) considered in their study over the 1980–2011 period for the Extremadura region located in south-west Spain (ES). The researchers reported increasing trends of 16.12 units per year, summing up to a total of 484 units in 30 years. A few years later, the same researchers, Moral et al. (2022) [107], provided results on the temporal evolution of the GDD for the historical period (1971–2005) over the winegrowing areas of southwestern Spain (ES) (Extremadura) and showed an increase of the index’s values from 1800 to almost 2200 units. Similarly, this part of Spain exceeded the thermal limitation for grapevine growth as in all three of the present examined periods (Figure 1, Figure 2 and Figure 3). The authors also predicted that depending on the considered index and the emission scenario, 65% to 92% and 80% to 98% of the Extremadura region will be potentially unsuitable (too hot) for viticulture by 2036–2065 and by 2066–2095, respectively. Piña-Rey et al. (2020) [108] have documented a significant trend to an increase in the Winkler index (for temperatures between 1 April and 30 September) from 2000 to 2015 in the north-western Spain (ES). More specifically, analysis of the index’s variations for 1950–2015 showed higher values in the Euro Siberian area (approximately 1500 in the Ribeiro DO transition bioclimatic area and < 1000 in the more Mediterranean areas) and a more pronounced increase of 420 units in the DO areas located in the eastern Mediterranean area during the more recent and smaller time frame (2000–2015). This fact may be related to the expansion of the wine-growing areas in western Spain, as illustrated in Figure 3 compared with Figure 1 and Figure 2. Based on estimations of the annual evolution and long-term trends of the GDD (Winkler index over past decades (1958–2005) in the Rías Baixas, Lorenzo et al. (2013) [109] have shown positive trends of 36 GDD per decade in north-western Spain (ES). This temporal evolution reveals the viticultural future exploitation of the northern parts of Spain, which appears more probable given the expansion of grapevines, which was already shown in 2018 (Figure 3). Martínez de Toda and Ramos (2019) [110] have estimated the climatic conditions over six vineyards located in northern Spain (ES) and, more specifically, in Rioja Alta (RA1: Haro and Cenicero municipalities and RA2: Sotés and Alesanco) and in Rioja Oriental (RO), along the period 2008–2018. Results on the mean GDD during this period showed 1515, 1199, and 1800 values in RA1, RA2, and RO, respectively, all bellow the 2000 units, as is exhibited for the present study’s same spatiotemporal context (Figure 3). Intrigliolo et al. (2014) [111] have described the climatic conditions in the viticultural area of Valencia (southeastern Spain (ES)) during three consecutive seasons (2009, 2010 and 2011). The area’s temperature conditions were described as ‘typical for warm viticulture climates’, with GDD from April to October exceeding the 2290◦C in all years as presented for P3 (Figure 3).
Portugal (PT)
According to our findings in Portugal, a high spatial expansion of areas with GDD ≥ 2000 has been recorded (from 119000 to 64200 km2). Since the country is one of the most renowned wine producers, there are many published studies on the topic. More specifically, by utilizing a high-resolution climatic dataset (<1km), Fraga et al. (2016) [112] have demonstrated the present and future optimal climatic zones for specific varieties’ cultivation over Portugal (PT). Calculations of the GDD for the recent-past (1950–2000) over 12 Portuguese mainland viticultural regions exhibited mean values ranging from 1309 to 2116 units, while an intense future warming trend (years 2041–2060) was projected (RCP4.5 and 8.5 scenarios) involving the northward shifting and movement of cultivations to higher elevations. Wunderlich et al., 2023 [113] have performed predictions (by fitting suitability models of Vitis vinifera using environmental variables accounting for temperature, precipitation, soil properties, topography, and agricultural practice—irrigation) on the grapevine’s suitability over Portugal (PT) for a baseline period between the years 1981 and 2010. A more extensive spatial distribution of the high suitability areas at the northern and central-western, mostly coastal parts of the country, was displayed, and the result was far more limited under no irrigation conditions. Our study’s presented distribution of the vine areas with GDD > 2000 depicts similarities with the respective for the 1950–2000 period conducted over Portugal (PT) by Fraga et al. (2017) [114]. As in the present study, by the year 2000, the approximately lower half of the country was characterized by values of the GDD > 2000. The tendency for the increasing accumulated temperatures appears to continue in the future since projections for the years 2041–2070 under the IPCC A1B scenario suggest significant increases of the GDD, especially in the innermost regions of Portugal (PT), with values exceeding the 2700 thermal units.
Romania (RO)
As in the present study, results from past climatic trends reveal that Romanian viticulture will benefit from CC [115]. By conducting a comparative study on the influence of CC on southern Romanian’s viticulture between a relatively extended period (1998–2018) and the reference period (1961–1997), Bucur et al. (2019) [116] have documented the increase among other temperature dependent indices, of the Winkler index (based on the GDD) by 173 units. Donici et al. (2021) [117] have concluded that in Pietroasa (Bihor County, western Romania (RO), GDD ranges from 1662 to 1825 in the years 2010 to 2020, thus demonstrating GDD values < 2000 units as in P3 (Figure 3). Patriche and Irimia (2022) [86] have conducted more recent CC impact assessments on the country’s viticultural potential and have revealed that, compared to the reference period (1961–1990), the areas suitable for viticulture have expanded during the last decades (1991–2013). More precisely, the shifting of new regions in the plateau, hilly, and lower mountain areas from restrictive to suitable for wine grape cultivation (25245 km2, 10.6% of the country) is documented along with a rise of the upper limit for vine growing from 612m to 860m. These expansion trends align with the present study, given an increase of the areas with GDD > 2000 units by 30000 km2 in P3. According to the authors, there is an increase in the suitability for wine grape production at about one-third of the country (76833 km2, 32.2%), with the potential for red wine production having significantly increased at the lower elevations and the potential for white wines having migrated to higher elevations and latitudes.
Serbia (RS)
For the period 1981–2007, Ruml et al. (2016) [118] have shown significant increases in historical temperature parameters for the region of Sremski Karlovci (Vojvodina province, northern Serbia (RS)) relative to the rise of the estimated GDD by 12.0 units per year, depicting thus, significant temperature warming trends in northern Serbia (RS). According to Vujadinović Mandić et al. (2022) [119], the distribution of the suitable areas for viticulture over Serbia (RS) for the years 1998–2017 is illustrated over the central and mostly northern parts where the values of the Winkler index span from 1944 to 2700 oC reflecting a warmer category compared to the reference 1961–1990 period. The appearance of suitable areas in northern Serbia (RS) is coherent with our findings, given that a small area emerging with GDD > 2000 is exhibited for P3 (Figure 3). The researchers also documented that the average change shift of approximately 200m was toward higher elevations. Ruml et al. (2012) [118] have performed climate projections and revealed Serbia’s (SR) tendency towards warmer conditions by the year 2100. Comparisons between the present 1961–1990 reference period and the years 2001–2030 (SRES A1B scenario) and 2071–2100 (SRES A2 scenario) showed that the mountainous region of Zlatibor (western Serbia (SR)), presently having an average heat accumulation of 700 GDD, will probably reach approximately the 1600 GDD, by the end of the century. Furthermore, non-traditional viticultural regions (e.g., Pozega in western Serbia (SR) and Kursumlija and Dimitrovgrad in southern Serbia (SR)), presently averaging nearly 1200 GDD, are predicted as more favorable for viticulture with an estimated value of almost 2000 GDD. In the authors’ opinion, these alterations open up the possibility for the transformation of previously unsuitable (too cool) marginal and elevated areas to climatically friendly regions for viticulture. Stefanovic et al. (2021) [120] have estimated the GDD in the Negotinska Krajina wine region (eastern Serbia (RS)) over three consecutive experimental years (2011–2013). Results on the values of the index were 1784, 1976 and 1686 respectively for 2011, 2012 and 2013 demonstrating agreement with the GDD < 2000 units shown for eastern Serbia (RS) in the P3 (Figure 3). Marković et al. (2016) [77] report warmer trends in relation to the reference period (1981–2010) in Oplenac (central Serbia (RS), during the years 2010 and 2011. GDD, however didn’t exceed the 2000 units (e.g., GDD of 1562 and 1737, respectively for 2010 and 2011), as depicted for the same area in P3 (Figure 3).
Bosnia and Herzegovina (BA)
Most surveys on the impact of CC on grapevine cultivation in Bosnia and Herzegovina (BA) are based on other indices (Tebic et al., 2021) [121], the results of which are not in the scope of this study. However, Jovanović-Cvetković et al. (2023) [122] have estimated the GDD values over two viticultural regions in Herzegovina from 2000 to 2019. Similar to the distribution of the GDD > 2000 displayed in Figure 3, results exceeded the 2000 units in the Trebinje (2372.7 ◦C) and Mostar (2555.3 ◦C) southern localities.
Bulgaria (BG)
Tzanova et al. (2020) [123] have reported the average GDD for the period 2017–2019 in three viticultural districts of Bulgaria. The Danubian plain in northern Bulgaria (BG) (town of Pleven, 116m a.s.l.) was characterized by GDD of 3911◦C. In the Thracian lowland in southern Bulgaria and more specifically, the village of Mogilovo (Chirpan municipality, 312m a.s.l.) and the Village of Mezek (Svilengrad municipality, 168 m a.s.l.), the GDD was amounted to 3820 ◦C and 4346 ◦C, respectively. As demonstrated, the values exceed 2000 units, which is also the case for new areas in northern Bulgaria and the area of Svilengrad by 2018, as shown in Figure 3.
Montenegro (ME)
In their effort for the phenolic assessment of the Montenegrine wines produced in the Podgorica region (southern Montenegro (ME)) during the years 2015 and 2016, Pajović Šćepanović et al. (2019) [124] have given the “warm” characterization of the area owing to the exceeding of the 2000 units value of the GDD (GDD ≥ 2200), as shown for the southern part of the country in Figure 3.
Croatia
According to the results of Omazić et al., 2020 [85] on the spatial distribution of the GDD over Croatia (HR) for the historical period 1971–2000, similarities are evident given that values of the index ≥ 2000 units (1944–2222) correspond to the country’s southernmost Adriatic shoreline which is almost the case for P2 (Figure 2). Leder et al. (2021) [125], in their research on the geographical discrimination of Croatian wines, mention low values of the calculated GDD in both western and eastern continental Croatian regions, which ranged from 1323.9 to 1652.5 GDD for the investigated climatologic period (1988–2017). On the contrary, for the same period, coastal Croatia (HR) reached 2483.5 GDD units, which is in agreement with coastal areas of GDD > 2000 in P2 and P3 (Figure 2 and Figure 3). Similarly, Karoglan et al. (2018) [126] have documented increases in the GDD from the reference period 1961–1990 to the examined 1988–2017 time frame over major Croatian wine-growing regions. Increases were displayed for both continental and coastal areas, with the latter demonstrating values over the 2000 units’ threshold (e.g., Dalmacija in SW coastal Croatia (HR) with 2483 units, Hrvatsko Primorje and Istra in NW coastal Croatia (HR) with 2036 and 2095 units, respectively), as illustrated in Figure 3. Omazić et al., 2023 [127] have concluded that over the last 30 years, all wine-growing areas in Croatia (HR) have changed at least one wine-growing zone. Considering that this outcome also involves areas where wine grapes have never been cultivated, it becomes apparent that new regions evolve as suitable for the exploitation of some vine varieties.
Slovenia
Over an extended period between 1950 and 2009, heat accumulation indices (GDD) have displayed significant increases since 1980, which have been attributed by Vršič et al. (2014) [128] to the growing-season warming in Styria (northeastern Slovenia (SI). The authors conclude, with the hypothesis that the warming trends will continue to the same extent as estimated in the 1980−2009 period, that major changes shall be anticipated. Wine-growing areas where vineyards are located on steep slopes are proven to be more functional to customize the style of wine according to those trends. Potisek’s et al. (2023) [129] calculations of the GDD index for the growing season period in western Slovenia (SI) during the 2015 to 2017 vintages have resulted in values < 2000 units, as demonstrated in Figure 3 for P3. Similarly, calculations conducted by Šuklje et al. (2022) [130] for Litmerk (northeastern Slovenia) resulted in GDD respectively of 1674, 1876, and 1553 for the 2017, 2018, and 2019 vintages, exhibiting thus values below the threshold of the 2000 thermal units, as in Figure 3.
Albania
Kopali et al. (2021) [131] have assessed the Tirana vineyards’ (central Albania) agroclimatic suitability zones based on the Winkler Index calculated from historical climate data (1966–1990). The researchers demonstrated a variation of the index from < 1200°C to > 2200°C, indicative of an extensive suitability range for grapevines. It was concluded that a substantial part (approximately 60% to 70%) of the examined area is characterized as suitable for viticulture, as also depicted for central Albania in Figure 1 and Figure 2.
Greece
Most viticultural areas in Greece (GR) are currently experiencing warm to very warm agroclimatic conditions. In their attempt to identify the climate characteristics in wine regions in Greece (GR), Koufos et al. (2014) [132] demonstrated increasing temperature trends, which have led to significantly higher GDD over the 1950–2000 time period. Owing to the country’s complex physical geography, results have shown a 200 GDD increase ranging from 103 GDD at Anchialos (northern Greece (GR)–central Macedonia) to 362 GDD at Samos (southeastern Greece (GR)–Aegean Island). Anderson et al. (2014) [133] have utilized average monthly maximum and minimum temperature grids for the calculation of the GDD (represented in the Winkler Index) over Greece (GR) for the same period (1950 to 2000). The authors denoted increasing trends of the GDD owing to the warmer growing seasons, which were more evident in the island regions than in the mainland areas. From 1981 to 2010, significant shifts in regional classifications resulted in warmer and drier climate types, and increasing temperature trends have been identified [134]. Xyrafis et al. (2022) [135] have estimated the trends in the GDD (over March–August) between the years 1974 and 2019 for the island of Santorini located in the South Aegean of Greece (GR). They commented on a significant annual index increase by 10.4 per year. For the period of March to August, the average GDD was 1741 units from 1974 to 1982, 1951 units from 1982 to 2006, and 2162 units from 2006 to 2019. Lazoglou al. (2018) [136] have investigated the impacts of CC on Greek viticulture, using nine bioclimatic indices (including the GDD) for the years 1981–2100 with a control period from 1981 to 2000). Values of the GDD for the latter period fell into the range of 1940–2220 or exceeded the 2220 units particularly in the eastern and southern parts of the country, relative to the areas illustrated in Figure 2 and Figure 3 for the P2 and P3, respectively. The hottest GDD category (> 2220) was distributed over the majority of the islands but also found to extend over the mainland. On the contrary, the Greek mountainous regions (Pindos Mountain ridge) where characterised by values lower than the 1390 units. Along with most of the indices investigated, the GDD demonstrated positive spatiotemporal trends with projections for the 2041–2060 period, highlighting the extension of values > 2220 to the coastal areas and to the entire Greek region by the end of the studied period. Petropoulos et al. (2018) [137] have conducted a survey in representative wine regions of Nemea (northeastern Peloponnese, Greece (GR)). Similar values of the GDD resulted between years, all exceeding the 2000 units (2475, 2350, and 2282, respectively, for 2012, 2013, and 2014), as shown also for the same region in P3 (Figure 3). Investigations of Anastasiou et al. (2023) [138] on the growing season’s thermal conditions over the winegrape area of Corinth (southern Greece (GR)) for three successive years (2015, 2016, and 2017) have depicted GDD values below 2000 units (1974.2, 1966.5, and 1826.9),which is in line with Figure 3 for the respective region.
Cyprus
With the aim to investigate the performance of indigenous Cypriot winegrapes in Krasochoria (Lemesos, southern Cyprus (CY)), Copper et al. (2020) [139] have displayed results for the long term average GDD over the 1955–2017 period and over the studied years 2017, 2018 and 2019. All three seasons along with the long-term average GDD exhibited values > 2400 and near 2700 units. As in the mentioned investigation, almost the entire country exhibits GDD ≥ 2000 in the P1, P2, and P3 examined periods (Figures 1, 2, and 3).
4. Conclusions
The spatial and temporal distribution of additional atmospheric indicators and parameters (e.g., frost, precipitation, evapotranspiration etc.) should also be examined to draw a sound conclusion about the atmospheric suitability. Despite the gaps in its spatial perimeter, the E-OBS dataset arises as an asset for the agroclimatic assessment of the Mediterranean area. The temporal resolution (daily temperature data) and the accuracy of the estimated dataset’s parameters are fundamental. Spatial resolution is a limiting factor for investigations of this nature since the 10x10 km resolution may hide several significant narrow agricultural regions. However, the E-OBS can be fine-scaled by the utilization of downscaling methods. Hence, the E-OBS dataset could be of basic service to the extended bioclimatic modeling for essential cultivations such as the vine.
Based on the findings of the present investigation, it is evident that the rising temperature over the Northern Mediterranean Basin has led to an expansion of the suitable areas for viticulture according to the selected index. This fact provides the perspective for viticultural development over higher altitude (mountainous) and longitudinal (northern) areas, thus allowing the fulfillment of the vines’ water and thermal demands. The results highlight direct climate impacts on the viticultural zoning in the NMB over the last 50 years. Among the investigated countries, Croatia, Bulgaria, and Romania have demonstrated more significant expansionary tendencies’ which probably indicates an emerging viticultural sector.
These outcomes are of paramount importance since they may contribute knowledge on the prioritization, optimization, and assessment of the adaptation strategies involved in the preservation of the current and future winegrape production. Winemakers are facing challenges in mitigating the effects of CC due to the continuous warming conditions. To meet some of these challenges, growers should put maximum effort into adapting viticulture to future climate characteristics and trends, especially in the warmest areas. Innovative agricultural approaches (e.g., change and blending of varieties, proper harvest management, and evolution of wine-making technologies) will be mandatory to confront the effect of CC and ultimately maintain the quality and quantity of viticultural production. It becomes evident that the sector’s future management and fate lie in the comprehension and realization by viticulturists of the specific climate variables’ present and, therefore, future impact on all aspects of viticultural production.
This study has attempted to alleviate the linkage between the evolution of the thermal climate and its effects on the temporal alteration of the viticultural areas’ surface distribution. The provision of quantitative knowledge may contribute to specialized preparation and organized preparedness to deal with potentially imminent developments in the sustainability of viticulture under more adverse climate regimes possibly occurring in the future.
Author Contributions
Conceptualization, I.C. and P.T.N.; Methodology, I.C. and I.P.; Investigation, F.D., I.C., and I.P.; Resources, F.D.; Original Preparation and Writing, I.C., I.P. and P.T.N.; Writing on Data and Methods, I.C. and I.P.; Method Application and computation of Results, I.C. and I.P.; Table and Figures, I.C.; Discussion F.D. and I.C.; Review and Editing, F.D. All authors have read and agreed to the published version of the manuscript.
Funding
This research received no external funding.
Institutional Review Board Statement
Not applicable.
Informed Consent Statement
Not applicable.
Data Availability Statement
Data available upon request.
Conflicts of Interest
The authors declare no conflict of interest.
References
- Driesen, E.; Van den Ende, W.; De Proft, M.; Saeys, W. Influence of Environmental Factors Light, CO2, Temperature, and Relative Humidity on Stomatal Opening and Development: A Review. Agronomy 2020, 10, 1975. [Google Scholar] [CrossRef]
- Hwang, H.; An, S.; Pham, M.D.; Cui, M.; Chun, C. The Combined Conditions of Photoperiod, Light Intensity, and Air Temperature Control the Growth and Development of Tomato and Red Pepper Seedlings in a Closed Transplant Production System. Sustainability 2020, 12, 9939. [Google Scholar] [CrossRef]
- Verma, S.; Kumar, N.; Verma, A.; Singh, H.; Siddique, K.H.M.; Singh, N.P. Novel Approaches to Mitigate Heat Stress Impacts on Crop Growth and Development. Plant Physiol. Rep. 2020, 25, 627–644. [Google Scholar] [CrossRef]
- Hatfield, J.L.; Prueger, J.H. Temperature Extremes: Effect on Plant Growth and Development. Weather Clim. Extrem. 2015, 10, 4–10. [Google Scholar] [CrossRef]
- Sánchez, B.; Rasmussen, A.; Porter, J.R. Temperatures and the Growth and Development of Maize and Rice: A Review. Glob. Change Biol. 2014, 20, 408–417. [Google Scholar] [CrossRef]
- Jägermeyr, J.; Müller, C.; Ruane, A.C.; Elliott, J.; Balkovic, J.; Castillo, O.; Faye, B.; Foster, I.; Folberth, C.; Franke, J.A.; et al. Climate Impacts on Global Agriculture Emerge Earlier in New Generation of Climate and Crop Models. Nat. Food 2021, 2, 873–885. [Google Scholar] [CrossRef] [PubMed]
- Ghil, M.; Lucarini, V. The Physics of Climate Variability and Climate Change. Rev. Mod. Phys. 2020, 92, 035002. [Google Scholar] [CrossRef]
- Ongoma, V.; Chen, H. Temporal and Spatial Variability of Temperature and Precipitation over East Africa from 1951 to 2010. Meteorol. Atmospheric Phys. 2017, 129, 131–144. [Google Scholar] [CrossRef]
- Bindi, M.; Fibbi, L.; Gozzini, B.; Orlandini, S.; Miglietta, F. Modelling the Impact of Future Climate Scenarios on Yield and Yield Variability of Grapevine. Clim Res 1996, 7, 213–224. [Google Scholar] [CrossRef]
- Droulia, F.; Charalampopoulos, I. A Review on the Observed Climate Change in Europe and Its Impacts on Viticulture. Atmosphere 2022, 13, 837. [Google Scholar] [CrossRef]
- del Río, S.; Álvarez-Esteban, R.; Alonso-Redondo, R.; Hidalgo, C.; Penas, Á. A New Integrated Methodology for Characterizing and Assessing Suitable Areas for Viticulture: A Case Study in Northwest Spain. Eur. J. Agron. 2021, 131, 126391. [Google Scholar] [CrossRef]
- Xiao, F.; Yang, Z.Q.; Lee, K.W. Photosynthetic and Physiological Responses to High Temperature in Grapevine (Vitis Vinifera L.) Leaves during the Seedling Stage. J. Hortic. Sci. Biotechnol. 2017, 92, 2–10. [Google Scholar] [CrossRef]
- Pagay, V.; Collins, C. Effects of Timing and Intensity of Elevated Temperatures on Reproductive Development of Field-Grown Shiraz Grapevines. OENO One 2017, 51. [Google Scholar] [CrossRef]
- Cameron, W.; Petrie, P.R.; Barlow, E.W.R. The Effect of Temperature on Grapevine Phenological Intervals: Sensitivity of Budburst to Flowering. Agric. For. Meteorol. 2022, 315, 108841. [Google Scholar] [CrossRef]
- de Rességuier, L.; Mary, S.; Le Roux, R.; Petitjean, T.; Quénol, H.; van Leeuwen, C. Temperature Variability at Local Scale in the Bordeaux Area. Relations With Environmental Factors and Impact on Vine Phenology. Front. Plant Sci. 2020, 11, 515. [Google Scholar] [CrossRef] [PubMed]
- Jones, G.V.; Davis, R.E. Climate Influences on Grapevine Phenology, Grape Composition, and Wine Production and Quality for Bordeaux, France. Am J Enol Vitic 2000, 51, 249–261. [Google Scholar] [CrossRef]
- Poni, S.; Gatti, M.; Palliotti, A.; Dai, Z.; Duchêne, E.; Truong, T.-T.; Ferrara, G.; Matarrese, A.M.S.; Gallotta, A.; Bellincontro, A.; et al. Grapevine Quality: A Multiple Choice Issue. Sci. Hortic. 2018, 234, 445–462. [Google Scholar] [CrossRef]
- Droulia, F.; Charalampopoulos, I. Future Climate Change Impacts on European Viticulture: A Review on Recent Scientific Advances. Atmosphere 2021, 12, 495. [Google Scholar] [CrossRef]
- Fraga, H.; Malheiro, A.C.; Moutinho-Pereira, J.; Jones, G.V.; Alves, F.; Pinto, J.G.; Santos, J.A. Very High Resolution Bioclimatic Zoning of Portuguese Wine Regions: Present and Future Scenarios. Reg. Environ. Change 2014, 14, 295–306. [Google Scholar] [CrossRef]
- Fraga, H.; Malheiro, A.C.; Moutinho-Pereira, J.; Cardoso, R.M.; Soares, P.M.M.; Cancela, J.J.; Santos, J.A. Integrated Analysis of Climate, Soil, Topography and Vegetative Growth in Iberian Viticultural Regions. PLoS ONE 2014, 9, 108078. [Google Scholar] [CrossRef]
- Venios, X.; Korkas, E.; Nisiotou, A.; Banilas, G. Grapevine Responses to Heat Stress and Global Warming. Plants 2020, 9, 1754. [Google Scholar] [CrossRef]
- Charalampopoulos, I.; Droulia, F.; Kokkoris, I.P.; Dimopoulos, P. Future Bioclimatic Change of Agricultural and Natural Areas in Central Europe: An Ultra-High Resolution Analysis of the De Martonne Index. Water 2023, 15, 2563. [Google Scholar] [CrossRef]
- Charalampopoulos, I.; Droulia, F.; Evans, J. The Bioclimatic Change of the Agricultural and Natural Areas of the Adriatic Coastal Countries. Sustainability 2023, 15, 4867. [Google Scholar] [CrossRef]
- Charalampopoulos, I.; Droulia, F. Frost Conditions Due to Climate Change in South-Eastern Europe via a High-Spatiotemporal-Resolution Dataset. Atmosphere 2022, 13, 1407. [Google Scholar] [CrossRef]
- Charalampopoulos, I.; Droulia, F. The Agro-Meteorological Caused Famines as an Evolutionary Factor in the Formation of Civilisation and History: Representative Cases in Europe. Climate 2021, 9, 5. [Google Scholar] [CrossRef]
- Fraga, H.; Malheiro, A.C.; Moutinho-Pereira, J.; Santos, J.A. An Overview of Climate Change Impacts on European Viticulture. Food Energy Secur. 2012, 1, 94–110. [Google Scholar] [CrossRef]
- Jones, G.V.; White, M.A.; Cooper, O.R.; Storchmann, K. Climate Change and Global Wine Quality. Clim Change 2005, 73, 319–343. [Google Scholar] [CrossRef]
- Sgubin, G.; Swingedouw, D.; Mignot, J.; Gambetta, G.A.; Bois, B.; Loukos, H.; Noël, T.; Pieri, P.; García de Cortázar-Atauri, I.; Ollat, N.; et al. Non-Linear Loss of Suitable Wine Regions over Europe in Response to Increasing Global Warming. Glob. Change Biol. 2023, 29, 808–826. [Google Scholar] [CrossRef]
- Zittis, G.; Almazroui, M.; Alpert, P.; Ciais, P.; Cramer, W.; Dahdal, Y.; Fnais, M.; Francis, D.; Hadjinicolaou, P.; Howari, F.; et al. Climate Change and Weather Extremes in the Eastern Mediterranean and Middle East. Rev. Geophys. 2022, 60, e2021RG000762. [Google Scholar] [CrossRef]
- Fraga, H.; Molitor, D.; Leolini, L.; Santos, J.A. What Is the Impact of Heatwaves on European Viticulture? A Modelling Assessment. Appl. Sci. 2020, 10, 3030. [Google Scholar] [CrossRef]
- Vautard, R.; van Oldenborgh, G.J.; Bonnet, R.; Li, S.; Robin, Y.; Kew, S.; Philip, S.; Soubeyroux, J.-M.; Dubuisson, B.; Viovy, N.; et al. Human Influence on Growing-Period Frosts like in Early April 2021 in Central France. Nat. Hazards Earth Syst. Sci. 2023, 23, 1045–1058. [Google Scholar] [CrossRef]
- Fonseca, A.; Fraga, H.; Santos, J.A. Exposure of Portuguese Viticulture to Weather Extremes under Climate Change. Clim. Serv. 2023, 30, 100357. [Google Scholar] [CrossRef]
- Bandhauer, M.; Isotta, F.; Lakatos, M.; Lussana, C.; Båserud, L.; Izsák, B.; Szentes, O.; Tveito, O.E.; Frei, C. Evaluation of Daily Precipitation Analyses in E-OBS (V19.0e) and ERA5 by Comparison to Regional High-Resolution Datasets in European Regions. Int. J. Climatol. 2022, 42, 727–747. [Google Scholar] [CrossRef]
- Charalampopoulos, I.; Polychroni, I.; Psomiadis, E.; Nastos, P. Spatiotemporal Estimation of the Olive and Vine Cultivations’ Growing Degree Days in the Balkans Region. Atmosphere 2021, 12, 148. [Google Scholar] [CrossRef]
- Mavromatis, T.; Voulanas, D. Evaluating ERA-Interim, Agri4Cast and E-OBS Gridded Products in Reproducing Spatiotemporal Characteristics of Precipitation and Drought over a Data Poor Region: The Case of Greece. Int. J. Climatol. 2021, 41, 2118–2136. [Google Scholar] [CrossRef]
- Photiadou, C.; Fontes, N.; Graça, A.R.; Schrier, G. van der ECA&D and E-OBS: High-Resolution Datasets for Monitoring Climate Change and Effects on Viticulture in Europe. BIO Web Conf. 2017, 9, 01002. [Google Scholar] [CrossRef]
- Saadi, S.; Todorovic, M.; Tanasijevic, L.; Pereira, L.S.; Pizzigalli, C.; Lionello, P. Climate Change and Mediterranean Agriculture: Impacts on Winter Wheat and Tomato Crop Evapotranspiration, Irrigation Requirements and Yield. Agric. Water Manag. 2015, 147, 103–115. [Google Scholar] [CrossRef]
- Faraslis, I.; Dalezios, N.R.; Alpanakis, N.; Tziatzios, G.A.; Spiliotopoulos, M.; Sakellariou, S.; Sidiropoulos, P.; Dercas, N.; Domínguez, A.; Martínez-López, J.A.; et al. Remotely Sensed Agroclimatic Classification and Zoning in Water-Limited Mediterranean Areas towards Sustainable Agriculture. Remote Sens. 2023, 15, 5720. [Google Scholar] [CrossRef]
- García de Cortázar-Atauri, I.; Duchêne, E.; Destrac-Irvine, A.; Barbeau, G.; De Rességuier, L.; Lacombe, T.; Parker, A.; Saurin, N.; van Leeuwen, C. Grapevine Phenology in France: From Past Observations to Future Evolutions in the Context of Climate Change. 2017.
- Ferretti, C.G. A New Geographical Classification for Vineyards Tested in the South Tyrol Wine Region, Northern Italy, on Pinot Noir and Sauvignon Blanc Wines. Ecol. Indic. 2020, 108, 105737. [Google Scholar] [CrossRef]
- Charalampopoulos, I. Agrometeorological Conditions and Agroclimatic Trends for the Maize and Wheat Crops in the Balkan Region. Atmosphere 2021, 12, 671. [Google Scholar] [CrossRef]
- Mavromatis, T.; Georgoulias, A.K.; Akritidis, D.; Melas, D.; Zanis, P. Spatiotemporal Evolution of Seasonal Crop-Specific Climatic Indices under Climate Change in Greece Based on EURO-CORDEX RCM Simulations. Sustainability 2022, 14, 17048. [Google Scholar] [CrossRef]
- Croitoru, A.-E.; Man, T.C.; Vâtcă, S.D.; Kobulniczky, B.; Stoian, V. Refining the Spatial Scale for Maize Crop Agro-Climatological Suitability Conditions in a Region with Complex Topography towards a Smart and Sustainable Agriculture. Case Study: Central Romania (Cluj County). Sustainability 2020, 12, 2783. [Google Scholar] [CrossRef]
- Teslić, N.; Zinzani, G.; Parpinello, G.P. Climate Change Trends, Grape Production, and Potential Alcohol Concentration in Wine from the “Romagna Sangiovese” Appellation Area (Italy. Theor Appl Clim. 2018, 131, 793–803. [Google Scholar] [CrossRef]
- Vâtcă, S.D.; Stoian, V.A.; Man, T.C.; Horvath, C.; Vidican, R.; Gâdea, Ștefania; Vâtcă, A. ; Rotaru, A.; Vârban, R.; Cristina, M.; et al. Agrometeorological Requirements of Maize Crop Phenology for Sustainable Cropping—A Historical Review for Romania. Sustainability 2021, 13, 7719. [Google Scholar] [CrossRef]
- Adão, F.; Campos, J.C.; Santos, J.A.; Malheiro, A.C.; Fraga, H. Relocation of Bioclimatic Suitability of Portuguese Grapevine Varieties under Climate Change Scenarios. Front. Plant Sci. 2023, 14. [Google Scholar] [CrossRef]
- Fraga, H.; Malheiro, A.C.; Moutinho-Pereira, J.; Santos, J.A. Future Scenarios for Viticultural Zoning in Europe: Ensemble Projections and Uncertainties. Int J Biometeorol 2013, 57, 909–925. [Google Scholar] [CrossRef]
- Irimia, L.M.; Patriche, C.V.; Roșca, B. Climate Change Impact on Climate Suitability for Wine Production in Romania. Theor. Appl. Climatol. 2018, 133, 1–14. [Google Scholar] [CrossRef]
- Gaitán, E.; Pino-Otín, M.R. Using Bioclimatic Indicators to Assess Climate Change Impacts on the Spanish Wine Sector. Atmospheric Res. 2023, 286, 106660. [Google Scholar] [CrossRef]
- Łysiak, G.P.; Szot, I. The Use of Temperature Based Indices for Estimation of Fruit Production Conditions and Risks in Temperate Climates. Agriculture 2023, 13, 960. [Google Scholar] [CrossRef]
- Ballesteros, R.; Ortega, J.F.; Hernandez, D.; del Campo, A.; Moreno, M.A. Combined Use of Agro-Climatic and Very High-Resolution Remote Sensing Information for Crop Monitoring. Int. J. Appl. Earth Obs. Geoinformation 2018, 72, 66–75. [Google Scholar] [CrossRef]
- Mathieu, J.A.; Aires, F. Assessment of the Agro-Climatic Indices to Improve Crop Yield Forecasting. Agric. For. Meteorol. 2018, 253–254, 15–30. [Google Scholar] [CrossRef]
- Paramesh, V.; Kumar, P.; Shamim, M.; Ravisankar, N.; Arunachalam, V.; Nath, A.J.; Mayekar, T.; Singh, R.; Prusty, A.K.; Rajkumar, R.S.; et al. Integrated Farming Systems as an Adaptation Strategy to Climate Change: Case Studies from Diverse Agro-Climatic Zones of India. Sustainability 2022, 14, 11629. [Google Scholar] [CrossRef]
- Santos, J.A.; Fraga, H.; Malheiro, A.C.; Moutinho-Pereira, J.; Dinis, L.-T.; Correia, C.; Moriondo, M.; Leolini, L.; Dibari, C.; Costafreda-Aumedes, S.; et al. A Review of the Potential Climate Change Impacts and Adaptation Options for European Viticulture. Appl. Sci. 2020, 10, 3092. [Google Scholar] [CrossRef]
- Mozny, M.; Hajkova, L.; Vlach, V.; Ouskova, V.; Musilova, A. Changing Climatic Conditions in Czechia Require Adaptation Measures in Agriculture. Climate 2023, 11, 210. [Google Scholar] [CrossRef]
- Bonhomme, R. Bases and Limits to Using ‘Degree.Day’ Units. Eur. J. Agron. 2000, 13, 1–10. [Google Scholar] [CrossRef]
- Sgubin, G.; Swingedouw, D.; Dayon, G.; García de Cortázar-Atauri, I.; Ollat, N.; Pagé, C.; van Leeuwen, C. The Risk of Tardive Frost Damage in French Vineyards in a Changing Climate. Agric. For. Meteorol. 2018, 250–251, 226–242. [Google Scholar] [CrossRef]
- Parker, A.K.; Cortázar-Atauri, I.G.D.; Leeuwen, C.V.; Chuine, I. General Phenological Model to Characterise the Timing of Flowering and Veraison of Vitis Vinifera L. Aust. J. Grape Wine Res. 2011, 17, 206–216. [Google Scholar] [CrossRef]
- McMaster, G.S.; Wilhelm, W.W. Growing Degree-Days: One Equation, Two Interpretations. Agric. For. Meteorol. 1997, 87, 291–300. [Google Scholar] [CrossRef]
- Wang, J.Y. A Critique of the Heat Unit Approach to Plant Response Studies. Ecology 1960, 41, 785–790. [Google Scholar] [CrossRef]
- Navrátilová, M.; Beranová, M.; Severová, L.; Šrédl, K.; Svoboda, R.; Abrhám, J. The Impact of Climate Change on the Sugar Content of Grapes and the Sustainability of Their Production in the Czech Republic. Sustainability 2021, 13, 222. [Google Scholar] [CrossRef]
- Qian, B.; Zhang, X.; Chen, K.; Feng, Y.; O’Brien, T. Observed Long-Term Trends for Agroclimatic Conditions in Canada. J. Appl. Meteorol. Climatol. 2010, 49, 604–618. [Google Scholar] [CrossRef]
- Kenealy, L.; Reighard, G.; Rauh, B.; Bridges Jr., W. Predicting Peach Maturity Dates in South Carolina with a Growing Degree Day Model. Acta Hortic. 2015, 479–752. [Google Scholar] [CrossRef]
- Asseng, S.; Ewert, F.; Martre, P.; Rötter, R.P.; Lobell, D.B.; Cammarano, D.; Kimball, B.A.; Ottman, M.J.; Wall, G.W.; White, J.W.; et al. Rising Temperatures Reduce Global Wheat Production. Nat. Clim. Change 2015, 5, 143–147. [Google Scholar] [CrossRef]
- Zhang, S.; Tao, F.; Zhang, Z. Changes in Extreme Temperatures and Their Impacts on Rice Yields in Southern China from 1981 to 2009. Field Crops Res. 2016, 189, 43–50. [Google Scholar] [CrossRef]
- Liu, Y.; Su, L.; Wang, Q.; Zhang, J.; Shan, Y.; Deng, M. Chapter Six - Comprehensive and Quantitative Analysis of Growth Characteristics of Winter Wheat in China Based on Growing Degree Days. In Advances in Agronomy; Sparks, D.L., Ed.; Academic Press, 2020; Vol. 159, pp. 237–273.
- Anandhi, A. Growing Degree Days—Ecosystem Indicator for Changing Diurnal Temperatures and Their Impact on Corn Growth Stages in Kansas. Ecol. Indic. 2016, 61, 149–158. [Google Scholar] [CrossRef]
- Grigorieva, E. Evaluating the Sensitivity of Growing Degree Days as an Agro-Climatic Indicator of the Climate Change Impact: A Case Study of the Russian Far East. Atmosphere 2020, 11, 404. [Google Scholar] [CrossRef]
- Ahmed, S.M. Climatic Change Impacts on Growing Degree Days and Climatologically Suitable Cropping Areas in the Eastern Nile Basin. Agric. Res. 2021, 10, 72–82. [Google Scholar] [CrossRef]
- Kukal, M.S.; Irmak, S. U.S. Agro-Climate in 20th Century: Growing Degree Days, First and Last Frost, Growing Season Length, and Impacts on Crop Yields. Sci. Rep. 2018, 8, 6977–6977. [Google Scholar] [CrossRef]
- Bernáth, S.; Paulen, O.; Šiška, B.; Kusá, Z.; Tóth, F. Influence of Climate Warming on Grapevine (Vitis Vinifera L.) Phenology in Conditions of Central Europe (Slovakia. Plants 2021, 10, 1020. [Google Scholar] [CrossRef] [PubMed]
- Charalampopoulos, I.; Droulia, F.; Tsiros, I.X. Projecting Bioclimatic Change over the South-Eastern European Agricultural and Natural Areas via Ultrahigh-Resolution Analysis of the de Martonne Index. Atmosphere 2023, 14, 858. [Google Scholar] [CrossRef]
- Cortiñas, J.A.; Fernández-González, M.; González-Fernández, E.; Vázquez-Ruiz, R.A.; Rodríguez-Rajo, F.J.; Aira, M.J. Phenological Behaviour of the Autochthonous Godello and Mencía Grapevine Varieties in Two Designation Origin Areas of the NW Spain. Sci. Hortic. 2020, 265, 109221. [Google Scholar] [CrossRef]
- Rodrigues, P.; Pedroso, V.; Henriques, C.; Matos, A.; Reis, S.; Santos, J.A. Modelling the Phenological Development of Cv. Touriga Nacional and Encruzado in the Dão Wine Region, Portugal. OENO One 2021, 55, 337–352. [Google Scholar] [CrossRef]
- García de Cortázar-Atauri, I.; Brisson, N.; Ollat, N.; Jacquet, O.; Payan, J.-C. Asynchronous Dynamics of Grapevine (“Vitis Vinifera”) Maturation: Experimental Study for a Modelling Approach. OENO One 2009, 43, 83–97. [Google Scholar] [CrossRef]
- Grillakis, M.G.; Doupis, G.; Kapetanakis, E.; Goumenaki, E. Future Shifts in the Phenology of Table Grapes on Crete under a Warming Climate. Agric. For. Meteorol. 2022, 318, 108915. [Google Scholar] [CrossRef]
- Marković, N.; Pržić, Z.; Tešević, V.; Vukovic, A.; Mutavdžić, D.; Vujadinović, M.; Ruml, M. Variation of Aromatic Compounds in ‘Cabernet Sauvignon’ Wine under the Influence of Different Weather Conditions and Harvest Dates. Acta Hortic. 2016, 701–708. [Google Scholar] [CrossRef]
- Žnidaršič, Z.; Gregorič, G.; Sušnik, A.; Pogačar, T. Frost Risk Assessment in Slovenia in the Period of 1981–2020. Atmosphere 2023, 14, 683. [Google Scholar] [CrossRef]
- Koufos, G.; Mavromatis, T.; Koundouras, S.; Fyllas, N.M. Viticulture: Climate Relationships in Greece and Impacts of Recent Climate Trends: Sensitivity to “Effective” Growing Season Definitions. In Advances in Meteorology, Climatology and Atmospheric Physics; Helmis, C.G., Nastos, P.T., Eds.; Springer Atmospheric Sciences; Springer Berlin Heidelberg: Berlin, Heidelberg, 2013; pp. 555–561 ISBN 978‐3‐642‐29171‐5. [Google Scholar]
- Alonso, F.; Chiamolera, F.M.; Hueso, J.J.; González, M.; Cuevas, J. Heat Unit Requirements of “Flame Seedless” Table Grape: A Tool to Predict Its Harvest Period in Protected Cultivation. Plants 2021, 10, 904. [Google Scholar] [CrossRef]
- Fraga, H.; Santos, J. a. Daily Prediction of Seasonal Grapevine Production in the Douro Wine Region Based on Favourable Meteorological Conditions. Aust. J. Grape Wine Res. 2017, 23, 296–304. [Google Scholar] [CrossRef]
- R Core Team R: A Language and Environment for Statistical Computing. Available online: https://www.R-project.org/ (accessed on 11 July 2022).
- QGIS Development Team QGIS Geographic Information System 2009.
- Schultze, S.R.; Sabbatini, P. Implications of a Climate-Changed Atmosphere on Cool-Climate Viticulture. J. Appl. Meteorol. Climatol. 2019, 58, 1141–1153. [Google Scholar] [CrossRef]
- Omazić, B.; Prtenjak, M.T.; Prša, I.; Vozila, A.B.; Vučetić, V.; Karoglan, M.; Kontić, J.K.; Prša, Ž.; Anić, M.; Šimon, S.; et al. Climate Change Impacts on Viticulture in Croatia: Viticultural Zoning and Future Potential. Int. J. Climatol. 2020, 40, 5634–5655. [Google Scholar] [CrossRef]
- Patriche, C.V.; Irimia, L.M. Mapping the Impact of Recent Climate Change on Viticultural Potential in Romania. Theor. Appl. Climatol. 2022. [Google Scholar] [CrossRef]
- Spinoni, J.; Vogt, J.; Barbosa, P. European Degree-Day Climatologies and Trends for the Period 1951-2011. Int. J. Climatol. 2015, 35, 25–36. [Google Scholar] [CrossRef]
- Malheiro, A.C.; Santos, J.A.; Fraga, H.; Pinto, J.G. Climate Change Scenarios Applied to Viticultural Zoning in Europe. Clim. Res. 2010, 43, 163–177. [Google Scholar] [CrossRef]
- Santos, J.A.; Malheiro, A.C.; Pinto, J.G.; Jones, G.V. Macroclimate and Viticultural Zoning in Europe: Observed Trends and Atmospheric Forcing. Clim. Res. 2012, 51, 89–103. [Google Scholar] [CrossRef]
- Tóth, J. p.; Végvári, Z. Future of Winegrape Growing Regions in Europe. Aust. J. Grape Wine Res. 2016, 22, 64–72. [Google Scholar] [CrossRef]
- Cardell, M.F.; Amengual, A.; Romero, R. Future Effects of Climate Change on the Suitability of Wine Grape Production across Europe. Reg. Environ. Change 2019, 19, 2299–2310. [Google Scholar] [CrossRef]
- Moriondo, M.; Jones, G.V.; Bois, B.; Dibari, C.; Ferrise, R.; Trombi, G.; Bindi, M. Projected Shifts of Wine Regions in Response to Climate Change. Clim Chang 2013, 119, 825–839. [Google Scholar] [CrossRef]
- Neethling, E.; Barbeau, G.; Bonnefoy, C.; Quénol, H. Change in Climate and Berry Composition for Grapevine Varieties Cultivated in the Loire Valley. Clim. Res. 2012, 53, 89–101. [Google Scholar] [CrossRef]
- Kurtural, S.K.; Gambetta, G.A. Global Warming and Wine Quality: Are We Close to the Tipping Point? OENO One 2021, 55, 353–361. [Google Scholar] [CrossRef]
- Baciocco, K.; Davis, R.; Jones, G. Climate and Bordeaux Wine Quality: Identifying the Key Factors That Differentiate Vintages Based on Consensus Rankings. J. Wine Res. 2014, 25, 75–90. [Google Scholar] [CrossRef]
- Davis, R.E.; Dimon, R.A.; Jones, G.V.; Bois, B. The Effect of Climate on Burgundy Vintage Quality Rankings. OENO One 2019, 53. [Google Scholar] [CrossRef]
- Eccel, E.; Zollo, A.L.; Mercogliano, P.; Zorer, R. Simulations of Quantitative Shift in Bio-Climatic Indices in the Viticultural Areas of Trentino (Italian Alps) by an Open Source R Package. Comput. Electron. Agric. 2016, 127, 92–100. [Google Scholar] [CrossRef]
- Pallotti, L.; Potentini, R.; Casturà, T.; Lanari, V.; Lattanzi, T.; Dottori, E.; Silvestroni, O. Analysis of Verdicchio Harvest Data in Matelica Appellation Area during the 1989-2016 Time Series. BIO Web Conf. 2022, 44, 02009. [Google Scholar] [CrossRef]
- Rocchetti, G.; Ferrari, F.; Trevisan, M.; Bavaresco, L. Impact of Climatic Conditions on the Resveratrol Concentration in Blend of Vitis Vinifera L. Cvs. Barbera and Croatina Grape Wines. Molecules 2021, 26, 401. [Google Scholar] [CrossRef]
- Michelini, S.; Tomada, S.; Kadison, A.E.; Pichler, F.; Hinz, F.; Zejfart, M.; Iannone, F.; Lazazzara, V.; Sanoll, C.; Robatscher, P.; et al. Modeling Malic Acid Dynamics to Ensure Quality, Aroma and Freshness of Pinot Blanc Wines in South Tyrol (Italy). OENO One 2021, 55, 159–179. [Google Scholar] [CrossRef]
- Teslić, N.; Vujadinović, M.; Ruml, M.; Antolini, G.; Vuković, A.; Parpinello, G.P.; Ricci, A.; Versari, A. Climatic Shifts in High Quality Wine Production Areas, Emilia Romagna, Italy, 1961-2015. Clim. Res. 2017, 73, 195–206. [Google Scholar] [CrossRef]
- Gentilesco, G.; Coletta, A.; Tarricone, L.; Alba, V. Bioclimatic Characterization Relating to Temperature and Subsequent Future Scenarios of Vine Growing across the Apulia Region in Southern Italy. Agriculture 2023, 13, 644. [Google Scholar] [CrossRef]
- Massano, L.; Fosser, G.; Gaetani, M.; Bois, B. Assessment of Climate Impact on Grape Productivity: A New Application for Bioclimatic Indices in Italy. Sci. Total Environ. 2023, 905, 167134. [Google Scholar] [CrossRef]
- Lanari, V.; Zacconi, F.M.; Illuminati, S.; Gigli, L.; Canullo, G.; Lattanzi, T.; Dottori, E.; Silvestroni, O. Seasonal Evolution Impact on Montepulciano Grape Ripening. BIO Web Conf. 2022, 44, 01001. [Google Scholar] [CrossRef]
- Vigl, E.L.; Tasser, E.; Williams, S.; Tappeiner, U. Defining Suitable Zones for Viticulture on the Basis of Landform and Environmental Characteristics: A Case Study from the South Tyrolean Alps.; 2017. 29 March.
- Moral, F.J.; Rebollo, F.J.; Paniagua, L.L.; García, A.; de Salazar, E.M. Application of Climatic Indices to Analyse Viticultural Suitability in Extremadura, South-Western Spain. Theor. Appl. Climatol. 2016, 123, 277–289. [Google Scholar] [CrossRef]
- Moral, F.J.; Aguirado, C.; Alberdi, V.; García-Martín, A.; Paniagua, L.L.; Rebollo, F.J. Future Scenarios for Viticultural Suitability under Conditions of Global Climate Change in Extremadura, Southwestern Spain. Agriculture 2022, 12, 1865. [Google Scholar] [CrossRef]
- Piña-Rey, A.; González-Fernández, E.; Fernández-González, M.; Lorenzo, M.N.; Rodríguez-Rajo, F.J. Climate Change Impacts Assessment on Wine-Growing Bioclimatic Transition Areas. Agriculture 2020, 10, 605. [Google Scholar] [CrossRef]
- Lorenzo, M.N.; Taboada, J.J.; Lorenzo, J.F.; Ramos, A.M. Influence of Climate on Grape Production and Wine Quality in the Rías Baixas, North-Western Spain. Reg. Environ. Change 2013, 13, 887–896. [Google Scholar] [CrossRef]
- Martínez de Toda, F.; Ramos Martín, M.C. (Ma C. Variability in Grape Composition and Phenology of “Tempranillo” in Zones Located at Different Elevations and with Differences in the Climatic Conditions. 2019.
- Intrigliolo, D.S.; Llacer, E.; Revert, J.; Esteve, M.D.; Climent, M.D.; Palau, D.; Gómez, I. Early Defoliation Reduces Cluster Compactness and Improves Grape Composition in Mandó, an Autochthonous Cultivar of Vitis Vinifera from Southeastern Spain. Sci. Hortic. 2014, 167, 71–75. [Google Scholar] [CrossRef]
- Fraga, H.; Santos, J.A.; Malheiro, A.C.; Oliveira, A.A.; Moutinho-Pereira, J.; Jones, G.V. Climatic Suitability of Portuguese Grapevine Varieties and Climate Change Adaptation. Int. J. Climatol. 2016, 36, 1–12. [Google Scholar] [CrossRef]
- Wunderlich, R.F.; Lin, Y.-P.; Ansari, A. Regional Climate Change Effects on the Viticulture in Portugal. Environments 2023, 10, 5. [Google Scholar] [CrossRef]
- Fraga, H.; Atauri, I.G. de C.; Malheiro, A.C.; Moutinho-Pereira, J.; Santos, J.A. Viticulture in Portugal: A Review of Recent Trends and Climate Change Projections. OENO One 2017, 51, 61–69. [Google Scholar] [CrossRef]
- Bucur, G.; Dejeu, L. Climate Change Trends in Some Romanian Viticultural Centers. 2021, 5, nr. 2, 2016, 24–27.
- Bucur, G.M.; Cojocaru, G.A.; Antoce, A.O. The Climate Change Influences and Trends on the Grapevine Growing in Southern Romania: A Long-Term Study. BIO Web Conf. 2019, 15, 01008. [Google Scholar] [CrossRef]
- Donici, A.; Mari, S.; Baniţă, C.; Urmuzache, R. Evaluation of the Viticultural Potential from the Pietroasa Wine-Growing Region in the Context of Current Climatic Changes. Sci. Pap. Ser. B Hortic. 2021, 65, 105–108. [Google Scholar]
- Ruml, M.; Vuković, A.; Vujadinović, M.; Djurdjević, V.; Ranković-Vasić, Z.; Atanacković, Z.; Sivčev, B.; Marković, N.; Matijašević, S.; Petrović, N. On the Use of Regional Climate Models: Implications of Climate Change for Viticulture in Serbia. Agric. For. Meteorol. 2012, 158–159, 53–62. [Google Scholar] [CrossRef]
- Vujadinović Mandić, M.; Vuković Vimić, A.; Ranković-Vasić, Z.; Đurović, D.; Ćosić, M.; Sotonica, D.; Nikolić, D.; Đurđević, V. Observed Changes in Climate Conditions and Weather-Related Risks in Fruit and Grape Production in Serbia. Atmosphere 2022, 13, 948. [Google Scholar] [CrossRef]
- Stefanovic, D.; Nikolic, N.; Kostic, L.; Todic, S.; Nikolic, M. Early Leaf Removal Increases Berry and Wine Phenolics in Cabernet Sauvignon Grown in Eastern Serbia. Agronomy 2021, 11, 238. [Google Scholar] [CrossRef]
- Trbic, G.; Popov, T.; Djurdjevic, V.; Milunovic, I.; Dejanovic, T.; Gnjato, S.; Ivanisevic, M. Climate Change in Bosnia and Herzegovina According to Climate Scenario RCP8.5 and Possible Impact on Fruit Production. Atmosphere 2022, 13, 1. [Google Scholar] [CrossRef]
- Jovanović-Cvetković, T.; Sredojević, M.; Natić, M.; Grbić, R.; Akšić, M.F.; Ercisli, S.; Cvetković, M. Exploration and Comparison of the Behavior of Some Indigenous and International Varieties (Vitis Vinifera L.) Grown in Climatic Conditions of Herzegovina: The Influence of Variety and Vintage on Physico-Chemical Characteristics of Grapes. Plants 2023, 12, 695. [Google Scholar] [CrossRef] [PubMed]
- Tzanova, M.; Atanassova, S.; Atanasov, V.; Grozeva, N. Content of Polyphenolic Compounds and Antioxidant Potential of Some Bulgarian Red Grape Varieties and Red Wines, Determined by HPLC, UV, and NIR Spectroscopy. Agriculture 2020, 10, 193. [Google Scholar] [CrossRef]
- Pajović Šćepanović, R.; Wendelin, S.; Raičević, D.; Eder, R. Characterization of the Phenolic Profile of Commercial Montenegrin Red and White Wines. Eur. Food Res. Technol. 2019, 245, 2233–2245. [Google Scholar] [CrossRef]
- Leder, R.; Petric, I.V.; Jusup, J.; Banović, M. Geographical Discrimination of Croatian Wines by Stable Isotope Ratios and Multielemental Composition Analysis. Front. Nutr. 2021, 8. [Google Scholar] [CrossRef]
- Karoglan, M.; Prtenjak, M.T.; Šimon, S.; Osrečak, M.; Anić, M.; Kontić, J.K.; Andabaka, Ž.; Tomaz, I.; Grisogono, B.; Belušić, A.; et al. Classification of Croatian Winegrowing Regions Based on Bioclimatic Indices. E3S Web Conf. 2018, 50, 01032. [Google Scholar] [CrossRef]
- Omazić, B.; Telišman Prtenjak, M.; Bubola, M.; Meštrić, J.; Karoglan, M.; Prša, I. Application of Statistical Models in the Detection of Grapevine Phenology Changes. Agric. For. Meteorol. 2023, 341, 109682. [Google Scholar] [CrossRef]
- Vršič, S.; Pulko, B.; Kraner Šumenjak, T.; Šuštar, V. Trends in Climate Parameters Affecting Winegrape Ripening in Northeastern Slovenia. Clim. Res. 2014, 58, 257–266. [Google Scholar] [CrossRef]
- Potisek, M.; Krebelj, A.; Šuklje, K.; Škvarč, A.; Čuš, F. Viticultural and Oenological Characterization of Muscat a Petits Grains Blancs and Muscat Giallo Clones. J. Cent. Eur. Agric. 2023, 24, 422–433. [Google Scholar] [CrossRef]
- Šuklje, K.; Krebelj, A.J.; Vaupotič, T.; Čuš, F. Effect of Cluster Thinning within the Grapevine Variety “Welschriesling” on Yield, Grape Juice and Wine Parameters. Mitteilungen Klosterneubg. 2022, 72, 118–129. [Google Scholar]
- Kopali, A.; Libohova, Z.; Teqja, Z.; Owens, P.R. Bioclimatic Suitability for Wine Vineyards in Mediterranean Climate—Tirana Region, Albania. Eur. J. Hortic. Sci. 2021, 86, 179–188. [Google Scholar] [CrossRef]
- Koufos, G.; Mavromatis, T.; Koundouras, S.; Fyllas, N.M.; Jones, G.V. Viticulture-Climate Relationships in Greece: The Impacts of Recent Climate Trends on Harvest Date Variation. Int. J. Climatol. 2014, 34, 1445–1459. [Google Scholar] [CrossRef]
- Anderson, J.; Dimou, P.; Jones, G.; Kalivas, D.; Koufos, G.; Mavromatis, T. Harvest Dates, Climate, and Viticultural Region Zoning in Greece. Proc. 10th Int. Terroir Congr. 7-10 July 2014 2014, 55–60.
- Koufos, G.C.; Mavromatis, T.; Koundouras, S.; Jones, G.V. Response of Viticulture-Related Climatic Indices and Zoning to Historical and Future Climate Conditions in Greece. Int. J. Climatol. 2018, 38, 2097–2111. [Google Scholar] [CrossRef]
- Xyrafis, E.G.; Fraga, H.; Nakas, C.T.; Koundouras, S. A Study on the Effects of Climate Change on Viticulture on Santorini Island. OENO One 2022, 56, 259–273. [Google Scholar] [CrossRef]
- Lazoglou, G.; Anagnostopoulou, C.; Koundouras, S. Climate Change Projections for Greek Viticulture as Simulated by a Regional Climate Model. Theor. Appl. Climatol. 2018, 133, 551–567. [Google Scholar] [CrossRef]
- Petropoulos, S.; Metafa, M.; Kotseridis, Y.; Paraskevopoulos, I.; Kallithraka, S. Amino Acid Content of Agiorgitiko (Vitis Vinifera L. Cv.) Grape Cultivar Grown in Representative Regions of Nemea. Eur. Food Res. Technol. 2018, 244, 2041–2050. [Google Scholar] [CrossRef]
- Anastasiou, E.; Templalexis, C.; Lentzou, D.; Biniari, K.; Xanthopoulos, G.; Fountas, S. Do Soil and Climatic Parameters Affect Yield and Quality on Table Grapes? Smart Agric. Technol. 2023, 3, 100088. [Google Scholar] [CrossRef]
- Copper, A.W.; Collins, C.; Bastian, S.; Johnson, T.; Koundouras, S.; Karaolis, C.; Savvides, S. Vine Performance Benchmarking of Indigenous Cypriot Grape Varieties Xynisteri and Maratheftiko: This Article Is Published in Cooperation with the XIIIth International Terroir Congress November 17-18 2020, Adelaide, Australia. Guest Editors: Cassandra Collins and Roberta De Bei. OENO One 2020, 54, 935–954. [Google Scholar] [CrossRef]
Figure 1.
The areas with GDD ≥ 2000 for the 1969–1978 (P1) time period.
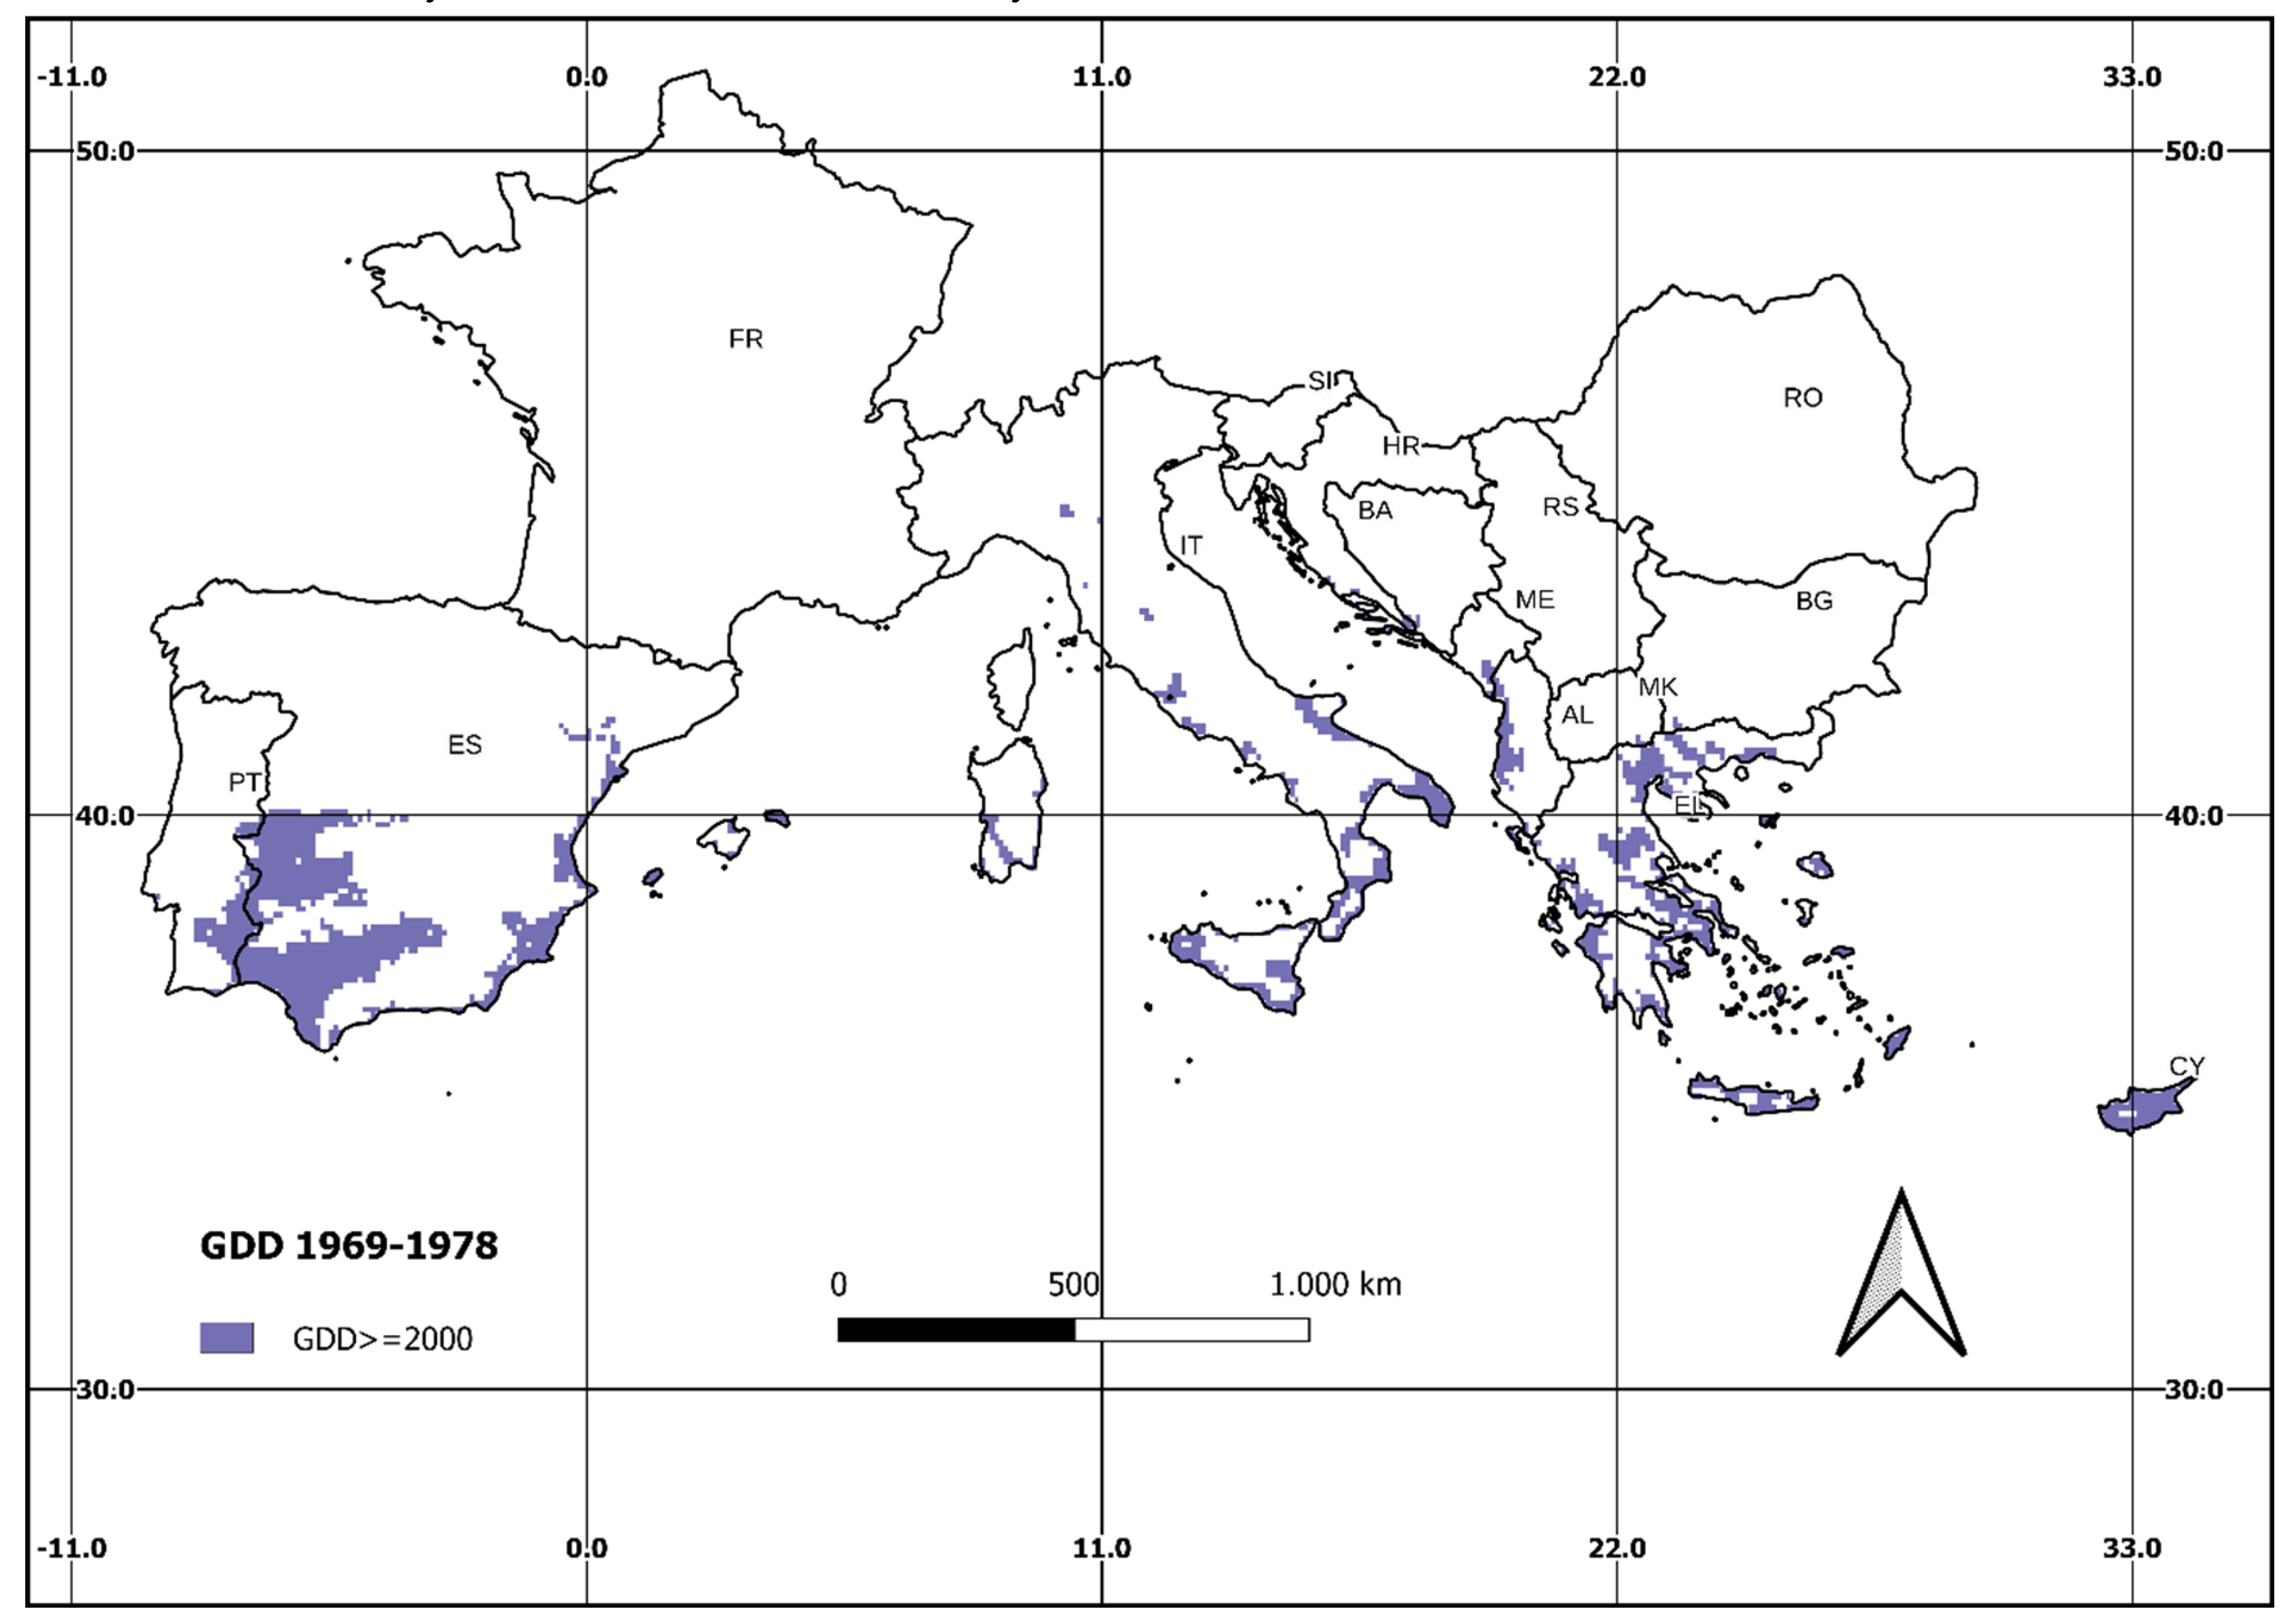
Figure 2.
The areas with GDD ≥ 2000 for the 1989–1998 (P2) time period.
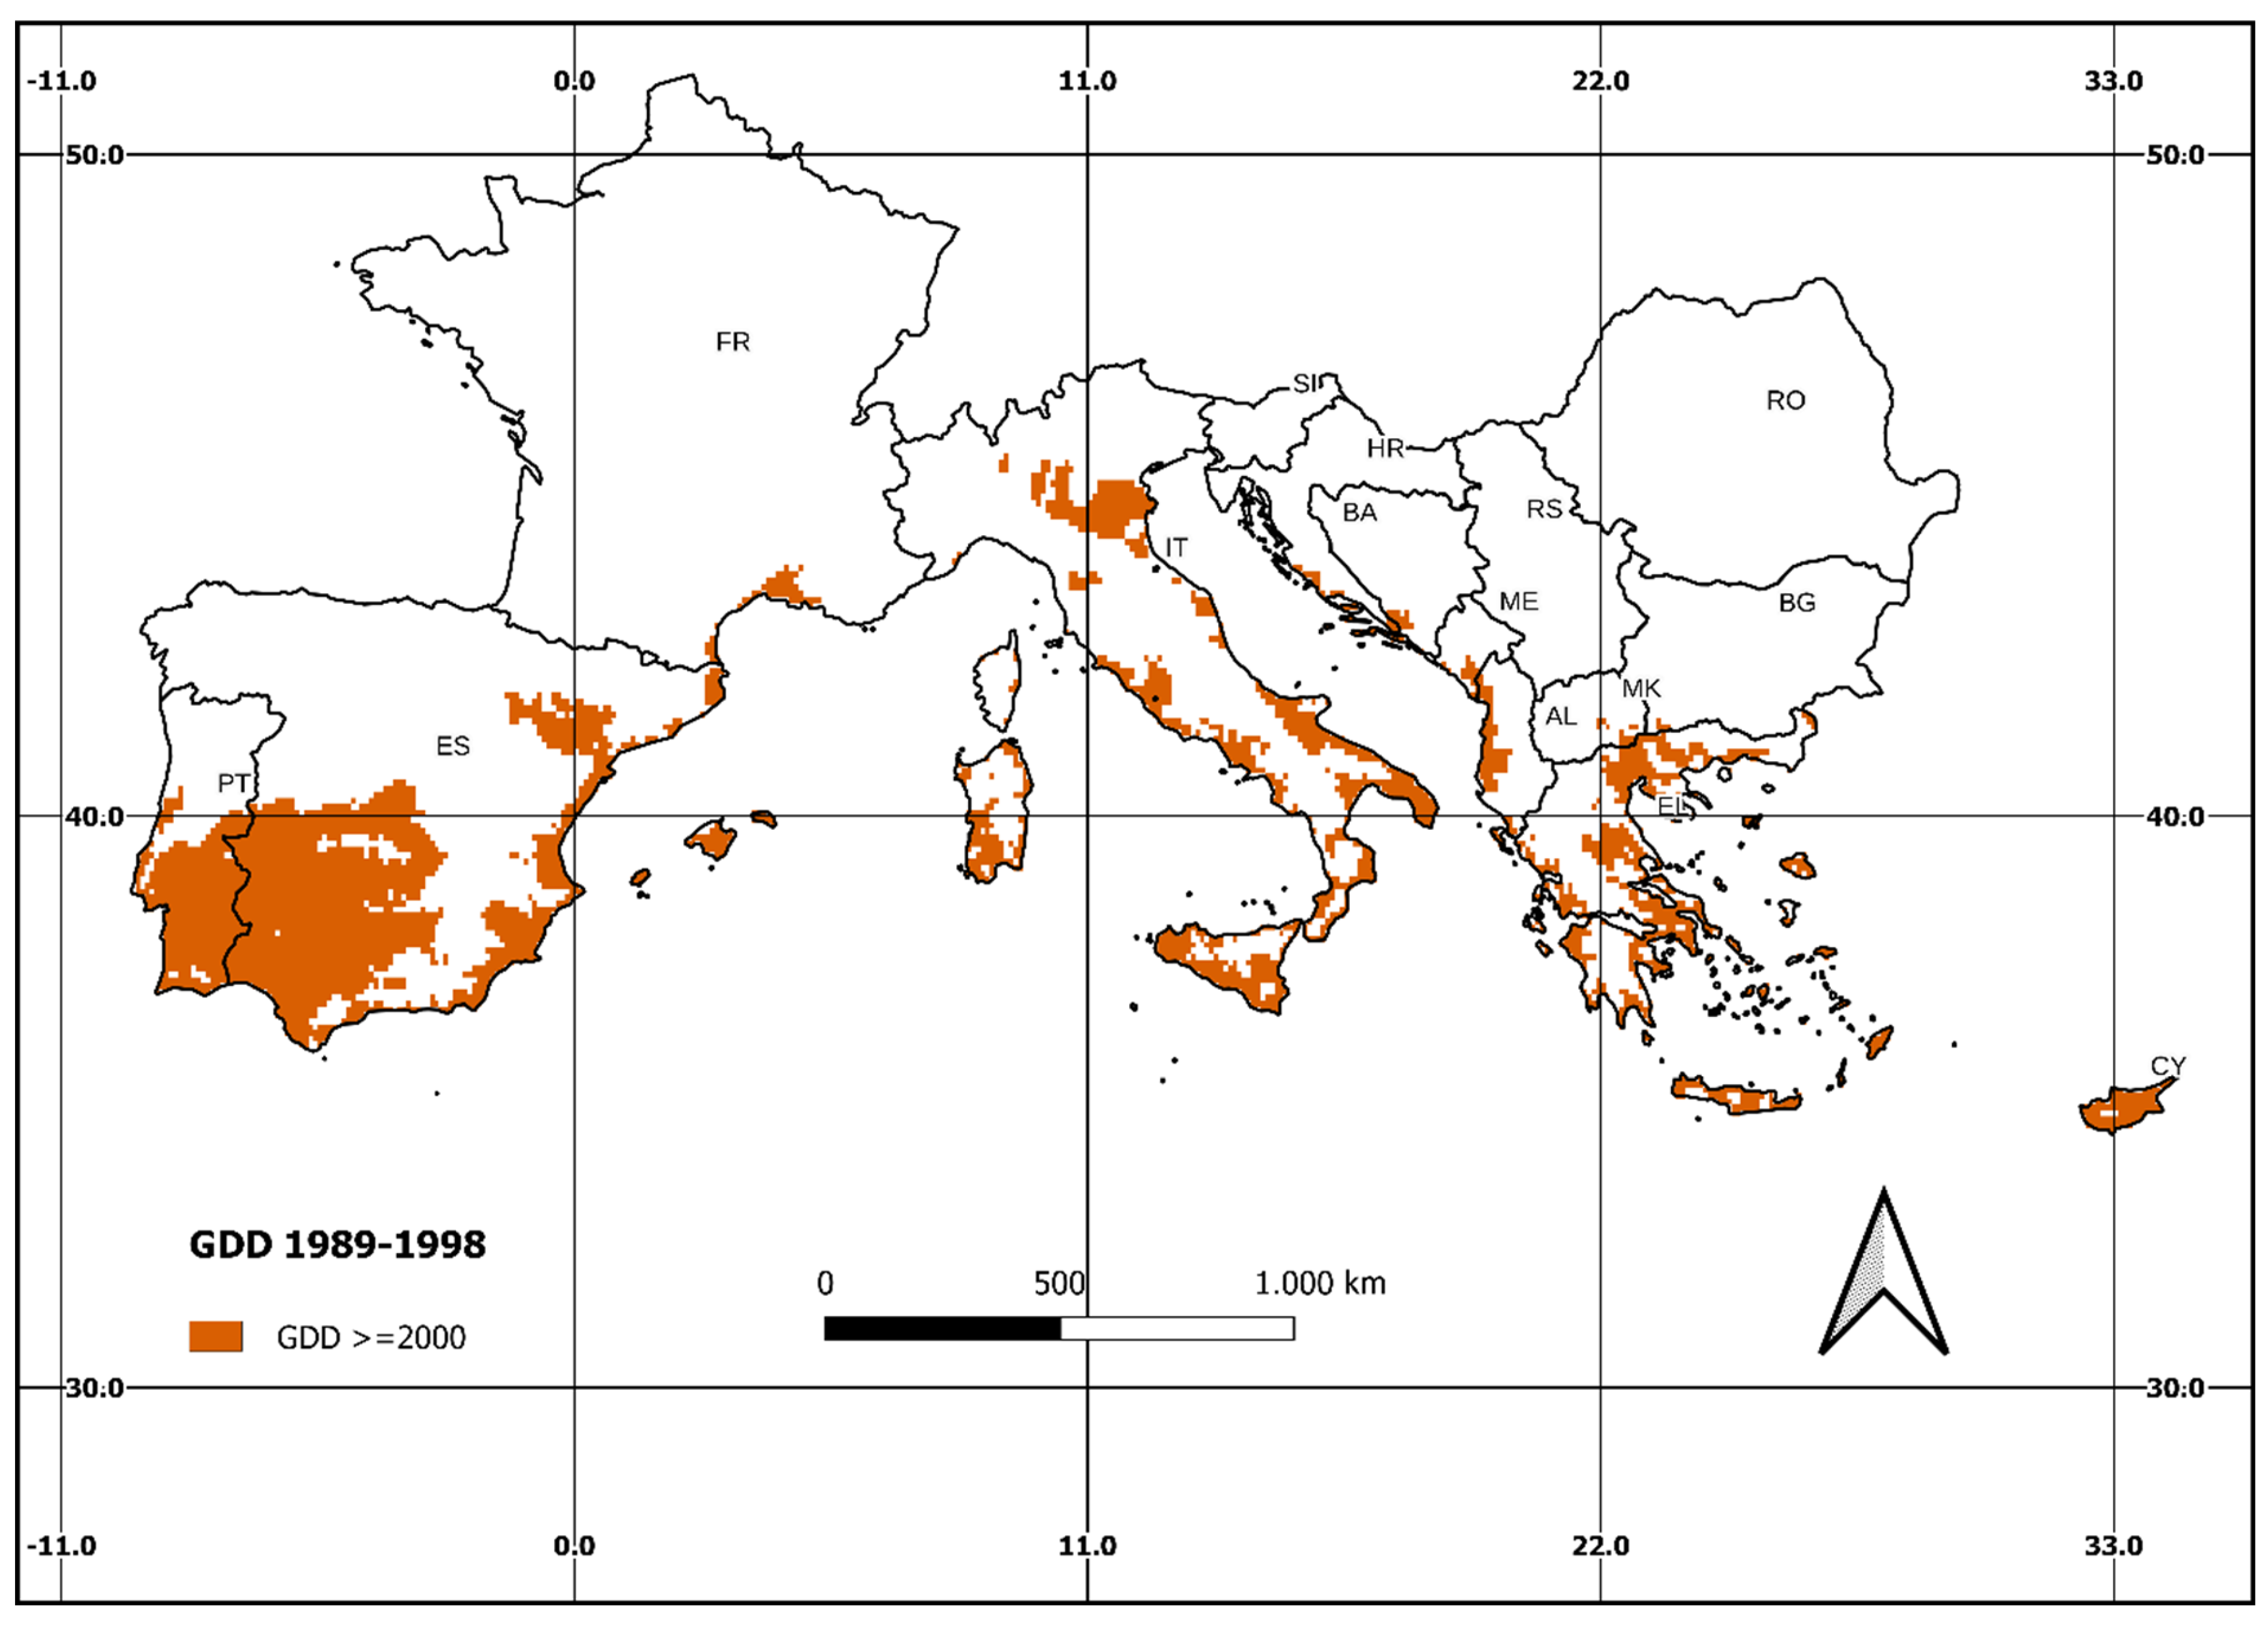
Figure 3.
The areas with GDD ≥ 2000 for the 2009–2018 (P3) time-period.
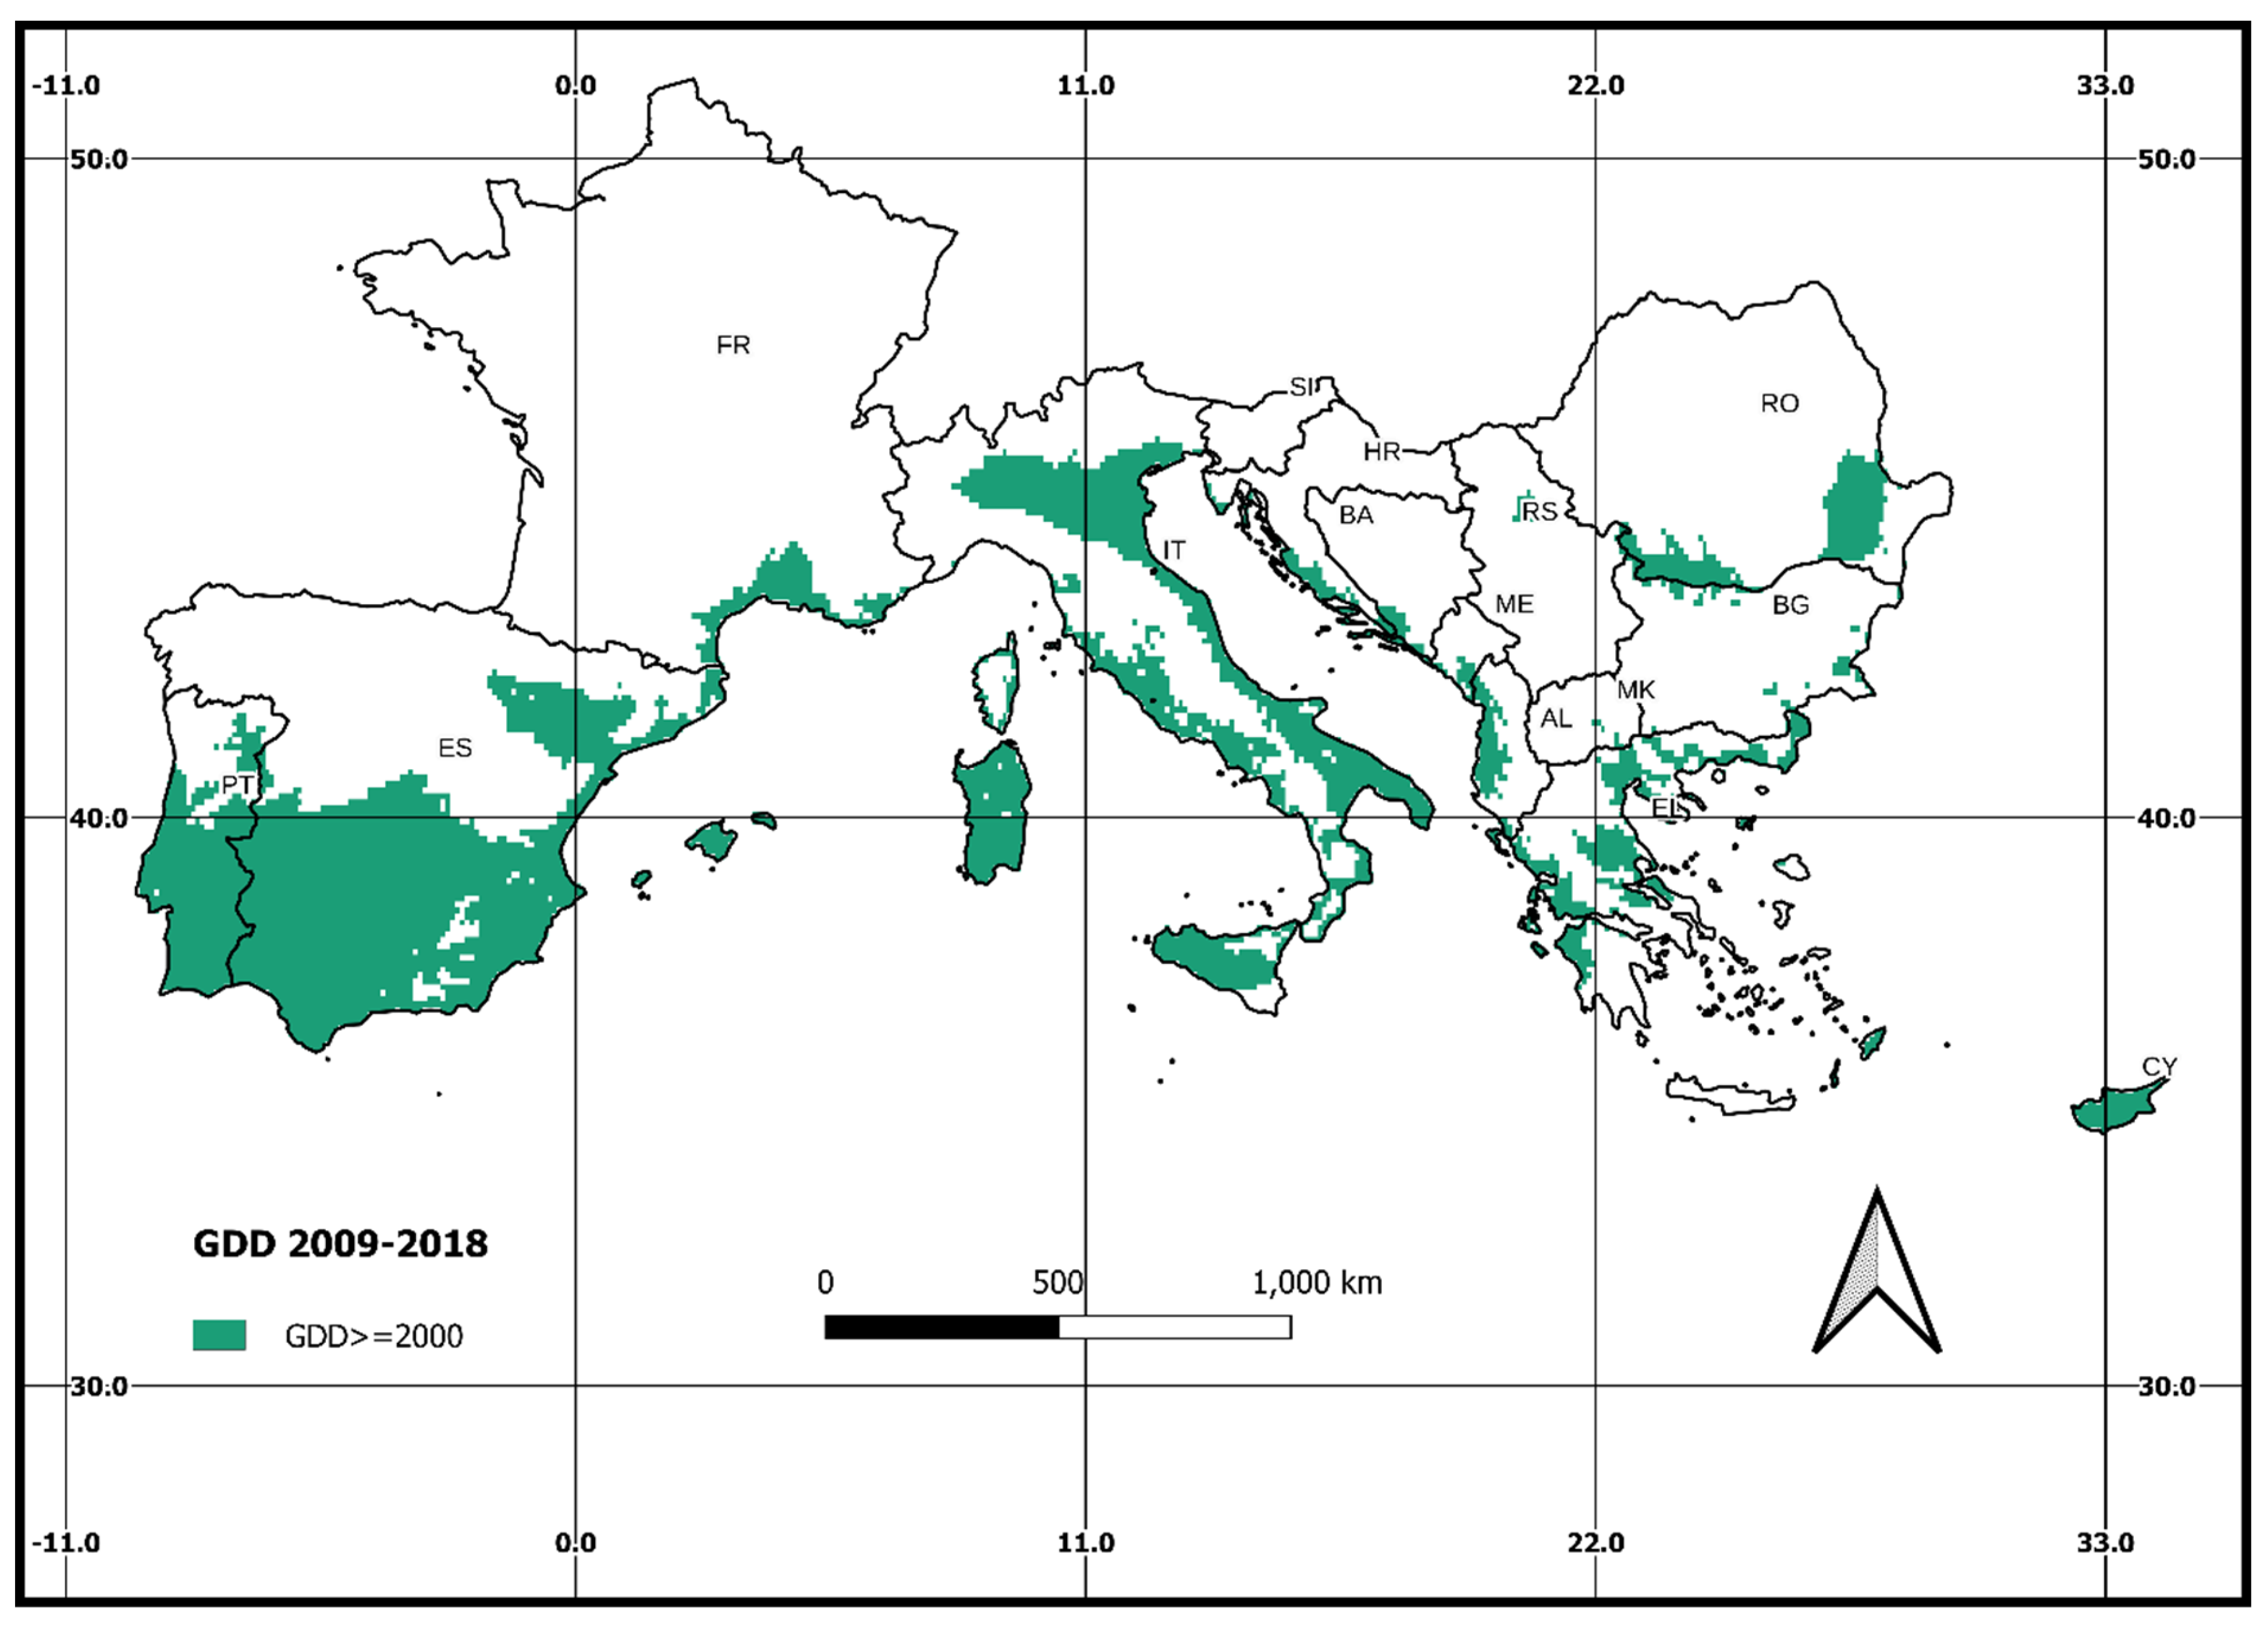
Figure 4.
The temporal evolution of the area with GDD ≥ 2000 per country (displayed in alphabetical order). The value is x 100 km2 for the 1969–1978 (P1), 1989–1998 (P2), and 2009–2018 (P3) intervals.
Figure 4.
The temporal evolution of the area with GDD ≥ 2000 per country (displayed in alphabetical order). The value is x 100 km2 for the 1969–1978 (P1), 1989–1998 (P2), and 2009–2018 (P3) intervals.
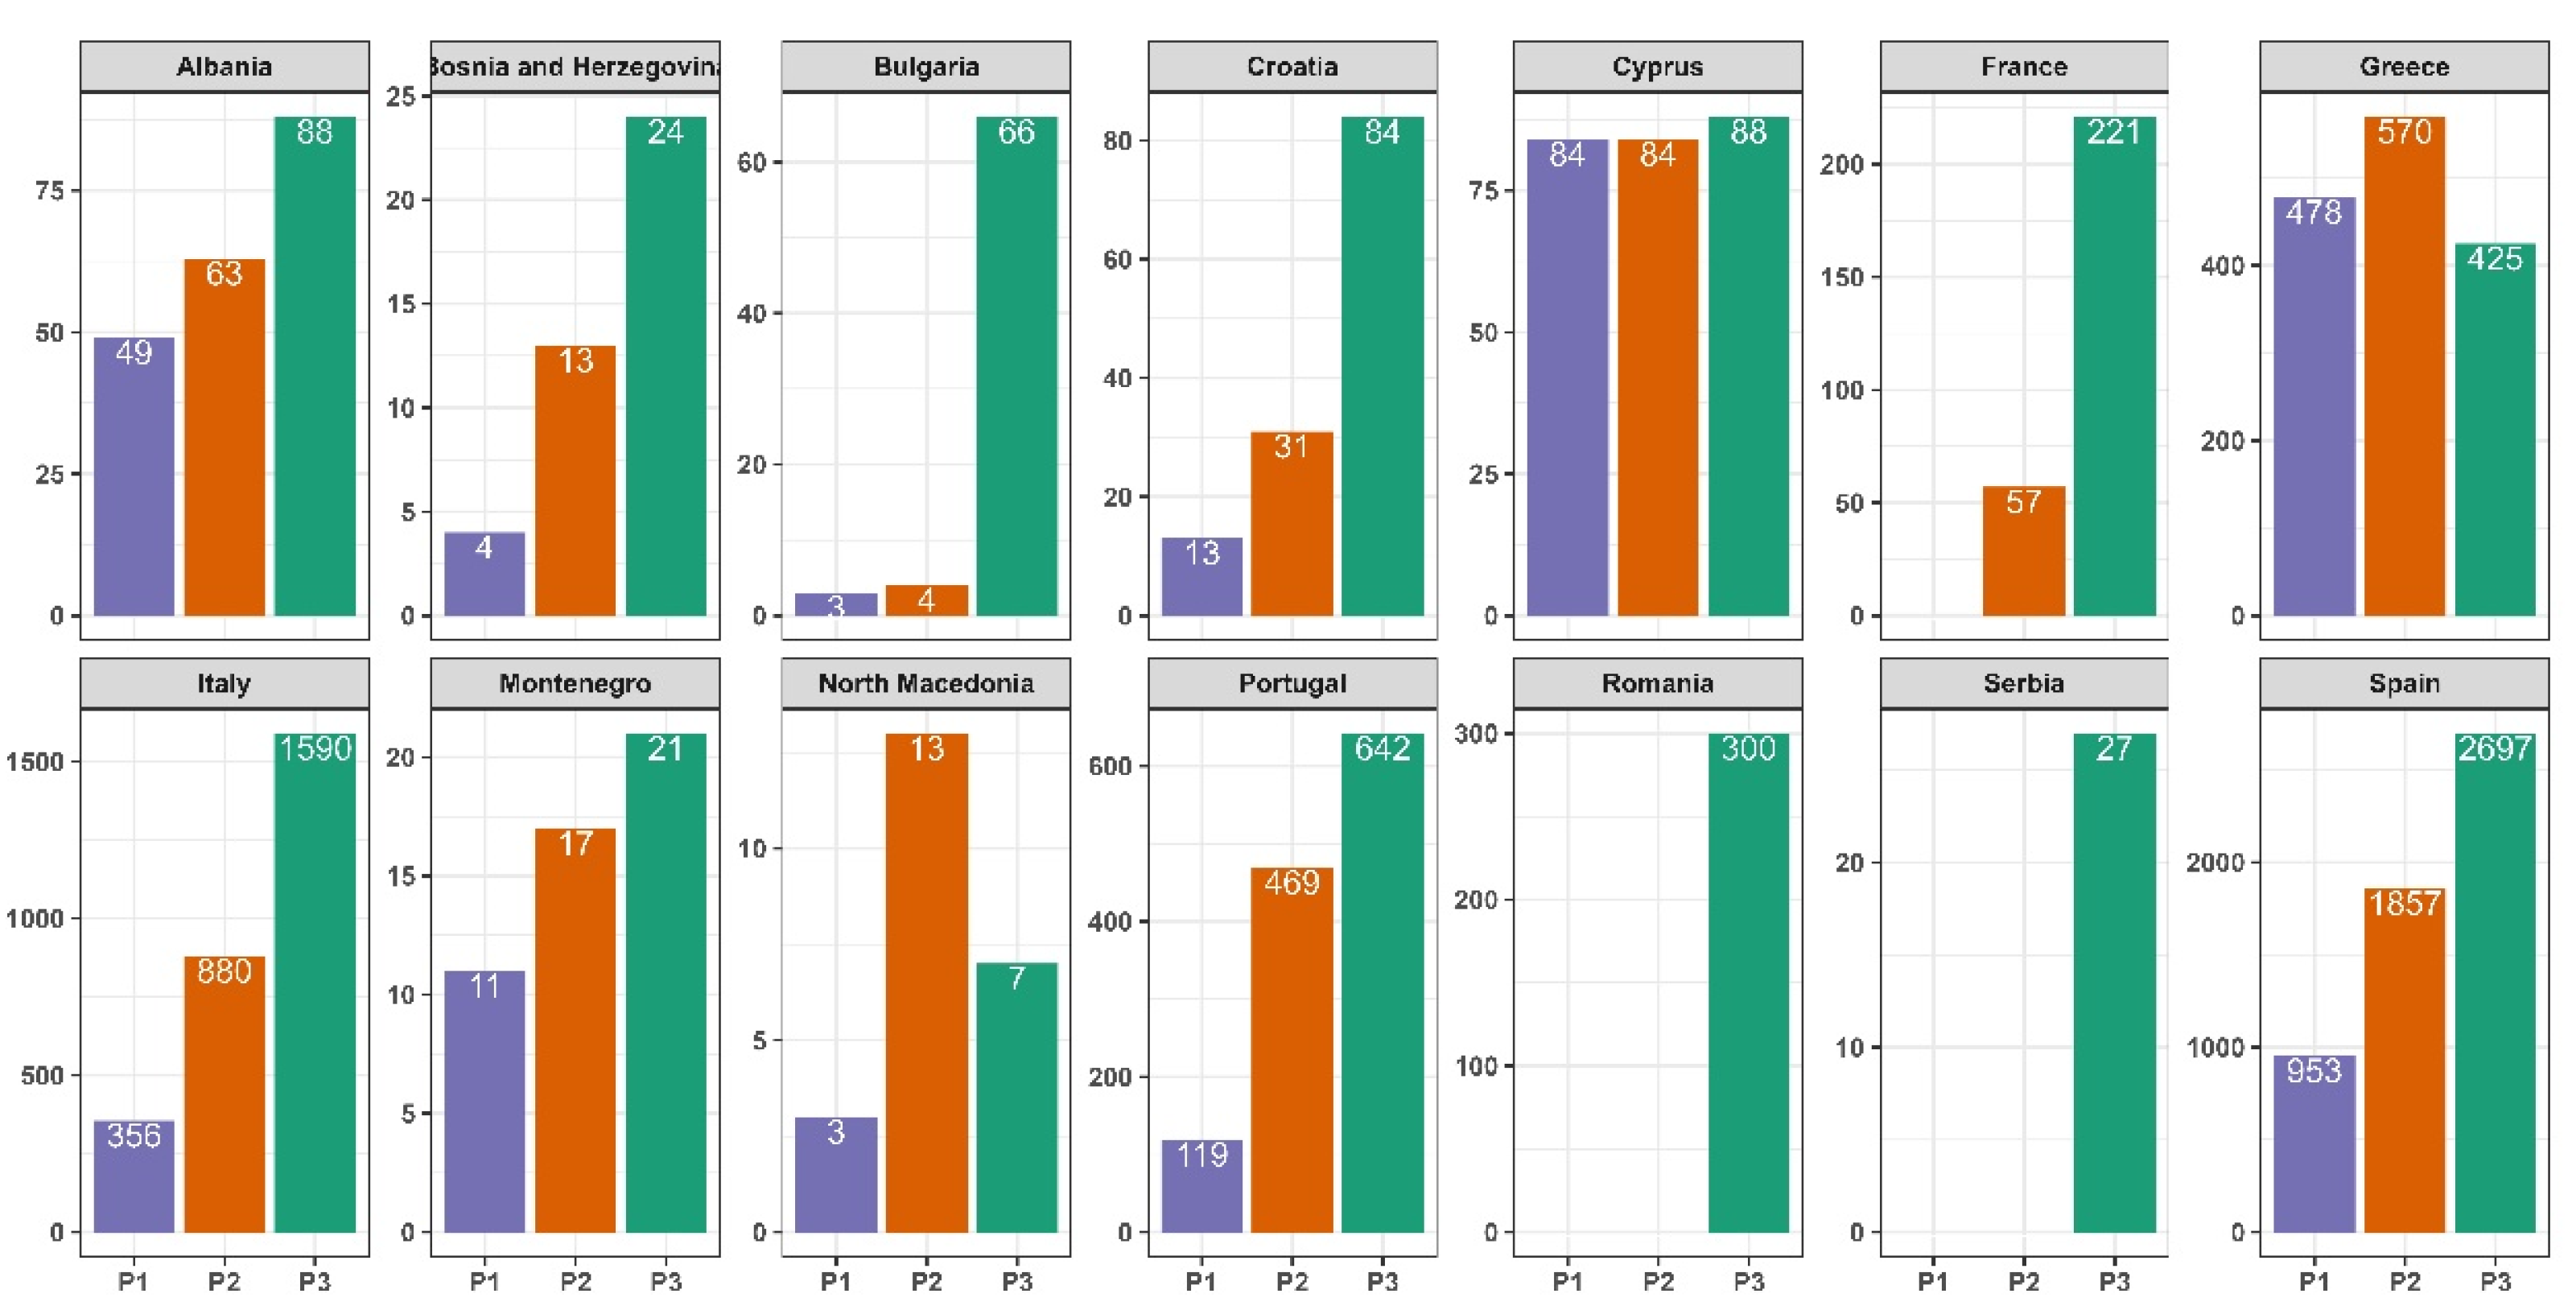
Disclaimer/Publisher’s Note: The statements, opinions and data contained in all publications are solely those of the individual author(s) and contributor(s) and not of MDPI and/or the editor(s). MDPI and/or the editor(s) disclaim responsibility for any injury to people or property resulting from any ideas, methods, instructions or products referred to in the content. |
© 2024 by the authors. Licensee MDPI, Basel, Switzerland. This article is an open access article distributed under the terms and conditions of the Creative Commons Attribution (CC BY) license (http://creativecommons.org/licenses/by/4.0/).
Copyright: This open access article is published under a Creative Commons CC BY 4.0 license, which permit the free download, distribution, and reuse, provided that the author and preprint are cited in any reuse.


