
Submitted:
26 November 2024
Posted:
27 November 2024
You are already at the latest version
Abstract
An advection-diffusion solver has been applied to assess how
stent strut shape and position impact the development of a pro-thrombotic
region within the stented human artery. We use a suitably parameterised advection-diffusion equation with a source term that is spatially uniform within a certain sub-domain of interest, to compute a ``time concentration''. The latter will serve as a surrogate quantity for ``age'' of fluid parcels, i.e., the time the fluid parcel has spent in the sub-domain. This is a particularly useful concept in the context of coronary artery haemodynamics, where blood stasis (or residence time) is recognised as the most important factor in thrombotic initiation. Our novel method has a very straightforward and convenient single lattice Boltzmann simulation framework encapsulation. We compute, present and correlate our residence time surrogate with a range of traditional haemodynamic metrics (wall shear stress, shear rate and re-circulation region shapes) and finally assess how these data can be used to quantify the risk of thrombus formation.
Keywords:
Residence time
; stenosis
; clotting
; coronary atherosclerosis
; lattice Boltzmann
; advection-diffusion
MSC: 92C50; 76-10; 92-10
1. Introduction
Cardiovascular disease is the world’s leading cause of death [1], with over three million people suffering from atherosclerotic cardiovascular disease in the UK. Atherosclerosis, characterized by the narrowing or blockage of arteries due to plaque build-up, can be treated using percutaneous interventions, such as balloon angioplasty and stent implantation. Inevitably, such procedures damage the monolayer of protective endothelial cells (ECs), which line the arteries and play a vital role in minimising inflammation and thrombosis. Consequently, scar tissue may form, leading to in-stent restenosis (ISR), with a reported incidence rate during the bare metal stent era of [2]. Although stent thrombosis (ST) is increasingly rare, with studies reporting incidence rates ranging from approximately to , this infrequent yet severe complication carries a mortality rate of [3,4] and a considerable burden of medication.
The dynamics of thrombus formation is multi-factorial but the central pillars of a quantitative, clinically relevant understanding are physical transport (species advection-diffusion) and hydrodynamics, because thrombus forms in the presence of:
- elevated concentrations of transported chemical species and activated platelets (which have been exposed to high fluid shear);
- increased fluid residence time;
- suppressed fluid and wall shear rates.
Haemodynamic shear rate, , and endothelial shear stress (ESS) history play pivotal roles in activating advecting platelets [5]. This fact, together with the need to consider relative residence time, makes it necessary to assess the history of fluid parcels, for a quantitative understanding of ST. Our fundamental premise is that the introduction of stent struts into the vessel induces local haemodynamic perturbations which couple effects above. This coupling, elaborated below, can be expressed using data from suitable single framework fluid dynamics simulations. We test this hypothesis by measuring residence times and stress due to fluid mechanics in the presence of a set of clinically relevant flow perturbations, representative of both stent design and stent deployment scenarios.
Stent struts vary in size and shape and for this work are generalised as rounded-square or circular (see Figure 2). For a correctly deployed stent, elevated wall shear stress (WSS) is observed at corners and along the top of the strut. In these regions, margination forces platelets down the shear gradient, towards the boundary [6] while proteins like the von Willebrand factor (vWF) form nets, thereby increasing the number of platelet binding sites [7]. Meanwhile, distal to the strut, flow separates into a re-circulation region. Within such regions the vessel wall experiences low WSS and platelets and vWF accumulate. Clearly, the strut and the endothelial cells immediately distal to it define a pro-thrombotic domain in which stent-induced haemodynamic perturbations couple to trigger thrombus formation [8]. We investigate the extent to which this coupling is influenced by variation in strut geometry and the effectiveness of stent deployment (stent malapposition). In passing, we remark that low WSS results in vessel inflammation and smooth muscle cell proliferation, leading to the accumulation of smooth muscle cells [9], contributing to ISR in this same region.
The application of computational fluid dynamics (CFD) to local haemodynamic behaviour facilitates an understanding of how fluid transport links to ISR and ST. A majority of the prior art has used traditional, proprietary CFD software to investigate stent strut design and stent positioning, etc. [10,11,12]. The coupling of a mass transport equation has also been used by various authors to model drug transport, both into the lumen and the artery wall, from a drug eluting stents (DES). In some of the earliest work, Balakrishnan et al. implemented a CFD and mass transfer model to predict drug deposition for single and overlapping DES [13]. Other mass transfer models have also been used with traditional CFD [14,15,16,17,18].
The use of meso-scale modelling, such as the lattice Boltzmann method (LBM) has precipitated notable advances which rely on key attributes of the method, canonically (i) a facility with complex geometries, (ii) an intrinsically parallelisable algorithm and (perhaps most important) (iii) compliance with multi-physics and multi-scale modelling approaches [19,20,21]. Exploiting these advantages, studies which are relevant to this work have applied LBM to blood flow in stenosed arteries [22,23,24,25], inferring relationships between flow dynamics, the stenosis and arterial atherogenesis. These works investigated flow around stents with particular reference to the evolution of ISR [26], to stent structure and positioning [27] and to stent selection [28]. Further afield LBM has been applied to aneurysms, formed as artery wall remodelling [29,30]
Here, we will delineate and implement a novel, single framework meso-scale modelling approach, with:
- a “clotting algorithm", based upon a suitable asymptotic proxy for blood residence time;
- a simple and robust boundary closure algorithm for flow and advection-diffusion modalities, accurately dealing with geometrical complexity, such as endothelial cells and rounded stent struts.
We will apply this model to investigate and differentiate the patho-physiological haemodynamics of ST and ISR, using convenient (if approximate) metrics applied to rounded-square and circular stent struts, within the following workflow. Section 2 provides an overview of the D2Q9 LBM model, discusses our clotting algorithm and accounts for our computational domain, Section 3 reports our simulation results and Section 4 concludes our paper, with clinical interpretation of the data and indications of future work.
2. Methodology
Two-dimensional (2D) simulations are certainly convenient to represent our scenarios. Moreover, they are deemed physiologically adequate for the present application [18], in which flow is dominated by the transverse and stream-wise co-ordinates.
LBM is an unsteady, bottom-up Eulerian approach in which the probability density function (PDF) for the momentum of a fluid parcel, , is evolved on a discrete lattice (see Section 2.1). LBM is conceived at the length-scale native to a minimal form of discrete kinetic theory and is designed to recover the continuum Navier-Stokes equations. This occurs in the thermodynamic limit, utilising a simple lattice evolution rule, or the kinetic equation, in which the momentum PDF streams between and interacts on lattice nodes (see [19,20,21]). Here, we implement a single component and single relaxation LBM, widely designated lattice Bhatnagar-Gross-Krook (LBGK) [31], which is one-way-coupled to an LBM advection-diffusion scheme with a source term. This advection-diffusion scheme effectively constitutes our clotting model, carried by a second lattice distribution. Flow and advection modes are a statistic of computations within a single framework. We first introduce the flow LBM model, then our clotting algorithm and finally disclose the straightforward coupling between the two.
2.1. Flow Solver Algorithm
The LBM-based descriptions of unsteady, weakly compressible hydrodynamics are as follows:
These originate from the lattice gas cellular automation of [32]. At the time of writing, LBM variants have been derived in several forms, by multiple routes and authors (see e.g., [19,33]). Solution of the momentum and continuity equations above is supported by evolution of the LBGK momentum PDF, , using the following kinetic equation:
Above i, , , t, , , , , , are the lattice link label, component of the PDF, discrete location, discrete time, time step, meso-scopic lattice velocity, relaxation constant, macroscopic density, macroscopic velocity (as defined below) and kinematic viscosity. The equilibrium distribution function, , is a second order polynomial approximation to a uniformly propagating Maxwell-Boltzmann distribution:
where and are a lattice link weight and the speed of sound for the model , respectively. Macroscopic fields , and P are calculated through summations of the distribution function in the following way:
The LBGK scheme outlined above is suitable for addressing Reynolds numbers characteristic of coronary artery flow:
Above, L characterises the spatial scale of the domain. The clotting algorithm component (for residence time) discussed in the next section, is one-way coupled to this scheme, i.e., the development of the residence time solution is influenced by the fluid dynamics, but not the other way around. The simple coupling is achieved as a parameterisation of the passing of the macroscopic velocity to the clotting algorithm, which is then used in the advection term.
2.2. Domain Residence Time Calculation
Here we address the identification of fluid parcels within the domain having an elevated residence time, relative to a threshold to be determined. The residence time algorithm is intended, eventually, to inform a reduced order model of clotting, by identifying parcels which are sequestered within a finite region in which we hypothesise, their cargo of metabolites will not be refreshed. The time for which a fluid parcel has been in the simulation domain -its age- is defined as its residence time. When regions of high residence time exist adjacent to a boundary and, further, contain elevated concentrations of vWF and activated platelets, one can infer an increased risk of thrombus formation within that region. While we consider only relative residence time, our method will generalise straightforwardly to species advection-diffusion.
To assign a residence time surrogate, we imagine that at the instant fluid parcels enter the region of interest, an internal source producing a times species at a uniform rate is activated. The domain residence time scalar field value is then directly proportional to the time species concentration. Of course, time does not diffuse, so that computing a time species concentration, denoted (from the solution of the advection-diffusion equation, with a constant source) requires us to parameterise within the regime of a very large Peclet number [34]. See Appendix A.1). LBM based advection-diffusion dynamics have also been variously derived [35,36,37]. Here, we employ a mature variant developed by Shi and Guo [38] which contains a source term, S (see also Chang et al., [39]). The advection-diffusion equation, with a homogeneous diffusion coefficient D, below:
is supported by the evolution of a second PDF, , as follows:
where the equilibrium distribution function is:
and its kinetic evolution equation source term is
Note, the diffusion coefficient is linked to the second distribution relaxation parameter , that the velocity of the fluid is a parameter of and that the kinetic equation of the second distribution is, essentially, an LBGK scheme close to that of the momentum PDF. The source term is used to increase the residence time surrogate at the specified, uniform rate, .
Before targeting stented geometries, we validated the application of the advection-diffusion scheme in an unstented geometry (straight channel) in the large regime, i.e., where advection dominates and diffusion effects are approximately zero. To do this, we used the known analytical solution for the velocity profile to recover domain residency time in the channel, and compared this result with simulation data at a range of diffusion coefficient values. Results showed that by tuning the relaxation parameter , we can sufficiently simulate the desired regime, where for the remainder of the work we use an [25].
2.3. Computational Domain
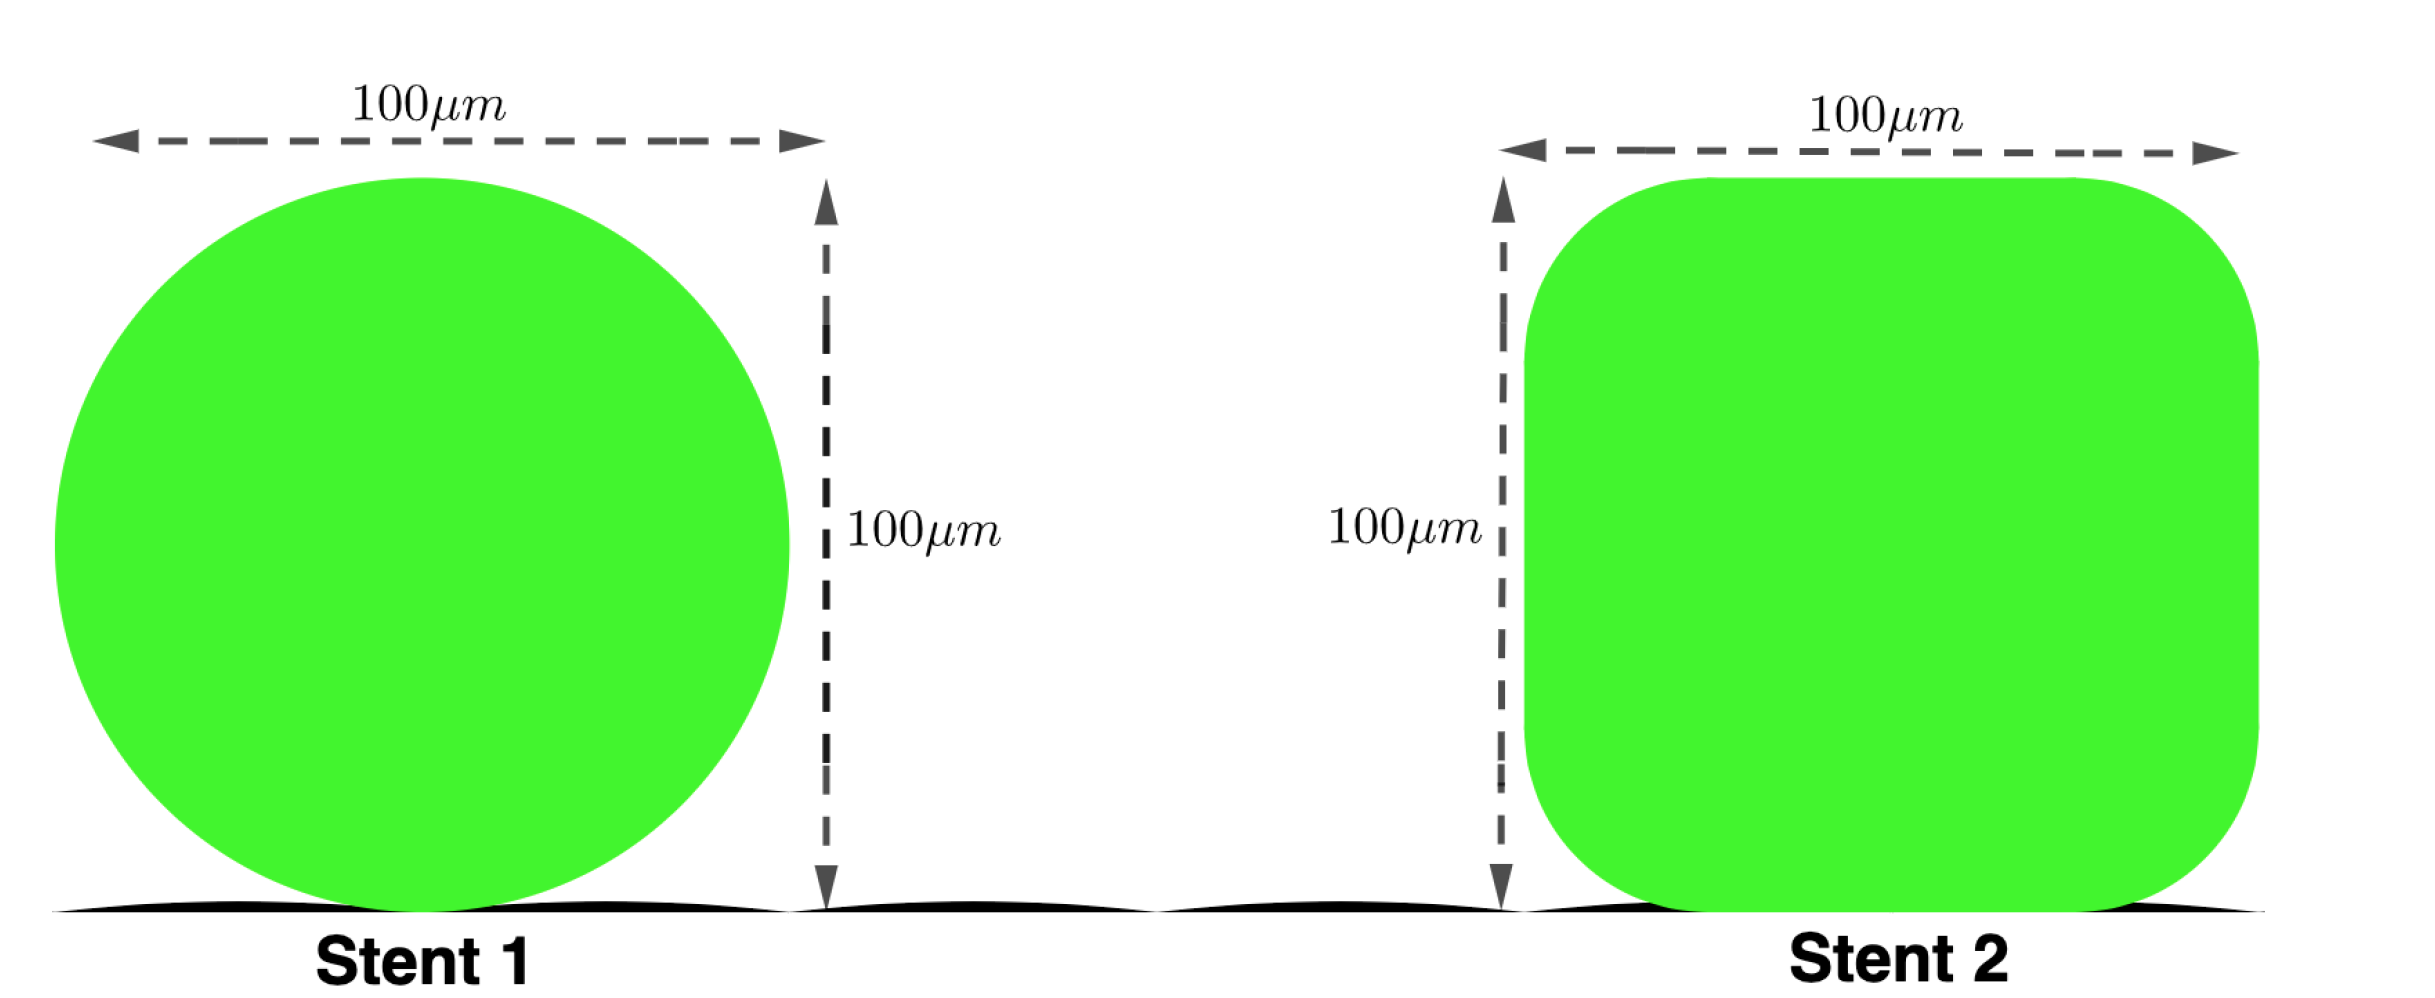
The computational domain is an idealised rectangular channel, consisting of × nodes, see Figure 1. The south boundary of the domain is modelled to represent a physical endothelium, consisting of endothelial cells which are modelled with a height of and length . Figure 2 shows the two strut profiles considered in this work, both having the same maximum width . The resolution of the domain is such that 1 lu = 1 m and the physical-lattice scaling used can be seen in Table 1. For additional information on our boundary closure methods please see Appendices Appendix A.2 and Appendix A.3.
Figure 1.
Schematic to illustrate our simulation domain lu and lu. The boundary conditions are: North symmetry condition; East / West algorithm of Zhang and Kwok [40]; South boundary (Endothelial cells and Stent Strut) non-slip condition enforced by the Bouzidi boundary Condition [41]. See Table 1 for physical units of the simulation.
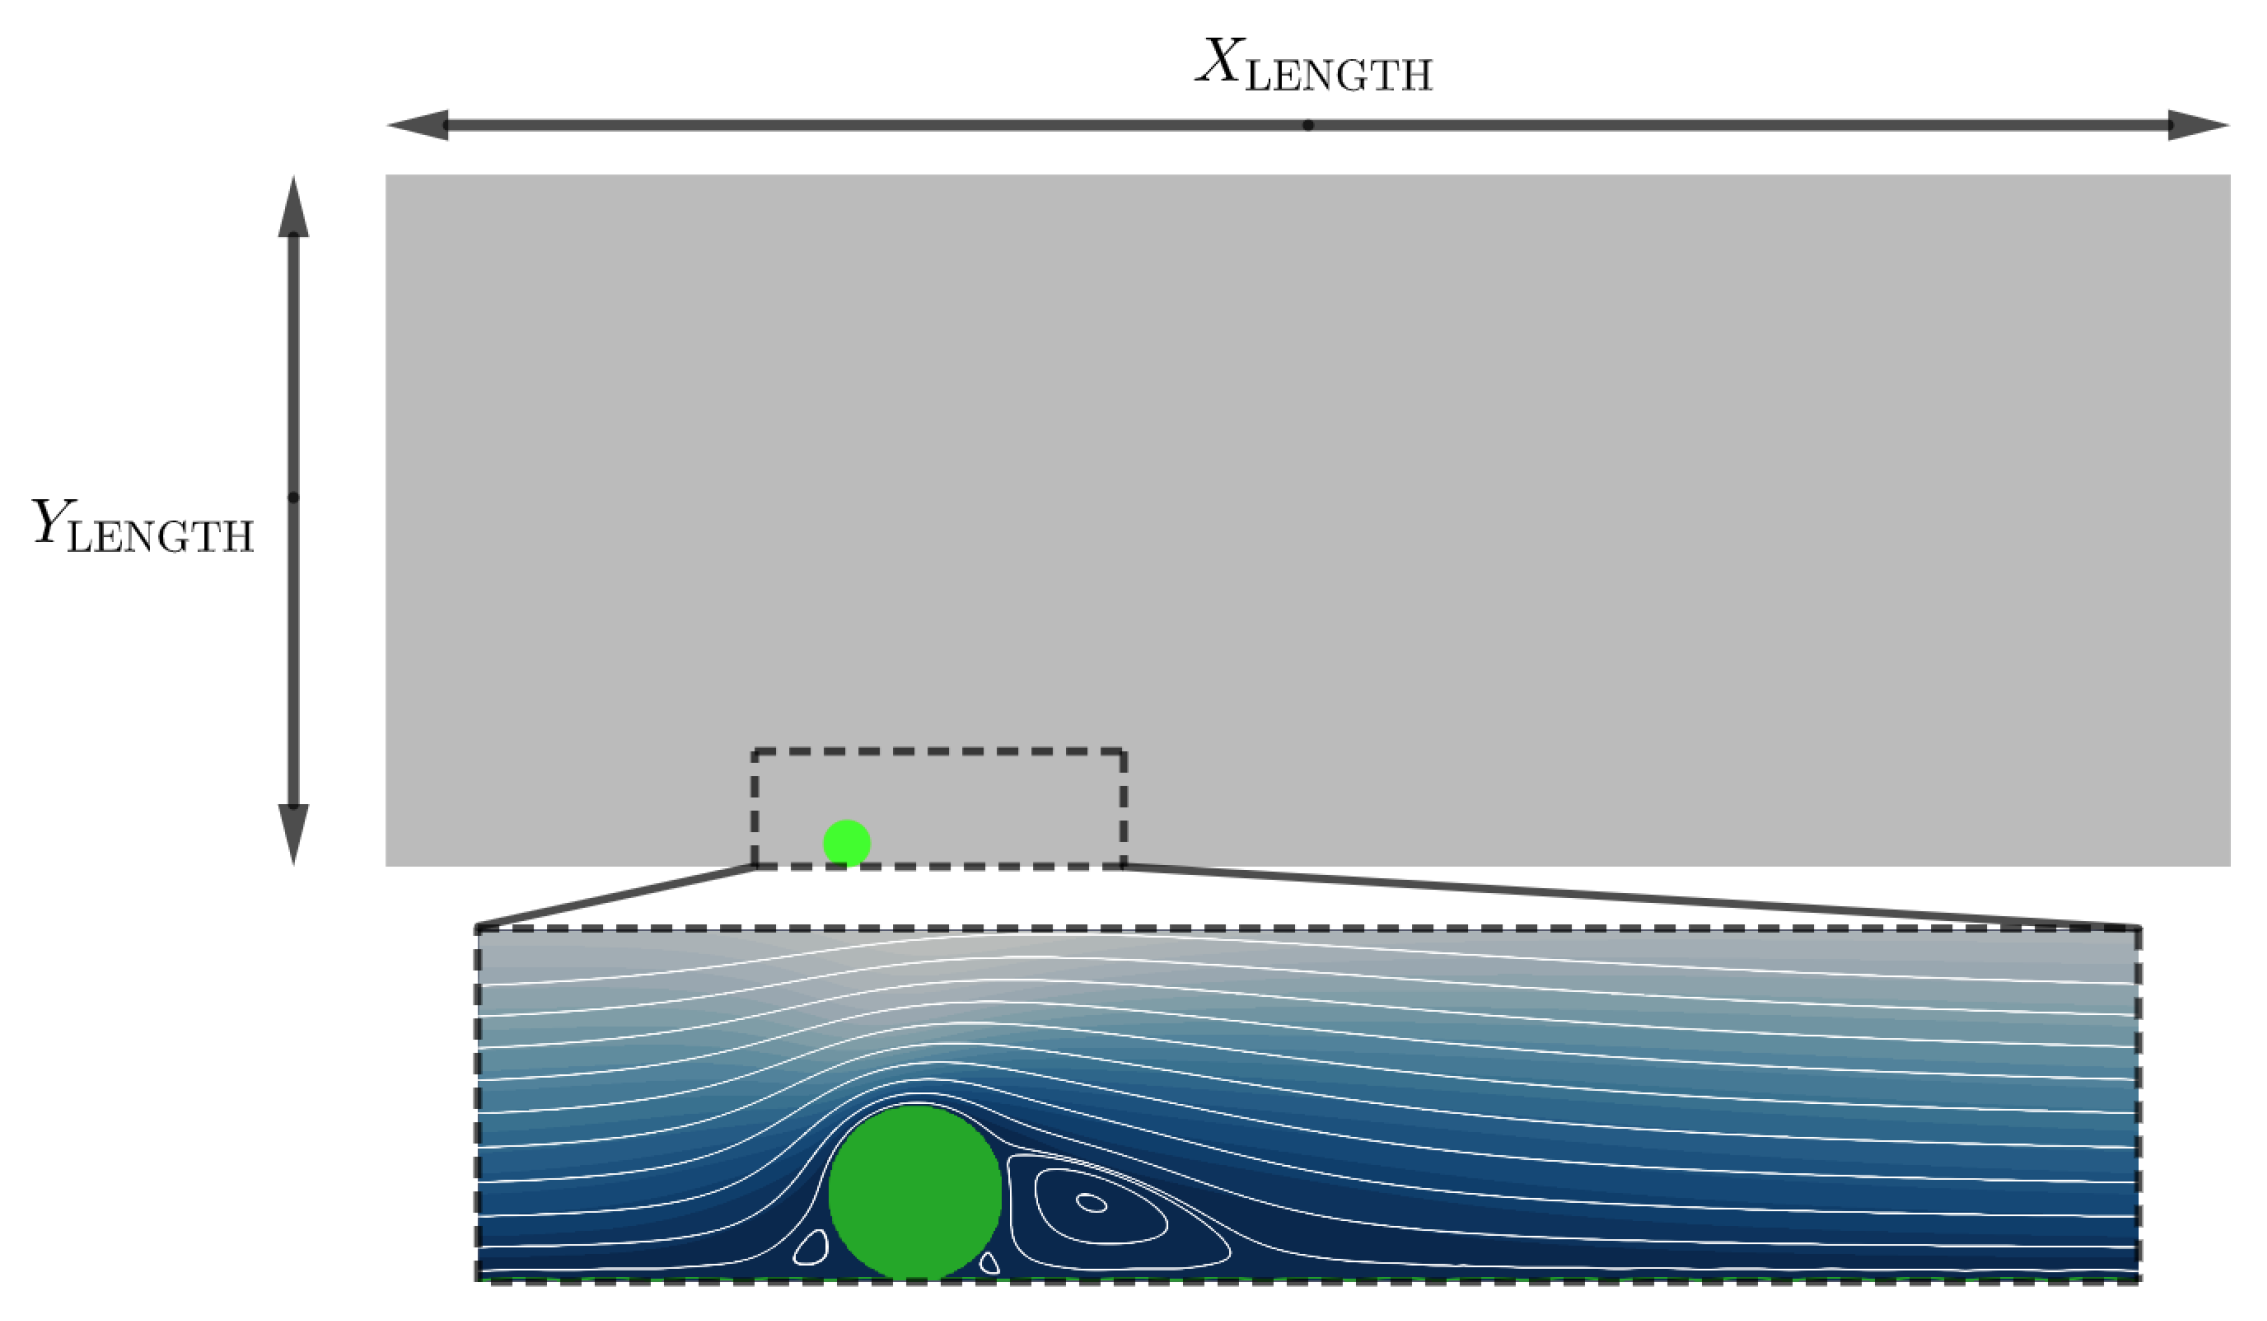
Figure 2.
Stents Struts: Schematic of the two stent struts being simulated in this paper: - Stent 1: Circular stent strut - diameter 100m. - Stent 2: Rounded stent strut - width and length 100m.
Figure 2.
Stents Struts: Schematic of the two stent struts being simulated in this paper: - Stent 1: Circular stent strut - diameter 100m. - Stent 2: Rounded stent strut - width and length 100m.
3. Results and Discussions
We will apply our model to study the local haemodynamic effects of variation in (i) strut geometry and (ii) position. To do this, we will simulate two common stent geometries, depicted in Figure 2 and investigate four different stent strut positions, specifically 50% embedded, 25% embedded, 0% embedded and -100% embedded (malapposed strut). Additionally, we will apply our model to an isolated strut, and then a group of three. Throughout, we report representative of haemodynamics in human coronary arteries. To address (i) and (ii) we compare results between simulations using metrics proposed to identify a thrombotic state or region. These metrics are relative blood residence time (BRT), wall shear stress (WSS), flow shear rate, re-circulation region size and location. It is useful to bound these metrics, to allow us to evaluate how local haemodynamics relates to a thrombotic state, and their relation to ISR and ST.
Blood Residence Time
- The residency time is a measure of the amount of time a fluid parcel has spent within the domain, and can be used to locate atheroprone regions within the domain [42]. In relation to stent haemorheology, regions of elevated residency time may accumulate platelets and adhesion proteins, promoting thrombus formation.
Wall Shear Stress
- In the 1970s it was hypothesized that the build-up of atheroma correlates with lower WSS [43]. Over the last couple of decades, more evidence has been provided to support this assertion [44,45,46] with low WSS regions now being characterised as Pa [44,47,48]. The build up of atheroma is associated with regions of low oscillatory WSS, which typically occurs in regions of flow separation and re-circulation. Higher WSS also plays a role in atheroma formation. The region of higher WSS found on the adlumninal surface of the struts results in platelet geometry change and activation. These platelets can then become trapped in the lower wall shear region, or wake behind the strut [49]. When discussing our results, we identify high WSS as Pa [49].
Shear Stress
- Shear rates in medium-to-large-sized arteries generally fall within the range 100 to 1000 [50]. However, stenosed regions experience larger shear rates. Indeed, it has been shown that at and above super-critical shear rates , the vWF is activated in the diseased vessel which see’s a narrowing of the artery, and forms long strings that increase platelet binding [51,52]. Accordingly, we take shear rates above to indicate an increased risk of atheroma formation, caused by the effective local narrowing of the artery due to the presence of the strut.
To summarise, we are particularly concerned with regions which will link to atherosclerotic plaque formation, i.e., areas of low WSS ( Pa), areas of high WSS ( Pa), and regions of high shear rates (). Once identified, we will use information on flow stream paths, derived from the Stokes stream function, in tandem with the relative residence time information, to identify elevated risk of atherosclerotic plaque formation, linking to biological responses.
3.1. Single Stent Strut Simulations
Here, we simulate a single stent strut (both circular and rounded stent strut geometries as shown in Figure 2) at a range of stent positions (100 malapposed, 0% embedded, 25% embedded, 50% embedded), at Re . In each case we consider relative residence time, velocity and shear rate within the domain- where haemodynamics are most of interest. Figure 3 and Figure 4 provide an example of simulation results corresponding to the circular and rounded struts in flow characterised by Re=528. To facilitate comparison, Table 2 and Table 3 summarise key metrics for both the circular and rounded struts at Re .
For both stent geometries, we observe that the more embedded the stent strut, the smaller the flow disturbance caused. This observation can be quantified by the re-circulation length given in Table 2 and Table 3. Comparing results for struts which are 50%, 25% and 0% embedded, for both the circular and rounded struts, the re-circulation size decreases as the percentage embedding increases. This suggests that for less embedded stents, there will be a larger distal region of low WSS. However the influence of stent geometry manifests when comparing circular and square stent struts when malapposed, with circular stent struts producing smaller re-circulation regions, due to their streamlined profile maintaining flow attachment for longer. In addition, for both stent geometries, malapposed struts cause a re-circulation region which is detached from the stent strut, in comparison to 0%, 25% and 50% embedded simulations, where the re-circulation region is attached to the strut. This observation indicates a potential change in thrombotic region location based on stent strut positioning.
Consider the impact of stent geometry on the local haemodynamics, and how this relates to thrombus formation. Comparing WSS over the stent struts it is evident that the rounded square strut has a larger maximum WSS than the circular strut, for equivalent Re. We further observe the maximum WSS increases with Re number and decreases as the stent becomes more embedded, as expected. Interestingly, across all simulations of circular and rounded stents struts, maximum WSS values are above those of the high WSS level ( Pa [49]). We will return to this point. Figure 3 and Figure 4 plot the shear rates in the region local to the stent. These plots clearly show, for all simulations, that the areas of low shear rates correspond to areas where re-circulation regions are present, and that areas of high shear rates appear at the top centre of the strut and the post top left rounded corner of the struts, for the circular and rounded square struts, respectively. For the circular strut, the malapposed positions resulted in shear rates above the , whereas for the rounded square strut, the malapposed and 0% embedded positions across all simulations have shear rates above the . This suggests that both stent position and geometry play a critical role vWF activation and elongation.
Finally we examine the relative residence time across the simulations. The BRT field variable is best evaluated within the context of flow along with streamlines and shear rate plots. We note that the regions with large relative BRTs are also regions where flow re-circulation occurs, at low velocities and low shear rates. In addition, by following the streamlines, we imagine how platelets and vWF proteins convect to these high residence time regions, generating a pro-thrombotic region and state. Furthermore, Table 2 and Table 3 show larger residence times when the stent is either malapposed or 0% embedded, when compared with the 25% and 50% embedded, which accords with a hydrodynamics of larger re-circulation regions, when the stent is either malapposed or 0% embedded.
Concluding the findings on single strut scenarios, the pro-thrombotic region has been assessed within the steady flow regime and is defined, for present purposes, by the intersection of relative residence time with other metrics of wall shear stress, shear rate and distal reattachment distance, tentatively to identify risk areas which promote thrombus formation. We observe, for both circular and rounded stent struts, that a re-circulation region forms behind the strut which is generally more prominent with less embedding of the strut. All struts experienced high WSS with max WSS being above the critical limit stated earlier (7 Pa) and reported in [49]. It was found that the square stent strut produced higher shear rates, with both the malapposed and 0% embedded strut producing shears above the stated critical value (5000 ), and the malapposed circular struts also showing shear rates above the critical value. Following the streamlines from these areas of high WSS and high shear rates (where the platelets are hypothesised to be activated), the platelets will aggregate in the circulation region (region of low WSS) which will increase the risk of thrombus formation. It was also observed that the more streamlined circular strut reduced the risk of a pro-thrombotic region, by having: lower magnitude of WSS, lower shear rates, smaller re-circulation regions and smaller relative residence times.
3.2. Multiple Stent Struts Simulations
Flow dynamics in the stent region can be more complicated because of interactions between adjacent struts. The spacing between struts varies, depending upon the brand and the axial co-ordinate (i.e the position where the stent cross-section is examined) and of course how effectively the stent has been implanted.
Here we simulate steady flow over three adjacent equi-spaced struts of both circular and rounded geometries at a range of stent positions (100 malapposed, 0% embedded, 25% embedded and 50% embedded) at , to assess the flow dynamics between stent struts. In each simulation, we consider BRT and the Stokes-Stream function over-laid on a shear rate field, across a cropped section of the domain where local haemodynamics are of most interest. Figure 5 and Figure 6 provide an example of simulation results corresponding to the circular and rounded struts in flow characterised by Re=533.
A clear difference between the multiple stent strut simulations and the isolated strut simulations are inter-strut re-circulation zones interactions. From Figure 5, for circular stent struts, at the Re numbers tested, the re-circulation behind the first strut does not reach the second strut, when embedded by at least 25%. For the rounded square stent struts, the re-circulation behind the first strut does not reach the second stent strut when the strut is embedded by more than 25%. This implies that for rounded square struts there are larger regions which experience both low shear rates and, presumably, oscillatory flow. Clearly, the spacing between stent struts would also impact on whether the detached flow of one strut re-attaches before the next strut.
The residence time plots in Figure 5 and Figure 6 demonstrate a similar trend to the isolated struts, with less embedded struts showing higher relative residence time. We see a more complex BRT field for multiple struts, although some established conclusions are supported by these results (i) areas of larger BRT align with regions of low shear stress; (ii) circular strut simulations show lower BRT when compared to rounded square simulations; (iii) areas of larger BRT are found proximal to the stent struts, again, intersecting with low shear rate regions.
4. Conclusion
This paper introduces and applies a coupled LBM-advection-diffusion and Newtonian flow solver, with a straightforward and amenable boundary closure, all encapsulated within a single framework, to investigate artery scale stent haemodynamics, with particular emphasis on local, pro-thrombotic regions in the immediate vicinity of the struts. Specifically, we postulate the concentration of a diffusion limited time species scalar field as a surrogate, at high Peclet number, for the relative domain residence time of blood. This quantity is computed alongside a set of accepted mechanical metrics (see below) that might easily provide datasets from which to evaluate the potential risk of atheroma formation.
The data we compute to find an assessment of risk associated with stent deployment scenarios and strut profiles are shear rate, wall shear stress, relative residence time, and the characteristic length of the strut-distal re- circulation region. All are determined with appropriate resolution and address realistic physiological ranges, relative scales and geometries, within the steady regime. Simulations were performed both on single struts and triplets of struts, to determine how strut shape and positioning interact with the metrics identified above. We have considered a finite, but we believe clinically representative, set of geometries, from which consistent observations emerge.
Our general observations indicate that the less embedded a strut, the larger the risk of a region prone to thrombosis, based on identifying regions with large relative residence time, low shear rates and large re-circulation zones. High WSS over the top of the struts will promote von Willebrand factor (vWF) to elongate and hence encourage platelet activation. Importantly, flow streamline distributions imply that fluid parcels containing activated vWF would then advect these species, resulting in the accumulation of key proteins and platelets in low shear rate, long residence time re-circulation zones. Simulation results further show that the rounded square stent struts created regions with larger WSS, longer re-circulation characteristic length and higher relative residence time compared with the circular stent struts, which quantifies the significance of strut streamlining. Multiple stent strut simulations evidenced a similar trend, with an increased residence time associated with the rounded square stent strut. We also expose the importance of the flow interaction between adjacent struts, modulated by Reynolds number, stent position and stent spacing. All these factors impact upon whether the flow re-attaches before reaching the next stent strut, which appears to be of high importance, as it could lead to large regions of low and oscillatory shear stress.
Broadly, it is clear that stent strut shape, relative position and malapposition all couple strongly to local hemodynamic metrics, including residence time. From the data presented here, no single metric seems to be insignificant, highlighting the need for convenient single framework methodologies. This study confirms that this approach can report all the relevant fields efficiently and accurately. Further work is required to objectively to correlate the individual modalities- the role of a number of data science tools which require only such data as we present here.
Rights Retention Statement
For the purpose of open access, the authors have applied a Creative Commons Attribution (CC BY) licence to any Author Accepted Manuscript version arising from this submission.
Author Contributions
Conceptualization, I.H., J.S. and X.X.; methodology, R.W., J.S. and I.H.; software, R.W., J.S. and J.E.; formal analysis, I.H., X.X., A.N., J.S., R.W., J.G. and J.E.; investigation, J.G.; resources, J.G., I.H.; data curation, J.S., J.E. and R.W.; writing—original draft preparation, R.W., J.S., I.H. and X.X.; writing—review and editing, I.H., X.X., A.N. and J.G.; visualization, J.S.; supervision, I.H., J.G. and A.N.. All authors have read and agreed to the published version of the manuscript.
Funding
This research received no external funding.
Data Availability Statement
We will share all our research data if our paper is accepted.
Conflicts of Interest
The authors declare no conflicts of interest.
Abbreviations
The following abbreviations are used in this manuscript:
| ISR | in-stent restenosis |
| ST | stent thrombosis |
| ESS | endothelial shear stress |
| WSS | wall shear stress |
| vWF | von Willebrand factor |
| CFD | computational fluid dynamics |
| DES | drug eluting stents |
| LBM | lattice Boltzmann method |
| 2D | two-dimensional |
| probability density function | |
| LBGK | lattice Bhatnagar-Gross-Krook |
Appendix A. Simulation Set up
This Appendix will provide additional detail concerning the set-up and parameterisation of our simulations. Specifically, it will focus on the control of diffusion, treatment of irregular boundaries, and flow boundary conditions.
Appendix A.1. Control of Diffusion
Eliminating diffusion entirely is not possible in LBM or any other numerical scheme. Simulations are therefore parameterized to emphasize advection over diffusion, by simulating at large Peclet numbers:
We do not aim to facilitate precise solutions of advection-diffusion dynamics for . Rather, to obtain a measure of relative residence time which supports quantitative comparison of clinically relevant scenarios in the form of values of which stratify different patho-physiologies and characterise domain locations. This comparison might be facilitated by a normalisation, relative to the corresponding physiological case. Even so, a natural step is to minimise diffusion by parameterising as follows:
However, in LBGK simulation, the relaxation parameter cannot approach too closely its upper bound without exciting instability [19]. We defer further consideration of lattice and parameterisation using the lattice and L. For results reported, we set 1.98.
Appendix A.2. Treatment of Irregular Boundaries
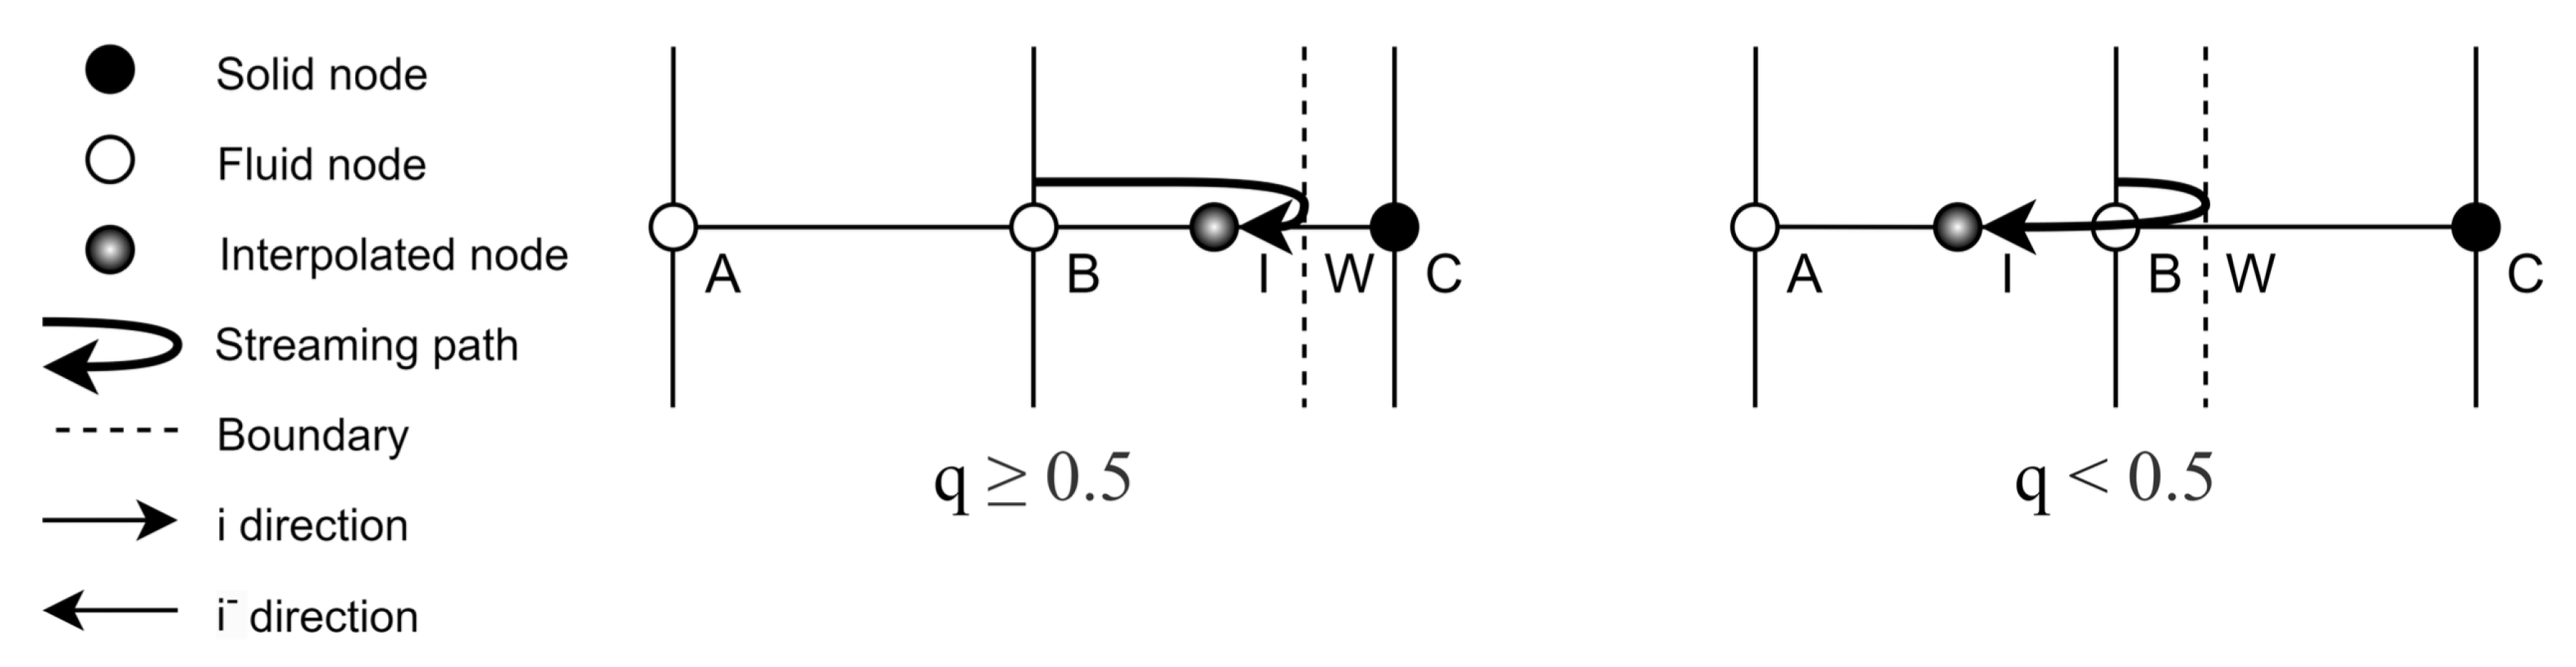
One benefit of the LBM is its ability to represent complex geometries using straight-forward boundary closure rules. To model the correct boundary curvature characteristic of strut and endothelial cell geometries, an interpolated bounce-back scheme is implemented, following Bouzidi et al. [41]. This scheme determines the post-collision and post-propagation distribution function by interpolating between the post-collision pre-propagation distribution functions, at the fluid site immediately adjacent to the boundary and at the penultimate lattice site . The formulation of depends upon a metric which is the normalised distance to the boundary wall:
To further exemplify this result and declare our notation we provide the one-dimensional schematic of Figure A1, below.
Figure A1.
Bouzidi Boundary Conditions: Schematic depicting the Bouzidi boundary condition interpolation rules based on the two cases & , in one dimension. Note, the labelling convention used in this figure relates to that used in Equation (A1).
Figure A1.
Bouzidi Boundary Conditions: Schematic depicting the Bouzidi boundary condition interpolation rules based on the two cases & , in one dimension. Note, the labelling convention used in this figure relates to that used in Equation (A1).
For closure of the advection-diffusion scheme, we also apply the interpolated bounce-back scheme on the distribution function. The remaining boundary conditions implemented for both the lattice Boltzmann and advection-diffusion solver are discussed in the next section.
Appendix A.3. Flow Boundary Conditions
Table 1 outlines: (i) the range of physical scales; (ii) the scales simulated; (iii) the related lattice units (lu). To ensure appropriate resolution, we use a conversion of 1 = 1 lu. Figure 1 is a schematic of the simulation domain (top) and then an enlargement of the local flow dynamics around a strut. Figure 2 declares the two strut profiles considered in this work, both having the same maximum width . Further, the ECs have a height of and length .
A mix of boundary conditions have been implemented for the species and concentration populations. In Figure 1, we utilise the symmetry of an idealised artery channel for computational efficiency, a symmetry condition being implemented at the north boundary, for both the species and concentration populations. At the east and west boundaries for the concentration we implement periodic boundary conditions. For the momentum distribution , we implement Zhang-Kwok pressure boundary conditions [40], which impose a pressure step across an otherwise periodic velocity boundary. The pressure in LBM is proportional to the density as . Equation (A2) describes how the pressure gradient is calculated by multiplying exiting distribution functions by constant . The density (pressure) difference between the inlet and outlet will drive fluid in the streaming direction, by maintaining a higher (lower) density at the distal (proximal) arterial boundary.
We assign to ensure our simulations fall within the physiological Re number range for artery flow. See Section 3. At the south boundary, to represent endothelial cells and struts, we implement the no-slip interpolative bounce back boundary condition of Appendix A.2 for both species and concentration.
References
- Vaduganathan, M.; Mensah, G.A.; Turco, J.V.; Fuster, V.; Roth, G.A. The Global Burden of Cardiovascular Diseases and Risk. Journal of the American College of Cardiology 2022, 80, 2361–2371. [Google Scholar] [CrossRef] [PubMed]
- Buccheri, D.; Piraino, D.; Andolina, G.; Cortese, B. Understanding and managing in-stent restenosis: A review of clinical data, from pathogenesis to treatment. Journal of Thoracic Disease 2016, 8, E1150–E1162. [Google Scholar] [CrossRef] [PubMed]
- Polimeni, A.; Sorrentino, S.; Spaccarotella, C.; Mongiardo, A.; Sabatino, J.; De Rosa, S.; Gori, T.; Indolfi, C. Stent Thrombosis After Percutaneous Coronary Intervention: From Bare-Metal to the Last Generation of Drug-Eluting Stents. Cardiology Clinics 2020, 38, 639–647. [Google Scholar] [CrossRef] [PubMed]
- Moukarbel, G. Coronary Stent Thrombosis and Mortality: Does the Relationship Stand the Test of Time? Journal of the American Heart Association 2022, 11, e025341. [Google Scholar] [CrossRef] [PubMed]
- Strony, J.; Beaudoin, A.; Brands, D.; Adelman, B. Analysis of shear stress and hemodynamic factors in a model of coronary artery stenosis and thrombosis. American Journal of Physiology-Heart and Circulatory Physiology 1993, 265, H1787–H1796. [Google Scholar] [CrossRef] [PubMed]
- Li, L.; Wang, S.; Han, K.; Qi, X.; Ma, S.; Li, L.; Yin, J.; Li, D.; Li, X.; Qian, J. Quantifying Shear-induced Margination and Adhesion of Platelets in Microvascular Blood Flow. Journal of molecular biology 2023, 435, 167824–167824. [Google Scholar] [CrossRef]
- Okhota, S.; Melnikov, I.; Avtaeva, Y.; Kozlov, S.; Gabbasov, Z. Shear Stress-Induced Activation of von Willebrand Factor and Cardiovascular Pathology. International journal of molecular sciences 2020, 21, 7804. [Google Scholar] [CrossRef]
- Hoare, D.; Bussooa, A.; Neale, S.; Mirzai, N.; Mercer, J. The Future of Cardiovascular Stents: Bioresorbable and Integrated Biosensor Technology. Advanced science 2019, 6, 1900856. [Google Scholar] [CrossRef]
- Koskinas, K.C.; Chatzizisis, Y.S.; Antoniadis, A.P.; Giannoglou, G.D. Role of Endothelial Shear Stress in Stent Restenosis and Thrombosis. Journal of the American College of Cardiology 2012, 59, 1337–1349. [Google Scholar] [CrossRef]
- Kolandaivelu, K.; Swaminathan, R.; Gibson, W.J.; Kolachalama, V.B.; Nguyen-Ehrenreich, K.L.; Giddings, V.L.; Coleman, L.; Wong, G.K.; Edelman, E.R. Stent Thrombogenicity Early in High-Risk Interventional Settings Is Driven by Stent Design and Deployment and Protected by Polymer-Drug Coatings. Circulation 2011, 123, 1400–1409. [Google Scholar] [CrossRef]
- Rikhtegar, F.; Wyss, C.; Stok, K.S.; Poulikakos, D.; Müller, R.; Kurtcuoglu, V. Hemodynamics in coronary arteries with overlapping stents. Journal of biomechanics 2014, 47, 505–511. [Google Scholar] [CrossRef] [PubMed]
- Chen, W.X.; Poon, E.K.; Thondapu, V.; Hutchins, N.; Barlis, P.; Ooi, A. Haemodynamic effects of incomplete stent apposition in curved coronary arteries. Journal of biomechanics 2017, 63, 164–173. [Google Scholar] [CrossRef] [PubMed]
- Balakrishnan, B.; Tzafriri, A.R.; Seifert, P.; Groothuis, A.; Rogers, C.; Edelman, E.R. Strut Position, Blood Flow, and Drug Deposition. Circulation 2005, 111, 2958–2965. [Google Scholar] [CrossRef] [PubMed]
- Chen, Y.; Xiong, Y.; Jiang, W.; Yan, F.; Guo, M.; Wang, Q.; Fan, Y. Numerical simulation on the effects of drug eluting stents at different Reynolds numbers on hemodynamic and drug concentration distribution. Biomedical engineering online 2015, 14 Suppl 1, S16–S16. [Google Scholar] [CrossRef]
- O’Brien, C.C.; Kolachalama, V.B.; Barber, T.J.; Simmons, A.; Edelman, E.R. Impact of flow pulsatility on arterial drug distribution in stent-based therapy. Journal of controlled release 2013, 168, 115–124. [Google Scholar] [CrossRef]
- Vijayaratnam, P.R.S.; Reizes, J.A.; Barber, T.J. Flow-Mediated Drug Transport from Drug-Eluting Stents is Negligible: Numerical and In-vitro Investigations. Annals of biomedical engineering 2019, 47, 878–890. [Google Scholar] [CrossRef]
- Chabi, F.; Abbasnezhad, N.; Champmartin, S.; Sarraf, C.; Bakir, F. Computer Simulation of the Coupling Between Recirculation Flows and Drug Release from a Coronary Drug-Eluting Stent. Biomedical Materials & Devices.
- Vijayaratnam, P.R.S.; Reizes, J.A.; Barber, T.J. The impact of strut profile geometry and malapposition on the haemodynamics and drug-transport behaviour of arteries treated with drug-eluting stents. International journal of numerical methods for heat & fluid flow 2022, 32, 3881–3907. [Google Scholar]
- Kruger, T.; Kusumaatmaja, H.; Kuzmin, A.; Shardt, O.; Silva, G.; Viggen, E.M. The Lattice Boltzmann method : principles and practice; Graduate texts in physics, Springer: Switzerland, 2017 - 2017. [Google Scholar]
- Guo, Z.; Shu, C. Lattice Boltzmann method and its applications in engineering; Advances in computational fluid dynamics ; vol. 3, World Scientific: Singapore ;, 2013.
- Chen, S.; Doolen, G.D. LATTICE BOLTZMANN METHOD FOR FLUID FLOWS. Annual review of fluid mechanics 1998, 30, 329–364. [Google Scholar] [CrossRef]
- M. Sakthivel, K.A. An off-lattice Boltzmann method for blood flow simulation through a model irregular arterial stenosis: The effects of amplitude and frequency of the irregularity. Physics of Fluids 2021.
- Kang, X. Lattice Boltzmann method simulating hemodynamics in the three-dimensional stenosed and recanalized human carotid bifurcations. Sci. China Phys. Mech. Astron 2015. [Google Scholar] [CrossRef]
- Stamou, A.C.; Buick, J.M. Lattice Boltzmann method simulating hemodynamics in the three-dimensional stenosed and recanalized human carotid bifurcations. Journal of Physics A: Mathematical and Theoretical 2016, 49. [Google Scholar]
- Bernsdorf, J.; Harrison, S.; Smith, S.; Lawford, P.; Hose, D. Concurrent Numerical Simulation of Flow and Blood Clotting using the Lattice Boltzmann Technique. 11th International Conference on Parallel and Distributed Systems (ICPADS’05). IEEE, 2005, Vol. 2, pp. 336–340.
- Caiazzo, A.; Evans, D.; Falcone, J.L.; Hegewald, J.; Lorenz, E.; Stahl, B.; Wang, D.; Bernsdorf, J.; Chopard, B.; Gunn, J.; Hose, R.; Krafczyk, M.; Lawford, P.; Smallwood, R.; Walker, D.; Hoekstra, A. A Complex Automata approach for in-stent restenosis: Two-dimensional multiscale modelling and simulations. Journal of computational science 2011, 2, 9–17. [Google Scholar] [CrossRef]
- Hirabayashi, M.; Ohta, M.; Rüfenacht, D.A.; Chopard, B. A lattice Boltzmann study of blood flow in stented aneurism. Future Generation Computer Systems 2004, 20, 925–934. [Google Scholar] [CrossRef]
- Dandan, M.; Yong, W.; Mueed, A.; Ansgar, A.; Michael, S.; Uecker, M. In silico modeling for personalized stenting in aortic coarctation. Engineering Applications of Computational Fluid Mechanics 2022, 16, 2056–2073. [Google Scholar] [CrossRef]
- Afrouzi, H.H.; Ahmadian, M.; Hosseini, M.; Arasteh, H.; Toghraie, D.; Rostami, S. Simulation of blood flow in arteries with aneurysm: Lattice Boltzmann Approach (LBM). Computer Methods and Programs in Biomedicine 2020, 187, 105312. [Google Scholar] [CrossRef] [PubMed]
- Osaki, S.; Hayashi, K.; Kimura, H.; Seta, T.; Sasayama, T.; Tomiyama, A. Numerical Simulations of Flows in a Cerebral Aneurysm Using the Lattice Boltzmann Method with the Half-Way and Interpolated Bounce-Back Schemes. Fluids 2021, 6. [Google Scholar] [CrossRef]
- Bhatnagar, P.L.; Gross, E.P.; Krook, M. A model for collision processes in gases. I. Small amplitude processes in charged and neutral one-component systems. Physical review 1954, 94, 511. [Google Scholar] [CrossRef]
- Frisch, U.; Hasslacher, B.; Pomeau, Y. Lattice-gas automata for the Navier-Stokes equation. Physical Review Letters 1986, 56, 1505–1508. [Google Scholar] [CrossRef]
- Succi, S. The lattice Boltzmann equation: for fluid dynamics and beyond; Oxford university press, 2001.
- Landau, L.; Lifshitz, E. Fluid Mechanics. Fluid Mechanics. Second Edition. 1987. Pergamon 1987. [Google Scholar] [CrossRef]
- Flekkøy, E. Lattice Bhatnagar-Gross-Krook models for miscible fluids. Physical Review E 1993, 47, 4247. [Google Scholar] [CrossRef]
- Wolf-Gladrow, D. A lattice Boltzmann equation for diffusion. Journal of statistical physics 1995, 79, 1023–1032. [Google Scholar] [CrossRef]
- Inamuro, T.; Yoshino, M.; Inoue, H.; Mizuno, R.; Ogino, F. A lattice Boltzmann method for a binary miscible fluid mixture and its application to a heat-transfer problem. Journal of Computational Physics 2002, 179, 201–215. [Google Scholar] [CrossRef]
- Guo, Z.; Zheng, C.; Shi, B. Discrete lattice effects on the forcing term in the lattice Boltzmann method. Physical review. E, Statistical, nonlinear, and soft matter physics 2002, 65, 046308–046308. [Google Scholar] [CrossRef] [PubMed]
- Chang, T.J.; Kao, H.M.; Yam, R.S.W. Lagrangian modeling of the particle residence time in indoor environment. Building and environment 2013, 62, 55–62. [Google Scholar] [CrossRef]
- Zhang, J.; Kwok, D.Y. Pressure boundary condition of the lattice Boltzmann method for fully developed periodic flows. Phys. Rev. E 2006, 73, 047702. [Google Scholar] [CrossRef] [PubMed]
- Bouzidi, M.; Firdaouss, M.; Lallemand, P. Momentum transfer of a Boltzmann-lattice fluid with boundaries. Physics of fluids (1994) 2001, 13, 3452–3459. [Google Scholar] [CrossRef]
- Hashemi, J.; Patel, B.; Chatzizisis, Y.S.; Kassab, G.S. Study of Coronary Atherosclerosis Using Blood Residence Time. Frontiers in Physiology 2021, 12. [Google Scholar] [CrossRef]
- Caro, C.; Fitz-Gerald, J.; Schroter, R. Atheroma and Arterial Wall Shear Observation, Correlation and Proposal of a Shear Dependent Mass Transfer Mechanism for Atherogenesis. Proceedings of the Royal Society of London. Series B, Containing papers of a Biological character. Royal Society (Great Britain) 1971, 177, 109–59. [Google Scholar] [CrossRef]
- Malek, A.; Alper, S.; Izumo, S. Hemodynamic shear stress and its role in atherosclerosis. JAMA : the journal of the American Medical Association 2000, 282, 2035–42. [Google Scholar] [CrossRef]
- Zhou, J.; Li, Y.S.; Chien, S. Shear Stress-Initiated Signaling and Its Regulation of Endothelial Function. Arteriosclerosis, thrombosis, and vascular biology 2014, 34. [Google Scholar] [CrossRef]
- Zhou, M.; Yu, Y.; Chen, R.; Liu, X.; Hu, Y.; Ma, Z.; Gao, L.; Jian, W.; Wang, L. Wall shear stress and its role in atherosclerosis. Frontiers in cardiovascular medicine 2023, 10, 1083547. [Google Scholar] [CrossRef]
- Phinikaridou, A.; Hua, N.; Pham, T.; Hamilton, J.A. Regions of Low Endothelial Shear Stress Colocalize With Positive Vascular Remodeling and Atherosclerotic Plaque Disruption. Circulation: Cardiovascular Imaging 2013, 6, 302–310. [Google Scholar] [CrossRef] [PubMed]
- Jenei, C.; Balogh, E.; Szabó, G.; Dézsi, C.; Kőszegi, Z. Wall shear stress in the development of in-stent restenosis revisited. A critical review of clinical data on shear stress after intracoronary stent implantation. Cardiology journal 2016, 23. [Google Scholar] [CrossRef] [PubMed]
- Gijsen, F.; Katagiri, Y.; Barlis, P.; Bourantas, C.; Collet, C.; Coskun, U.; Daemen, J.; Dijkstra, J.; Edelman, E.; Evans, P.; Van der Heiden, K.; Hose, R.; Koo, B.K.; Krams, R.; Marsden, A.; Migliavacca, F.; Onuma, Y.; Ooi, A.; Poon, E.; Serruys, P. Expert recommendations on the assessment of wall shear stress in human coronary arteries: Existing methodologies, technical considerations, and clinical applications. European heart journal 2019, 40. [Google Scholar] [CrossRef] [PubMed]
- Ng, J.; Bourantas, C.; Torii, R.; Huiying, A.; Tenekecioglu-Md-Phd, E.; Serruys, P.; Foin, N. Local Hemodynamic Forces After Stenting: Implications on Restenosis and Thrombosis. Arteriosclerosis, Thrombosis, and Vascular Biology 2017, 37, ATVBAHA.117–309728. [Google Scholar] [CrossRef]
- Okhota, S.; Melnikov, I.; Avtaeva, Y.; Kozlov, S.; Gabbasov, Z. Shear Stress-Induced Activation of von Willebrand Factor and Cardiovascular Pathology. International Journal of Molecular Sciences 2020, 21, 7804. [Google Scholar] [CrossRef]
- Gogia, S.; Neelamegham, S. Role of fluid shear stress in regulating VWF structure, function and related blood disorders. Biorheology 2015, 52. [Google Scholar] [CrossRef]
Figure 3.
Single Circular Strut, Re = 528: Plots of the residence time (left), velocity profile (middle) and shear rate (right) for flow around a circular stent strut which is: (i) -100%; (ii) 0%; (iii) 25%; and (iv) 50%, embedded. Results were taken at Reynolds number, Re = 528.
Figure 3.
Single Circular Strut, Re = 528: Plots of the residence time (left), velocity profile (middle) and shear rate (right) for flow around a circular stent strut which is: (i) -100%; (ii) 0%; (iii) 25%; and (iv) 50%, embedded. Results were taken at Reynolds number, Re = 528.
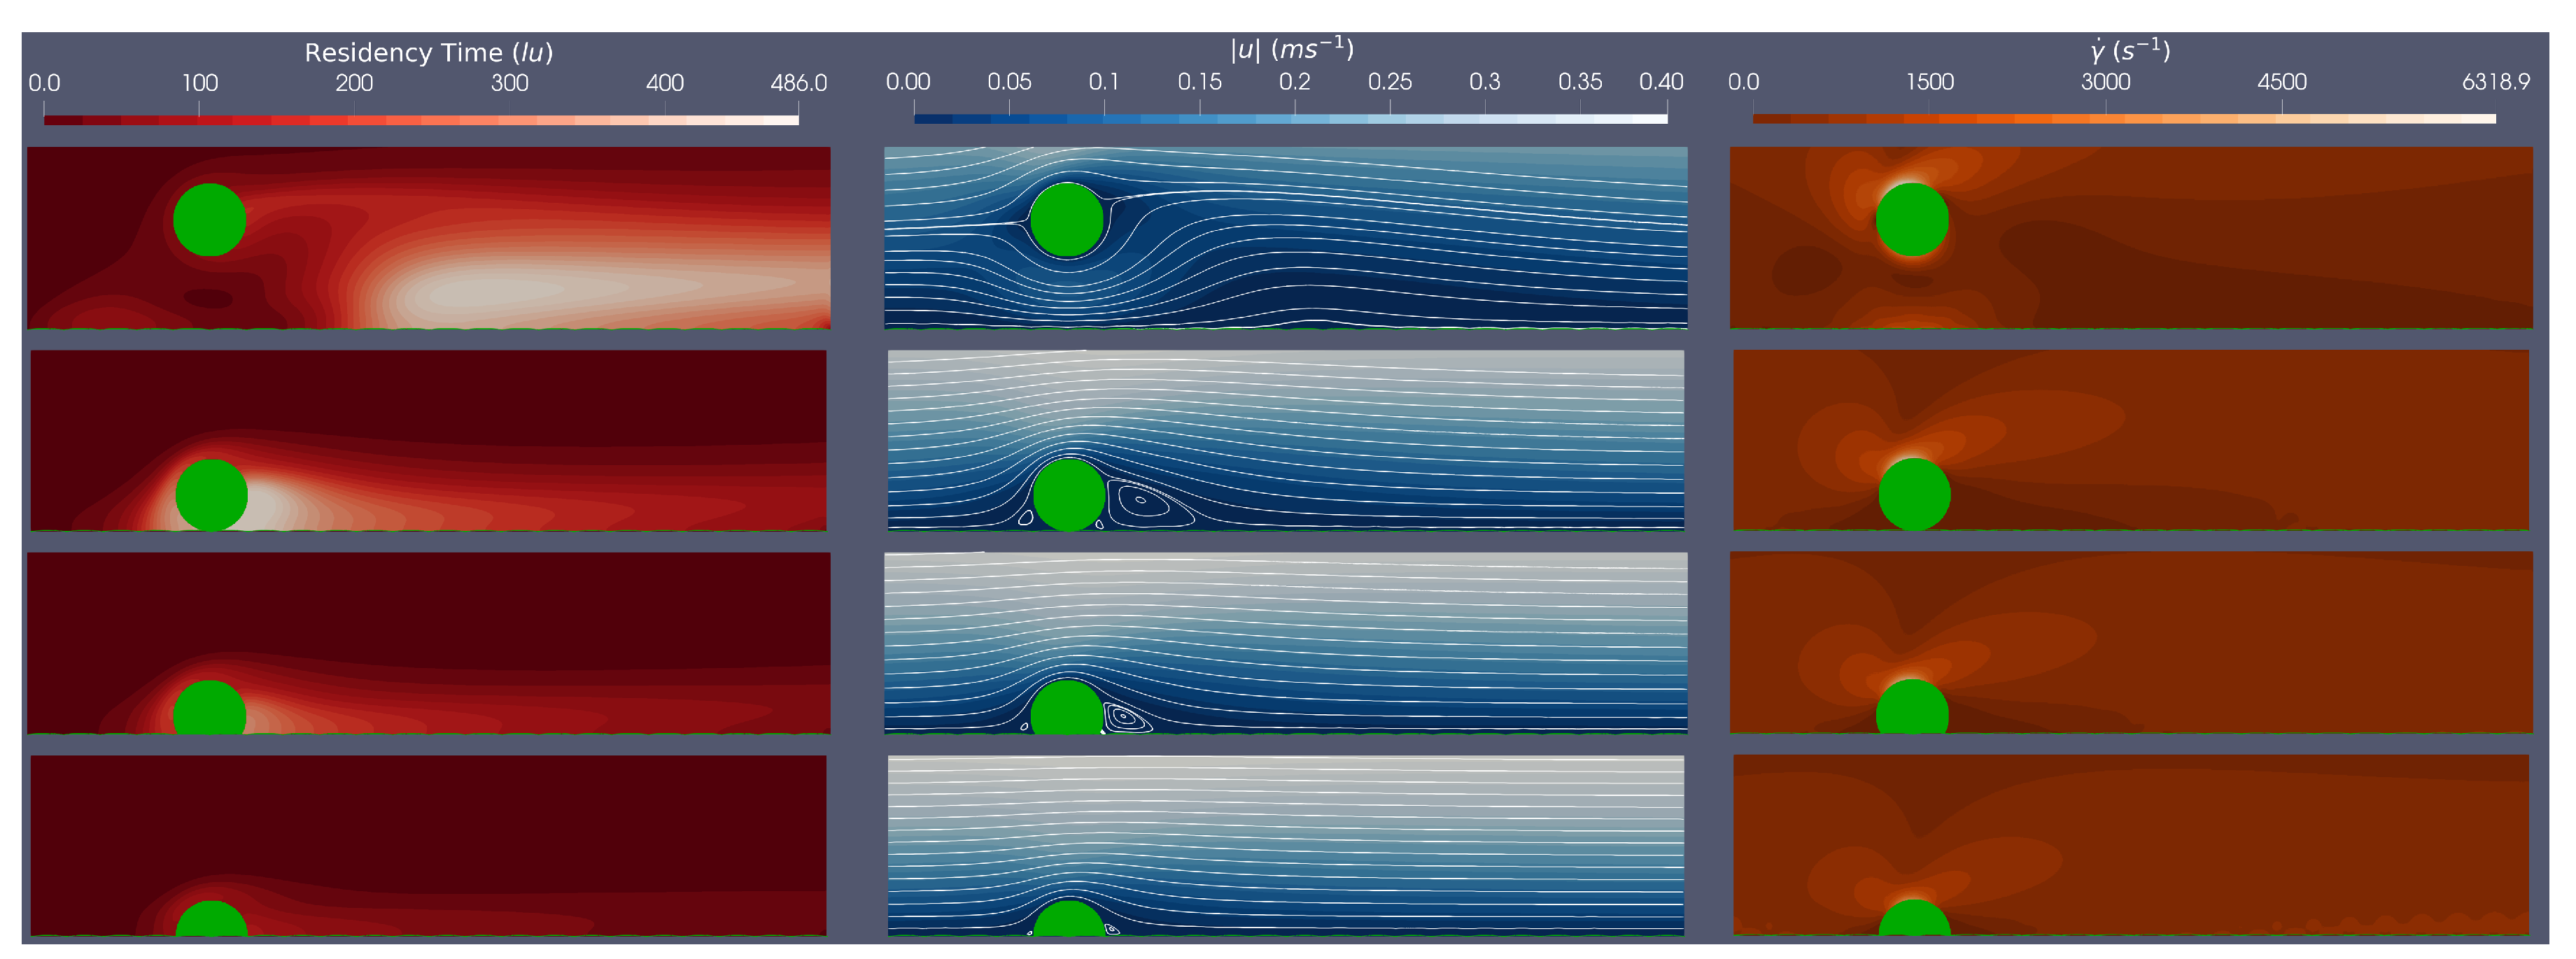
Figure 4.
Single Rounded Strut, Re = 528: Plots of the residence time (left), velocity profile (middle) and shear rate (right) for flow around a rounded stent strut which is: (i) -100%; (ii) 0%; (iii) 25%; and (iv) 50%, embedded. Results were taken at Reynolds number, Re = 528.
Figure 4.
Single Rounded Strut, Re = 528: Plots of the residence time (left), velocity profile (middle) and shear rate (right) for flow around a rounded stent strut which is: (i) -100%; (ii) 0%; (iii) 25%; and (iv) 50%, embedded. Results were taken at Reynolds number, Re = 528.
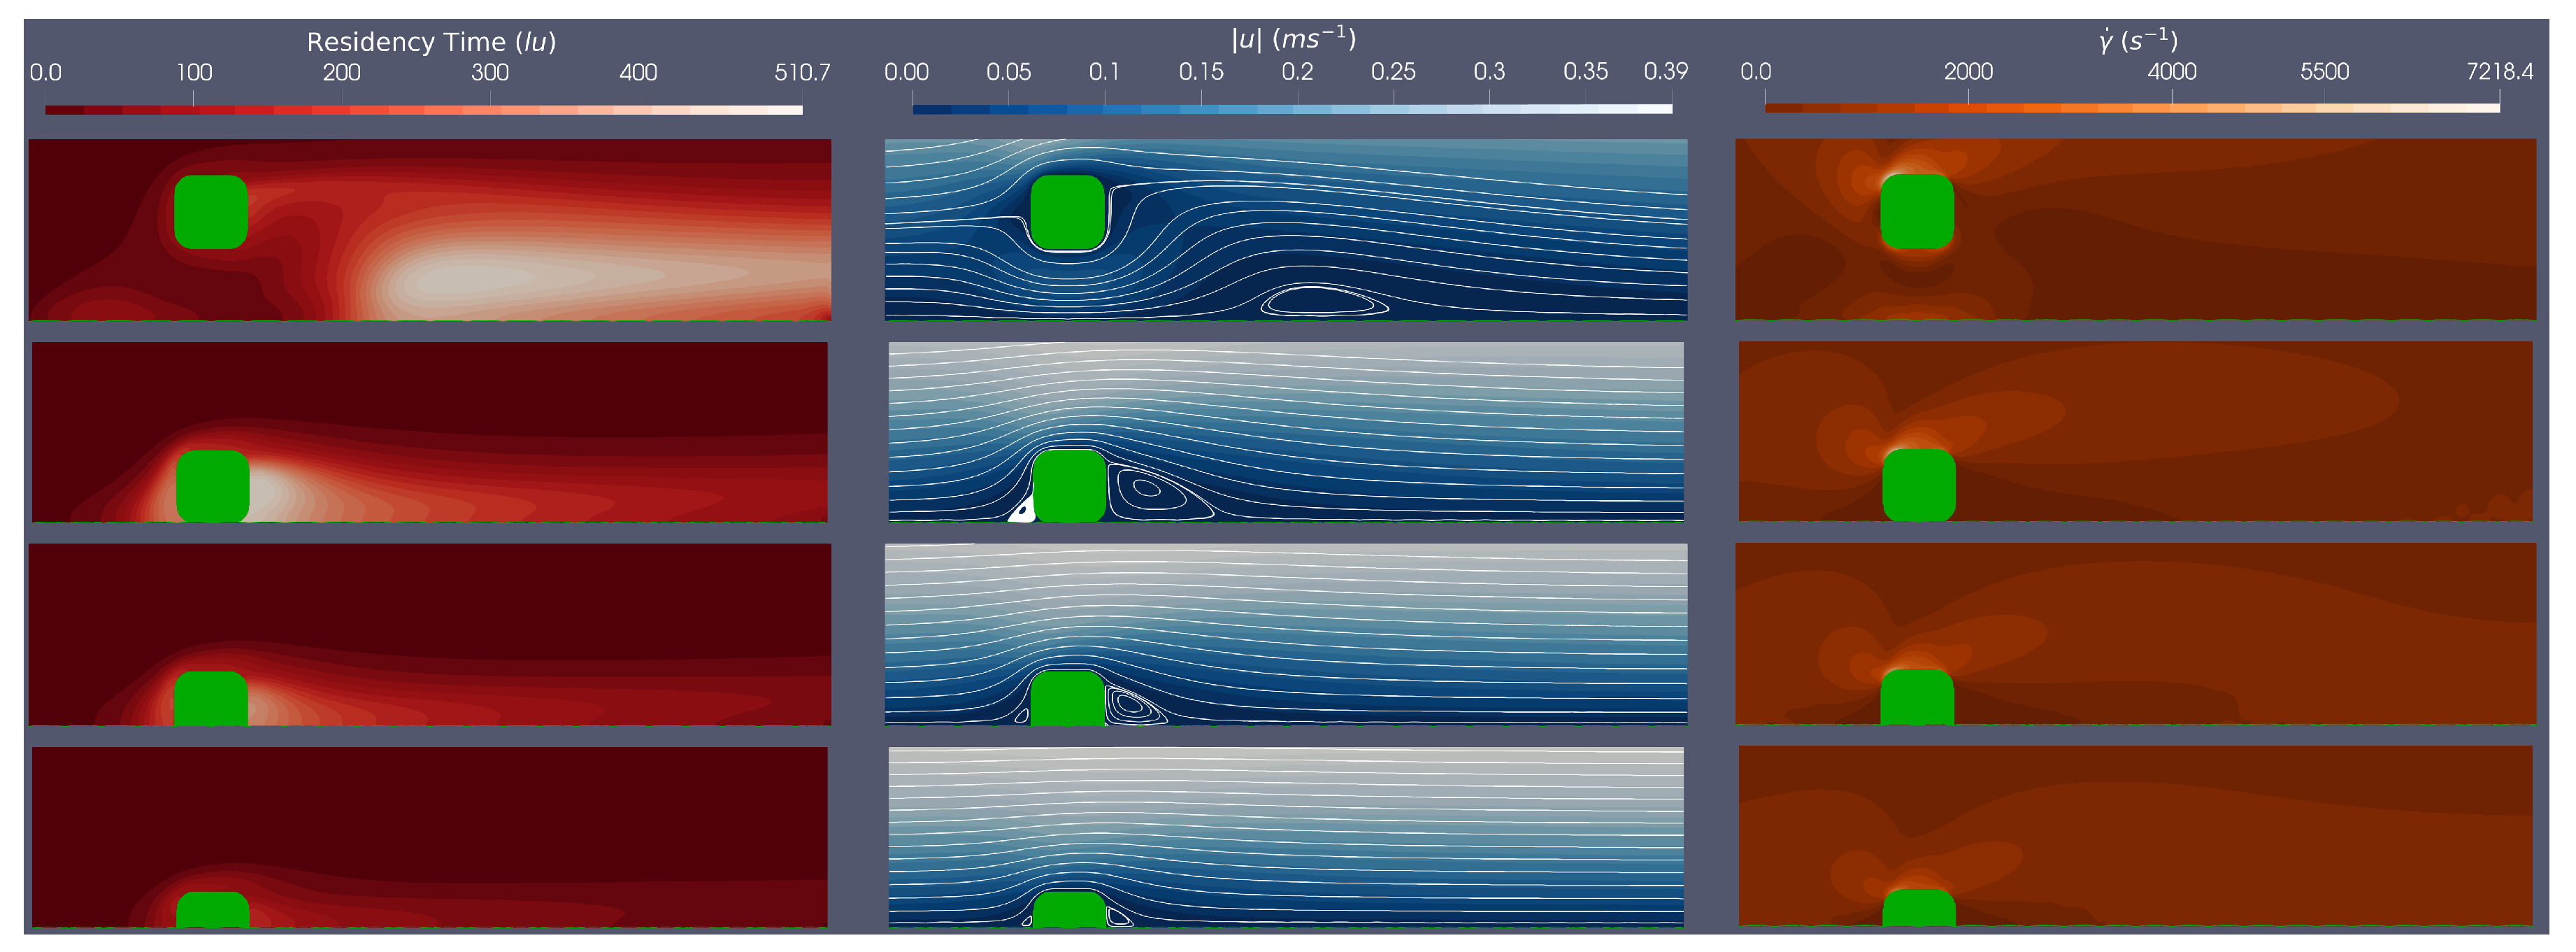
Figure 5.
Three Circular Strut, Re = 533: residence time (left) and the shear rate with Stokes stream function over-layed (right) for flow around three circular stent struts which are: (i) -100%; (ii) 0%; (iii) 25%; and (iv) 50%, embedded. Results were taken at Re = 533.
Figure 5.
Three Circular Strut, Re = 533: residence time (left) and the shear rate with Stokes stream function over-layed (right) for flow around three circular stent struts which are: (i) -100%; (ii) 0%; (iii) 25%; and (iv) 50%, embedded. Results were taken at Re = 533.
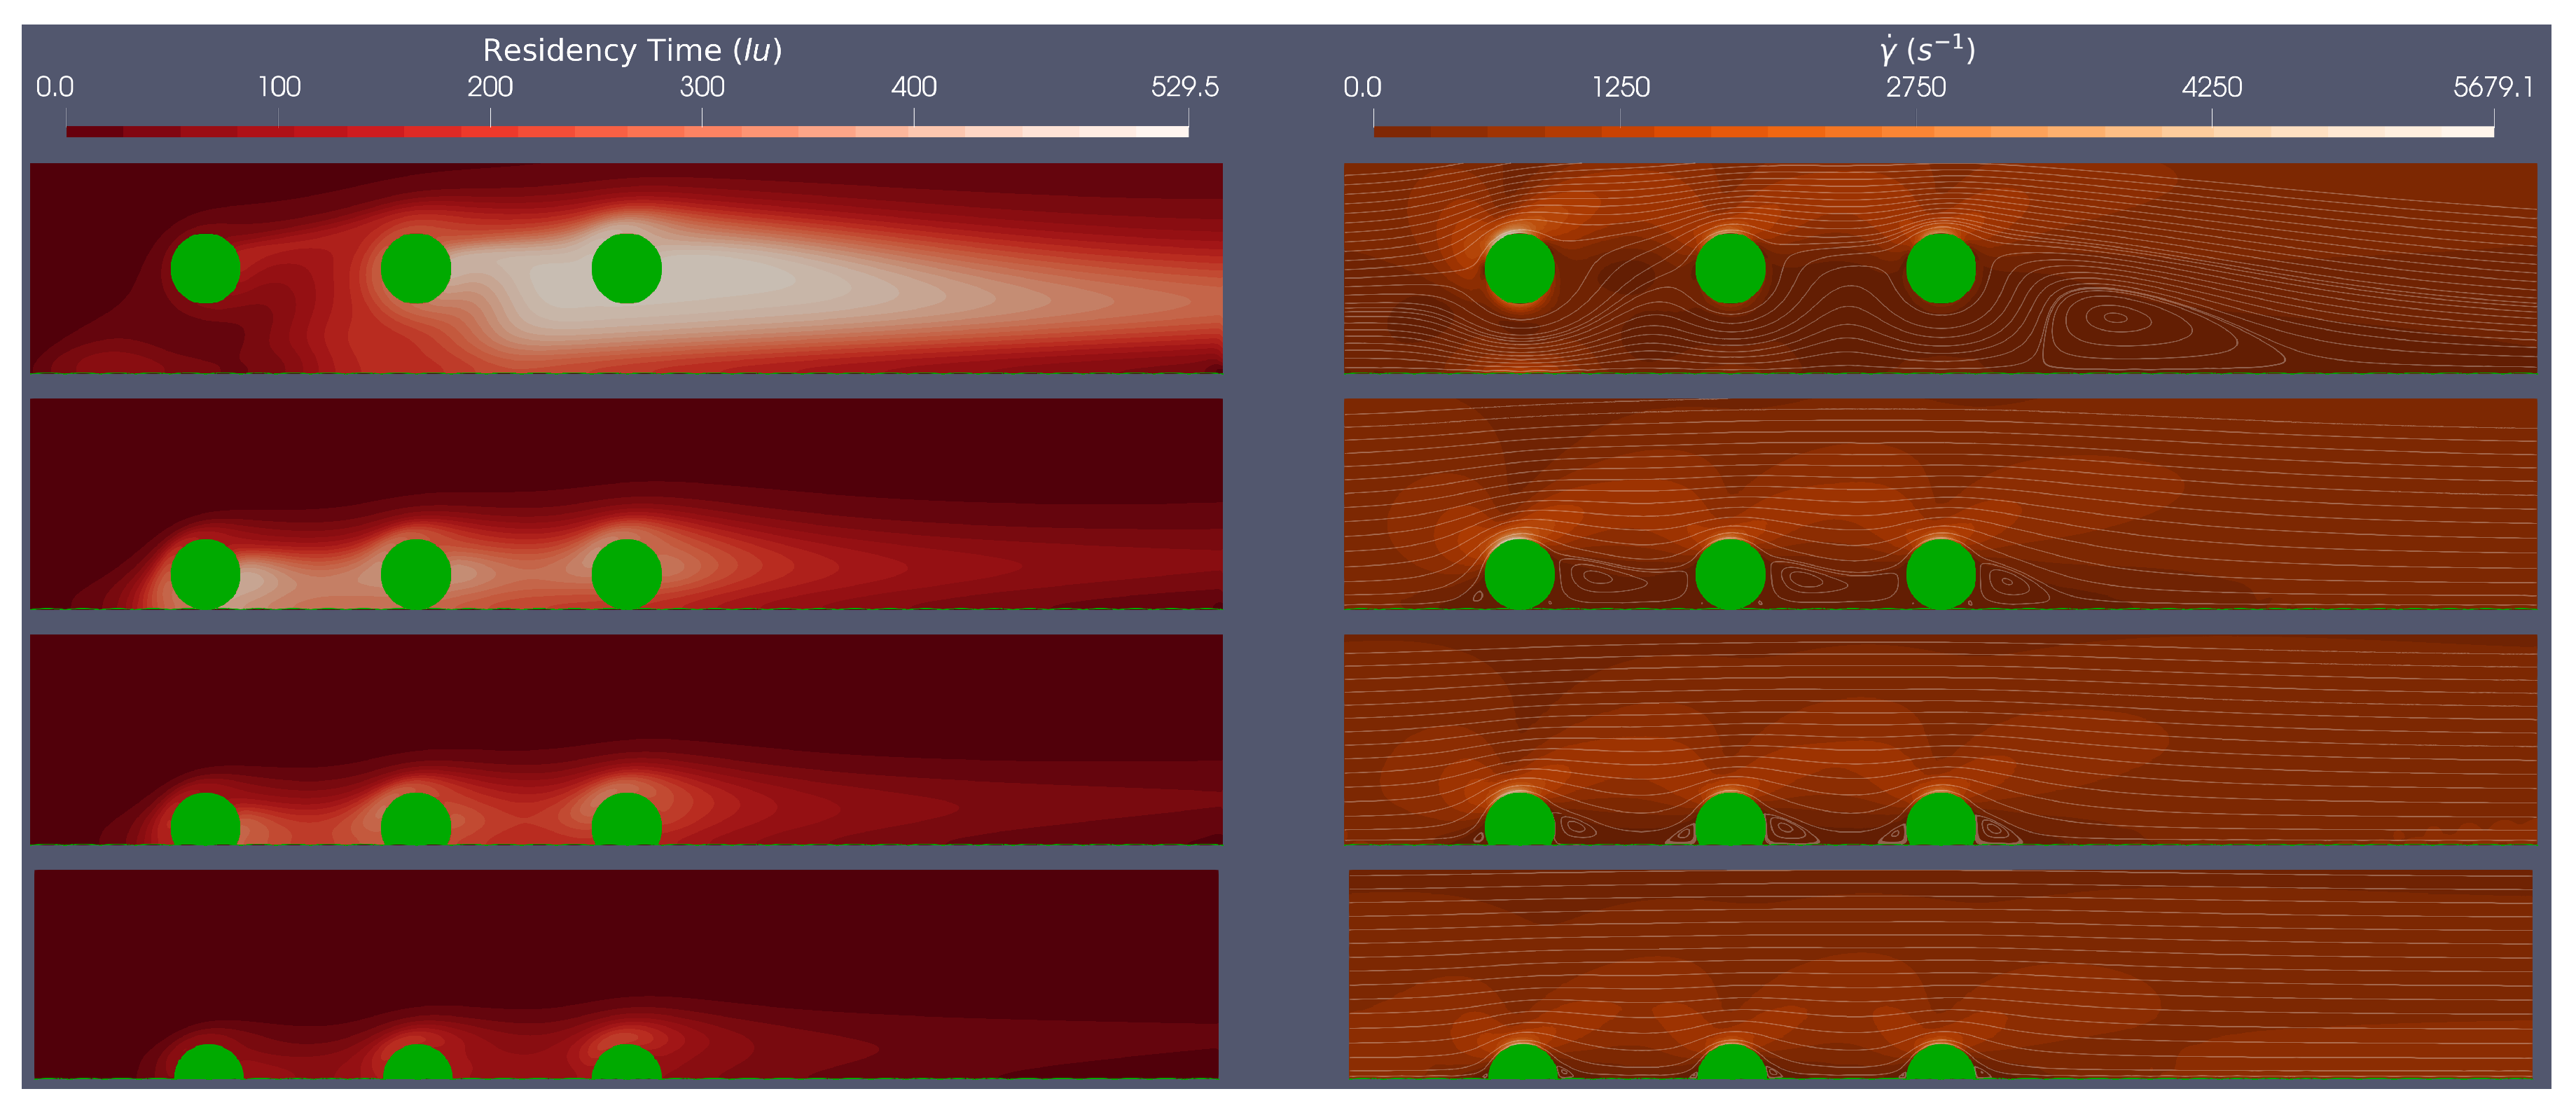
Figure 6.
Three Rounded Strut, Re = 533: Plots of the residence time (left) and the shear rate with Stokes stream function overlays (right) for flow around three circular stent struts which are: (i) -100%; (ii) 0%; (iii) 25%; and (iv) 50%, embedded. Results were taken at Re = 533.
Figure 6.
Three Rounded Strut, Re = 533: Plots of the residence time (left) and the shear rate with Stokes stream function overlays (right) for flow around three circular stent struts which are: (i) -100%; (ii) 0%; (iii) 25%; and (iv) 50%, embedded. Results were taken at Re = 533.
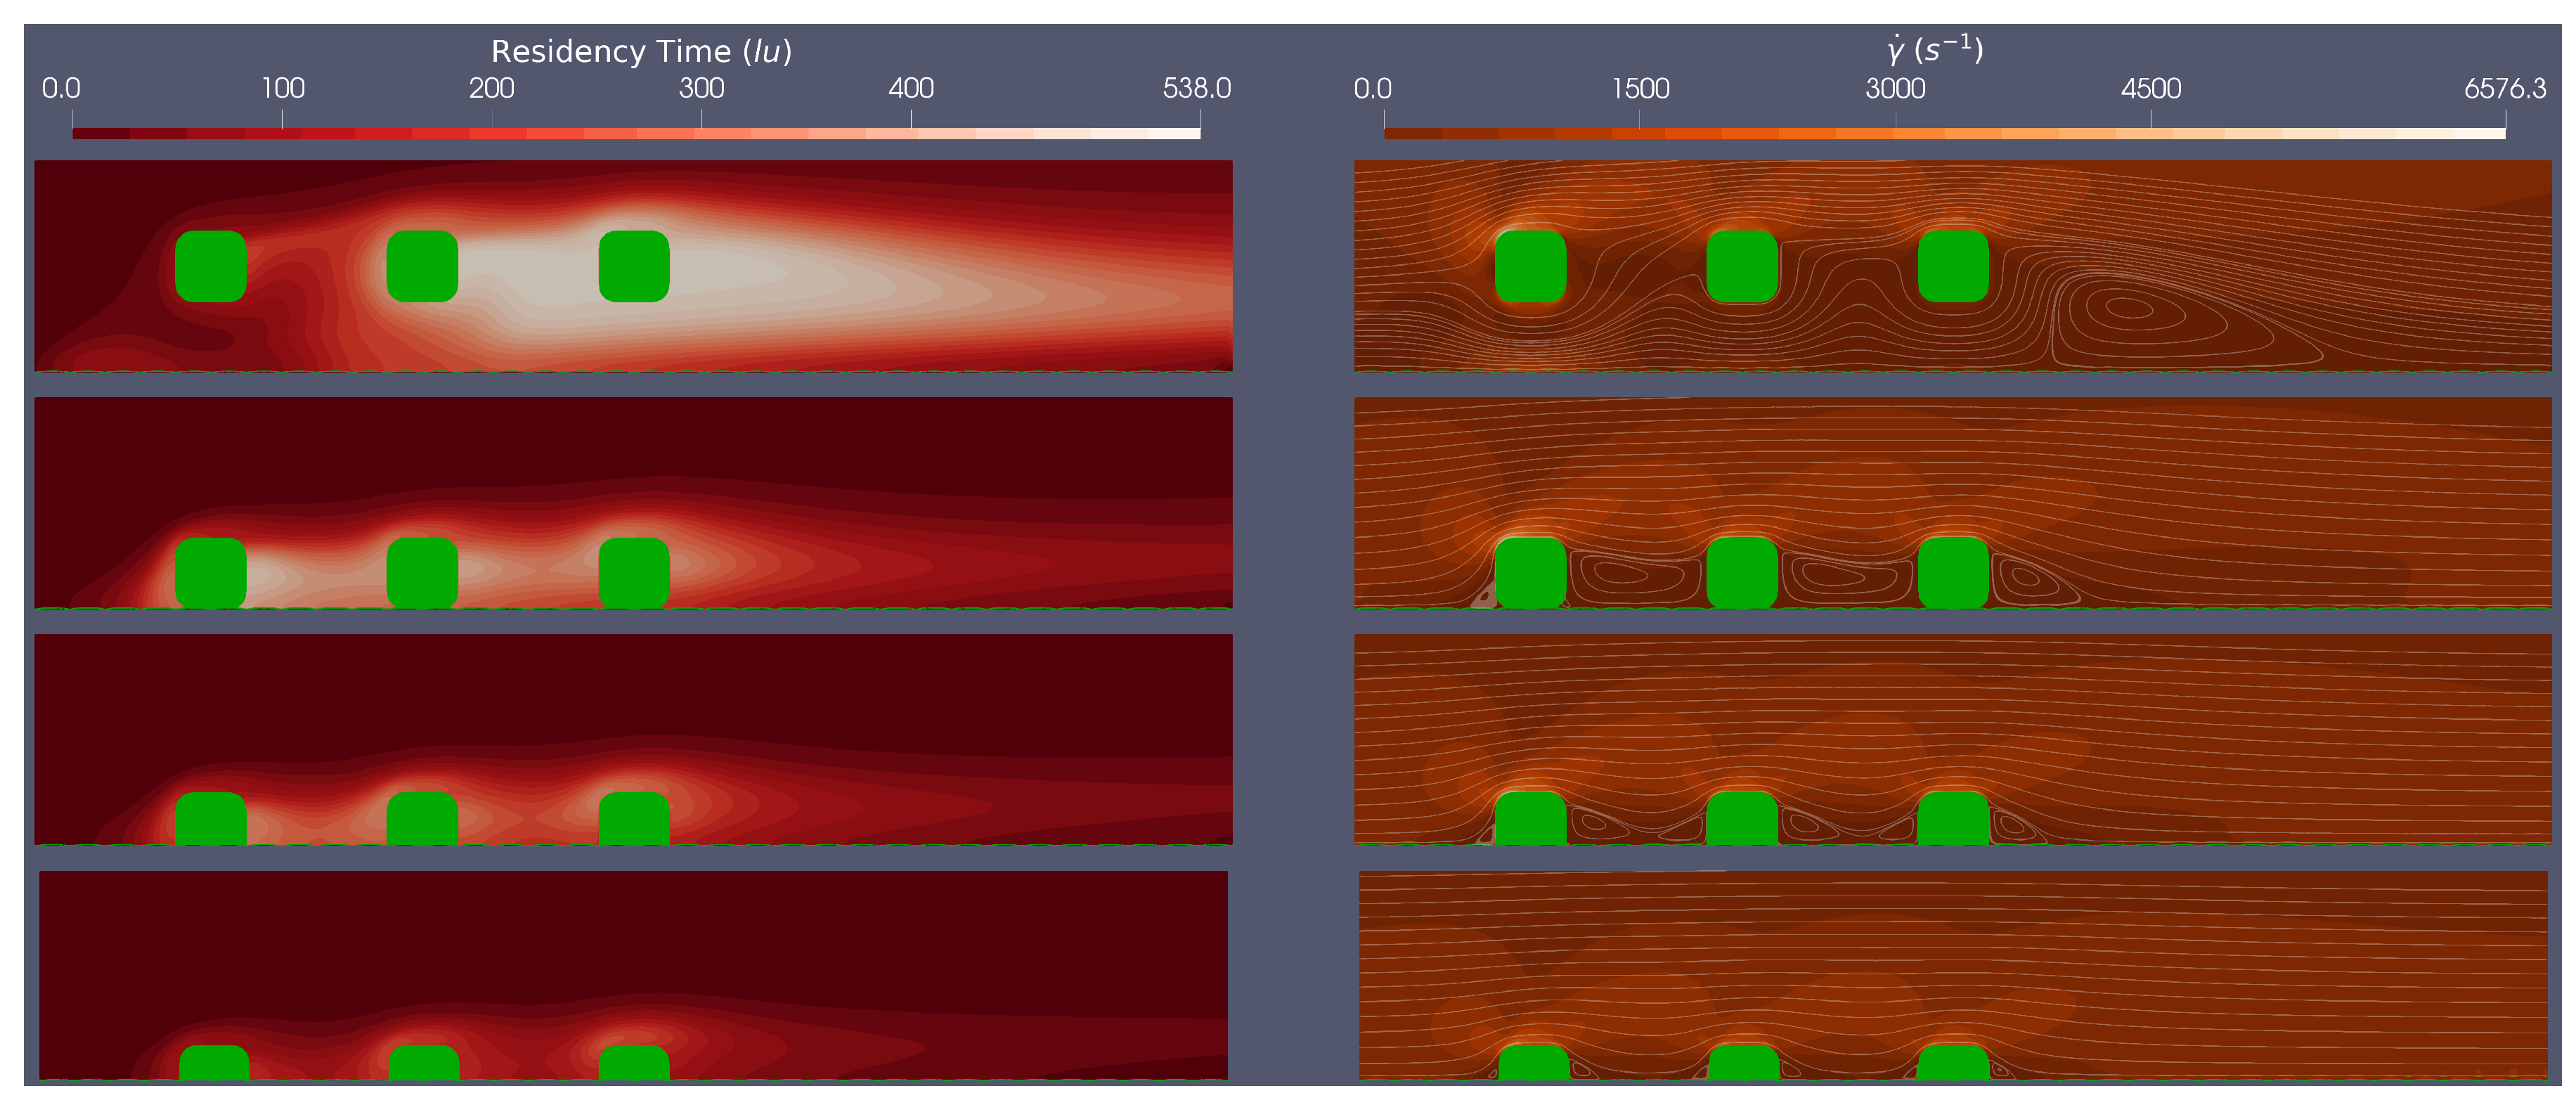

Table 1.
Scales: Each column shows the physical scale range, simulated scales, and the simulated scale in lattice units.
Table 1.
Scales: Each column shows the physical scale range, simulated scales, and the simulated scale in lattice units.
| Linking Physical to LB scales: 1 = 1 lu | |||
|---|---|---|---|
| Physical size range | Simulated size | Lattice units | |
| Stent Height | 100 lu | ||
| EC Height | 1.5 lu | ||
| EC Length | 50 lu | ||
| Artery diameter | 3000 lu | ||
Table 2.
Circular Stent Strut: Max WSS found at the top centre of strut. Relative Location is position relative to the origin at the bottom centre of the strut.
Table 2.
Circular Stent Strut: Max WSS found at the top centre of strut. Relative Location is position relative to the origin at the bottom centre of the strut.
| Reynolds Number | Embedded % | WSS | Shear Rate | residence Time | ||
|---|---|---|---|---|---|---|
| Max | Max | Max | Relative | Re-circulation | ||
| () | () | () | Location (m) | length (m) | ||
| Re=409 | -100 | 11.4 | 5406 | 328 | (345,72) | 45 |
| 0 | 9.91 | 4455 | 337 | (49,40) | 131 | |
| 25 | 8.9 | 3894 | 229 | (50,30) | 70 | |
| 50 | 7.41 | 3156 | 114 | (-33,44) | 24 | |
| Re=469 | -100 | 12.4 | 5881 | 385 | (354,60) | 117 |
| 0 | 10.9 | 4921 | 414 | (48,36) | 140 | |
| 25 | 9.77 | 4304 | 270 | (48,11) | 74 | |
| 50 | 8.15 | 3478 | 120 | (50,1) | 25 | |
| Re=528 | -100 | 13.3 | 6319 | 441 | (366,51) | 165 |
| 0 | 11.9 | 5357 | 486 | (47,32) | 160 | |
| 25 | 10.6 | 4690 | 299 | (48,11) | 77 | |
| 50 | 8.9 | 3781 | 120 | (50,1) | 26 | |
Table 3.
Rounded Square Stent Strut: Max WSS found at the post top left rounded corner. Relative Location is position relative to an origin taken at the bottom centre of the strut.
Table 3.
Rounded Square Stent Strut: Max WSS found at the post top left rounded corner. Relative Location is position relative to an origin taken at the bottom centre of the strut.
| Reynolds Number | Embedded % | WSS | Shear Rate | residence Time | ||
|---|---|---|---|---|---|---|
| Max | Max | Max | Relative | Re-circulation | ||
| () | () | () | Location (m) | length (m) | ||
| Re=409 | -100 | 12.3 | 6245 | 362 | (328,79) | 170 |
| 0 | 10.4 | 5053 | 360 | (51,49) | 154 | |
| 25 | 9.03 | 4300 | 267 | (51,33) | 87 | |
| 50 | 7.35 | 3457 | 151 | (51,14) | 41 | |
| Re=469 | -100 | 13.3 | 6753 | 428 | (333,67) | 231 |
| 0 | 11.5 | 5582 | 438 | (51,45) | 161 | |
| 25 | 9.97 | 4750 | 316 | (51,27) | 94 | |
| 50 | 8.09 | 3810 | 167 | (51,9) | 43 | |
| Re=528 | -100 | 14.3 | 7218 | 495 | (337,57) | 304 |
| 0 | 12.4 | 6077 | 510 | (51,42) | 169 | |
| 25 | 10.9 | 5174 | 354 | (51,24) | 99 | |
| 50 | 8.83 | 4143 | 172 | (51,7) | 44 | |
Disclaimer/Publisher’s Note: The statements, opinions and data contained in all publications are solely those of the individual author(s) and contributor(s) and not of MDPI and/or the editor(s). MDPI and/or the editor(s) disclaim responsibility for any injury to people or property resulting from any ideas, methods, instructions or products referred to in the content. |
© 2024 by the authors. Licensee MDPI, Basel, Switzerland. This article is an open access article distributed under the terms and conditions of the Creative Commons Attribution (CC BY) license (http://creativecommons.org/licenses/by/4.0/).
Copyright: This open access article is published under a Creative Commons CC BY 4.0 license, which permit the free download, distribution, and reuse, provided that the author and preprint are cited in any reuse.


