
Submitted:
05 September 2025
Posted:
09 September 2025
You are already at the latest version
Abstract
The global prevalence of peripheral artery disease (PAD) continues to rise, driving the increasing clinical use of drug-coated balloons (DCBs). These devices traditionally deliver the antiproliferative drug Paclitaxel (PTX) or its derivatives to the lesion site and have demonstrated superior effectiveness over plain old balloon angioplasty in mitigating post-interventional restenosis. Despite improved clinical outcomes, concerns with inefficient intraprocedural PTX transfer to the arterial wall and resultant off-target/systemic effects remain. This study utilizes DCB-arterial wall structural contact modeling to identify how the microstructural features of urea-based coatings modulate drug transfer efficiency, with consideration of both traditional PTX and recently proposed multi-drug payloads that also deliver the smooth muscle cell relaxant Valsartan (VAL). We incorporated experimentally-obtained measures of coating surface microstructures of PTX-urea and PTX-VAL-urea coatings into finite element models that simulate key physical processes in DCB deployment, namely device-tissue mechanical contact and diffusion-mediated drug transport. Model predictions enable the interrelation of coating surface microstructure to intraprocedural tissue-arterial wall contact area, mechanical load distribution, and drug-specific transfer to the arterial wall. Our findings suggest that coating microstructure modulates the transfer efficiency of PTX but not VAL, which is understood as a consequence of the procedural duration and relative molecular weights/mobilities of these drugs. Taken together, our study underscores the complexity of coating design/dosing for multi-drug payloads and supports the use of computational modeling in the device design process.
Keywords:
drug-coated balloon
; finite element analysis
; surface roughness
; contact mechanics
; drug transfer
; valsartan
; paclitaxel
∙Finite element models are
used to evaluate the effects of DCB surface microstructure on drug delivery
efficiency. Increased surface roughness leads to a larger contact area with the
arterial wall during DCB deployment. Coating-specific intraprocedural contact
area governs the transfer of high molecular weight drugs (i.e. Paclitaxel),
while the transfer of low molecular weight drug (i.e. Valsartan) shows a
limited dependence in this context.
1. Introduction
The global prevalence of peripheral artery disease (PAD) has increased significantly, with 1,466 diagnoses per 100,000 individuals worldwide in 2019 1. This rising trend is also evident in the United States, where 2020 estimates indicate that PAD prevalence ranged from 19 to 21 million individuals 2. Following the approval of drug-coated balloons (DCBs) nearly a decade ago, DCBs have seen rapid adoption in the U.S., wherein the primary drug payloads are Paclitaxel (PTX) and derivative compounds 3. An analysis of 62,054 arterial interventions performed from September 2016 to December 2019 showed that DCBs were used in 34.4% (n=21,352) of these procedures 4. Recent meta-analyses demonstrate that DCB angioplasty is more effective than plain old balloon (POB) angioplasty for PAD, significantly reducing the risk of revascularization, restenosis, late lumen loss, and major adverse events 5. Despite these benefits, some concerns remain regarding the long-term safety of PTX-coated devices, particularly potential systemic toxicity due to off-target delivery 6. It is important to note that even reduced doses of PTX may elevate systemic toxicity and the risk of all-cause mortality, particularly in individuals with pre-existing cardiovascular conditions 7. The long-term effectiveness and deleterious side-effects of DCB angioplasty is dependent on the PTX dosage administered, underscoring the necessity for continued improvement in drug transfer efficiency during balloon deployment 8.
DCB structural contact modeling has been sparsely used in device design, even though the contact between the coating and arterial wall obviously influences drug transfer and thus subsequent therapeutic performance 9. Contact between these inherently non-uniform surfaces make the relevant mechanics multiscale and challenges identification of key biophysical interactions governing transfer efficiency during DCB deployment 10. Finite element approaches may offer a solution, as they have been employed to analyze other endovascular device-artery interactions and identify arterial pressure, arterial compliance, lesion complexity, and stent design as factors underlying the success of vascular therapy 11,12. In the DCB context, prior research has qualitatively emphasized the importance of coating microstructure and surface topography in determining the nature of contact and drug transfer efficiency during balloon inflation 9,13,14. Distinct coating microstructures, such as needle-like versus spherical shapes, differentially influence coating penetration into tissue and interfacial contact mechanics, thereby affecting drug delivery 15. Surface modifications, such as ultraviolet-ozone plasma treatment, can also alter surface roughness to enhance coating adherence and drug transfer efficiency 16.
Existing literature has explored the relationship between DCB-arterial wall contact parameters, including contact area, contact load, and applied displacement 17,18. We seek to build upon these studies by understanding the operative contact area between the balloon and the arterial wall due to variations in coating composition and microstructure 9,12,19. We previously analyzed the surface topography of novel DCB coatings that deliver both PTX and the anti-contractile drug Valsartan (VAL), where we identified a compositional dependence of surface roughness and associated topographical parameters, including the arithmetical mean deviation (Ra) and root mean square deviation (Rq) of a microstructural surface map 20. Here we consider urea-based coating variants that are distinguished by the dosing ratio of VAL to PTX, specifically [VAL/PTX] = 0, 0.25, 0.5, and 1. The experimentally obtained topography of these coatings were used to generate contacting surfaces in a finite element model of DCB deployment. A commercial finite element package was utilized to perform elastic contact modeling, wherein model predictions yield measures of intra-procedural PTX and VAL delivery efficiency as a function of both coating compositional and balloon deployment parameters.
2. Materials and Methods
2.1. Quantification of Coating Surface Area
We previously quantified the surface roughness of urea-based coating formulations via texture analysis of scanning electron microscope (SEM) images (Figure 1A) 20. Here we directly used these images to first extract point clouds of the coating surfaces (Figure 1B), then applied an interpolation function to recover a continuous surface profile (Figure 1C), and finally used the function to create parametric surfaces amenable to finite element modeling (Figure 1D). This 3D geometry provided a quantification of urea-based surface area variation of PTX coatings with titrated VAL content, wherein each coating variant was reconstructed within a standardized geometrical domain (100x100x25 µm3) reflective of typical for urea-based coatings 21.
2.2. Contact Model: Domain Creation
A 2D axisymmetric model was developed to simulate intraprocedural DCB-arterial wall contact, with the axial direction along the globally-defined positive Y-axis and the radial direction aligned with the positive X-axis. This model consisted of three geometric domains: a balloon, a coating, and the arterial wall. Prior to imposing a geometrical rotation about the axis of symmetry, all domains were rectangular with balloon, coating, and arterial wall dimensions of 50 µm x 3 mm, ~25 µm x 3mm, and 0.5 mm x 6 mm, respectively. A rotational symmetry of order 4 (270°) was then applied across all domains, creating a 3D cylindrical representation of the DCB-arterial wall contact environment.
2.2.1. Balloon Domain
Balloon material properties were motivated by a standard semi-compliant catheter that expands up to 30% upon inflation 12. The balloon material was accordingly modeled as a homogeneous, isotropic, linear, elastic solid, with a Young’s modulus of 414 MPa, a Poisson’s ratio ν=0.4, and density ρ=916 kg/m3 based on reported values for Pebax balloons 12,22–24.
2.2.2. Coating Domain
We considered four coating domains, each with unique, experimentally-determined surface microstructures resulting from the varied drug payloads. Prior to axisymmetric domain rotation, all 2D coating domains had a length of 3 mm and a nonuniform width due to the surface microstructure. We utilized a polygon function to connect and close the distinct interpolation curves extracted from the SEM images, but positioning them at specific coordinates such that the mean coating thickness was ~25 µm in all cases. The coating formulation integrates two therapeutic agents, PTX and VAL, with urea serving as the excipient at a 1000 mg/mL concentration 25. This excipient concentration drives coating crystallization and confers both the structural integrity and drug release characteristics 26,27. Although the underlying urea crystals inherently exhibit mechanical anisotropy due to the alignment of needle-like surface features 15, we approximate the coating as an isotropic material with topography derived from SEM roughness profiles. The irregular, multi-directional nature of the observed surface features suggests that this simplification, which greatly reduces computational cost, reasonably reflects the critical surface features dictating contact mechanics 28-31. The urea-based coating layer was modeled as a homogeneous, isotropic linear elastic solid with a Young’s modulus of 2 GPa 29, a Poisson’s ratio of 0.3 30, and a density of 700 kg/m3 31.
2.2.3. Arterial Wall Domain
A 2D axisymmetric model of a vessel was created as a rectangle with L = 6 mm and W = 0.5 mm, which, upon revolution, generates an ideal cylinder mimicking the geometry of a healthy femoral arterial wall 32. The vessel length considered in each case was twice the length of the balloon/coating domains, ensuring full DCB containment and preventing any interference from imposed boundary conditions on simulated balloon expansion. The selected thickness represents a physiologically realistic dimension for the healthy femoral artery, particularly relevant for the combined intima-media layer.
The mechanical behavior of the vessel was characterized using the 3rd-order Mooney-Rivlin hyperelastic constitutive model 33,34. The assigned geometry and model parameters were based on reported values for femoral arteries (Table 1), with the tissue considered as a nearly incompressible solid with Poisson’s ratio of 0.475 12, a density of ρ=0.983 g/mL 35 and Young’s modulus Е=9Mpa 36.
2.3. Simulated Deployment
DCB-arterial wall contact due to a prescribed balloon displacement and subsequent drug transport upon coating contact with the arterial wall were simulated with a commercial finite element software (COMSOLTM) within a time-dependent 2D axisymmetric framework as described above. The contact pairs were defined as the nonuniform coating layer as the source boundary and the arterial wall as the destination boundary (Figure 2A) 37. The source was meshed using a triangular mesh to accommodate the sharp edges of the coating’s irregular surface, while a uniform rectangular mesh was employed for the featureless destination boundary (arterial wall) (Figure 2B). Mesh convergence studies were conducted by iteratively increasing mesh density within each domain, with the stop condition set as a difference of results between two successive steps less than 2%. To achieve accurate convergent results and save computation time, several factors were considered in the simulation. These include: (1) a prescribed displacement value applied on the top surface of the balloon-coating layer to mimic the actual balloon inflation-deflation process; (2) a first-order rectangular function used to apply the load for ramping; and (3) ensuring the mesh on the destination surface is always finer than the source boundary (Figure 2C).
2.4. Transport Equations
PTX and VAL transfer to and transport within the arterial tissue was simulated with a transient diffusion model, thereby neglecting the contribution of advection to drug transport within the wall 6,35-36. Thus, concentration-dependent drug kinetics are first-order and depend on assignment of an effective diffusion coefficient (Deff), which is drug- and domain-specific:
………………………….1
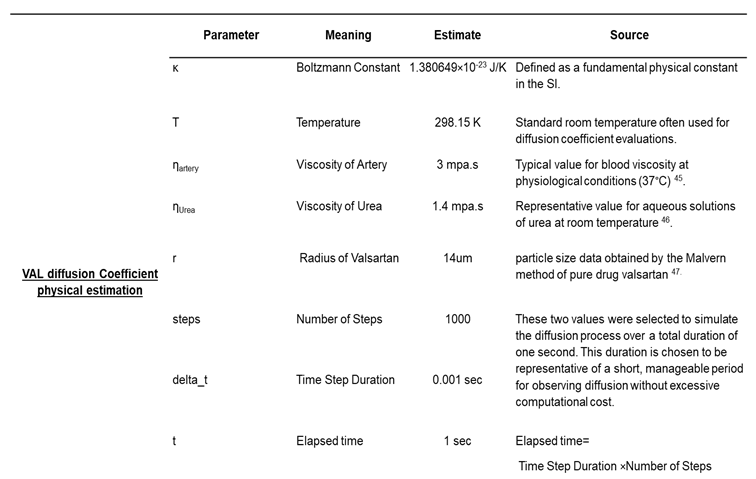
While VAL shows some capacity to penetrate transdermal tissues and undergo passive diffusion, its overall tissue distribution is limited, with no explicit diffusivity constant found in the given data 40. The available data mostly point to its pharmacokinetics involving limited tissue permeation and binding mostly to plasma proteins 41,42 we integrated theoretical calculations with MonteCarlo random walk simulation 43 to calculate the diffusion coefficient in both environments (urea coating and artery), initially, the Stokes-Einstein equation was used (Equation 2)
……………………………2
This involved defining the key parameters—specifically, the Boltzmann constant (kB), absolute temperature (T), VAL radius (r), and the viscosities (η)—for both the artery and urea coating at 310 K. All constants and parameters are summarized in Table 2. Monte Carlo simulation was performed for each environment to provide an empirical estimation of the diffusion coefficient. A total of 10,000 particles were simulated over 1,000 time steps, with each step lasting 1 millisecond.
During each time step, the displacement of each particle was randomly generated from a normal distribution, effectively mimicking Brownian motion. The mean squared displacement (MSD) of all particles from their initial positions was then calculated, and this MSD, along with the total simulation time, was used to estimate the diffusion coefficient for each environment using the relationship described in Equation 3.
………………………….3
2.5. Boundary Conditions
Arterial wall contact with the coating was defined as a contact pair within the structural contact model (Figure 2A). A zero-flux boundary condition was applied between the coating-lumen interface and the coating-balloon interface. A perfect sink condition was applied to the end wall layer. All other boundaries remained open throughout the balloon inflation-deflation simulation. The initial drug molar concentration of PTX in the coating was set to 140 mol/m3 for a coating thickness of 25 µm, which is equivalent to a real surface concentration of 3 µg/mm2, across all four models. Conversely, the initial volume concentration of VAL varied monotonically to match the experimental [VAL/PTX] surface concentration ratios of 0, 0.25, 0.5, and 1, corresponding to VAL molar concentrations of 0, 68.75, 137.5, and 275 mol/m3, respectively.
2.6. Simulation
To facilitate transient solution convergence, we employed a fully coupled approach in which all degrees of freedom embodied by the governing equation system are simultaneously solved for at each simulation time step. This strategy, while computationally intensive, provided convergence stability when implemented with an automatic, highly nonlinear (Newton) solver. The governing system of equations was integrated using a fifth-order backward differencing scheme with variable time stepping and default values of relative and absolute tolerances. To ensure a smooth and convergent simulation output, we applied ramping functions for surface displacements (as opposed to step-wise functions). The applied balloon displacement to simulate DCB deployment was 50, 60, 70, and 80 µm (Figure 3), values in line with the expected range of post-contact inflations for typical DCBs 23,44.
3. Results and Discussion
3.1. Surface Area Characterization
Our findings indicate that surface topography, characterized by peaks and valleys structures, is non-uniformly distributed across all patch regimes (Figure 1). The presence of these microscopic irregularities demonstrates that the true surface area within a regime always exceeds its idealized geometric surface area (Figure 4), which is considered along with standard measures of coating consistency over the balloon surface.
3.2. Contact Mechanics
Our results demonstrate that surfaces with high inherent roughness, such as 0[VAL/PTX], maintain a substantial contact area even at low loads due to their numerous peaks providing an extensive topological surface (Figure 5A-D). At low loads, a relatively smooth surface, such as 0.25,1 [VAL/PTX], initially presents a larger nominal contact area compared to a rougher surface like 0.5 [VAL/PTX] (Figure 5A, B) because the smooth surface forms a single, continuous contact patch, and its area growth saturate, leading to an insignificant increase in the contact area. For all coating variants, the contact area demonstrates a nonlinear increase with applied low loads (Figure 5E). However, a clear linear relationship emerges in the contact area, primarily due to the coating’s stiff nature. This stiffness causes the peaks to largely retain their shape, effectively acting as tiny indenters that deform the softer artery. The artery’s elastic properties enable it to intimately conform to the rough coating’s topography as the load increases. This conformity effectively engages more microstructural peaks, thereby increasing the effective contact area and confirming that surface roughness further enhances tissue-coating contact area (Figure 6).
The average contact stress, expressed by Von Mises stress in Pascals (Pa), is plotted against different applied displacements (Figure 7). While initial contact on a rough surface concentrates stress at peaks, the high deformability of the artery allows these peaks to distribute the load over a larger area. This mechanism reduces extreme local pressure points that would otherwise occur with hard, rough surfaces.
3.3. Impact of the Coating Roughness on the Amount of Drug Transfer
Increased surface roughness on DCBs results in a higher amount of PTX transfer to the artery (Figure 8). This is attributed to the fact that, as we stated before, a rougher surface offers a larger total contact area for drug release. This phenomenon of a rougher surface promotes superior mechanical interlocking with the artery, particularly as load increases. The irregularities promote faster transport of the drug away from the surface by offering more escape routes or contact points at the interface, thereby accelerating the achievement of steady-state drug release (Figure 8A, D). In contrast, the smooth surface provides a less efficient diffusion source, hindering drug transfer and slowing the achievement of steady-state release. PTX has a significantly higher molecular weight, approximately 853.9 g/mol, which is nearly double that of VAL, at approximately 435.52 g/mol. This substantial difference in molecular weight is a primary factor explaining the distinct behaviors observed between the two drugs ( and Figure 9). PTX’s larger size leads to greater resistance and slower movement within both the coating and the arterial tissue, resulting in lower diffusion coefficients Deff (5.41e-11, 1.99e-13) m²/s in the healthy artery and coating, respectively33. In contrast, VAL, being a relatively low molecular weight drug, shows higher diffusivity. Our Monte Carlo simulation estimated its diffusivity at 1.3×10⁻¹⁰ m²/s in the healthy artery and 4.54×10⁻¹¹ m²/s in the coating. This enhanced diffusivity allows VAL to easily navigate the internal matrix of the coating. The greater mobility of VAL subsequently overshadow any potential influence of surface topography on its release characteristics (Figure 9).
3.3. Study Limitations
Our in-silico study focuses on intraprocedural contact mechanics and drug transfer, which, while vital, does not extend to predicting the chronic effects of different roughness profiles on drug retention or systemic distribution. The primary simplification involves the reduction of complex anatomical and physiological factors to a computational model, which omits the full spectrum of in vivo variability. Another study is needed to precisely adjust the microstructural elements of the drug coating based on its composition to achieve an optimal balance between micro-scale surface roughness and drug transfer efficiency. Such considerations motivate further exploration of novel drug payloads for integration into next-generation medical devices.
4. Conclusions
Our investigation demonstrates that the interplay of surface roughness, applied load, and contact area is crucial for DCB performance. By strategically incorporating an anticontractile compound like VAL at a half ratio into the existing urea-based DCB coating, we achieved a dual-purpose design. This modification, despite slightly altering roughness, allows for susbsequent evaluation of VAL within DCB payloads while effectively preservingthe inherent microstructure and contact mechanics of traditional urea-based coatings, thereby maintaining the primary function of PTX delivery/efficiency.
References
- Eid MA, Mehta K, Barnes JA, et al. The global burden of peripheral artery disease. Journal of Vascular Surgery, 1119. [CrossRef]
- https://fyra.io. The True Prevalence of PAD and the Economics of Major Amputation. Endovascular Today. Accessed , 2025. https://evtoday. 27 June 2021.
- Haase T, Speck U, Bienek S, et al. Drug-Coated Balloons: Drugs Beyond Paclitaxel? FBL. [CrossRef]
- Tepe G, Brodmann M, Micari A, et al. 5-Year Outcomes of Drug-Coated Balloons for Peripheral Artery In-Stent Restenosis, Long Lesions, and CTOs. JACC: Cardiovascular Interventions, 1065. [CrossRef]
- Li J, Lu W, Lin L, et al. Comparison of clinical outcomes of drug-coated balloons angioplasty vs. plain old balloons angioplasty for peripheral arterial disease: an umbrella meta-analysis. Front Cardiovasc Med, 1511. [CrossRef]
- Mechanisms of Tissue Uptake and Retention in Zotarolimus-Coated Balloon Therapy | Circulation. Accessed , 2023. https://www.ahajournals.org/doi/full/10.1161/CIRCULATIONAHA.113. 27 July 0020.
- Shibata T, Nohara S, Morikawa N, et al. Cardiovascular adverse events and prognosis in patients with haematologic malignancies and breast cancer receiving anticancer agents: Kurume-CREO Registry insights. Eur J Prev Cardiol, 1941. [CrossRef]
- Schahab N, Prengel AK, Mahn T, et al. Long-term clinical outcome and mortality risks after paclitaxel-coated balloon angioplasty in patients with peripheral artery disease: An observational clinical study. Health Science Reports. [CrossRef]
- Tzafriri AR, Muraj B, Garcia-Polite F, et al. Balloon-based drug coating delivery to the artery wall is dictated by coating micro-morphology and angioplasty pressure gradients. Biomaterials, 1203. [CrossRef]
- Chen Y, Yang Y, Wang H, et al. Finite Element Analysis of Fluid–Structure Interaction in a Model of an L-Type Mg Alloy Stent-Stenosed Coronary Artery System. Metals, 1176. [CrossRef]
- Zhu X, Umezu M, Iwasaki K. Finite element analysis of cutting balloon expansion in a calcified artery model of circular angle 180°: Effects of balloon-to-diameter ratio and number of blades facing calcification on potential calcification fracturing and perforation reduction. PLOS ONE, 0251. [CrossRef]
- Stratakos E, Antonini L, Poletti G, et al. Investigating Balloon-Vessel Contact Pressure Patterns in Angioplasty: In Silico Insights for Drug-Coated Balloons. Ann Biomed Eng, 2908. [CrossRef]
- Chang GH, Azar DA, Lyle C, Chitalia VC, Shazly T, Kolachalama VB. Intrinsic coating morphology modulates acute drug transfer in drug-coated balloon therapy. Sci Rep, 6839. [CrossRef]
- Shazly T, Eberth JF, Kostelnik CJ, et al. Hydrophilic Coating Microstructure Mediates Acute Drug Transfer in Drug-Coated Balloon Therapy. ACS Appl Bio Mater, 25 April 2024. [CrossRef]
- Chang GH, Azar DA, Lyle C, Chitalia VC, Shazly T, Kolachalama VB. Intrinsic coating morphology modulates acute drug transfer in drug-coated balloon therapy. Sci Rep, 6839. [CrossRef]
- Azar D, Lott JT, Jabbarzadeh E, Shazly T, Kolachalama VB. Surface Modification Using Ultraviolet-Ozone Treatment Enhances Acute Drug Transfer in Drug-Coated Balloon Therapy. Langmuir, 4645. [CrossRef]
- Cao Z, Li J, Fang Z, Feierkaiti Y, Zheng X, Jiang X. The factors influencing the efficiency of drug-coated balloons. Front Cardiovasc Med, 9477. [CrossRef]
- Shazly T, Torres WM, Secemsky EA, Chitalia VC, Jaffer FA, Kolachalama VB. Understudied factors in drug-coated balloon design and evaluation: A biophysical perspective. Bioengineering & Translational Medicine, 1037. [CrossRef]
- Colombo M, Corti A, Berceli S, Migliavacca F, McGinty S, Chiastra C. 3D modelling of drug-coated balloons for the treatment of calcified superficial femoral arteries. PLOS ONE, 0256. [CrossRef]
- BaniHani D, Eberth JF, Spinale FG, et al. Towards the Integration of an Anti-Contractile Compound Within Drug-Coated Balloon Therapy. Cardiovasc Eng Tech, 25 July 2025. [CrossRef]
- Kaule S, Minrath I, Stein F, et al. Correlating Coating Characteristics with the Performance of Drug-Coated Balloons – A Comparative In Vitro Investigation of Own Established Hydrogel- and Ionic Liquid-Based Coating Matrices. PLOS ONE, 0116. [CrossRef]
- Li T, Zhang Z, Wang W, et al. Simulation and Experimental Investigation of Balloon Folding and Inserting Performance for Angioplasty: A Comparison of Two Materials, Polyamide-12 and Pebax. Journal of Functional Biomaterials. [CrossRef]
- Rogers C, Tseng DY, Squire JC, Edelman ER. Balloon-Artery Interactions During Stent Placement. Circulation Research. [CrossRef]
- Capelli C, Nordmeyer J, Schievano S, et al. How do angioplasty balloons work: a computational study on balloon expansion forces. Accessed , 2025. https://eurointervention.pcronline. 1 July.
- Turner EA, Atigh MK, Erwin MM, Christians U, Yazdani SK. Coating and Pharmacokinetic Evaluation of Air Spray Coated Drug Coated Balloons. Cardiovasc Eng Technol. [CrossRef]
- Kontin S, Höfler A, Koch R. Heat and Mass Transfer accompanied by Crystallisation of single Particles containing Urea-water-solution. Published online 2010.
- Excipient microstructure modulates acute transfer of balloon coating.... | Download Scientific Diagram. Accessed , 2025. https://www.researchgate. 1 July 3328.
- Koza Z, Matyka M, Khalili A. Finite-size anisotropy in statistically uniform porous media. Phys Rev E, 0663. [CrossRef]
- Ionita M, Iovu H. Mechanical properties, urea diffusion, and cell cultural response of poly(vinyl alcohol)–Chitosan bioartificial membranes via molecular modelling and experimental investigation. Composites Part B: Engineering, 2464. [CrossRef]
- Bu H, Yu S, Dong W, Wang Y, Zhang L, Xia Y. Calibration and Testing of Discrete Element Simulation Parameters for Urea Particles. Processes. [CrossRef]
- 57-13-6 CAS MSDS (Urea) Melting Point Boiling Point Density CAS Chemical Properties. Accessed , 2025. https://www.chemicalbook.com/ChemicalProductProperty_US_CB5853861. 1 July.
- Wang GJ, Layne AJ, Mohler ER, Davis JT, Sonnad SS, Fairman RM. A Cross-Sectional Analysis of Femoral Artery Intima-Media Thickness. Journal for Vascular Ultrasound. [CrossRef]
- Tzafriri AR, Parikh SA, Edelman ER. Taking paclitaxel coated balloons to a higher level: Predicting coating dissolution kinetics, tissue retention and dosing dynamics. Journal of Controlled Release. [CrossRef]
- Prendergast PJ, Lally C, Daly S, et al. Analysis of Prolapse in Cardiovascular Stents: A Constitutive Equation for Vascular Tissue and Finite-Element Modelling. Journal of Biomechanical Engineering. [CrossRef]
- Tzafriri AR, Groothuis A, Price GS, Edelman ER. Stent elution rate determines drug deposition and receptor-mediated effects. Journal of Controlled Release. [CrossRef]
- Camasão DB, Mantovani D. The mechanical characterization of blood vessels and their substitutes in the continuous quest for physiological-relevant performances. A critical review. Materials Today Bio, 1001. [CrossRef]
- Structural Contact Modeling Guidelines. COMSOL. Accessed , 2025. https://www.comsol. 1 July 8383.
- McGinty, S. A decade of modelling drug release from arterial stents. Mathematical Biosciences. [CrossRef]
- McKittrick CM, McKee S, Kennedy S, et al. Combining mathematical modelling with in vitro experiments to predict in vivo drug-eluting stent performance. J Control Release. [CrossRef]
- A.r M, M. A.r M, M.r B, S.b K, B.v P, S.s R. Transdermal Permeation Enhancement of Valsartan Using Solid Lipid Nanoparticles. Research Journal of Pharmacy and Technology, 1297. [Google Scholar]
- Saydam M, Takka S. BIOAVAILABILITY FILE: VALSARTAN. Published online 2007.
- Yang H, Gao R, Ji X, Wang Z, Qiu W. Population Pharmacokinetic Analysis of Valsartan in Healthy Chinese Subjects. Clinical Pharmacology in Drug Development. [CrossRef]
- Vickers NA, Andersson SB. Monte Carlo Simulation of Brownian Motion using a Piezo-Actuated Microscope Stage. Proc Am Control Conf, 2019. [CrossRef]
- Timmins LH, Miller MW, Clubb FJ, Moore JE. Increased artery wall stress post-stenting leads to greater intimal thickening. Lab Invest. [CrossRef]
Figure 2.
2D Axisymmetric model of balloon-coating- artery contact. (A) Contact Model of 100x100 μm2 with four different coating surface roughness. (B) Balloon- coating triangular mesh and Artery uniform rectangular mesh (C) Geometry of a finite element mesh with a detailed view.
Figure 2.
2D Axisymmetric model of balloon-coating- artery contact. (A) Contact Model of 100x100 μm2 with four different coating surface roughness. (B) Balloon- coating triangular mesh and Artery uniform rectangular mesh (C) Geometry of a finite element mesh with a detailed view.
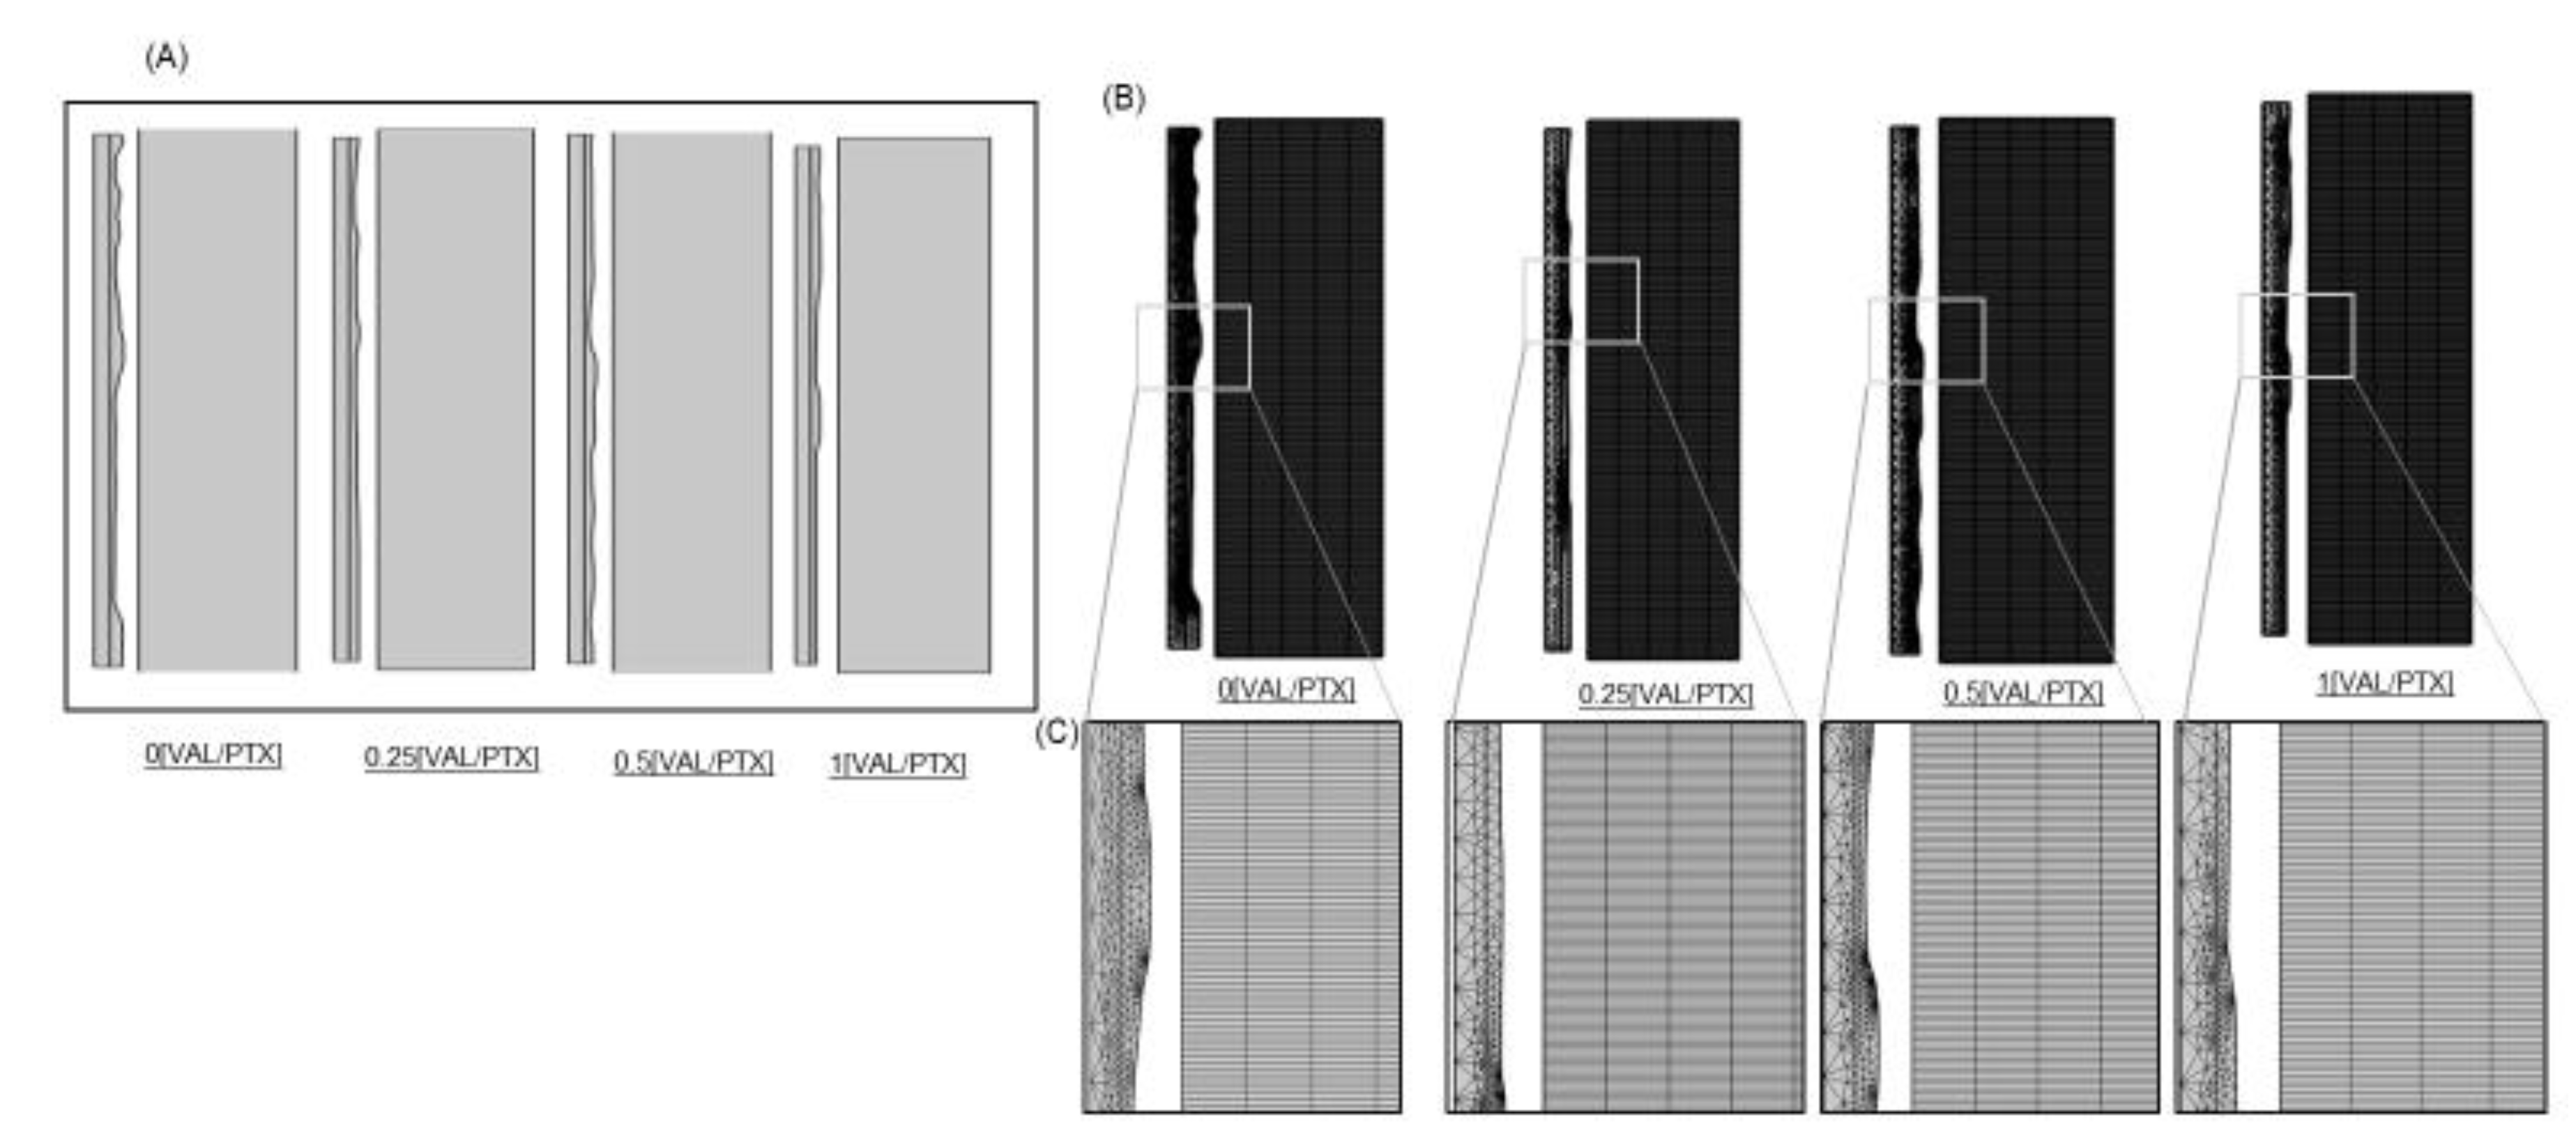
Figure 3.
Balloon deployment Simulation. (A) Balloon inflation-deflation at different deployment times. (B) 2-D revolution of the Axisymmetric model.
Figure 3.
Balloon deployment Simulation. (A) Balloon inflation-deflation at different deployment times. (B) 2-D revolution of the Axisymmetric model.
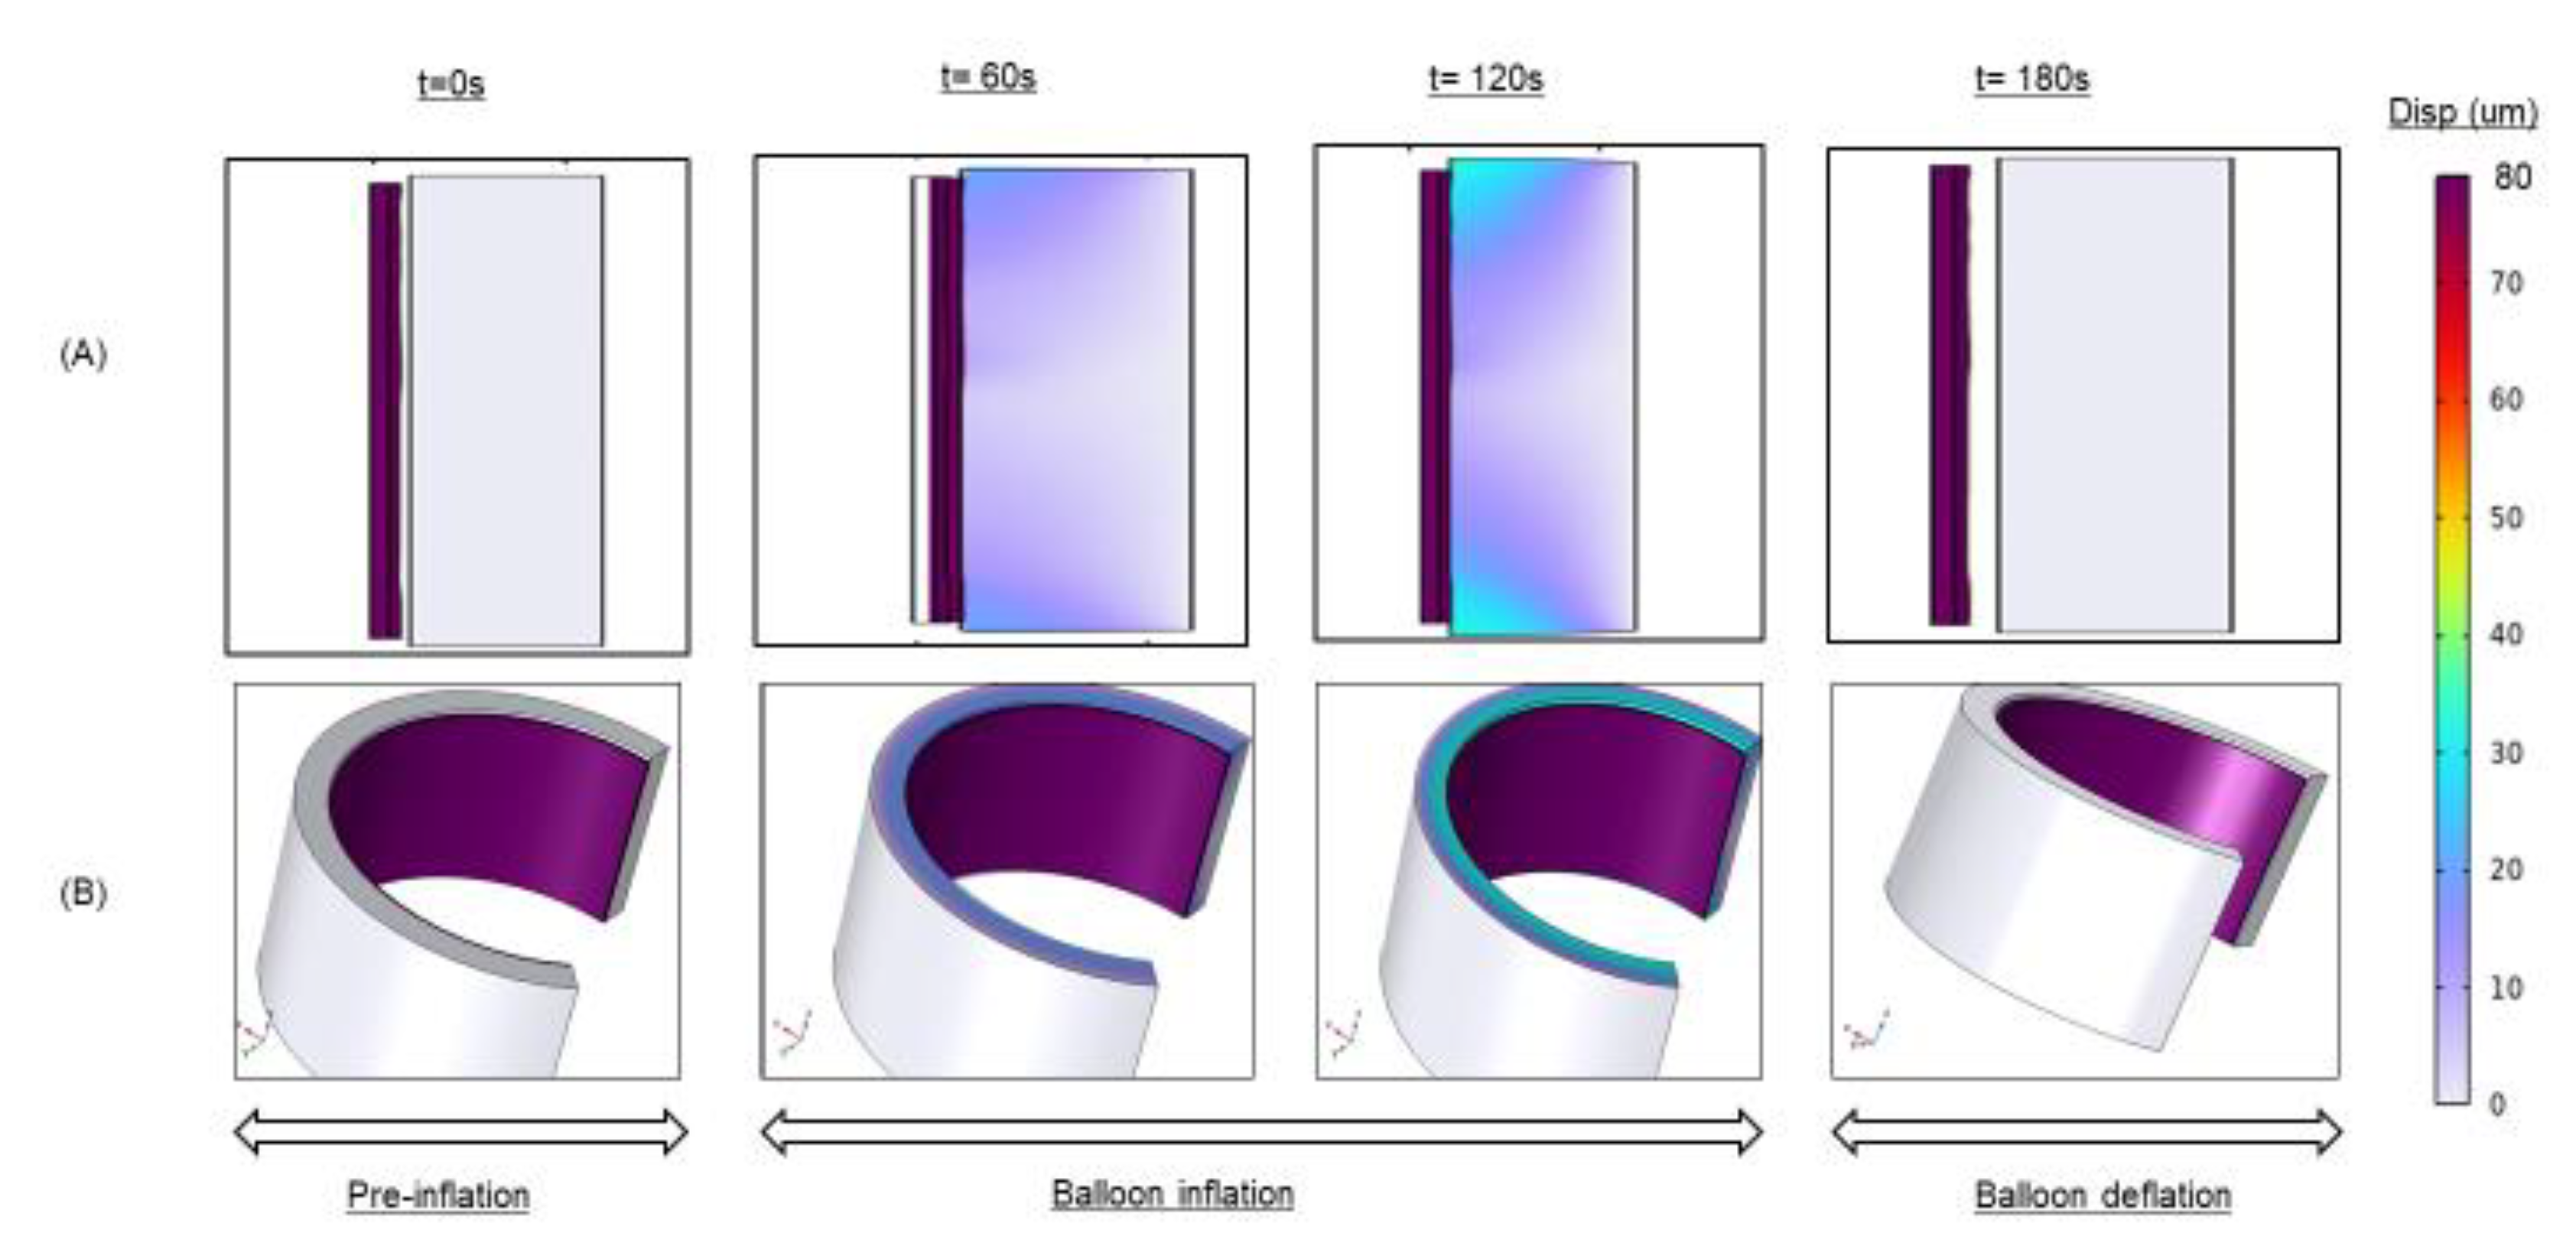
Figure 4.
True surface area evaluation. (B) 3D coating geometry surface area for 100x100um2, idealized geometry surface area * indicates p<0.05 vs. [VAL/PTX] = 0. N= 4/group; error bars represent +SEM.
Figure 4.
True surface area evaluation. (B) 3D coating geometry surface area for 100x100um2, idealized geometry surface area * indicates p<0.05 vs. [VAL/PTX] = 0. N= 4/group; error bars represent +SEM.
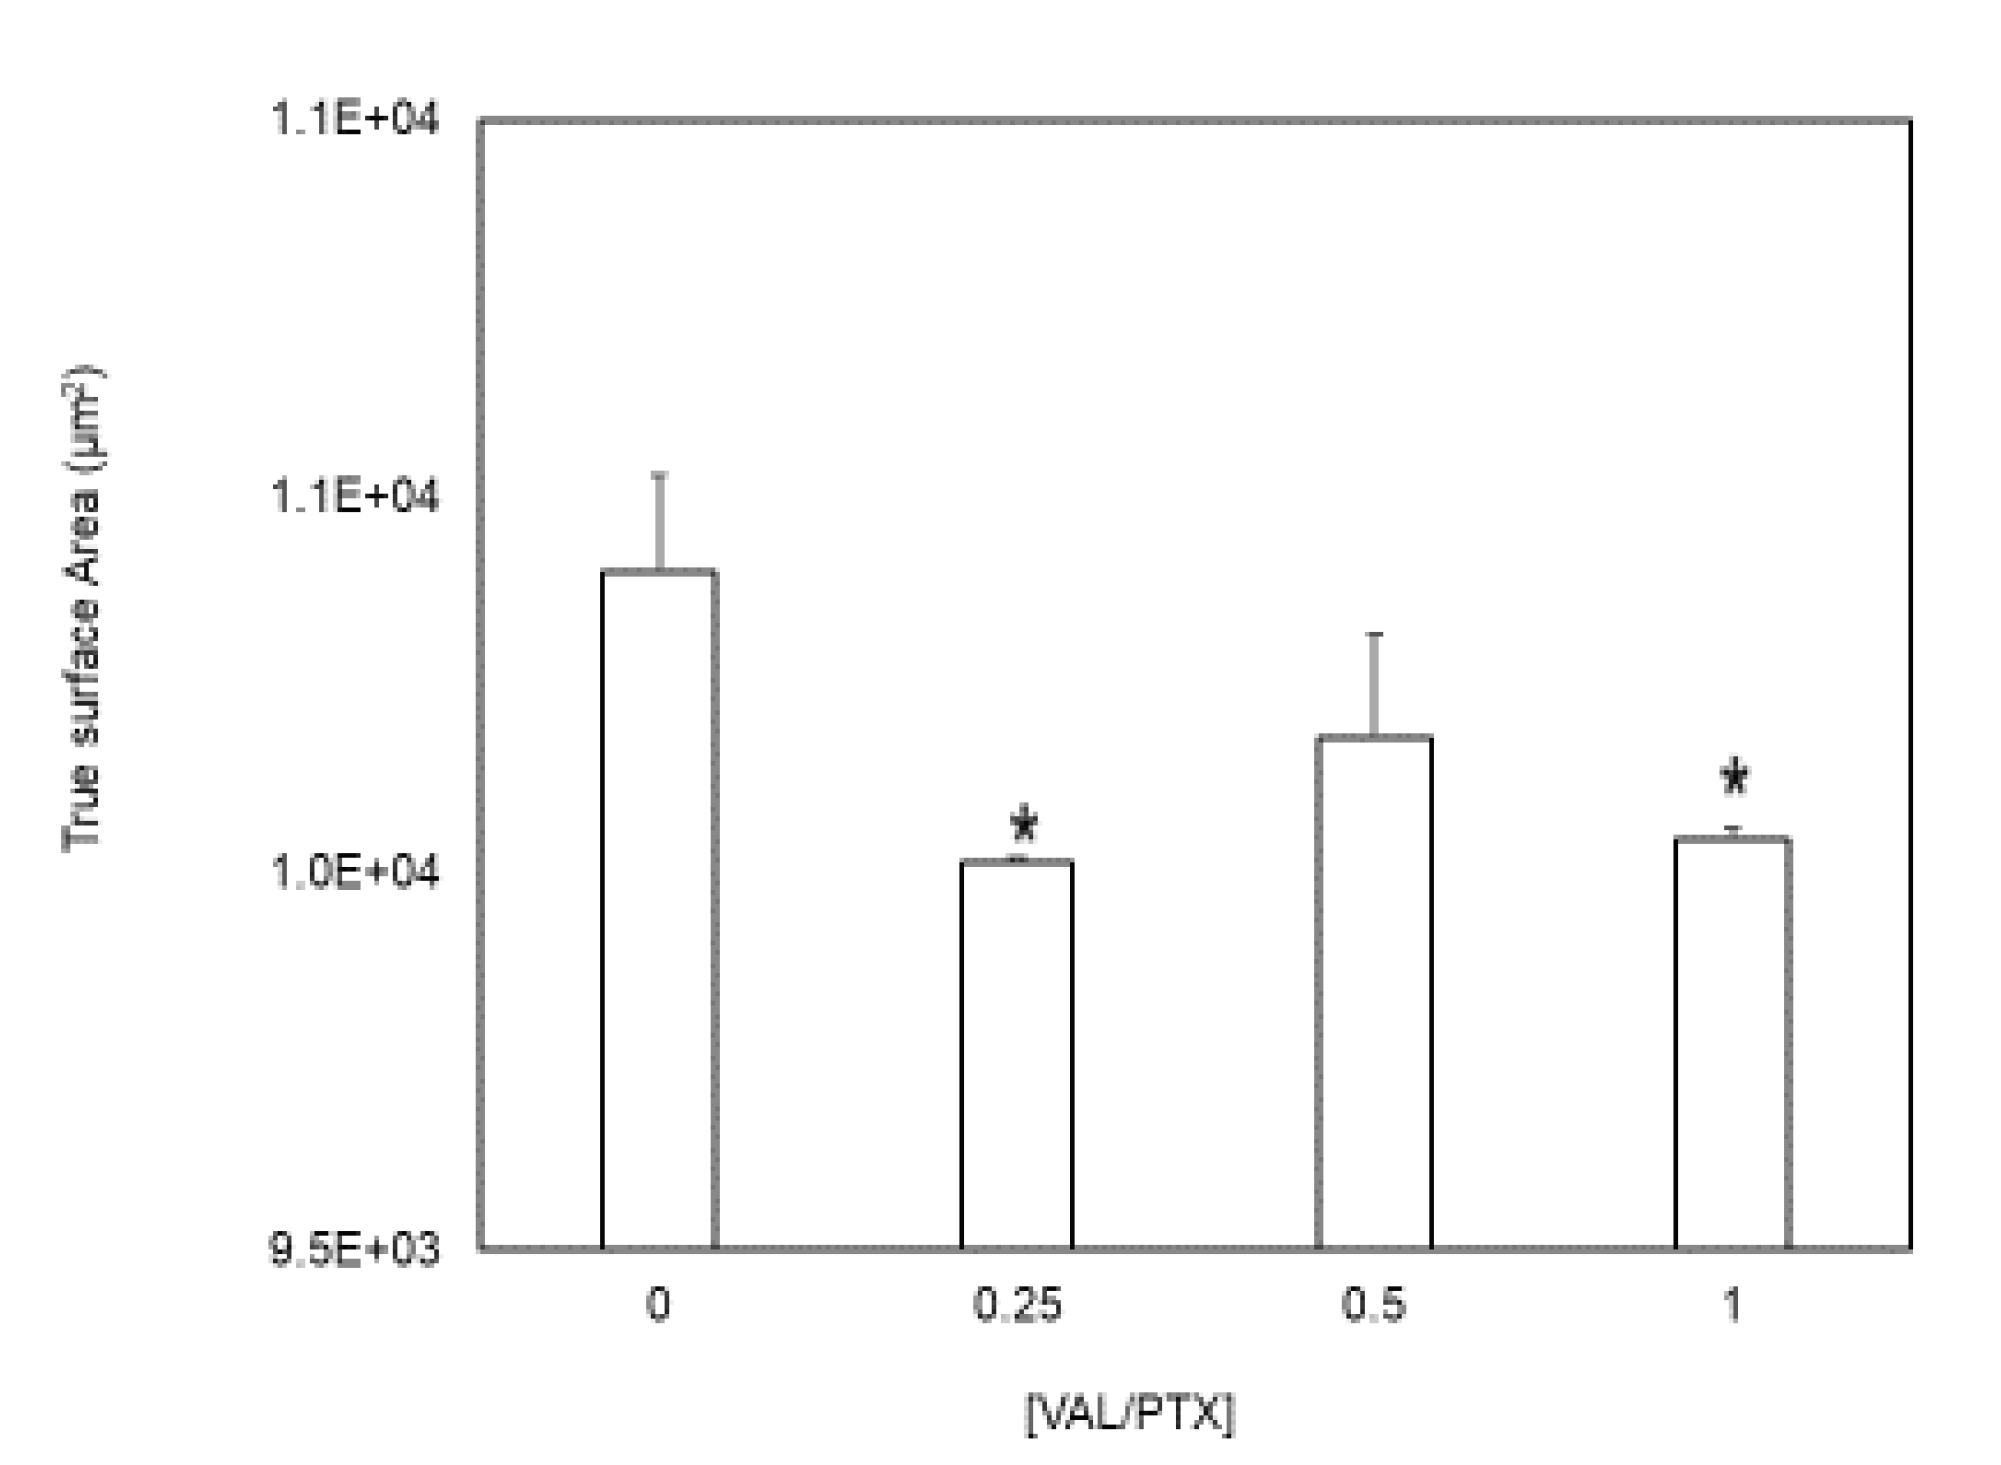
Figure 5.
Changes in the measurement of the coating-artery contact area (um2) during balloon deployment. (A) The highest rough coating 0[VAL/PTX] exhibited a distinct high contact area under all load variations. (B)The relatively smooth coatings (0.25,1 [VAL/PTX]) have a higher contact area under low load. (C) An increase in the applied load increases the contact area in all coating variants. (D) Under higher load, the rough coatings (0,0.5 [VAL/PTX] exhibited higher contact area. (E) Relation between balloon-coating layer displacement and the peak contact area attained.
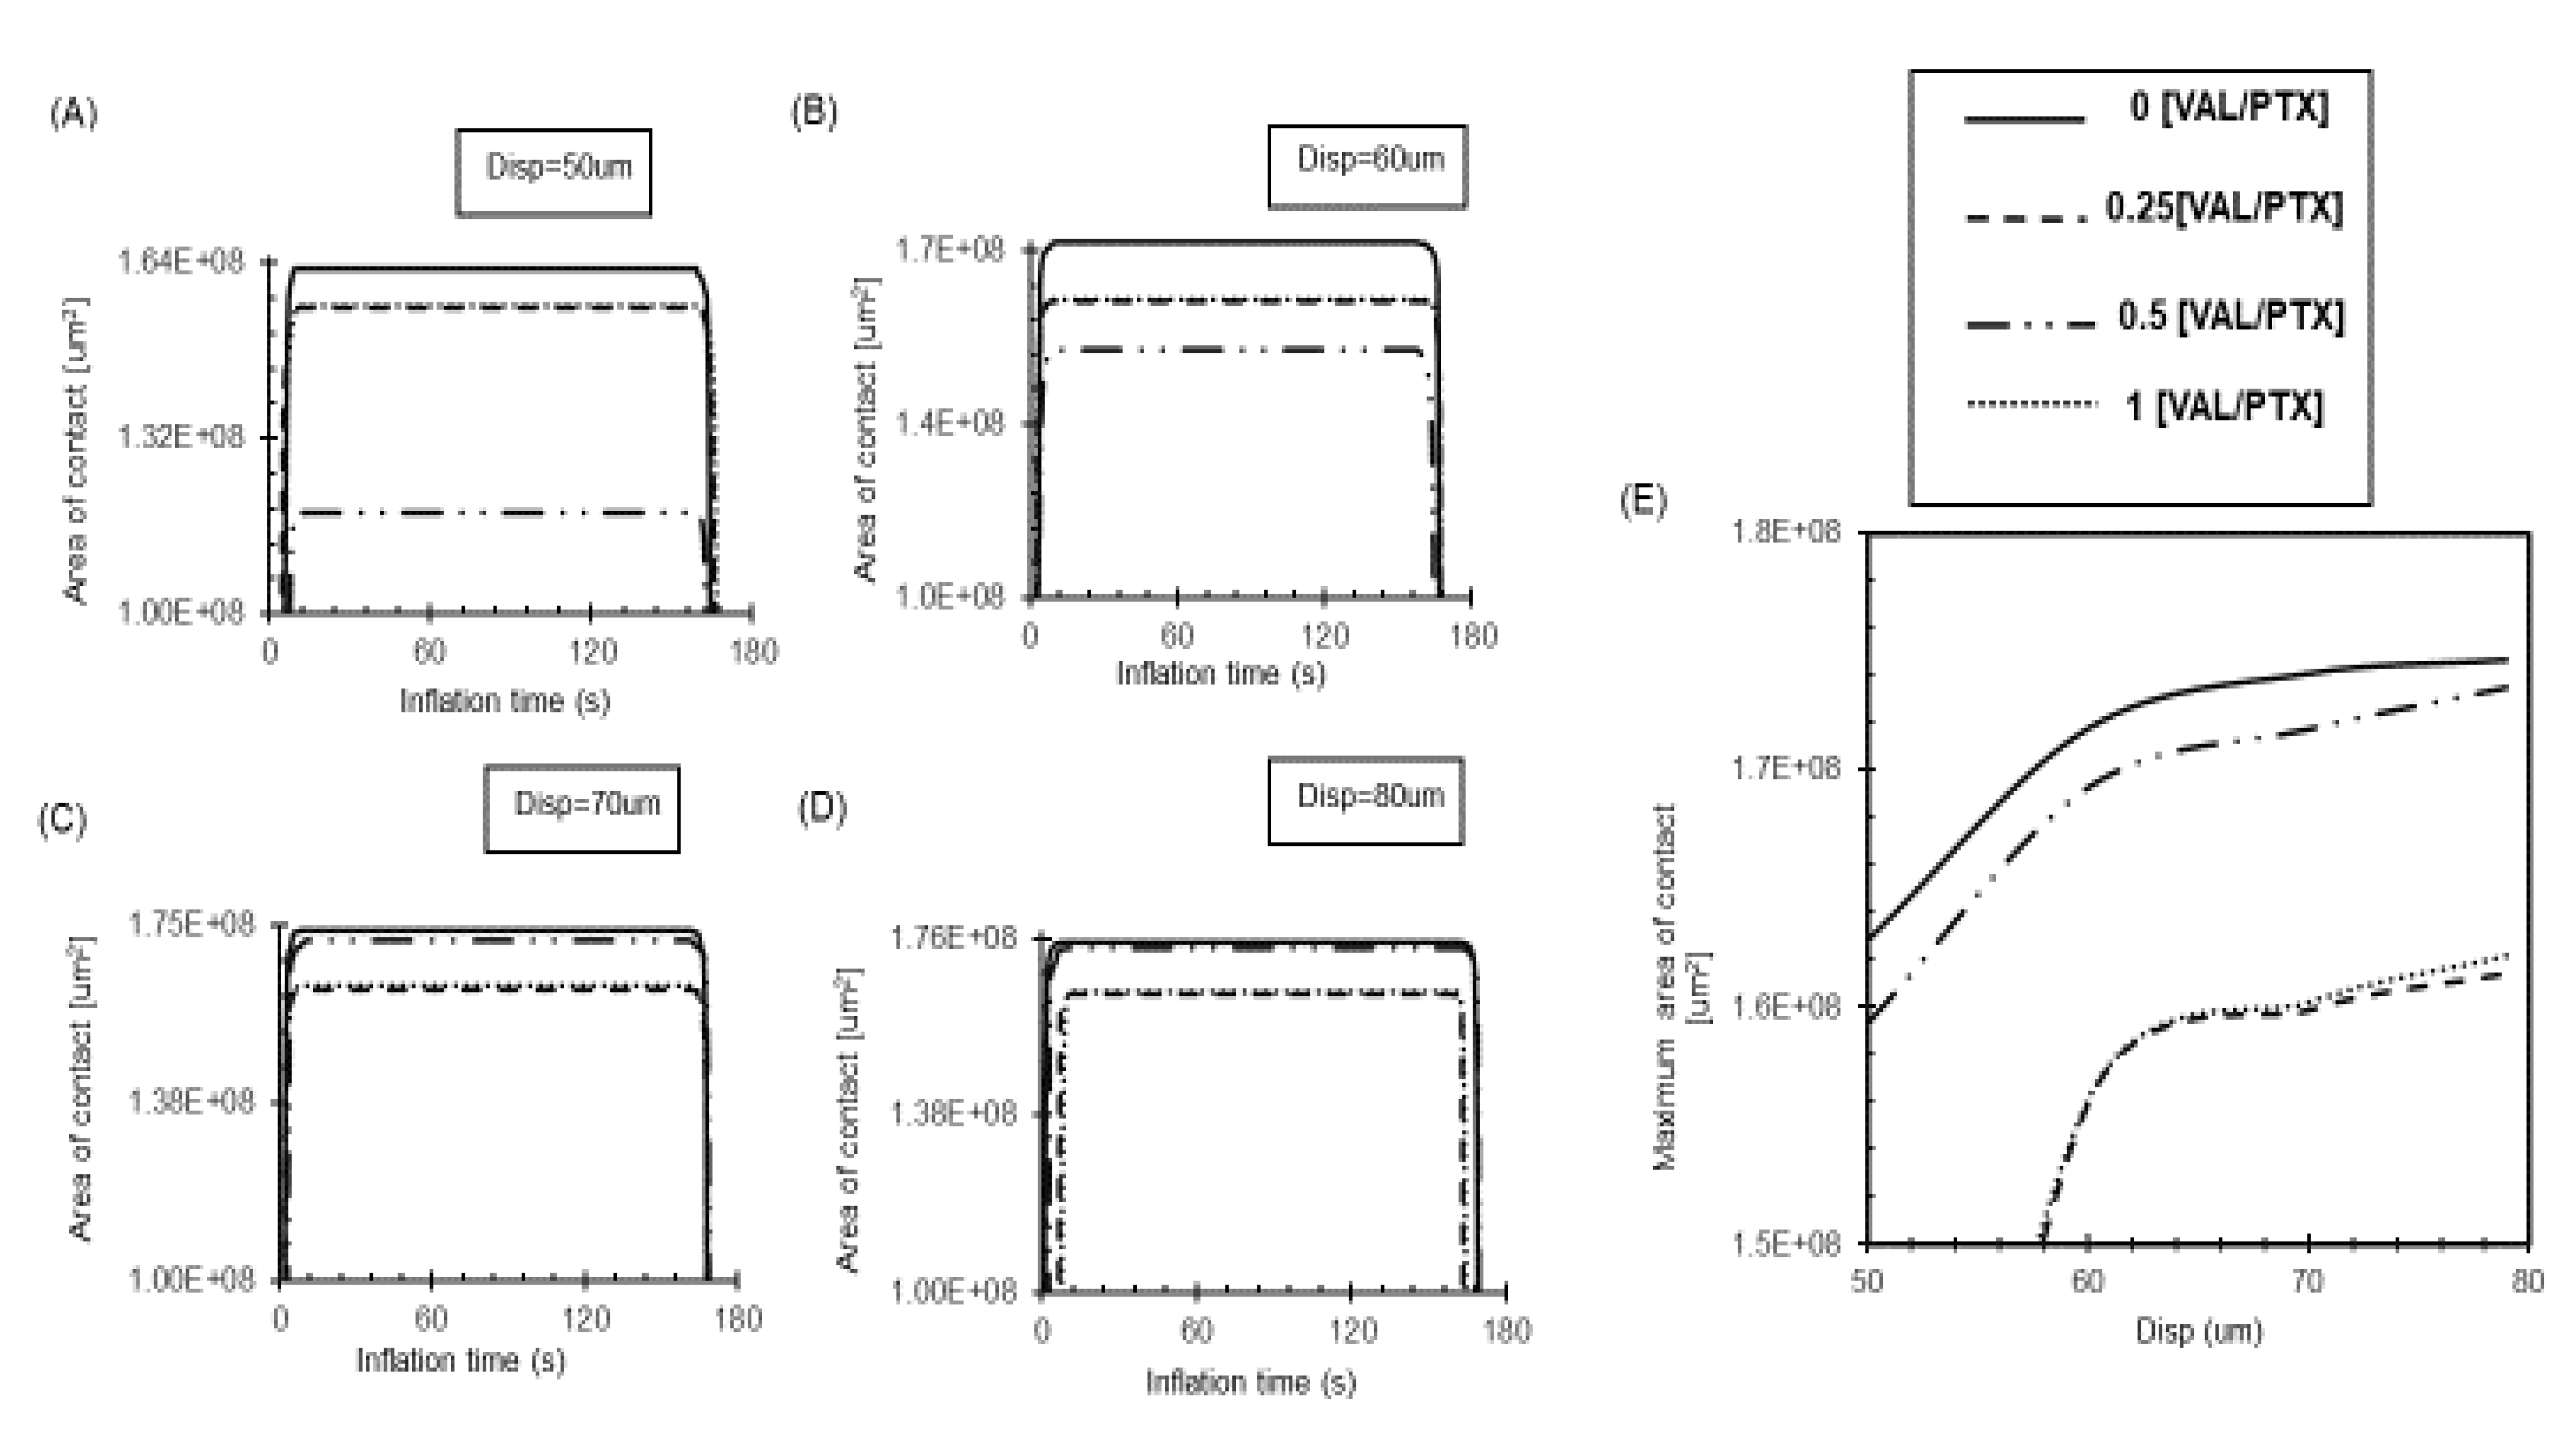
Figure 6.
The effect of applied load on the number of peaks engaged in contact. (A) Under low load, the coating peaks deform the artery, with not all microstructural peaks engaging in the contact. (B) Under high load, more microstructural peaks become engaged in the contact, consequently increasing the effective contact area.
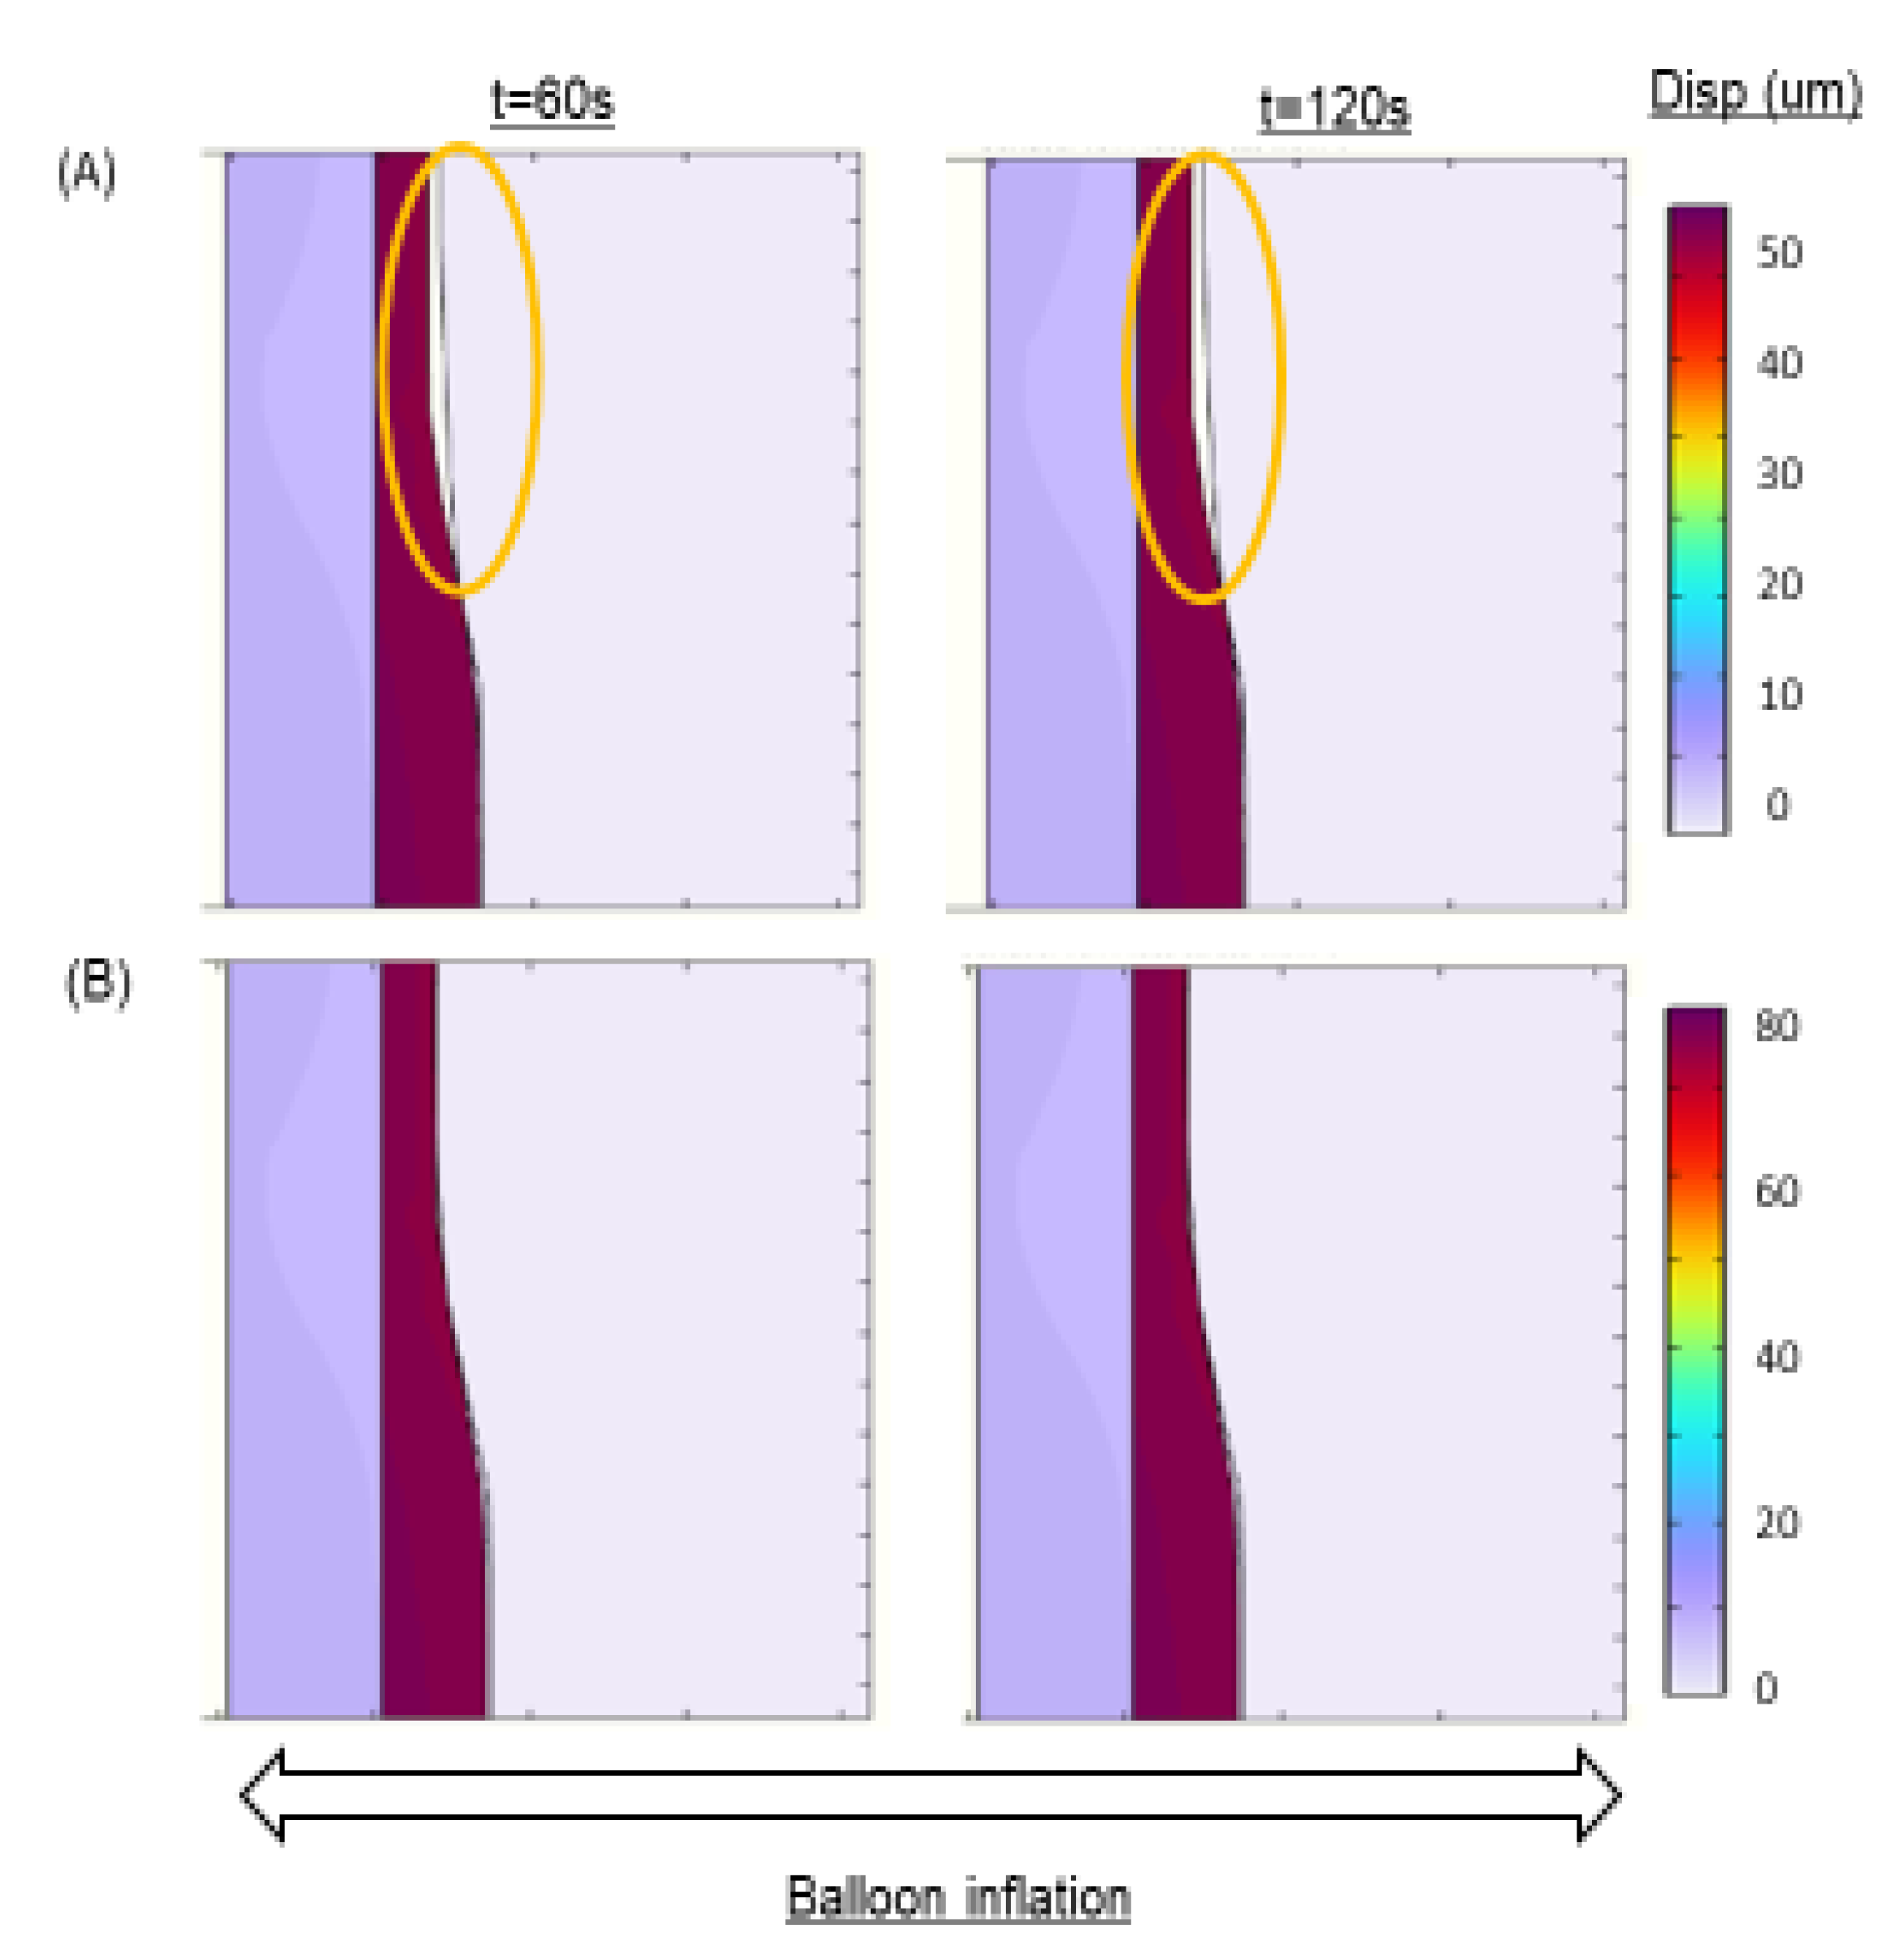
Figure 7.
Changes in average stress on the artery wall during balloon deployment under varying applied loads. (A, B) Higher roughness coatings (0, 0.5 [VAL/PTX]) resulted in elevated stress on the artery wall. (C) Under moderate applied loads, the stress exerted by the coating layer on the wall was similar across different coatings. (D) Under high load, the increased contact area led to a reduced amount of stress on the artery wall for the rough coating.
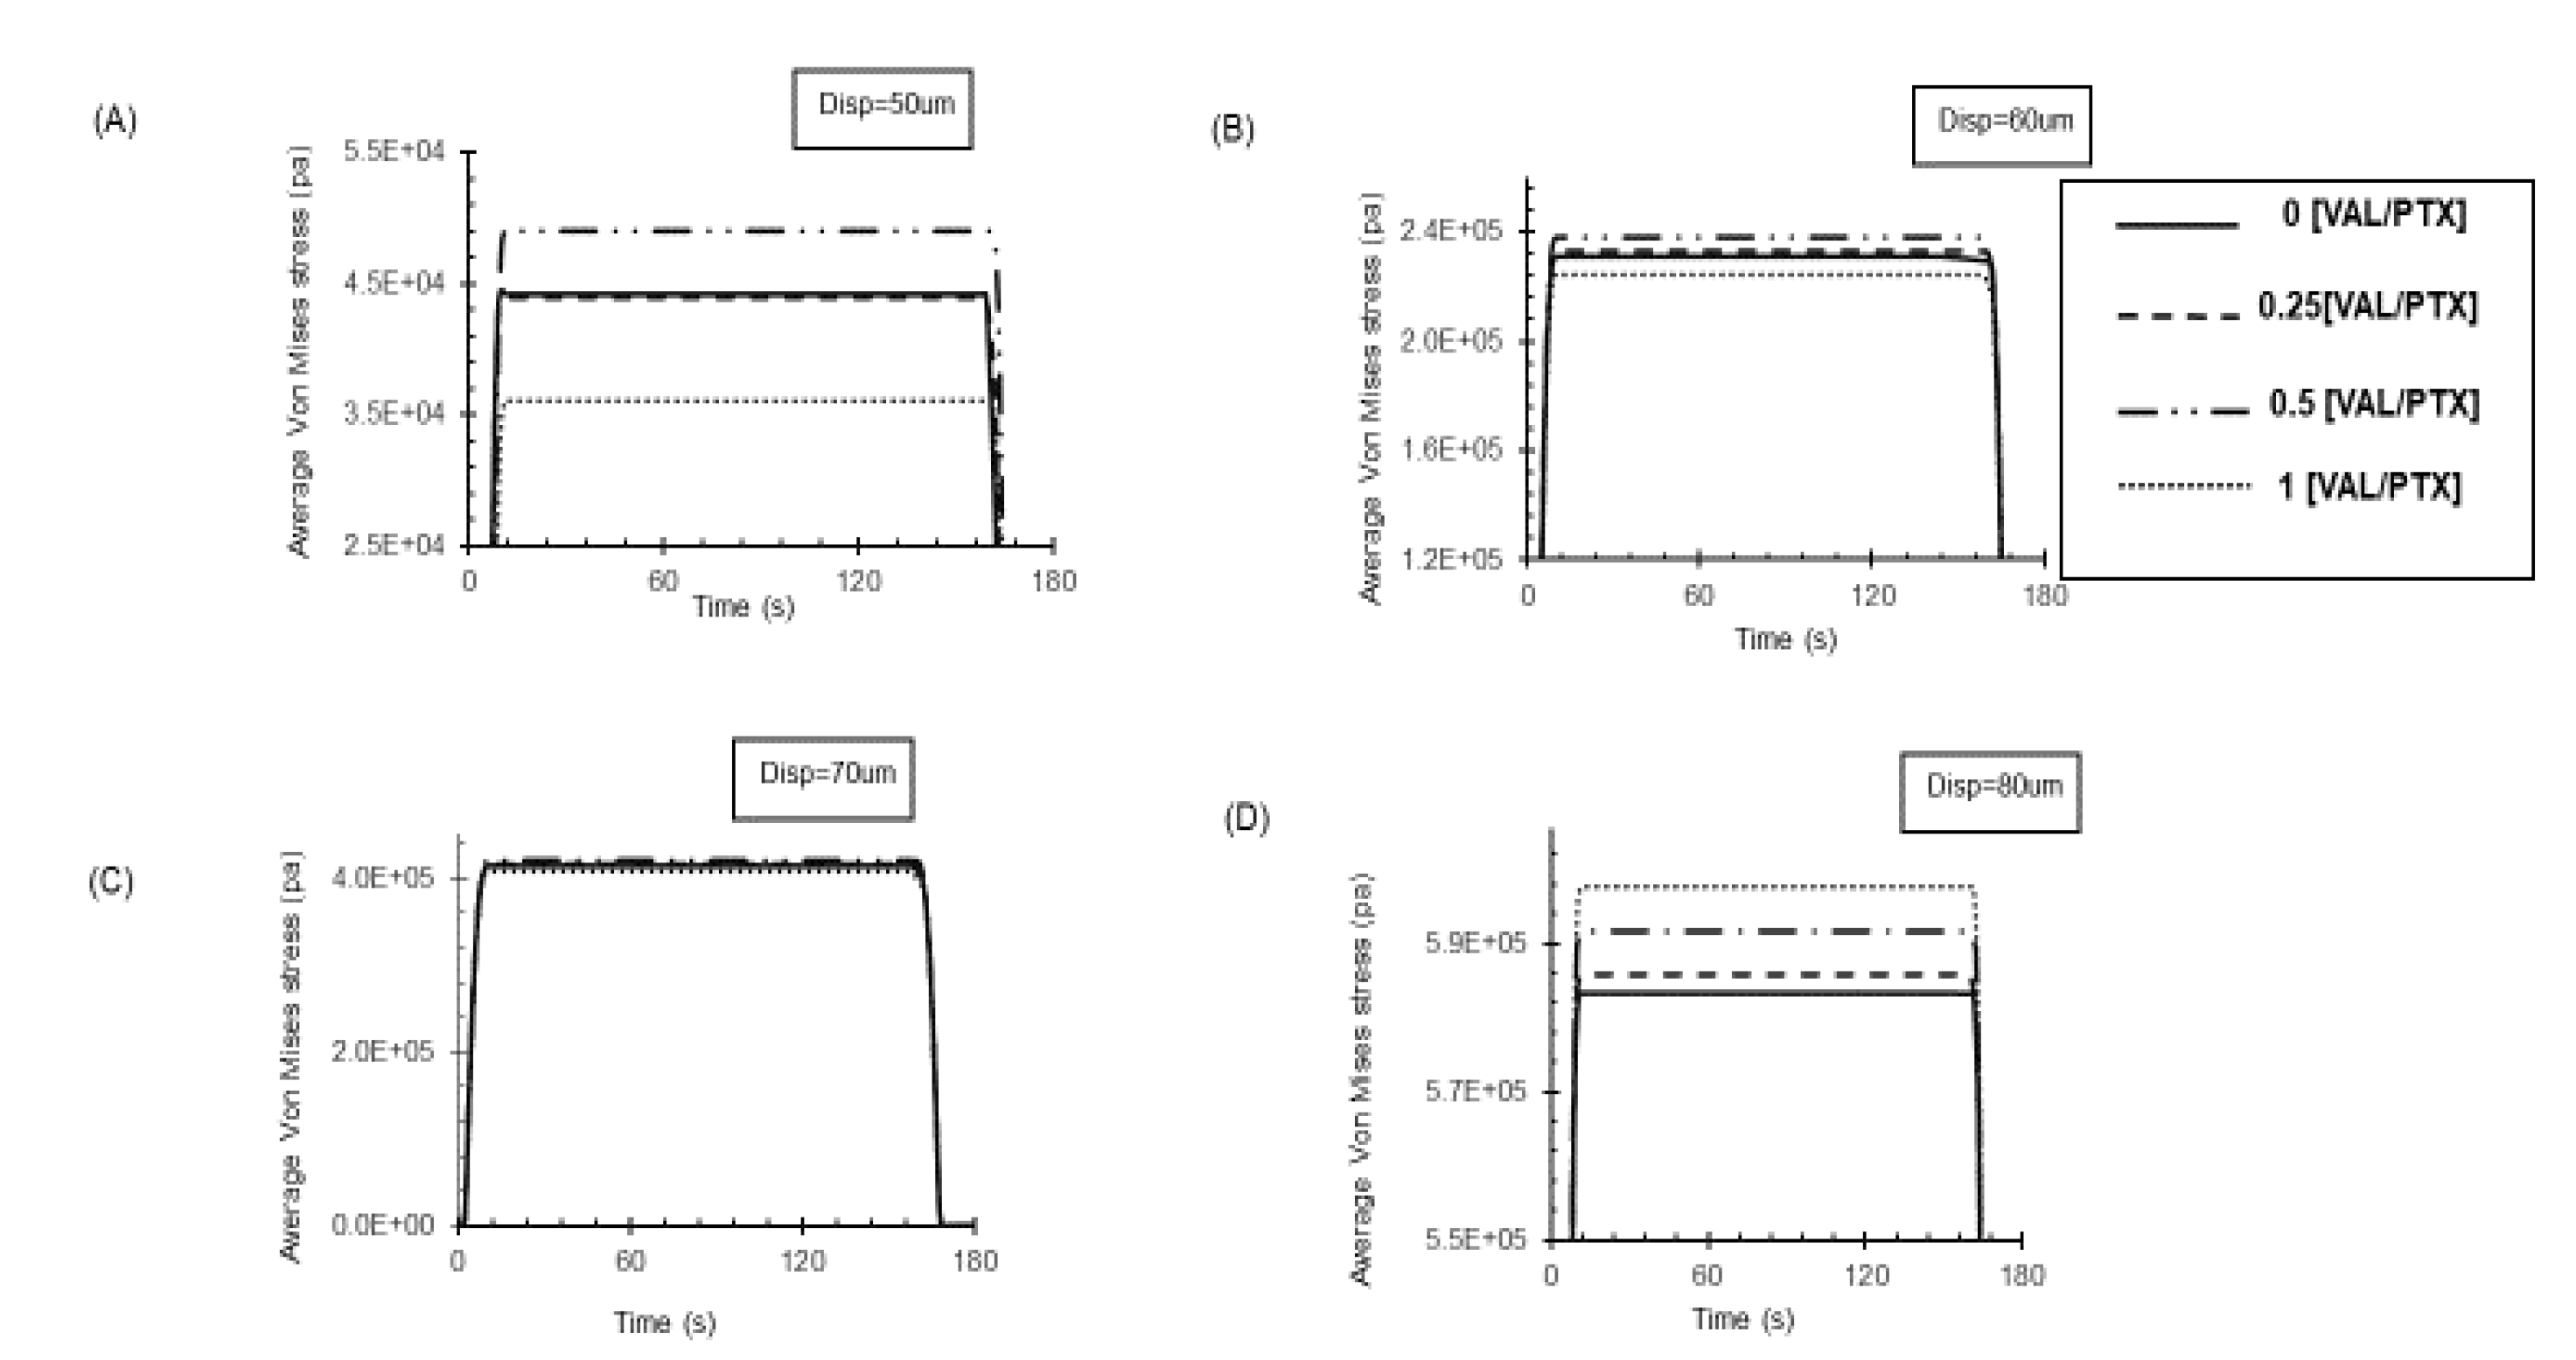
Figure 8.
Delivery rate of PTX to the arterial wall during 180s inflation. (A) The relatively smooth coatings (0.25,1 [VAL/PTX]) achieve more PTX transfer under low load, while they reach the steady state slower than relatively rough ones. (B) Further load increases lead to higher drug transfer in all rough coatings. (C) Increased load enhances PTX transfer in relatively rough coatings [0VAL/PTX],0.5[VAL/PTX]. (D) Subsequent load increases raise drug transfer, with faster steady-state attainment in relatively rough coatings 0,0.5[VAL/PTX].
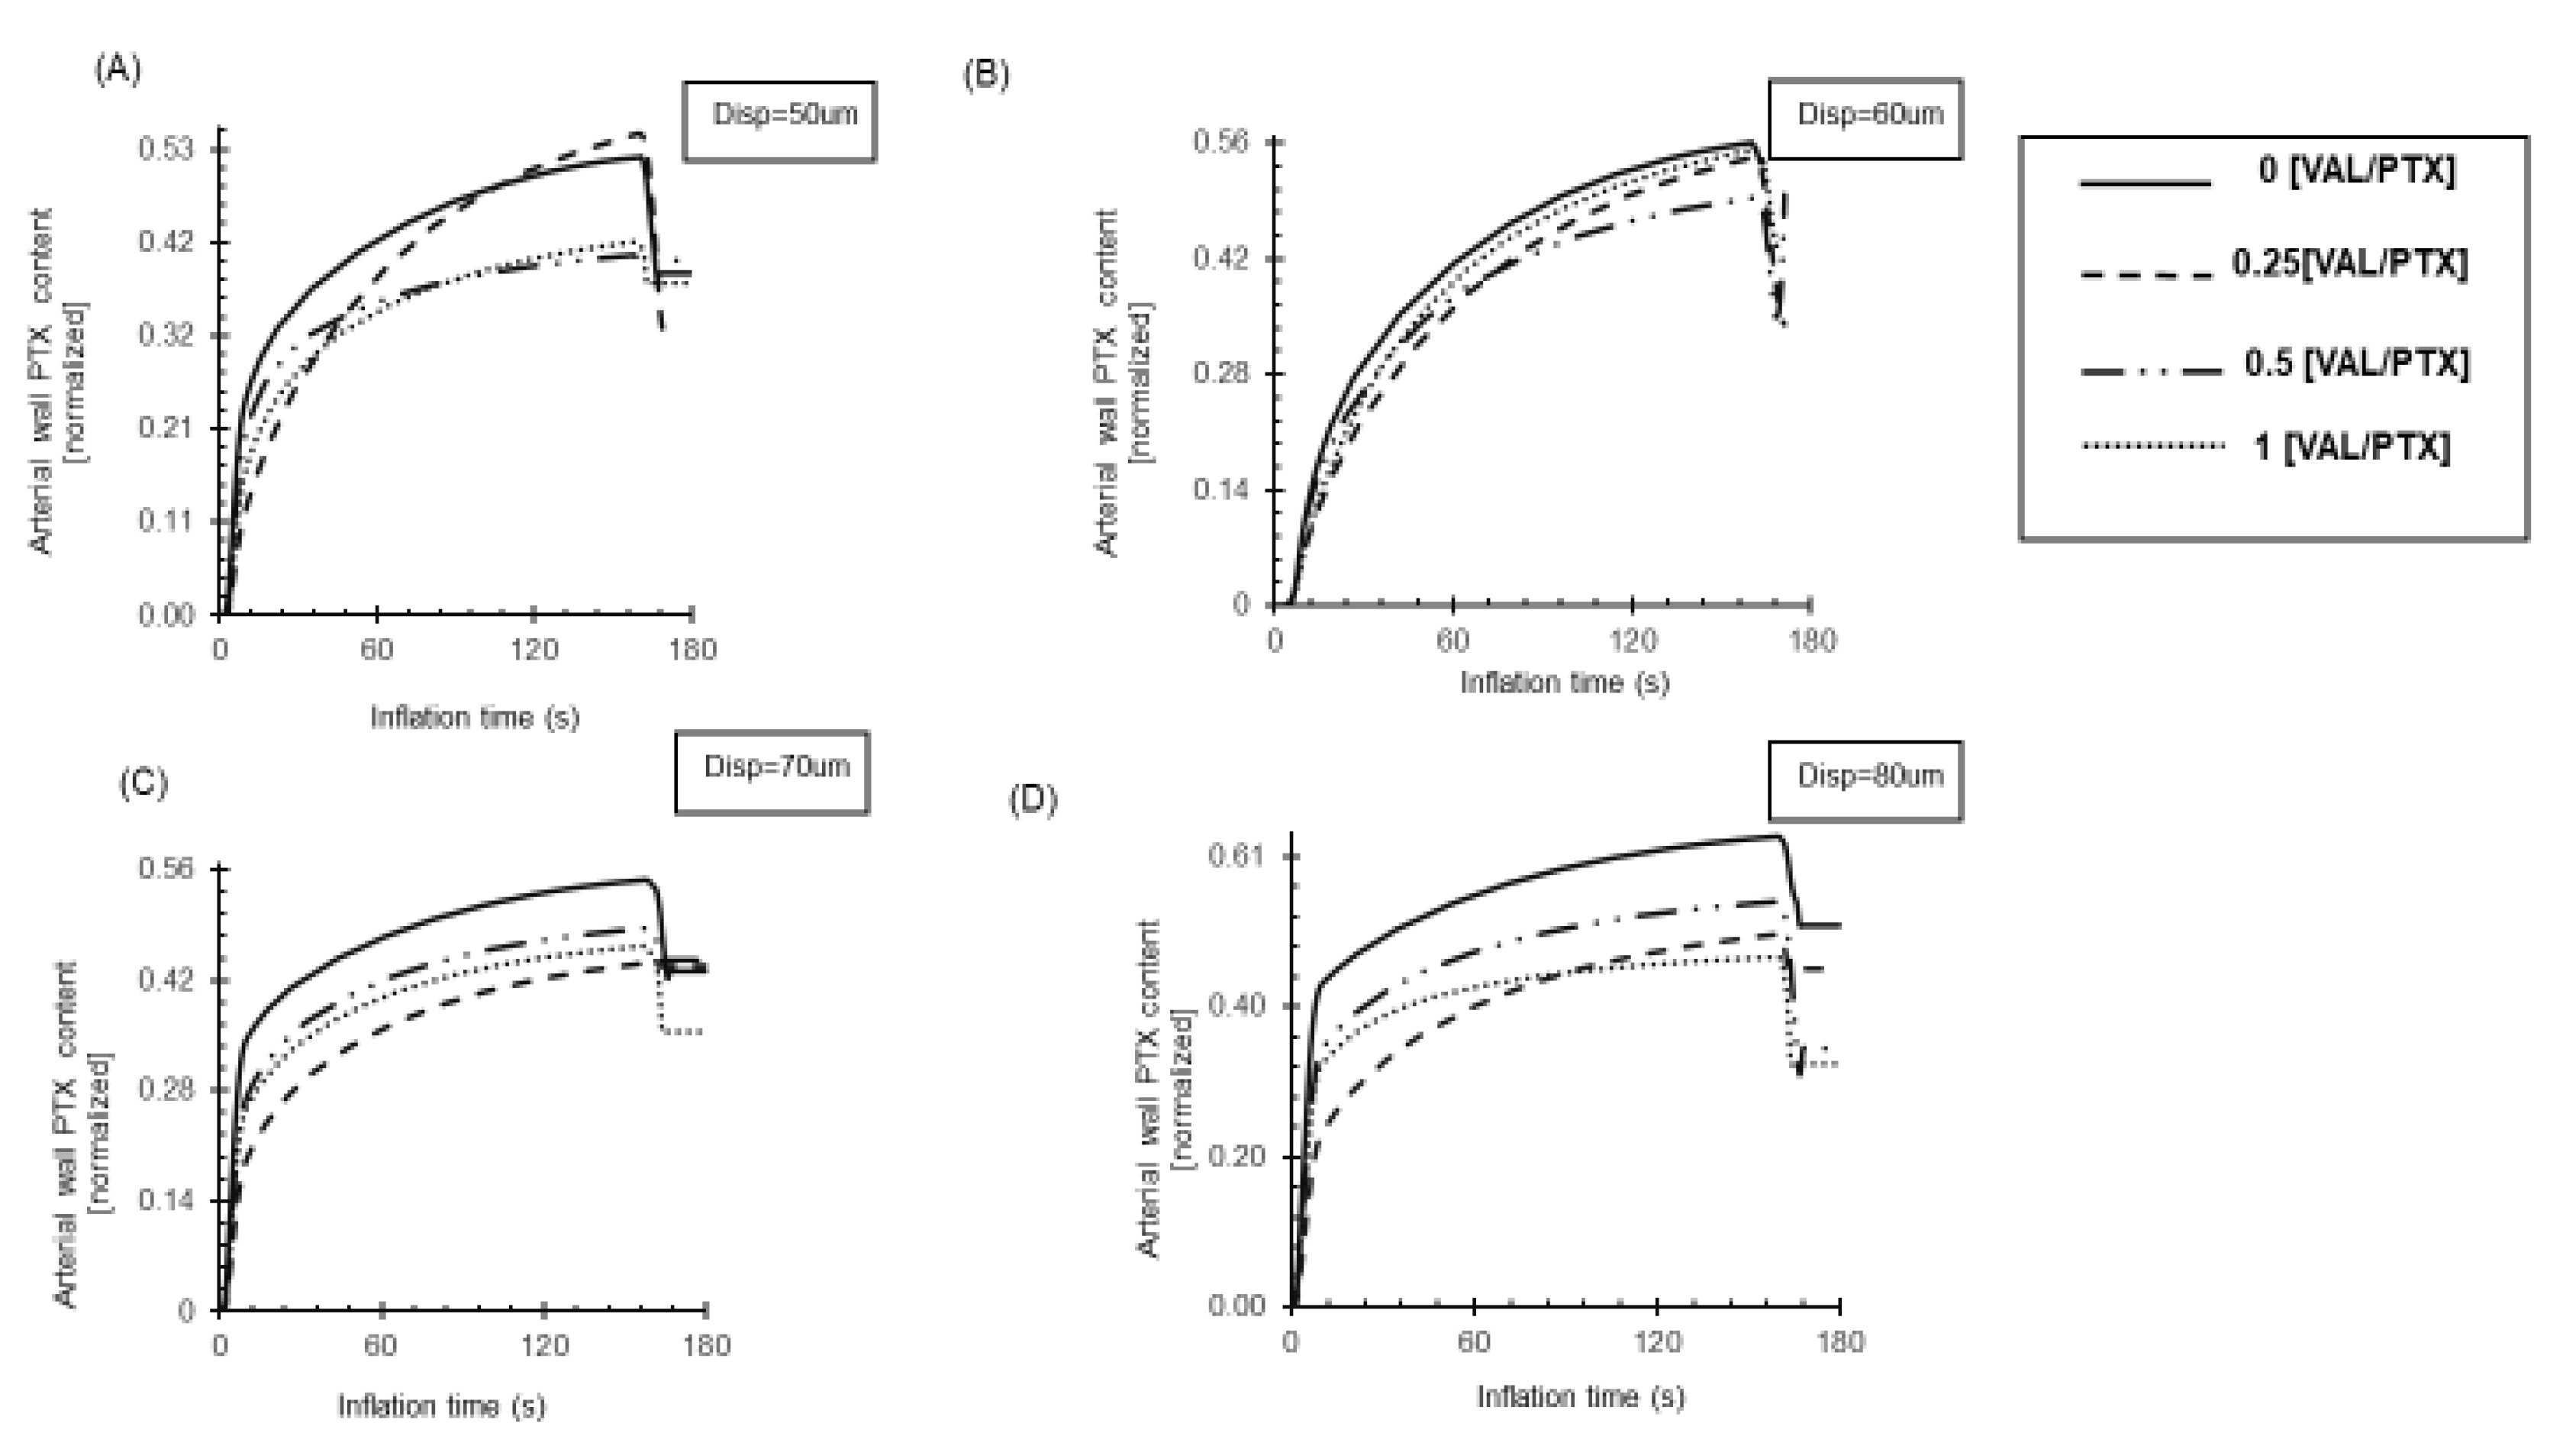
Figure 9.
VAL delivery to the arterial wall during a 180s inflation. (A) Smoother coatings (0.25,1 [VAL/PTX]) achieve greater VAL transfer under low load. (B) Increased loads result in higher drug transfer across all rough coatings. (C),(D) VAL transfer is less affected or related to surface roughness changes.

Table 1.
Arterial wall transport of paclitaxel. Human femoral artery parameters and Hyperelastic constants to describe the vascular wall nonlinear elastic behavior. The parameters describe a 5-parameter Mooney-Rivlin model.
Table 1.
Arterial wall transport of paclitaxel. Human femoral artery parameters and Hyperelastic constants to describe the vascular wall nonlinear elastic behavior. The parameters describe a 5-parameter Mooney-Rivlin model.
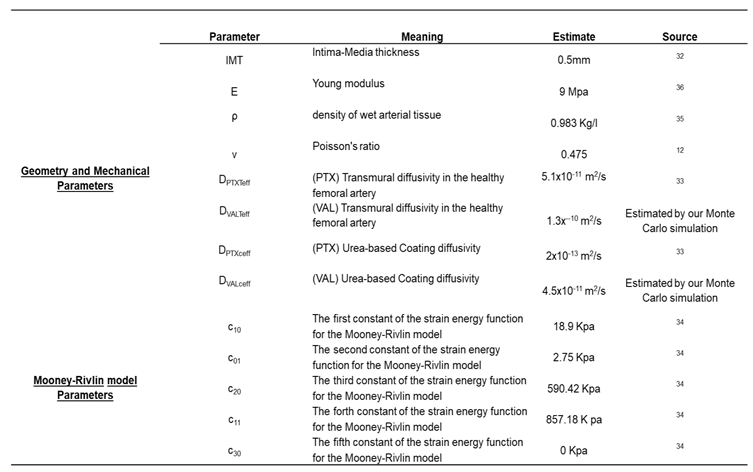 |
Table 2.
Constants and equations used to simulate the diffusivity of valsartan in the human femoral artery and coating by Monte Carlo simulation.
Table 2.
Constants and equations used to simulate the diffusivity of valsartan in the human femoral artery and coating by Monte Carlo simulation.
 |
Disclaimer/Publisher’s Note: The statements, opinions and data contained in all publications are solely those of the individual author(s) and contributor(s) and not of MDPI and/or the editor(s). MDPI and/or the editor(s) disclaim responsibility for any injury to people or property resulting from any ideas, methods, instructions or products referred to in the content. |
© 2025 by the authors. Licensee MDPI, Basel, Switzerland. This article is an open access article distributed under the terms and conditions of the Creative Commons Attribution (CC BY) license (http://creativecommons.org/licenses/by/4.0/).
Copyright: This open access article is published under a Creative Commons CC BY 4.0 license, which permit the free download, distribution, and reuse, provided that the author and preprint are cited in any reuse.


