Submitted:
10 October 2025
Posted:
10 October 2025
You are already at the latest version
Abstract
Even young, asymptomatic individuals with non-obstructive coronary disease can expe-rience acute myocardial infarction due to plaque rupture. Computational fluid dynamics (CFD) enables the simulation of coronary hemodynamics and wall shear stress (WSS), a key biomechanical factor in plaque vulnerability. However, the influence of varying coro-nary geometries and flow conditions on WSS behavior remains unclear. This study ana-lyzed how geometric factors (arterial diameter, tapering, and stenosis location) and he-modynamic or rheological parameters (inlet pressure, hematocrit) affect WSS distribution through CFD simulations. Idealized models of the left anterior descending, left circumflex, and right coronary arteries with 50% stenosis, along with a real right coronary artery mesh for validation, were evaluated under physiological conditions. Changes in hemato-crit modified blood viscosity and density. Ansys CFD simulations showed that both geo-metric and hemodynamic factors significantly impact WSS. Higher hematocrit and inlet pressure increased WSS; larger diameters led to nonlinear amplification; and distal or ta-pered lesions altered shear stress distribution. WSS values often exceeded 30 Pa, aligning with previous findings. Even minor modifications in geometry or blood properties caused notable changes in WSS, indicating that percent stenosis and fractional flow reserve (FFR) alone may be inadequate to fully assess the risk of plaque rupture.
Keywords:
CFD
; coronary
; atheroma plaque
; infarction
; rupture
1. Introduction
Cardiovascular diseases are the leading cause of mortality worldwide[1], especially acute myocardial infarction (AMI)[2]. Although traditionally associated with risk factors such as dyslipidemia and smoking, cases of acute coronary occlusion in asymptomatic young individuals have been increasingly reported[3,4], possibly attributed to vulnerable plaques with little stenosis, but which are fragile to shear forces[4]. This finding reveals an important gap in the current literature[5].
Characterized by an extensive necrotic core, high lipid content, high content of activated macrophages, thin fibrotic matrix, and low calcium content, these plaques are highly vulnerable to stress at the flow-wall interface[6,7], known as wall shear stress (WSS). Under these conditions, while more stable structures can resist without rupture, vulnerable plaques become susceptible to destabilization, potentially precipitating sudden ischemic events[8,9].
In this context, research focuses on two main objectives: (I) identifying patients with a higher propensity for vulnerable plaque formation who require specific diagnostic evaluation[10,11]; and (II) mapping WSS behavior in different coronary scenarios to assess the risk of plaque rupture[8,11,12]. For objective (II), in vitro[13,14] and in vivo[15] methods can be used for data acquisition; however, in silico[16] approaches have gained increasing prominence in recent years for simulating hemodynamic variables, particularly through computational fluid dynamics (CFD) software such as Ansys and OpenFOAM.
In this sense, the present study proposes a CFD-based methodology to describe how geometric (taper, diameter, plaque position) and rheological/hemodynamic (hematocrit, inlet pressure) variations influence the magnitude and distribution of WSS on the simulated endothelium, representing the intensity of plaque rupture risk in vivo[4,8].
2. Materials and Methods
2.1. Clinical Variables Applied to CFD
The first stage of the study involved a well-founded selection of population-based clinical variables described in the medical literature. The pressure values input into the simulation, expressed in millimeters of mercury (mmHg) and subsequently converted to Pascals (Pa), encompassed both the ranges considered normal by current guidelines and those outside this range, which are frequently observed in emergency care settings[17,18]. The conversion from diastolic blood pressure (DBP) to coronary perfusion pressure (CPP) was defined as CPP = DBP – LVEDP, where DBP is diastolic blood pressure and LVEDP is left ventricular end-diastolic pressure[19].
Distal coronary bed pressure is determined by the interaction between vascular compliance and microvascular resistance[20,21]. Evidence indicates that in stenoses of up to approximately 80–85%[22], compensatory vasodilation maintains post-stenotic flow. Under these conditions, pooled analyses indicate that distal pressure corresponds to approximately 82–88% of the inlet pressure at the inflow moment/second[23,24,25], with distal pressures showing a linear relationship with changes in inflow pressure[26].
Density and viscosity were modulated by varying hematocrit (Ht) values (Figure 1), encompassing both the normal clinical spectrum and values outside this range, but still plausible in clinical practice and previously tested in other studies[27].The relationship between Ht, density, and viscosity was defined according to formulas described in the medical literature[28]. Blood flow was modeled as Newtonian and incompressible, since previous investigations have shown that, under conditions of shear rate > 100 s⁻¹, arterial diameter > 1 mm, and Ht within physiological ranges, the consideration of non-Newtonian effects is unnecessary[29,30].
Computational Mesh Geometry
Given the variations in mesh geometry required to reproduce different simulated behaviors, an idealized computational modeling approach was adopted. In this study, was used the formulations proposed by Ho et al. (2023)[31] to represent atherosclerotic plaques with 50% stenosis (equation 2) and 35% eccentricity (equation 4), considering that these formulations are based on the analysis of 400 patients and therefore have a solid clinical foundation.
However, slight adaptations were introduced into the mathematical modeling to reproduce the natural tapering[32] (equation 1 and 3) and positive remodeling on the plaque-free wall of arteries33, while preserving the principles described in the original study (equation 2,4,5).
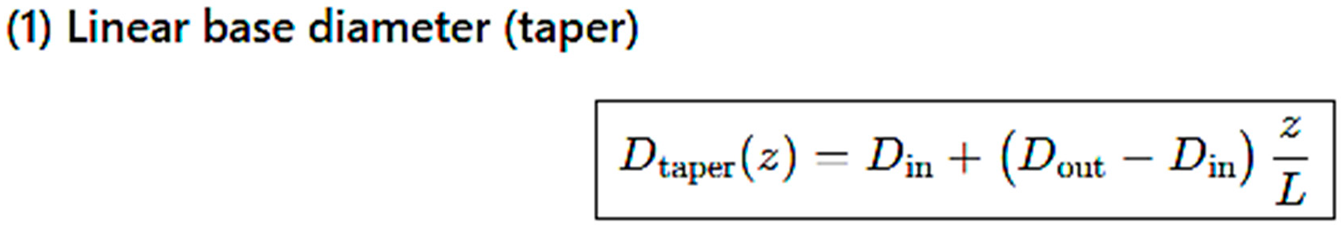
In the geometric formulation, Eq. 1 defines the linear taper of the vessel from the inlet (Din) and outlet (Dout) diameters along the total length (L). Eq. 2 describes the multiplicative stenosis profile, characterized by the severity S0 and the axial positions z0, z1, z2, z3, which delimit the proximal lenght stenosis (Li), middle lenght (Lm) and distal lenght of stenosis (Lo). These three lenghts were fixed with a value of 6mm. The actual vessel diameter at each position d(z), results from the combination of the taper with the stenosis function (Eq. 3). To represent eccentric stenoses (Eq. 4), introduces the eccentricity e(z), modulated by the maximum parameter e0. Finally, Eq. 5 describes the parametric contour of the cross-section in Cartesian coordinates (x(z,θ),y(z,θ)), simultaneously incorporating tapering, narrowing, and eccentric displacement, with θ ranging from 0 to 2π.
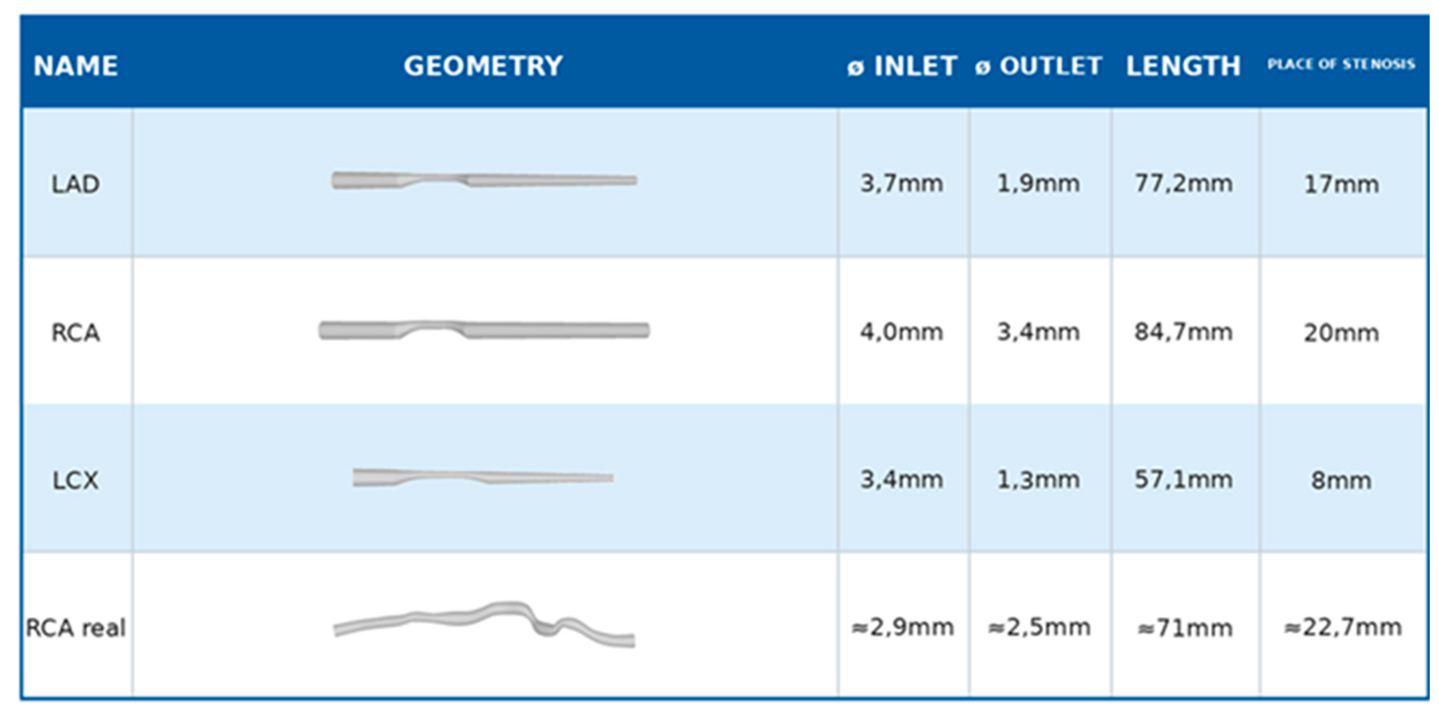
To represent the three main coronary arteries, idealized geometries of the left circumflex artery (LCX), the right coronary artery (RCA), and the left anterior descending artery (LAD) were constructed. Their inlet, outlet, and taper diameters were defined based on mappings previously described in the literature[32]. The total length was calculated using an approach similar to that of Ho et al. [31], consisting of the following segments: the initial segment, a segment containing the atherosclerotic plaque, a fixed distal portion 20 mm downstream from the plaque, and an additional segment equivalent to 22.22% of the mean in vivo artery length.
Considering that the large number of variables in CFD simulations has not yet been extensively tested or published, the comparative results available in the literature remain limited. As part of the validation process, in addition to comparison with other studies addressing the same approach, simulations were performed using a real right coronary artery (RCA) model provided by Vukicevic et al.[34] in .STL format (Table 1), which is compatible with the Ansys software employed in this study.
The primary location of the atheromatous plaque in our study was initially defined according to mappings described in the medical literature[35] and was subsequently treated as one of the modified geometric variables, together with diameters and taper. The element size adopted was 3 × 10⁻⁴, and CFD simulations were carried out using Ansys Student 2025 R1 (Ansys® software, Ansys Inc., Canonsburg, PA, USA.).
Boundary Conditions
Inlet pressure was defined using the CPP formula, with the LVEDP value set at 5 mmHg[36]; thus, CPP values corresponded to diastolic pressure minus 5 mmHg. For flow triggering, two models can be applied: the transient model, which represents variation throughout a cardiac cycle, or the steady-state model, which evaluates the response to the main pulse trigger. In this study, the steady-state model was adopted, as the analysis focused on peak WSS values and was not affected by cyclical variation, consistent with previous reports using similar models[37,38].
The specification of outlet pressure in CFD studies shows considerable variability in the literature, with some publications describing it as a fixed pressure set to zero, an arbitrary numerical value, or calculated using formulas, such as in the Lumped Parameter Network (LPN) model. From a clinical perspective, distal arterial residual pressure results from the interaction between compliance and vascular resistance[20,21], variables that are idiosyncratic to each individual. In the present study, was aimed for a hemodynamic assessment closer to physiological reality, by adopting mean distal coronary pressure values during perfusional instant[23,24,25], which were subsequently applied for validation in an additional simulation.
This result was reapplied to a coronary artery model based on the geometry described by Ho et al. In this configuration, with Pinlet fixed at 90 mmHg and Poutlet set to 86% of the inlet pressure, the values obtained for Pd and distal velocity were highly consistent with the reference: 77.27 mmHg and 3.22 m/s in the present study versus 77.3 mmHg and 3.3 m/s reported by Ho et al.[31].
Regarding flow, none of the simulations produced velocity values associated with a Reynolds number greater than 2000. Therefore, a laminar viscous flow model was adopted.
3. Results
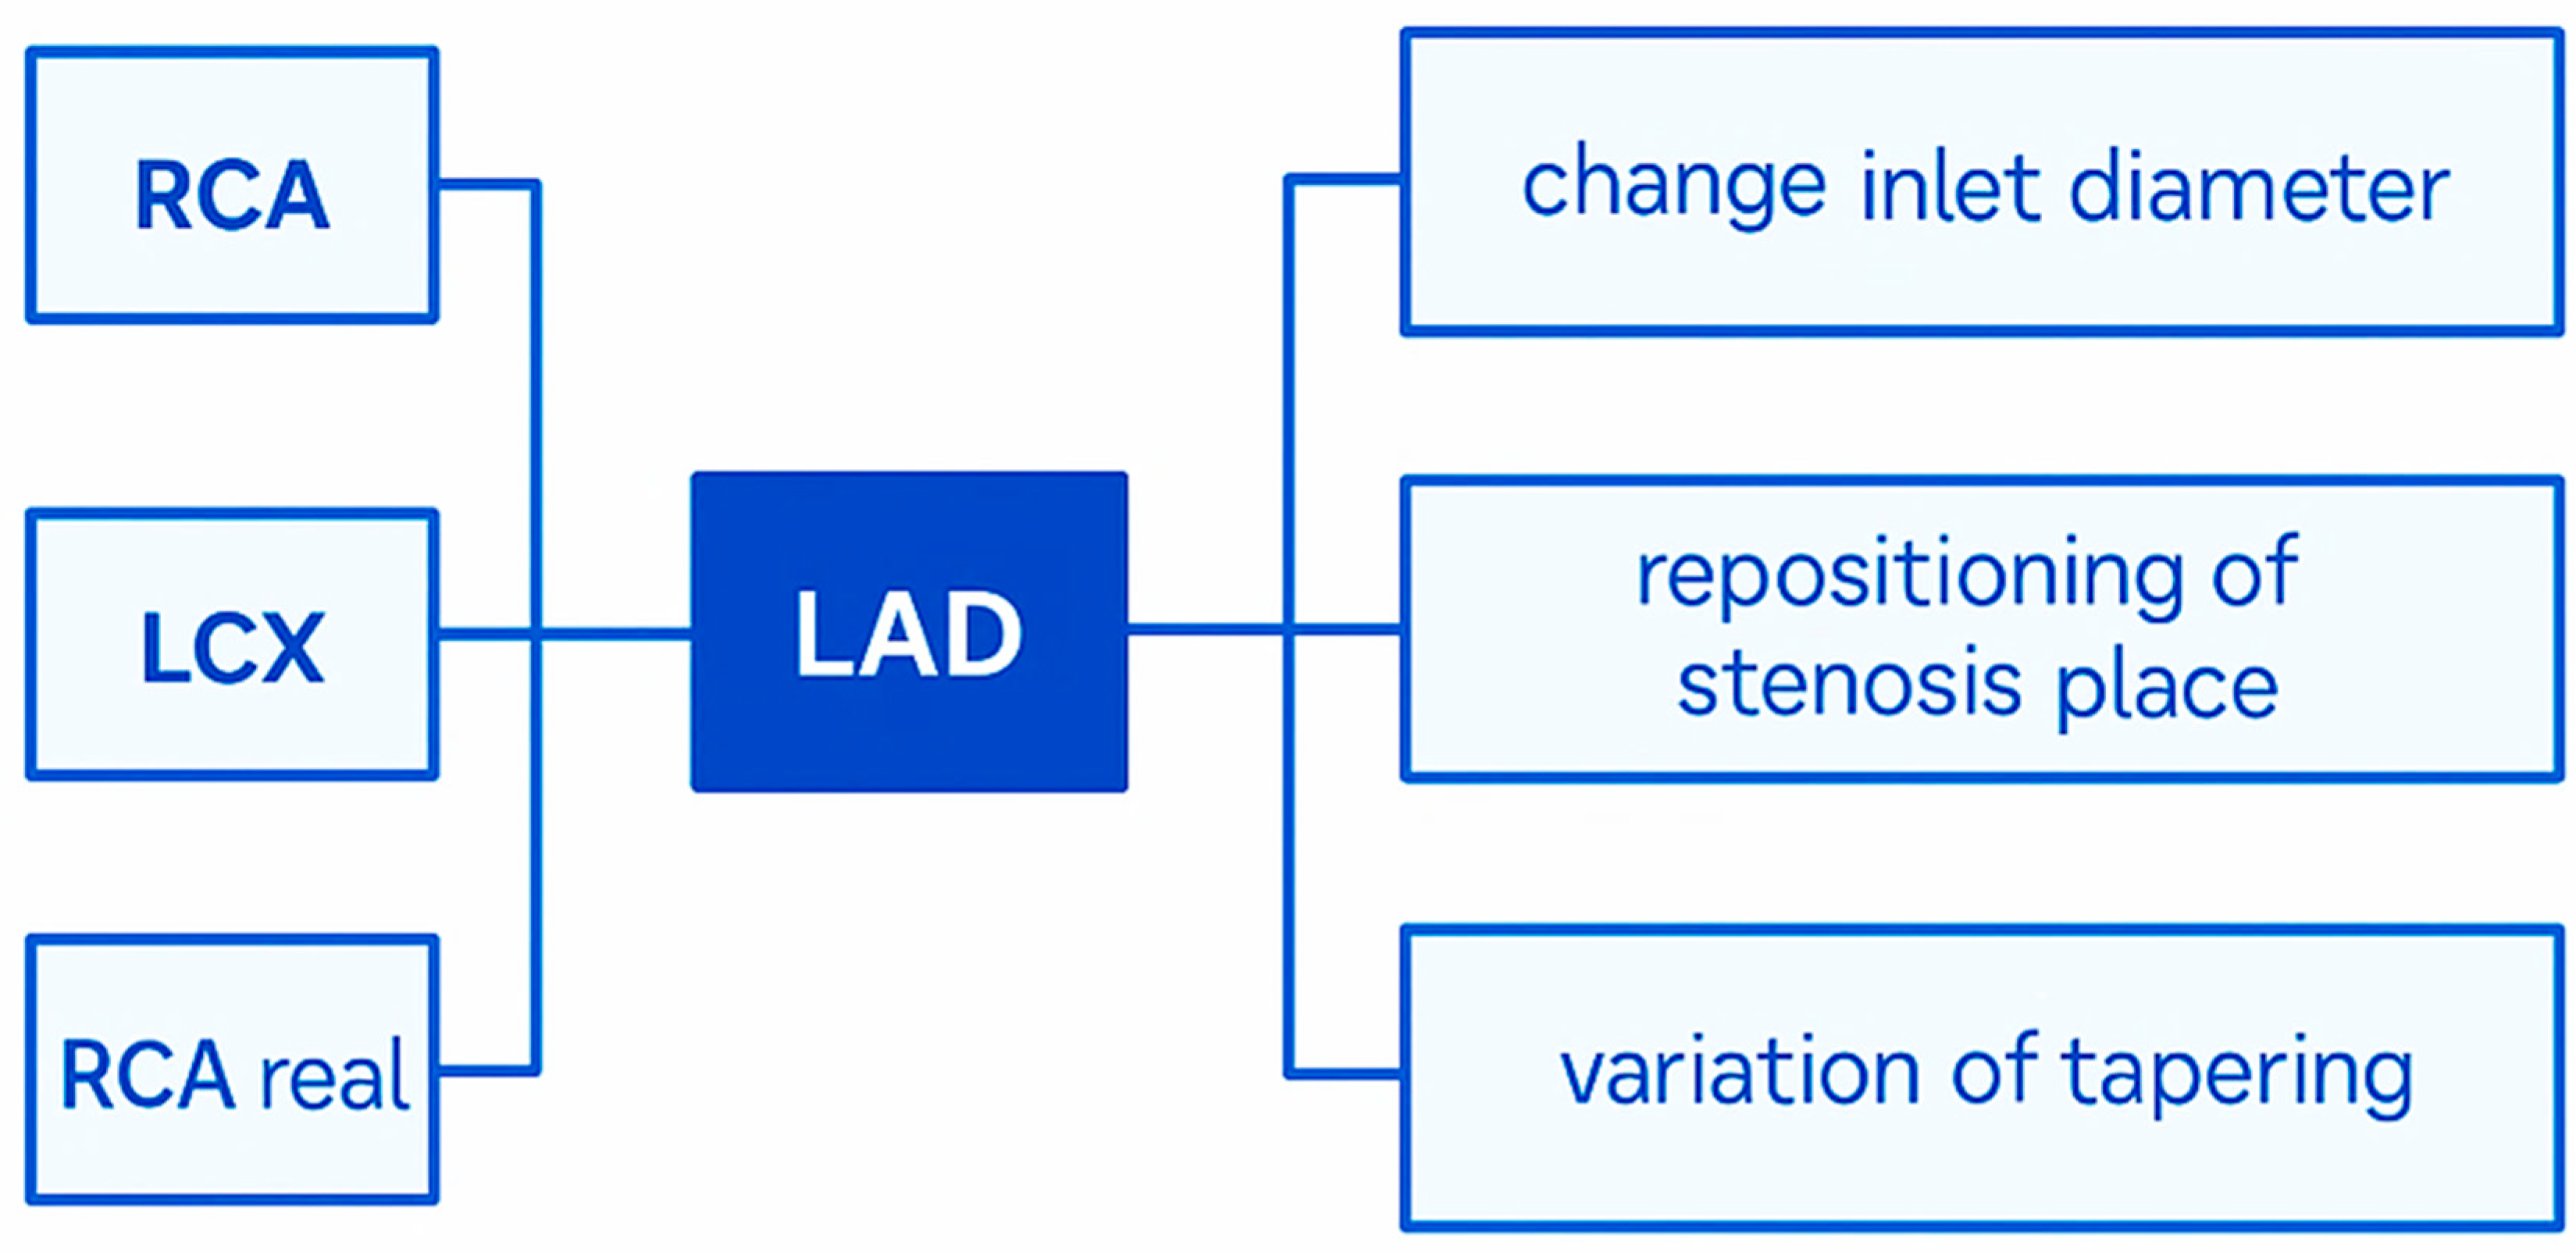
Geometric variations were proposed in this study (Figure 2). The analyses were primarily based on LAD coronary and compared with RCA, LCX as well real RCA. Posteriorly, to isolate the variables, was proposed modifications involved three main aspects for LAD: changes in the inlet diameter, repositioning of the stenosis site, and variation of tapering along the vessel length. To simulate these meshs, input parameters— inlet pressure, outlet pressure, and hematocrit—were systematically varied for each of the geometries considered. Together, these adjustments allowed a comprehensive assessment of how anatomical and hemodynamic factors interact to influence coronary blood flow.
3.1. Comparison of Hematocrit
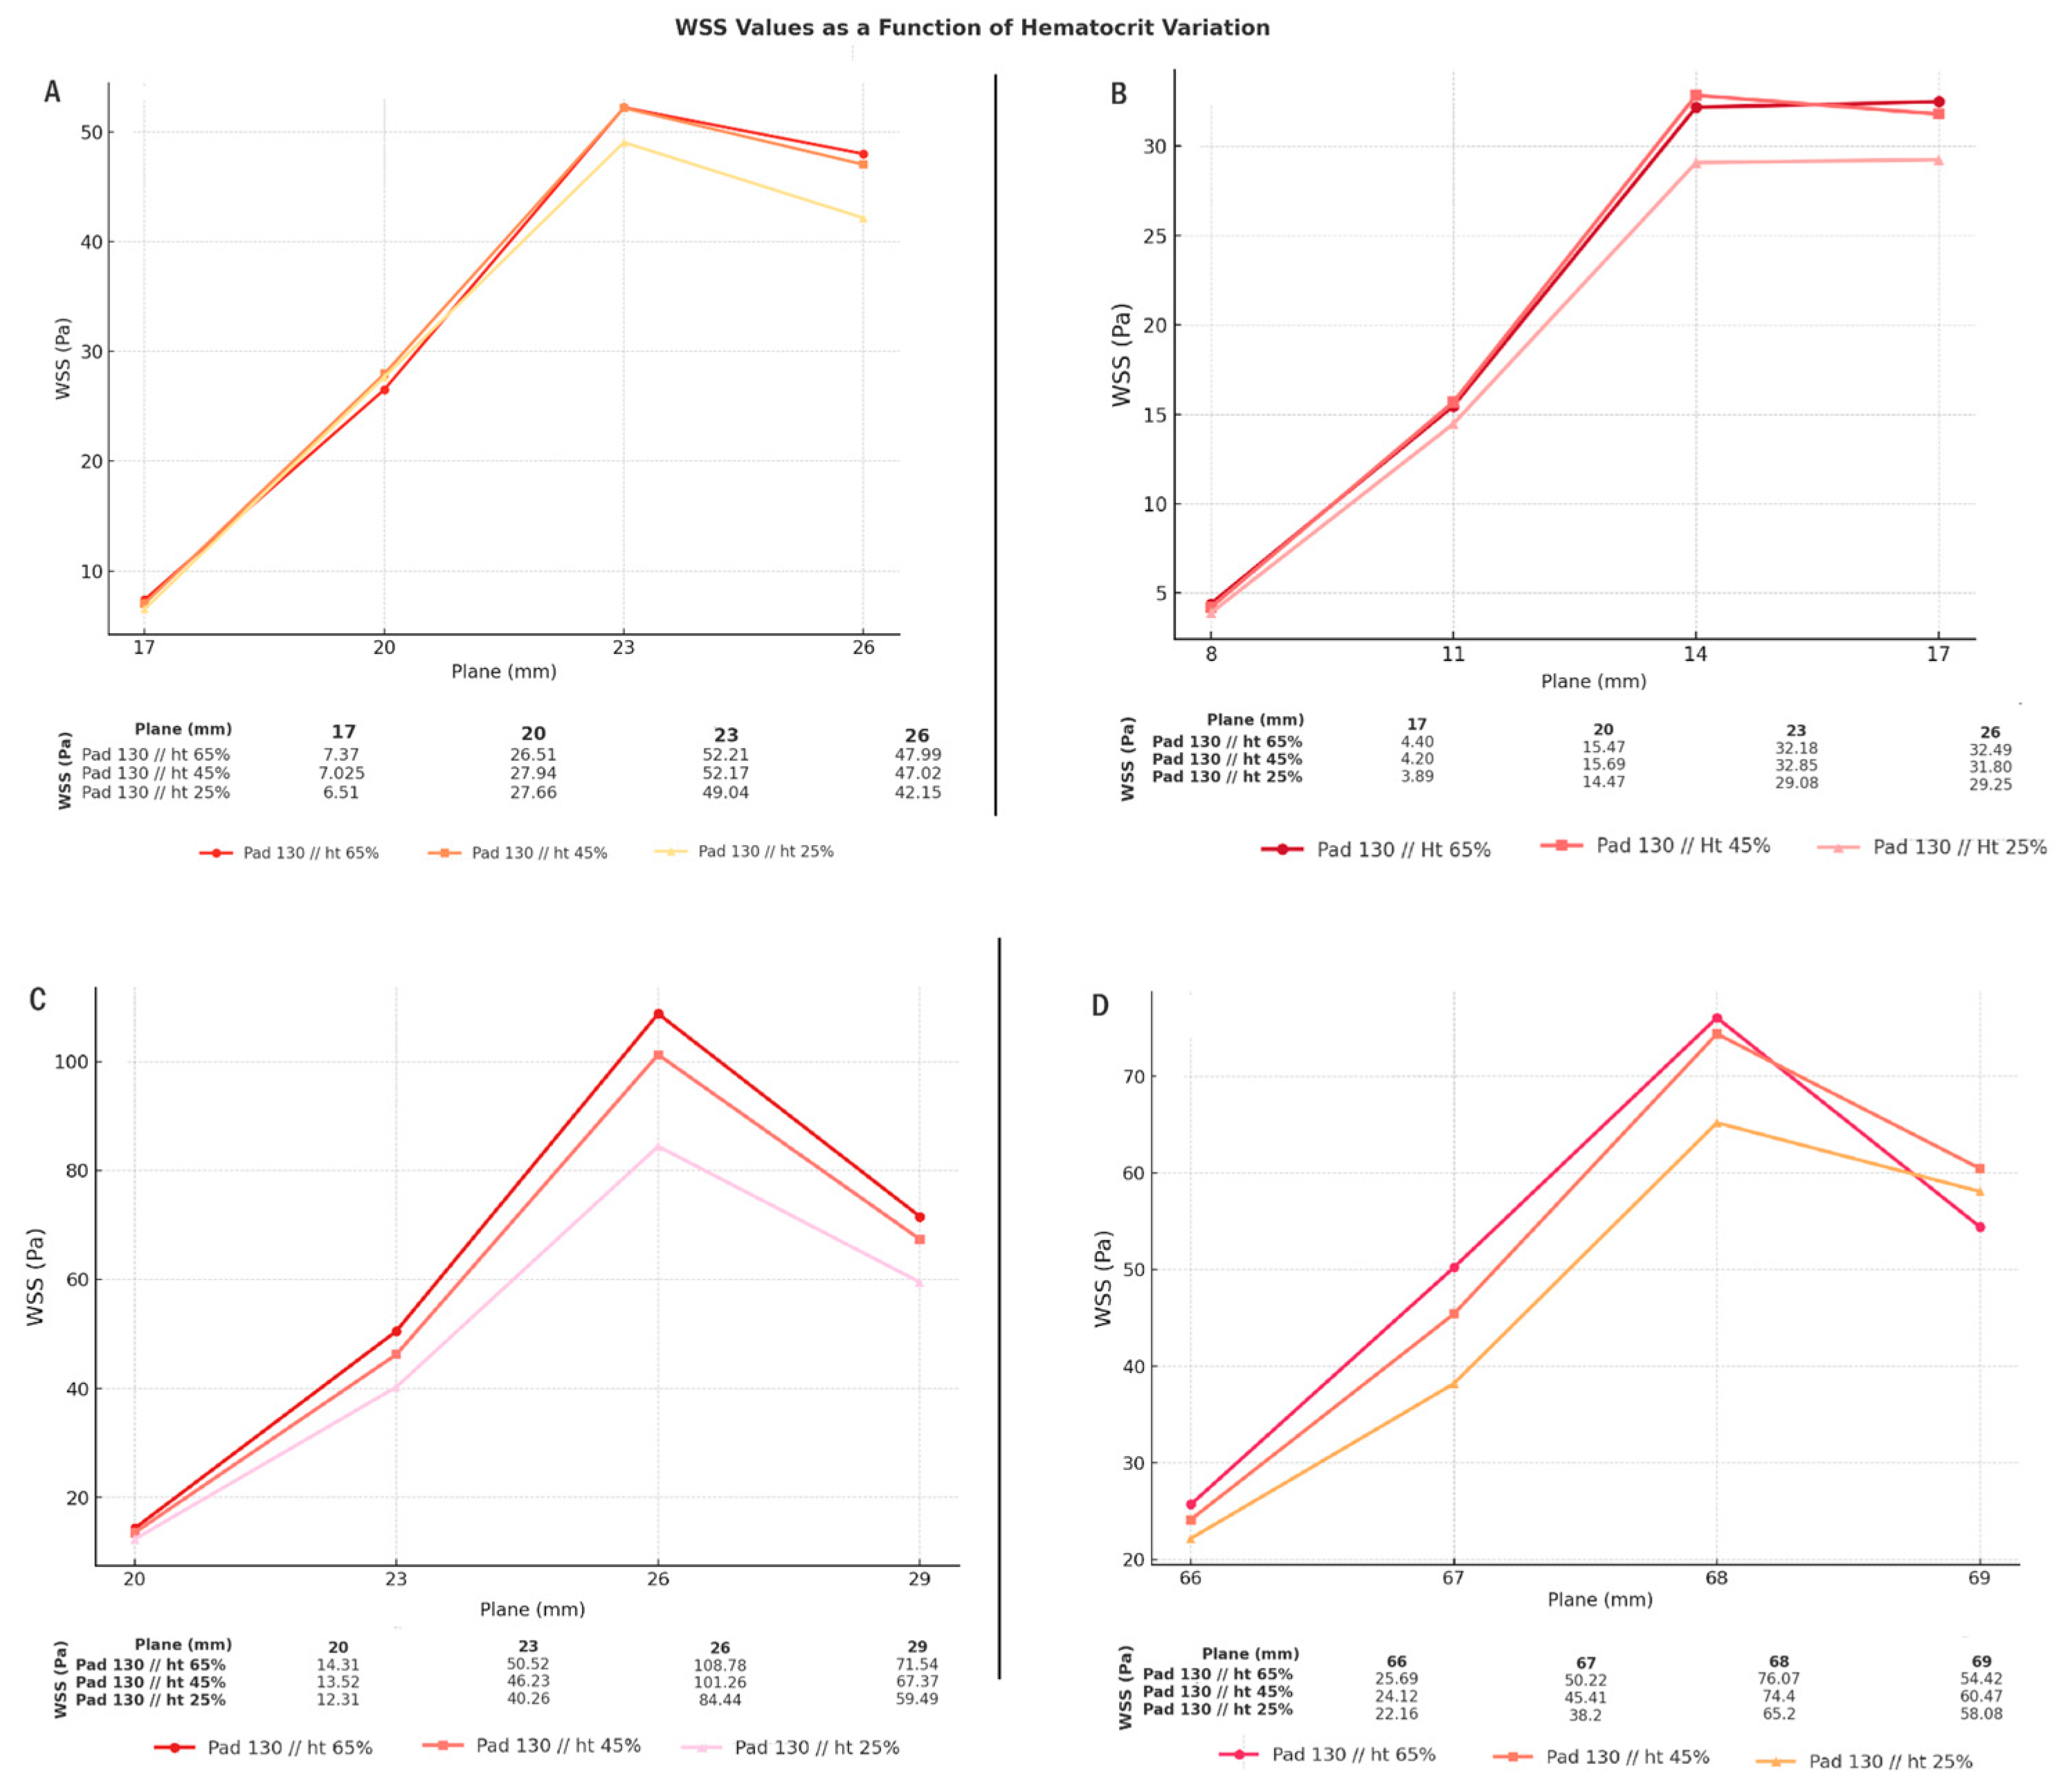
The variation of wall shear stress (WSS) as a function of hematocrit across the different arterial models analyzed (Graph 1): (A) LAD, (B) LCX, (C) RCA, and (D) Real RCA. Each proposed geometry incorporates at least three variables modeled from real data—taper, diameter, and plaque positioning—which together define the hemodynamic environment. Variations in hematocrit produced distinct changes in the peak intensity and amplitude of WSS, demonstrating its critical role in modulating shear forces within coronary arteries.
The simulations reveal that in all geometries, higher hematocrit values (65%) consistently amplified WSS peaks compared to lower levels (25%), with intermediate values (45%) showing peak nearly of Ht 65%. This effect was particularly evident in the LAD and RCA models, where the WSS peaks were more pronounced, reflecting the sensitivity of these regions to flow alterations. Interestingly, the real RCA geometry generated curves that closely followed those of the idealized models, reinforcing the robustness of the adopted methodology and highlighting the reproducibility of the hemodynamic patterns under controlled variations.
3.2. Comparison of Different Inlet Pressure Values
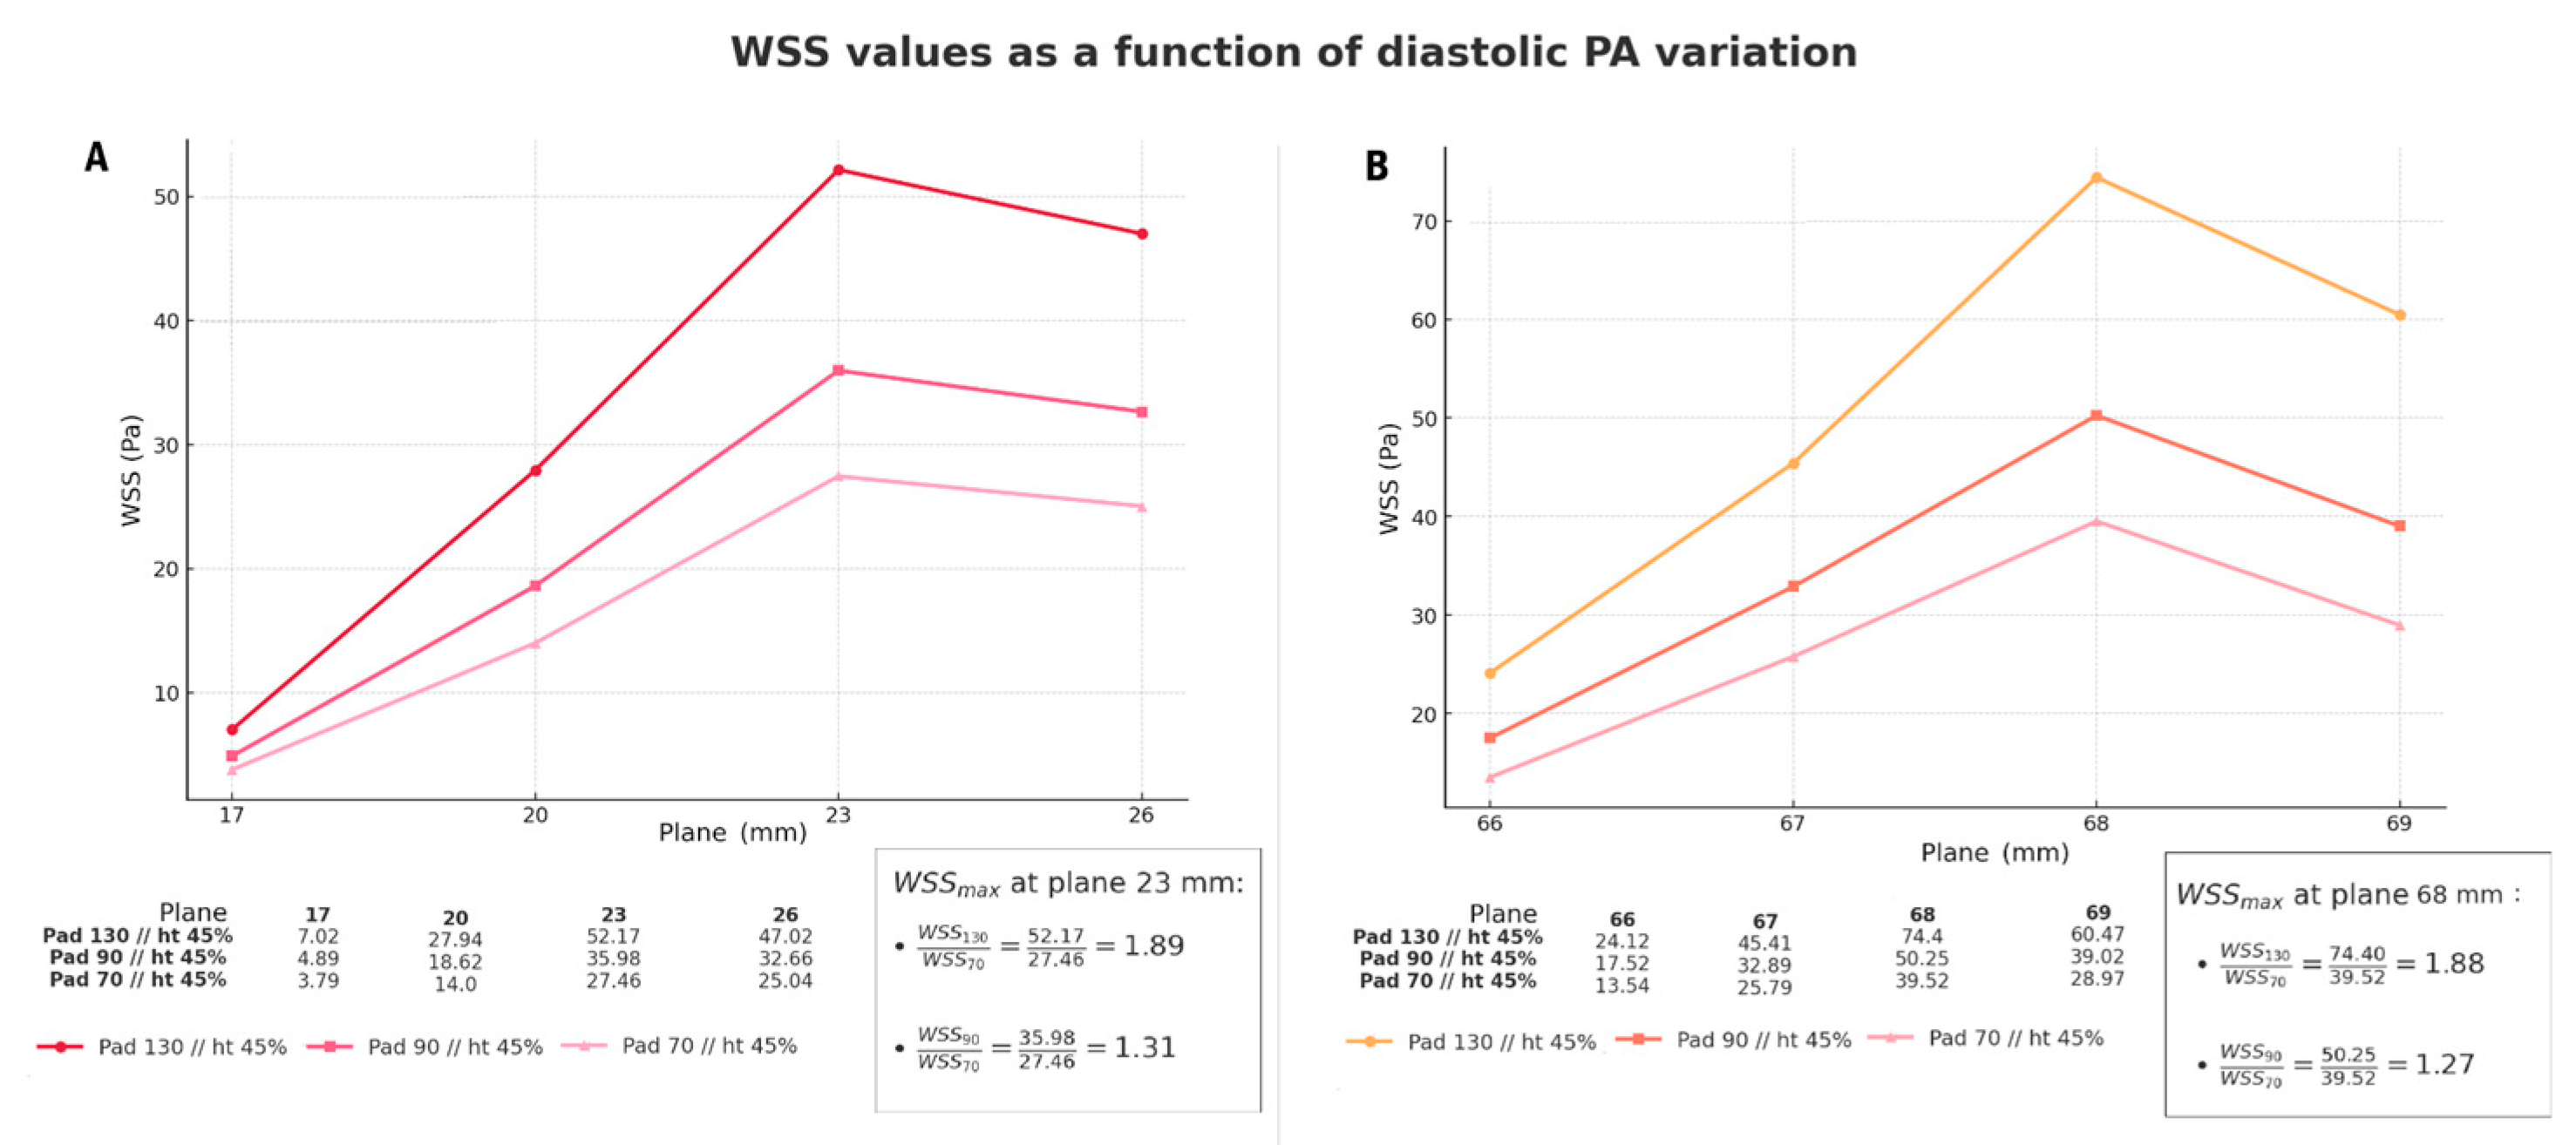
The Graph 2 presents the simulation in CFD software of wall shear stress (WSS) along the stenotic region under different diastolic pressure inputs. Panel (A) corresponds to the idealized LAD model, while panel (B) represents the real RCA geometry. In both cases, the WSS values increased consistently with higher imposed diastolic pressures, demonstrating that shear stress at the stenotic site is directly proportional to the initial pressure input.
For the LAD model, the maximum WSS recorded at plane 23 mm reached 52.17 Pa for 130 mmHg, compared with 27.46 Pa for 70 mmHg, resulting in a ratio of 1.89. Similarly, in the real RCA, the maximum WSS at plane 68 mm was 74.40 Pa for 130 mmHg and 39.52 Pa for 70 mmHg, corresponding to a ratio of 1.88. These simulations demonstrate a close agreement between the inlet pressure ratios and the WSS ratios, indicating that variations in inlet diastolic pressure are linearly
3.3. Comparison of Different Arteries (Geometries)
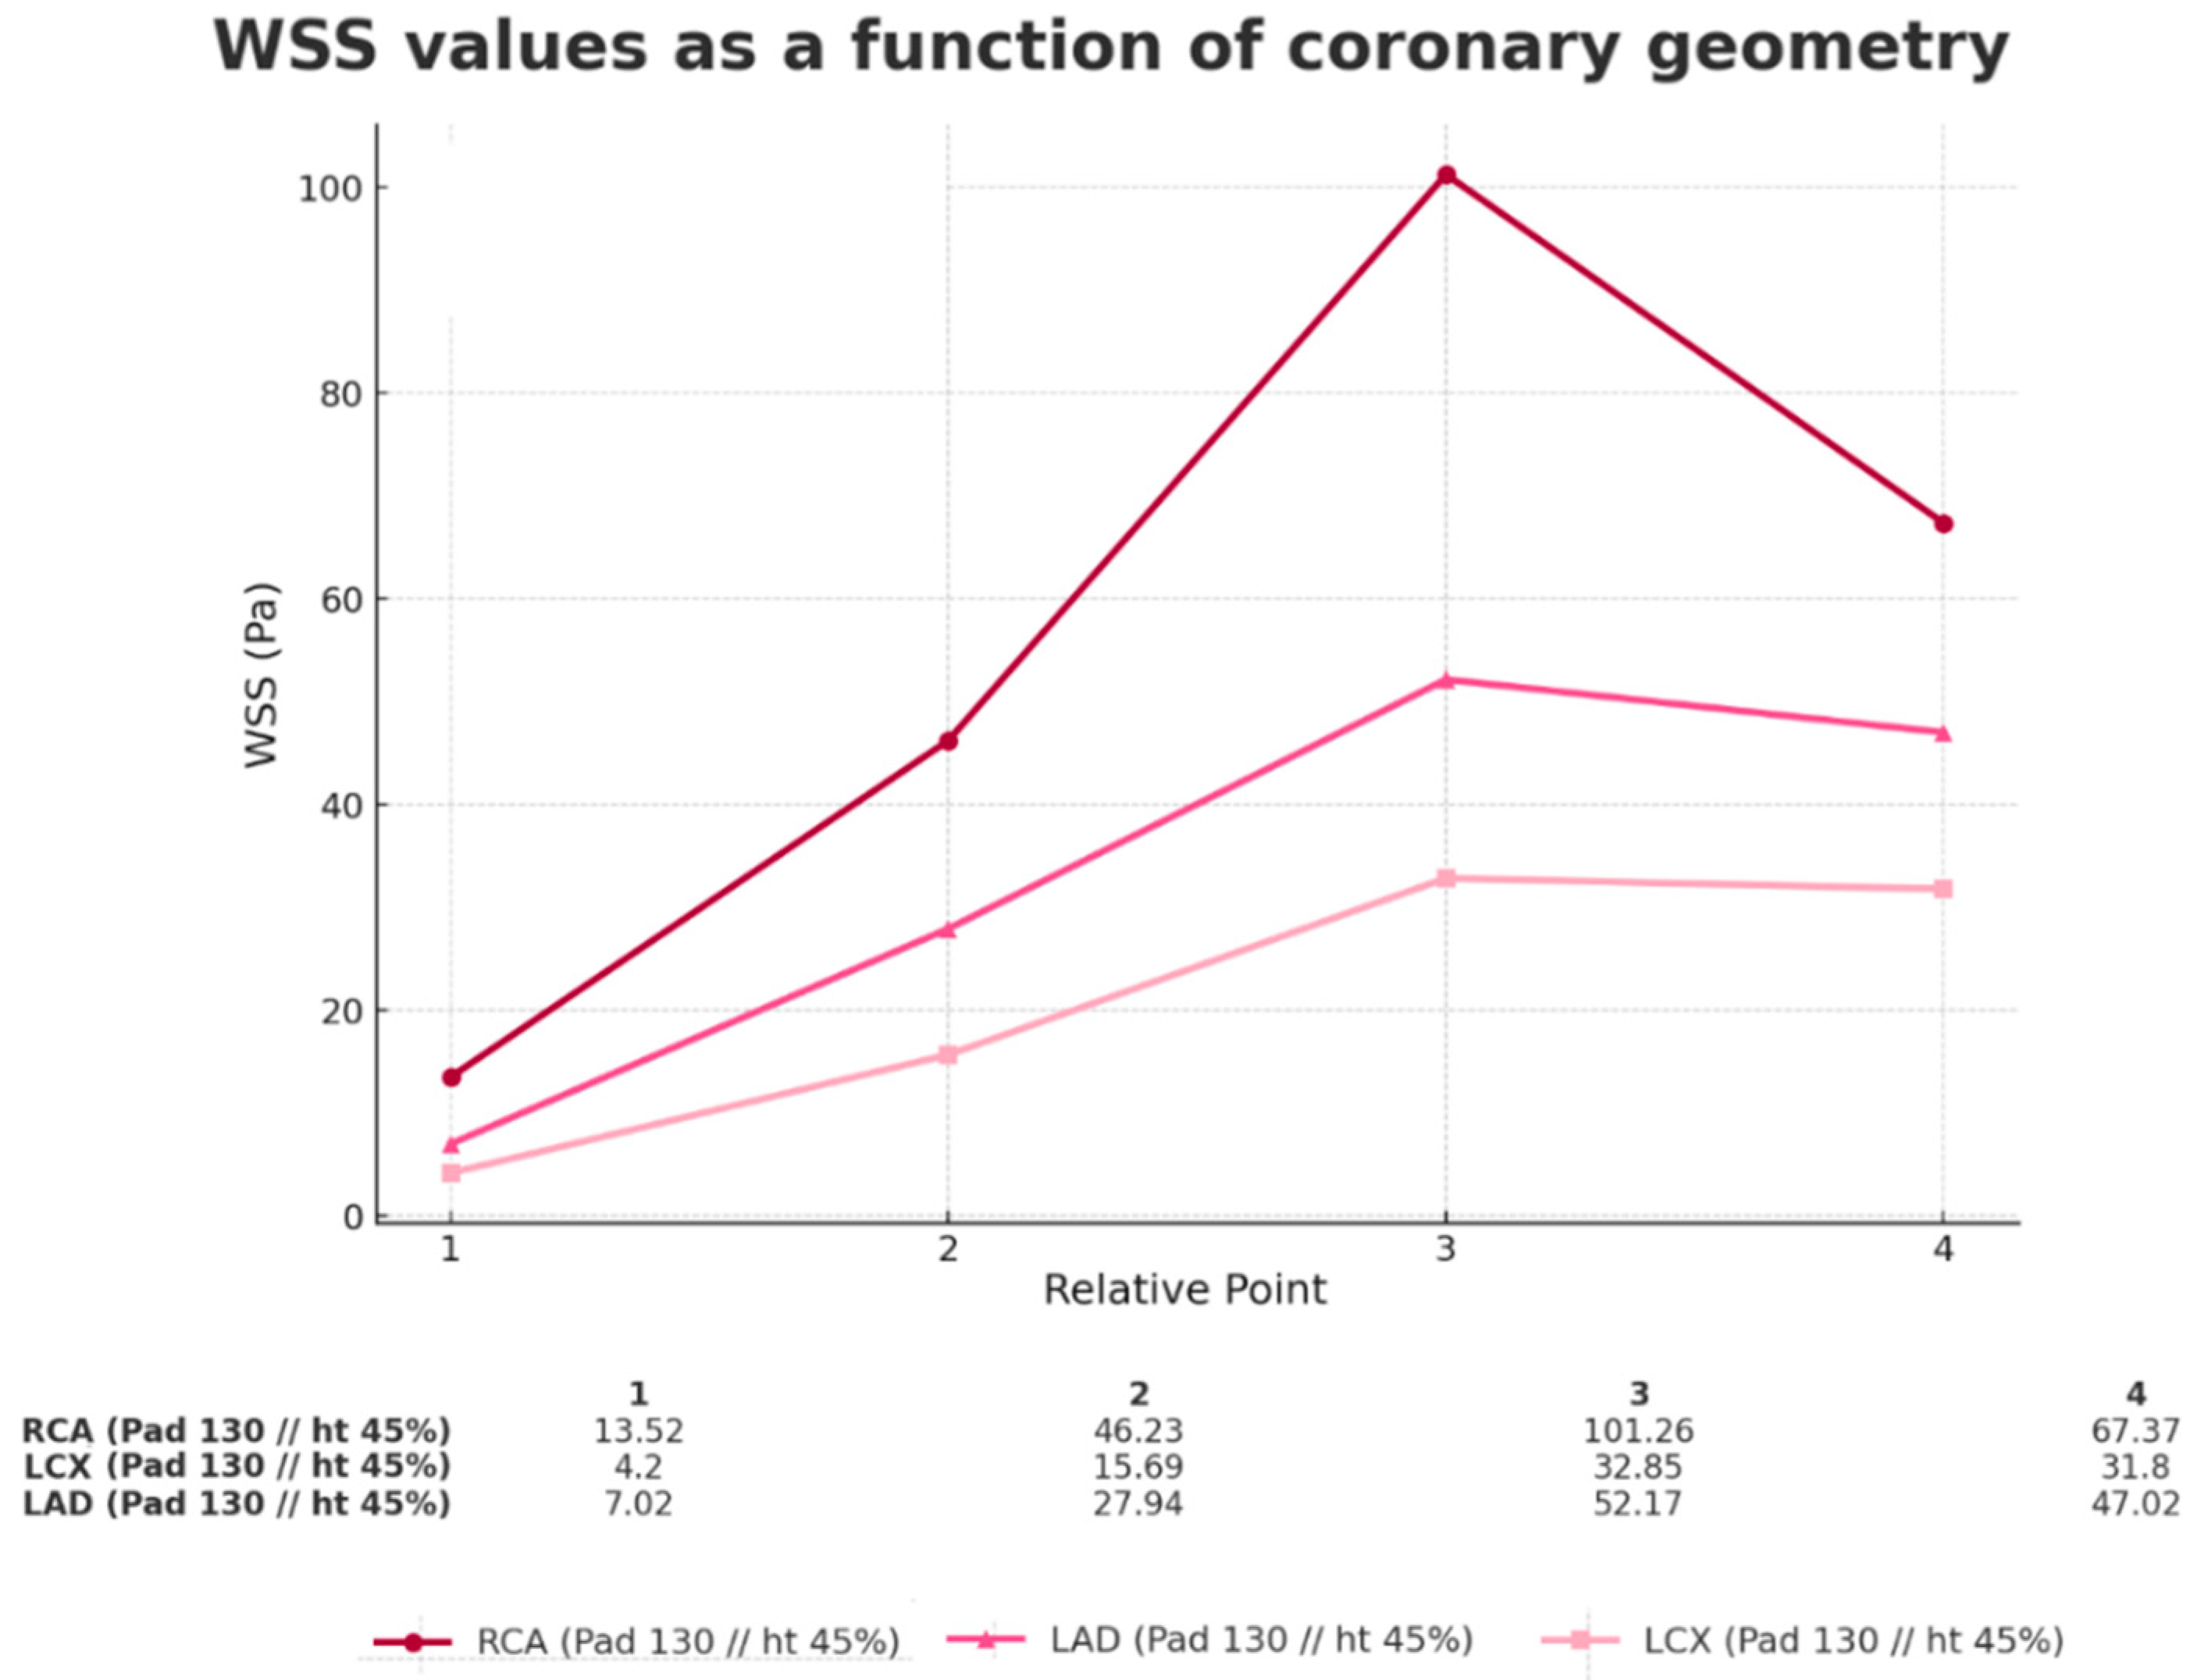
The Graph 3 illustrates the variation of wall shear stress (WSS) under identical hematocrit (Ht) and diastolic pressure (PAd) conditions across different coronary geometries. The results demonstrate that geometric differences—particularly taper, stenosis location, and inlet diameter—significantly influence both the magnitude and distribution of WSS.
Among the simulated cases, the RCA model exhibited the highest WSS peak (101.26 Pa at point 3), whereas the LAD and LCX models reached lower maxima of 52.17 Pa and 32.85 Pa, respectively. These findings highlight that, despite being subjected to the same hemodynamic boundary conditions, each geometry produced distinct stress profiles. Importantly, variations were observed not only in peak intensity but also in the downstream behavior beyond the stenosis, where the interaction with the proximal shoulder (upstream) modulated the post-stenotic WSS distribution.
Such simulations reinforce the role of vessel-specific geometry as a critical determinant of hemodynamic patterns and WSS. Given these differences , it was necessary to conduct an isolated analysis of each variable—namely inlet diameter, taper, and plaque position—in order to determine the relative influence of each on the maximum WSS. The analyses were organized as follows:
3.4. Comparison of Different Inlet Diameters (Geometries)
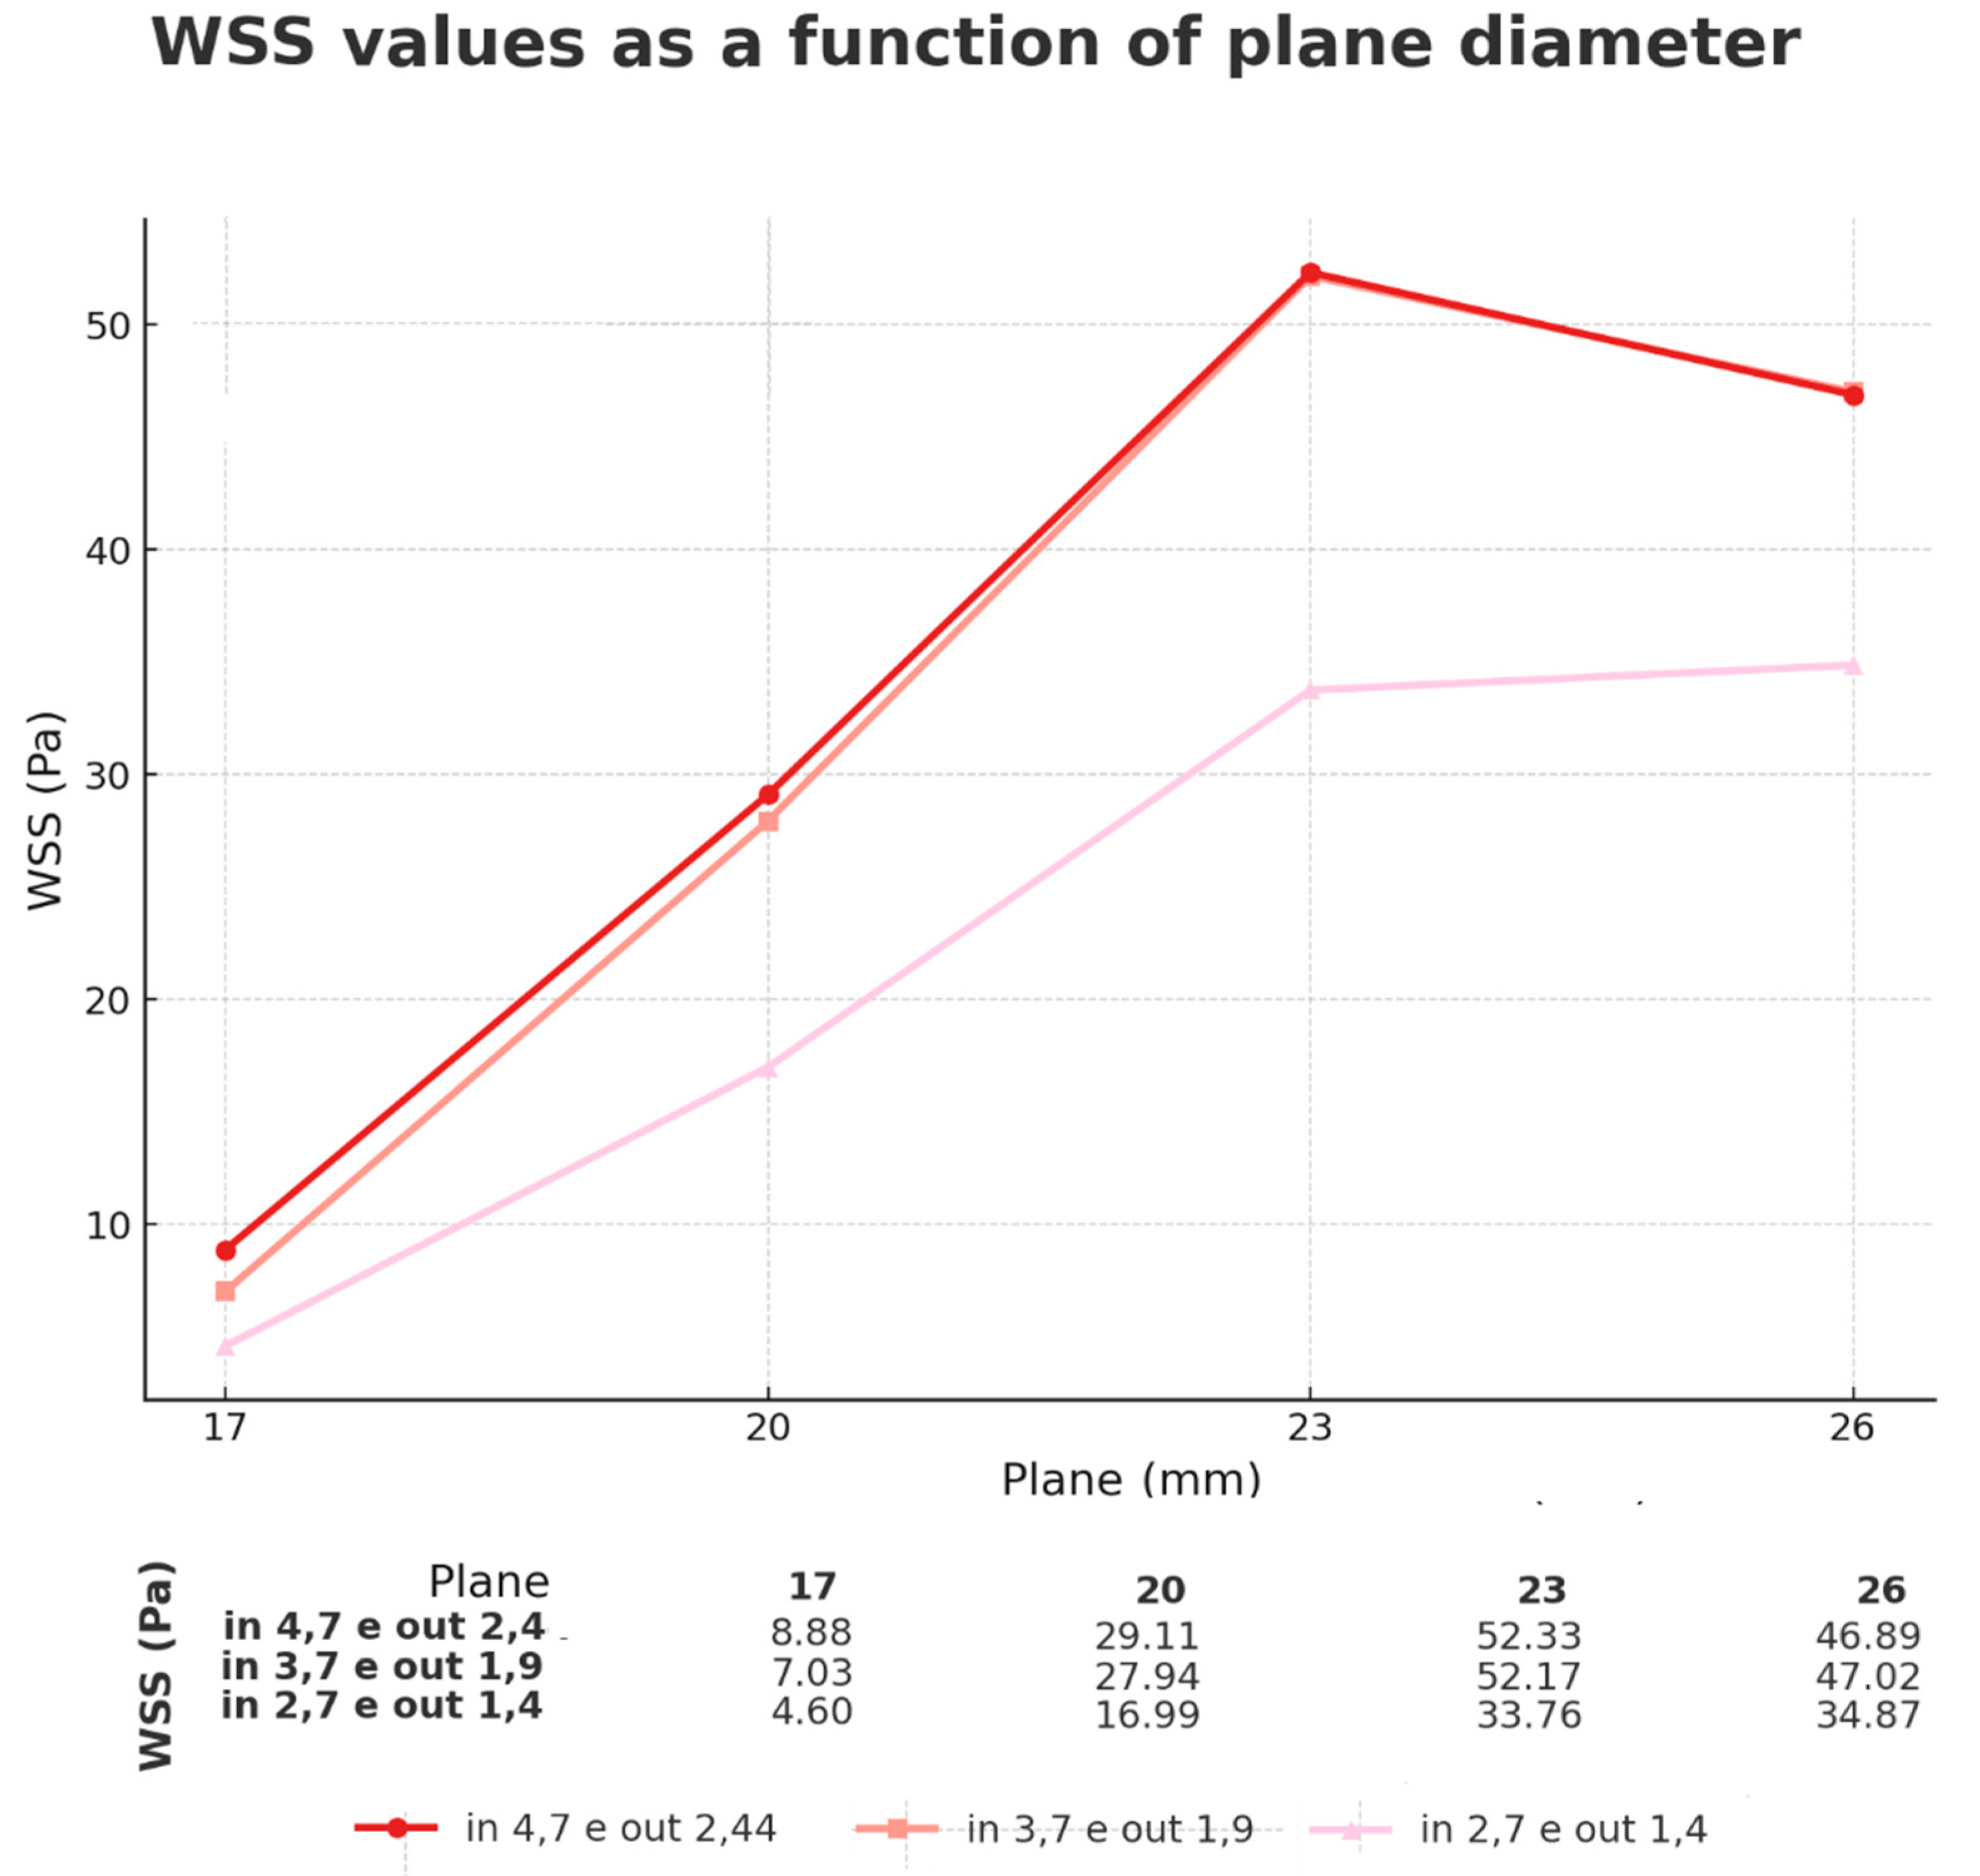
Using the LAD as a reference (Graph 4), a mean inlet diameter of 3.7 mm was adopted, with variations of ±1 mm, while maintaining the predefined inlet PA values. The results confirmed the trend observed in previous analyses: increasing the inlet diameter leads to an increase in WSS, although in a non-linear manner. The largest variation was observed between 2.7 and 3.7 mm, whereas between 3.7 and 4.7 mm the behavior tended to stabilize.
The simulations confirmed that increasing the inlet diameter produces higher WSS values until reaching an apparent saturation peak. At this stage, smaller diameters yield lower WSS peaks, although these peaks tend to persist for a longer distance along the atheromatous plaque (proximal shoulder + plateau) as discussed in the subsequent Results section (Fundamentals of Fluid Mechanics).
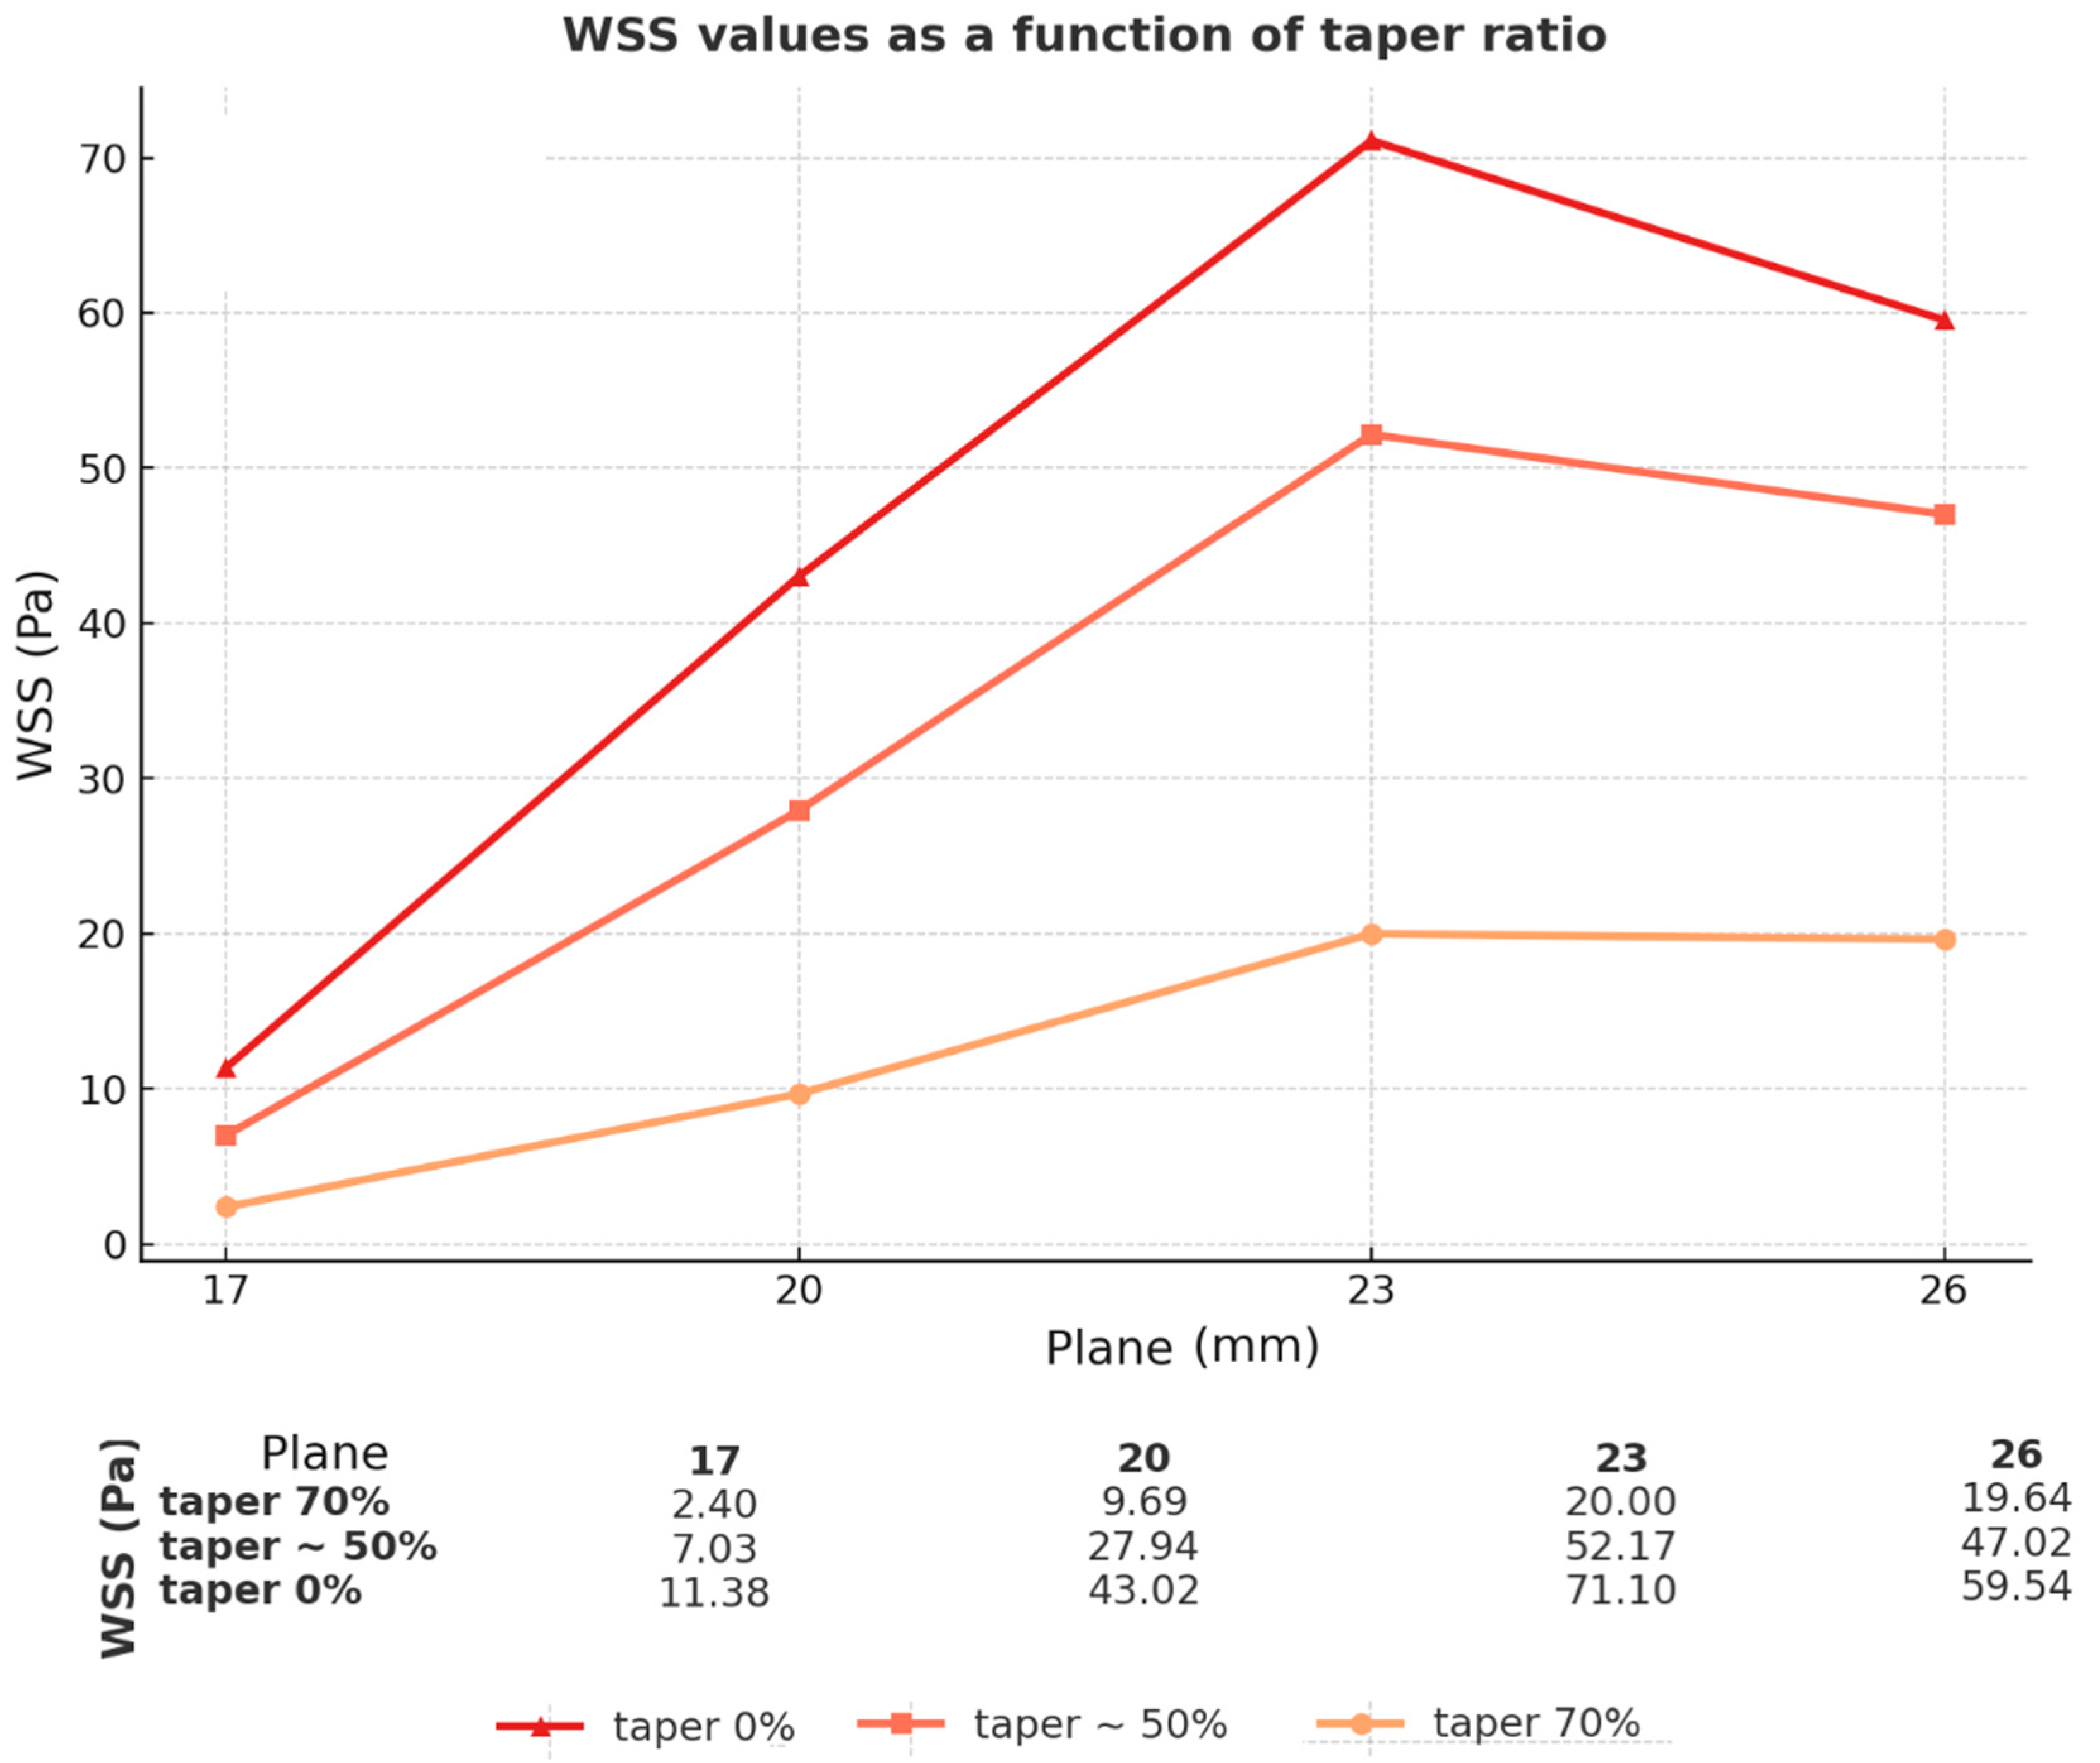
3.5. Comparison of Different Taper (Geometries)
In addition, Graph 5 shows the impact of taper ratio on WSS behavior. By modifying the taper percentage, two key patterns were observed: first, the maximum WSS value increased as the taper decreased; second, the pressure drop across the stenotic site occurred more rapidly with lowly taper ratios. In the case of a 70% taper, WSS values at both the stenosis plateau and the proximal upstream shoulder were nearly equivalent, indicating a redistribution of hemodynamic stress along the lesion. These findings highlight the combined effects of geometric narrowing and tapering on the localization and intensity of WSS, reinforcing their clinical relevance in stenosis progression and rupture risk.
By modifying the taper percentage, changes were observed in two main aspects: the maximum WSS value increased as the taper decreased; however, the pressure drop on the stenosis occurred more rapidly. In the case of a 70% taper, the pressure was virtually identical at both the stenosis plateau and the region corresponding to the proximal upstream shoulder.
3.6. Comparison of Different Sites of Stenosis Initiation (Geometries)
Graph 6 illustrates the hemodynamic impact of modifying the site of stenosis initiation. In line with literature reports, the original configuration positioned the plaque in the proximal third of the artery, approximately 17 mm from the vessel origin. To explore positional effects, two variations were introduced: one shifting the stenosis 10 mm proximally (at 7 mm from the origin) and another 10 mm distally (at 27 mm from the origin), while maintaining identical diameter and tapering parameters.
The results revealed a consistent curve pattern across all simulations, with WSS increasing along the flow direction, peaking near the stenosis, and declining thereafter. However, the magnitude of these peaks varied according to the onset location, even hemodinamics parameters remain unchanged. Distal stenoses (27 mm) produced the highest WSS values, while proximal stenoses (7 mm) exhibited lower shear intensities. The intermediate site (17 mm) yielded values between these two extremes, but nearly of the 27mm, demonstrating likely saturation position.
4. Discussion
4.1. Gap in the Literature
With the advancement of more sophisticated diagnostic modalities, such as CT angiography, optical coherence tomography, and intravascular ultrasound (IVUS), it has become possible to more accurately differentiate vulnerable plaques from more stable lesions. Nevertheless, a significant gap persists in the literature regarding the definition of when and how to intervene—clinically or mechanically—based on this characteristcs.
The medical literature, both in scientific articles and in clinical guidelines, acknowledges this issue as a fundamental pillar yet to be fully elucidated:
- Journal of the American Heart Association; september 2024: Ekmejian et al. [5]: “Despite the utility of WSS in the prognostication of coronary disease, there remains a paucity of outcome-driven randomized clinical trials on the role of CFD and FSI in clinical practice and whether there are potential therapeutic targets linked to WSS. For example, it is unclear whether percutaneous coronary intervention of a coronary plaque associated with high WSS reduces the risk of future MI [...] Randomized clinical trials comparing CFD/FSI parameters to existing modalities such as intravascular imaging and invasive coronary physiology will be required for these techniques to transition from their predominant role in research to a more clinical role.
- ESC 2023 ACUTE CORONARY SYNDROMES Guidelines for the management of acute coronary syndromes [39]: “Does management of non-infarct-related CAD with intravascular imaging guidance to identify rupture prone atherosclerotic plaque improve clinical outcomes?”
4.2. Analysis of Simulated Results
The literature has highlighted the need for further investigation into the chronic effects of high WSS on plate destabilization[40]. Reference values differ: while some authors consider high WSS to be above 2.5 Pa[41,42], others adopt the limit of >7.0 Pa[43], classifying values >~15 to 25 Pa as super high WSS[40]. This discrepancy also extends to critical thresholds for endothelial integrity: whereas certain reports associate rupture risk with plaques exposed to WSS >4.95 Pa[44], other studies suggest that only values exceeding 35 Pa would be sufficient to trigger endothelial degradation[45].
Each variable related to the arterial network or blood rheology influences the pressure exerted on the endothelium. In our simulations, WSS peaks generally exceeded >30 Pa in the stenotic region, a finding that is consistent with similar studies, such as that of Alamir et al[46]., which describe values generally above 30 and peaks of up to 70 Pa in severe stenoses[46]. Similar results were also reported by Hoogen et al. [47], with records of 32.34 Pa in real coronary angiograms rendered and simulated in CFD, and by Nisco et al. [48], who observed values between 40 and 50 Pa in stenoses of 50 to 70%.
Regarding the location of the WSS peak, our results demonstrated maximum values in the proximal portion of the plaque, in some cases maintained along the stenosis plateau. These topographic points corroborate findings previously described in the literature. Russo et al. [49], for example, reported in one of their models values of 48.7 Pa and 94.4 Pa in regions of ascending and mid-stenosis, respectively. These results are comparable to those obtained in our simulation of idealized RCA with 50% stenosis, 130 mmHg diastolic pressure, and 45% Ht, which presented values of 46.23 Pa and 101.26 Pa, respectively (Graph 3).
About the rheological parameters analyzed in our simulations (Graph 1), a correlation was observed between increased viscosity and elevated WSS. This increase in shear magnitude, evidenced in both real and idealized meshes, is in line with recent publications, such as that of Xie et al. [50], which demonstrated that elevated hematocrit intensifies WSS in regions of stenosis. From a clinical perspective, this association is also supported by longitudinal studies, such as that of Sorlie et al. [51], which demonstrated a greater propensity for acute myocardial infarction in patients with Ht > 49%, when compared to those with values below 42%.
Relevant results were obtained by manipulating the inlet diameter (Graph 4), showing that increasing this parameter promotes an increase in the WSS until reaching a saturation point. This finding differs from some CFD publications that adopt fixed velocity values or flow waveform profiles in the inlet Lindsey et al. [52]; on the other hand, it converges with physiological data obtained by vascular ultrasound. Reneman et al. [53] describe that "a tenfold increase in flow combined with a 20% increase in diameter will cause a 5.8-fold increase in shear stress." This observation reinforces the explanation that, under constant flow conditions, larger diameters would tend to reduce the WSS; however, in clinical practice, the increase in arterial caliber is accompanied by an increase in flow during vasodilation processes, resulting in shear intensification[54].
Our atherosclerotic plaque model (18 mm long with a 6 mm plateau) showed that, in situations of greater taper (example 70% tapering), peak WSS is reduced at the proximal shoulder of the stenosis but remains elevated throughout the plaque, compared to arteries without taper (Graph 5). This behavior can be explained by the adaptation of Poiseuille's law to WSS in converging nozzles, in which flow in smaller diameters prolongs the pressure loss along the conduct due the distributed pressure drop, a phenomenon that will be described below (detailed in the section: Fundamentals of fluid mechanics).
Similarly, when the plaque is more distant of the inlet it receive more peak of WSS when compared of proximal (Graph 6). These behavior too depends of diameter and flow , which generate difference of Total and Local Losses Pressure (detailed in the section: Fundamentals of fluid mechanics).
Another relevant finding from the hemodynamic simulations was the existence of a proportionality between the inlet pressure ratio and the WSS values along the stenosis, evidenced both in idealized meshes and in the real model. From the results obtained in the present study, it was observed that the division of the WSS measured at the proximal shoulder or in the stenotic region maintains proportions similar to the inlet pressure ratios used in the calculation. For example, diastolic Pinlet ratios of 130/70 mmHg and 90/70 mmHg resulted in values of 1.86 and 1.29, respectively, remaining reflected in the WSS values of the stenosis (Graph 2).
We did not find similar simulation tests in the literature for comparison purposes, so for better accuracy, we compared an idealized mesh with a real one (Graph 2), where this pattern was maintained. If this proportionality is confirmed by in vitro experiments or in vivo methods, this information will be highly relevant for future applications, such as neural networks aimed at predicting hemodynamic patterns, with potential use in diagnostic imaging reports.
4.3. Fundamentals of Fluid Mechanics
Our analysis considered both real models (with dendritic and/or meandric geometries) and idealized meshes, the latter generally configured as conical profiles that converge-divergent in the stenosis region but converge globally. This idealized format incorporates principles of a gradually contracting converging nozzle associated with a stenosis point26, configuring itself as convergent-divergent with a smoothed hydraulic singularity, like a Venturi tube (Figure 3). The stenosis generated by the atheromatous plaque is therefore interpreted as a structural anomaly in the conduit that promotes an increase in WSS in the proximal region and a significant decrease downstream of the irregularity. Mastering these hydraulic principles is essential for understanding the nuances of hemodynamics, interpreting results considering classical formulas, and assessing the influence of input variables on boundary conditions and output results.
For variations in inlet diameter, our conclusion is that, by using a "snapshot" of the moment the flow is triggered [37,38]— in which the inlet pressure is defined by the CPP and the basal distal pressure theoretically results from the combination of compliance and resistance — a global ΔP is established that, at that instant, governs parameters such as direction, velocity, and flow rate. A equation adapted and applied to converging nozzle diagrams, how smaller the radius/diameter, greater is the distributed pressure drop due to shear stress along the taper [26,55,56](Equation 2).
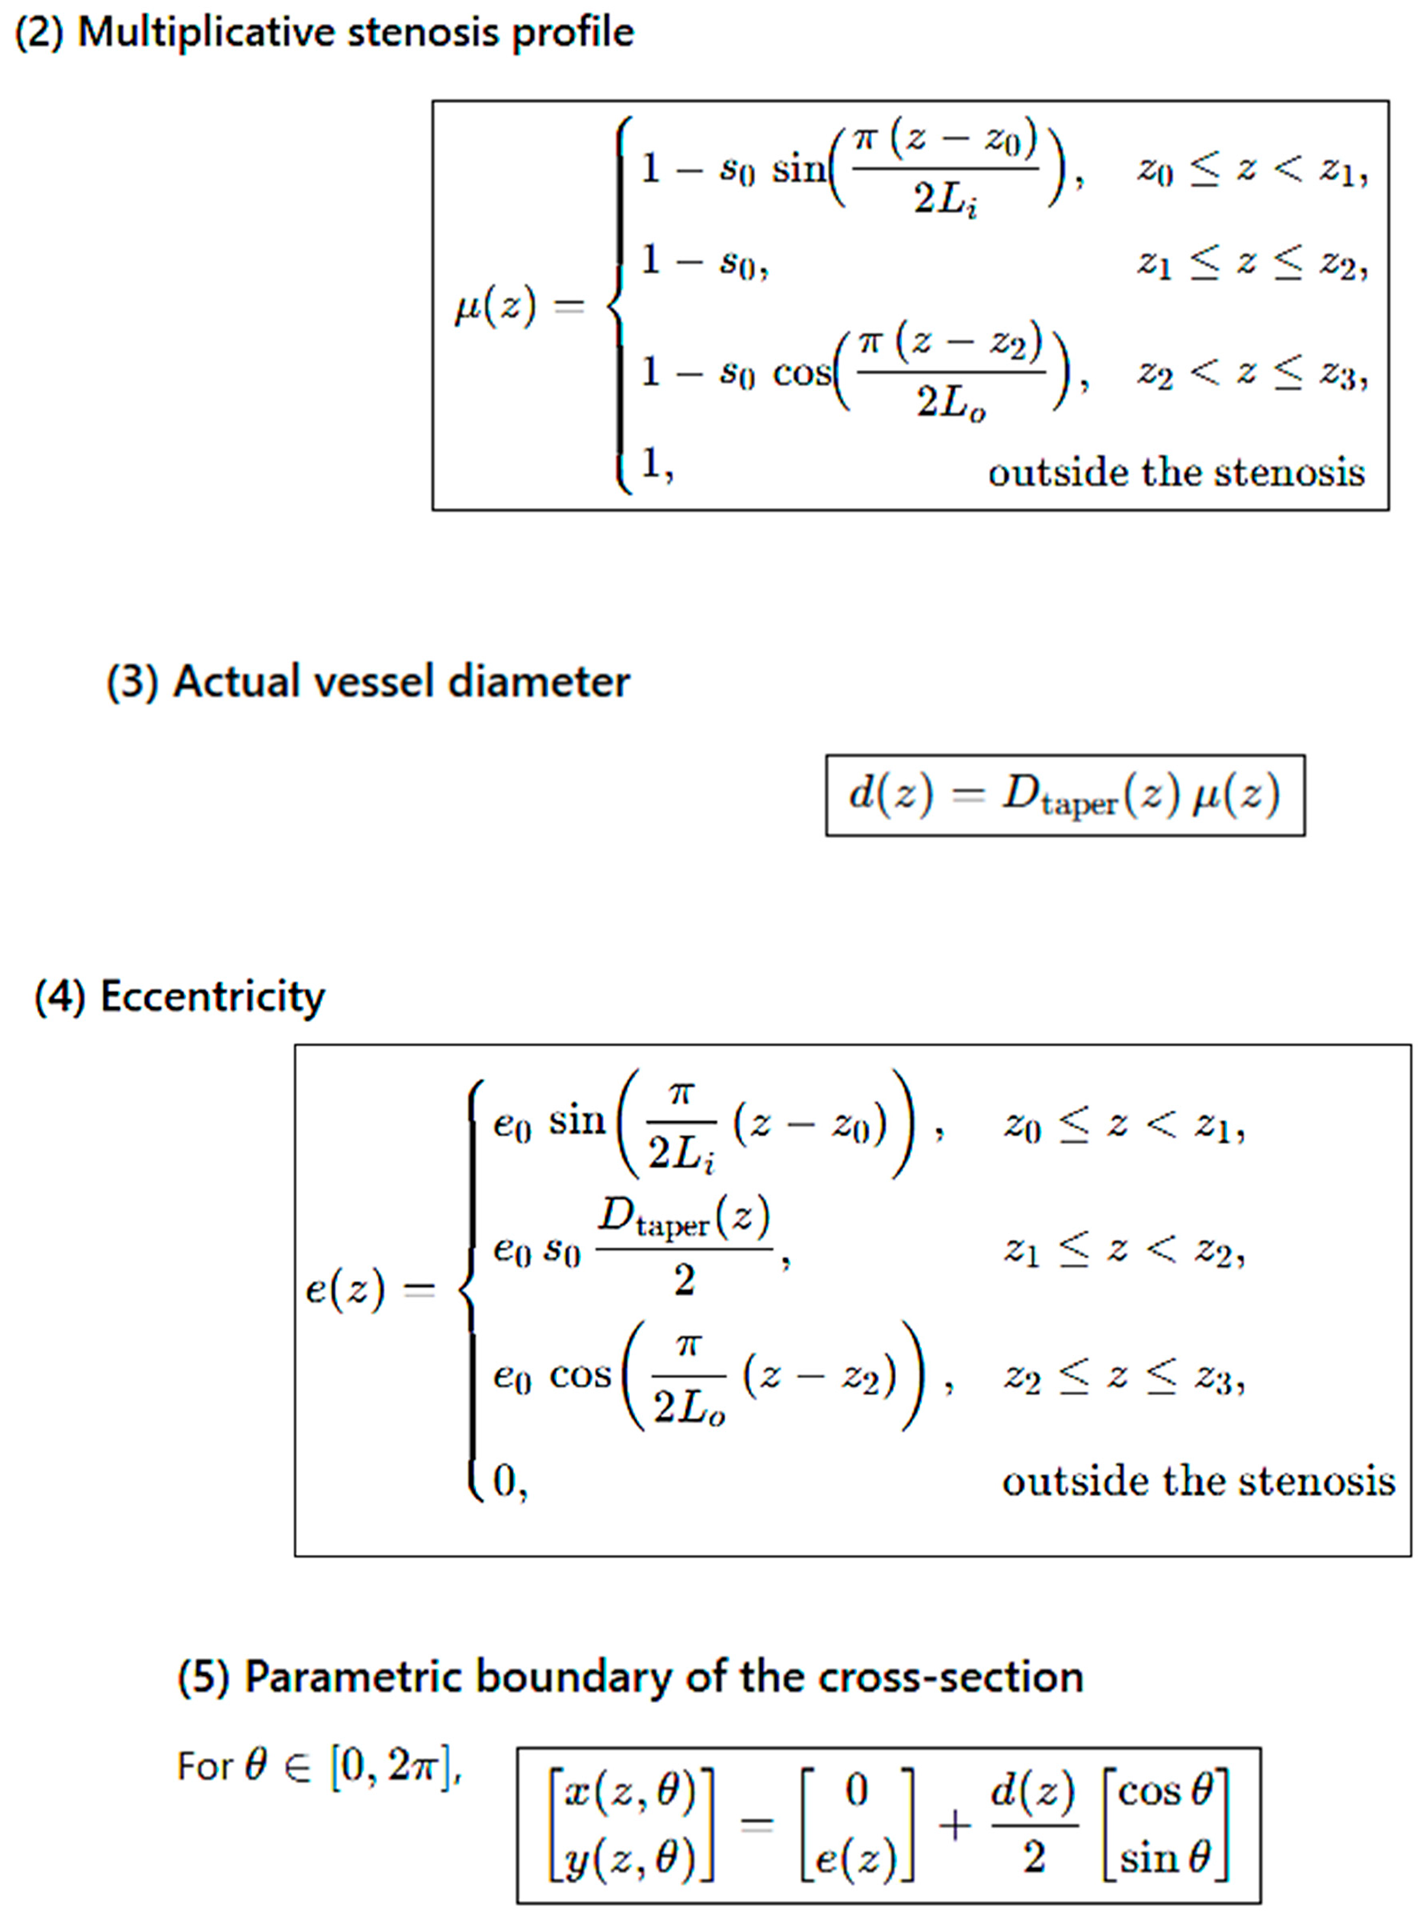
In fluid dynamics, the pressure drop (Δp) is determined by distributed (Major Head Losses) plus Local Minor Losses. The Darcy-Weisbach (corresponding to the pressure dissipation due to continuous friction along the conduit) associated with WSS (which denotes the tangential stress) equation represents the of distributed pressure losses. Geometric parameters include vessel length (L), inner diameter (D, in meters), and inner radius (ri ,in meters). Fluid properties are expressed by density (ρ, kg/m³), mean velocity (V, m/s), volumetric flow rate (Q, m³/s), and dynamic viscosity (η, Pa s). The equation that comes from both has shear inversely proportional to the radius cubed (Equation 6).
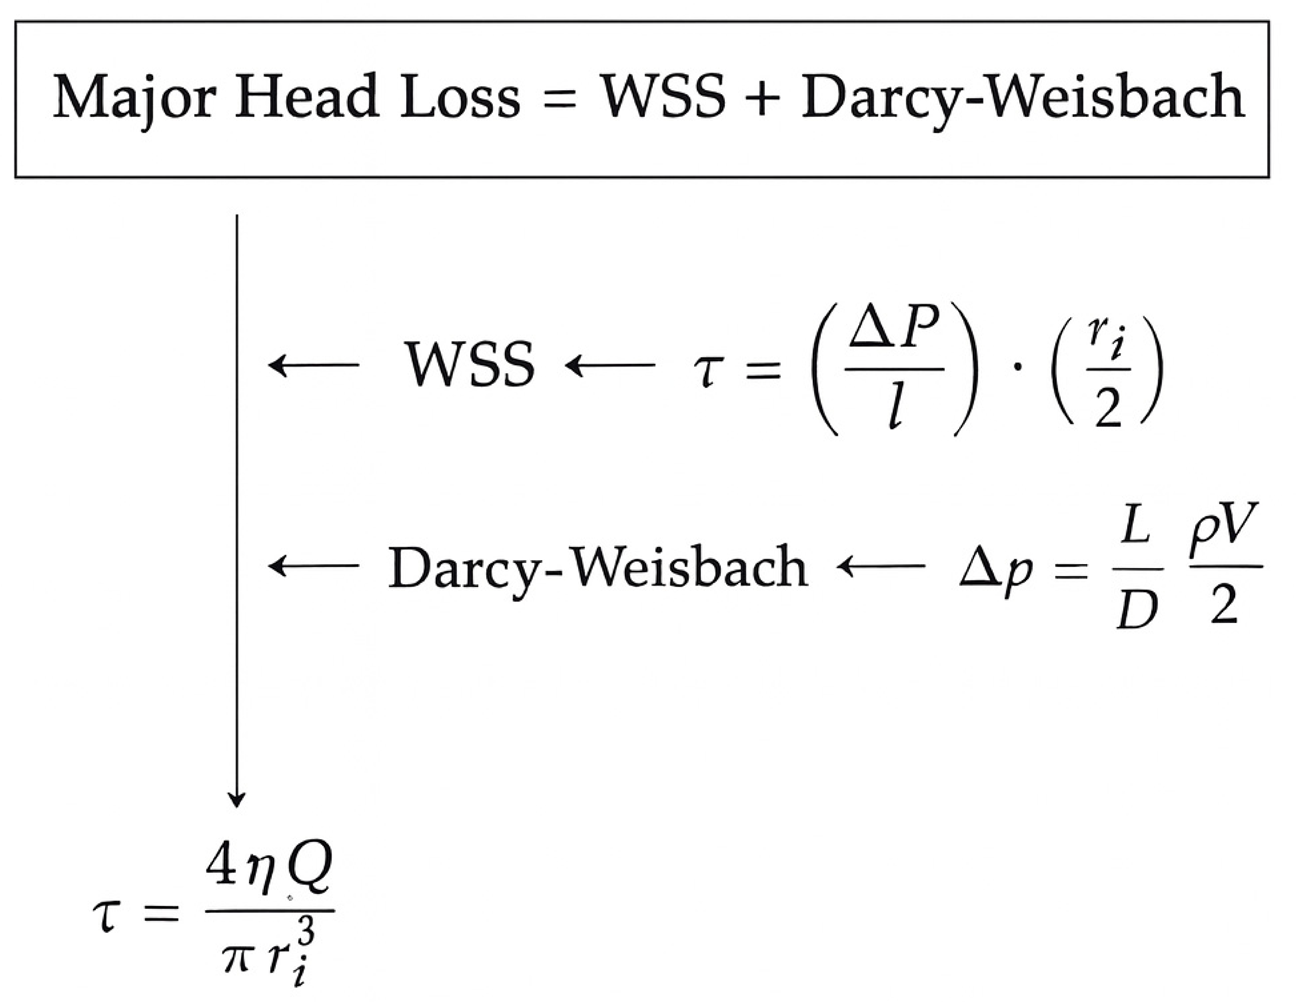
Equation 6 – Distributed Pressure Loss as a Function of Shear Stress.
Vessels with reduced diameters exhibit greater pressure consumption along their course, such that upon reaching the proximal shoulder of the stenosis they present lower flow velocity and, consequently, reduced local pressure loss (Eq. 6) [26]. Conversely, for larger diameters, the distributed pressure loss trend becomes less significant, as described by Equation 6, in which the radius is raised to the third power. In these cases, the overall pressure loss is concentrated in the losses localized to the stenosis[26], demonstrating the saturation behavior observed in Graph 4 for inlet diameters between 3.7 and 4.7 mm (Equation 7)[26].
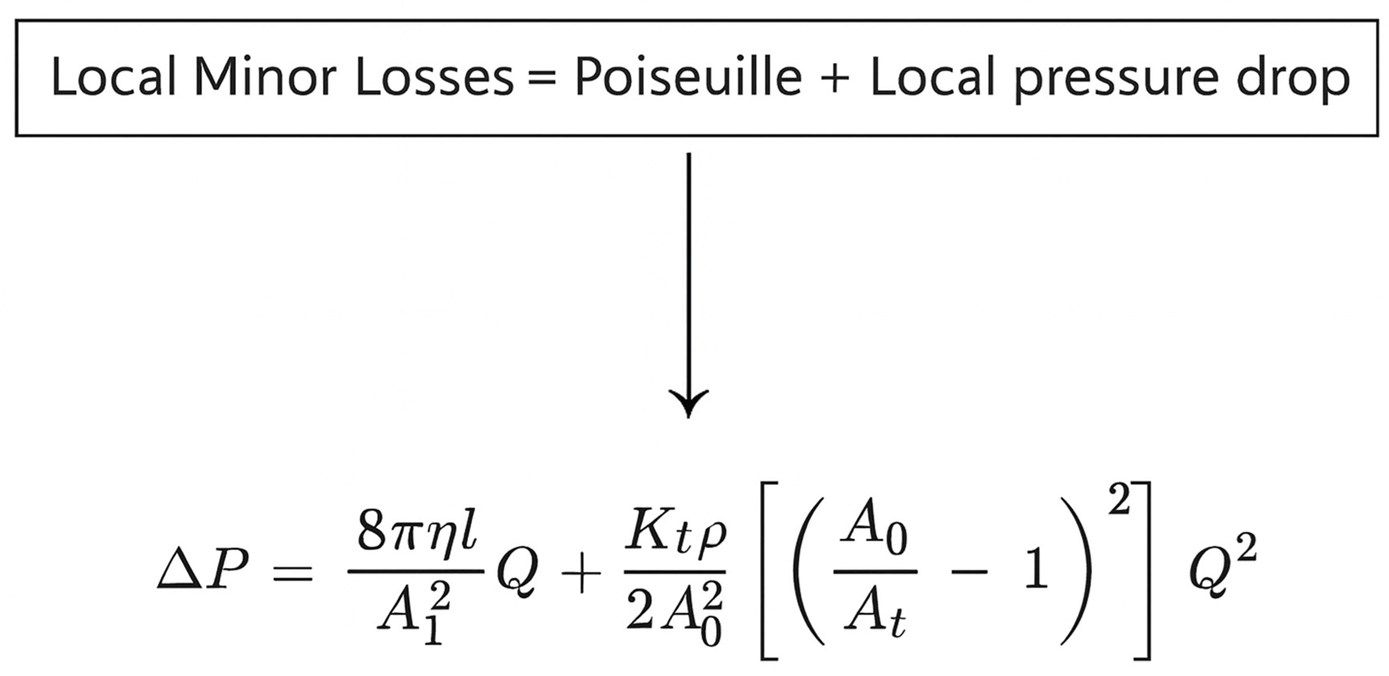
Equation 7: Local Minor Losses.
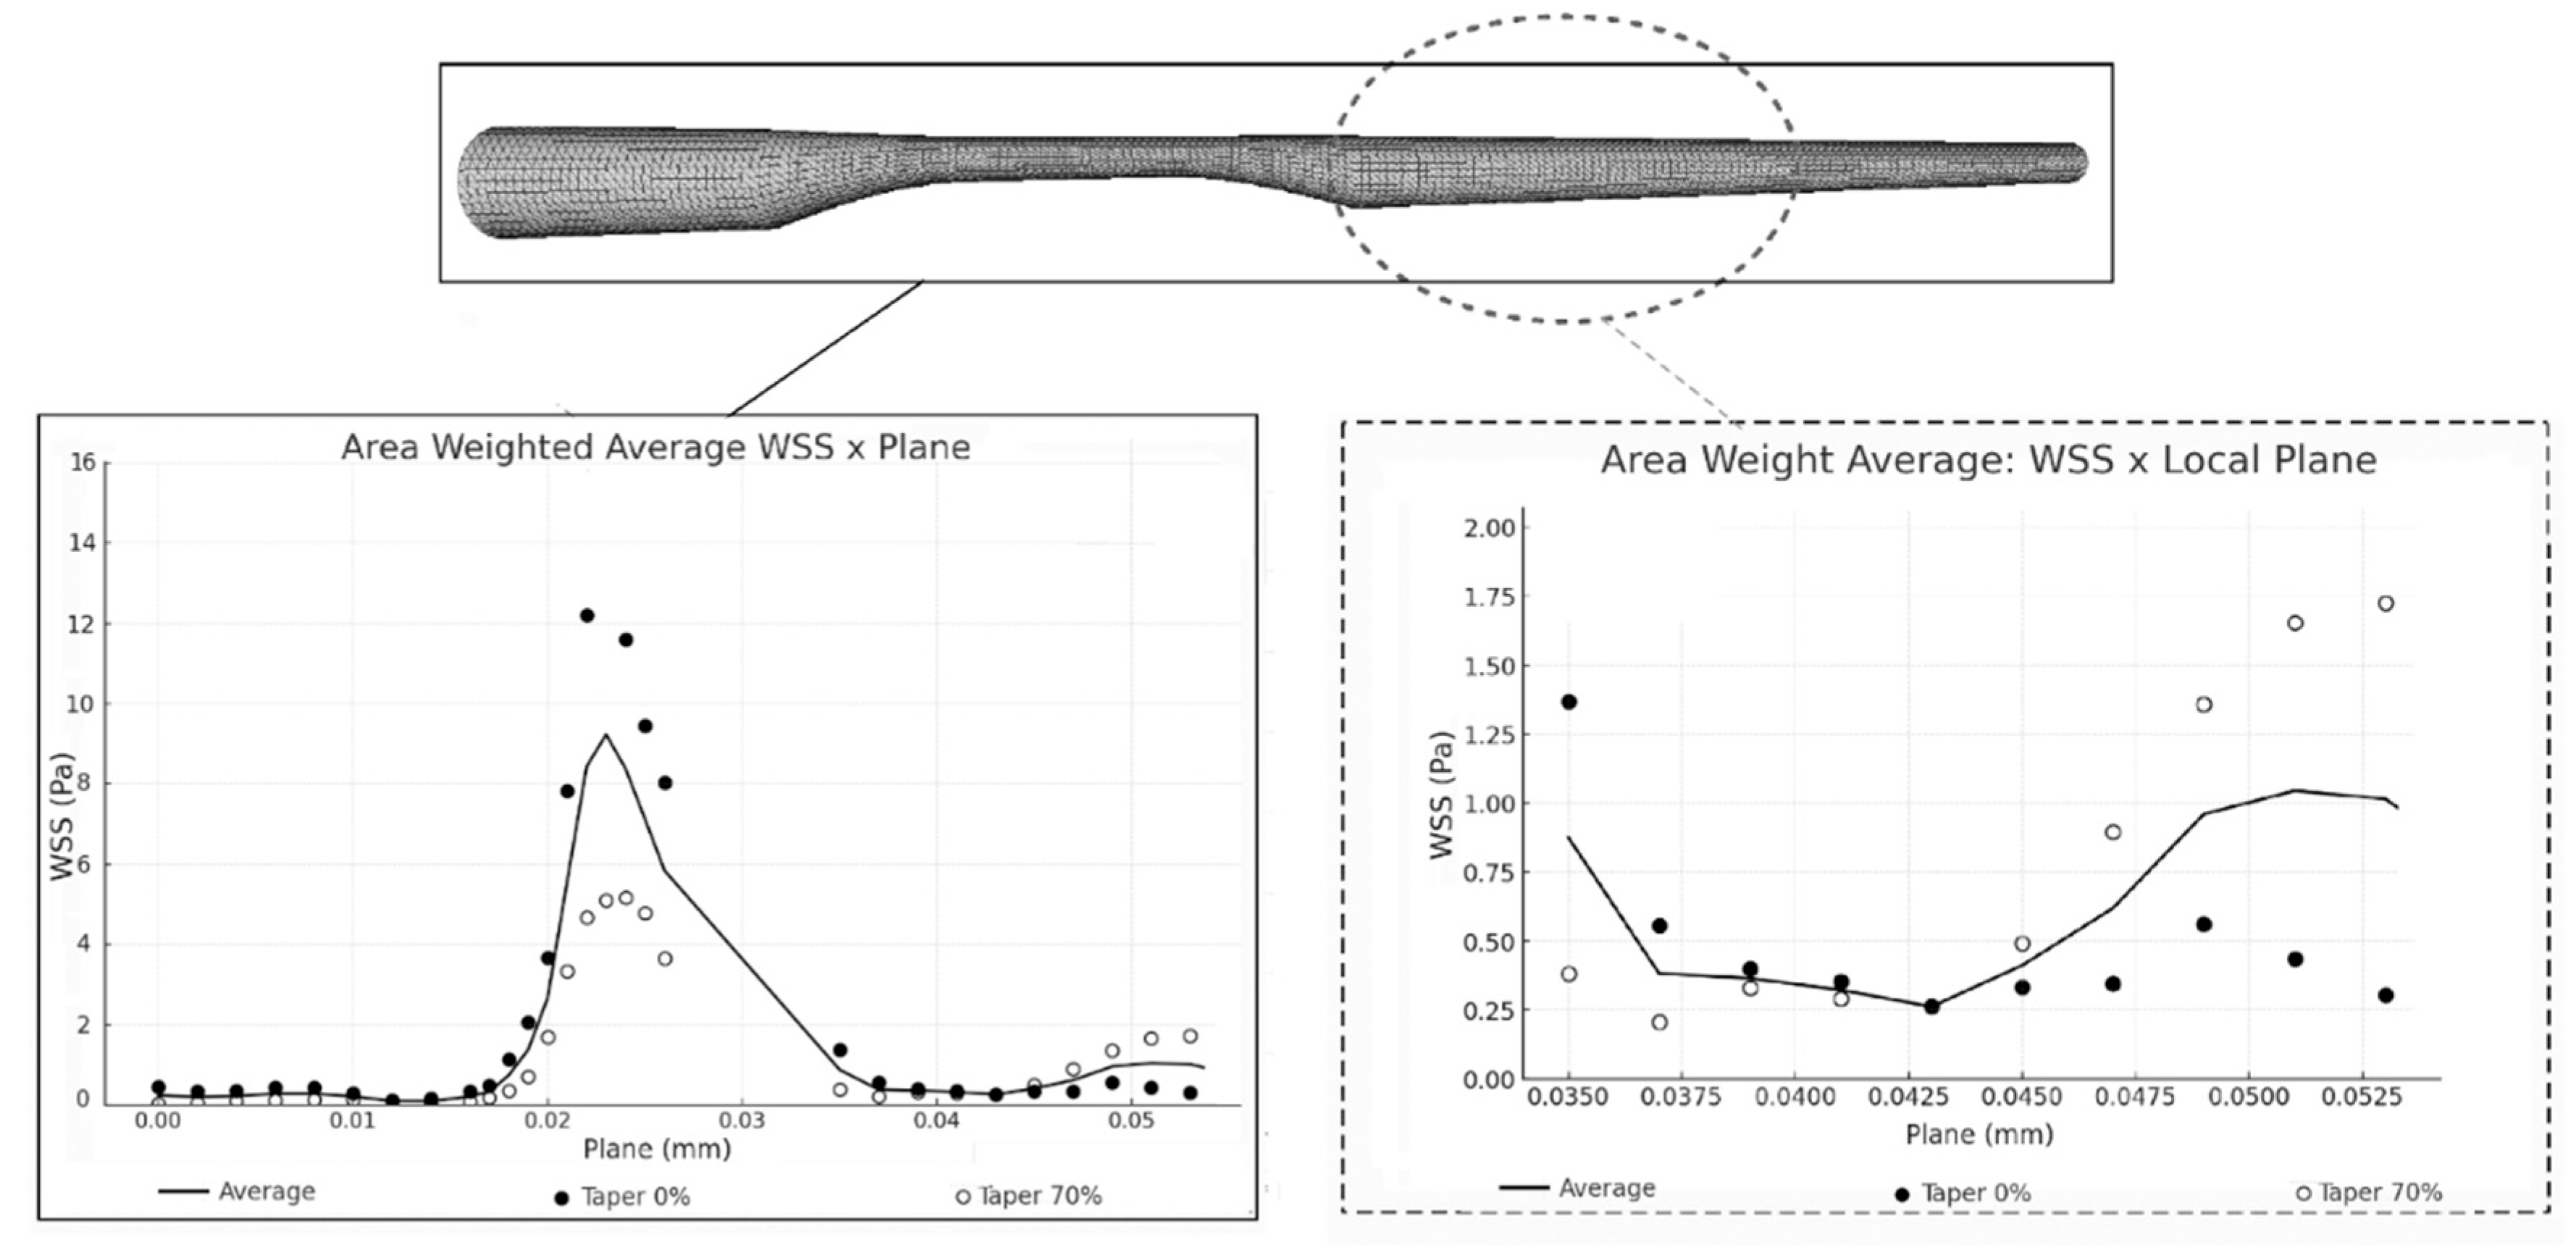
For simulate these effects, the average head loss associated with the WSS, measured using the Surface Integrals Area Weighted Average, confirms the previously reported theoretical results. Arteries subjected to the same inlet diameter, viscosity, and inlet pressure, but with different taper values, exhibit considerable variations in both the mean peak of the stenotic region and the behavior in sections without abrupt disturbances. In these regions without stenosis, geometries with higher taper exhibit rising average WSS, while in the absence of taper, the WSS tends to remain at a plateau or even decline.
Figure 4.
simulation analysis diagram: absolute values verified, important analysis locations, stress distribution field.
Figure 4.
simulation analysis diagram: absolute values verified, important analysis locations, stress distribution field.
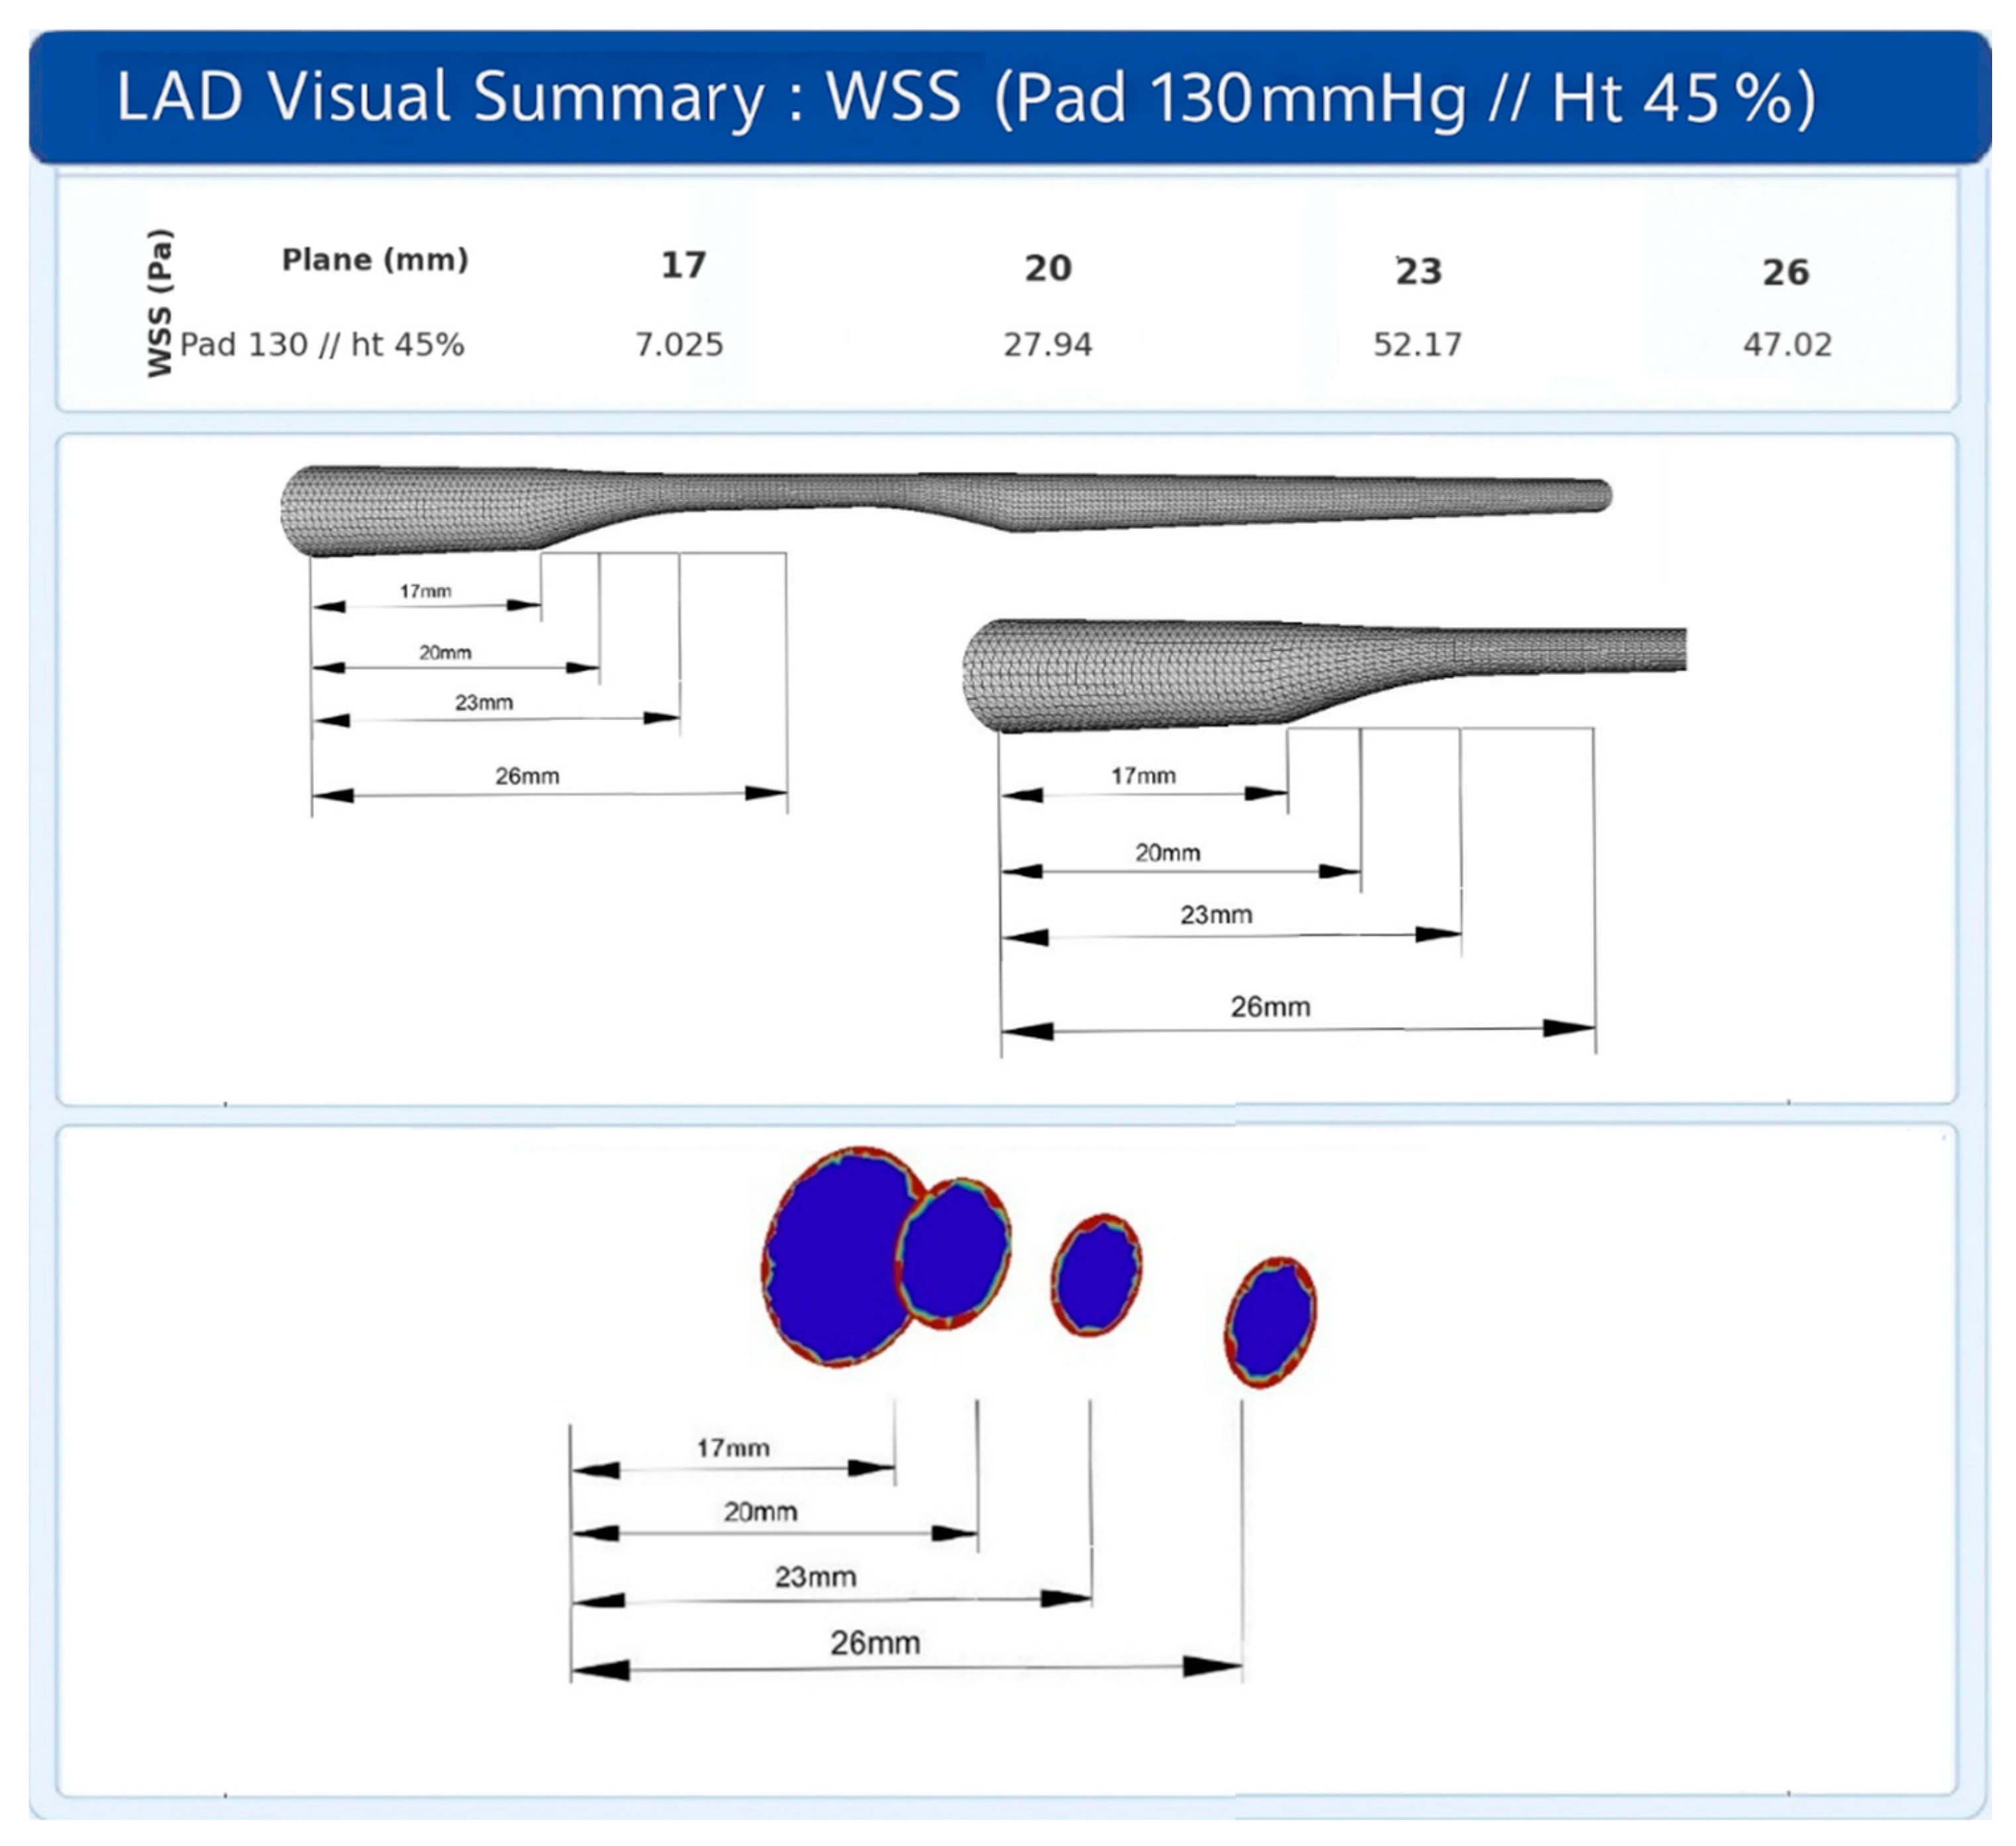
Figure 5.
Area Weighted Average WSS: simulation pattern represented as distributed and localized head loss along the artery.
Figure 5.
Area Weighted Average WSS: simulation pattern represented as distributed and localized head loss along the artery.
4.4. Biological Analysis and Future Clinical Applicability
In the field of biological analysis, parameters such as low-attenuation plaque, positive remodeling, thin cap, spotty calcifications, macrophage and napkin-ring sign have received increasing attention because they indicate plaques more prone to rupture when identified on imaging tests[57]. Additionally, cardiovascular risk prediction protocols in young adults4, such as the PDAY risk score (2022)[58], and noninvasive indirect findings, including epicardial adipose tissue[59] and lipoprotein(a) levels[4], have been proposed as screening tools for selecting patients for investigation, even in the absence of classic risk factors.
The eligibility of these patients converges with the GAP previously described in the literature on chronic and acute arterial disease, highlighting a specific profile composed of individuals with subclinical stenosis, without classic predictors of coronary artery disease, such as smoking or obesity, but with unstable plaques more susceptible to rupture. This spectrum of patients remains partially unattended by current screening methods, although it is already the focus of guidelines and recent studies[4].
4.5. Physical Analysis and Future Clinical Applicability
Understanding the different parameters and results obtained is essential to address the existing gap in the literature. For example, according to CFD simulations, two arteries with 50% plaque stenosis may exhibit different behaviors: one with a larger inlet diameter tends to generate greater WSS at the proximal edge of the plaque, while the other, with a more angular taper, distributes this WSS along the atheroma plateau, producing diffuse fragility (Graph 3). These findings, when suggested by CFD simulations, analyzed in vitro, and confirmed in vivo, will be able to support the development of neural network or deep learning algorithms capable of generating angiographic reports estimating WSS, enabling the individualization of atherosclerotic plaque treatment.
This individualization feature may, in the future, guide the decision between stent angioplasty and pharmacological therapy in subclinical atheroma plaques with FFR (fraction flow reserve) > 0.8—currently outside the scope of interventions—but which present structural fragility associated with high WSS. The goal is to early identify patients at risk of rupture and infarction even in the absence of anginal chest pain[60].
It is suggested that imaging examinations would be capable of identifying atheromatous plaques and, through specific neural networks, estimating the associated WSS be employed, thereby supporting more accurate decision-making regarding coronary interventions. This approach would not replace current methods, but would open a new category of analysis, reducing the exclusive reliance on clinical angina, percentage lumen obstruction, or FFR.
5. Conclusion
This study demonstrated, through computational fluid dynamics simulations, that small clinical and geometric variations in the coronary artery can significantly modify WSS patterns. Therefore, based on CFD simulation, FFR and percent stenosis alone may prove insufficient as rupture risk predictors for atherosclerotic plaques, since the same lesion can generate significant discrepancies in shear stress values depending on coronary geometry.
This suggests that the connection between a future, widely tested neural network for WSS estimates, coupled with biological knowledge of fragile atheroma plaques, apply to in vivo tests, would provide scientific support for hemodynamicists to make increasingly individualized clinical decisions, minimizing the risk of underestimating treatments in plaques that are subclinical from the point of view of percentual stenosis or FFR, but at high risk of rupture under shear stress, answering the current gap of the literature.
Author Contributions
Conceptualization: Mario H. Quim Ferreira, Valter Aragão do Nascimento and Johannes Gérson Janzen; methodology, Mario H. Quim Ferreira; software, Mario H. Quim Ferreira; validation, Mario H. Quim Ferreira, Valter Aragão do Nas-cimento and Johannes Gérson Janzen; formal analysis, Mario H. Quim Ferreira; investigation, Mario H. Quim Ferreira; resources, Mario H. Quim Ferreira; data curation, Mario H. Quim Ferreira; writing: Mario H. Quim Ferreira; writing (review and editing): Mario H. Quim Ferreira, Valter Aragão do Nascimento; visualization: Mario H. Quim Ferreira, Valter Aragão do Nascimento; supervision and review of simulations: Mario H. Quim Ferreira, Johannes Gérson Janzen; project administration, Mario H. Quim Ferreira. All authors have read and agreed to the published version of the manuscript.
Funding
This research was financially supported (financial assistance/ scholarship) by Coordenação de Aperfeiçoamento de Pessoal de Nível Superior-Brasil (CAPES)-Finance Code 001.
Data Availability Statement
The coronary artery mesh (RCA real) was obtained from Vukicevic et al. [34], Scientific Reports (2018), and is li-censed under Creative Commons Attribution 4.0 International (CC BY 4.0) Like described in "Rights and permissions". No modifications were made to public mesh sample, only simulated. Available repository link in original article [34]: https://github.com/ArsoVukicevic/X-Ray-Angio-data. DOI: https://doi.org/10.1038/s41598-018-19440-9.
Acknowledgments
The authors thank the Federal University of Mato Grosso do Sul, Faculty of Medicine and Engineering, for their scien-tific support.
Conflicts of Interest
The authors declare that they have no conflicts of interest. Specifically, they report no relationships with industry, commercial entities, or external funding sources that could have influenced the results of this study.
Abbreviations
The following abbreviations are used in this manuscript:
| AMI | acute myocardial infarction |
| CCP | coronary perfusion pressure |
| CFD | computational fluid dynamics |
| FFR | fraction flow reserve |
| Ht | hematocrit |
| LAD | left anterior descending |
| LCX | left circumflex artery |
| RCA | right coronary artery |
| RCAreal | real right coronary artery |
| WSS | wall shear stress |
References
- World Health Organization. Cardiovascular Diseases (CVDs). World Health Organization, 2025. https://www.who.int/news-room/fact-sheets/detail/cardiovascular-diseases-(cvds).
- Krittanawong, C.; Khawaja, M.; Tamis-Holland, J.E.; Girotra, S.; Rao, S.V. Acute Myocardial Infarction: Etiologies and Mimickers in Young Patients. J. Am. Hear. Assoc. 2023, 12, e029971. [Google Scholar] [CrossRef]
- Sama, C. , Santucci A., Mastroianni C., et al. Near-fatal acute myocardial infarction in a young patient. Cureus 2022, 14, e32994. [Google Scholar] [CrossRef]
- Cojocaru, P.A.; Țieranu, M.L.; Piorescu, M.T.L.; Buciu, I.C.; Belu, A.M.; Cureraru, S.I.; Țieranu, E.N.; Moise, G.C.; Istratoaie, O. Myocardical Infarction in Young Adults: Revisiting Risk Factors and Atherothrombotic Pathways. Medicina 2025, 61, 1615. [Google Scholar] [CrossRef]
- Ekmejian, A.A.; Carpenter, H.J.; Ciofani, J.L.; Gray, B.H.M.; Allahwala, U.K.; Ward, M.; Escaned, J.; Psaltis, P.J.; Bhindi, R. Advances in the Computational Assessment of Disturbed Coronary Flow and Wall Shear Stress: A Contemporary Review. J. Am. Hear. Assoc. 2024, 13, e037129. [Google Scholar] [CrossRef]
- Tasouli-Drakou, V.; Ogurek, I.; Shaikh, T.; Ringor, M.; DiCaro, M.V.; Lei, K. Atherosclerosis: A Comprehensive Review of Molecular Factors and Mechanisms. Int. J. Mol. Sci. 2025, 26, 1364. [Google Scholar] [CrossRef]
- Ajoolabady, A.; Pratico, D.; Lin, L.; Mantzoros, C.S.; Bahijri, S.; Tuomilehto, J.; Ren, J. Inflammation in atherosclerosis: pathophysiology and mechanisms. Cell Death Dis. 2024, 15, 817. [Google Scholar] [CrossRef]
- Wang, L.; Zhu, Y.; Zhao, C.; Maehara, A.; Lv, R.; Guo, X.; Yang, M.; Mintz, G.S.; Tang, D.; Jia, H.; et al. Role of biomechanical factors in plaque rupture and erosion: insight from intravascular imaging based computational modeling. npj Cardiovasc. Heal. 2025, 2, 1–11. [Google Scholar] [CrossRef]
- Park, D.-W.; Kim, H.; Singh, A.; Brown, D.L. Prophylactic stenting of vulnerable plaques: pros and cons. EuroIntervention 2024, 20, e278–e280. [Google Scholar] [CrossRef] [PubMed]
- Wang, Z.; Zhang, P. Novel imaging modalities for the identification of vulnerable plaques. Front. Cardiovasc. Med. 2024, 11, 1450252. [Google Scholar] [CrossRef] [PubMed]
- Yang, Y.; Song, Y.; Mu, X. The Role of Fluid Mechanics in Coronary Atherosclerotic Plaques: An Up-to-Date Review. Rev. Cardiovasc. Med. 2024, 25, 49. [Google Scholar] [CrossRef]
- Zhao, C.; Lv, R.; Maehara, A.; Wang, L.; Gao, Z.; Xu, Y.; Guo, X.; Zhu, Y.; Huang, M.; Zhang, X.; et al. Plaque Ruptures Are Related to High Plaque Stress and Strain Conditions: Direct Verification by Using In Vivo OCT Rupture Data and FSI Models. Arter. Thromb. Vasc. Biol. 2024, 44, 1617–1627. [Google Scholar] [CrossRef]
- Cho, M.; Park, J.-K. Modular 3D In Vitro Artery-Mimicking Multichannel System for Recapitulating Vascular Stenosis and Inflammation. Micromachines 2021, 12, 1528. [Google Scholar] [CrossRef] [PubMed]
- Wang, H.; Song, H.; Yang, Y.; Cao, Q.; Hu, Y.; Chen, J.; Guo, J.; Wang, Y.; Jia, D.; Cao, S.; et al. Three-dimensional printing for cardiovascular diseases: from anatomical modeling to dynamic functionality. Biomed. Eng. Online 2020, 19, 76. [Google Scholar] [CrossRef]
- Kim, S.; Jing, B.; Lane, B.A.; Tempestti, J.M.; Padala, M.; Veneziani, A.; Lindsey, B.D. Dynamic Coronary Blood Flow Velocity and Wall Shear Stress Estimation Using Ultrasound in an Ex Vivo Porcine Heart. Cardiovasc. Eng. Technol. 2023, 15, 65–76. [Google Scholar] [CrossRef] [PubMed]
- Tufaro, V.; Torii, R.; Erdogan, E.; Kitslaar, P.; Koo, B.-K.; Rakhit, R.; Karamasis, G.V.; Costa, C.; Serruys, P.; Jones, D.A.; et al. An automated software for real-time quantification of wall shear stress distribution in quantitative coronary angiography data. Int. J. Cardiol. 2022, 357, 14–19. [Google Scholar] [CrossRef]
- Gauer, R. Severe Asymptomatic Hypertension: Evaluation and Treatment. Am. Fam. Physician 2017, 95, 492–500. [Google Scholar]
- Böhm, M.; Schumacher, H.; Teo, K.K.; Lonn, E.; Mahfoud, F.; E Mann, J.F.; Mancia, G.; Redon, J.; Schmieder, R.; Weber, M.; et al. Achieved diastolic blood pressure and pulse pressure at target systolic blood pressure (120–140 mmHg) and cardiovascular outcomes in high-risk patients: results from ONTARGET and TRANSCEND trials. Eur. Hear. J. 2018, 39, 3105–3114. [Google Scholar] [CrossRef]
- Hsieh, M.-J.; Chen, C.-C.; Chen, D.-Y.; Lee, C.-H.; Ho, M.-Y.; Yeh, J.-K.; Huang, Y.-C.; Lu, Y.-Y.; Chang, C.-Y.; Wang, C.-Y.; et al. Risk Stratification by Coronary Perfusion Pressure in Left Ventricular Systolic Dysfunction Patients Undergoing Revascularization: A Propensity Score Matching Analysis. Front. Cardiovasc. Med. 2022, 9, 860346. [Google Scholar] [CrossRef]
- Kim, H.J.; Vignon-Clementel, I.E.; Coogan, J.S.; Figueroa, C.A.; Jansen, K.E.; Taylor, C.A. Patient-Specific Modeling of Blood Flow and Pressure in Human Coronary Arteries. Ann. Biomed. Eng. 2010, 38, 3195–3209. [Google Scholar] [CrossRef]
- Spaan, J.A. Coronary diastolic pressure-flow relation and zero flow pressure explained on the basis of intramyocardial compliance. Circ. Res. 1985, 56, 293–309. [Google Scholar] [CrossRef] [PubMed]
- Stegehuis, V.E.; Wijntjens, G.W.; Piek, J.J.; van de Hoef, T.P. Fractional Flow Reserve or Coronary Flow Reserve for the Assessment of Myocardial Perfusion: implications of FFR as an imperfect reference standard for myocardial ischemia. Curr. Cardiol. Rep. 2018, 20, 77. [Google Scholar] [CrossRef] [PubMed]
- Geng, Y.; Liu, H.; Wang, X.; Zhang, J.; Gong, Y.; Zheng, D.; Jiang, J.; Xia, L. Effect of microcirculatory dysfunction on coronary hemodynamics: A pilot study based on computational fluid dynamics simulation. Comput. Biol. Med. 2022, 146, 105583. [Google Scholar] [CrossRef] [PubMed]
- Gong, Y.; Feng, Y.; Yi, T.; Yang, F.; Li, Y.; Zhang, L.; Zheng, B.; Hong, T.; Liu, Z.; Huo, Y.; et al. Coronary Angiography-Derived Diastolic Pressure Ratio. Front. Bioeng. Biotechnol. 2020, 8, 596401. [Google Scholar] [CrossRef]
- Zhao, Y. , Ping J., Yu X., et al. Fractional flow reserve-based 4D hemodynamic simulation of time-resolved blood flow in left anterior descending coronary artery. Clin. Biomech. 2019, 70, 164–169. [Google Scholar] [CrossRef]
- Westerhof, N.; Stergiopulos, N.; Noble, M.I.; Westerhof, B.E. Snapshots of Hemodynamics: An Aid for Clinical Research and Graduate Education, 3rd ed.; Springer Nature: Durham, NC, United States, 2019. [Google Scholar] [CrossRef]
- Khan, P.M.; Sharma, S.D.; Chakraborty, S.; Roy, S. Effects of hematocrit levels on flow structures and stress levels in the healthy and diseased carotid arteries. Phys. Fluids 2024, 36, 011907. [Google Scholar] [CrossRef]
- Nogourani, Z.S.; Alizadeh, A.; Salman, H.M.; Al-Musawi, T.J.; Pasha, P.; Waqas, M.; Ganji, D.D. Numerical investigation of the effect of changes in blood viscosity on parameters hemodynamic blood flow in the left coronary artery with consideration capturing fluid–solid interaction. Alex. Eng. J. 2023, 77, 369–381. [Google Scholar] [CrossRef]
- Boutsianis, E.; Dave, H.; Frauenfelder, T.; Poulikakos, D.; Wildermuth, S.; Turina, M.; Ventikos, Y.; Zund, G. Computational simulation of intracoronary flow based on real coronary geometry☆. Eur. J. Cardio-Thoracic Surg. 2004, 26, 248–256. [Google Scholar] [CrossRef] [PubMed]
- Candreva, A.; De Nisco, G.; Rizzini, M.L.; D’ascenzo, F.; De Ferrari, G.M.; Gallo, D.; Morbiducci, U.; Chiastra, C. Current and Future Applications of Computational Fluid Dynamics in Coronary Artery Disease. Rev. Cardiovasc. Med. 2022, 23, 377. [Google Scholar] [CrossRef]
- Ho, N.N.; Lee, K.Y.; Lee, S.-W. Uncertainty quantification of computational fluid dynamics-based predictions for fractional flow reserve and wall shear stress of the idealized stenotic coronary. Front. Cardiovasc. Med. 2023, 10, 1164345. [Google Scholar] [CrossRef]
- Dodge, J.J.T.; Brown, B.G.; Bolson, E.L.; Dodge, H.T. Lumen diameter of normal human coronary arteries. Influence of age, sex, anatomic variation, and left ventricular hypertrophy or dilation. Circulation 1992, 86, 232–246. [Google Scholar] [CrossRef]
- Wentzel, J.J. , Gijsen F.J.H., van der Giessen R.J., et al. Positive remodeling at 3-year follow up is associated with plaque-free coronary wall segment at baseline: a serial IVUS study. Atherosclerosis 2014; 236, 82–90. [Google Scholar] [CrossRef]
- Vukicevic, A.M.; Çimen, S.; Jagic, N.; Jovicic, G.; Frangi, A.F.; Filipovic, N. Three-dimensional reconstruction and NURBS-based structured meshing of coronary arteries from the conventional X-ray angiography projection images. Sci. Rep. 2018, 8, 1711. [Google Scholar] [CrossRef]
- Bergström, G.; Persson, M.; Adiels, M.; Björnson, E.; Bonander, C.; Ahlström, H.; Alfredsson, J.; Angerås, O.; Berglund, G.; Blomberg, A.; et al. Prevalence of Subclinical Coronary Artery Atherosclerosis in the General Population. Circulation 2021, 144, 916–929. [Google Scholar] [CrossRef]
- Zoghbi, W.A.; Flachskampf, F.A.; Quinones, M.A. Textbook of Clinical Hemodynamics, 2nd ed.; Elsevier: Philadelphia, PA, USA, 2018. [Google Scholar]
- Sacchetti, M. “A comparative analysis of transient and steady-state CFD simulations in coronary arteries.” Politecnico di Torino; 2020.
- Schrauwen, J.T.C.; Karanasos, A.; van Ditzhuijzen, N.S.; Aben, J.-P.; van der Steen, A.F.W.; Wentzel, J.J.; Gijsen, F.J.H. Influence of the Accuracy of Angiography-Based Reconstructions on Velocity and Wall Shear Stress Computations in Coronary Bifurcations: A Phantom Study. PLOS ONE 2015, 10, e0145114. [Google Scholar] [CrossRef]
- European Society of Cardiology. 2023 ESC Guidelines for the management of acute coronary syndromes (ACS). ESC Clinical Practice Guidelines. 2023.
- Samady, H.; Molony, D.S.; Coskun, A.U.; Varshney, A.S.; De Bruyne, B.; Stone, P.H. Risk stratification of coronary plaques using physiologic characteristics by CCTA: Focus on shear stress. J. Cardiovasc. Comput. Tomogr. 2019, 14, 386–393. [Google Scholar] [CrossRef] [PubMed]
- Kumar, A.; Hung, O.Y.; Piccinelli, M.; Eshtehardi, P.; Corban, M.T.; Sternheim, D.; Yang, B.; Lefieux, A.; Molony, D.S.; Thompson, E.W.; et al. Low Coronary Wall Shear Stress Is Associated With Severe Endothelial Dysfunction in Patients With Nonobstructive Coronary Artery Disease. JACC: Cardiovasc. Interv. 2018, 11, 2072–2080. [Google Scholar] [CrossRef] [PubMed]
- Hartman, E.M.J.; De Nisco, G.; Gijsen, F.J.H.; Korteland, S.-A.; van der Steen, A.F.W.; Daemen, J.; Wentzel, J.J. The definition of low wall shear stress and its effect on plaque progression estimation in human coronary arteries. Sci. Rep. 2021, 11, 21757. [Google Scholar] [CrossRef] [PubMed]
- Garcha, A.; Gutiérrez, N.G. Sensitivity of coronary hemodynamics to vascular structure variations in health and disease. Sci. Rep. 2025, 15, 3325. [Google Scholar] [CrossRef]
- Bourantas, C.V.; Zanchin, T.; Torii, R.; Serruys, P.W.; Karagiannis, A.; Ramasamy, A.; Safi, H.; Coskun, A.U.; Koning, G.; Onuma, Y.; et al. Shear Stress Estimated by Quantitative Coronary Angiography Predicts Plaques Prone to Progress and Cause Events. JACC: Cardiovasc. Imaging 2020, 13, 2206–2219. [Google Scholar] [CrossRef]
- Herrero, M.V.O. , Wutzow W.W., Costa A.M.S. Modelagem, simulação e análise de esforços hemodinâmicos em um vaso sanguíneo com aterosclerose. In: Anais do XI EPCC – Encontro Internacional de Produção Científica. Maringá (PR): UniCesumar; 2019. ISSN 2594-4991. ISBN 978-85-459-1960-5.
- Alamir, S.H.; Tufaro, V.; Trilli, M.; Kitslaar, P.; Mathur, A.; Baumbach, A.; Jacob, J.; Bourantas, C.V.; Torii, R. Rapid prediction of wall shear stress in stenosed coronary arteries based on deep learning. Front. Bioeng. Biotechnol. 2024, 12, 1360330. [Google Scholar] [CrossRef]
- Hoogen, I.J.v.D.; Schultz, J.; Kuneman, J.H.; A de Graaf, M.; Kamperidis, V.; Broersen, A.; Jukema, J.W.; Sakellarios, A.; Nikopoulos, S.; Kyriakidis, S.; et al. Detailed behaviour of endothelial wall shear stress across coronary lesions from non-invasive imaging with coronary computed tomography angiography. Eur. Hear. J. - Cardiovasc. Imaging 2022, 23, 1708–1716. [Google Scholar] [CrossRef]
- De Nisco, G.; Rizzini, M.L.; Verardi, R.; Chiastra, C.; Candreva, A.; De Ferrari, G.; D'Ascenzo, F.; Gallo, D.; Morbiducci, U. Modelling blood flow in coronary arteries: Newtonian or shear-thinning non-Newtonian rheology? Comput. Methods Programs Biomed. 2023, 242, 107823. [Google Scholar] [CrossRef]
- Russo, G. , Pedicino D., Chiastra C., et al. Coronary artery plaque rupture and erosion: role of wall shear stress profiling and biological patterns in acute coronary syndromes. Int. J. Cardiol. 2023, 370, 356–365. [Google Scholar] [CrossRef]
- Xie, J.; Cao, H.; Jin, D.; Wang, Y.; Li, X.; Budoff, M.; Jiang, H.; Ren, J. Correlation analysis of hematocrit level and coronary heart disease in patients with chest pain: a case-control study. J. Thorac. Dis. 2025, 17, 2492–2502. [Google Scholar] [CrossRef] [PubMed]
- Sorlie, P.D.; Garcia-Palmieri, M.R.; Costas, R.; Havlik, R.J. Hematocrit and risk of coronary heart disease: the Puerto Rico Heart Health Program. Am. Hear. J. 1981, 101, 456–461. [Google Scholar] [CrossRef] [PubMed]
- Lindsey, S.E.; Butcher, J.T.; Vignon-Clementel, I.E. Cohort-based multiscale analysis of hemodynamic-driven growth and remodeling of the embryonic pharyngeal arch arteries. Development 2018, 145, dev162578. [Google Scholar] [CrossRef]
- Reneman, R.S.; Hoeks, A.P.G. Wall shear stress as measured in vivo: consequences for the design of the arterial system. Med Biol. Eng. Comput. 2008, 46, 499–507. [Google Scholar] [CrossRef]
- Joyner, M.J.; Casey, D.P. Regulation of Increased Blood Flow (Hyperemia) to Muscles During Exercise: A Hierarchy of Competing Physiological Needs. Physiol. Rev. 2015, 95, 549–601. [Google Scholar] [CrossRef]
- Manton, M.J. Low Reynolds number flow in slowly varying axisymmetric tubes. J. Fluid Mech. 1971, 49, 451–459. [Google Scholar] [CrossRef]
- Microvascular Research. Flow resistance. In: Topics in Medicine & Dentistry. Elsevier; 2007. https://www.sciencedirect.com/topics/medicine-and-dentistry/flow-resistancee.
- Dawson, L.P.; Layland, J. High-Risk Coronary Plaque Features: A Narrative Review. Cardiol. Ther. 2022, 11, 319–335. [Google Scholar] [CrossRef] [PubMed]
- Nerlekar, N.; Brown, A.J.; Muthalaly, R.G.; Talman, A.; Hettige, T.; Cameron, J.D.; Wong, D.T.L. Association of Epicardial Adipose Tissue and High-Risk Plaque Characteristics: A Systematic Review and Meta-Analysis. J. Am. Hear. Assoc. 2017, 6, e006379. [Google Scholar] [CrossRef] [PubMed]
- Kwok, C.S.; Bennett, S.; Holroyd, E.; Satchithananda, D.; Borovac, J.A.; Will, M.; Schwarz, K.; Lip, G.Y.H. Characteristics and outcomes of patients with acute coronary syndrome who present with atypical symptoms: a systematic review, pooled analysis and meta-analysis. Coron. Artery Dis. 2024, 36, 240–251. [Google Scholar] [CrossRef] [PubMed]
Figure 1.
viscosity and density as a function of hematocrit variations. (A) Density as a function of Ht is widely reported; however, the values for ρbc and ρp vary somewhat across the literature. In this study, we adopted values cited in more than one publication.(B) The formula for viscosity as a function of Ht also varies in the literature, with differences depending on whether the fluid is modeled as Newtonian or non-Newtonian. Here, was adopted a formulation consistent with a previous CFD study. Ht = hematocrit; ρbc = red blood cell density; ρb = blood density; ρp = plasma density; cP = centipoise.
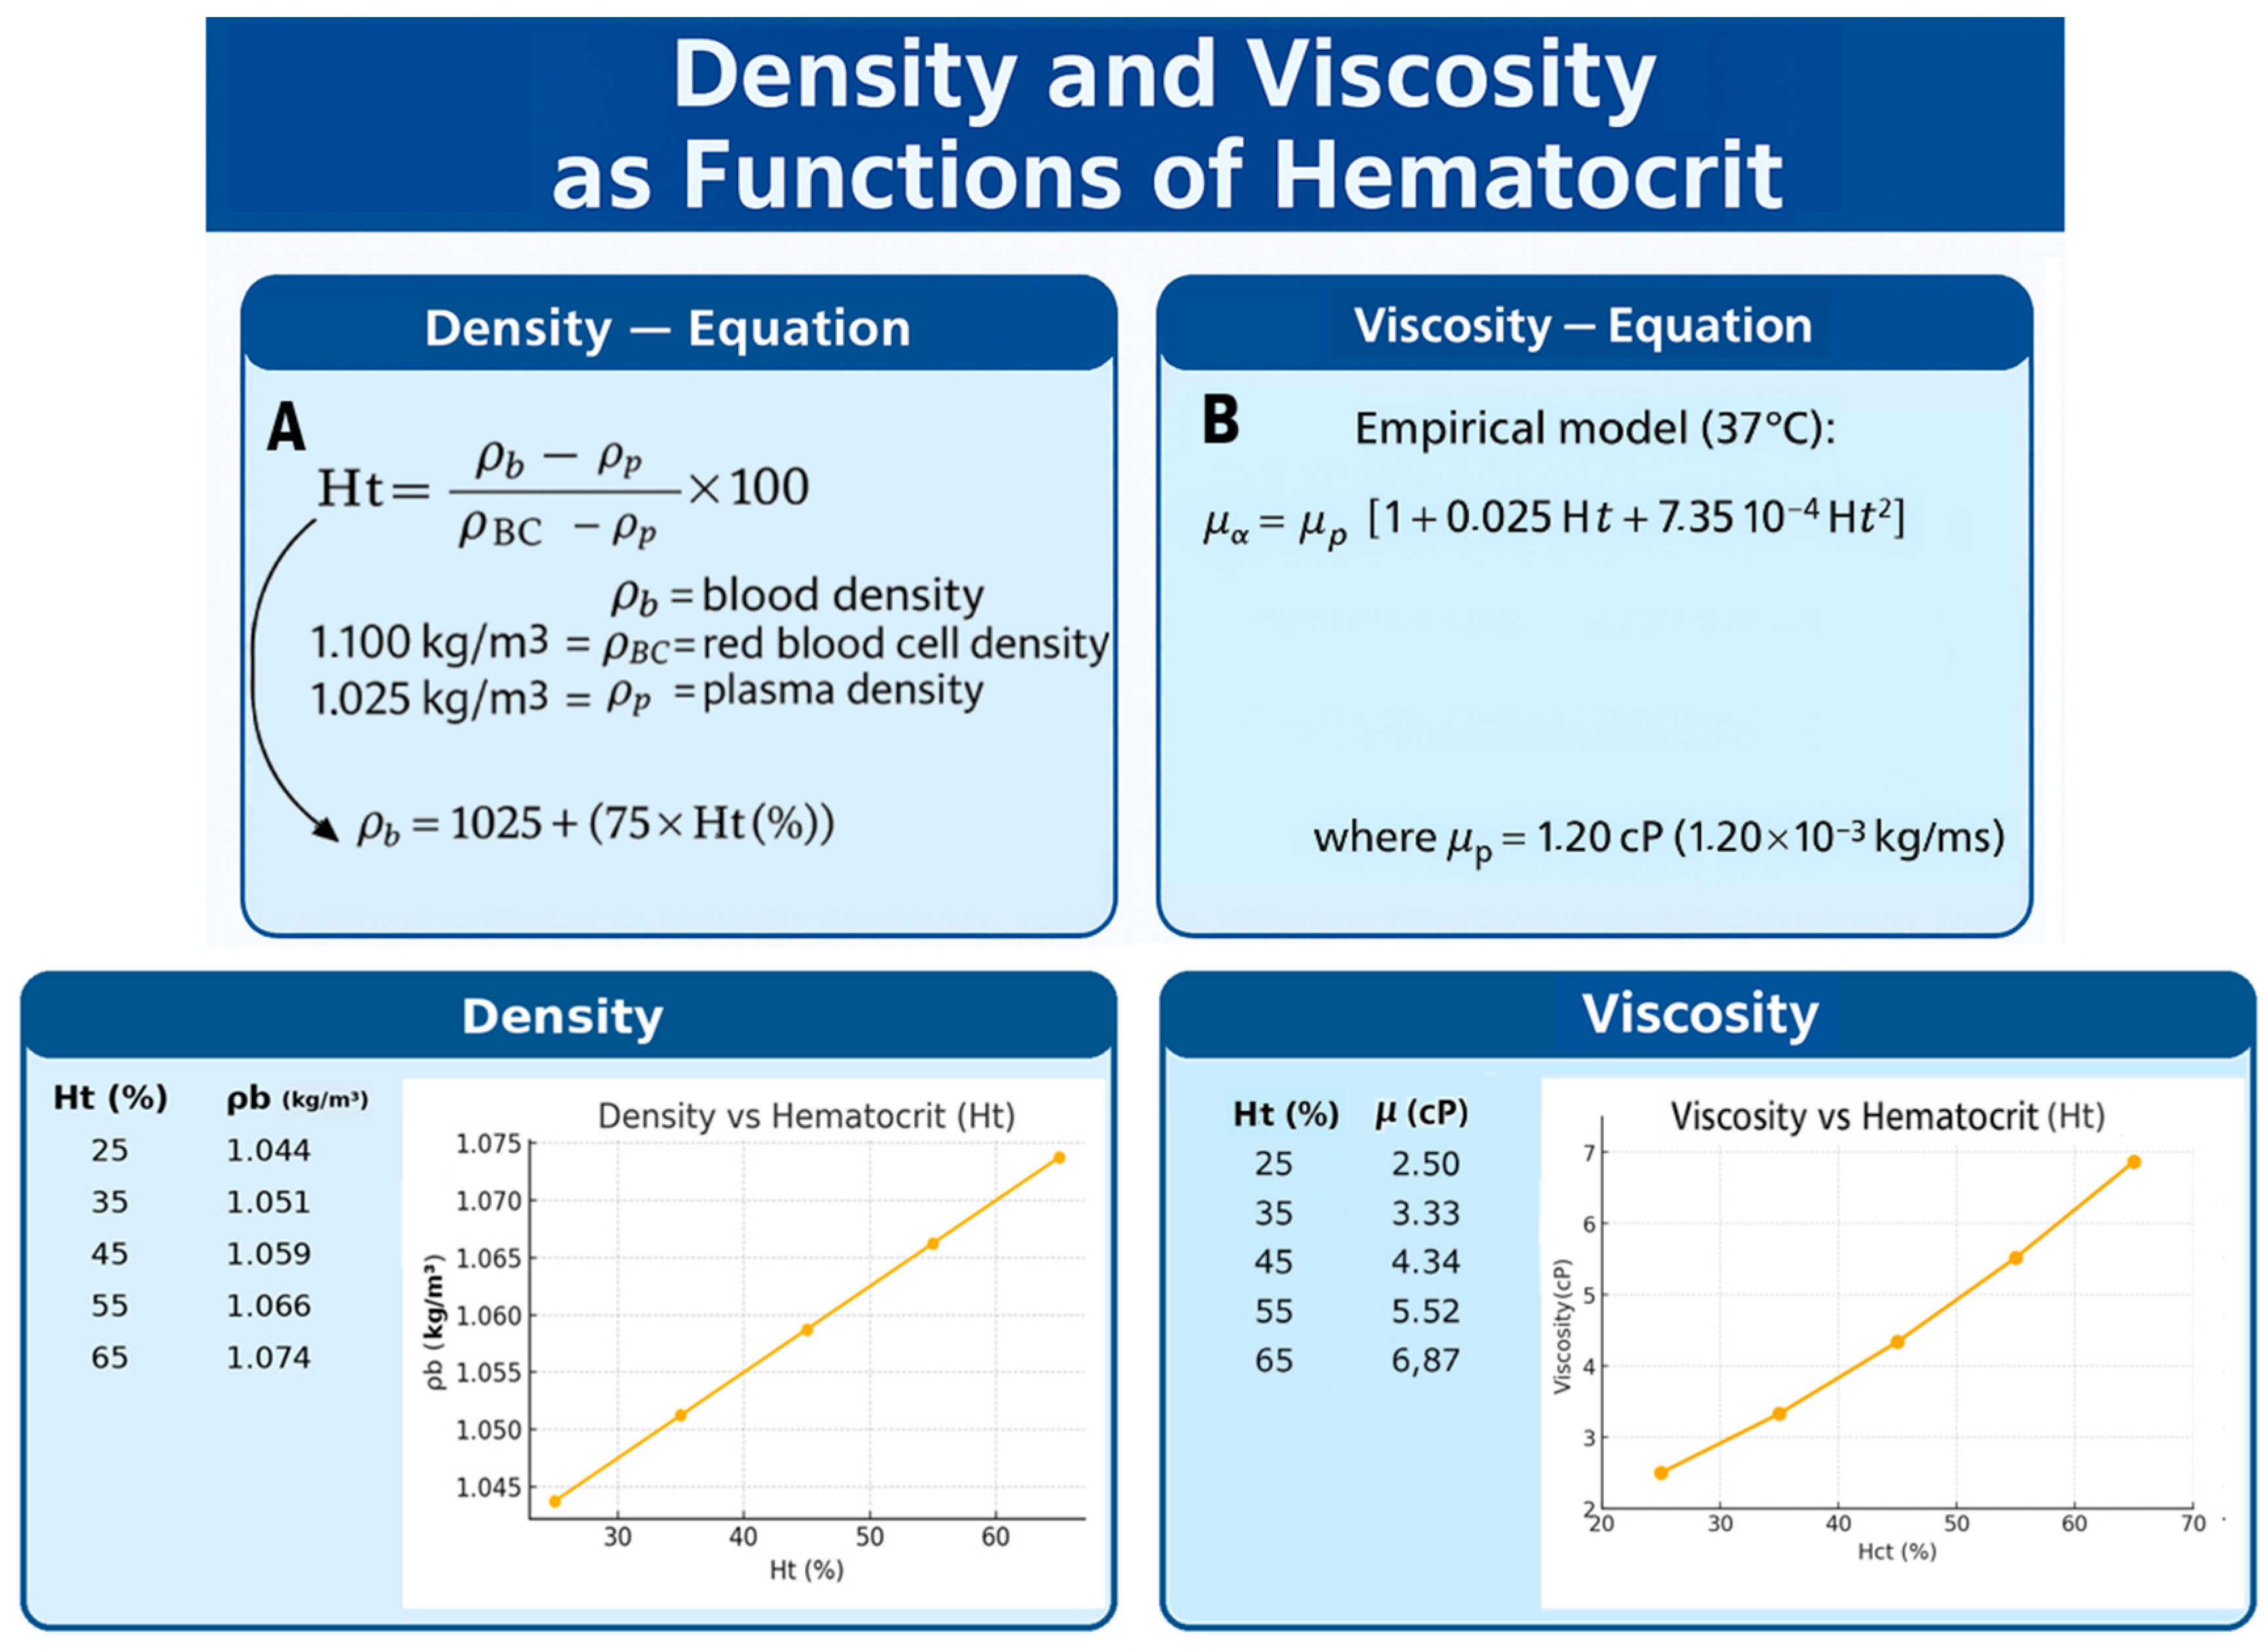
Figure 2.
Proposed variations in the studied geometries. LAD = left anterior descending coronary artery; RCA = right coronary artery; LCX = left circumflex coronary artery.
Figure 2.
Proposed variations in the studied geometries. LAD = left anterior descending coronary artery; RCA = right coronary artery; LCX = left circumflex coronary artery.
Graph 1.
WSS variation as a function of hematocrit across different arterial models.( A) LAD; (B) LCX; (C) RCA; (D) Real RCA.
Graph 1.
WSS variation as a function of hematocrit across different arterial models.( A) LAD; (B) LCX; (C) RCA; (D) Real RCA.
Graph 2.
WSS values along the stenosis under different pressure inputs. (A) corresponds to the idealized LAD model; (B) represents the real RCA.
Graph 2.
WSS values along the stenosis under different pressure inputs. (A) corresponds to the idealized LAD model; (B) represents the real RCA.
Graph 3.
WSS variation under identical Ht and diastolic pressure (PAd) across different geometries.
Graph 4.
WSS variation across different coronary diameters.
Graph 5.
WSS variation in different coronary narrowings.
Graph 6.
WSS variation at different stenosis onset locations.
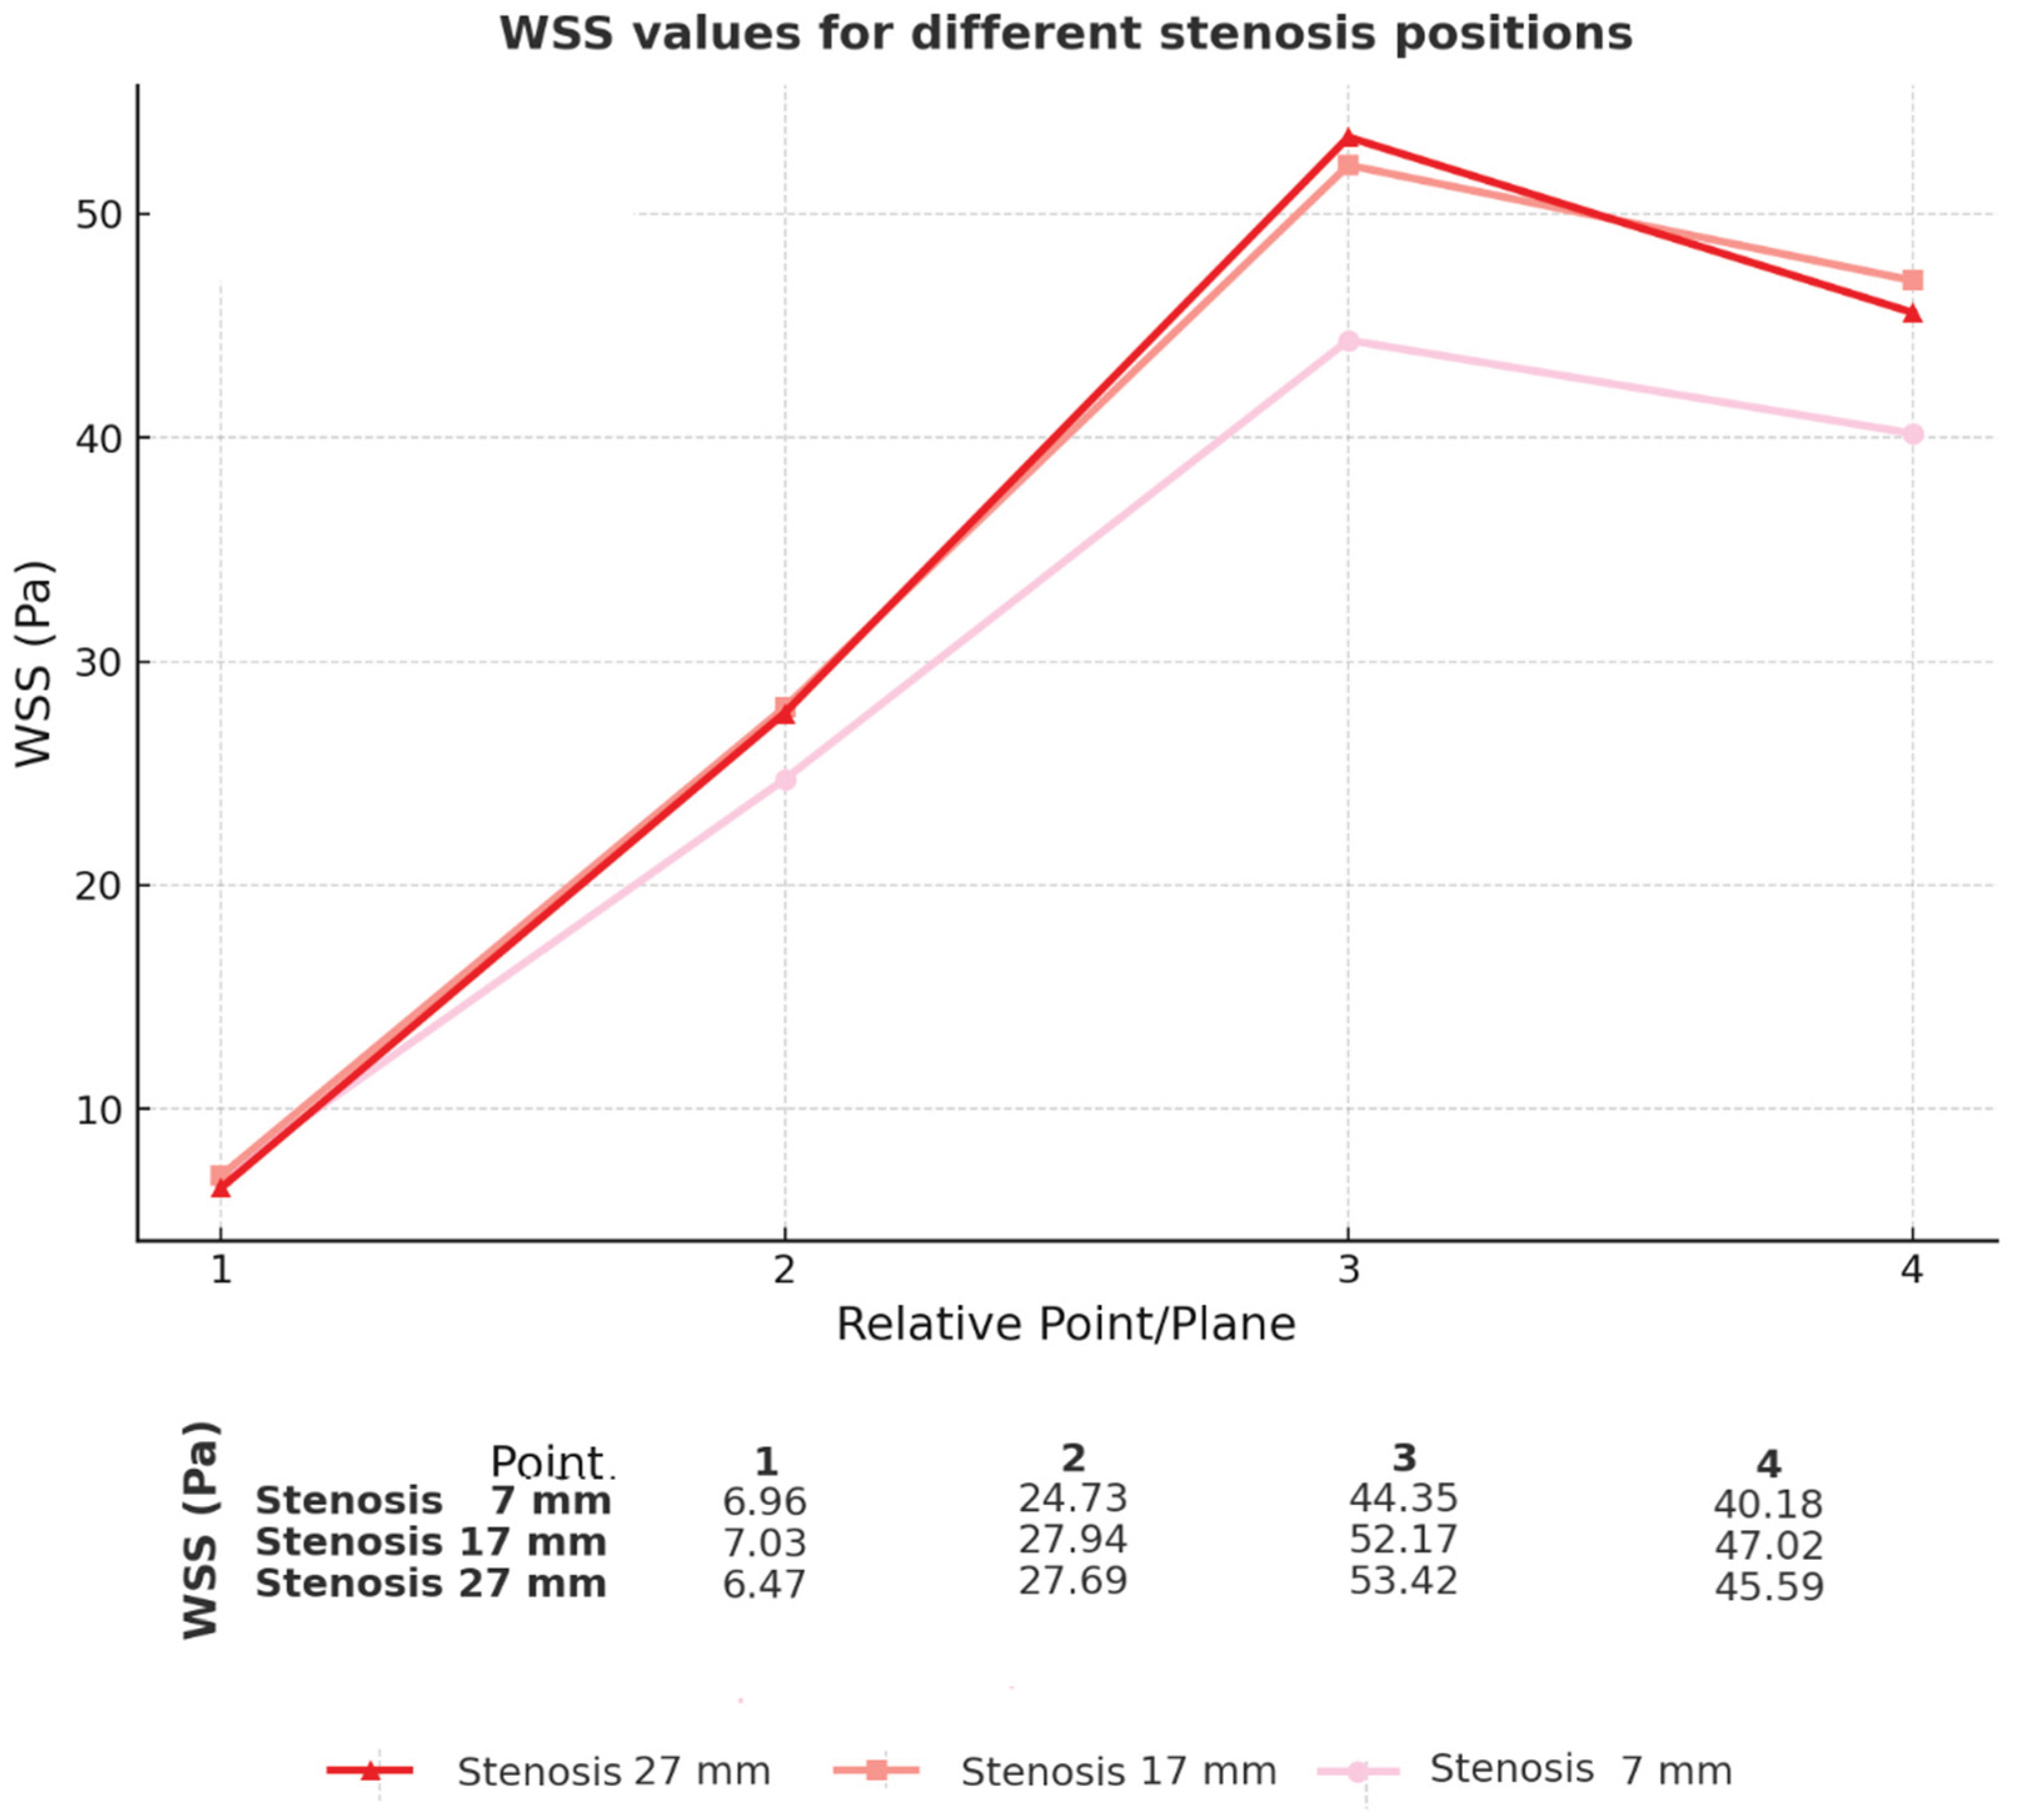
Figure 3.
Schematic diagram in fluid mechanics for theoretical basis, represented in wireframe of idealized coronary mesh, compared with conventional engineering models.
Figure 3.
Schematic diagram in fluid mechanics for theoretical basis, represented in wireframe of idealized coronary mesh, compared with conventional engineering models.
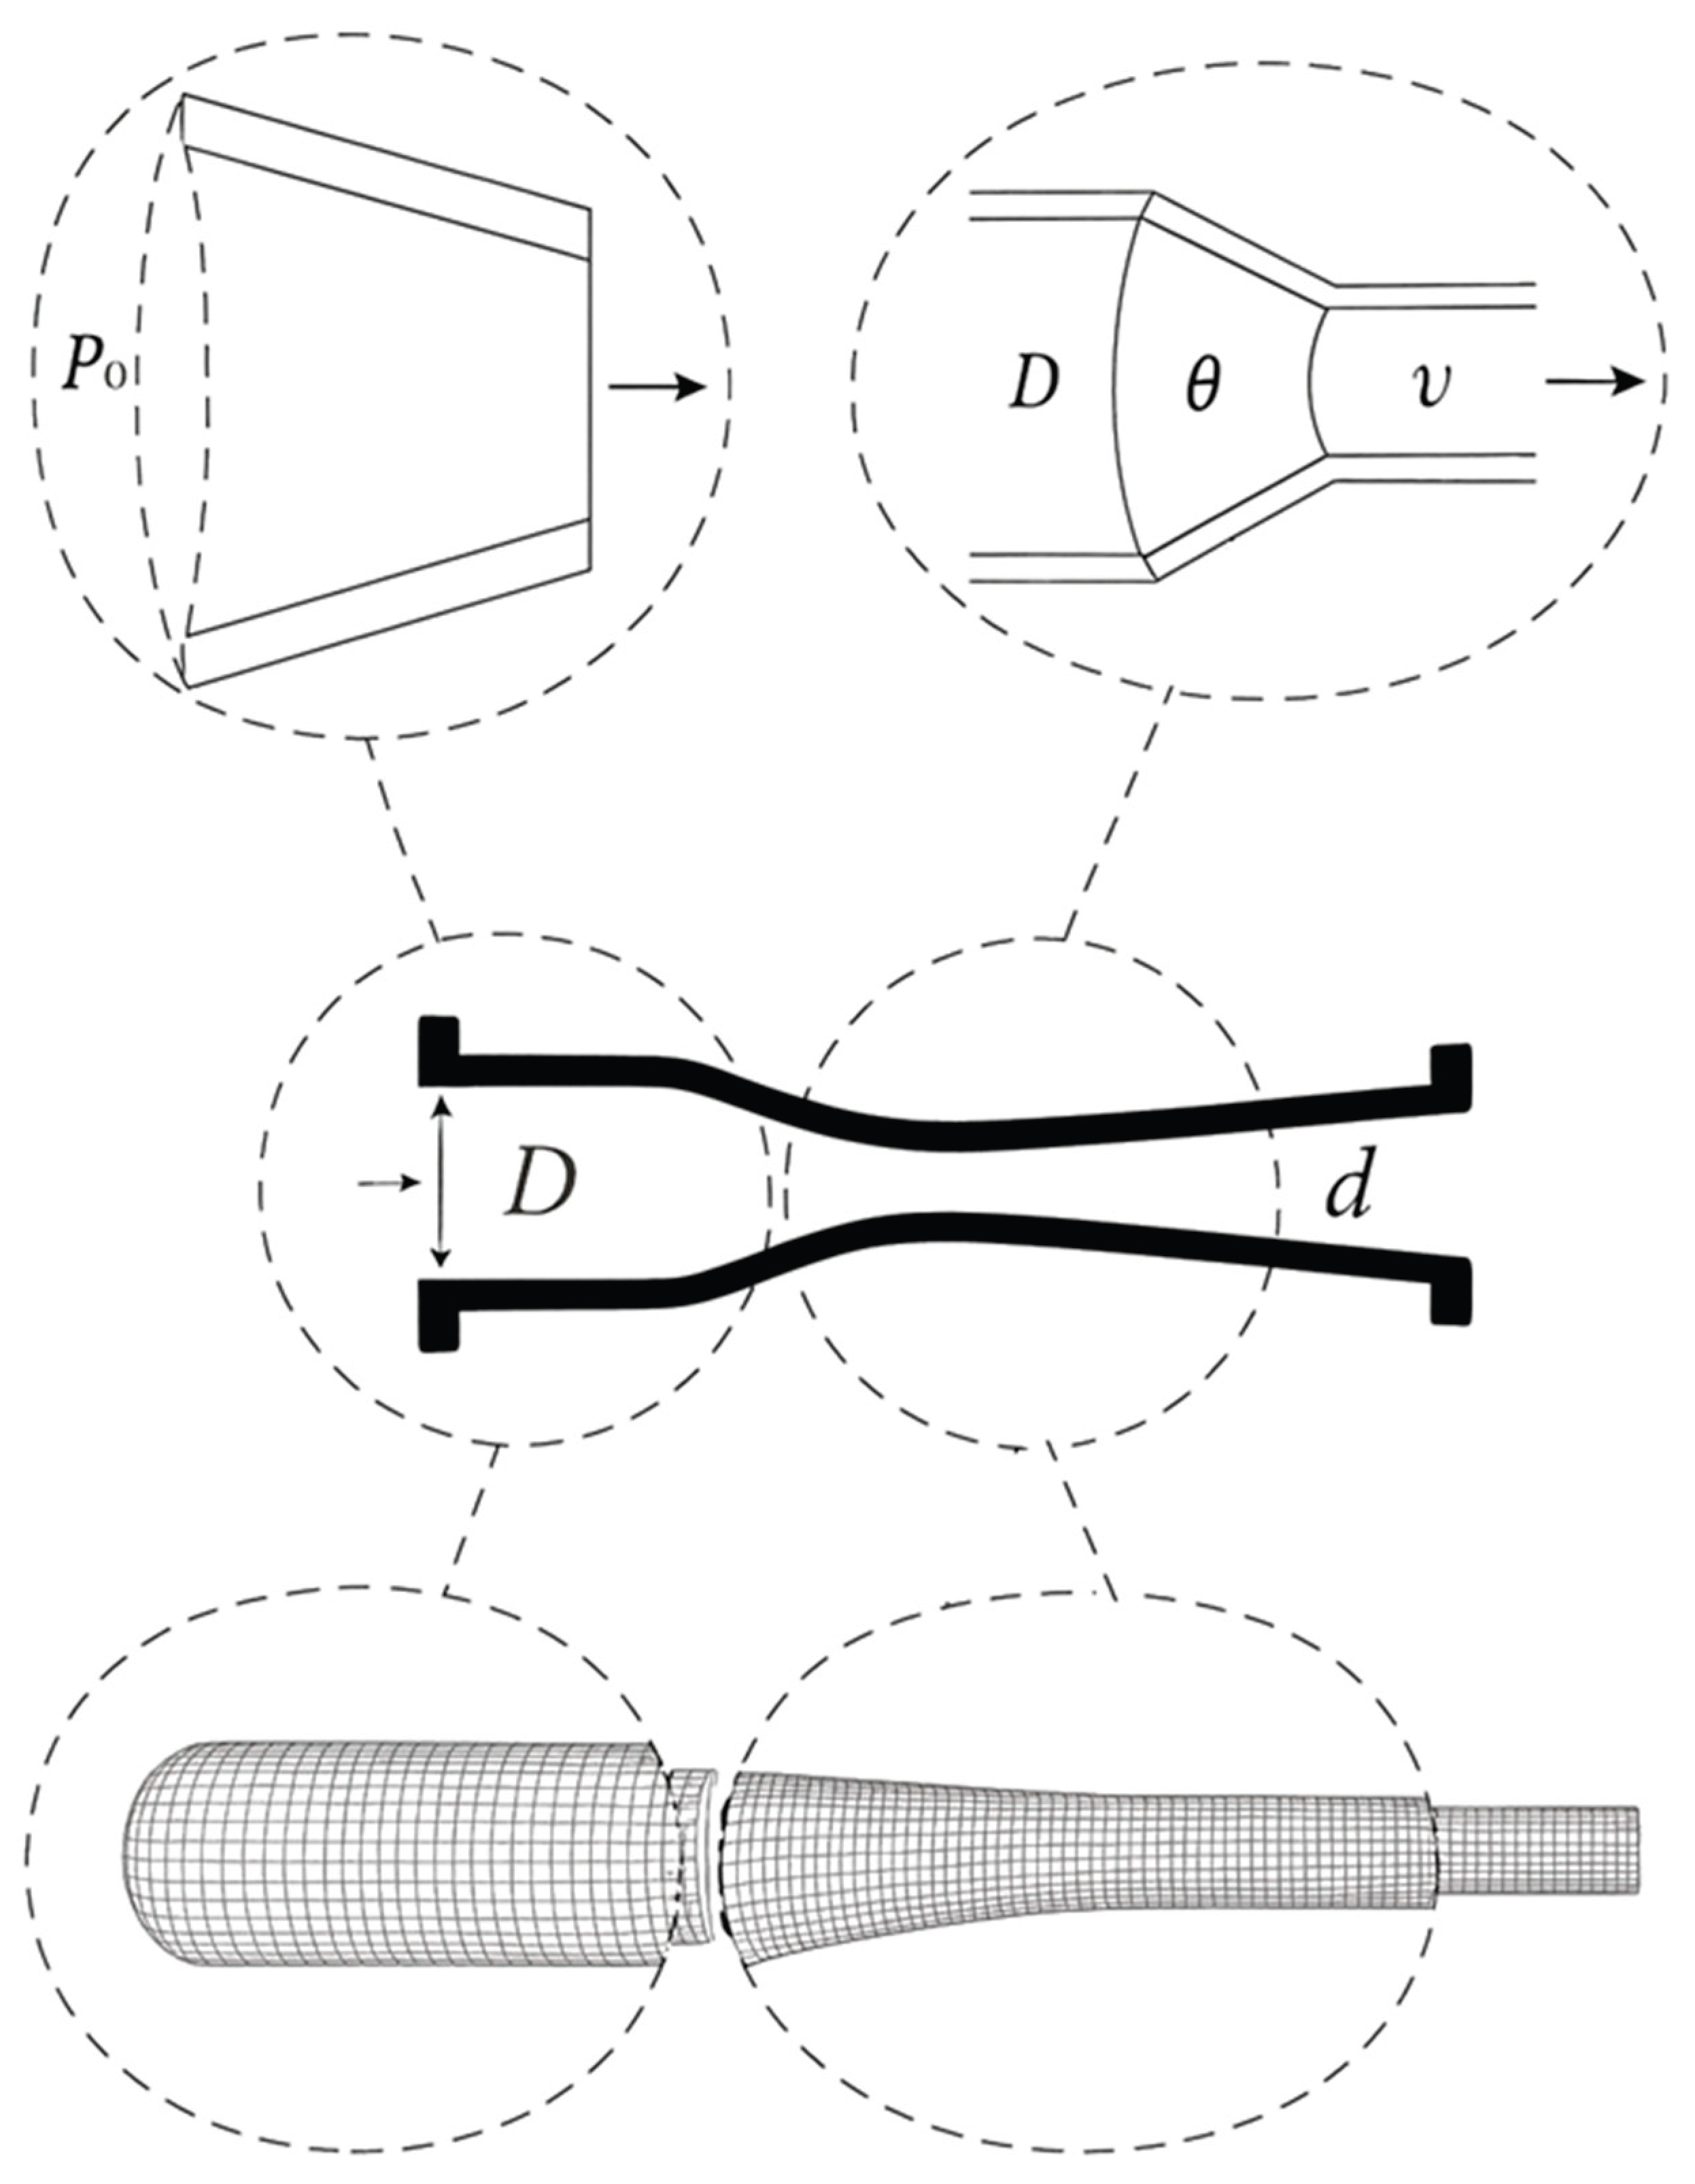

Table 1.
Mesh geometry characteristics. General description of the geometry of the idealized and real meshes used in the simulation modules. Coronary artery: LAD = anterior descending artery; RCA = right coronary artery; LCX = circumflex artery.
Table 1.
Mesh geometry characteristics. General description of the geometry of the idealized and real meshes used in the simulation modules. Coronary artery: LAD = anterior descending artery; RCA = right coronary artery; LCX = circumflex artery.
 |
Disclaimer/Publisher’s Note: The statements, opinions and data contained in all publications are solely those of the individual author(s) and contributor(s) and not of MDPI and/or the editor(s). MDPI and/or the editor(s) disclaim responsibility for any injury to people or property resulting from any ideas, methods, instructions or products referred to in the content. |
© 2025 by the authors. Licensee MDPI, Basel, Switzerland. This article is an open access article distributed under the terms and conditions of the Creative Commons Attribution (CC BY) license (http://creativecommons.org/licenses/by/4.0/).
Copyright: This open access article is published under a Creative Commons CC BY 4.0 license, which permit the free download, distribution, and reuse, provided that the author and preprint are cited in any reuse.


