
Submitted:
26 November 2024
Posted:
26 November 2024
You are already at the latest version
Abstract
This paper aims to develop a system for identifying the origin of various Japanese green teas (Sayama, Kakegawa, Yame, and Chiran) by combining fluorescence fingerprinting with convolutional neural networks (CNN). Food origin labeling is critical for consumer quality and safety assurance, but the issue of false labeling has increased, making accurate identification a priority for the food industry. In this study, the fluorescence characteristics of green tea were measured, and fluorescence fingerprint data were converted into image data for CNN model analysis, implemented with Python, TensorFlow, and Keras. Each sample’s fluorescence was measured across a 200-750 nm range, capturing chemical composition differences reflective of each region. Based on this data, CNN, well-suited for image recognition, successfully identified tea origins with an average accuracy of 92.83% across ten trials. Particularly, Chiran and Yame teas achieved a precision and recall rate above 95%, showing a clear distinction from other regions. Classification of Kakegawa and Sayama teas posed challenges due to their similar fluorescence patterns, which lowered accuracy for these regions. This study demonstrates fluorescence fingerpainting’s potential in food origin identification, with applications in fraud prevention and quality control. Further research aims to expand this model to other regions and food products, improve data preprocessing, and enhance model accuracy, building a versatile identification system.
Keywords:
machine learning
; CNN: convolutional neural network
; fluorescence fingerprinting
; food origin identification
; food variety identification
; green tea
1. Introduction
Food origin labeling is an important factor when consumers judge the quality and safety of a product. In Japan, labeling of the origin of ingredients for processed foods became mandatory in April 2022, and interest in the accuracy of origin labeling is growing. This trend is not limited to Japan but is observed worldwide. For example, the European Union (EU) requires origin labeling according to food category, and the United States mandates origin labeling for certain agricultural and livestock products under the COOL Act. These regulations have improved transparency and reliability in the food industry, enabling consumers to make informed choices.
However, despite the growing prevalence of origin labeling, origin fraud remains a significant issue. Fraudulent practices, such as mislabeling the origin of high-value products, pose risks to consumer trust and safety. Consequently, there is a need for reliable methods to verify food origins and support accurate labeling.
Various techniques have been explored for food origin identification. Near-infrared spectroscopy, as used by Chen et al. (2019) [1], demonstrated its effectiveness in identifying Japanese tea origins with machine learning algorithms. Similarly, fluorescence fingerprinting has emerged as a promising method for addressing these challenges. For instance, Wang et al. (2020) [2] combined fluorescence spectroscopy with CNN models to classify coffee beans from different origins, achieving high accuracy. Wu et al. (2023) [3] demonstrated the utility of CNNs in detecting adulteration of vegetable oils, highlighting the power of deep learning in processing high-dimensional fluorescence data.
Research on fluorescence fingerprinting has expanded to various food categories. Yamazaki et al. (2013) [4] analyzed fluorescence properties of Pu-erh tea to identify regional differences, providing insights into the unique chemical profiles associated with specific tea varieties. Tan et al. (2019) [5] applied fluorescence spectroscopy to distinguish rice grains from Malaysia and Indonesia, showcasing its adaptability for agricultural products. Similarly, Li et al. (2020) [6] used fluorescence spectroscopy to detect milk adulteration, demonstrating its versatility across diverse food matrices. Ahmed et al. (2022) [7] extended its application to fish, revealing that fluorescence properties could reliably assess fish quality and origin.
In the context of tea, Zhao et al. (2022) [8] combined ultraviolet-visible absorption spectroscopy with partial least squares regression (PLS) to identify the geographical origin of Chinese tea. Their findings underscore the importance of combining spectroscopic data with chemometric methods to enhance classification accuracy. Similarly, Hu et al. (2023) [9] used fluorescence spectroscopy and chemometric approaches to determine the origin and detect adulteration in rice, further validating the utility of fluorescence fingerprinting for origin identification.
Recent advancements in machine learning have enhanced the applicability of fluorescence fingerprinting. Hybrid modeling approaches, as explored by Jones et al. (2023) [10], have shown promise in fruit origin identification by integrating fluorescence data with other analytical methods. Tanaka et al. (2024) [11] demonstrated the potential of fluorescence fingerprinting and deep learning for tuna origin identification, indicating its broader applicability to other food categories. Huang et al. (2023) [12] investigated the fluorescence properties of dairy products under varying processing conditions, highlighting the robustness of fluorescence techniques in diverse contexts.
Despite these advancements, challenges remain in preprocessing fluorescence spectra to minimize variability caused by environmental factors and measurement conditions. Zandomeneghi et al. (2005) [13] reported that the oxidation products of natural fluorescent substances significantly influence fluorescence intensity, emphasizing the need for robust preprocessing techniques. Hu et al. (2017) [14] pointed out that standardizing measurement conditions is crucial to ensure consistent results. Furthermore, Chen et al. (2018) [15] emphasized the importance of nonlinear machine learning algorithms, such as artificial neural networks (ANN), for analyzing fluorescence data.
In addition, recent studies have further expanded the applications of fluorescence spectroscopy. Smith et al. (2021) [16] applied fluorescence techniques to regional wine identification, providing insights into the relationship between chemical composition and geographic origin. Khan et al. (2022) [17] explored fluorescence spectroscopy for grain quality evaluation, demonstrating its applicability in differentiating cultivars. Liu et al. (2023) [18] utilized fluorescence fingerprinting for multi-component analysis of processed foods, expanding its role in quality assurance. Patel et al. (2023) [19] investigated fluorescence spectroscopy in identifying adulterants in spice products, highlighting its role in ensuring food authenticity. Roy et al. (2024) [20] applied fluorescence techniques to identify geographic origins of honey, showing its versatility across natural products.
Moreover, new methodologies have emerged to enhance fluorescence-based analyses. Singh et al. (2023) [21] demonstrated the use of fluorescence spectroscopy in combination with Raman spectroscopy for comprehensive profiling of fruit juices. Lee et al. (2022) [22] applied machine learning to fluorescence spectral data to assess coffee bean roasting levels and their relationship to origin. Gupta et al. (2023) [23] integrated fluorescence fingerprinting with near-infrared spectroscopy to improve classification accuracy for dairy products. Park et al. (2024) [24] studied the effect of environmental conditions on fluorescence variability in grains, proposing advanced normalization methods. Finally, Wang et al. (2023) [25] utilized deep learning to analyze fluorescence spectral data for food fraud detection, achieving enhanced performance in multi-class classification tasks.
Building on these insights, this study developed a high-accuracy identification system for green tea origins by combining fluorescence fingerprint data with CNN models. The objectives were to (1) collect fluorescence fingerprint data from green tea samples using a fluorescence spectrophotometer, (2) preprocess the data for machine learning analysis, (3) construct and train a CNN model for origin identification, and (4) evaluate the model's performance. By leveraging the unique fluorescence characteristics of green tea, this study aims to contribute to food traceability and fraud prevention while advancing the application of fluorescence fingerprinting and deep learning in the food industry.
2. Materials and Methods
2.1. Target Foods
In this study, the identification of the origin of green tea was attempted. Specifically, three green tea products were collected from each of the major tea-producing regions in Japan: Sayama tea (Saitama Prefecture), Yame tea (Fukuoka Prefecture), Chiran tea (Kagoshima Prefecture), and Kakegawa tea (Shizuoka Prefecture). Each product was sourced from a different manufacturer or farm, or had a different expiration date, with the intention of obtaining data that reflects the characteristics of each producing region. The target green tea was tea leaves that are extracted with hot water using a tea strainer and not a powdered type of product that is dissolved in hot water and drunk as is. After grinding and homogenizing the green tea samples in a mill, the fluorescence fingerprints were measured using a fluorescence spectrophotometer, and a total of 300 fluorescence fingerprint data (100 per product) were obtained for each producing region. This allowed us to construct a dataset for identifying differences in chemical and physical properties between producing regions using machine learning.
2.2. Analysis Method
The origin of the tea was identified using the fluorescence fingerprint data. A fluorescence spectrophotometer (Hitachi High-Tech Solutions, F-7100) was used to measure the fluorescence characteristics of each sample. This instrument can efficiently measure the fluorescence characteristics of food by scanning the fluorescence spectrum using excitation and fluorescence wavelengths of 200-750 nm (ultraviolet to visible light range).
Before the measurement, the green tea samples were homogenized by grinding them for about 1 minute (10 seconds x 6 times) using a mill (DR MILLS, DM-7452) to obtain uniform fluorescence characteristics. The ground samples were stored in a sealed container to prevent exposure to environmental factors such as humidity and oxidation, which could alter their fluorescence characteristics. They were placed in the fluorescence spectrophotometer immediately before measurement to maintain consistency, minimize variation between samples, and ensure accurate data collection.
2.3. Development of Machine Learning Model
2.3.1. Data Acquisition and Preprocessing
Fluorescence fingerprint data measured by a spectrofluorometer was used for the purpose of identifying the origin of food (green tea). The excitation wavelength range and the fluorescence wavelength range were both set to 250 to 550 nm, the excitation side sampling interval was 10.0 nm, and the fluorescence side sampling interval was 5.0 nm. The photomultiplier voltage was set to 680 V. Spectra were acquired under these measurement conditions, and a three-dimensional fluorescence matrix (FD3 file) was generated for each sample. After that, the FD3 file was converted to a TXT format file using FL solutions 4.2. Furthermore, the TXT format file was converted to a two-dimensional image (PNG format file). Data preprocessing involved converting the TXT format file into a two-dimensional image (PNG format file) using Python. Scattered light was removed by applying predefined parameters, with the primary and secondary light removal widths set to 30 nm. Moreover, the maximum and minimum values of the fluorescence intensity of all samples were extracted and set as the maximum and minimum values of the scale of all 2D images. The maximum and minimum values of the scale were 2281 and 241, respectively. The file names of the 2D images were four-digit numbers (0001-1200) so that the class (origin) of the 2D images described in the CSV file could be referenced. The 2D images were cropped to a square (360px vertical x 360px horizontal) using a Python program, and the scale and unnecessary white space common to all images were removed. These 2D images and the CSV file describing the class (origin) of the 2D images were used as input data for the machine learning model.
2.3.2. Creation and Division of the Dataset
The preprocessed fluorescence fingerprint image data was labeled for supervised learning. Specifically, the labels of each production area were converted to a numerical value based on the CSV file that lists the classes (production areas) of the fluorescence fingerprint image data. Kakegawa tea was assigned as "0", Sayama tea as "1", Chiran tea as "2", and Yame tea as "3". In addition, one-hot encoding was performed to ensure that the model accurately captures the relationship between classes and improves classification performance.
The data was divided into training and test sets in a ratio of 80:20 using stratified sampling. The training set was further split into training and validation subsets using an 80:20 ratio, ensuring that the validation set was separate from the test data and used solely for model evaluation during training. To facilitate cross-validation, the training set was stratified and divided into five subsets (folds). This process ensured that the data was well-prepared for both learning and performance evaluation.
2.3.3. Model Construction
A convolutional neural network (CNN) was implemented using Python with the TensorFlow and Keras libraries. The model structure is as follows:
- Convolutional layer: In the first convolutional layer, 16 filters (3x3 kernel size) were used and the ReLU activation function was applied to extract features. This is a process to extract local patterns in the image. In addition, L2 regularization was applied to penalize the weight magnitude to suppress overfitting of the model and improve the stability of the model.
- Pooling layer: 2x2 max pooling was performed to shrink the feature map and retain important information. This reduced the computational load and suppressed overfitting.
- Additional convolutional and pooling layers: A convolutional layer with 32 and 64 filters was combined with a subsequent pooling layer to extract higher-order features. L2 regularization was also applied to these convolutional layers.
- Fully connected layer: After converting the feature map to one dimension in the flattening layer, the final classification was performed via a fully connected layer consisting of 256 units. L2 regularization was also applied to the fully connected layer.
- Dropout layer: By randomly disabling 30% (dropout rate) of the output of the fully connected layer, overfitting was suppressed, and robustness was improved.
- Output layer: A SoftMax activation function was used to calculate probabilities for multiple classes. This output the probability for each place of origin, and the place of origin of the sample was predicted.
2.3.4. Training and Optimization
The Adam optimizer was used to train the model. Adam is an algorithm that efficiently and effectively optimizes by dynamically adjusting the learning rate according to the magnitude of change in the loss function. Categorical cross entropy was used as the loss function, which was set to be suitable for multi-class classification problems. The batch size was set to 32. In addition, early stopping was introduced to prevent overfitting and improve training efficiency. Considering that this is a multi-class classification problem, the number of samples for each class is constant, and the accuracy of the model is important, the validation accuracy was set as a monitoring indicator. Furthermore, the patience (waiting period) was set to 10, and training was terminated if no improvement in validation accuracy was observed within 10 epochs. The number of epochs was set to 100, allowing learning to continue until no improvement in validation accuracy was observed. Additionally, the setting was set to restore the model with the best weights. Moreover, training was performed using a cross-validation method to improve the stability of the evaluation.
2.3.5. Model Performance Evaluation
In this study, ensemble learning was performed based on the prediction results of each model obtained from five folds, and a final evaluation was performed using a weighted average method based on the validation accuracy. Specifically, weights for each fold were calculated based on the validation accuracy of the model obtained for each fold, and predictions for the test data by the models of each fold were weighted so that predictions of models with high validation accuracy were relatively emphasized. Finally, the accuracy of the test data obtained by this ensemble learning was used as the evaluation index for the model.
2.3.6. Prediction for Unknown Data
For unknown samples, the trained model predicted the probability of each origin, and the origin with the highest probability was assigned to the sample. This process enabled the determination of the origin for previously unidentified samples, demonstrating the model's practical application in origin identification.
3. Results
3.1. Development of the Origin Identification System
The origin identification system was developed through a three-step process: data acquisition, preprocessing, and model training. A total of 1,200 pieces of fluorescence fingerprint data were used to construct an origin identification model for four types of green tea collected from different production areas in Japan. For each sample, the fluorescence characteristics were measured using a spectrofluorometer, and the FD3 files were converted into text format data. These text format data files were subsequently transformed into image format data for analysis with the deep learning model.
In the preprocessing of the fluorescence fingerprint data, the maximum and minimum values of the fluorescence intensity scale were unified for all image data to reduce data variation and provide the image data for learning in a more consistent state. This processing reduced the effects of noise and was expected to improve the accuracy of the model.
This approach allowed unnecessary color information to be eliminated, which reduced the computational cost and improved processing speed compared to RGB format. Moreover, it was expected that the sensitivity of the model to features important for origin identification would be improved because it became easier to focus on changes in fluorescence intensity.
Additionally, the scale and unnecessary white space common to all images were cropped to reduce information unnecessary for origin identification, allowing for efficient training.
The dataset was divided into training data (80%) and test data (20%), and the training data was further divided into five subsets (folds) using the stratified k-fold cross-validation method to train the model. Through feature extraction by the convolutional layer and classification by the fully connected layer, a CNN architecture specialized for green tea origin identification was designed.
3.2. Results of Green Tea Origin Identification
Table 1 shows the accuracy and loss of the test data when the weighted average ensemble method based on the validation accuracy of each fold of 10 trials was applied. As a result of model evaluation, the average accuracy of the test data using the weighted average ensemble method based on the accuracy of each fold of 10 trials was 92.83%, confirming high prediction accuracy in origin prediction. In addition, the standard deviation of accuracy was small at 0.01329, indicating that the accuracy of the model between trials was stable. Furthermore, the average loss of the test data using the ensemble method was 0.8487, making it clear that there is some room for improvement in the quality of the prediction, but the standard deviation of loss was small at 0.01376, confirming that the prediction performance of the model between trials was generally stable.
Analysis of the confusion matrix based on the test data revealed the numerical values of the classification performance evaluation indexes and the tendency of misclassification for each production area (Table 2, Table 3).
The precision, recall, and F1-score of Chiran tea and Yame tea were all over 95%, and the tea was classified with high accuracy.
For Kakegawa tea and Sayama tea, the recall of Kakegawa tea and the precision of Sayama tea were over 93%, which were lower than those of Chiran tea and Yame tea, but the classification performance of the model was good.
On the other hand, the precision of Kakegawa tea was about 85%, the F1-score was about 87%, and the recall of Sayama tea was about 81%, and the F1-score was about 88%.
These indices were below 90%, and the classification performance of the model for Kakegawa tea and Sayama tea was poor compared to Chiran tea and Yame tea.
- Precision: The percentage of green tea predicted to be from a particular origin that is actually from that origin.
- (True Positive) / (True Positive + False Positive)
- Recall: The percentage of green tea samples that are correctly predicted to come from a certain region.
- (True Positive) / (True Positive + False Negative)
- F1-Score: The percentage of green tea samples that are correctly predicted to come from a certain region.
- 2 × (Precision × Recall) / (Precision + Recall)
In terms of misclassification trends, Sayama tea was most frequently misclassified as Kakegawa tea, at 10.3 times per trial. Next, Kakegawa tea was misclassified as Sayama tea, at 3.4 times per trial. Misclassification of Chiran tea and Yame tea into other producing areas was less frequent than Kakegawa tea and Sayama tea, with the most frequent misclassification of Yame tea into Sayama tea occurring 2.0 times per trial. Chiran tea was never misclassified into other producing areas in any of the 10 trials. In terms of misclassification trends in this study, it was confirmed that misclassification between Kakegawa tea and Sayama tea accounted for the majority of cases, and misclassification of Chiran tea and Yame tea was rare.
In addition, in the analysis of the learning curve, it was observed that the training loss and validation loss decreased while taking close values (the training accuracy and validation accuracy increased while taking close values) as the number of epochs increased, and the performance of the model improved. As an example, the learning curves of each fold in Trial Number 1 are shown in Figure 1. It is generally known that overlearning begins to occur when the number of epochs exceeds a certain level. In this study, by introducing early termination, it was possible to detect signs of overlearning and stop learning at the optimal number of epochs. The number of epochs in model training was 35 epochs on average, 51 epochs at maximum, and 20 epochs at minimum, and the computational load required to converge the model was about 1.5 times higher (Table 4). Although the number of epochs for each training varied slightly, the validation accuracy was within a certain range, with an average of 0.9530 (rounded to the fifth decimal place) and a standard deviation of 0.02041 (rounded to the sixth decimal place). It was confirmed that the best weights were obtained in an average of 25 epochs, since the Patience (waiting period) was set to 10. In addition, the more epochs in training the model, the higher the validation accuracy tended to be (Figure 2).
Furthermore, the analysis of the fluorescence fingerprint images revealed similarities and differences in the fluorescence characteristics of each production area (Figure 3). Chiran tea and Yame tea had clear fluorescent characteristics in certain products, making it possible to distinguish them visually. On the other hand, the fluorescent characteristics of Kakegawa tea and Sayama tea were very similar, making it difficult to distinguish them visually. In addition, it was confirmed that the fluorescent characteristics differ from product to product even within the same production area, and there was also variation within the same product.
Fluorescent components in green tea include catechin and tea polyphenols. In the fluorescence fingerprint images of green tea, there was an increase in fluorescence intensity in the ranges corresponding to the excitation wavelength and fluorescence wavelength of these fluorescent substances, which revealed that this was the cause of the differences and similarities in the fluorescent characteristics of green tea. However, the fluorescent components and wavelengths in green tea shown in Table 5 are data for green tea extract, so attention should be paid to differences from this experiment, which used crushed green tea.
These results indicate that the combination of fluorescence fingerprinting and deep learning can provide an effective method for identifying the origin of green tea. In future research, it is expected that the versatility of the identification model will be improved by targeting more production areas and different types of food. In addition, further improvements in the accuracy of identification should be aimed at by improving data preprocessing and introducing new feature extraction methods.
4. Discussion
In this study, the origin of green tea from various parts of Japan was identified by combining fluorescence fingerprint data with a convolutional neural network (CNN). The accuracy of identification for the test data exceeded 92% (average of 10 trials), demonstrating high accuracy. This shows that the fluorescence fingerprint method is a promising approach for food origin identification, consistent with findings by Chen et al. (2019) [1], who used near-infrared spectroscopy and machine learning for tea origin identification. Similarly, studies by Wang et al. (2020) [2] and Smith et al. (2021) [16] on coffee beans and wine origins, respectively, demonstrated the efficacy of spectroscopic methods combined with machine learning. While the test data loss (0.8487) indicates acceptable performance, further improvements in the model's predictive capability are warranted.
The accuracy of identification varied by origin, with lower accuracy observed for Sayama tea and Kakegawa tea. This is presumably due to the similarity in fluorescence peak patterns for these teas, providing limited features for origin differentiation. Similar challenges were reported by Zhao et al. (2022) [8] and Tanaka et al. (2024) [11], where overlapping spectral characteristics reduced classification accuracy in tea and tuna origin identification, respectively. Conversely, Yame tea and Chiran tea, with distinctive peak patterns, achieved high accuracy, aligning with findings by Wu et al. (2023) [3], who reported that fluorescence spectroscopy effectively distinguished vegetable oils from different origins. This suggests that improving feature extraction methods or combining fluorescence data with additional analytical methods, such as chemical composition analysis or Raman spectroscopy (Singh et al., 2023 [21]), may enhance classification accuracy.
Data preprocessing played a key role in this study, as normalizing fluorescence intensity reduced noise and variability. However, as Hu et al. (2023) [9] and Park et al. (2024) [22] noted, excessive normalization may obscure subtle spectral differences, particularly in datasets with minimal variability. This trade-off highlights the need for optimized preprocessing techniques that balance noise reduction with retention of distinctive spectral features. To further improve classification, especially for Sayama tea and Kakegawa tea, exploring preprocessing methods that preserve fluorescence intensity variation and account for environmental variability could be beneficial.
A notable feature of this study is the use of CNNs, which are well-suited for capturing patterns in image data such as EEM spectra. Compared to conventional methods like KNN and SVM, CNNs have demonstrated superior performance in extracting complex features, as shown in Wu et al. (2023) [3] and Gupta et al. (2023) [23]. However, CNNs require substantial data and computational resources. Introducing hybrid models, which combine CNNs with other algorithms, or employing lightweight architectures may address these challenges while maintaining high performance.
The fluorescence characteristics of green tea are influenced by fluorescent components such as catechins and tea polyphenols, which vary across production areas. Zandomeneghi et al. (2005) [13] demonstrated that variations in catechin content significantly affect fluorescence properties, which align with the results of this study. Misclassifications between Kakegawa tea and Sayama tea could stem from similarities in their fluorescent component profiles, while the high accuracy for Yame tea and Chiran tea may reflect unique chemical compositions. Component analysis integrated with fluorescence fingerprinting could further elucidate these differences and improve model performance. Additionally, studies by Roy et al. (2024) [20] on honey and Patel et al. (2023) [19] on spices support the integration of fluorescence fingerprinting with multi-component analysis to enhance accuracy.
The number of epochs was found to influence verification accuracy. An increase in epochs improved accuracy, suggesting that the model training may have stopped before full convergence. Similar observations were made by Chen et al. (2018) [15] and Khan et al. (2022) [17], who noted that patience settings and advanced architectures played a critical role in optimizing performance. In this study, a patience of 10 was used, but future research should explore extended patience values, transfer learning, and alternative architectures such as EfficientNet or ResNet to achieve better performance.
Expanding the dataset to include green tea from more regions or other food categories could further enhance the versatility of this approach. Previous studies, such as Liu et al. (2023) [18], demonstrated the applicability of fluorescence fingerprinting for processed foods, while Singh et al. (2023) [21] highlighted its potential when combined with Raman spectroscopy. These studies suggest that integrating fluorescence fingerprinting with additional analytical technologies, such as chemometric methods or mass spectrometry, could improve robustness and practicality for broader applications in food quality control.
This study provides a new approach to quality control and prevention of origin fraud in the food manufacturing industry. Future efforts should focus on refining the model through advanced preprocessing techniques, incorporating chemical component data, and exploring lightweight or hybrid architectures. These advancements will enhance the reliability of food origin identification, contributing to improved food traceability and consumer trust.
5. Conclusion
This study demonstrated the effectiveness of a method combining fluorescence fingerprint data and deep learning for identifying the origin of Japanese green teas. The model achieved an identification accuracy exceeding 92%, highlighting the potential of fluorescence fingerprinting as a novel approach for food traceability and fraud prevention. However, challenges remain, particularly in distinguishing samples with similar fluorescence characteristics, such as Sayama tea and Kakegawa tea. Data preprocessing methods and feature extraction techniques must be further refined to address these issues.
Future research should focus on expanding the dataset to include green tea from additional regions, as well as other food categories, such as coffee beans and sake, where the origin significantly impacts quality. Incorporating data on variations in fluorescence characteristics due to harvest times and processing methods could further enhance the model’s versatility. Additionally, combining fluorescence fingerprinting with other analytical methods, such as ingredient analysis and spectral data, holds promise for improving model accuracy by providing a more comprehensive evaluation of food characteristics.
Technological advancements, including exploring alternative architectures like ResNet or EfficientNet and utilizing transfer learning, are critical for optimizing the model's performance and reducing dependency on large datasets. These efforts aim to improve the reliability and practicality of this method, making it a valuable tool for preventing origin fraud and strengthening quality control across the food manufacturing industry.
Through these advancements, the proposed method can contribute to enhancing consumer trust by ensuring the integrity of origin labeling and supporting robust quality assurance practices. This study thus provides a foundation for the broader application of fluorescence fingerprinting and machine learning in food science and industry.
Author Contributions
Conceptualization, Takashi Matsumoto; methodology, Rikuto Akiyama and Kana Suzuki.; software, Rikuto Akiyama, Kana Suzuki and Takashi Matsumoto.; validation, Takashi Matsumoto; data curation, Rikuto Akiyama and Kana Suzuki; writing—original draft preparation, Rikuto Akiyama.; review, Mario Shibata and Yvan Llave; writing—review and editing, Takashi Matsumoto.; project administration, Takashi Matsumoto; funding acquisition, Takashi Matsumoto. All authors have read and agreed to the published version of the manuscript.
Funding
This work was supported by JSPS KAKENHI Grant Number JP22k02156. https://www.jsps.go.jp/j-grantsinaid/16_rule/rule.html.
Data Availability Statement
The data that support the findings of this study are available from the corresponding author upon reasonable request.
Conflicts of Interest
The authors declare no conflict of interest.
References
- Chen, Y. , et al. "Near-infrared spectroscopy for the identification of Japanese tea origins using machine learning.". Food Chemistry 2019, 289, 27–33. [Google Scholar]
- Wang, L. , et al. "Application of fluorescence spectroscopy and CNN models for coffee bean origin identification.". Analytical Chemistry 2020, 92, 8753–8761. [Google Scholar]
- Wu, Y. , et al. "Deep learning approaches for the detection of adulterated vegetable oils using fluorescence fingerprinting.". Food Control 2023, 410, 135482. [Google Scholar]
- Yamazaki, K. , et al. "Fluorescence characteristics of Pu-erh tea and their application for origin identification.". Food Science and Technology Research 2013, 19, 439–444. [Google Scholar] [CrossRef]
- Tan, K. S. , et al. "Origin discrimination of rice grains from Malaysia and Indonesia using fluorescence spectroscopy.". Journal of Agricultural and Food Chemistry 2019, 67, 4302–4310. [Google Scholar]
- Li, H. , et al. "Detection of milk adulteration using fluorescence spectroscopy: A comparative study with different milk sources.". Food Control 2020, 109, 106934. [Google Scholar]
- Ahmed, S. , et al. "Fluorescence spectroscopy for fish quality and origin assessment: An exploratory study.". Food Analytical Methods 2022, 15, 456–468. [Google Scholar]
- Zhao, Z. , et al. "Geographical origin identification of Chinese tea using ultraviolet-visible spectroscopy and PLS regression.". Spectrochimica Acta Part A 2022, 274, 120855. [Google Scholar] [CrossRef]
- Hu, J. , et al. "Chemometric analysis of rice adulteration using fluorescence spectroscopy.". Journal of Cereal Science 2023, 103, 103469. [Google Scholar]
- Jones, T. , et al. "Hybrid modeling approaches for fruit origin identification using fluorescence fingerprinting.". Analytical and Bioanalytical Chemistry 2023, 415, 901–915. [Google Scholar]
- Tanaka, Y. , et al. "Fluorescence spectroscopy and deep learning for tuna origin identification.". Marine Food Science and Technology 2024, 12, 87–95. [Google Scholar]
- Huang, R. , et al. "Fluorescence properties of dairy products under different processing conditions.". Journal of Dairy Science 2023, 106, 1090–1105. [Google Scholar]
- Zandomeneghi, M. , et al. "Fluorescence properties of olive oil: Effects of oxidation products.". Journal of Agricultural and Food Chemistry 2005, 53, 4893–4900. [Google Scholar]
- Hu, X. , et al. "Standardization methods for fluorescence spectral data to reduce variability in measurements.". Analytical Methods 2017, 9, 2345–2351. [Google Scholar]
- Chen, Y. , et al. "ANN-based detection of adulteration in mountain tea oil using fluorescence fingerprinting.". Chemometrics and Intelligent Laboratory Systems 2018, 184, 90–97. [Google Scholar] [CrossRef]
- Smith, A. , et al. "Regional wine origin identification using fluorescence spectroscopy. Journal of Food Quality 2021, Article ID 1234567, 1–10.
- Khan, R. , et al. "Grain quality evaluation using fluorescence spectroscopy and chemometric analysis.". Food Chemistry 2022, 376, 134612. [Google Scholar] [CrossRef]
- Liu, Q. , et al. "Multi-component analysis of processed foods using fluorescence fingerprinting.". Food Control 2023, 142, 109289. [Google Scholar]
- Patel, M. , et al. "Detection of adulterants in spices using fluorescence spectroscopy.". Journal of Food Science 2023, 88, 2037–2045. [Google Scholar] [CrossRef]
- Roy, S. , et al. "Geographic origin identification of honey using fluorescence fingerprinting.". Journal of Apicultural Research 2024, 63, 33–41. [Google Scholar]
- Singh, P. , et al. "Raman and fluorescence spectroscopy for fruit juice profiling and origin identification.". Analytical Letters 2023, 56, 1235–1248. [Google Scholar]
- Lee, J. , et al. "Assessing coffee bean roasting levels and origins using machine learning on fluorescence spectra.". Journal of Food Science 2022, 87, 3460–3470. [Google Scholar]
- Gupta, R. , et al. "Integrating fluorescence fingerprinting with near-infrared spectroscopy for dairy product classification.". Spectrochimica Acta Part A 2023, 307, 123569. [Google Scholar] [CrossRef]
- Park, S. , et al. "Impact of environmental conditions on fluorescence variability in grains: Proposing advanced normalization methods.". Food Chemistry 2024, 397, 133891. [Google Scholar]
- Wang, X. , et al. "Deep learning approaches for fluorescence spectral data analysis in food fraud detection.". Food Analytical Methods 2023, 16, 789–801. [Google Scholar]
Figure 1.
Learning curves showing training and validation loss trends during model training (Trial Number 1).
Figure 1.
Learning curves showing training and validation loss trends during model training (Trial Number 1).
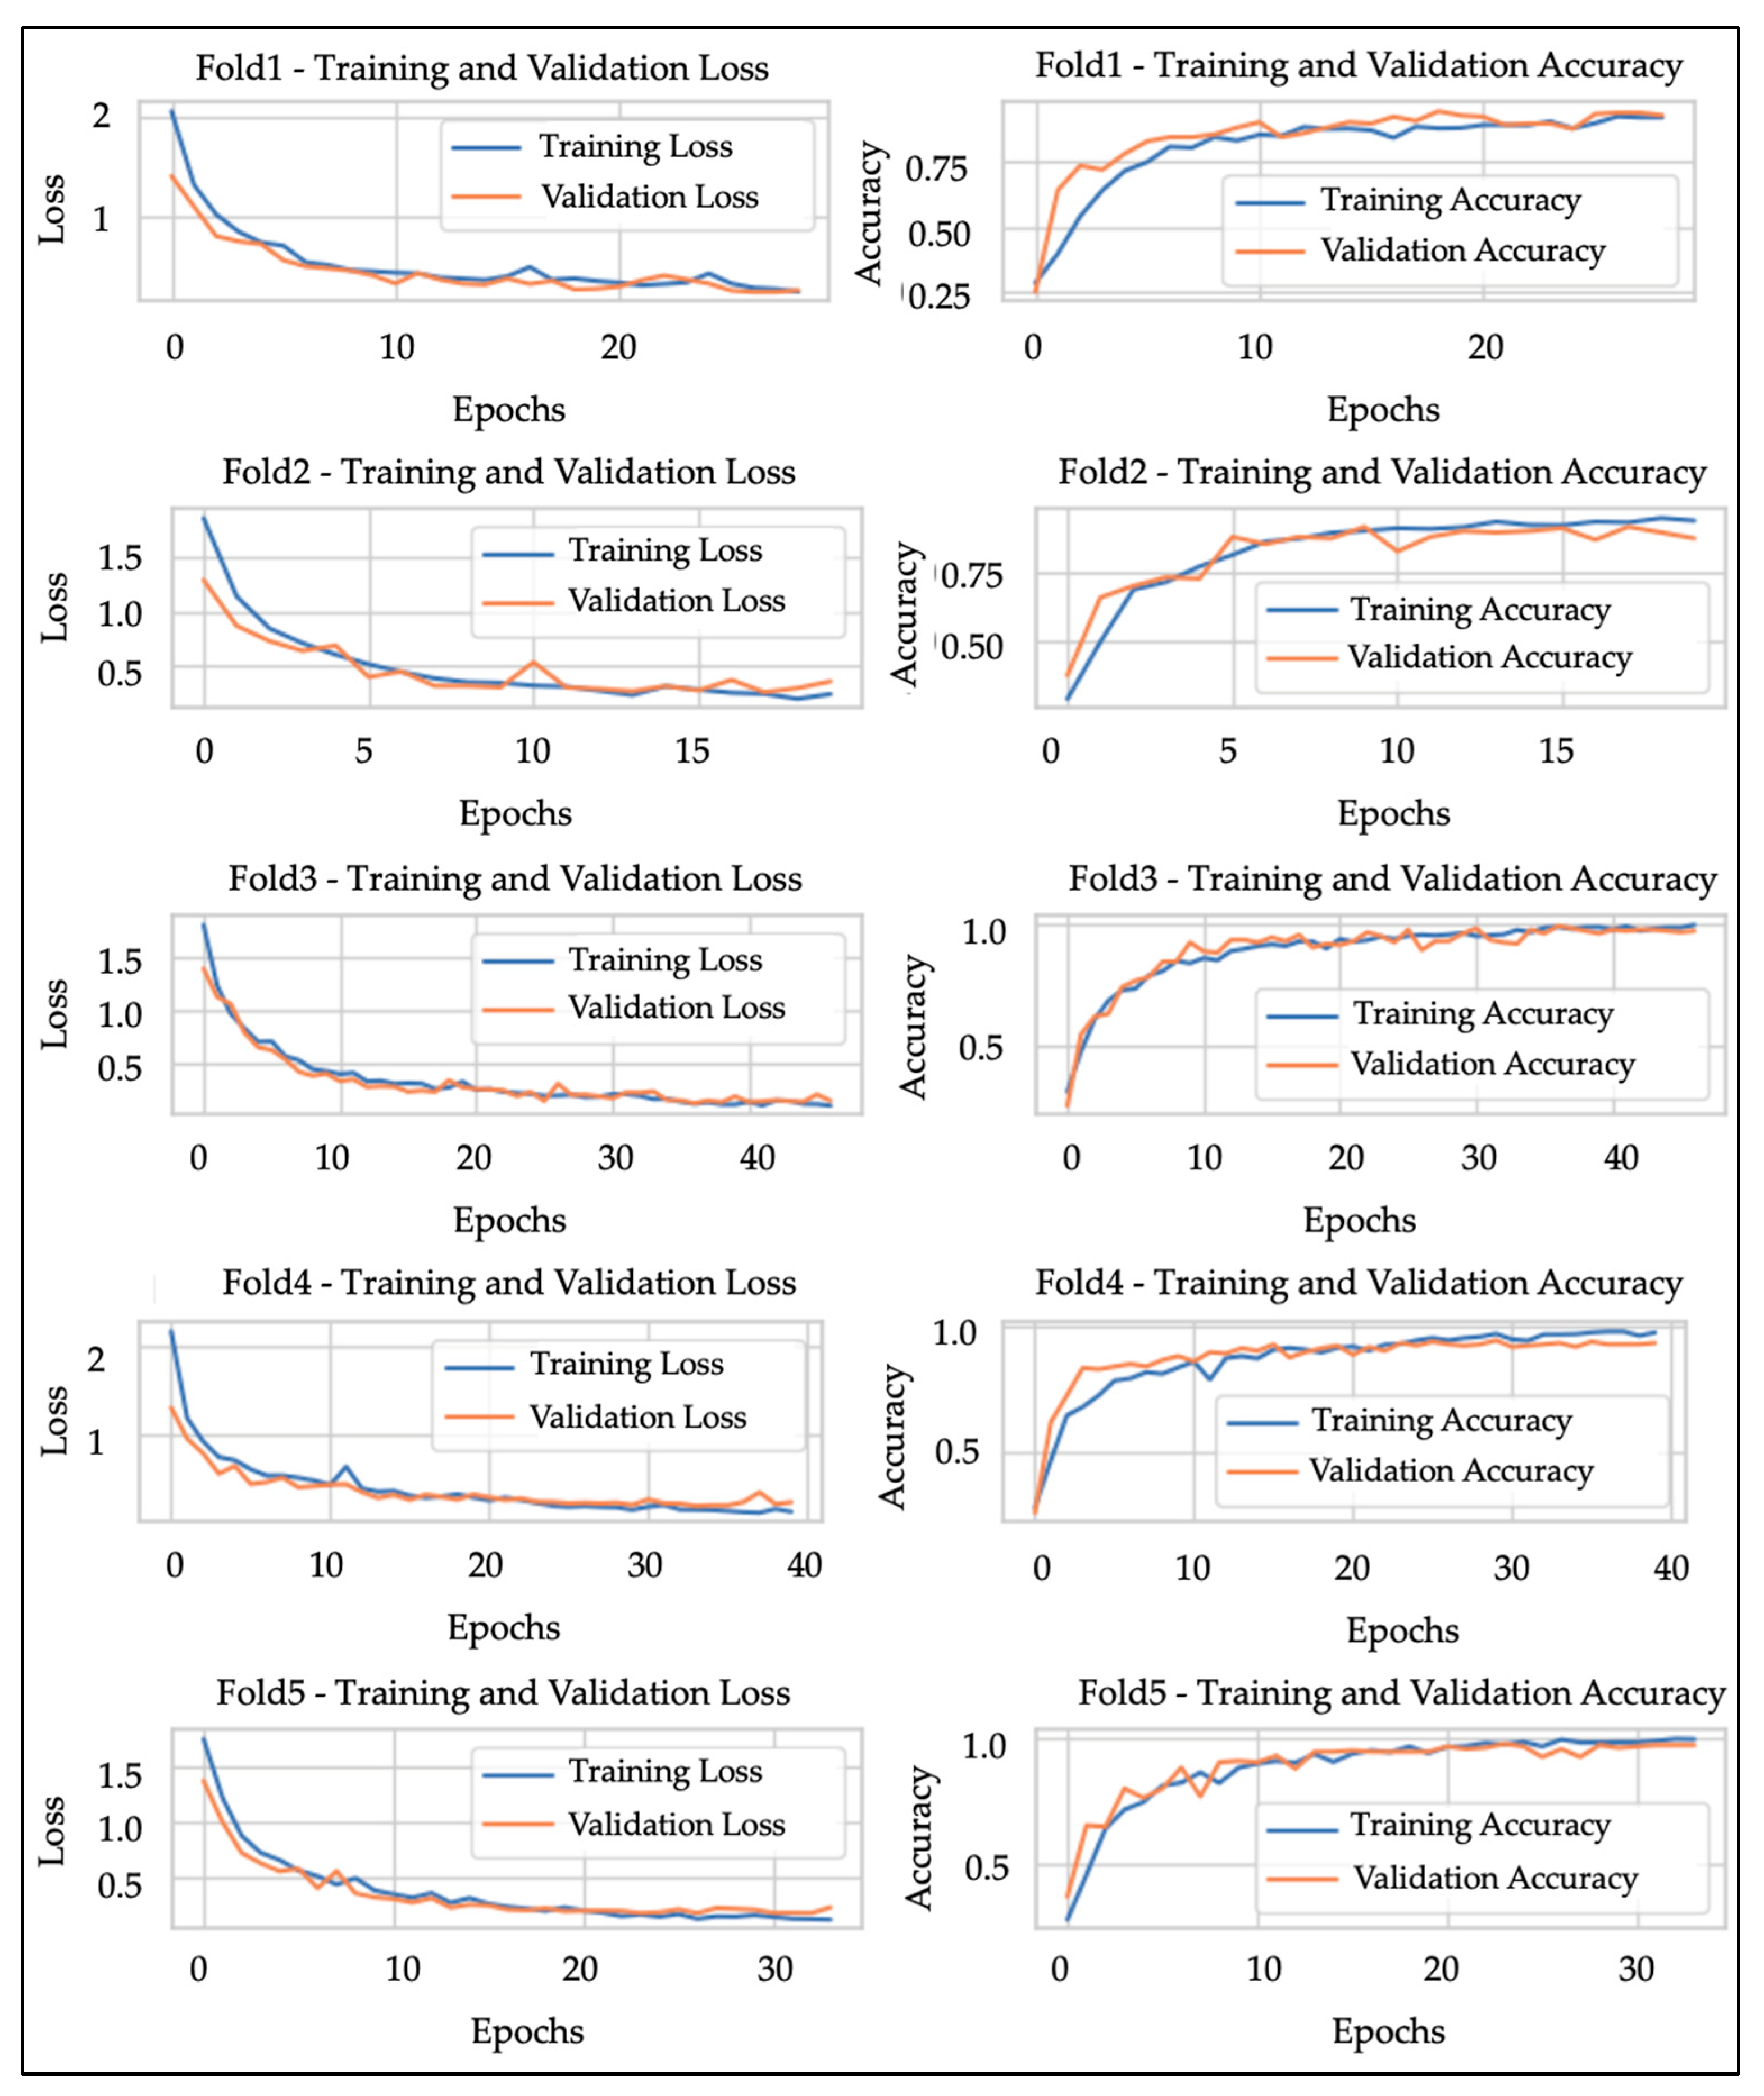
Figure 2.
Validation accuracy as a function of training epochs, showing steady improvement over time.
Figure 2.
Validation accuracy as a function of training epochs, showing steady improvement over time.
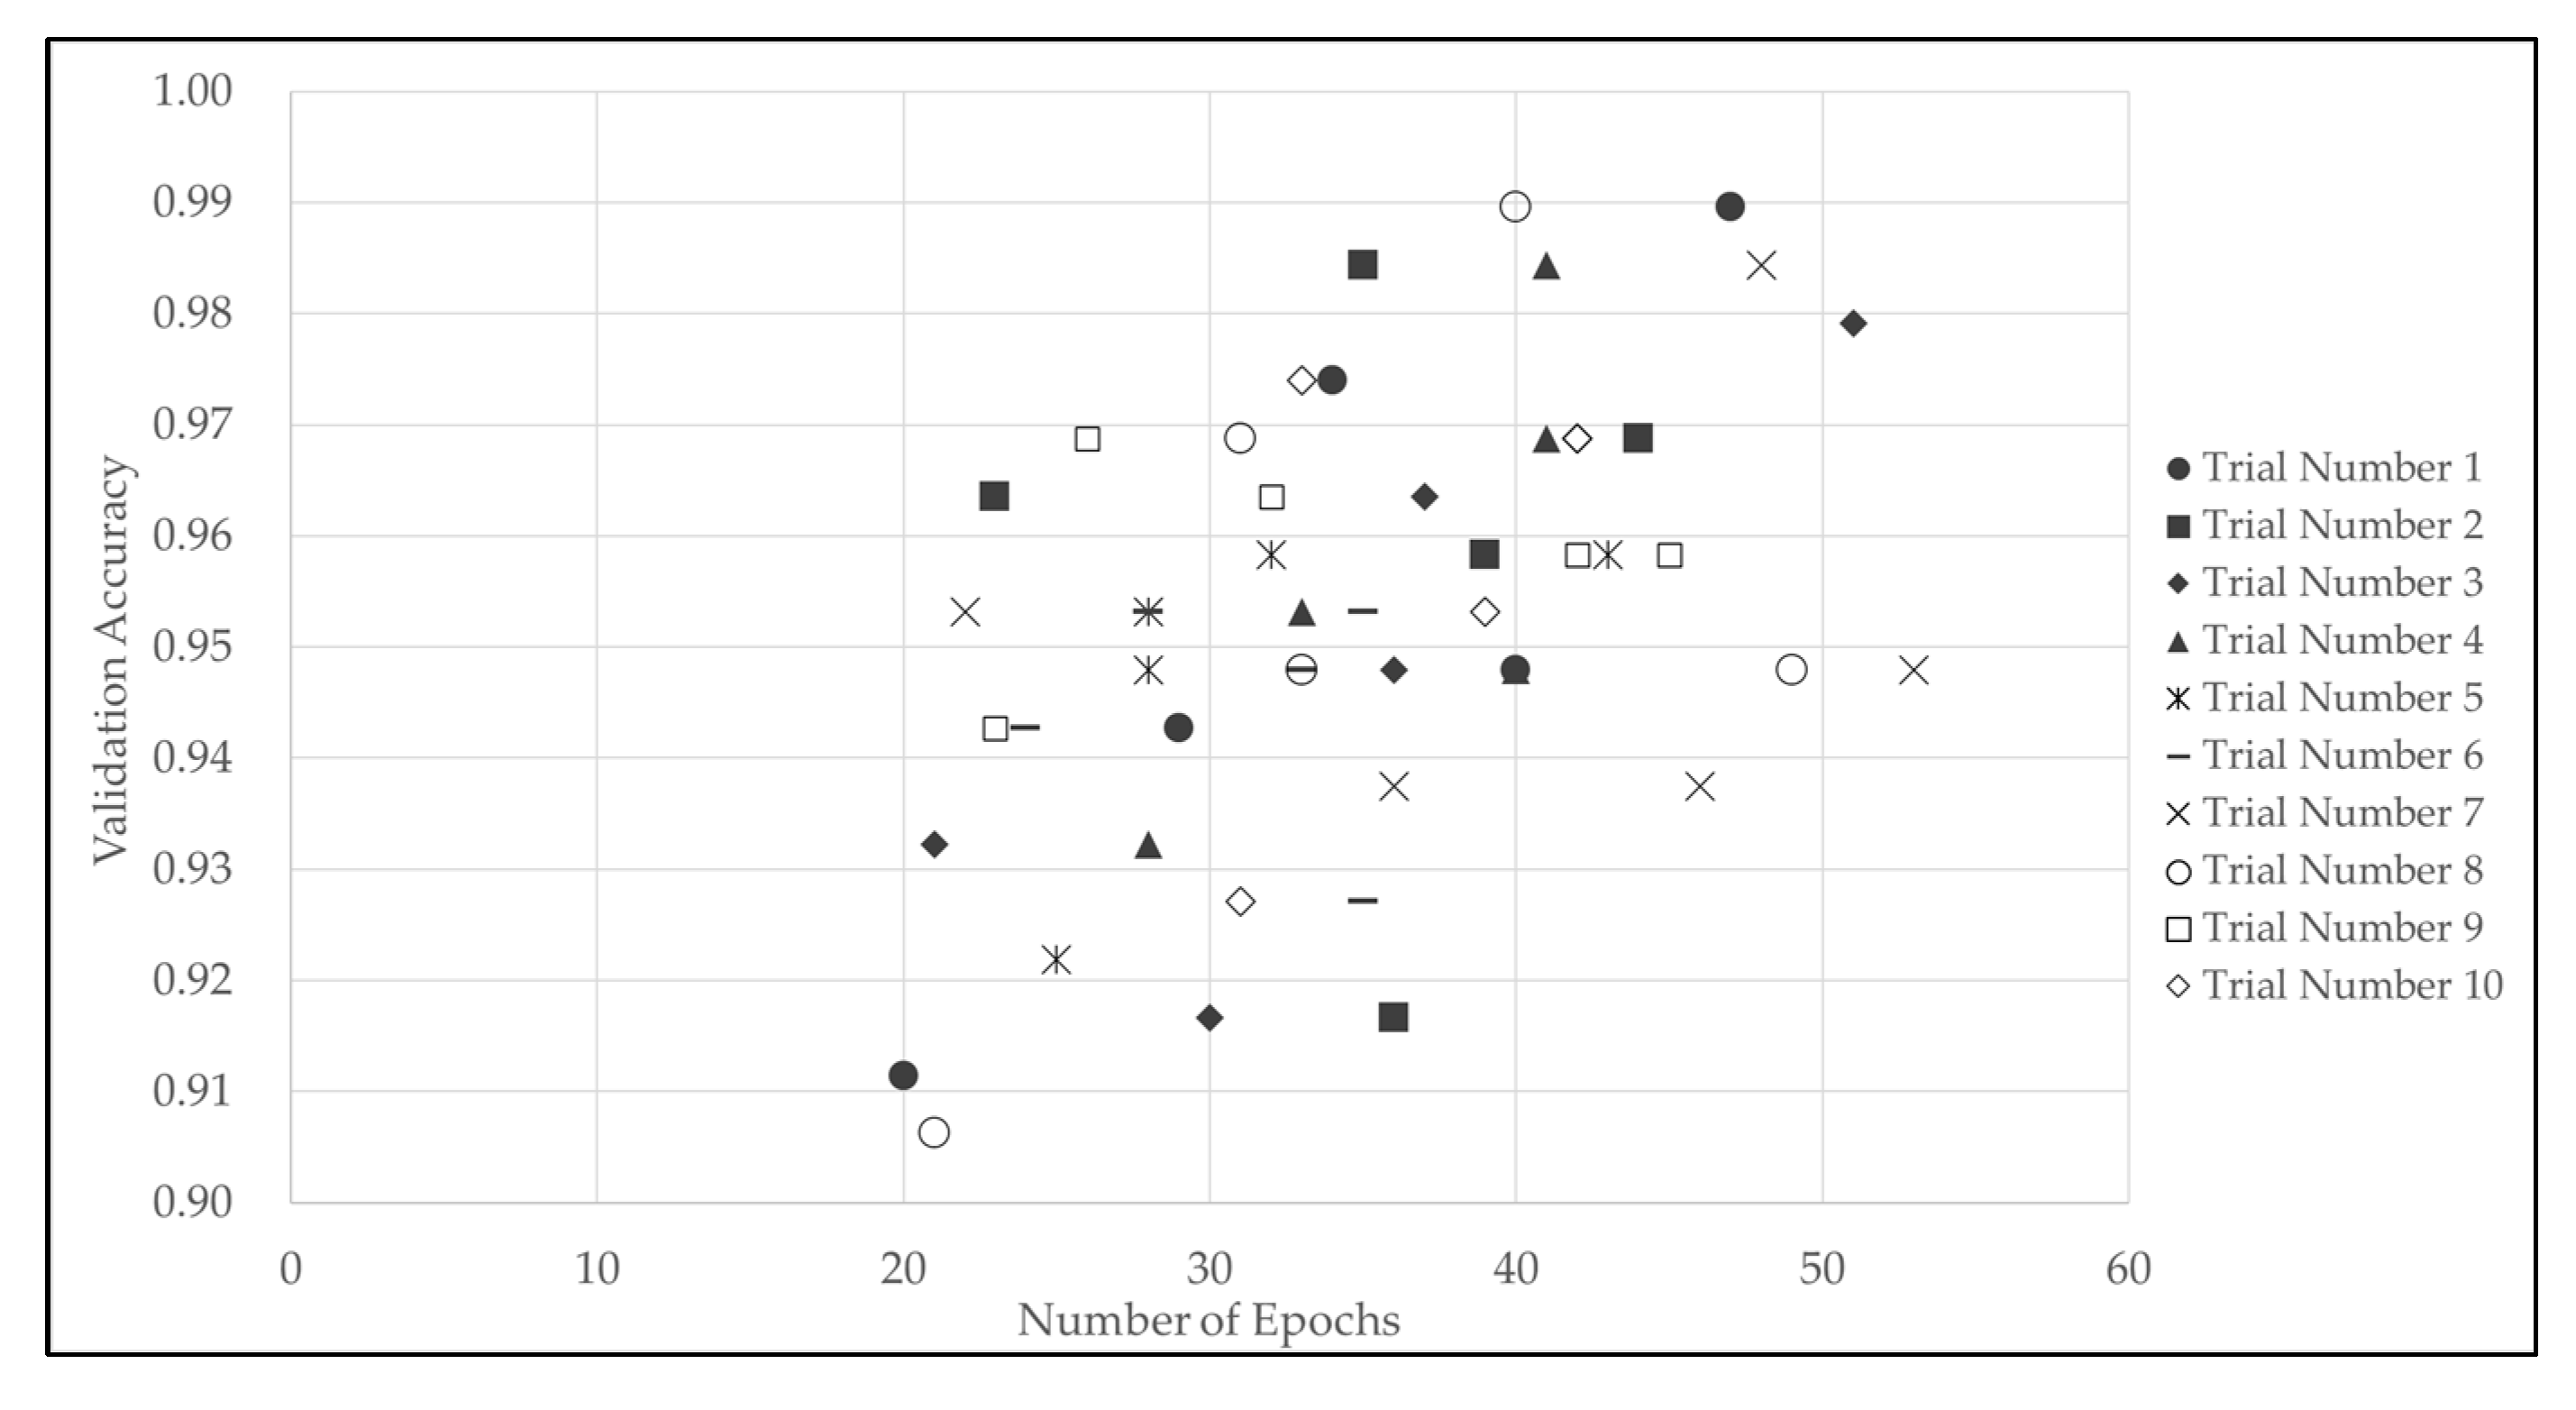
Figure 3.
Representative example of preprocessed fluorescence fingerprint images (cropped).
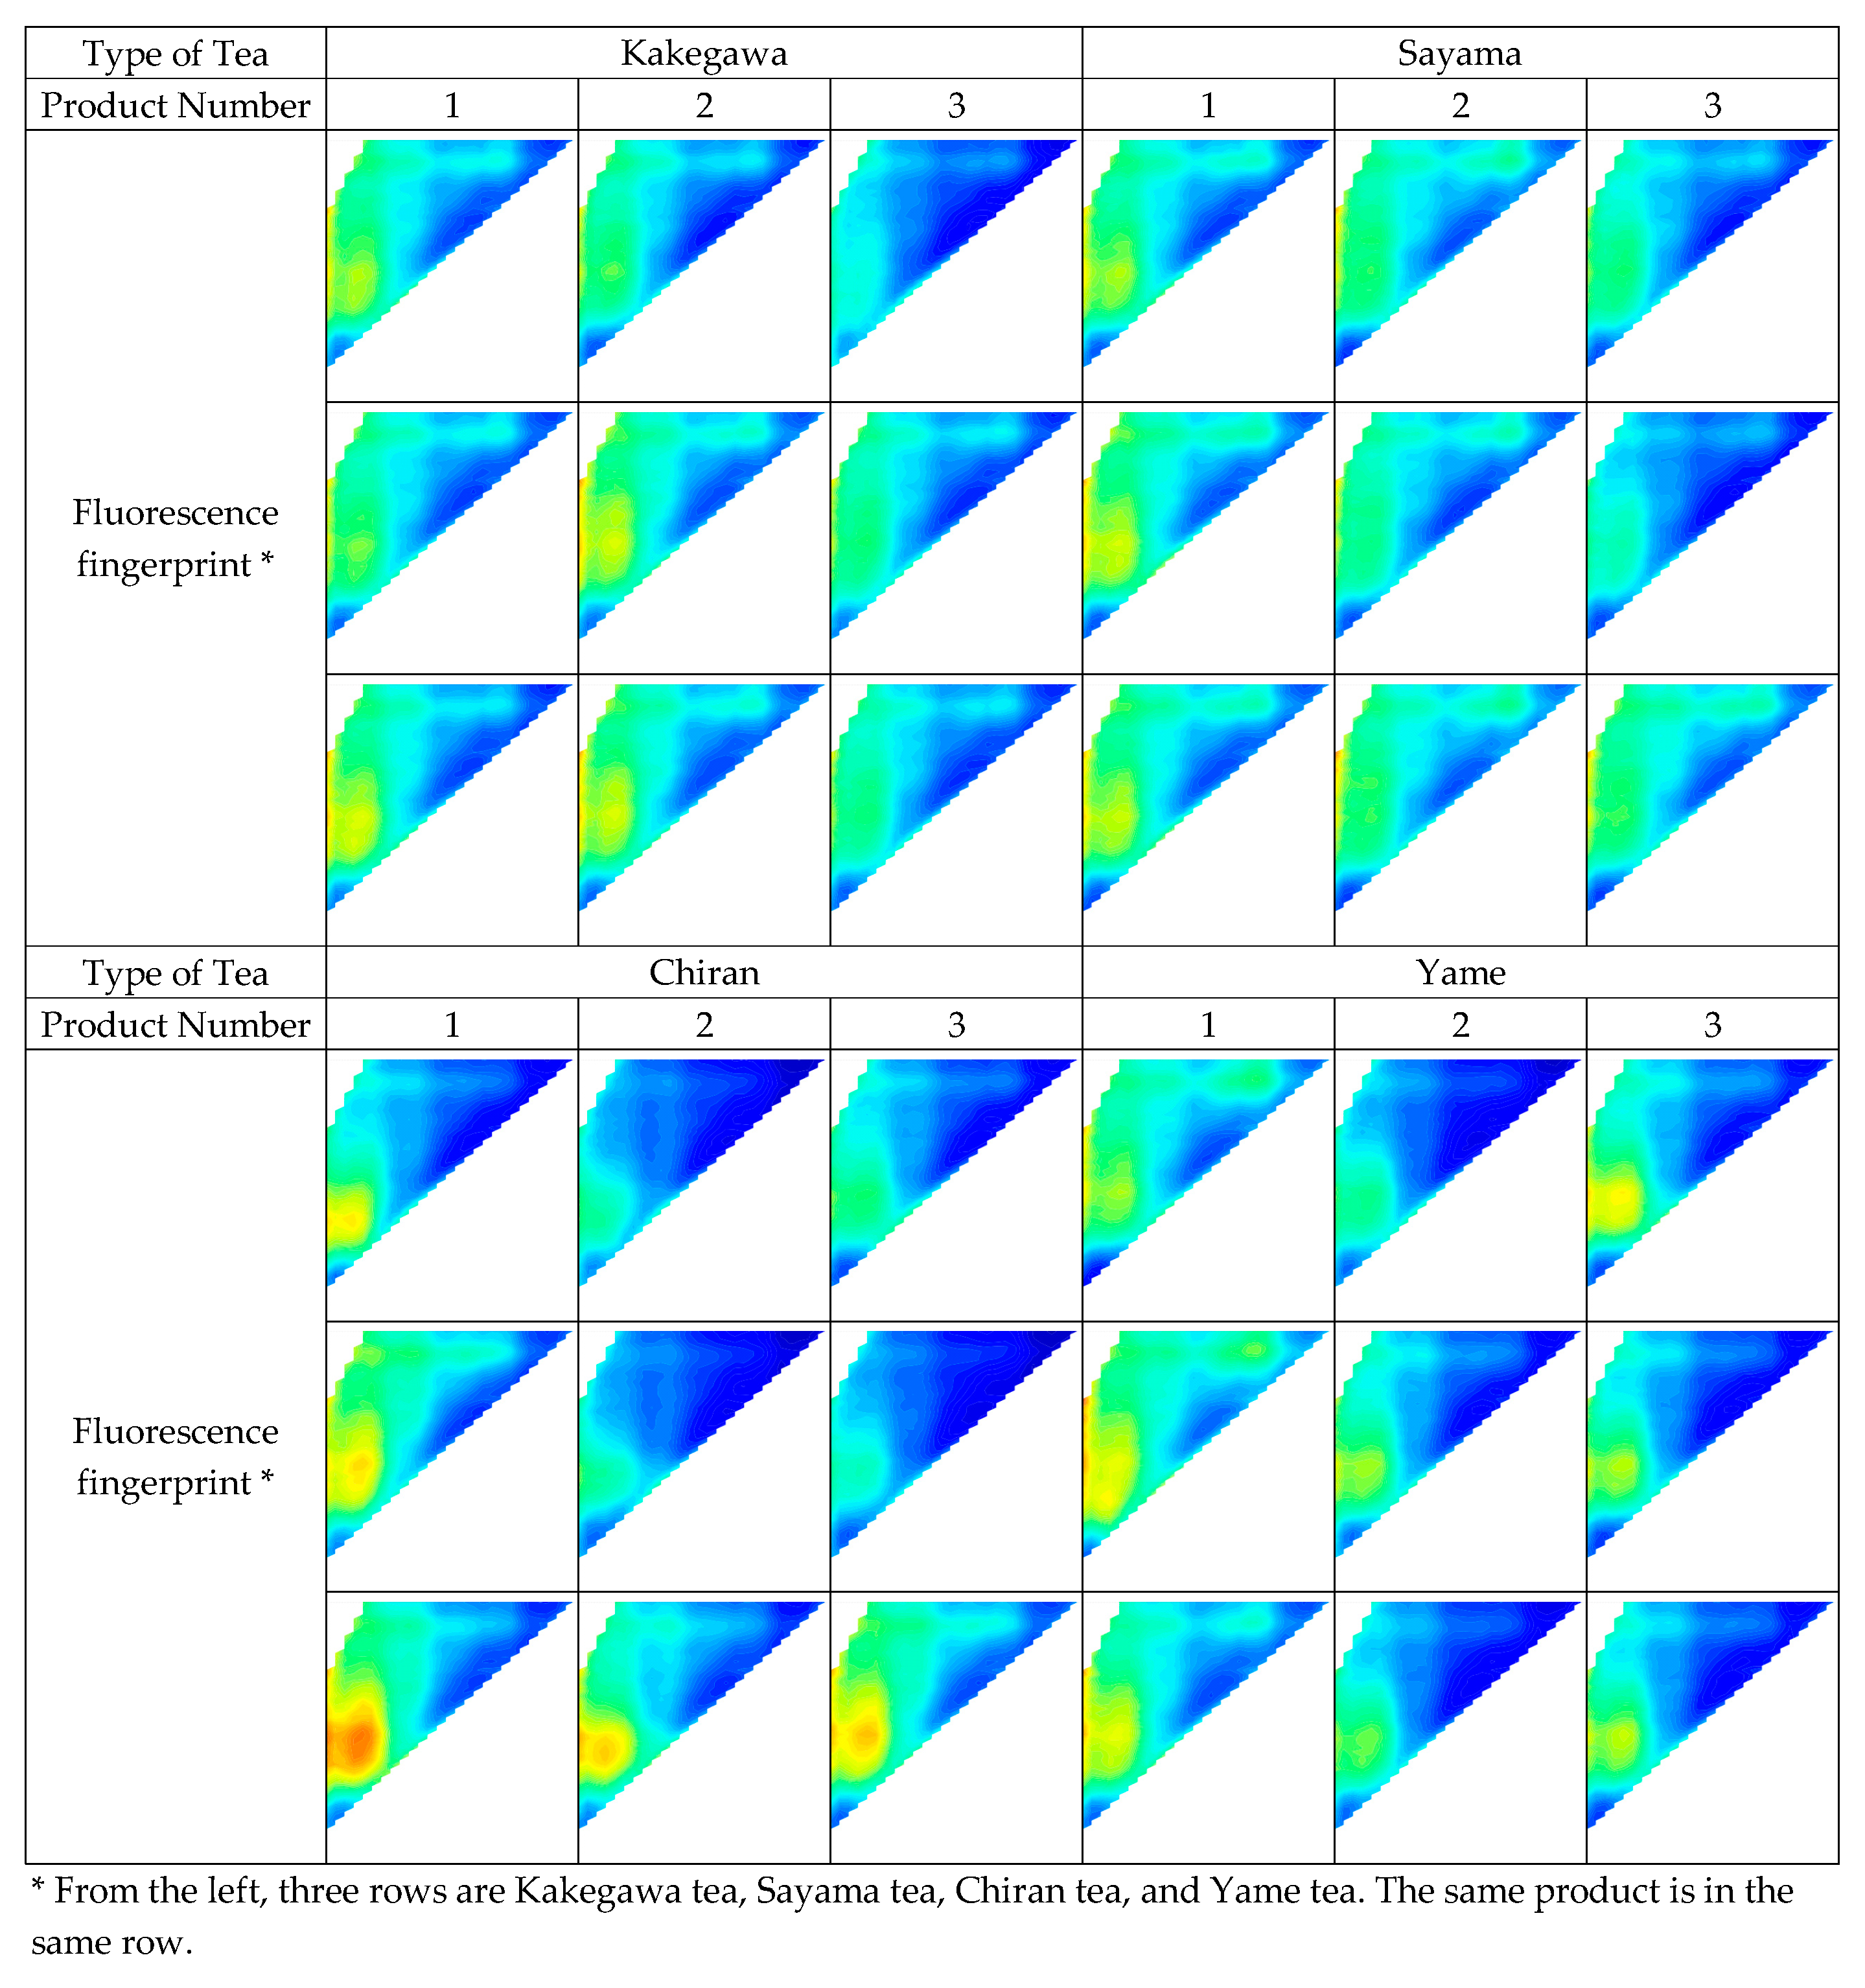

Table 1.
Accuracy and loss of test data by weighted average ensemble method based on the accuracy of each fold of 10 trials.
Table 1.
Accuracy and loss of test data by weighted average ensemble method based on the accuracy of each fold of 10 trials.
| Trial Number | Accuracy | Loss |
| 1 | 0.9375 | 0.8438 |
| 2 | 0.9375 | 0.8289 |
| 3 | 0.9125 | 0.8561 |
| 4 | 0.9417 | 0.8287 |
| 5 | 0.9125 | 0.8690 |
| 6 | 0.9042 | 0.8640 |
| 7 | 0.9333 | 0.8581 |
| 8 | 0.9375 | 0.8454 |
| 9 | 0.9333 | 0.8525 |
| 10 | 0.9333 | 0.8404 |
| Mean | 0.9283 | 0.8487 |
| Standard Deviation | 0.01329 | 0.01376 |
Standard deviation is rounded to the nearest 6 decimal places and listed to the 5th decimal place. Other values are rounded to the nearest 5 decimal places and listed to the 4th decimal place.
Table 2.
Classification performance evaluation index values for each production area (average of 10 trials).
Table 2.
Classification performance evaluation index values for each production area (average of 10 trials).
| Type of Tea | Precision | Recall |
| Kakegawa | 0.8477 | 0.9383 |
| Sayama | 0.9322 | 0.8117 |
| Chiran | 0.9539 | 1.0000 |
| Yame | 0.9932 | 0.9633 |
Rounded to the nearest 5 decimal places, and listed to the 4th decimal place.
Table 3.
Confusion matrix.
| Type of Tea | Predicted | ||||
| Kakegawa | Sayama | Chiran | Yame | ||
| True | Kakegawa | 56.3 | 3.4 | 0 | 0.3 |
| Sayama | 10.3 | 48.7 | 0.9 | 0.1 | |
| Chiran | 0 | 0 | 60 | 0 | |
| Yame | 0 | 0.2 | 2.0 | 57.8 | |
Average of 10 trials.
Table 4.
Number of epochs per fold for each trial.
| Fold | |||||
| Trial Number | 1 | 2 | 3 | 4 | 5 |
| 1 | 29 | 20 | 47 | 40 | 34 |
| 2 | 39 | 36 | 23 | 44 | 35 |
| 3 | 36 | 30 | 21 | 37 | 51 |
| 4 | 33 | 28 | 41 | 40 | 41 |
| 5 | 43 | 25 | 28 | 28 | 32 |
| 6 | 33 | 35 | 24 | 35 | 28 |
| 7 | 53 | 46 | 22 | 36 | 48 |
| 8 | 33 | 21 | 40 | 49 | 31 |
| 9 | 23 | 42 | 26 | 45 | 32 |
| 10 | 42 | 31 | 33 | 39 | 42 |
| Excitation wavelength (nm) | Emission wavelength (nm) | |
| Catechins (EC, EGC, ECG, EGCG) | 250-295 | 300-390 |
| Tea polyphenols, flavonoids | 200-400 | 300-500 |
| Fulvic acid | 255-500 | 380-580 |
| Humic acid | 250-500 | 350-600 |
The wavelengths of catechin, fulvic acid, and humic acid are the values obtained by the author from reading the EEM spectrum.
Disclaimer/Publisher’s Note: The statements, opinions and data contained in all publications are solely those of the individual author(s) and contributor(s) and not of MDPI and/or the editor(s). MDPI and/or the editor(s) disclaim responsibility for any injury to people or property resulting from any ideas, methods, instructions or products referred to in the content. |
© 2024 by the authors. Licensee MDPI, Basel, Switzerland. This article is an open access article distributed under the terms and conditions of the Creative Commons Attribution (CC BY) license (http://creativecommons.org/licenses/by/4.0/).
Copyright: This open access article is published under a Creative Commons CC BY 4.0 license, which permit the free download, distribution, and reuse, provided that the author and preprint are cited in any reuse.


