
Submitted:
05 April 2024
Posted:
05 April 2024
You are already at the latest version
Abstract
A multimodal detection system with complementary capabilities for efficient detection was developed for impurity detection. The system consisted of a visible light camera, a multispectral camera, image correction and registration algorithms. It can obtain spectral feature and color feature at the same time, and has higher spatial resolution than a single spectral camera. This system was applied to detect impurities in Pu ’er tea to verify its high efficiency. The spectral and color features of each pixel in the images of Pu ’er tea were obtained by this system and used for pixel classification. The experimental results show that the accuracy of Support Vector Machine (SVM) model based on combined features is 93%, which is 7% higher than that based on only spectral features. By applying median filtering algorithm and contour detection algorithm to the label matrix extracted from pixel-classified images, 8 impurities except hair were detected successfully. Moreover, taking advantage of the high resolution of visible light camera, small impurities can be clearly imaged. By comparing the segmented color image with the pixel-classified image, small impurities such as hair could be detected successfully. Finally, it is proved that the system can obtain multiple images to allow a more detailed and comprehensive understanding of the detected items, and has excellent ability to detect small impurities.
Keywords:
multimodal detection system
; combined feature
; impurity detection
; machine learning
; small impurity
1. Introduction
The multimodal imaging system refers to a sophisticated technology that combines different imaging modalities to provide a comprehensive view or analysis of a subject, such as the human body, geological formations, materials, etc. This integrated system enables simultaneous or sequential acquisition of multiple types of images or data, allowing for a more detailed and holistic understanding of the subject under investigation. Multimodal imaging systems find diverse applications across various fields due to their ability to provide comprehensive insights by combining different imaging techniques. Some of the key applications include Medical Diagnostics. [1,2,3,4], Biomedical Research [5], Environmental and Earth Sciences [6,7]. In addition, the detection content in the industry is becoming more and more complex, and the information obtained by a single sensor can not meet the needs of detection. Therefore, multimodal imaging systems are gradually used in the industry for detection in recent years. Zhao et al. (2023) utilize a mulitmodal information acquisition and test platforn that contain a camera and an IR thermal image to achieve accurate recognition of coal and gangue [8]. Xu et al. (2022) developed a defect-detecting system based on unmanned airships, integrated panoramic CCD cameras, three-dimensional laser scanners, inertial measurement units, barometric altimeters, illumination sensors, and control modules, sucessfully detect the defect of vertical shaft surface [9]. Saran et al. (2022) used a multi modal imaging (Polarization camera)-based system to detect foreign objects on the surface of a coal carrying conveyor [10]. In addition, there are some other studies on the application of multimodal imaging systems in industry. [11,12,13,14]
In this study, we developed a multimodal imaging-based impurity detection system having complementary capabilities for efficient detection which includes a multispectral camera for obtaining the spectral features, and a visible light camera for obtaining the color features. It can obtain more information for more accurate analysis of the sample, and the visible light camera effectively makes up for the shortcomings of low resolution of multispectral camera. In this study, this system was used to detect impurities in Pu ’er tea and verify the effectiveness of this system. In recent years, with the rapid development of electronic technology, computer technology, image processing technology, machine vision and vision-related disciplines, machine vision technology has gradually been applied to impurity detection. The traditional research process of automated impurity detection is to select the appropriate sensor to obtain the relevant features according to the feature differences between the detected items and impurities, and then use the machine learning method to classify. Md et al. (2017) utilized a digital camera that combines back, front and structured lighting to achieve soybean quality evaluation. Then a series of image processing algorithms were used to successfully identified the dockage fractions with an accuracy of 96% for slit beans, 75% for contaminated beans, and 98% for both defect beans and stem/pods [15]. Mahirah et al. (2017) developed a machine vision system with double lighting and an image processing algorithm were developed to detect undesirable objects in the paddy. Based on HSI color features and geometrical feature, a series of image processing algorithms were utilized to detect undesirable objects and damaged grain in paddy [16]. Shubham et al. (2019) has presented an automatic, real-time and cost-effective image processing based system for classification of rice grains into various categories according to their inferred commercial value. Extracted geometrical features in spatial domain and utilized SVM(support vector machine) for multiple-class classification. Senni et al. (2014) used infrared thermography to detect impurities in biscuits [17]. The traditional image segmentation (e.g., Otsu’s method and co-occurrence matrix), handcrafted feature extraction (e.g., the texture features) and classification approaches (e.g., fuzzy clustering and support vector machine) were used to detect the impurity in cotton [18,19,20]. Sun et al. (2023) utilized electromagnetic vibration feeder combination with terahertz time-domain spectroscopy(THz- TDS), effectively detecting tea stalk and insect foreign bodies in finishing tea products. The overall accuracy of KNN model is 95.6% [21]. These impurity detection work has achieved good results. However, with the increasing demand for automated detection, the characteristics of the detected substances are more complex and there are more types of impurities to be detected. This often makes it difficult to select the right sensor for classification. The information obtained by a single sensor is limited and often cannot meet the needs of classification. Machine vision system with multiple types of sensors participating in information integration will fill this gap [22].
Pu ‘er is a major kind of post-fermented tea made with a ‘large leaf’ variety of Camellia sinensis (C. sinensis assamica), whose distribution is limited to the mountains of southern Yunnan, China. Pu ‘er tea, a unique postfermented tea produced in China, has antiobesity, hypolipidemic, and antioxidative properties [23]. In the process of picking fresh Pu ’er leaves and the subsequent processing, Pu ’er tea is prone to being adulterated with impurities including tea stalks, tea fruits, branches, and grains, significantly impacting its taste and quality. If Pu ’er tea products containing impurities flow into the market, it will affect the commercial reputation of manufacturers and the health of consumers. In order to improve the quality of Pu ’er tea, the impurities in Pu ’er tea must be removed during processing. The traditional impurity sorting method of Pu ‘er tea is manual selection, which is labor-intensive, time-consuming, and inefficient. In addition to manual selection, color sorters are also employed for the identification and removal of impurities in tea. Traditional color sorter utilize photoelectric detection technology to automatically sort out the discolored objects according to the different optical properties of samples. Color sorters are mainly used in agricultural machineries like rice sorter, bean sorter, peanut sorter etc. It reduces the human effort, labor and cost [24]. However, for some impurities that have a similar color to Pu ‘er tea, it will be difficult to identify and eliminate them by traditional color sorters. More efficient and reliable methods are needed to accurately identify and remove impurities in Pu ‘er tea. Unlike soybean and paddy, tea is irregular in shape and difficult to be completely dispersed by vibration feeder, making it difficult to detect impurities using geometrical feature. The spectral imaging techniques is commonly used in tea industry [25,26,27,28,29]. Spectral imaging techniques mainly include Multispectral imaging(MSI) and Hyperspectral imaging(HSI). The imaging speed of multispectral cameras is faster than that of hyperspectral cameras, which is more suitable for rapid detection. However, using multispectral camera to detect impurities in Pu ‘er tea will miss tiny impurity due to the low resolution of spectral camera. Multispectral camera can obtain the spectral information of tea, but its resolution is too low to meet the needs of detecting small impurities. The visible light camera just makes up for this disadvantage, and can integrate color features to improve classification accuracy. Therefore, it is necessary to use multiple sensors to obtain more information and achieve more accurate identification of tea impurities.
The purpose of this study is to build a multimodal detection system, including system design, image preprocessing and image registration. Then explored the effect of its first application in the detection of impurities in Pu ’er tea. Through experiments to verify that using this multimodal detection system can improve the accuracy of classification compared with using a single multispectral camera and verify this system has the ability of detecting small impurities. The multimodal detection system for impurity detection provides a reference for solving increasingly complex detection projects, and is expected to promote the application of multimodal systems in industry. The aim of this study is to achieve rapid and accurate identification of impurities in Pu ‘er tea.
2. Materials and Methods
2.1. Multimodal Detection System
In this study, a compact and efficient spectral imaging module (GX-IRSV-1100, Guangzhou Guangxin Technology Co., Ltd., China) was used to acquire near-infrared diffuse spectral images of the sample surface. The spectral imaging module can obtain 10 spectral images at visible and near-infrared wavelengths, corresponding to 713, 736, 759, 782, 805, 828, 851, 874, 897 and 920nm, with an image resolution of 1024×1280 pixels and its field of view is 40°×31.5°×25.5°. Compared with other multi-spectral camera, this spectral imaging module has the characteristics of small size, low cost and high efficiency, and is very suitable for rapid detection, because it adopts F-P Interferometer to select the wavelength of light through, and all spectral images are obtained by the same CMOS sensor. In addition, a high-resolution visible light camera (MV-CS050-60GC, HIKROBOT) with a higher resolution(2448×2048 pixels) than the spectral camera was used to obtain color images. A lens(MVL-MF1224M-5MPE, HIKROBOT) suitable for the camera was selected, and the field of view was slightly larger than that of the spectral camera (49.6°×39°×33°). Halogen lamps (MR16, Royal Dutch Philips Electronics Ltd, Netherlands) with a power of 50 W were used as light sources, and the white PU conveyor belt was used as the background of the samples. Figure 1 shows the imaging system used in this experiment. The distance between the spectral imaging module and the visible light camera is about 10cm, and the vertical distance between the camera and the sample is about 78cm. Four halogen lamps are distributed in four corners and installed on adjustable brackets to adjust the angle and height of the light. The vertical distance between the halogen lamp and the sample is about 63 cm. In order to ensure the stability of data acquisition and eliminate the impact of sensor baseline signal and ambient light, a standard diffuse whiteboard with the same reflectivity in the working band was used to calibrate the original data. The method is shown as follows:
Where I is the calibrated data, Io is the original data, W is standard whiteboard data, B is the black calibration data captured when the camera sensor is covered, and r is the whiteboard reflectance(50% here).
After impurity data acquisition and calibration, the threshold segmentation method in OpenCV library is used to extract the region of interest(ROI) of each impurity sample. For different impurities, segmentation methods with better segmentation effect are adopted, including threshold segmentation method and automatic threshold segmentation method. Some impurity images with low contrast are segmented after image enhancement.
2.2. Image Registration
The images obtained by visible and multispectral cameras have a certain amount of pixel offset and a slight spatial offset. The images obtained by the two cameras need to be registered to achieve the combined features before pixel classification. In the process of image registration, the position of the two cameras is adjusted first, and then the self-made calibration plate is placed on the conveyor belt to be shot by the two cameras separately. Since the 828nm spectral image in the multi-spectral camera had the best imaging quality, the 828nm spectral image in the multispectral camera was used for image registration. After whiteboard calibration of the 828nm spectral image, the 512×512 pixel region in the middle was intercepted. There are three common methods for image registration, which are area-based pipeline, feature-based pipeline and learning-based pipeline [30]. The feature-based pipeline can effectively resist the influence of geometric distortions (e.g., scale and rotation changes), so the feature-based pipeline is adopted in this study. SIFT algorithm was used to obtain the feature points of the color and spectral images of the calibration plate. KNN feature point matching method was adopted to find the matching feature points of the two images. Using the coordinates of the matched feature points, the perspective transformation matrix between the two cameras was obtained. Finally, the color images are registered with the spectral images through perspective transformation matrix. The specific registration process is shown in Figure 2.
2.3. Sample Preparation
All Pu ’er tea and impurity samples used in this study were provided by a prominent Pu ’er tea industry leader in Yunnan Province, China. All impurity samples are manually selected from the production line, then sorted and stored in specific containers. Impurity classes are extremely numerous, making it challenging to classify them clearly. The impurity categories include tea stalk, bamboo, leaf, wood, tea fruit, stone, cotton, plastic and hair. Each impurity was selected and sealed in polyethylene(PE) bags in sufficient quantity, which was used to acquire the spectral features and color features of impurities to establish a classification model. In addition, a certain amount of tea was mixed with various impurities in the other two bags, which were set aside as test samples for conducting experiments and verify the feasibility of the impurity detection method in this study.
2.4. Spectrum Feature and Color Feature
After the tea was dispersed by the vibration feeder, there was still overlap between tea leaves and overlap between tea and impurities. There will be misjudgment in identifying the category of each connected domain according to the spectral and color features of the connected domain. Pixels are basic components of images. Each pixel in the spectral image and color image contains spectral feature and color feature (R, G, B), respectively. Since the surface feature of Pu ‘er tea and impurities are uniform, pixel classification will be adopted in this experiment. A total of 11 kinds of pixels, including 9 impurities, tea and white PU conveyor belt. Each sample, including 9 types of impurities and tea, was separately spread out on the white PU conveyor belt and imaged by the multimodal detection system. After the images of each sample were obtained, whiteboard correction and image registration were performed on it. For each sample, the color image has the best quality among the color image and 10 spectral images. Therefore, different threshold segmentation methods were used in color images to obtain the ROI of each sample image.
Each pixel in a spectral image corresponds to a spectral curve, and each pixel in a color image corresponds to three-channel(RGB) gray values.The reflectance at 10 wavelengths were used as the spectral feature, and the color feature is RGB color feature. The reflectance at 10 wavelengths and the three-channel gray values of RGB image, a total of 13 feature values were used as combined feature. Each pixel was classified using spectral feature and combined feature respectively. The final classification results will be compared to verify the effectiveness of this system.
2.5. Modelling and Evaluation
In this study, we only need to identify impurities, and do not need to classify impurities. Therefore, the pixel datasets were divided into three categories: white background, Pu ’er tea and impurity, in which the impurity pixel datasets consists of the same number of pixels for each impurity class. For each type of pixel datasets, the pixels randomly divided into data set A and data set B in a ratio of 6:4. Data set A was used to train the machine learning model, and data set B was used to evaluate the trained model. In this study, the accuracy rate, that is, the proportion of correctly classified samples to the total number of samples, was used as the main index to evaluate the model. For the models with the highest accuracy, in order to evaluate their performance more comprehensively, precision, recall and F1-score were used to evaluate it. The formulas for precision, recall and F1-score are as follows:
Where TP, TN, FP, FN are true positive, true negative, false positive and false negative, respectively.
In this study, a machine learning model was established to analyze the processed data and accurately classify pixels. Commonly used machine learning algorithms include support vector machine (SVM), K-nearest neighbor (KNN), Random forest (RF), decision tree (DT), etc.
SVM is a nonlinear classifier, commonly used to solve classification problems. The kernel function solves the nonlinear problem of the classification hyperplane by mapping the non-separable data into a higher dimensional space. The algorithm still has good classification performance when the number of training samples is limited. If classes are separated by nonlinear boundaries, SVM uses kernel functions to enable linear separation of classes. Radial basis function(RBF) is mostly employed because of its simplicity and speed during its computation. [26]
KNN is a commonly used data mining algorithm, which is an instance-based supervised learning algorithm. When using KNN for prediction, all the training data is involved in the calculation. After K nearest neighbor points are found, the category of the points to be measured is determined by voting method based on distance. The selection of k had a certain effect on the recognition performance during the establishment of the KNN model.The optimal K value can be obtained by cross-validation method.
RF is an ensemble learning algorithm based on decision tree, which uses multiple decision trees to carry out parallel independent prediction classification, and then obtains the classification result through voting statistics among multiple trees. In RF setting, to ensure the data difference and data quantity in each sub-dataset, bootstrap method is used to randomly select datasets and features, and sub-datasets are constructed for base decision tree training. Therefore, RF is not easy to fall into overfitting, has good anti-noise ability and has strong robustness. [25]
Decision tree methodology is a commonly used data mining method for establishing classification systems based on multiple covariates or for developing prediction algorithms for a target variable. This method classifies a population into branch-like segments that construct an inverted tree with a root node, internal nodes, and leaf nodes. The algorithm is non-parametric and can efficiently deal with large, complicated datasets without imposing a complicated parametric structure. [36]
All of these machine learning models have some hyperparameters that need to be manually determined before training. Cross-validation and grid search are used to select the optimal hyperparameters. In the experiment, only training set was used for cross-validation and grid search to avoid data leakage in testing set which will result in inaccurate model evaluation.
3. Results
3.1. Feature Analysis
3.1.1. Spectral Analysis
A total of more than 400,000 pixels were extracted from the ROI of sample images, the specific number is shown in the Table 1. In each type of pixel datasets, 2000 pixels were randomly selected for the experiment. Using the spectral features of these pixels, the average spectral curve of each type is drawn to verify the differentiation of each type of spectrum. The spectra curves of 30 pixels were randomly selected from these 2000 pixels to draw raw spectral curves for the analysis of spectral features. Figure 3 shows that spectra belonging to the same category exhibit similar trends and comparable intensities, while spectra of different categories exhibit significant differences in intensity and trends. Similar trends indicate that the samples have similar chemical compositions, while differences in intensity are related to variations in the chemical content and surface morphology of the samples. However, some spectral curves belonging to the same category have intensity fluctuations, causing the spectral curves of different categories overlapping at some wavelengths. That is because the reflection spectrum in different parts of the same sample are also different due to the granularity and height of sample surface. However, it can be seen from the average spectral curves that there are obvious differences between spectral curves of different categories. Although the intensity of spectral curves of different categories can not be distinguished at some wavelengths due to the physical properties of the sample and noise, the reflectance at ten wavelengths can still be used to distinguish each categories, which is why the reflectance at ten wavelengths were used as a spectral feature.
3.1.2. Principal Component Analysis(PCA)
Principal Component Analysis(PCA) is the most widely used dimensionality reduction algorithm [31]. After dimensionality reduction, the scatter plot of principal components can judge the degree of differentiation of different categories of data and the degree of aggregation of each category of data. The dimensionality of spectral feature data and combined feature data was reduced by PCA and retaining the first two principal components. The cumulative contribution rate of the two principal components exceeds 97%, which indicates that PCA results can explain the characteristics of the original feature information. The scatter plot of the PCs values for some training data points in a 2D image is shown in Figure 4. It can be seen that compared with color features and spectral features, combined features have better performance. In the first two principal components scatter plot of combined features, the features of each category of data are more aggregated, and the distinction between different categories of data is more obvious. From the scatter point plots of first two of component of the combined features of each type of pixel, it can be seen that tea fruit, tea stalk and leaves are easily misjudged as tea.
3.2. Comparison of Different Models
Since impurity identification only needs to detect impurities without classifying different impurities, the same number of pixels are randomly selected from the 9 impurities to form an impurity sample containing 2000 impurity pixels. In addition to the impurity samples, there are also sample of Pu’ er tea containing 2000 pixels of Pu ‘ er tea and background sample containing 2000 pixels of white conveyor belt. These pixel samples are divided into the training set and the test set in a ratio of 6:4. In this study, SVM [32,33], KNN [34], RF [35], and DT [36] models were established respectively and the best parameters were set by grid search algorithm. Compare models using only spectral features with models using combined features. The results show the SVM model using combined features has a highest classification accuracy of 93%. As shown in Table 2, compared with SVM model using only spectral features, the overall accuracy is increased by 7% after adding color features.
Confusion matrix is a specific table layout used to visualize the performance of supervised learning algorithms, especially classification algorithms. In this matrix, each row represents the actual category and each column represents the predicted category. Each cell of the matrix contains the number of samples in that actual and predicted category. With the confusion matrix, we can not only calculate evaluation metrics such as accuracy, precision, and recall, but also get a more complete picture of the model’s performance across different categories. The confusion matrix for classifying tea, impurities and background using SVM is shown in Figure 5. The confusion matrix shows the prediction results in the test set. In order to know which impurities are easily misjudged as tea, a classification model of various impurities was established. The corresponding confusion matrix was obtained and shown in Figure 5. It can be seen that pixels of tea stalk, tea fruit and leaves are easily misjudged as tea pixels.
3.3. Classification Results
All types of impurities were included in the test images, which were used to verify the effectiveness of the detection method in this study. There are a total of 8 test images, and Figure 6 show the processing results of 4 of them. The best trained model was used to process the tested images, and the pixel-classified images obtained was shown in the second column of Figure 6.
4. Discussion
4.1. Post-Processing
In the classification images directly inferred by the model, mainly has two types of misclassification: first, there are chaotic misjudgment pixels at the edge of the object, it can be seen that there were chaotic red dots of misjudgment at the edge of the object in the pixel-classified images; second, there are misjudgment pixels in the object region, especially in the impurities of cotton thread, tea fruit and hair.
For the first type of misjudgment, there are two main reasons, one reason was that shadow was still be generated around the object under the irradiation of the four-corner light source, resulting in changes in the spectral features and color feature of the edge area of the object. Another reason was that there were still a certain pixel offset after the spectral image is registered with the color image, which depends on the matching degree of feature points of the two images and the accuracy of the image registration algorithm. For this type of misjudgment, algorithms can be used to solve it. Mode filtering, that is, each pixel is set to the label value with the highest proportion in the window of a certain area of the pixel, can be used to deal with these chaotic misjudged pixels. However, considering the algorithm time, the label matrix was obtained and processed by median filtering algorithm. In the label matrix, the predicted position of impurities is assigned 2, and the remaining positions, including the background and Pu ’er, are assigned 0. Using the median filter in the label matrix could achieve the effect of mode filter, which greatly reduces the time. The result after processing is shown in the third column of Figure 6.
For the second type of misjudgment, this is due to the low resolution of the spectral camera, the low feature differentiation and surface morphology of the object. The main reason for the misjudgment of hair impurities is that the spectral camera resolution is too low to clearly image small impurities, resulting in the inability to obtain the spectral feature of hair. For tea fruit impurity, mainly because the spherical surface will cause the reflection spectrum of different parts of the surface to be different. For cotton impurities, it is mainly due to the low feature differentiation. However, the impurity region was extracted by contour detection algorithm. It is shown in the four column of Figure 6 that although there were misjudgments in the regions of these two types of impurities, they could be accurately detected after post-processing. In addition, From the impurity detection results of sample 1, it can be seen that the hair was missed. This was because the multispectral camera resolution is too low to clearly image small impurities such as hair, resulting in the inability to obtain the spectral feature of hair. In addition to this, all impurities except the hair were successfully detected after post-processing.
4.2. Small Impurity
Multispectral cameras require a larger CMOS sensing area to receive sufficient light intensity, so their resolution is not very high. Small impurities such as hair, which is only 1mm wide, will not be clearly shown in the spectral images. This will result in a serious loss of the spectral feature of the hair region. However, because the resolution of the visible light camera in the multimodal detection system is higher than that of the multispectral camera, it can clearly image small objects such as hair. The multi-modal detection system can effectively extract the color features of the hair region, so that such impurities as hair can be detected to a certain extent. In the second column of Figure 5, it can be seen from the classification image of sample1 directly inferred by the model that the hair region predicts intermittent red dots. However, in the process of removing the messy misjudged red dots, pixels predicted to be impurities in the hair regions are processed into background pixels. In the third column of Figure 5, as can be seen from the pixel-classified images processed by mode filtering in sample 1 that the hair regions were all processed into background, which leads to missing detection of hair impurities later in the process of using contour detection algorithm in the impurity mask. The process of using this system to detect small impurities is shown in Figure 7. Taking advantage of the high resolution of visible light camera, hair can be clearly imaged. In the color image, all the regions except the background were segmented by threshold segmentation method. In the pixel-classified images after processing, the regions predicted as impurities and Pu’ er tea were segmented. Comparing the two segmentation images, the excess part of the segmented area of the color image is hair. Figure 8 shows the final detection results of the eight test images.
4.3. Model Extrapolation Capability
In the real-world scenarios, the types of impurities are highly diverse, and their categories have no boundaries. In the tea production process, it is inevitable that different types of impurities will be accidentally mixed into the tea. It is challenging to obtain data sets containing all types of impurities for model training. However, models built based on specific impurity categories may have a certain degree of extrapolation ability. To verify this capability of the model, several types of impurities that were not present in the training data were selected in this study, including cigarette butts, feathers, insects and grains. Similarly, the spectral and color features of the samples were obtained by the multimodal detection system, and the image was classified at pixel level by SVM model based on the combined features. The pixel-classified results are shown in Figure 9. The results show that although the combined features of these impurities are not captured in the training set, these impuritie objects can be accurately detected, which indicates that the established model has good extrapolation ability. The model includes three categories: background, tea and impurities, in which all types of impurities are grouped into one category. In addition, rich types of impurities and a large number of pixel data are used in the model. All these make the model have a good generalization ability, which means that the model is highly likely to have a good detection effect for some unfamiliar types of impurities.
4.4. Result Discussion and Prospect
Through the experimental results, it can be verified that the multi-modal detection system can effectively detect impurities in tea.The detection time for each 512×512 pixel image is about 2.66s, which is ideal for rapid non-destructive detection. The factors that affect the detection efficiency are not only the detection algorithm time, but also the imaging time and the imaging field of view. The multispectral camera used in this study has fast imaging speed and the image registration algorithm is simple and fast. The total imaging and image registration time is less than 3s. Due to the limitation of the size of the correction whiteboard in the experiment, the actual field of view corresponding to the image is about 20cm×20cm. In practical applications, the size of the corrected whiteboard can be increased, which improves the detection field to a certain extent. A visible light camera with a slightly larger field of view than a multispectral camera is used in the experiment, but a visible light camera with a larger resolution and field of view can be selected for practical applications. However, due to the limitation of resolution of multi-spectral cameras, the field of view captured will be much smaller than that of visible light cameras, but multiple multi-spectral cameras can be used to increase the detection field. The visible light camera with larger field of view and a higher resolution is located in the center, and multiple multi-spectral cameras are installed in different directions at the same distance from the visible light cameras. Through this installation method, each multispectral camera can be paired with the same visible-light camera, thus effectively increasing the detection field.
In terms of the accuracy of the algorithm, it can be concluded from the detection results that there are problems such as incomplete detection of the impurity object region and deviation of the predicting box. This is mainly because the accuracy of pixel classification is not high enough, and some scattered impurity pixels will be processed into other types of pixels in the post-processing, which causes the object area to become incomplete. Fortunately, despite the incomplete detection of the impurity object region, all the impurity regions can be detected. This means that incomplete detection of the impurity object region will not affect the final detection accuracy of the impurity. In order to improve the accuracy of pixel classification, the instance segmentation based on deep learning method will be considered next. A total of 13 channels of multi-spectral data and visible light data were input into the network for training. Multiple image sources can provide more information, which can effectively improve the accuracy of network training results. In addition, several impurity objects are detected as the same impurity object due to overlapping or close proximity. In the subsequent process of automatic removal of impurities, this will cause some impurities to be missed.It can be solved by adding another round of impurity detection after the vibrator disperses the tea again, which can not only solve the missed detection caused by overlapping impurity objects, but also solve the missed detection caused by impurities covered by tea. However, this will increase the detection time, which needs to be balanced between accuracy and efficiency in practical applications.
The multimodal detection system designed in this experiment can obtain more abundant information from multiple cameras, and more importantly, it can make up for the shortcomings of low resolution of multi-spectral cameras. The whole system has high imaging stability and fast imaging speed, which is very suitable for rapid detection. This study confirms the advantages of this system in tea selection, which can not only improve the accuracy of pixel classification, but also improve the ability to detect small objects. It can also be used for impurity detection of other samples, such as soybean impurity detection, rice impurity detection, grain impurity detection and so on. It can also be used for crop growth monitoring, classification problems and remote sensing. The system can be used for projects that only use multispectral cameras, and the increased information and higher resolution will allow these studies to be improved to varying degrees.
5. Conclusions
In this paper, a multimodal image-based detection system containing fast imaging multi-spectral camera, visible light camera, image correction and registration algorithm was proposed and applied to the rapid non-destructive detection of impurities in Pu ’er tea to verify the feasibility and efficient detection ability of this system. The spectral features and color features of pixels in the image were obtained by the system, and the classification model was established by using combined features and spectral features respectively. The results show that adding color features can effectively improve the classification accuracy of pixels. The SVM model using combined features had the highest accuracy of 93%, which is 7% higher than the SVM model using only spectral features. In addition, taking advantage of the high resolution of the visible light camera, small impurities such as hair were successfully detected. The system successfully detected 9 kinds of impurities in Pu ’er tea, such as leaf, tea stalk and hair, which effectively verified the high efficiency of the system. The main contribution of this study is to establish a multimodal detection system, and successfully realized the rapid impurity detection of Pu ’er tea. This study provides reference for the design of multimodal detection system in industry, and provides a method of impurity detection using multimodal detection system. This is expected to promote the application of multimodal systems in industry and contribute to the development of future intelligent production systems in Industry 4.0.
Author Contributions
Conceptualization, X.Y. and Z.K.; methodology, Z.K. and Y.G.; software, Z.K., Y.G. and W.H.; validation, Z.K., Y.G.; formal analysis, X.Y. and Z.K.; investigation, Z.K. and Y.C.; resources, X.Y.; data curation, Z.K.; writing—original draft preparation, Z.K.; writing—review and editing, X.Y.; visualization, W.H. and Y.C.; supervision, X.Y.; project administration, X.Y.; funding acquisition, X.Y. All authors have read and agreed to the published version of the manuscript.
Funding
This research received no external funding.
Conflicts of Interest
The authors declare no conflicts of interest.
References
- Mukhi, S.E.; Varshini, R.T.; Sherley, S.E.F. Diagnosis of COVID-19 from Multimodal Imaging Data Using Optimized Deep Learning Techniques. SN computer science 2023, 4, 212. [Google Scholar] [CrossRef]
- Nayak, M.; Tiyadi, J. Predicting the Onset of Diabetes Using Multimodal Data and a Novel Machine Learning Method. Technical report, EasyChair, 2023.
- Houria, L.; Belkhamsa, N.; Cherfa, A.; Cherfa, Y. Multimodal magnetic resonance imaging for Alzheimer’s disease diagnosis using hybrid features extraction and ensemble support vector machines. International Journal of Imaging Systems and Technology 2023, 33, 610–621. [Google Scholar] [CrossRef]
- Spaide, R.F.; Curcio, C.A. Drusen characterization with multimodal imaging. Retina((Philadelphia, Pa.) 2010, 30, 1441–1454. [Google Scholar] [CrossRef] [PubMed]
- Heintz, A.; Sold, S.; Wühler, F.; Dyckow, J.; Schirmer, L.; Beuermann, T.; Rädle, M. Design of a Multimodal Imaging System and Its First Application to Distinguish Grey and White Matter of Brain Tissue. A Proof-of-Concept-Study. Applied Sciences 2021, 11, 4777. [Google Scholar] [CrossRef]
- Li, X.; Zhang, G.; Cui, H.; Hou, S.; Chen, Y.; Li, Z.; Li, H.; Wang, H. Progressive fusion learning: A multimodal joint segmentation framework for building extraction from optical and SAR images. ISPRS Journal of Photogrammetry and Remote Sensing 2023, 195, 178–191. [Google Scholar] [CrossRef]
- Quan, L.; Lou, Z.; Lv, X.; Sun, D.; Xia, F.; Li, H.; Sun, W. Multimodal remote sensing application for weed competition time series analysis in maize farmland ecosystems. Journal of Environmental Management 2023, 344, 118376. [Google Scholar] [CrossRef] [PubMed]
- Zhao, L.; Han, L.; Zhang, H.; Liu, Z.; Gao, F.; Yang, S.; Wang, Y. Study on recognition of coal and gangue based on multimode feature and image fusion. Plos one 2023, 18, e0281397. [Google Scholar] [CrossRef]
- Chu, X.; Tang, L.; Sun, F.; Chen, X.; Niu, L.; Ren, C.; Li, Q. Defect detection for a vertical shaft surface based on multimodal sensors. IEEE Journal of Selected Topics in Applied Earth Observations and Remote Sensing 2022, 15, 8109–8117. [Google Scholar] [CrossRef]
- Saran, G.; Ganguly, A.; Tripathi, V.; Kumar, A.A.; Gigie, A.; Bhaumik, C.; Chakravarty, T. Multi-modal imaging-based foreign particle detection system on coal conveyor belt. Transactions of the Indian Institute of Metals 2022, 75, 2231–2240. [Google Scholar] [CrossRef]
- Maheshkar, V. Improved Detection of Recyclable Plastics Using Multi Modal Sensing and Machine Learning. PhD thesis, State University of New York at Buffalo, 2023.
- Jiang, L.; Xue, R.; Liu, D. Node-Loss Detection Methods for CZ Silicon Single Crystal Based on Multimodal Data Fusion. Sensors 2023, 23, 5855. [Google Scholar] [CrossRef]
- Villafana, T.; Edwards, G. Creation and reference characterization of Edo period Japanese woodblock printing ink colorant samples using multimodal imaging and reflectance spectroscopy. Heritage Science 2019, 7, 1–14. [Google Scholar] [CrossRef]
- Lee, J.H.; Kim, B.H.; Kim, M.Y. Machine learning-based automatic optical inspection system with multimodal optical image fusion network. International Journal of Control, Automation and Systems 2021, 19, 3503–3510. [Google Scholar] [CrossRef]
- Momin, M.A.; Yamamoto, K.; Miyamoto, M.; Kondo, N.; Grift, T. Machine vision based soybean quality evaluation. Computers and Electronics in Agriculture 2017, 140, 452–460. [Google Scholar] [CrossRef]
- Mahirah, J.; Yamamoto, K.; Miyamoto, M.; Kondo, N.; Ogawa, Y.; Suzuki, T.; Habaragamuwa, H.; Ahmad, U. Monitoring harvested paddy during combine harvesting using a machine vision-Double lighting system. Engineering in agriculture, environment and food 2017, 10, 140–149. [Google Scholar] [CrossRef]
- Senni, L.; Ricci, M.; Palazzi, A.; Burrascano, P.; Pennisi, P.; Ghirelli, F. On-line automatic detection of foreign bodies in biscuits by infrared thermography and image processing. Journal of Food Engineering 2014, 128, 146–156. [Google Scholar] [CrossRef]
- Zhang, H.; Li, D. Applications of computer vision techniques to cotton foreign matter inspection: A review. Computers and electronics in agriculture 2014, 109, 59–70. [Google Scholar] [CrossRef]
- Zhang, R.; Li, C.; Zhang, M.; Rodgers, J. Shortwave infrared hyperspectral reflectance imaging for cotton foreign matter classification. Computers and Electronics in Agriculture 2016, 127, 260–270. [Google Scholar] [CrossRef]
- Zhang, M.; Li, C.; Yang, F. Classification of foreign matter embedded inside cotton lint using short wave infrared (SWIR) hyperspectral transmittance imaging. Computers and Electronics in Agriculture 2017, 139, 75–90. [Google Scholar] [CrossRef]
- Sun, X.; Xu, C.; Luo, C.; Xie, D.; Fu, W.; Gong, Z.; Wang, X. Non-destructive detection of tea stalk and insect foreign bodies based on THz-TDS combination of electromagnetic vibration feeder. Food Quality and Safety 2023, 7, fyad004. [Google Scholar] [CrossRef]
- Yang, Z.; Ma, W.; Lu, J.; Tian, Z.; Peng, K. The Application Status and Trends of Machine Vision in Tea Production. Applied Sciences 2023, 13, 10744. [Google Scholar] [CrossRef]
- Tian, J.; Zhu, Z.; Wu, B.; Wang, L.; Liu, X. Bacterial and fungal communities in Pu’er tea samples of different ages. Journal of food science 2013, 78, M1249–M1256. [Google Scholar] [CrossRef] [PubMed]
- Thike, A.; San, Z.M.; Oo, Z.M. Design and development of an automatic color sorting machine on belt conveyor. International Journal of Science and Engineering Applications 2019, 8, 176–179. [Google Scholar] [CrossRef]
- Pan, S.; Zhang, X.; Xu, W.; Yin, J.; Gu, H.; Yu, X. Rapid On-site identification of geographical origin and storage age of tangerine peel by Near-infrared spectroscopy. Spectrochimica Acta Part A: Molecular and Biomolecular Spectroscopy 2022, 271, 120936. [Google Scholar] [CrossRef] [PubMed]
- Zhang, X.; Gao, Z.; Yang, Y.; Pan, S.; Yin, J.; Yu, X. Rapid identification of the storage age of dried tangerine peel using a hand-held near infrared spectrometer and machine learning. Journal of Near Infrared Spectroscopy 2022, 30, 31–39. [Google Scholar] [CrossRef]
- Yu, Z.; Cui, W. LSCA-net: A lightweight spectral convolution attention network for hyperspectral image processing. Computers and Electronics in Agriculture 2023, 215, 108382. [Google Scholar] [CrossRef]
- Yin, J.; Yang, Y.; Hong, W.; Cai, Y.; Yu, X. Portable smart spectrometer integrated with blockchain and big data technology. Applied Sciences 2019, 9, 3279. [Google Scholar] [CrossRef]
- Liang, D.; Zhou, Q.; Ling, C.; Gao, L.; Mu, X.; Liao, Z. Research progress on the application of hyperspectral imaging techniques in tea science. Journal of Chemometrics 2023, 37, e3481. [Google Scholar] [CrossRef]
- Zhu, B.; Zhou, L.; Pu, S.; Fan, J.; Ye, Y. Advances and challenges in multimodal remote sensing image registration. IEEE Journal on Miniaturization for Air and Space Systems 2023. [Google Scholar] [CrossRef]
- Rao, C.R. The use and interpretation of principal component analysis in applied research. Sankhyā: The Indian Journal of Statistics, Series A 1964, pp. 329–358.
- Cortes, C.; Vapnik, V. Support-vector networks. Machine learning 1995, 20, 273–297. [Google Scholar] [CrossRef]
- Yang, Y.; Zhang, X.; Yin, J.; Yu, X. Rapid and nondestructive on-site classification method for consumer-grade plastics based on portable NIR spectrometer and machine learning. Journal of Spectroscopy 2020, 2020, 1–8. [Google Scholar] [CrossRef]
- Jiang, L.; Cai, Z.; Wang, D.; Jiang, S. Survey of improving k-nearest-neighbor for classification. In Proceedings of the Fourth international conference on fuzzy systems and knowledge discovery (FSKD 2007). IEEE, 2007, Vol. 1, pp. 679–683.
- Biau, G.; Scornet, E. A random forest guided tour. Test 2016, 25, 197–227. [Google Scholar] [CrossRef]
- Song, Y.Y.; Ying, L. Decision tree methods: applications for classification and prediction. Shanghai archives of psychiatry 2015, 27, 130. [Google Scholar] [CrossRef] [PubMed]
Figure 1.
Multimodal detection system.
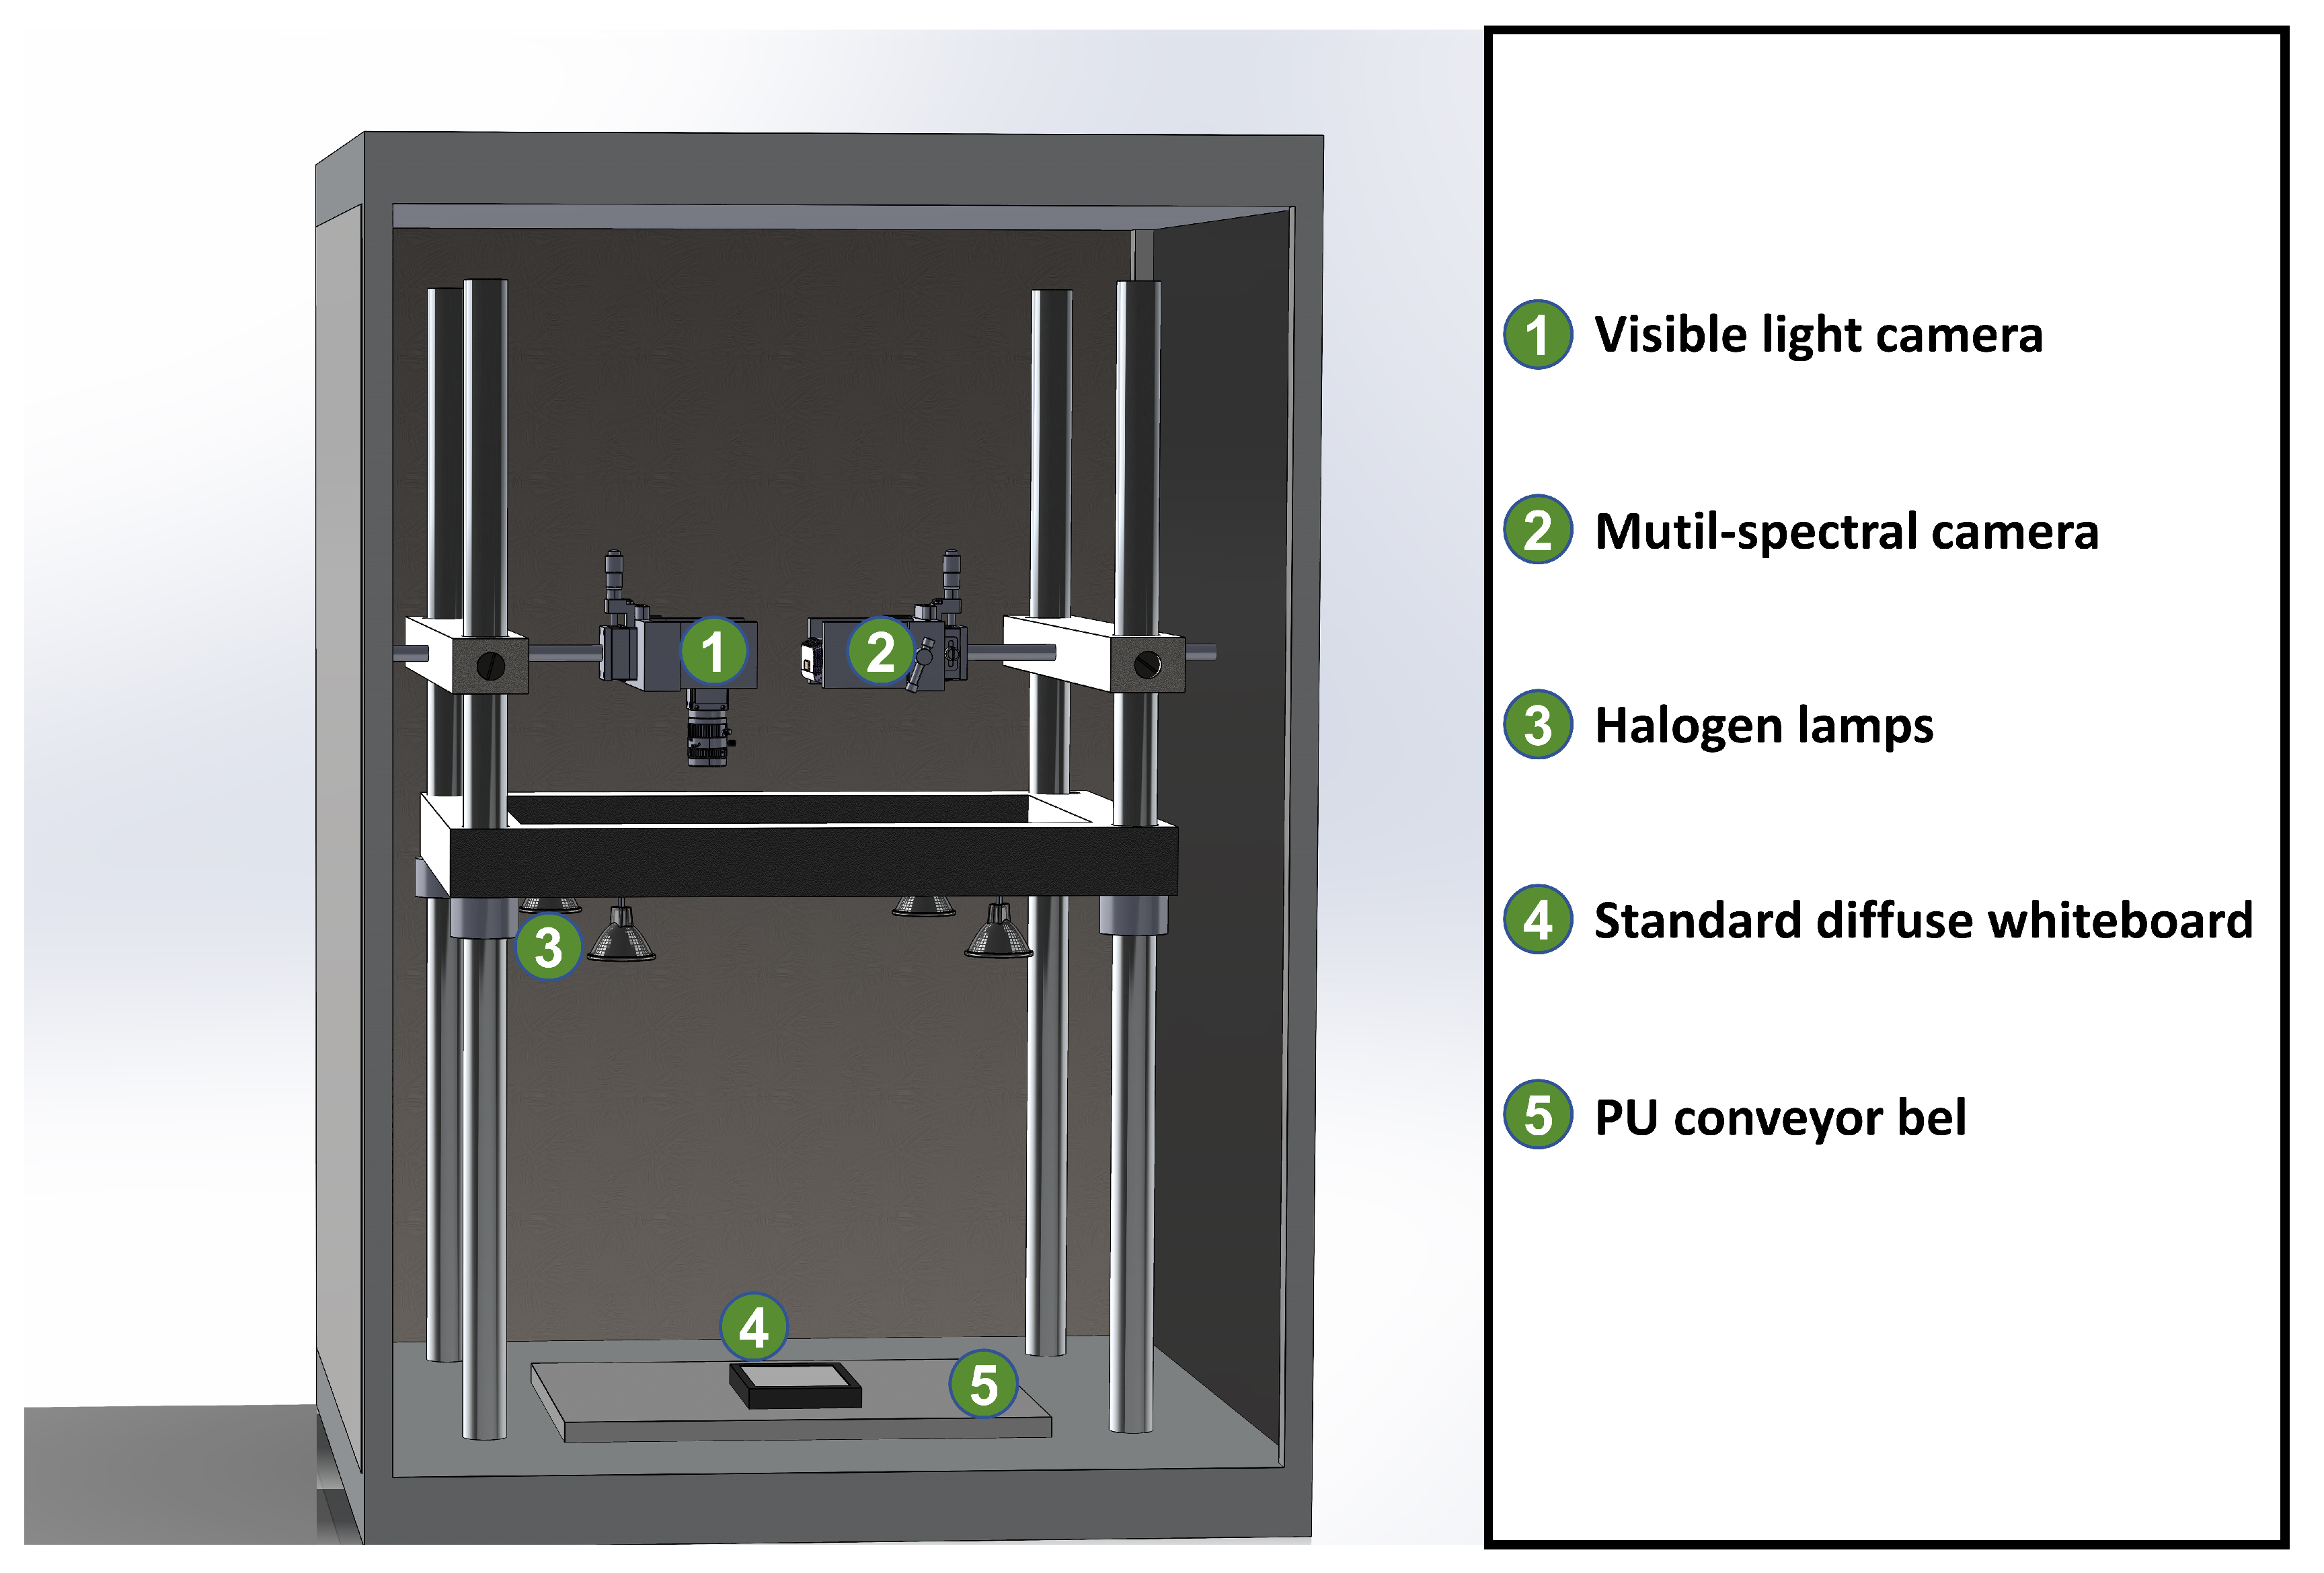
Figure 2.
The process of image registration.(a) Original color image. (b) Corrected color image. (c)828nm spectral image.
Figure 2.
The process of image registration.(a) Original color image. (b) Corrected color image. (c)828nm spectral image.
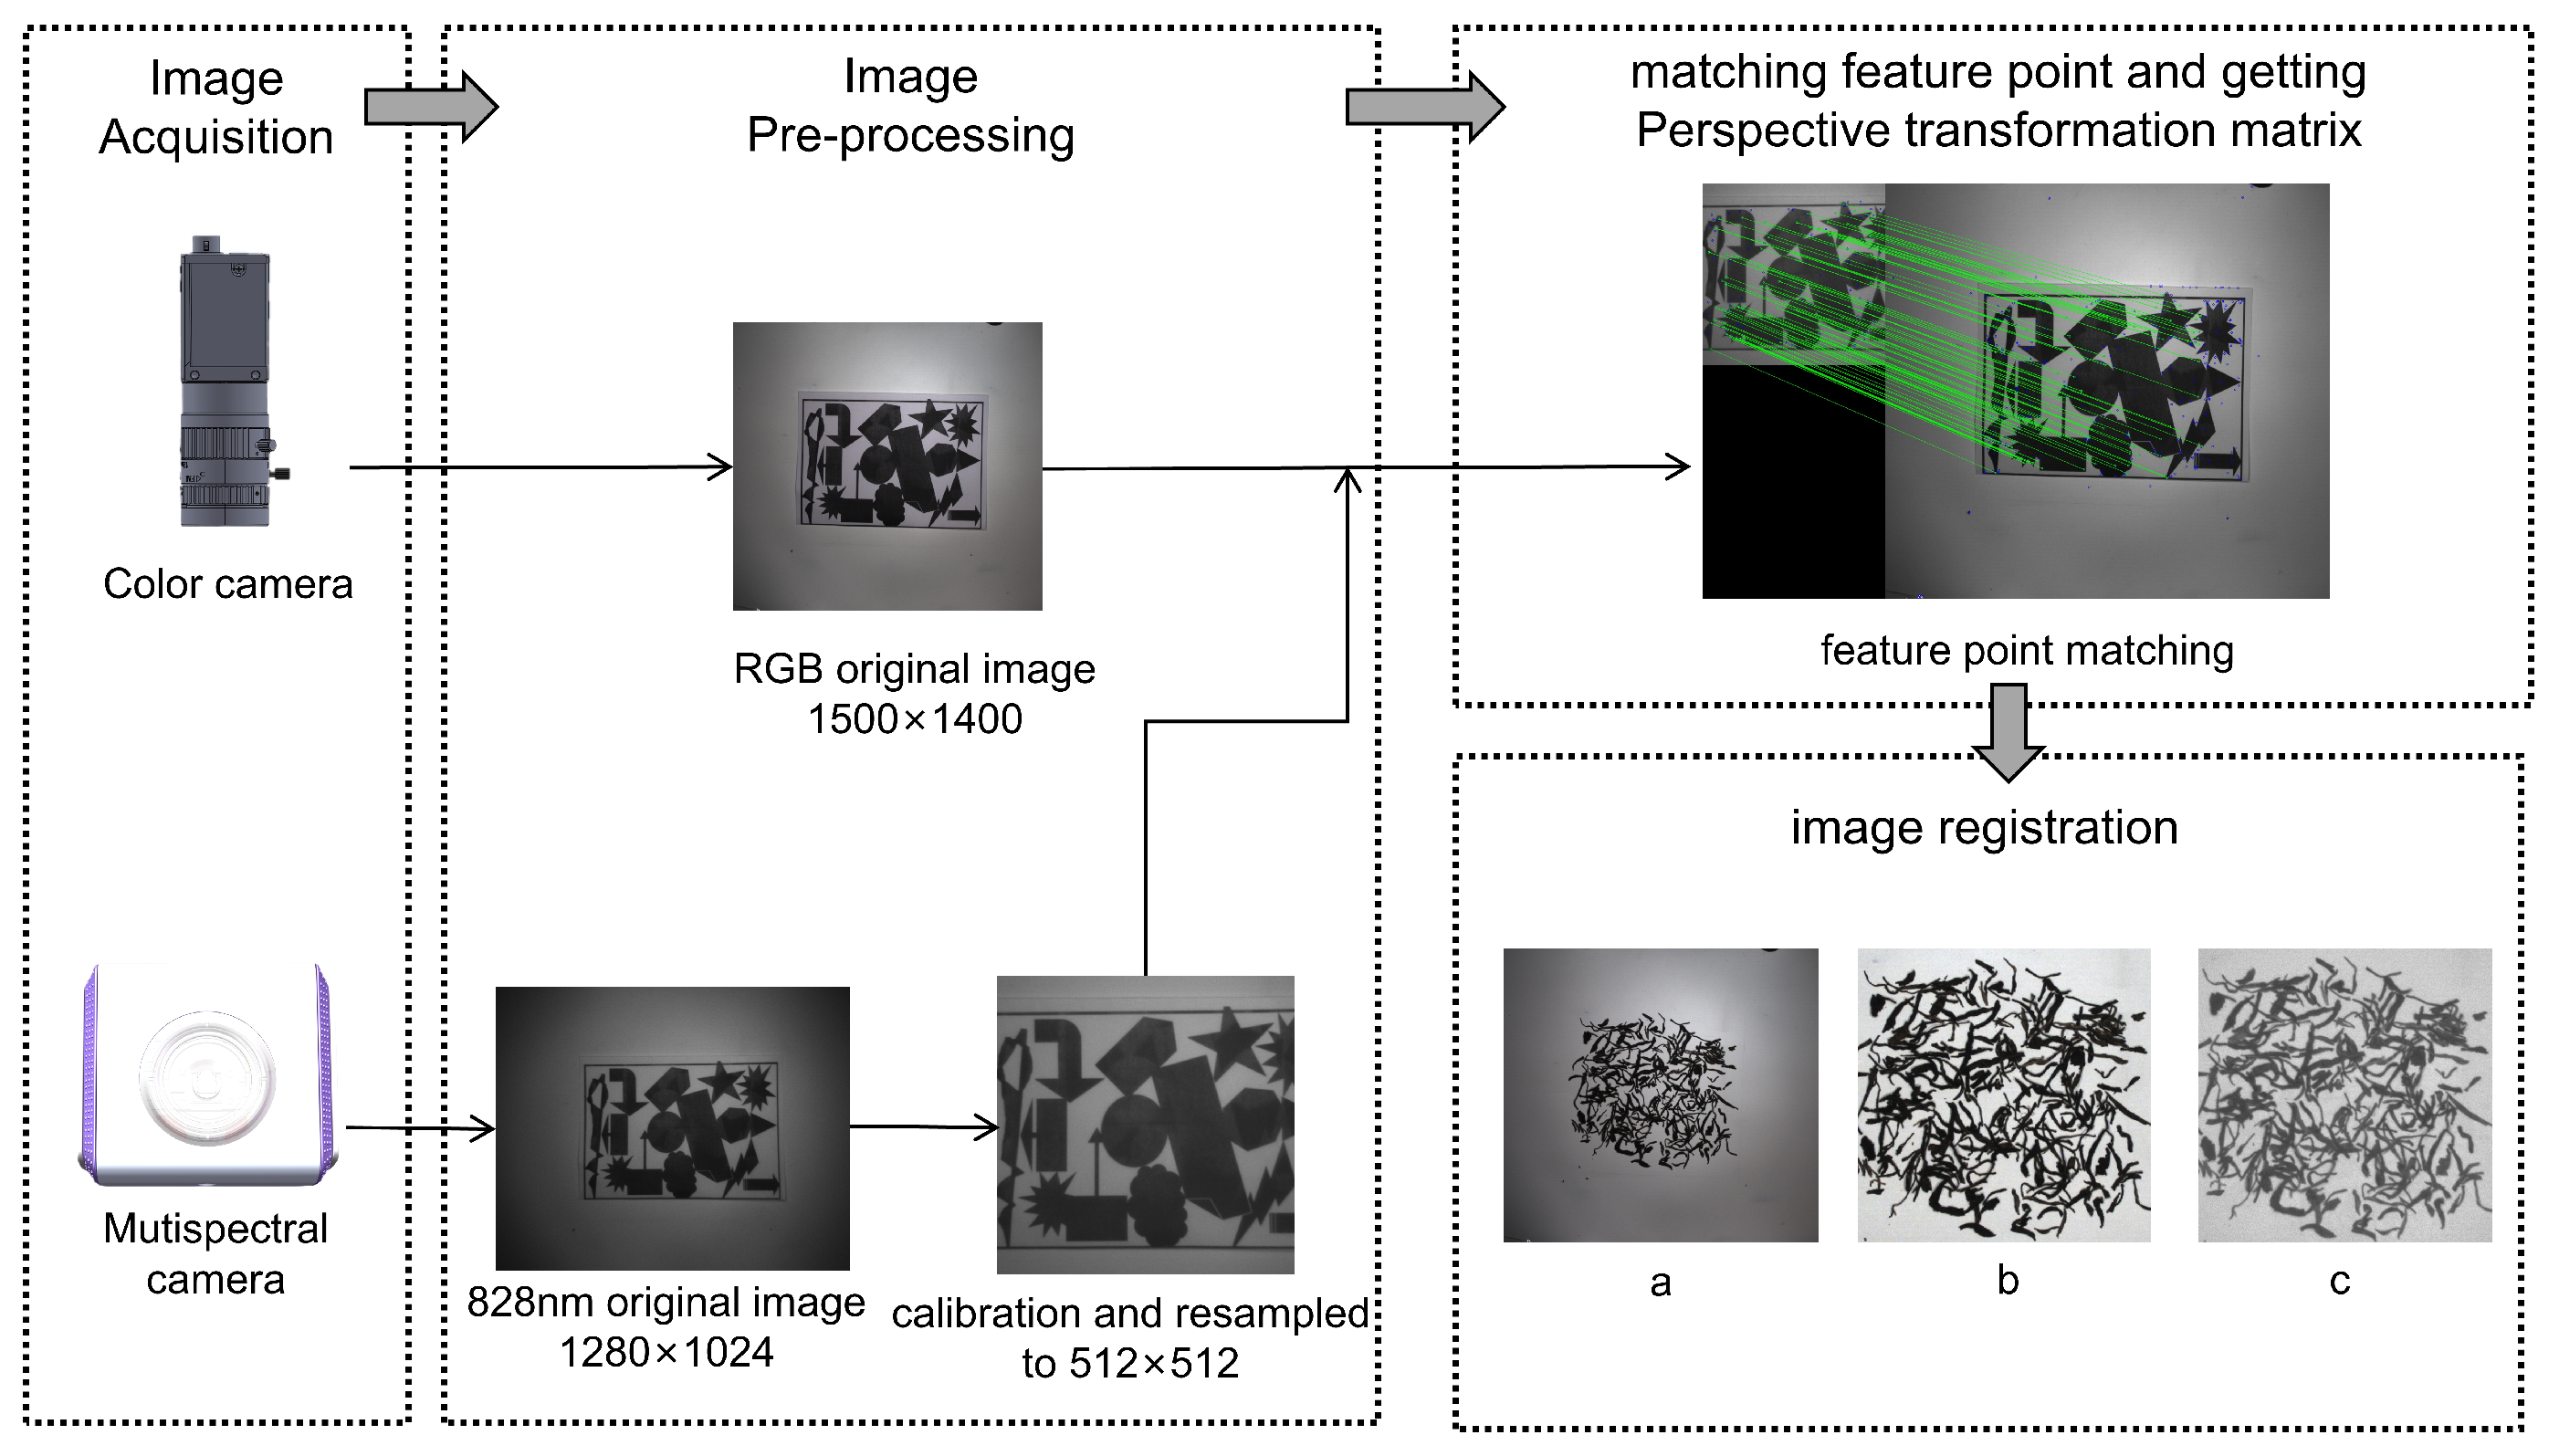
Figure 3.
(a) Three types of raw spectral curves (b) Three types of average spectral curves (c) All types of raw spectral curves (d) All types of average spectral curves.
Figure 3.
(a) Three types of raw spectral curves (b) Three types of average spectral curves (c) All types of raw spectral curves (d) All types of average spectral curves.
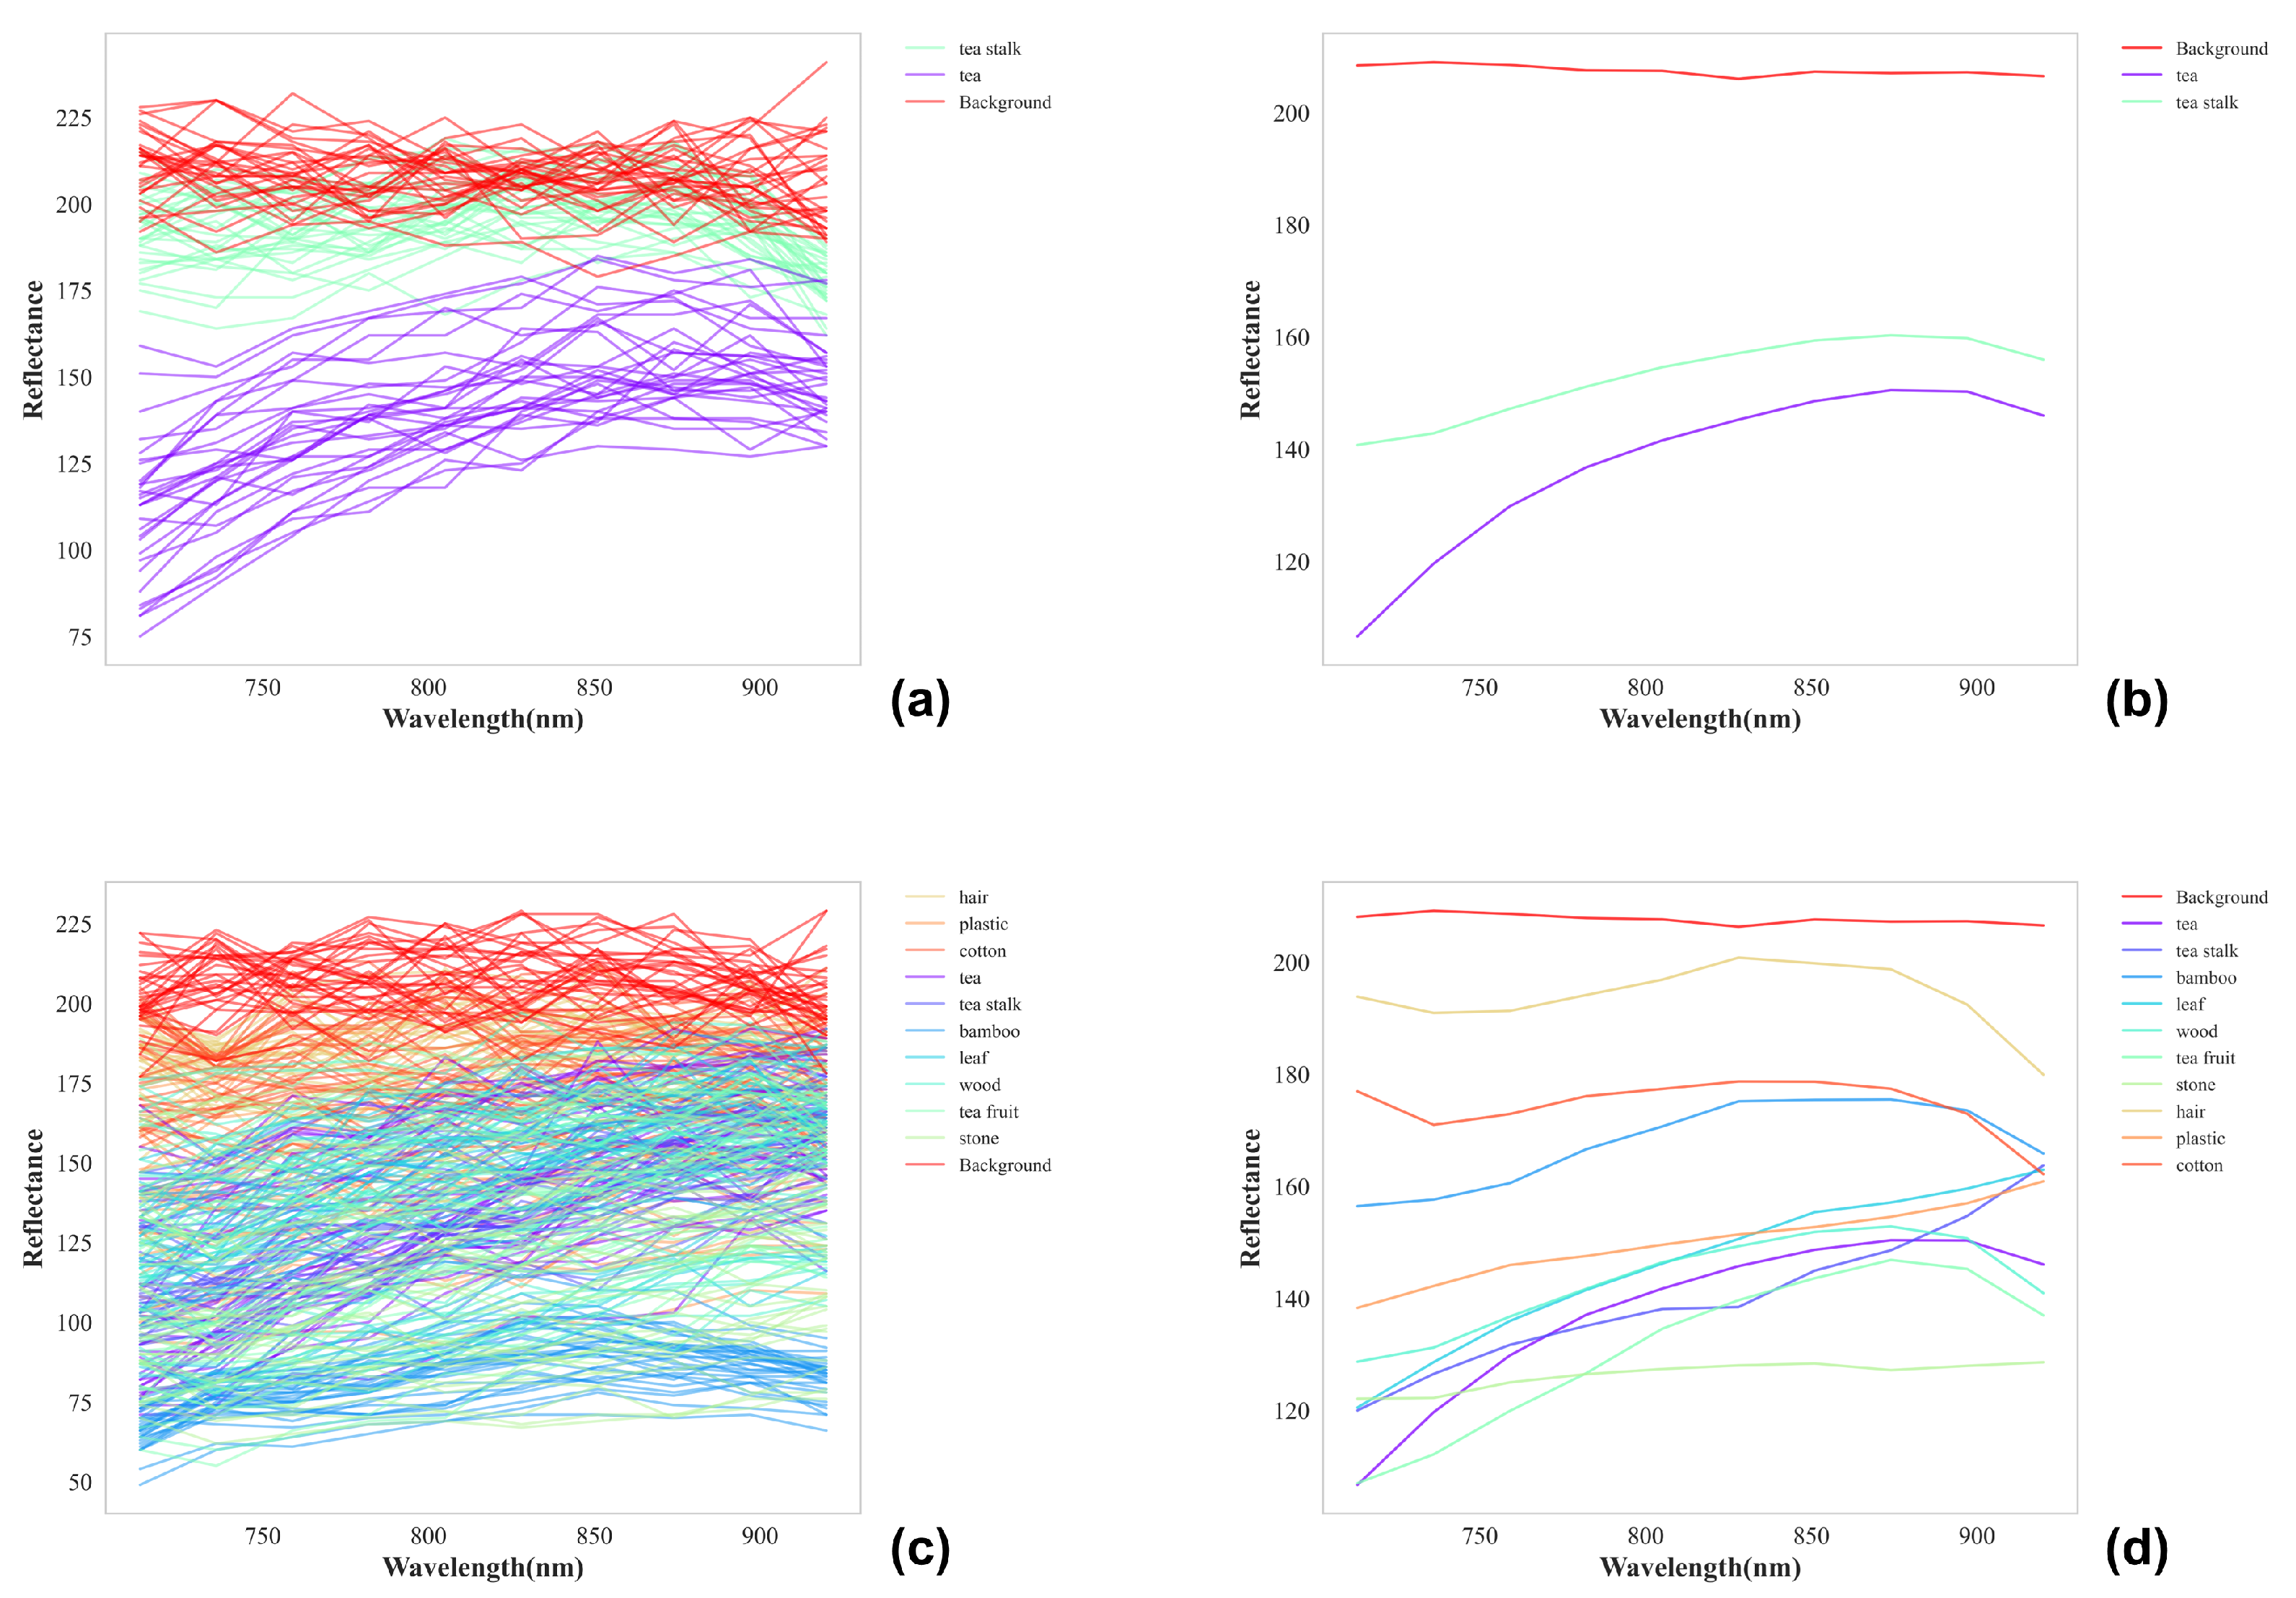
Figure 4.
Scatter plot of the first two principal components of (a) Combined feature (b) Spectral feature (c) RGB color feature (d) Combined feature of all kinds of pixels.
Figure 4.
Scatter plot of the first two principal components of (a) Combined feature (b) Spectral feature (c) RGB color feature (d) Combined feature of all kinds of pixels.
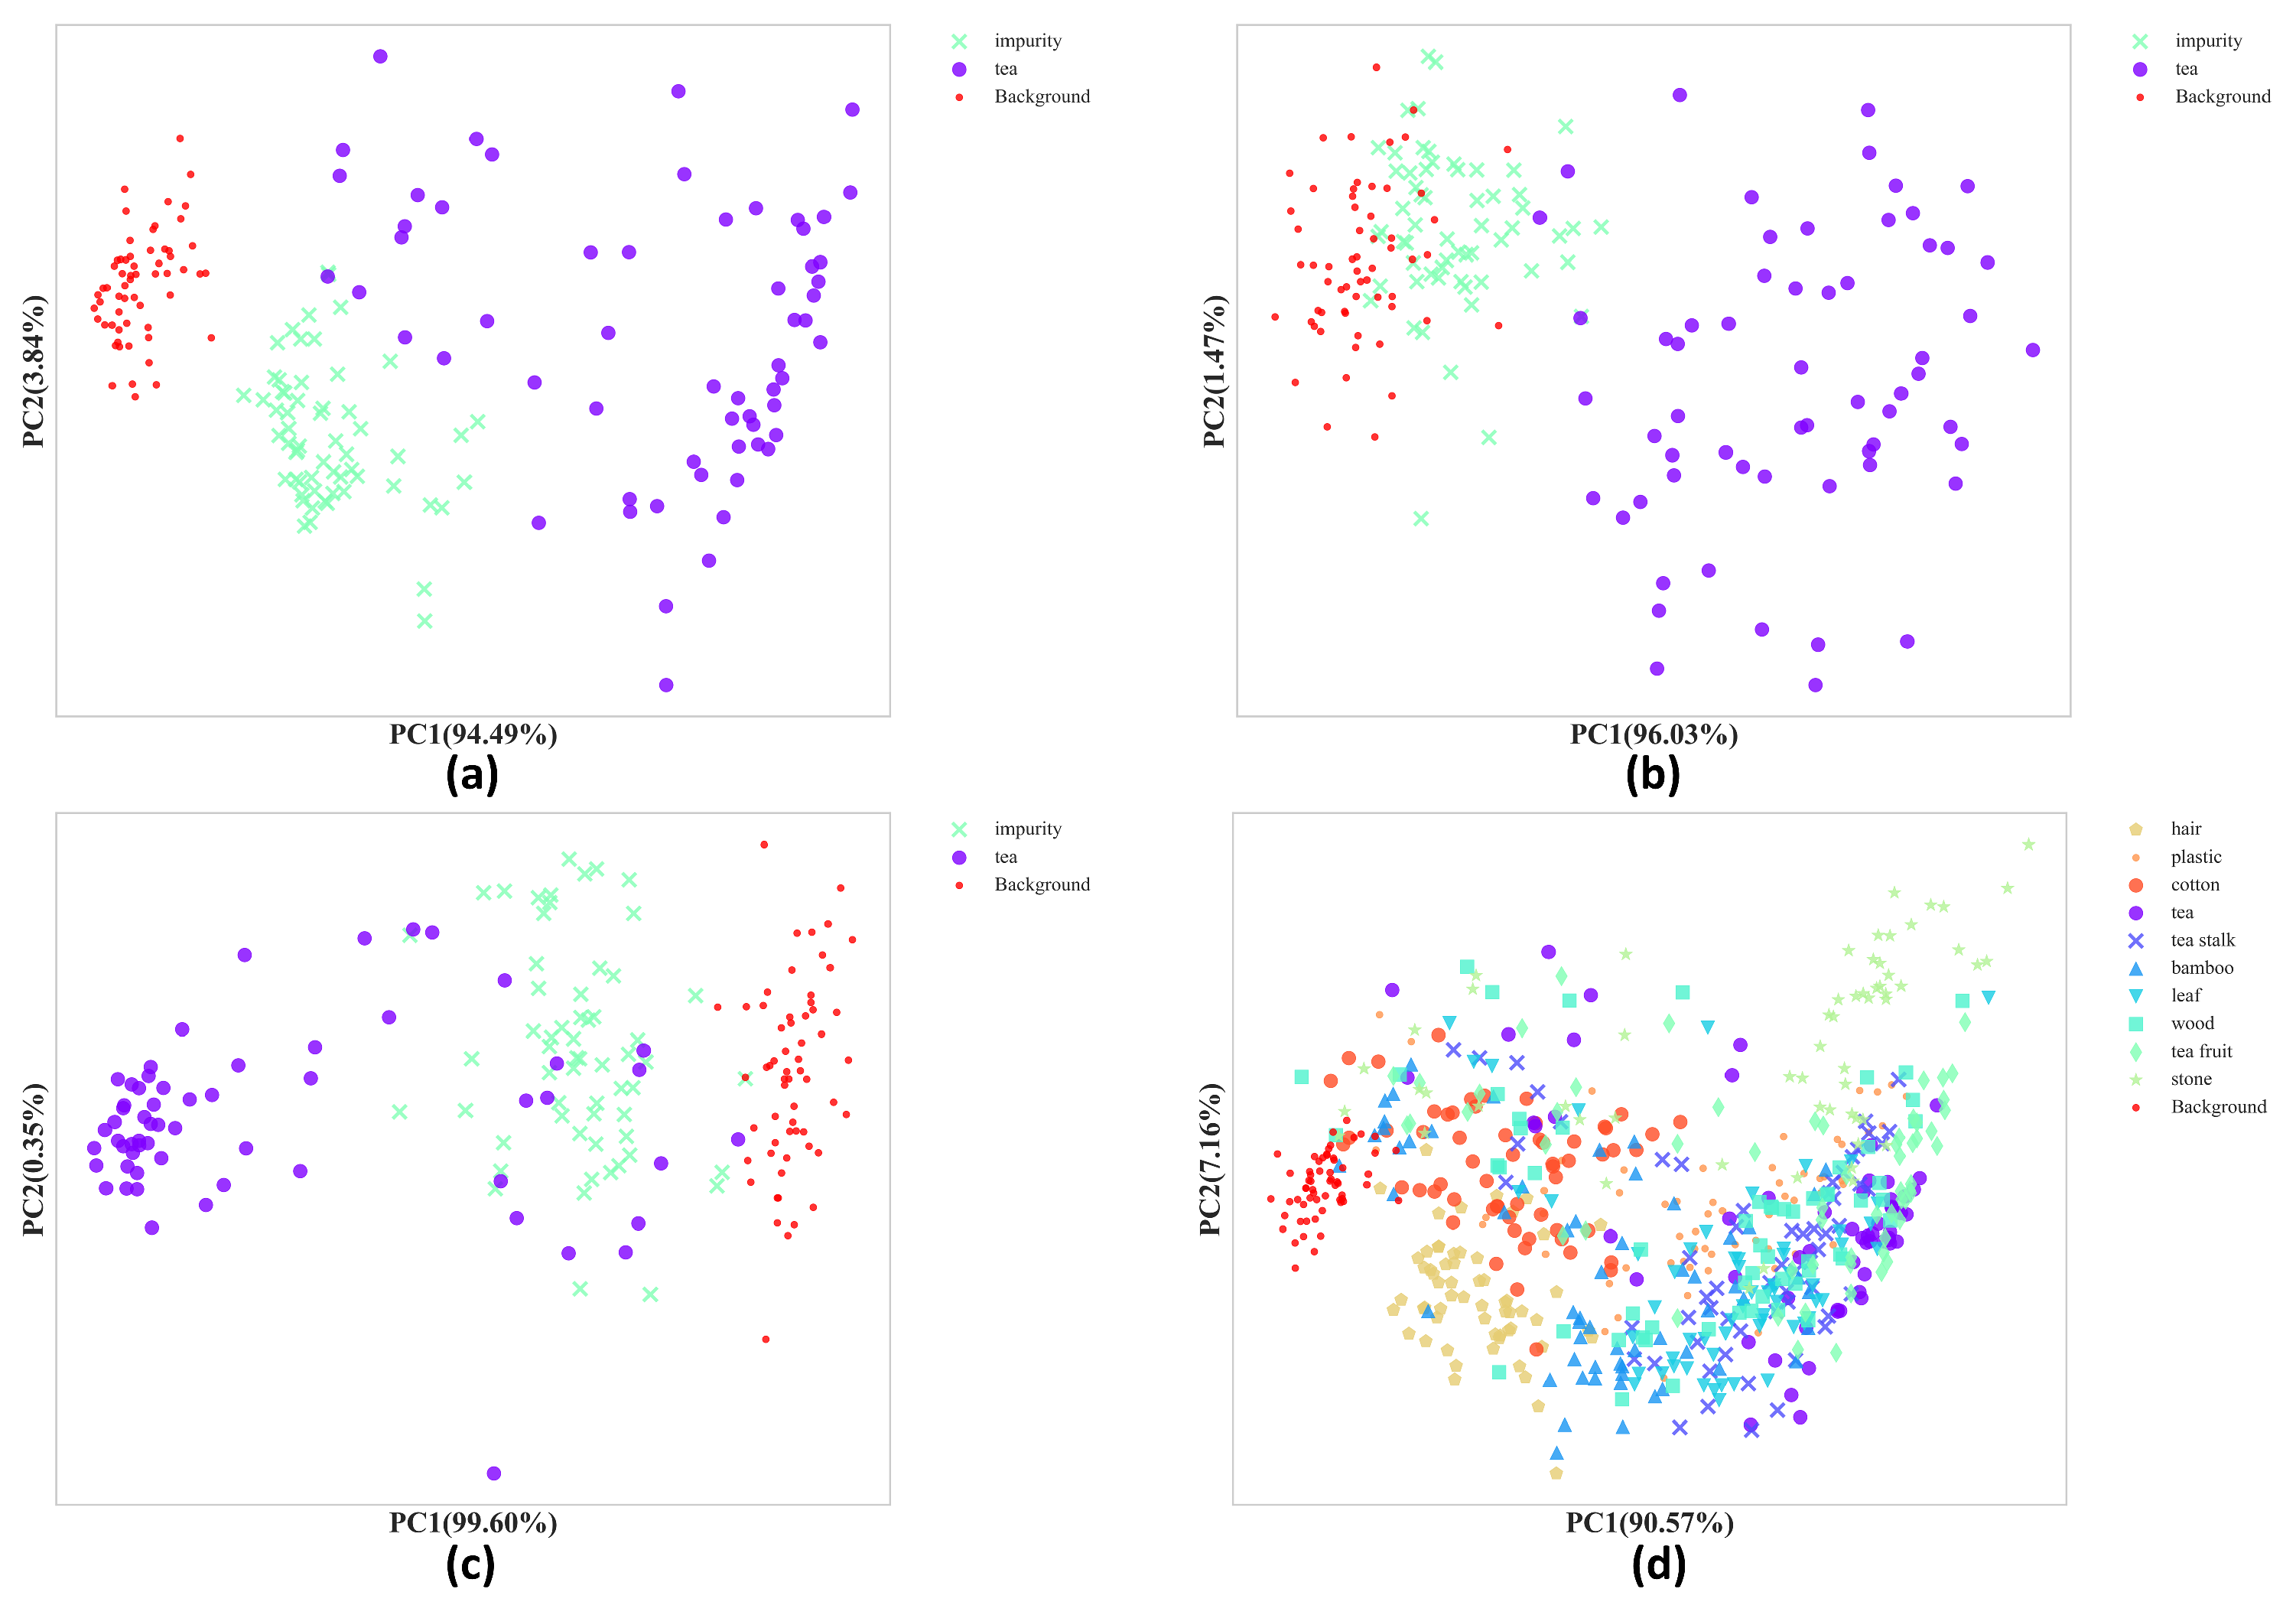
Figure 5.
Confusion matrix of (a) Three types of classification (b) All types of classification.
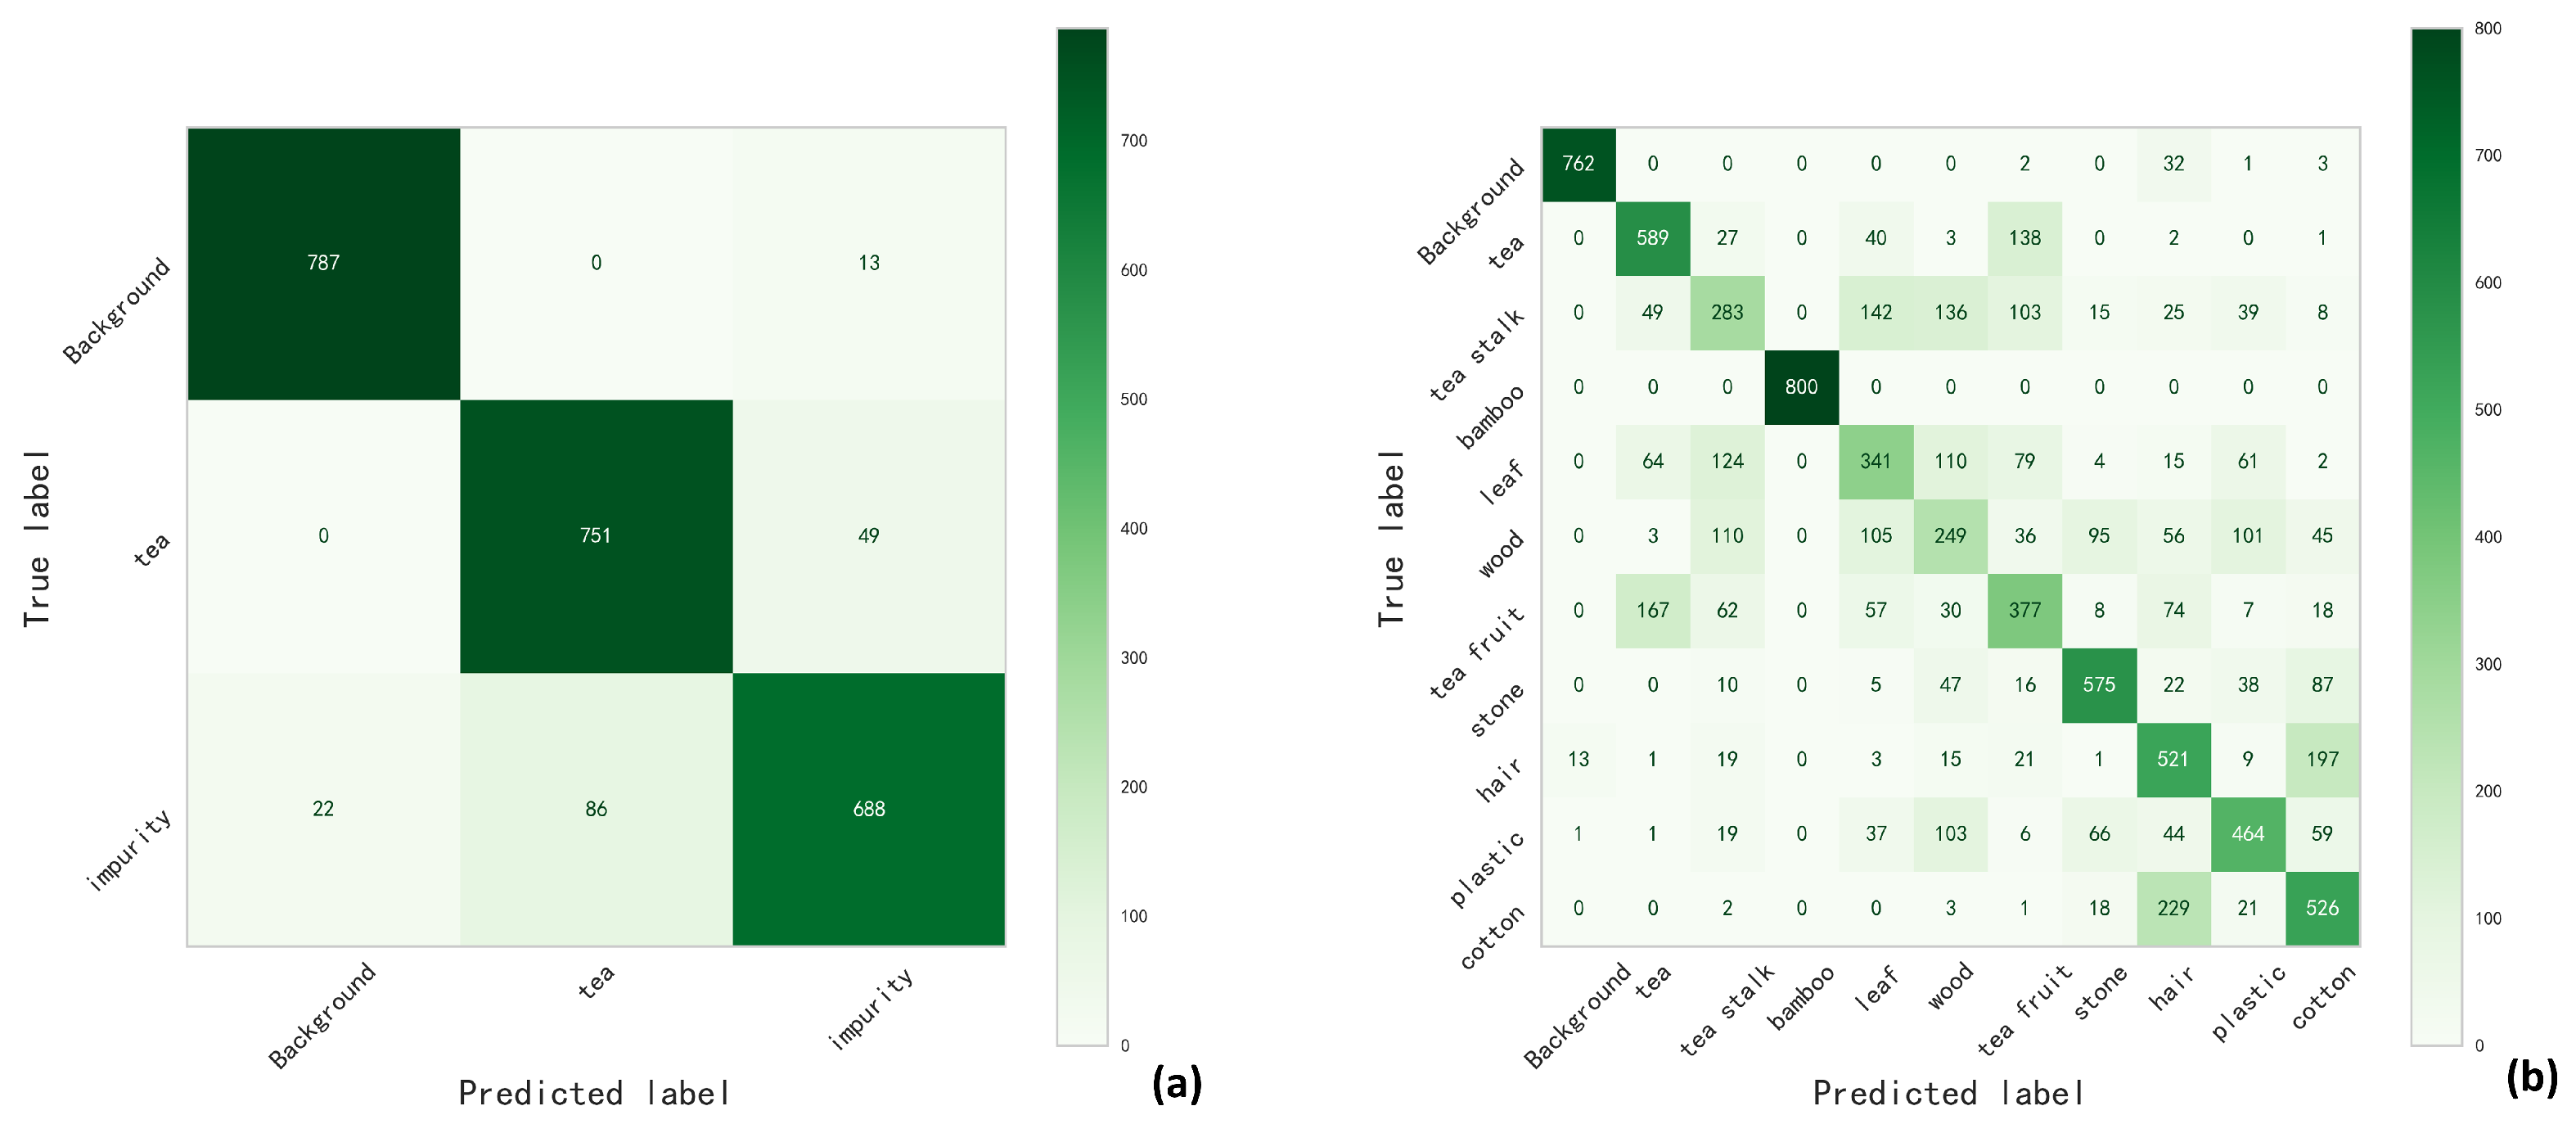
Figure 6.
The results of 4 test images.(a) Corrected color image (b)Pixel-classified images (c) Pixel-classified images after processing (d) Prediction box (e) Ground truth box
Figure 6.
The results of 4 test images.(a) Corrected color image (b)Pixel-classified images (c) Pixel-classified images after processing (d) Prediction box (e) Ground truth box
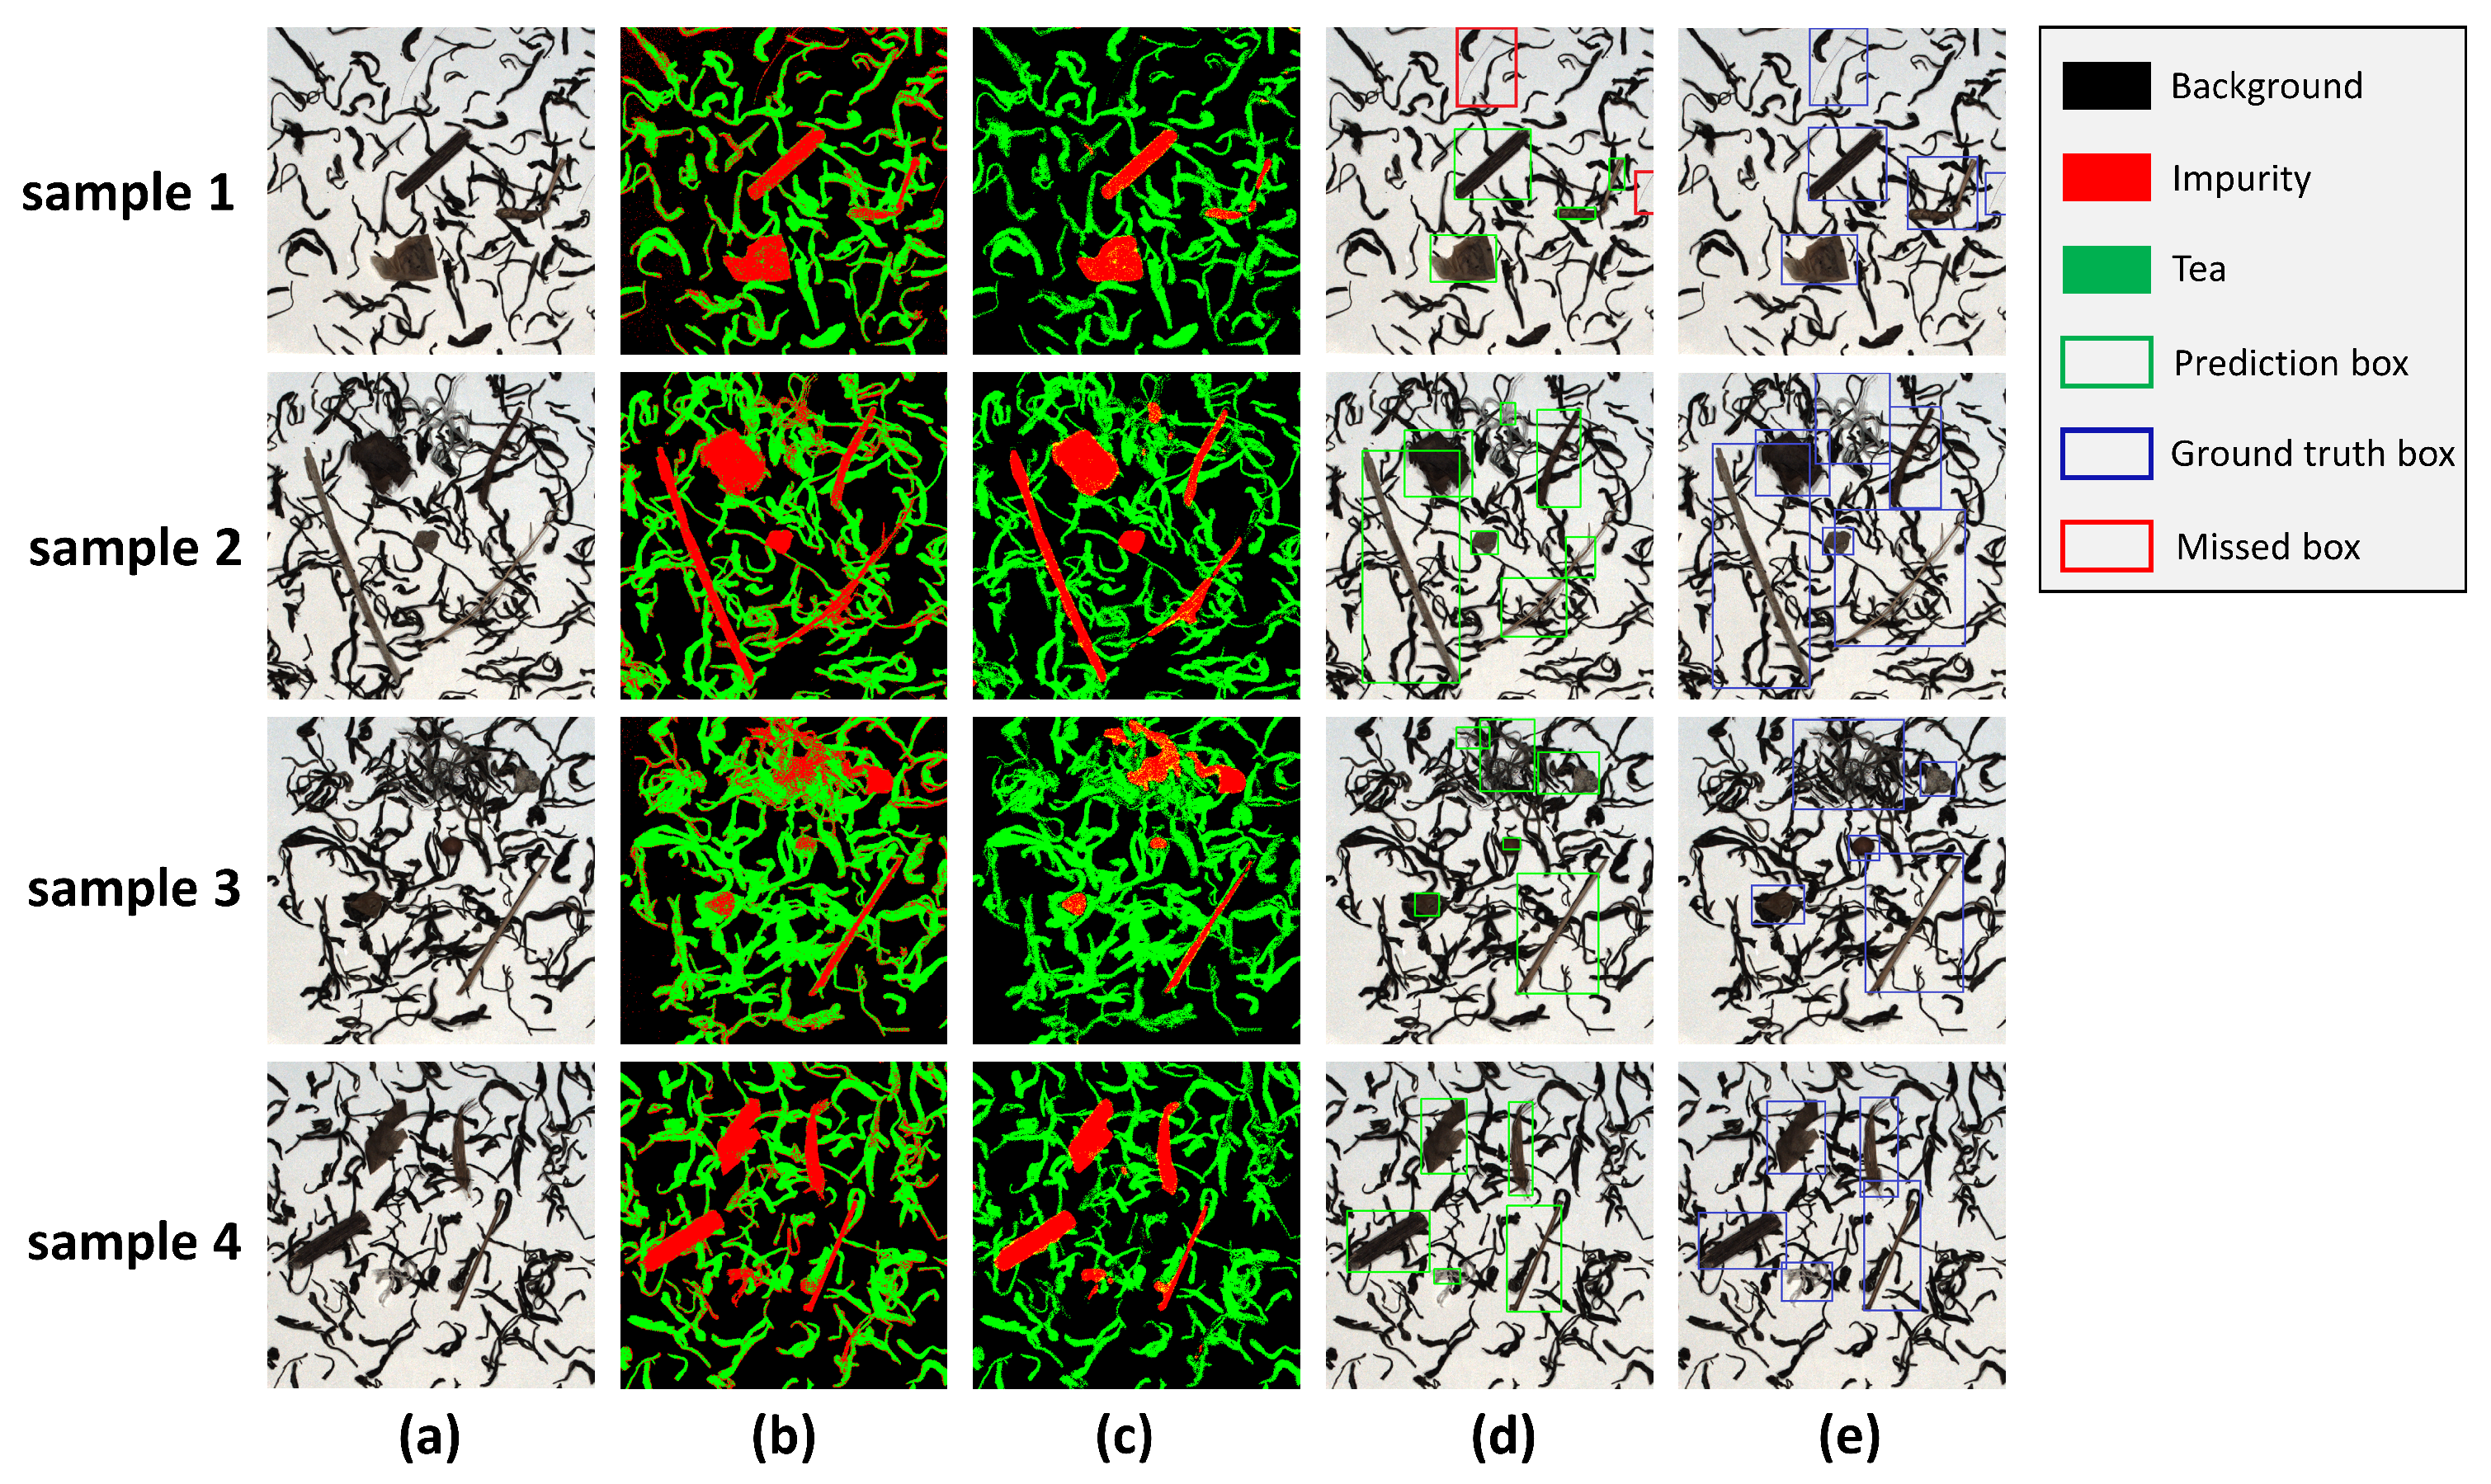
Figure 7.
The process of detecting small impurities.
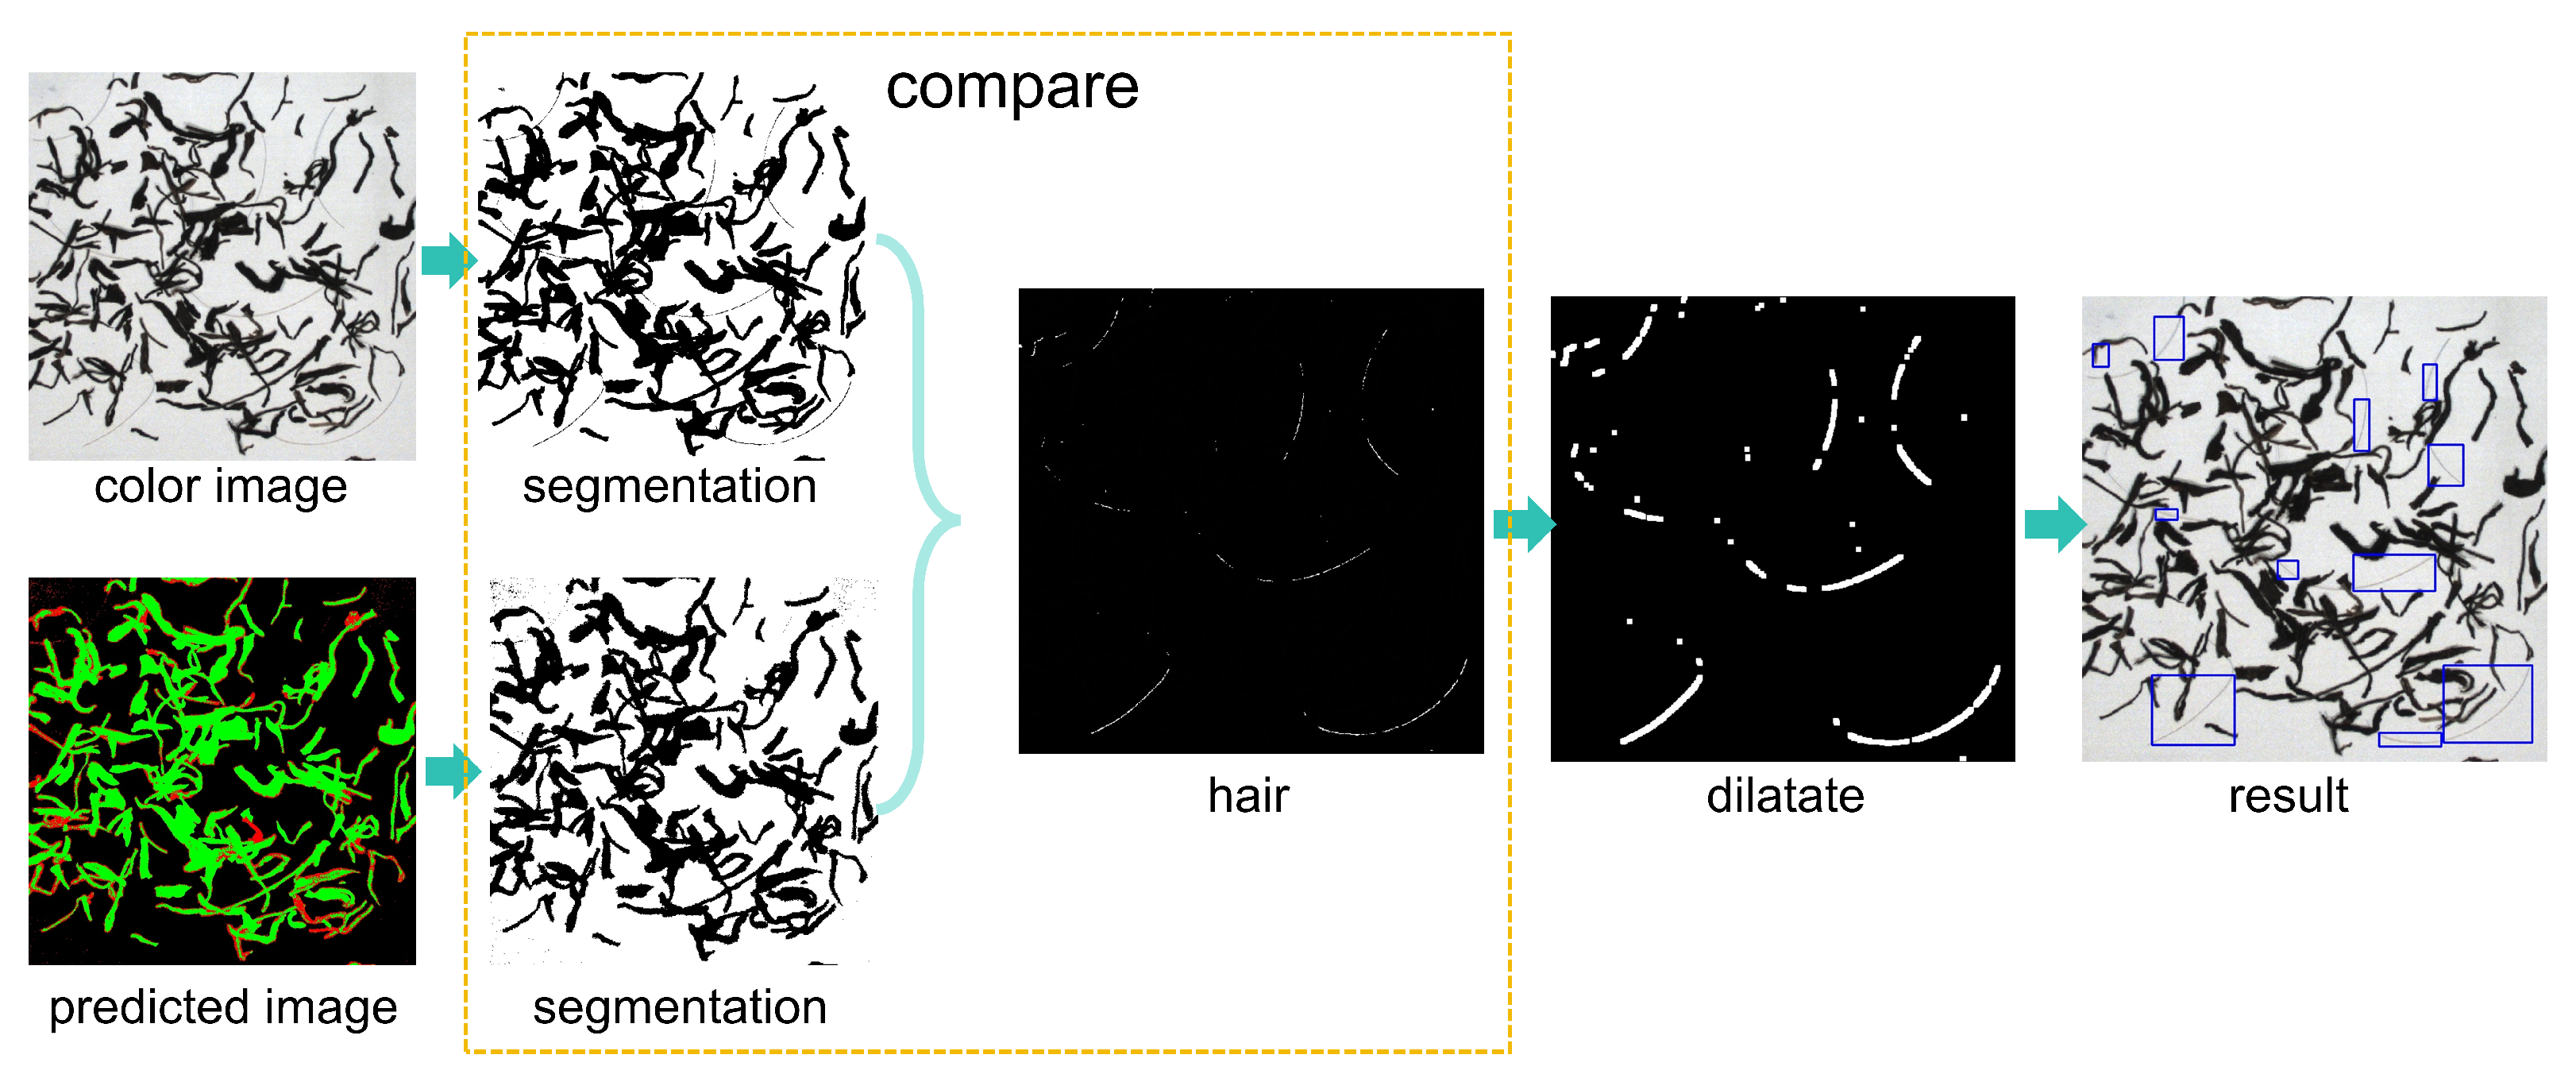
Figure 8.
The final detection result of the test images.
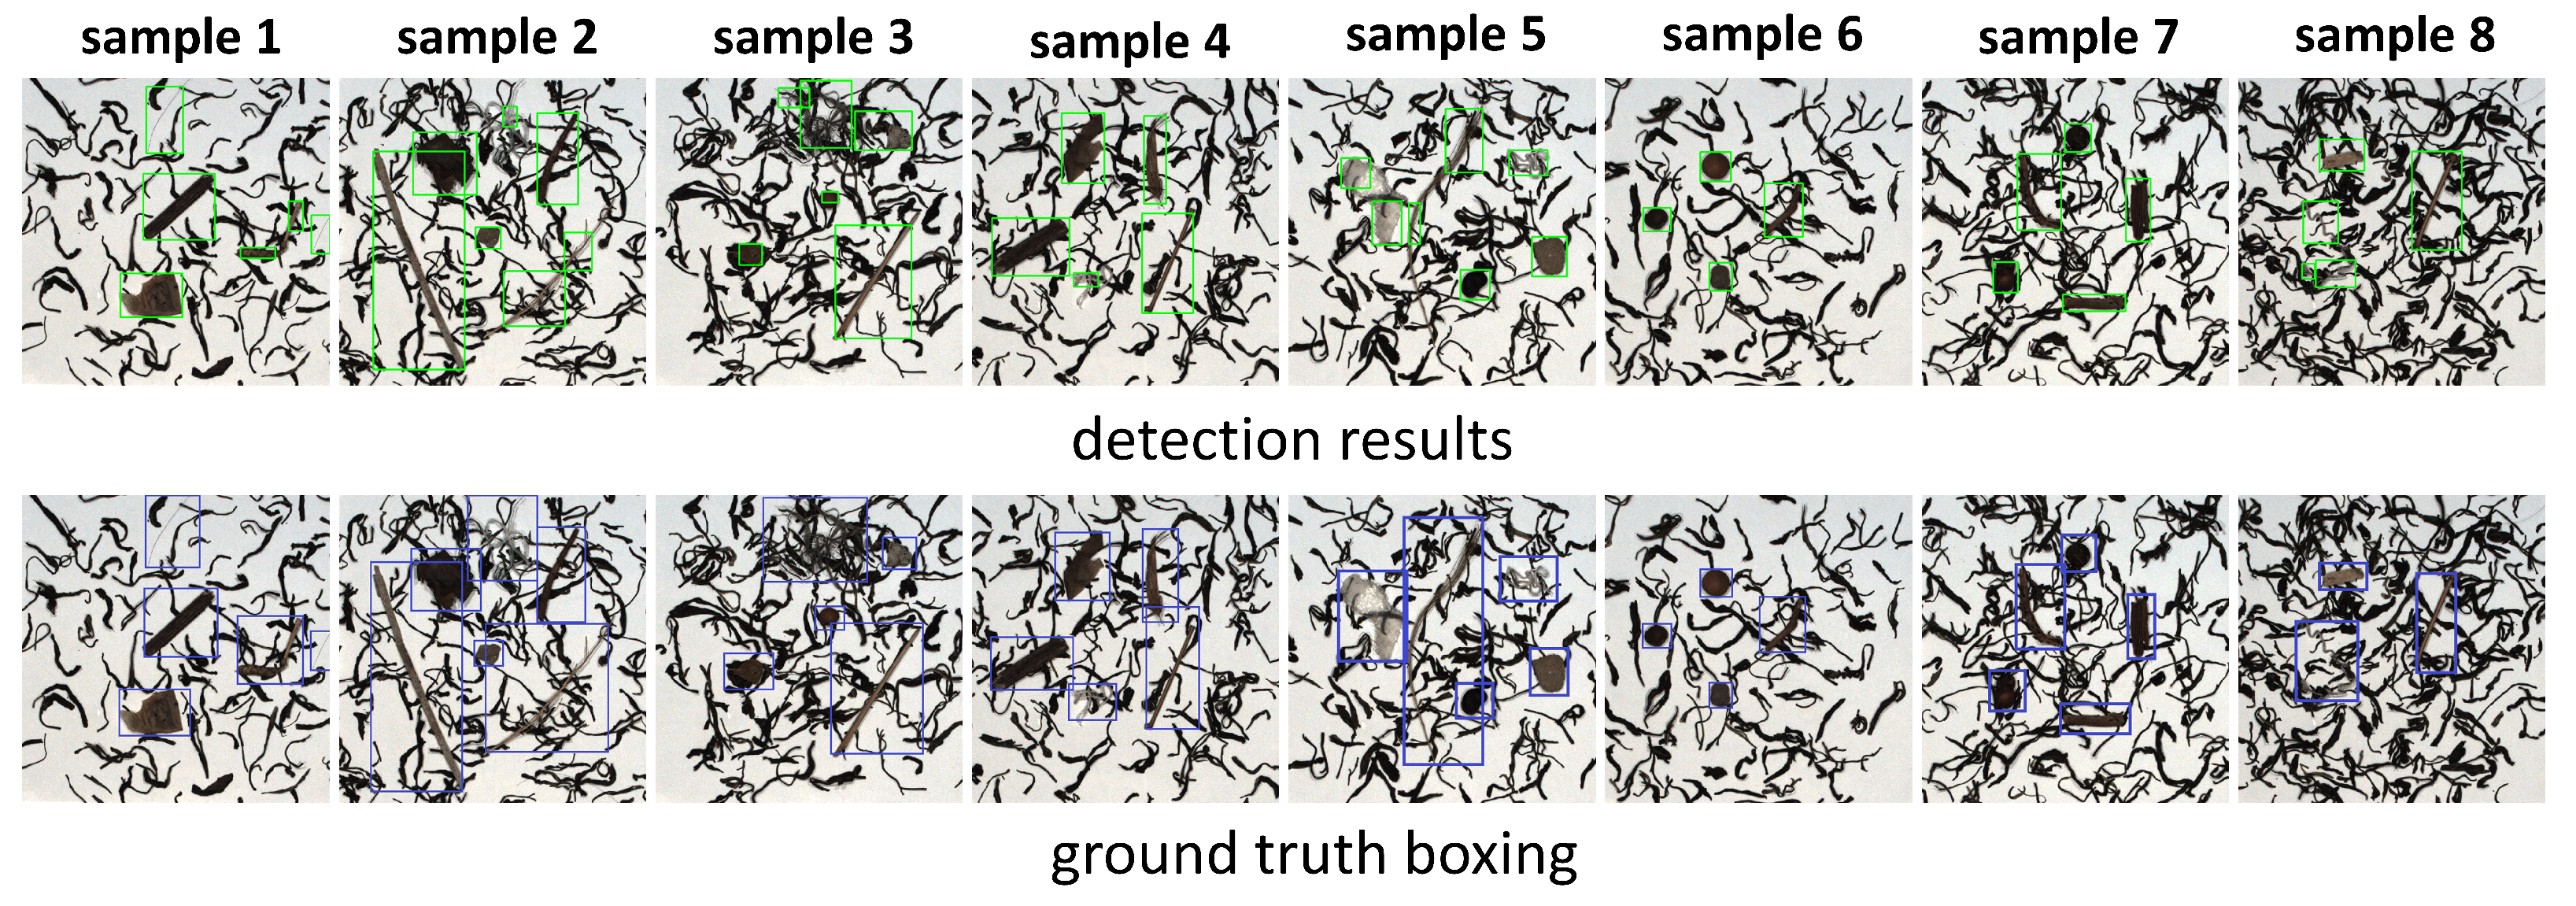
Figure 9.
The inference results of other impurity samples.
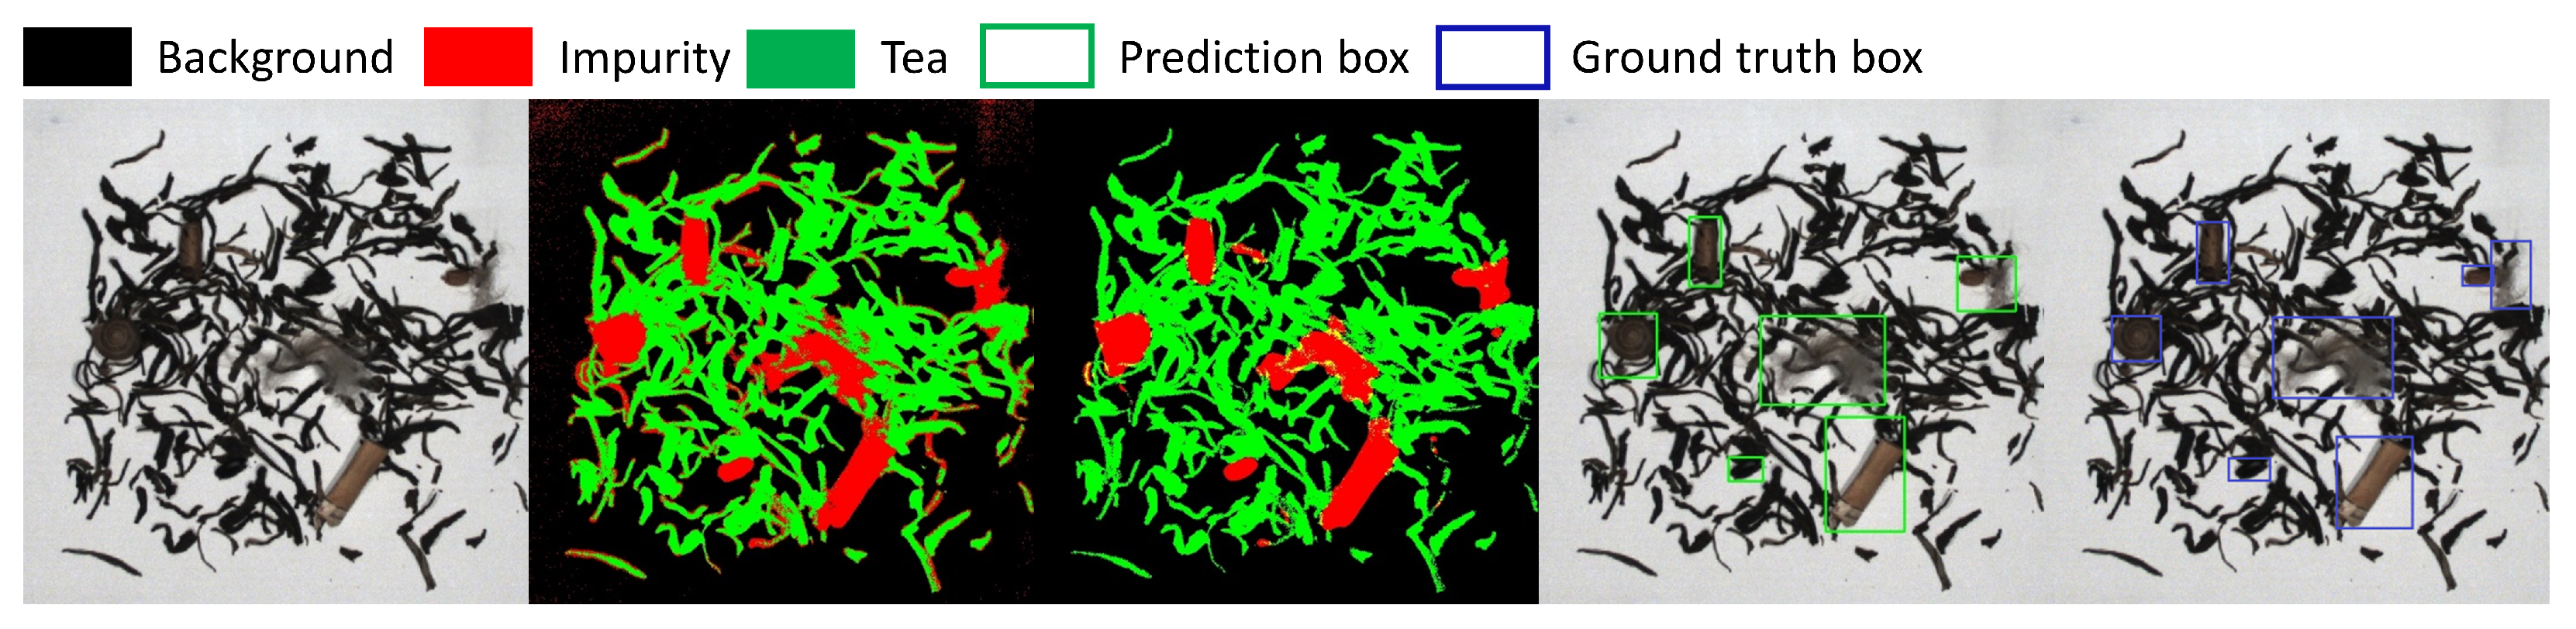

Table 1.
Specific number of pixel samples.
| tea | tea stalk | bamboo | leaf | wood | tea fruit | stone | hair | plastic | cotton |
|---|---|---|---|---|---|---|---|---|---|
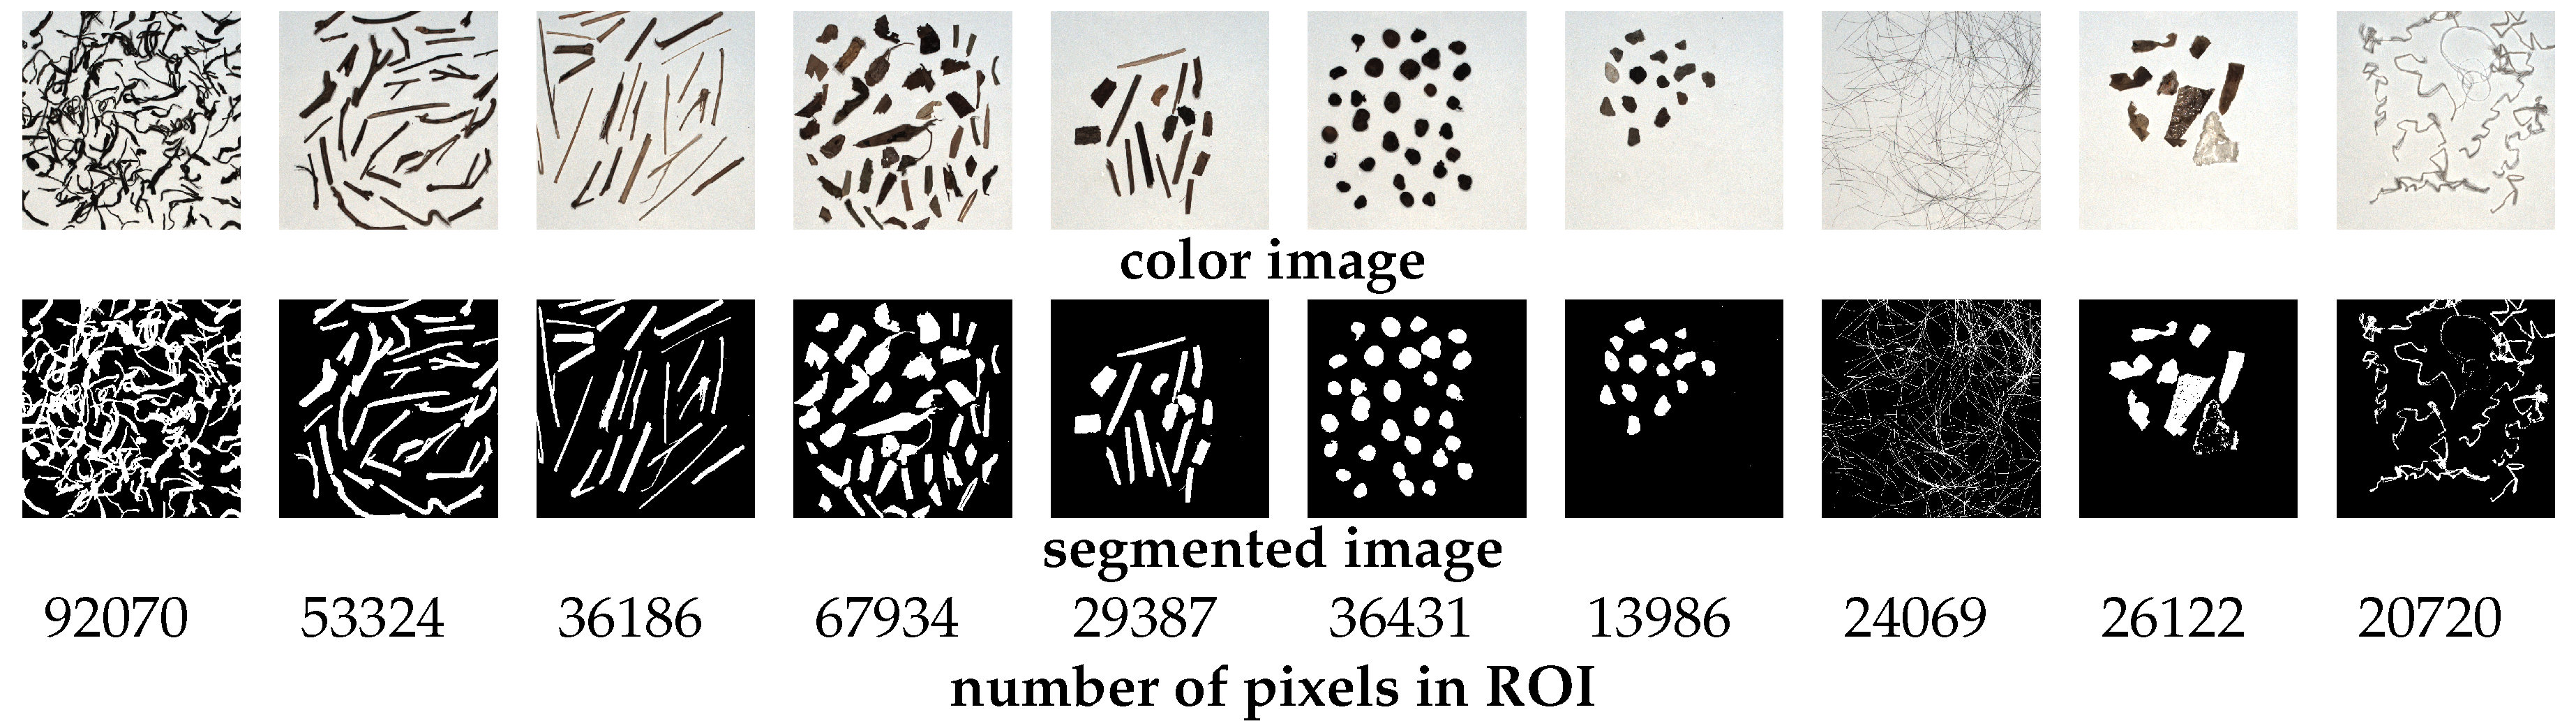 | |||||||||
Table 2.
Accuracy using different features and different models.
| SVM | RF | KNN | DT | |
|---|---|---|---|---|
| Spectrum | 0.86 | 0.86 | 0.86 | 0.84 |
| Spectrum + RGB | 0.93 | 0.91 | 0.91 | 0.88 |
Disclaimer/Publisher’s Note: The statements, opinions and data contained in all publications are solely those of the individual author(s) and contributor(s) and not of MDPI and/or the editor(s). MDPI and/or the editor(s) disclaim responsibility for any injury to people or property resulting from any ideas, methods, instructions or products referred to in the content. |
© 2024 by the authors. Licensee MDPI, Basel, Switzerland. This article is an open access article distributed under the terms and conditions of the Creative Commons Attribution (CC BY) license (http://creativecommons.org/licenses/by/4.0/).
Copyright: This open access article is published under a Creative Commons CC BY 4.0 license, which permit the free download, distribution, and reuse, provided that the author and preprint are cited in any reuse.


