Submitted:
22 November 2024
Posted:
25 November 2024
You are already at the latest version
Abstract
With the acceleration of urbanization and industrialization in China, iron in-use stocks (IIUS) are accumulating rapidly. IIUS is potential reservoirs accessible for urban mining and a major source of future renewable energy. So this study used Henan Province as a case to assess IIUS and its spatial distribution at the provincial level in China. In this study, a bottom-up model was used to estimate the temporal characteristics of IIUS, and analyzed the prefecture-level spatial distribution of IIUS in 2021 based on the spatial autocorrelation model. Meanwhile, this study also explored the decoupling between IIUS and economic development using the constructed Tapio-LMDI model and identified the factors affecting the decoupling relationship. The results showed that, 1) Henan Province’s total IIUS reached 474.51 Mt in 2022, increasing by 7.89 times from 2000. The largest contributor of IIUS was building sector, which accounted for 66.89% of the total in 2022. 2) At prefecture-level cities, the density of IIUS varied from 1055.35 to 8855.35 t/km2 in 2021, indicating a signification imbalance in spatial distribution. 3) Moran’ I index for IIUS in Henan Province was 0.47 and the Z-value was 2.75 (P < 0.001), showing a significant spatial positive correlation. 4) There is a Weak-decoupling relationship between IIUS and economy, and technology factor is the main factor to promote decoupling. The government needs to improve the technology to realize the decoupling of IIUS.
Keywords:
iron and steel
; in-use stocks
; temporal and spatial characteristic
; spatial autocorrelation analysis
; Tapio-LMDI model
1. Introduction
Iron has become an indispensable material in modern industry because of its high strength, good toughness and wide applicability. In recent decades, rapid urbanization and industrialization in China have significantly increased the iron consumption in various sectors (Yue et al., 2016). To meet the growing demand, China has become the world’s largest producer and consumer of iron, accounting for 52.9% of global crude steel production in 2021 (WSA, 2021). The increasing consumption of iron has led to a large accumulation of iron-containing products in downstream sectors such as building, machinery and so on, which is called iron in-use stocks (IIUS). IIUS can be recycled, processed, and reused after reaching the end of their lifetime, so it has become the main source of secondary resource recycling and utilization in the future, which can alleviate the demand for crude steel and contribute to reducing the carbon footprint of steel products (Müller et al., 2011; WSA, 2019).
The 14th Five-Year Plan for the Development of Circular Economy (NDRCC, 2021) and Recycling of Waste Materials (NDRCC, 2022) both point out that it is necessary to increase the recycling rate of steel scrap resources. Scrap steel accounted for 64.96% of the major recycling recoveries in 2022 (CAMR, 2023), so IIUS is one of the main resources in the future. Therefore, accounting for IIUS can help to clarify the amount of scrap steel, and the spatial characteristics of IIUS can help the rational layout of the renewable resources processing industry. It is necessary to study the temporal and spatial characteristics of IIUS.
At present, two research methods are commonly used to account IIUS. The first is the top-down method, which is mainly suitable for calculating IIUS at the national level. In this method, IIUS is obtained by calculating the difference of steel between the inflow and outflow amount. Obviously, this method is usually applied to the estimation of IIUS at the national level (Müller et al., 2006; Lou et al., 2008; Müller et al., 2011). The second method is the bottom-up method, which involves collecting the quantity of steel products and the strength of steel from buildings sector, machinery sector, infrastructure sector, transportation sector and domestic appliances sector. (Yu et al., 2020; Hao et al., 2020). Compared with the top-down method, the bottom-up method can provide detailed information about the distribution of IIUS in different sectors. Therefore, in this paper, the bottom-up method is used to calculate the IIUS.
At present, most studies on IIUS primarily focus on the national level, such as the United States (Müller et al., 2006), China (Pauliuk et al., 2012), and Japan (Müller et al., 2011). Watari (2023) found that IIUS in developed countries is significantly higher than China. Additionally, there have been some studies examining the difference of IIUS among provinces and cities. Song et al. (2020) and Yu et al. (2020) used the bottom-up method to explore the heterogeneity of IIUS in 31 provinces. Liu et al. (2019) studied the metal stocks accumulation of 10 megacities in China. However, there are fewer studies that provide in-depth analyses of the characteristics of the provinces with large IIUS, which can’t provide sufficient support for local policies and government actions.
Currently, research on the spatial characteristics of IIUS only focused on the distribution characteristics. Song et al. (2020) found that the eastern region has the largest share of IIUS by analyzing the total IIUS. Yu et al. (2020) analyzed per capita IIUS and found that its distribution is very uneven, being higher in the eastern and coastal regions. By systematically analyzing the spatial characteristics of IIUS, it is possible to identify the distribution patterns of iron and steel resources within different prefecture-level cities. The current analysis of IIUS spatial characteristics is relatively shallow. Incorporating a spatial autocorrelation model can better identify the clustering patterns of IIUS across different cities, which is crucial for optimizing the location and capacity planning of resource recovery bases (Duan et al., 2021). Currently, spatial autocorrelation model is mainly used to analyze the spatial correlation of carbon emissions (Shen et al., 2021; Zhao et al., 2022; Wang et al., 2023), and few studies have analyzed the spatial correlation of IIUS.
Besides, the relationship between stock and economy has received a lot of attention (Fishman et al., 2015; Krausmann et al., 2017; Song et al., 2020b). Stock can directly reflect the physical basis of the economy (Zhang et al., 2018). Zhao et al. (2020) analyzed the decoupling relationship between IIUS and economic growth by using the decoupling index of resource consumption. Current research shows that the relationship between IIUS and economic growth is complex (Song et al., 2020b), so it is necessary to analyse the decoupling relationship between IIUS and economic development. However, scholars always focus on the decoupled state between the economy and the IIUS, and few studies can reflect the role of relevant factors in the decoupling process.
To fill the above information gaps, the integrated analysis framework of the bottom-up method, spatial autocorrelation model and Tapio-LMDI model is developed to comprehensively analyze the temporal and spatial characteristics of IIUS in provinces with large IIUS. This study aimed to explore the temporal and spatial characteristics of IIUS and the relationship between IIUS and the economy in various prefecture-level cities of the province.
Henan Province is located in the central region and is an emerging industrial province. Previous studies have shown that the central region will become a major supplier of waste steel after 2040 (Song et al., 2020), and Henan Province has the third-largest total amount of IIUS in China (Yu et al., 2020). Therefore, this study chose Henan Province as the research object. The province consists of 18 cities with different economic, demographic, and administrative characteristics, so this study explored the intral heterogeneity of Henan province.
The paper is structured as follows. Section 2 described the methods used in this study. Section 3 discussed the temporal and spatial characteristics of provincial IIUS over the years and the decoupling relationship and decoupling factors between IIUS and economy. Section 4 analyzed its uncertainty and puts forward policy suggestions. Finally, Section 5 presented the conclusion in this paper.
2. Methodology
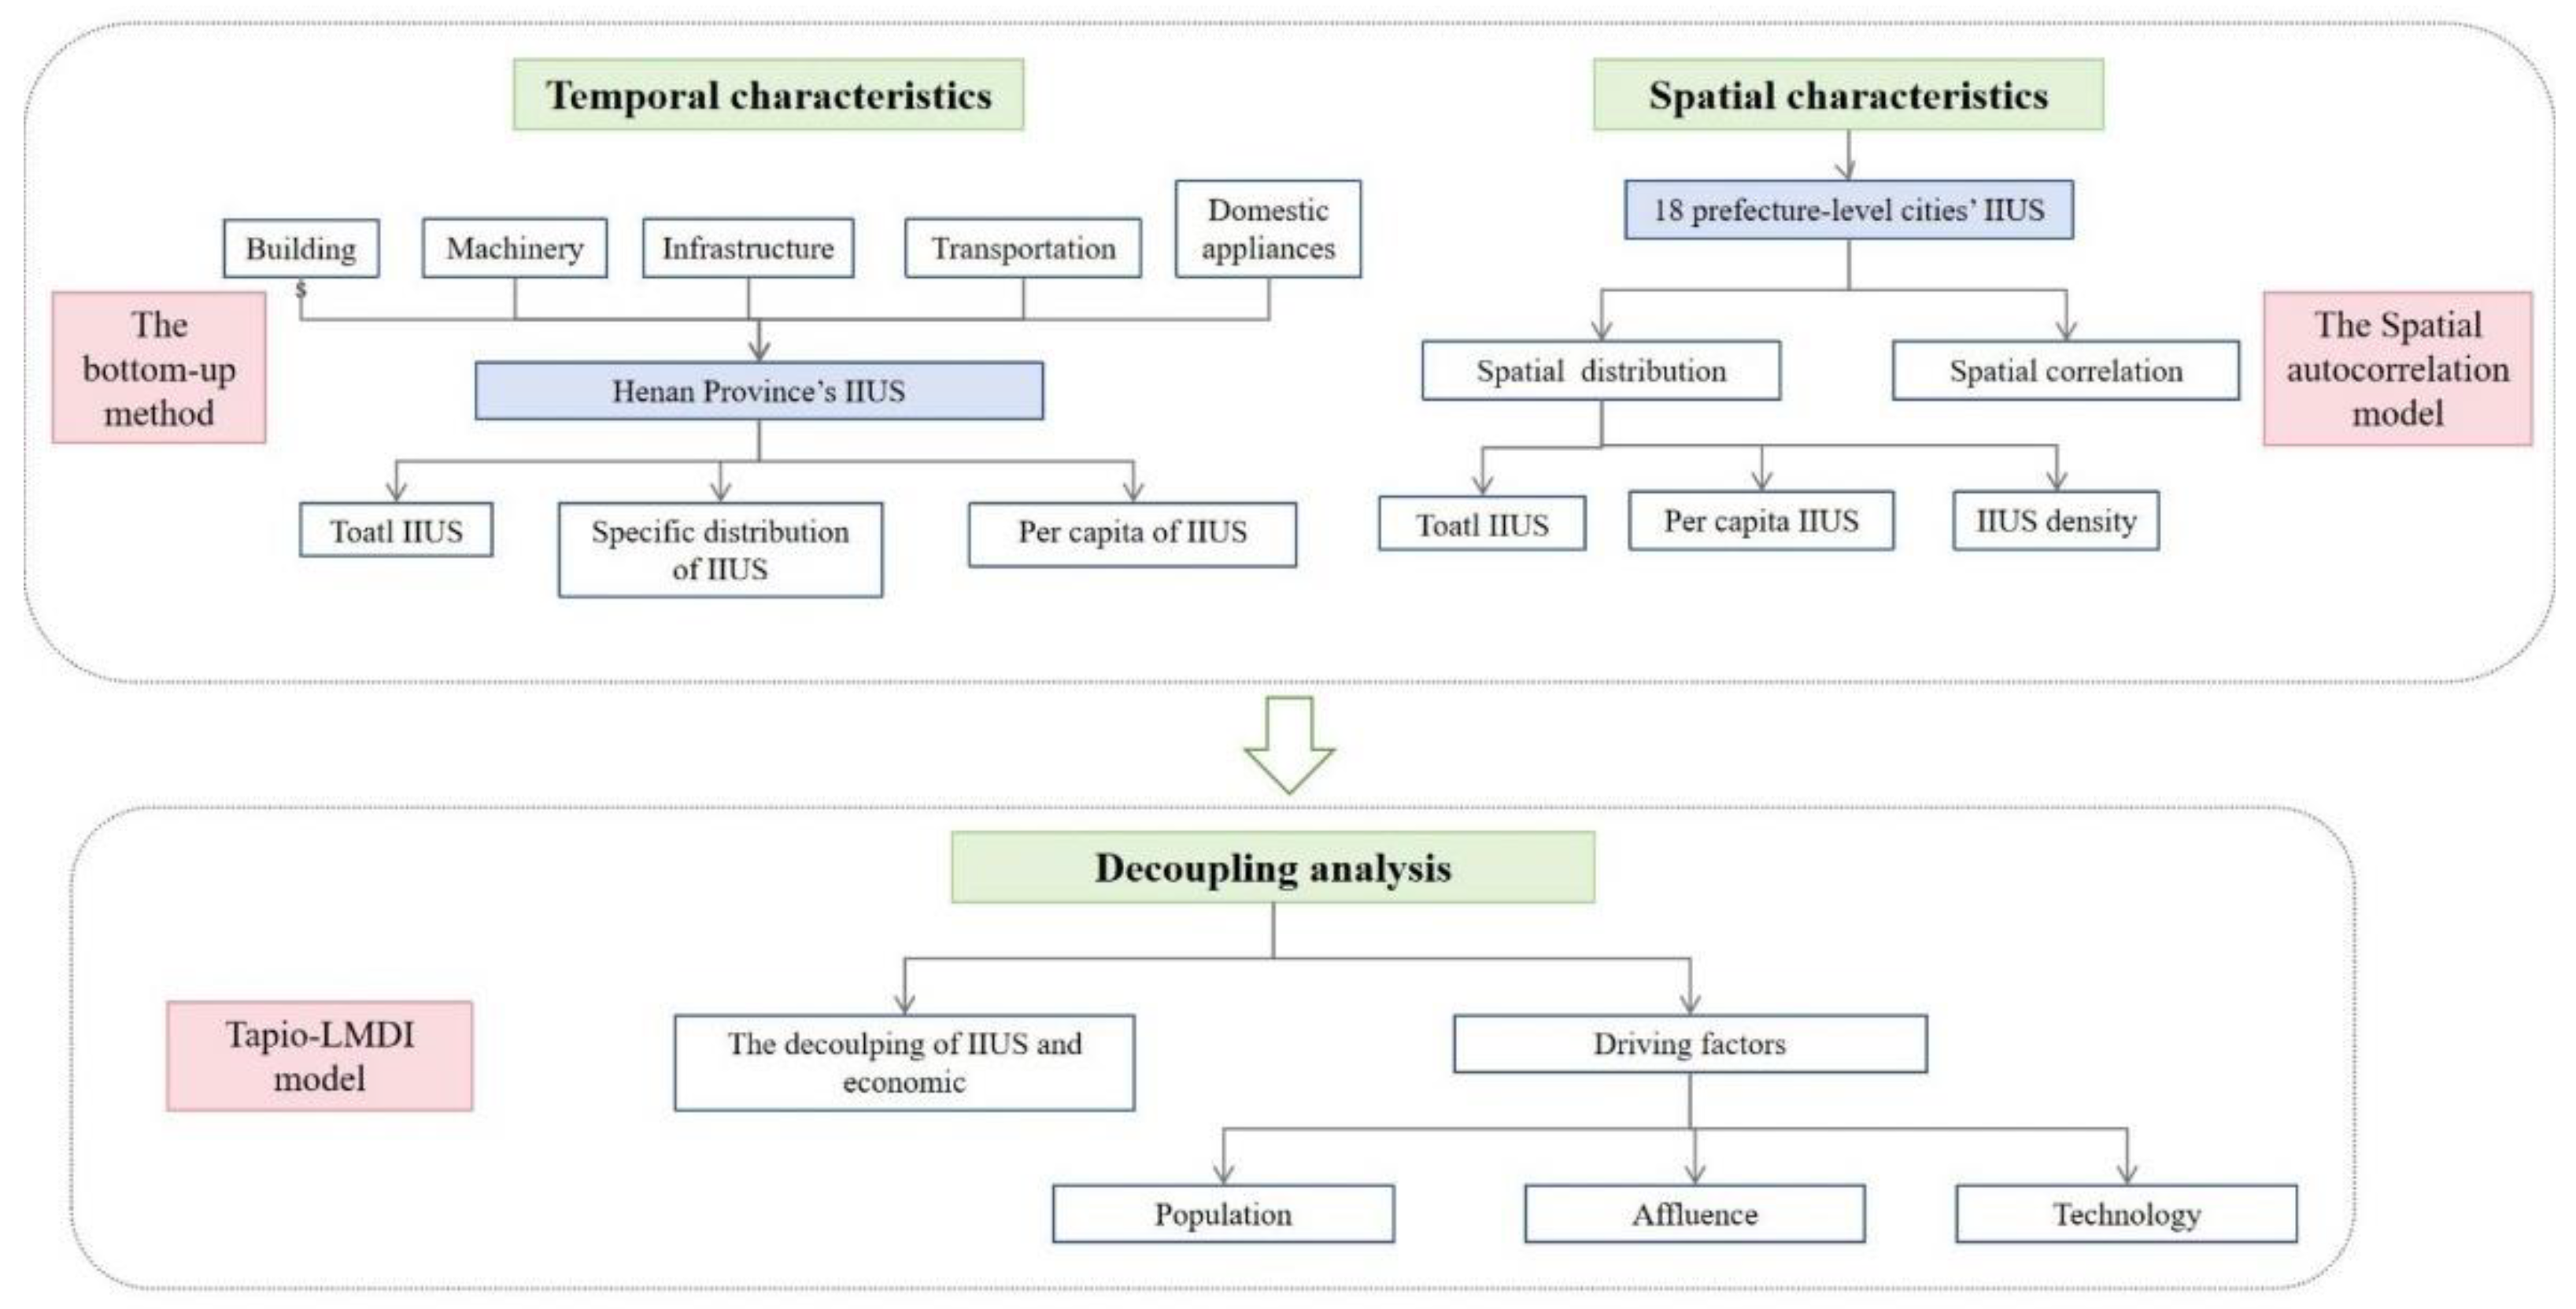
As shown in Figure1, this study presents a comprehensive model designed to quantify and explore the characteristic of IIUS. Firstly this study adopted a bottom-up method to analyse the trends and characteristics of IIUS at the provincial and prefecture level cites over different time scales. Secondly, based on the spatial autocorrelation model, the correlation and distribution characteristics of the spatial distribution of IIUS in each city were explored. Finally, a decoupling effort model was constructed by combining the traditional LMDI model and the Tapio model, which analyzed the decoupling state of IIUS and the economy and identified the main contributing factors affecting the decoupling results.
Figure 1.
The model framework proposed in this study.
2.1. Quantification of the Historical Steel Stocks
The time span of this study is 22 years (2000-2022), with all the administrative districts of Henan Province as the spatial boundaries. Within the boundaries of time and space, this study divides the iron terminal products into five major industries: buildings, infrastructure, machinery, domestic appliances and transportation facilities, and each industry is further divided into several subcategories (see Table 1). The bottom-up method was used to calculate IIUS by collecting information about final product stocks of Henan Province and material intensity (Li et al., 2022), as illustrated by Eq. (1):
where S represents the total IIUS of the surveyed area; Pi represents the amount of product i stocks; Mi represents the steel intensity of product i; and n represents the total number of iron-containing products. The steel strength parameters of related products mainly come from Song et al. (2020).
2.1.1. Buildings
Buildings are mainly divided into two categories: residential and non-residential, and iron is mainly used in the frame structure of the buildings. In this study, it is further subdivided into urban residential buildings, rural residential buildings, urban non-residential buildings and rural non-residential buildings (Song et al., 2020). Since there is no floor area of relevant non-residential buildings, this study adopts the method provided by Zhang et al. (2015), which assumes that residential buildings are proportional to non-residential floor area.
2.1.2. Machinery
Machinery in Henan Province is divided into agricultural and industrial machinery. Among them, the main agricultural machinery are large and medium tractors, large and medium tractor towing farm machines, small tractors, drainage and irrigation machines, combine harvesters, threshing machines, pump, seed pelleting machinery and other motored machinery for processing of farm products. Agricultural machinery and industrial machinery are distinguished. Because data of industrial machinery are not available in statistics, the method recommended by Liu et al. (2019) is used to estimate the number of industrial machinery in this study: it is assumed that the metal content per power of agricultural machinery is applicable to industrial machinery, the steel stock of industrial machinery Sind(t) is calculated from Eq.(2):
Where TPagri(t) and TPind are total capacity (total power, KW) of agriculture machinery and industrial machinery at time t; Sagri(t) determined by Eq 1, is the agricultural machinery stocks at time t.
2.1.3. Infrastructure
Seven important types of infrastructure are considered: roads, bridges, railways, pipelines, street lamps and electricity infrastructures. These data are mainly from the Urban and Rural Construction Statistical Yearbook and Urban Statistical Yearbook of the Ministry of Housing and Urban-Rural Development (NBS, 2001-2023).
2.1.4. Transportation
The main means of transportation in Henan Province are calculated: subway, railway, motorcycles, passenger cars, trucks, trails, diesel and electric locomotives. The number and carrying capacity of transportation facilities since 2000 are analyzed. Data mainly come from the Henan Statistical Yearbook (HSB, 2001-2023).
2.1.5. Domestic Appliances
Iron is widely used in domestic appliances because of its good thermal and electrical conductivity. In this study, domestic appliances are divided into four categories: kitchen appliances, cleaning and thermoregulation appliances, communication appliances and video and Auto appliances. Data of each product are calculated based on the number of households and number of domestic appliances per 100 households from the Henan Statistical Yearbook (HSB, 2001-2023).
2.2. Spatial Autocorrelation Analysis
Spatial autocorrelation is a statistical method used to measure the distribution characteristics and mutual relations of spatial data. There may be some dependence or similarity between data values in adjacent or close positions, and this dependence or similarity will weaken or disappear with the increase of distance. In this study, global and local Moran’s I were used to analyze the differences in the distribution characteristics of per capita of IIUS in different prefecture-level cities in Henan Province from the perspective of space. Moran (1950) initially proposed global Moran’s I (Moran, 1950), which is a statistic that describes the spatial autocorrelation of the whole study area. The formula for the global Moran’s I statistic are given below.
where IG indicates the global Moran’s I, n is the total number of study areas, xi and xj are the values of an attribute feature x at regions i and j, respectively, and wij is an element in spatial weight matrix w that is used to denote the neighboring relationship of spatial regions at n positions.
Moran’s I index ranges from -1 to 1, and is positively spatially correlated when it is greater than 0. The greater the value, the more pronounced the spatial correlation. While a value below zero indicates a spatially negative correlation (Zhang et al., 2023). And the Z-score tests the significance of this index. If the Z-score is close to 0, there is no significant clustering. A positive Z-score indicates clusters with high attribute values and vice versa for clusters with low attribute values. However, only when the significance test result p <0.05 indicates that the value of the study object has a significant spatial autocorrelation, and then the value of Moran’s I has statistical significance.
To improve the accuracy of the identified region, Anselin (1995) proposed the local Moran’s I, which can effectively evaluate the correlation between each space and its neighboring space. Local Moran’s I can measure whether there is a high or low local spatial agglomeration in a region, reflecting the similarity of the attribute values of adjacent units in the space. The formulas for the local Moran’s I statistic are given below.
where IL represents the Local Moran’s I, zi and zj are the values normalized to regions i and j, respectively, wij is an element of the space weight matrix w, xi is an attribute for the feature i, is the mean of the corresponding attribute, and wij is the spatial weight between feature i and j.
2.3. Decoupling Analysis Between IIUS and Economic Growth
Based on the general concept of Tapio decoupling model, the decoupling elasticity index between IIUS and economic growth can be written as:
where, e (MS, GDP) is the decoupling coefficient between IIUS and economic development, MSR and MS0 are IIUS at last period R and the base period 0; GDPR and GDP0 are economic development at last period R and the base period 0 .
Since Tapio decoupling model merely considers the decoupling relationship between IIUS and GDP, and it doesn’t show the reasons behind the changes. Decomposition analysis is helpful to find the main contributors to decoupling improvement. Thereby this article combines IPAT equation, LMDI decomposition with Tapio decoupling model to make an in-depth analysis in search of reasons behind the changes of the decoupling relationship (Xie et al., 2019; Dai et al., 2023). Therefore, proposed the decoupling decomposition model combining the decoupling model and the LMDI model for IIUS (Wang et al., 2019; Wu et al., 2021) .
The IPAT equation can be written as Eqs. (4)-(5):
where T, A and P respectively represents the iron intensity, GDP per capita and the population.The changes in IIUS from the year 0 to R can then be written as Eq. (6) according to LMDI method.
where ΔMS denotes the change of IIUS the year 0 to R. ΔMST, ΔMSA and ΔMSP respectively represents the corresponding changes in iron intensity, GDP per capita, and population, which respectively stands for the contributions from technology, affluence and population to changes in IIUS. ΔMST, ΔMSA and ΔMSP are calculated as equation (7)–(9).
Following Chen et al. (2023), Eq (3) can be rewritten as Eqs (10)-(12).
where eT, eA and eP respectively stands for the decoupling factor of technology, affluence and population scale for IIUS decoupling. The positive value of an influencing factor means that it is the inhibitor for the decoupling process.
3. Results
3.1. The Temporal Characteristic of IIUS
3.1.1. Total IIUS in 2000-2022
Figure 2. presents the IIUS valuation results for Henan Province. The results indicate that the total IIUS increased from 53.41 Mt in 2000 to 474.51 Mt in 2022, with an average annual growth rate of 10.44%. Among the five downstream sectors, the building sector occupies the most significant proportion of IIUS, accounting for 66.89% of the total in 2022. With the rapid urbanization, the IIUS of the building sector in Henan Province continued to grow, from 37.11 Mt to 317.41 Mt. The second downstream sector is the machinery sector, increasing from 9.89 Mt in 2000 to 92.48 Mt in 2022, with an average annual growth rate of 10.70%. The remaining three sectors (infrastructure, transportation, and domestic appliances) have smaller proportions of the total IIUS, not exceeding 13.62% in 2022.
3.1.2. Specific Distribution of IIUS
The proportion of IIUS in the building sector is the largest, which is composed of residential buildings and non-residential buildings. Residential and non-residential building stocks accounted for an average of 42.35% and 26.41% of the total in-use stocks, respectively. Since the 10th Five-Year Plan, IIUS in urban residential buildings showed an increasing tendency because of rural population migration to urban areas, so the urban residential buildings became the most important deposition sector for IIUS (see Figure 3a), reaching 33.88%-44.06%. This is followed by urban non-residential building stocks, which account for 29.28% of the total building sector in 2022.
The share of the machinery sector increased from 18.51% in 2000 to 19.49%, which is the second largest downstream sector of IIUS. It consists mainly of industrial and agricultural machinery. Industrial machinery has the largest share, accounting for 86.68% of the total sector in 2022 (see Figure 3b). Agricultural machinery includes nine primary types of equipment, among them, small tractors’ IIUS accounts for the larger proportion of the whole agriculture machinery sector, accounting for 27.54%.
In the infrastructure sector, IIUS increased significantly from 3.13 Mt to 34.22 Mt during 2000-2022. Bridge was the largest IIUS in the infrastructure sector(see Figure 3c). During 2000-2016, IIUS in the bridge increased from 1.69 Mt to 25.34 Mt. The IIUS of bridge is larger due to the high steel strength, which gives it good stability and durability. This is followed by pipelines and electricity infrastructures, accounting for 14.05% and 4.78% of the total sector in 2022.
As shown in Figure 3d, passenger cars and trucks stocks account for a relatively large proportion of the transportation sector. Passenger cars stocks are growing faster, with an average annual growth rate of 15.78% from 2000 to 2022. The number of cars (especially passenger cars) has gradually increased since the late 2000s, accounting for 67.06% of the total sector. The followed by trucks’ stocks, which account for 27.62% of the total sector in 2022.
Figure 3e shows the changing pattern of IIUS being used in the domestic appliances sector. IIUS in this sector increased significantly from 0.38 Mt to 3.41 Mt during 2000-2022. Reform and opening up have gradually enabled residents to lead a more comfortable life, and with the rising demand for living, domestic appliances such as air-conditioners, washing machines and refrigerators have gradually become an indispensable part of residents’ lives. So the domestic appliances sector is mainly composed of cleaning and thermoregulation appliances’ stocks, accounting for 85.63% of the sector in 2022.
3.1.3. Per Capita of IIUS
The per capita IIUS in Henan Province increased from 0.56 t/cap in 2000 to 4.81 t/cap in 2022, with an annual growth rate of 10.24%. As shown in Figure 4, the growth in per capita IIUS is positively correlated with the growth in per capita GDP. Currently, the per capita IIUS in China is in a rapid development stage. However, the per capita GDP of Henan Province is lower than China, its growth rate is slower than China.
Compared to developed countries, the EU’s per capita IIUS has gradually reached a saturation state, exceeding 10 t/cap (Watari et al., 2023), meaning that while per capita GDP continues to grow, the per capita IIUS remains unchanged. The USA reached saturation in 2004, approaching 11 t/cap, and its per capita GDP is much higher than China. China’s per capita GDP and IIUS lag behind those of developed countries. Similarly, Henan Province lags behind China as a whole. This gap indicates that there is a huge potential for future growth in per capita IIUS in Henan Province as the economy develops.
3.2. The Spatial Characteristic of IIUS
3.2.1. The Spatial Distribution of IIUS for 18 Prefecture-Level Cities in Henan
Henan Province is composed of 18 prefecture-level cities. There are differences in the total amount and composition of IIUS in prefecture-level cities (See Figure S1). ZZ, the capital city of Henan Province, has the largest GDP, accounting for 21% of the province’s GDP. Therefore, its IIUS is the largest, accounting for 14.74% of the province. In addition to ZZ, the IIUS of XX, NY, ZMD and LY also have a high share of IIUS in the province, with 8.25%, 8.01%, 7.48% and 6.91%, respectively. Including ZZ, the top five regions account for 45.32% of the total stock in the province. In addition, the prefecture-level city with the lowest IIUS is JY, accounting for only 1.11% of the province, followed by LH, with 8.85 Mt.
The spatial characteristics pattern of IIUS in prefecture-level cities of Henan are shown in the Figure 5. From the spatial distribution pattern, it can be seen that the areas with high density of IIUS are those with large populations and high GDP per capita (Figure 6). For iron stock density, the IIUS density in Henan Province is 2723.68 t/km2. Among all cities, ZZ’s GDP ranks first in the province, so ZZ has the largest IIUS density, which is 8855.35 t/km2. The IIUS density of ZZ is 8.39 times that of SMX, which is the least dense city. For iron stock per capita, the per capita IIUS in Henan Province is 4.56 t/cap. Among the cities, the city with the largest per capita IIUS is JY, reaching 6.92 t/cap, mainly because JY has the smallest population in Henan Province. The city with the lowest per capita IIUS is ZK (3.24 t/cap), mainly because ZK has the lowest per capita GDP in the province. Comparing the coefficient of variation (CV) for these two data sets, the data for per capita IIUS have a CV of 21.71%, and data for the density of IIUS have a CV of 54.08%. This result demonstrates the certain spatial heterogeneity among Henan’s prefecture-level cities in iron stocks’ density.
In-use stock not only satisfies the needs of human daily life, but also serves as a driving force for material to be recycled (Zhang et al., 2019). The policy of Recycling of Waste Materials (NDRCC, 2022) point out that there is a need to optimize the industrial layout of resource recycling according to resource endowment, industrial distribution and waste characteristics. Differences in the quantity and types of scrap steel in prefecture-level cities in Henan Province are closely related to the variability in the distribution pattern of IIUS. Therefore, it is necessary to consider the spatial distribution of IIUS in order to optimize the recycling layout of scrap steel resources. And the IIUS density and per capita IIUS in prefecture-level cities can also be used as important indicators for optimizing the layout of scrap resources in the future.
3.2.2. Spatial Autocorrelation Analysis of IIUS
In this study, Moran’s I was used to test the spatial correlation of per capita IIUS. Firstly, the global Moran’s I autocorrelation analysis was carried out on the per capita of IIUS in Henan Province in 2021, based on the unit of prefecture-level cities. The results showed that the Moran’s I index was 0.47 and the Z-value was 2.75 (P <0.001), indicating that the per capita IIUS in Henan Province is a non-random distribution at the prefecture-level cities, showing a significant spatial positive correlation. The overall distribution is clustered, with high (low) growth levels and other cities with high (low) growth levels neighboring each other in the spatial location distribution. Secondly, the spatial autocorrelation per capita IIUS is tested locally. As shown in Figure 7, the high-high agglomeration characteristic of per capita IIUS is quite obvious, that is, a region with large per capita IIUS is surrounded by other regions with larger per capita IIUS. The high-high agglomeration areas are mainly concentrated in JZ and XX. The low-low agglomeration area is distributed mainly in KF.
3.3. Decoupling Analysis
Based on the five-year plan, Henan’s IIUS was decoupled in five phases. Table 2 shows the decoupling index between Henan’s IIUS and the economy. From 2000 to 2022, both GDP and IIUS maintained a growth trend (i.e., ΔGDP/GDP > 0; ΔMS/MS > 0). The decoupling index continued to increased to 0.67, but it showed a downward trend after the 11st Five-Year Plan. This result indicates that IIUS and economic growth are in a state of weak decoupling, with the correlation between economic growth and IIUS gradually weakening. This means that during this phase, while economic growth continued, the growth rate of IIUS slowed down relative to the rate of economic growth. Since the 21st century, China’s rapid industrialization and urbanization have stimulated economic and IIUS growth. However, with technological advancements, the development of a circular economy, and adjustments in industrial structure, the close relationship between economic growth and IIUS has weakened, leading to a reduction in environmental impact.
In order to further clarify the internal factor of the change of decoupling index, the LMDI model was used to decompose the decoupling index. And the decoupling index can be divided into three factors (See Figure 8):
- (1)
- The affluence factor is the most important disincentive to decoupling. The average annual contribution value of the decoupling index reached 0.27, and even 0.54 in the 10th Five-Year Plan period, and the lowest contribution value was 0.012 in the early 14th Five-Year Plan period. According to the Outline of China’s 13th Five-Year Plan, the average annual growth rate of China’s economy will be reduced to 6.5% from 2016-2020, and Henan’s 13th Five-Year Plan has also reduced the economic growth rate to 8%, which means that the driving role of affluence will be weakened. Although the affluence factor is declining, it is still an important factor affecting decoupling.
- (2)
- The population scale factor has an inhibitory effect on the decoupling state, but the inhibitory effect on the decoupling elasticity index is weak, and the overall trend is downward. The impact of the population scale factor on decoupling is mainly reflected in rural-urban migration. In order to accommodate more people, the government needs to build a large number of buildings and infrastructure. Henan’s population has been on an upward trend, growing from 9466 million in 2000 to 9941 million in 2020, and then declining to 9872 million in 2021. From the 13th Five-Year Plan to the early 14th Five-Year Plan period, because the population decreased by 16.6 million, the population scale factor help to promote decoupling. Thus, the population scale factor in the future may help to reach the decoupling.
- (3)
- The technological factor is the only one that has been contributing to the state of decoupling. The advancement in technology is mainly due to the increased utilisation intensity of IIUS and resource substitution (Dai et al., 2023). Figure S2 shows the utilization intensity of IIUS, which shows a decreasing trend, and the technical effect of intensity is positive. The substitution of resources is mainly due to the accelerated industrialisation of China, which has resulted in the development of new materials that have replaced some of the steel. So in the future, technological advances can lead to more rapid decoupling through the introduction of new technologies and alternative resources.
4. Discussion
4.1. Comparison with Other Regions
The level of in-use stocks can reflect the level of technological and economic development of a region. Table 3 shows the results of IIUS studies in other regions, which can be used as benchmarks when analyzing. Compared with other provinces in China, Henan Province had a per capita stock of 3.31 t/cap in 2016, which is lower than Zhejiang and Fujian Provinces. From the previous analyses, it can be seen that the per capita stock is positively correlated with the per capita GDP, and this difference may be caused by the difference in the level of economic development of the two regions and the size of their populations. In 2016, Henan Province’s GDP was 40160.01 billion, ranking 4th in China, but its per capita GDP only ranked 20th, far below Zhejiang and Fujian provinces. Combined with the analyses of previous studies (Hao et al., 2020), it can be seen that the share of steel in the building sector fluctuates and decreases over time, but it is still an important source of IIUS, so the results of this study are in line with the characteristics of China. In the future, the steel industry should consider the steel demand in the building sector to avoid the mismatch between steel supply and demand.
This result also reflects the fact that the large use of iron and steel in developed countries is driven by their sophisticated ironmaking processes and developed economies. The quantity of IIUS is therefore a determinant of a country’s industrial process and level of development. As long as IIUS per capita remains at the 2 t threshold, it has entered the core stage of industrialization (Muller et al., 2011). Henan Province only reached the 2 t threshold in 2014, officially entering the stage of rapid industrial development. Pauliuk et al. (2013) calculated IIUS per capita for 200 countries around the world and found that the saturation point for all countries is 10-16 t/cap. The saturation point is about 2-3 times higher than in Henan Province. Based on the saturation evidence from industrialized countries, it can be expected that the demand for IIUS in Henan Province will increase further soon, especially for those end-use sector with a large proportion of IIUS.
4.2. Uncertainty Analysis
In the bottom-up method, the estimation of IIUS was based on several different data sources, so it is necessary to analyze for uncertainty. This study selected the semi-quantitative evaluation method to perform uncertainty analysis (Salemdeeb et al., 2021; Zhang et al., 2012). Data from statistical and survey reports are considered to have less uncertainty than data from through data from estimation and other literature. Besides, some calculations involved multiple estimation parameters. In this case, we assume that the more estimated parameters are used, the greater the uncertainty of the calculated data. Based on these assumptions, the different data sources were categorized into different levels of uncertainty (Table 4). “Low” represents ±10% uncertainty, “Medium” represents ±20%, and “High” represents ±30%.
Due to the complexity of the equipment that constitutes the machinery sector, the uncertainty of the result is medium, and the sectors account for 22.68% of the total IIUS. Compare with previous study, the share of machinery sector’s IIUS is 20.76% of Sichuan Province in 2018 (Yue et al., 2023), and the share of machinery is 19.29% in Henan Province. Because the GDP of these two provinces are similar in 2018, so it can be seen that the proportion in this study is also very consistent with previous scholarship. In addition, due to the lack of data on the per capita non-residential floor area in urban and rural areas, the IIUS of non-residential buildings is calculated according to the method provided by Zhang et al. (2015), so the uncertainty of the result is medium, and these two sectors account for 31.67% of the total IIUS. The data for the electricity infrastructures sector comes from the Statistical yearbook, but detailed data are not disclosed in 2020-2022, so the uncertainty is medium. The uncertainty in the domestic appliances sector stems from the failure to fully count all communication appliances and video and auto appliances, so its uncertainty is medium. In general, the uncertainty of the estimated results in this study is acceptable.
4.3. Policy Implications
The iron and steel industry is facing challenges from declining capacity, and this study provides a scientific basis for future steel demand forecasting and scrap recycling by accounting for IIUS. Specific recommendations are given below:
- (1)
- Completing the scrap steel recycling chain from the perspective of industrial distribution. In terms of downstream sectors, IIUS in the building sector continues to grow and is the main source of IIUS, reaching 66.89 % of the total IIUS in 2022. The lifetime of building is typically around 30-50 years (Hu et al., 2010), so a large number of IIUS will be phased out at the end of their lifetime in the future. But Guo et al. (2019) found that the utilization rate of building waste in China is less than 10%. In order to achieve efficient use of iron and steel resources, steel recyclers need to improve their integration capabilities for professional dismantling and fine sorting. At the same time, it is necessary to continuously optimize the integrated development of scrape steel, recycling, dismantling, processing and distribution, and improve the recycling network of scrap steel resources.
- (2)
- Optimizing the recycling layout of scrap resources based on the IIUS at the prefecture-level cities. To improve the utilization efficiency of steel resources, combined with the research results of this paper and considering the distribution of the steel industry in Henan Province, it is proposed to prioritize the establishment of scrap steel recycling bases around Jiaozuo and Xinxiang, so as to promote the agglomeration and large-scale green development of recycling enterprises and cultivate leading enterprises. Meanwhile, it is recommended to establish scrap recycling outlets in Zhengzhou, Nanyang and other cities with a large number of IIUS in order to recycle resources more efficiently.
- (3)
- Promoting the decoupling between IIUS and economic development through technology. Henan Province is currently in the industrialization stage, and IIUS will continue to grow with economic growth. To accelerate the decoupling between IIUS and economic development, based on the findings of this study, technology is the primary factor in promoting decoupling. Therefore, it is necessary to improve the level of technological innovation and substitute materials appropriately. At the same time, it is necessary to provide financial subsidies for technological innovation of enterprises and improve fiscal and tax preferential policies.
5. Conclusion
Through the bottom-up method, this study have researched the quantity, composition and distribution pattern of IIUS from temporal and spatial dimension, and used spatial autocorrelation model to explore spatial correlation of prefecture-level cities of Henan Province in 2021. Meanwhile, through Tapio—LMDI model, the decoupling of IIUS and economy and the main driving factors are discussed. Several conclusions are as follows.
- (1)
- Henan Province’s IIUS has been growing rapidly. From 2000–2022, Henan Province’s in-use steel stock increased by 7.89 times, from 53.41 Mt to 474.51 Mt. The per capita IIUS in Henan Province increased by 7.54 times, changing from 0.56 t/cap to 4.81 t/cap. This is obviously lower than that of developed countries and has considerable growth potential in the future. From the perspective of industrial distribution, in the last 22 years, the building sector has accounted for the largest proportion.
- (2)
- At prefecture-level cities, the magnitudes of IIUS on per capita basis are close, ranging from 3.24 to 6.92 t/cap. Category distribution patterns are also similar, showing relative consistency in iron use among all 18 prefecture-level cities. However, the wide range of stocks density, between 1055.35 to 8855.35 t/km2, reveals signification spatial heterogeneity. Through the spatial autocorrelation analysis, it can be seen that the per capita stock in Henan Province shows a significant spatial autocorrelation at the prefecture-level cities. The main agglomeration area is concentrated in Jiaozuo and Xinxiang.
- (3)
- By Tapio model, this study found that IIUS and economic development have always been Weak-decoupling, and the correlation is weakening. Through the decomposition analysis of decoupling factors, this study finds that the technology factor can always promote decoupling and the population size factor can promote decoupling in the future.
In summary, the results of this study can provide the relevant information needed to set policies on the recycling of scrap metal, which can help to make better decisions on recycling and steel scrap management within a region or city. In the next research, we can use it to forecast future steel demand and assess the potential for energy savings and emission reductions in the steel industry based on our analysis results..
Supplementary Materials
The following supporting information can be downloaded at the website of this paper posted on Preprints.org.
References
- Anselin, L. Local indicators of spatial association lisa. Geogr. Anal. 1995, 27, 93–115. [Google Scholar] [CrossRef]
- China Iron And Steel Association (CISA). China Steel Yearbook; China Iron and Steel Association: Beijing, China, 2022. [Google Scholar]
- China Association for Material Recycling (CAMR). China Recycling Industry Development Report: Beijing, China, 2023.
- Dai, T.J.; Yue, Z.C. The evolution and decoupling of in-use stocks in Beijing. Energ. Econ. 2023, 203, 107606. [Google Scholar] [CrossRef]
- Drakonakis, K.; Rostkowski, K.; Rauch, J.; Graedel, T.E.; Gordon, R.B. Metal capital sustaining a north American city: iron and copper in NewHaven CT. Resour. Conserv. Recycl. 2007, 49, 406–420. [Google Scholar] [CrossRef]
- Duan, L.; Liu, Y.; Yang, Y.; et al. Spatiotemporal dynamics of in-use copper stocks in the Jing-Jin-Ji urban agglomeration, China. Resour., Conserv. Recycl. 2021, 175, 105848. [Google Scholar] [CrossRef]
- Fishman, T.; Schandl, H.; Tanikawa, H. The socio-economic drivers of material stock accumulation in Japan’s prefectures. Ecol. Econ. 2015, 113, 76–84. [Google Scholar] [CrossRef]
- Gloser, S.; Soulier, M.; Tercero Espinoza, L.A. Dynamic analysis of global copper flows. Global stocks, postconsumer material flows, recycling indicators, and uncertainty evaluation. Environ. Sci. Technol. 2013, 47, 6564–6572. [Google Scholar] [CrossRef]
- Guo, J.; Miatto, A.; Shi, F.; Tanikawa, H. Spatially explicit material stock analysis of buildings in Eastern China metropoles. Resour. Conserv. Recycl. 2019, 146, 45–54. [Google Scholar] [CrossRef]
- Hao, M.; Song, L.L.; Dai, M.; Liu, Y.P.; Dai, T.; Chen, W.Q. Urban mining assessment of copper, iron and aluminum in Fujian province. Resour. Ind. 2020, 22, 66–74. (in Chinese). [Google Scholar] [CrossRef]
- Henan Statistical Bureau (HSB), 2001-2023. Statistical Yearbook of Henan. China Statistics Press, Henan, China. Available online: http://www.ha.stats.gov.cn/tjfw/tjcbw/tjnj/ (accessed on 18 May 2021).
- Hu, M.; Pauliuk, S.; Wang, T.; Huppes, G.; Voet, E.V.D.; Müller, D.B. Iron and steel in Chinese residential buildings: a dynamic analysis. Resour. Conserv. Recycl. 2010, 54, 591–600. [Google Scholar] [CrossRef]
- The People’s Government of Henan Province (PGHP), 2017. Jiyuan National Industry-City Integration Demonstration Zone General Program. Available online: https://www.henan.gov.cn/2017/07-03/239746.html (accessed on 27 May 2024).
- The People’s Government of Henan Province (PGHP), 2021. Henan releases a pilot recycling and treatment system for used and end-of-life appliances. Available online: https://www.henan.gov.cn/2021/07-08/2179992.html (accessed on 27 May 2024).
- Kozawa, S.; Tsukihashi, F. Analysis of global demand for ironsource by estimation of in-use steel stock. Tetsu to Hagane. 2009, 95, A710–A719. [Google Scholar] [CrossRef]
- Krausmann, F.; Wiedenhofer, D.; Lauk, C.; Haas, W.; Tanikawa, H.; Fishman, T.; Miatto, A.; Schandl, H.; Haberl, H. Global socioeconomic material stocks rise 23-fold over the 20th century and require half of annual resource use. Proc. Natl. Acad. Sci. 2017, 114, 1880–1885. [Google Scholar] [CrossRef] [PubMed]
- Li, S.P.; Wang, Z.; Zhang, T.G.; Yue, Q. Quantification and spatial distribution of aluminum in-use stocks in Henan Province, China. Resour. Conserv. Recycl. 2022, 186, 1006540. [Google Scholar] [CrossRef]
- Liu, Q.; Cao, Z.; Liu, X.; Liu, L.; Dai, T.; Han, J.; Duan, H.; Wang, C.; Wang, H.; Liu, J.; Cai, G.; Mao, R.; Wang, G.; Tan, J.; Li, S.; Liu, G. Product and metal stocks accumulation of China’s megacities: patterns, drivers, and implications. Environ. Sci. Technol. 2019, 53, 4128–4139. [Google Scholar] [CrossRef] [PubMed]
- Lou, Y.; Shi, L. Metal stock analysis at the city scale - an example of steel and aluminium stocks in Handan City in 2005. Resour. Sci. 2008, 30, 147–152. (in Chinese). [Google Scholar]
- Moran, P.A. Notes on continuous stochastic phenomena. Biome. 1950, 37, 17–23. [Google Scholar] [CrossRef]
- Müller, D.B.; Wang, T.; Duval, B. Patterns of iron use in societal evolution. Environ. Sci. Technol., 2011, 45, 182–188. [Google Scholar] [CrossRef]
- Müller, D.B.; Wang, T.; Duval, B.; Graedel, T.E. Exploring the engine of anthropogenic iron cycles. Proc. Natl. Acad. Sci. 2006, 103, 16111–16116. [Google Scholar] [CrossRef]
- National Bureau of Statistics (NBS), 2019-2023. China Rural Statistical Yearbook. China Statistics Press., China. http://www.ha.stats.gov.cn/tjfw/tjcbw/tjnj/.
- National Bureau of Statistics (NBS), 2001-2023. Statistical Yearbook of urban construction. China Statistics Press, China. https://www.mohurd.gov.cn/.
- National Bureau of Statistics (NBS), 2022. Statistical yearbook of urban and rural construction. China Statistics Press, China. https://www.mohurd.gov.cn/.
- National Development and Reform Commission of China (NDRCC), 2018. Announcement on the construction of national resource recycling base units. https://www.gov.cn/xinwen/2018-09/10/content_5320836.htm (accessed 27 May 2024).
- National Development and Reform Commission of China (NDRCC), 2021. “The 14th Five-Year Plan” for the Development of Circular Economy. https://www.gov.cn/zhengce/zhengceku/2021-07/07/content_5623077.htm (accessed 13 September 2024).
- National Development and Reform Commission of China (NDRCC), 2022. Guiding Opinions on Accelerating the Construction of Waste Material Recycling System. https://www.gov.cn/zhengce/zhengceku/2022-01/22/content_5669857.htm (accessed 13 September 2024).
- Pauliuk, S.; Wang, T.; Müller, D. Moving toward the circular economy: the role of stocks in the Chinese steel cycle. Environ. Sci. Technol. 2012, 46, 148–154. [Google Scholar] [CrossRef]
- Pauliuk, S.; Wang, T.; Müller, D.B. Steel all over the world: estimating in-use stocks of iron for 200 countries. Resour. Conserv. Recycl. 2013, 71, 22–30. [Google Scholar] [CrossRef]
- Shen, W.R.; Liang, H.W.; Dong, L.; Ren, J.Z.; Wang, G.J. Synergistic CO2 reduction effects in Chinese urban agglomerations: Perspectives from social network analysis. Sci. Total Environ. 2021, 798, 149352. [Google Scholar] [CrossRef]
- Song, L.L.; Wang, P.; Hao, M.; Dai, M.; Xiang, K.Y.; Li, N.; Chen, N.Q. Mapping provincial steel stocks and flows in China: 1978-2050. J. Clean. Prod. 2020, 262, 121393. [Google Scholar] [CrossRef]
- Song, L.L.; Wang, P.; Xiang, K.; Chen, W.Q. Regional disparities in decoupling economic growth steel stocks: forty years of provincial evidence in China. J. Environ. Manage. 2020b, 271, 111035. [Google Scholar] [CrossRef] [PubMed]
- Song, L.L.; Han, J.; Li, N.; Huang, Y.Y.; Hao, M.; Dai, M.; Chen, W.Q. China material stocks and flows account for 1978–2018. Sci. Data. 2021, 8, 303. [Google Scholar] [CrossRef] [PubMed]
- Salemdeeb, R.; Saint, R.; Clark, W.; Lenaghan, M.; Pratt, K.; Millar, F. A pragmatic and industry-oriented framework for data quality assessment of environmental footprint tools. Resour. Environ. Sustain. 2021, 3, 100019. [Google Scholar] [CrossRef]
- Tanikawa, H.; Hashimoto, S. Urban stock over time: spatial material stock analysis using, 4.d.-G.I.S. Build. Res. Inf. 2009, 37, 483–502. [Google Scholar] [CrossRef]
- United States Geological Survey (USGS), 2005. Metal Stocks in Use in the United States. America. https://pubs.usgs.gov/fs//2005/3090/2005-3090.pdf.
- Wang, J.L.; Graedel, T.E. Aluminum in-use stocks in China: a bottom-up study. J. Mater. Cycles Waste Manag. 2010, 12, 66–82. [Google Scholar] [CrossRef]
- Wang, T.; Müller, D.B.; Hashimoto, S. The ferrous find: counting iron and steel stocks in China’s economy. J. Ind. Ecol. 2015, 19, 877–889. [Google Scholar] [CrossRef]
- Wang, X.F.; Shen, D.J.; Li, W. Research on the mechanism, model and application of decoupling between water resources utilization and economic growth. China Popul. Resour. Environ. 2019, 29, 139–147. (in Chinese). [Google Scholar] [CrossRef]
- Watari, T.; Giurco, D.; Cullen, J. Scrap endowment inequalities in global steel decarbonization. J. Clean. Prod. 2023, 425, 139041. [Google Scholar] [CrossRef]
- Wang, Y.F.; Lv, W.Y.; Wang, M.J.; Chen, X.; Li, Y. Application of improved Moran’s I in the evaluation of urban spatial development. Spat. Stat. 2023, 54, 100736. [Google Scholar] [CrossRef]
- Wu, D.; Li, A.; Zhang, C.J. Evaluation on the decoupling between the economic development and water resources utilization in the Beijing-Tianjin-Hebei region under dual control action. China Popul. Resour. Environ. 2021, 31, 150–160. [Google Scholar]
- World Steel Association. World Steel in Figures; World Steel Association: Brussels, Belgium, 2019. [Google Scholar]
- World Steel Association, 2021. Steel Statistical Yearbook 2021. https://worldsteel.org/data/world-steel-in-figures-2022/#world-crude-steel-production-1950-to-2021.
- Xie, P.J.; Gao, S.S.; Sun, F.H. An analysis of the decoupling relationship between CO2 emission in power industry and GDP in China based on LMDI method. J. Clean. Prod. 2019, 211, 598–606. [Google Scholar] [CrossRef]
- Yue, Q.; Wang, H.M.; Gao, C.K.; Du, T.; Li, M.J.; Lu, Z.W. Analysis of iron in-use stocks in China. Resour. Policy. 2016, 49, 315–322. [Google Scholar] [CrossRef]
- Yu, B.Y.; An, R.Y.; Zhao, J.P. Spatial and temporal disparity of the in-use steel stock for China. Resour. Conserv. Recycl. 2020, 155, 104667. [Google Scholar] [CrossRef]
- Zhao, F.; Yue, Q.; He, J.H.; Li, Y.; Wang, H.M. Quantifying China’s iron in-use stock and its driving factors analysis. J. Environ. Manage. 2020, 274, 111220. [Google Scholar] [CrossRef] [PubMed]
- Zhao, D.D.; Lei, Y.; Zhang, Y.; Shi, X.R.; Liu, X.; Xu, Y.L.; Xue, W.B. Analysis of vehicular CO2 emission in the Central Plains of China and its driving forces. Sci. Total Environ. 2022, 814, 152758. [Google Scholar] [CrossRef]
- Zhang, L.; Yuan, Z.; Bi, J. Estimation of copper in-use stocks in Nanjing, China. J. Ind. Ecol. 2012, 16, 191–202. [Google Scholar] [CrossRef]
- Zhang, L.; Yang, J.M.; Cai, Z.J.; Yuan, Z.W. Understanding the spatial and temporal patterns of copper in-use stocks in China. Environ. Sci. Technol. 2015, 49, 6430–6437. [Google Scholar] [CrossRef]
- Zhang, C.; Chen, W.Q.; Ruth, M. Measuring material efficiency: a review of the historical evolution of indicators, methodologies and findings. Resour. Conserv. Recycl. 2018, 132, 79–92. [Google Scholar] [CrossRef]
- Zhang, Y.P.; Zhao, H.T.; Yu, Y.D.; Wang, T.; Zhou, W.J.; Jiang, J.; Chen, D.J.; Zhu, B. Copper in-use stocks accounting at the sub-national level in China. Resour. Conserv. Recycl. 2019, 147, 49–60. [Google Scholar] [CrossRef]
- Zhu, J.; Fan, C.; Shi, H.; Shi, L. Efforts for a circular economy in China: a comprehensive review of policies. J. Ind. Ecol. 2019, 23, 110–118. [Google Scholar] [CrossRef]
- Zhang, Y.; Teoh, B.K.; Zhang, L. Exploring driving force factors of building energy use and GHG emission using a spatio-temporal regression method. Energ. 2023, 269, 126747. [Google Scholar] [CrossRef]
Figure 2.
IIUS from 2000 to 2022 in Henan Province (Unit: Mt).
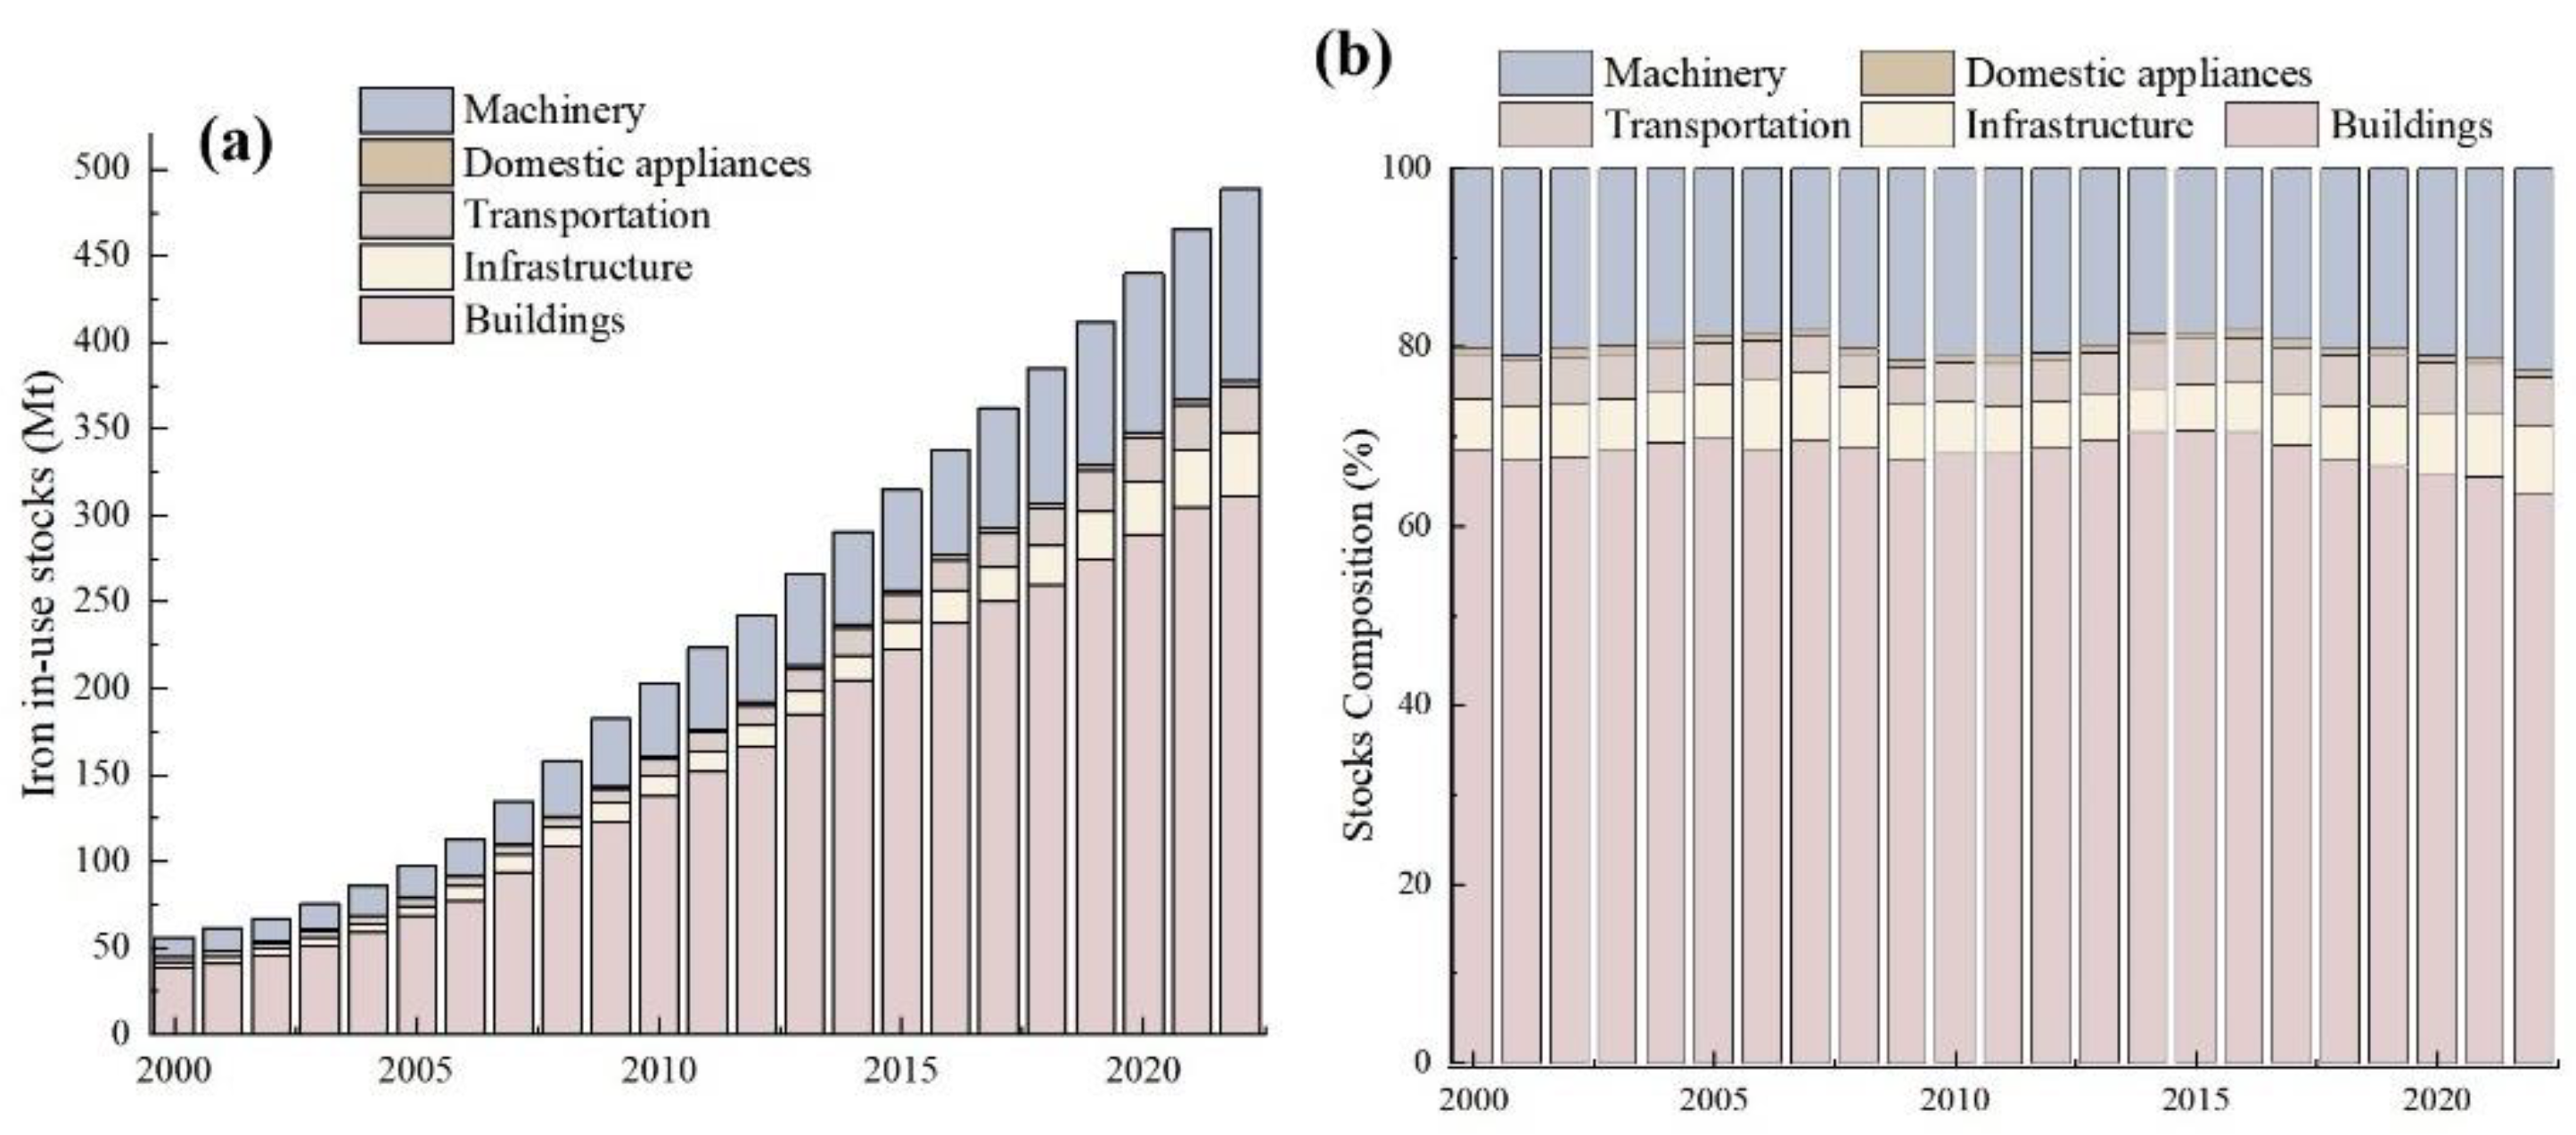
Figure 3.
The evolution of in-use product stocks in buildings (a), transportation (b), infrastructures(c), machinery(d), domestic appliances(e).
Figure 3.
The evolution of in-use product stocks in buildings (a), transportation (b), infrastructures(c), machinery(d), domestic appliances(e).
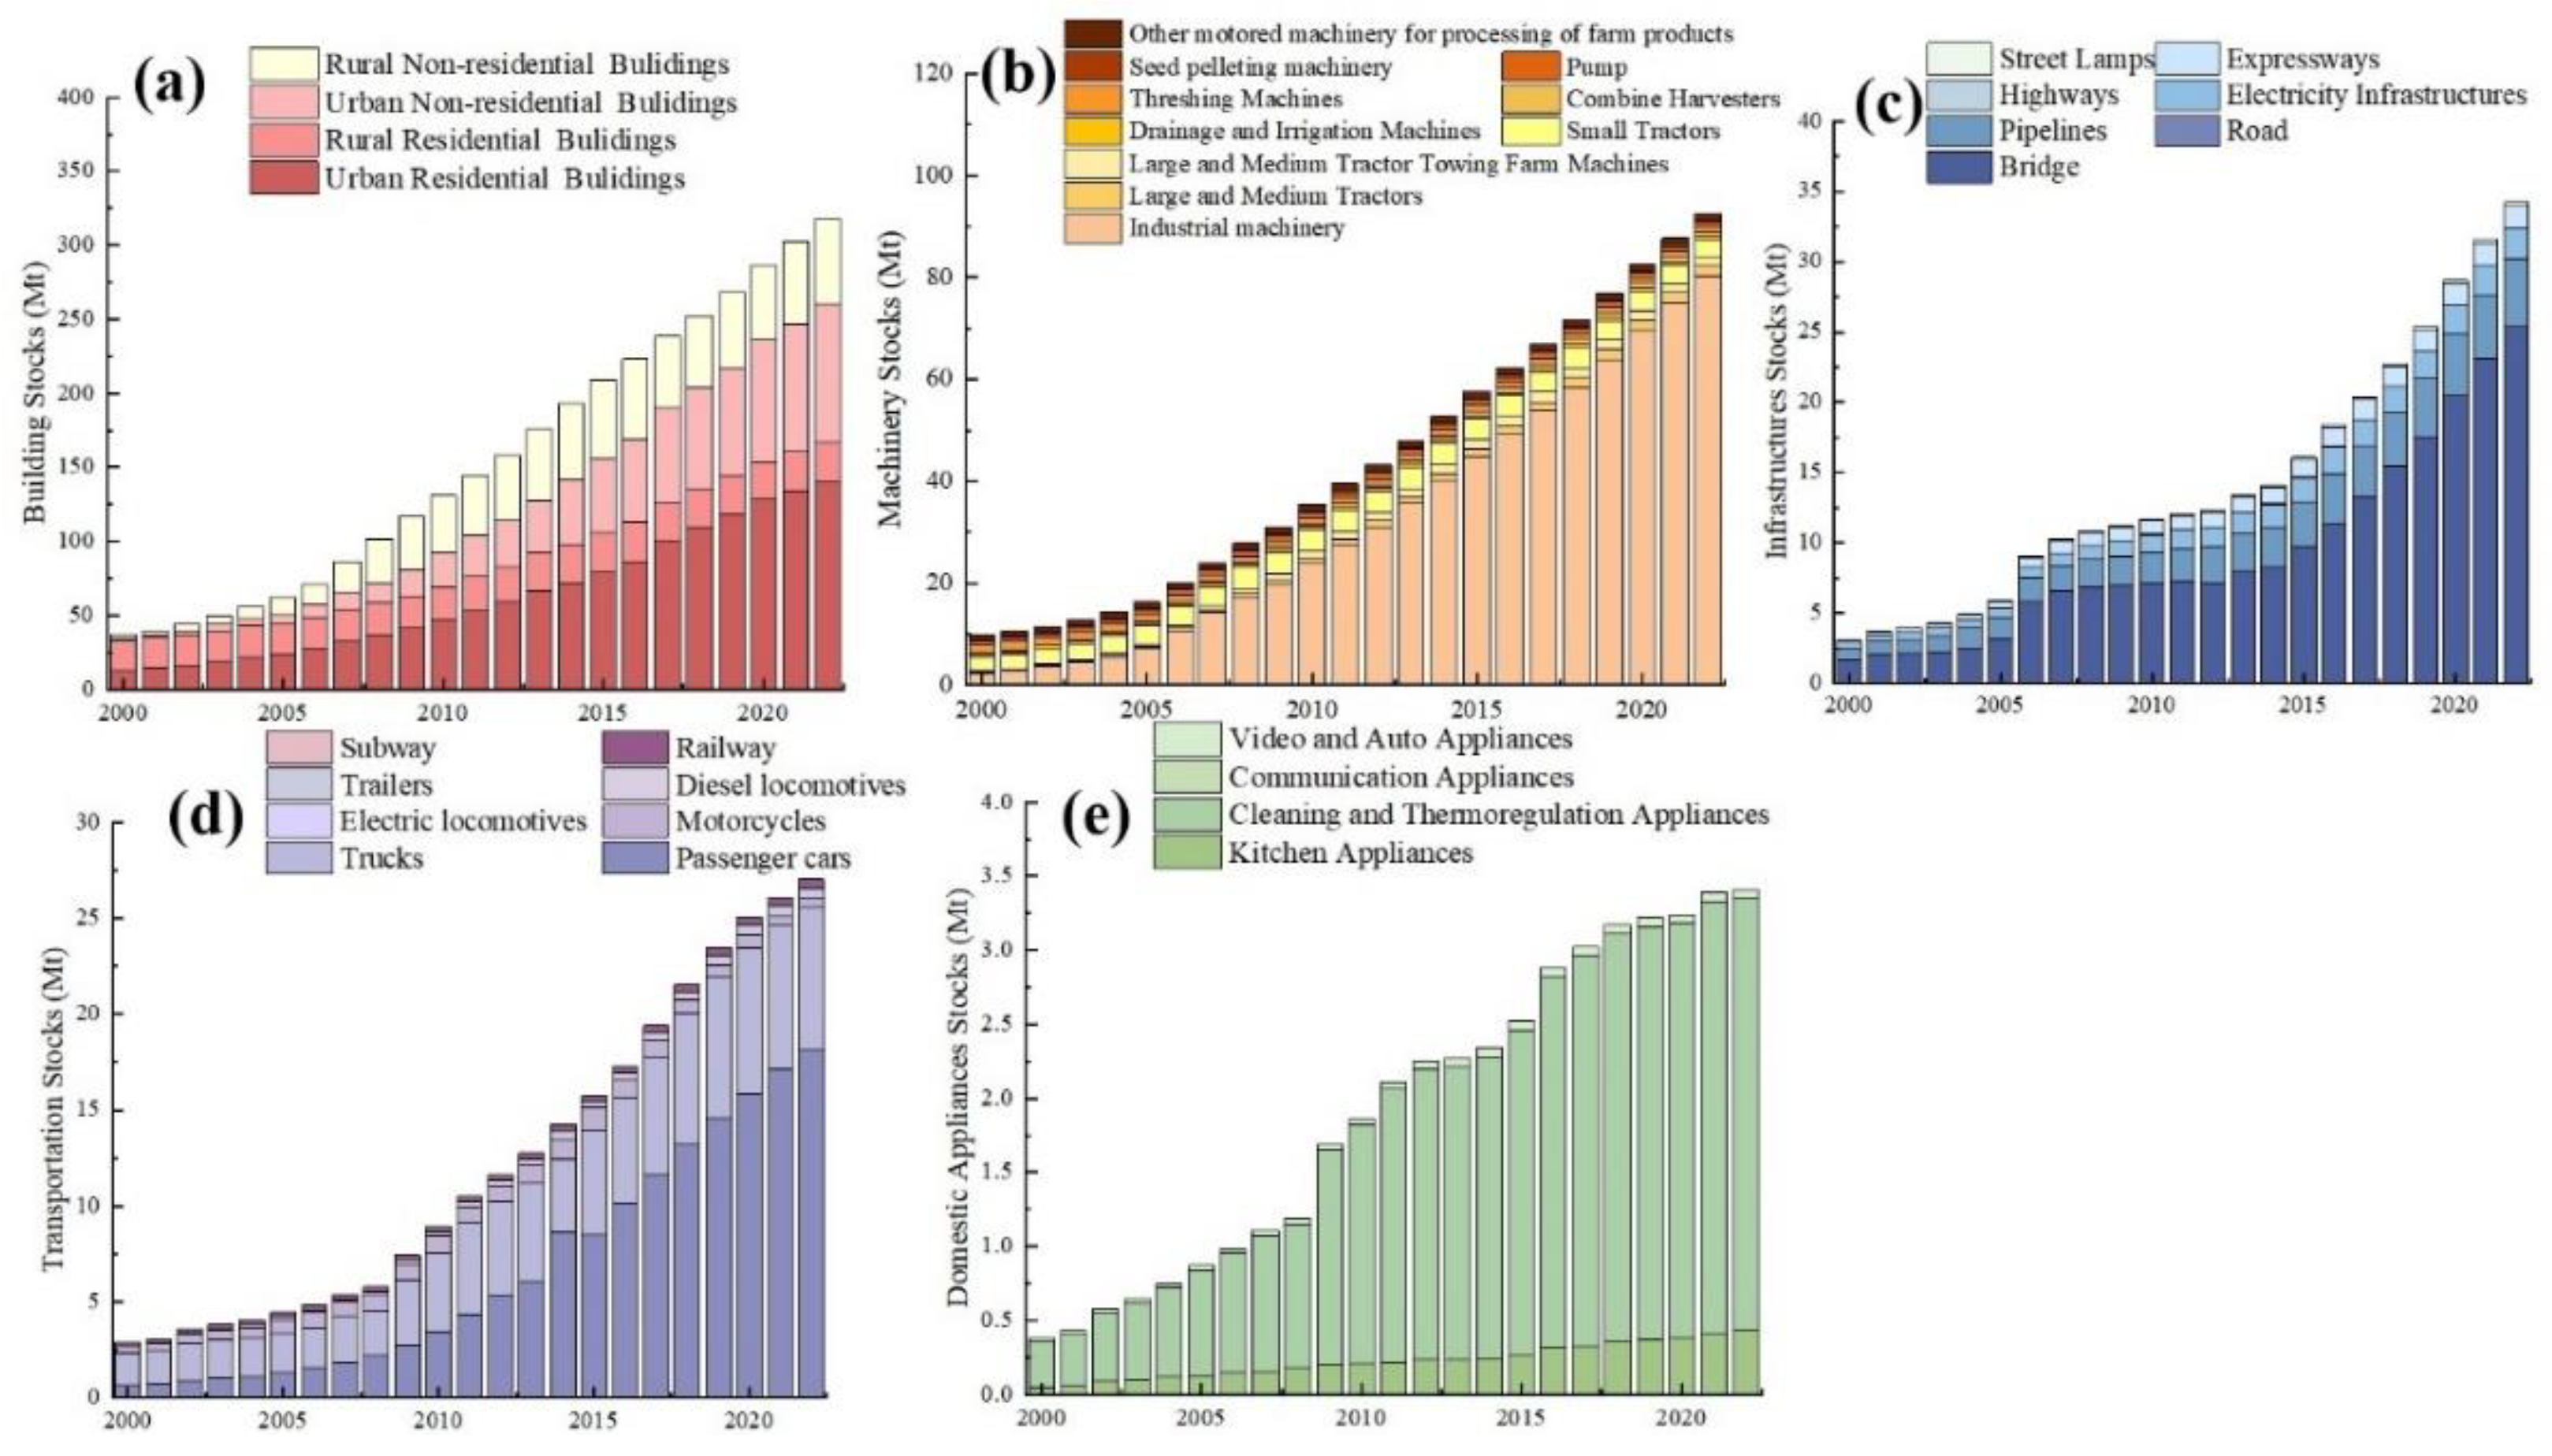
Figure 4.
Relationship between per capita IIUS and per capita GDP in Henan Provinces and other region.
Figure 4.
Relationship between per capita IIUS and per capita GDP in Henan Provinces and other region.
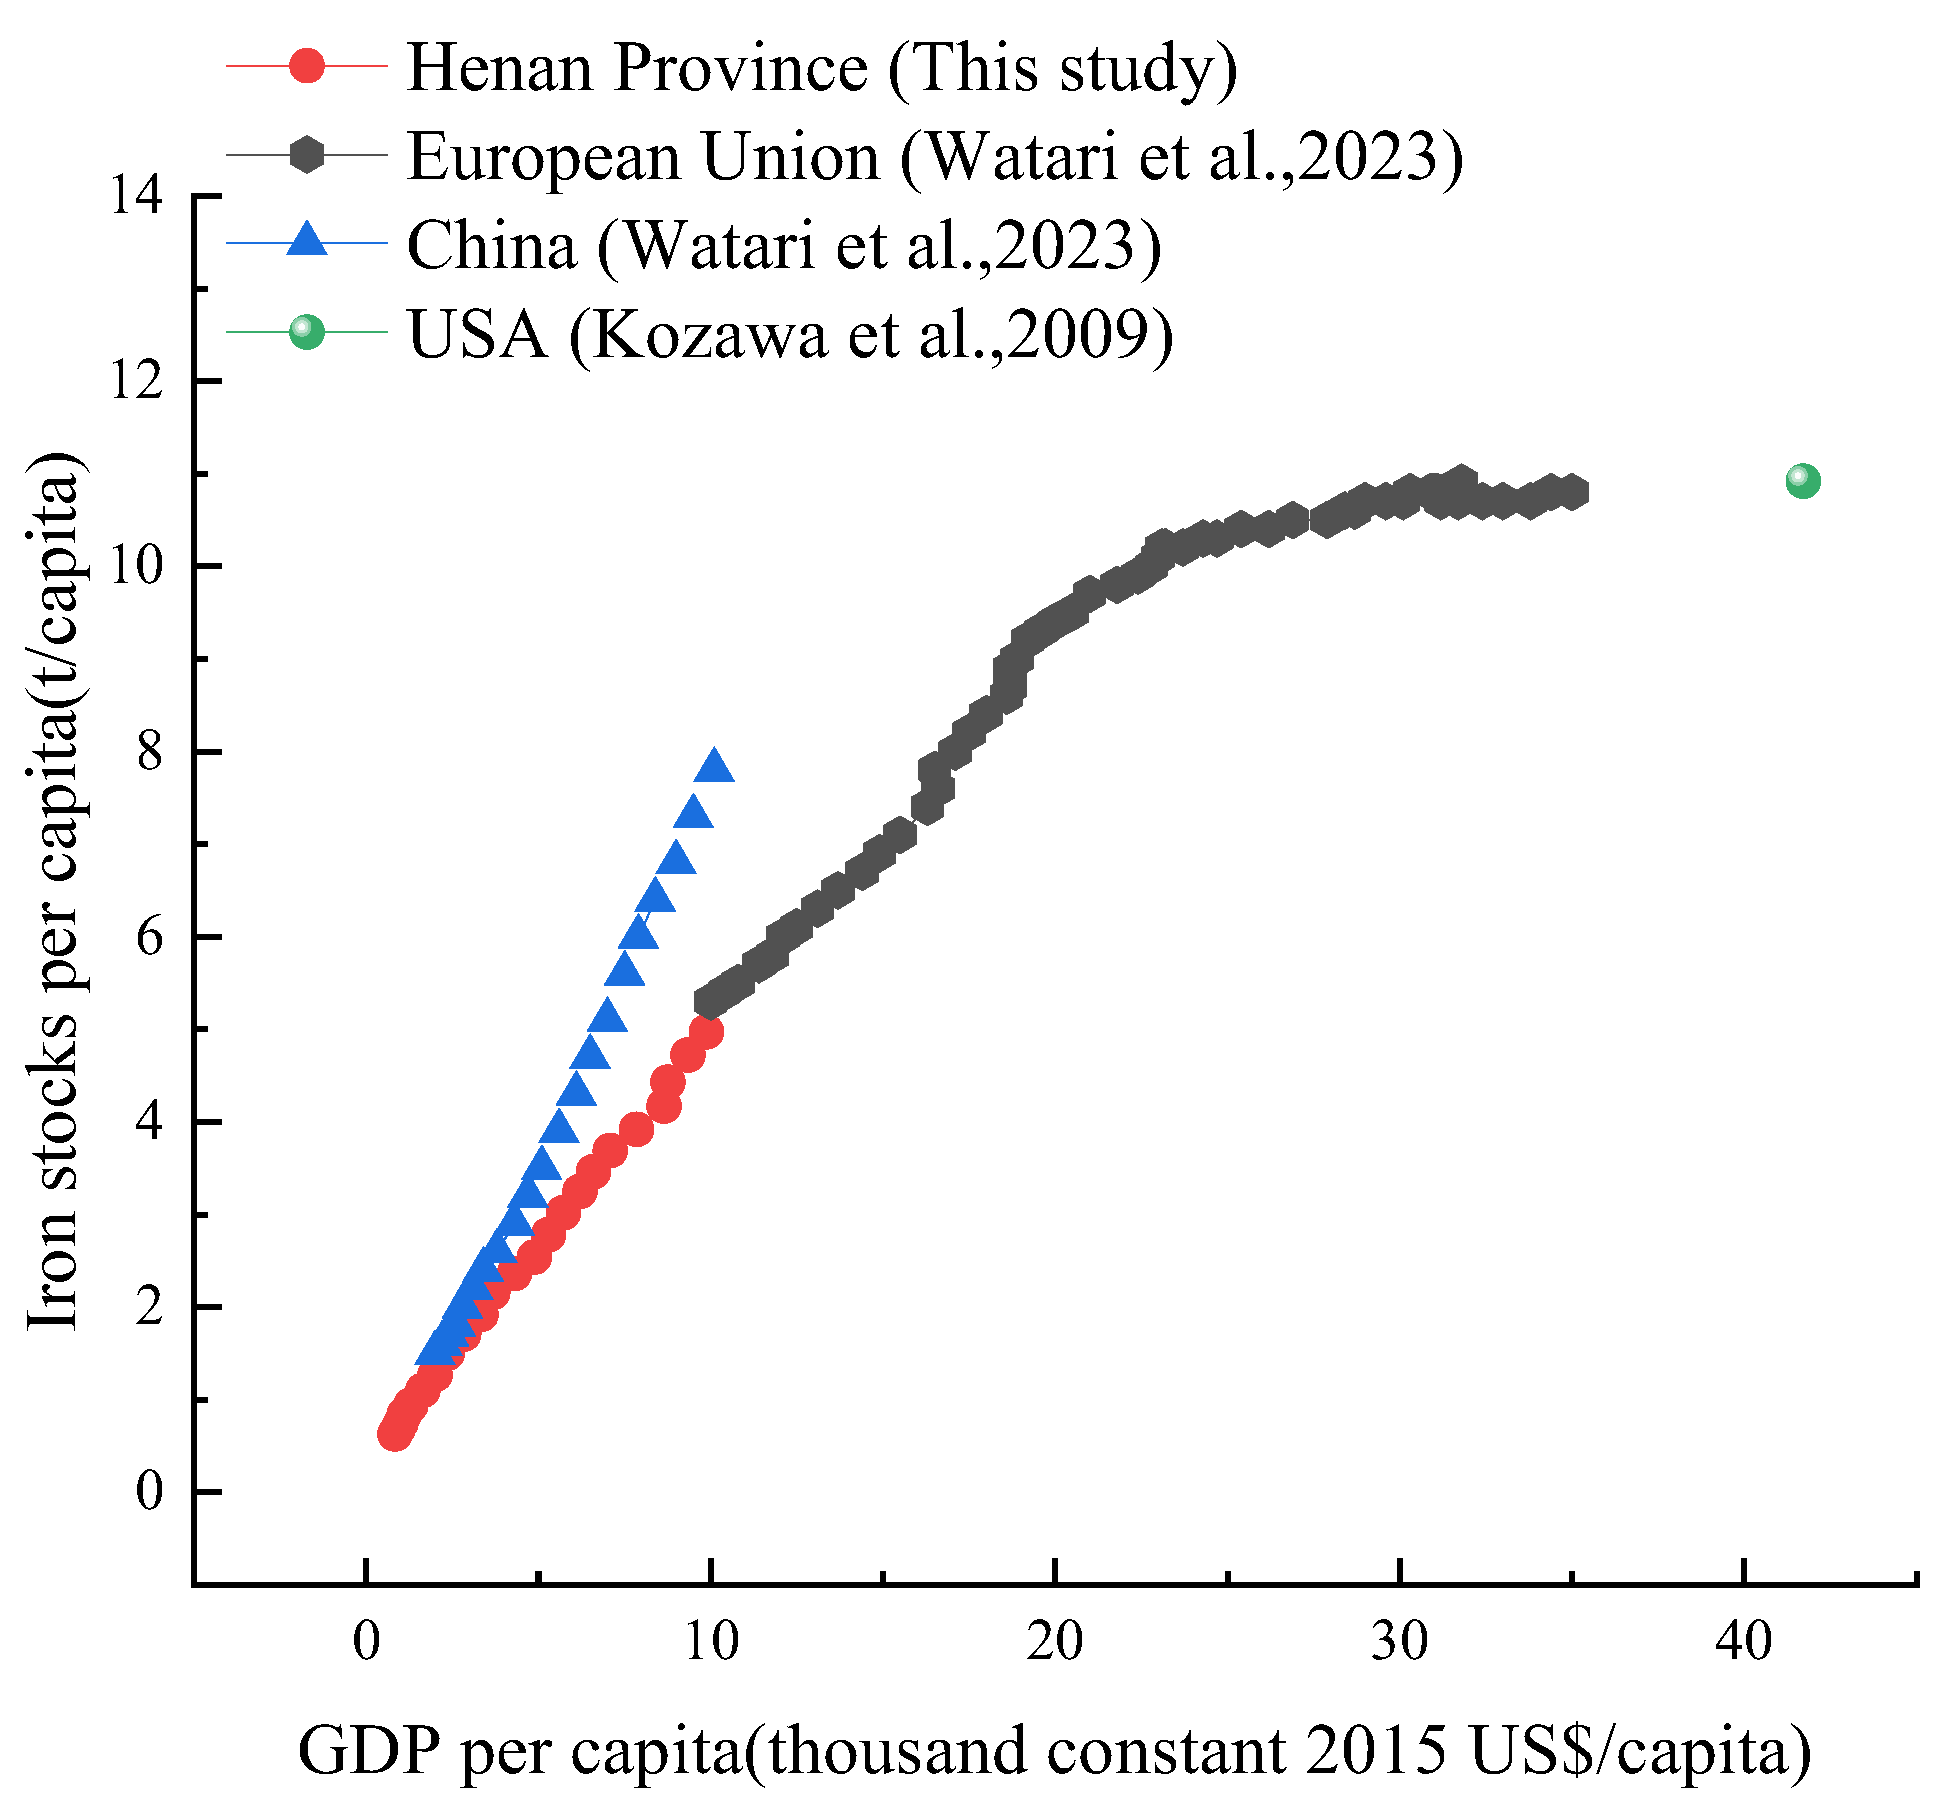
Figure 5.
Spatial structures of Henan’s prefecture-level cities: iron stocks per sq. km (a), iron in-use stocks per capita (b).
Figure 5.
Spatial structures of Henan’s prefecture-level cities: iron stocks per sq. km (a), iron in-use stocks per capita (b).
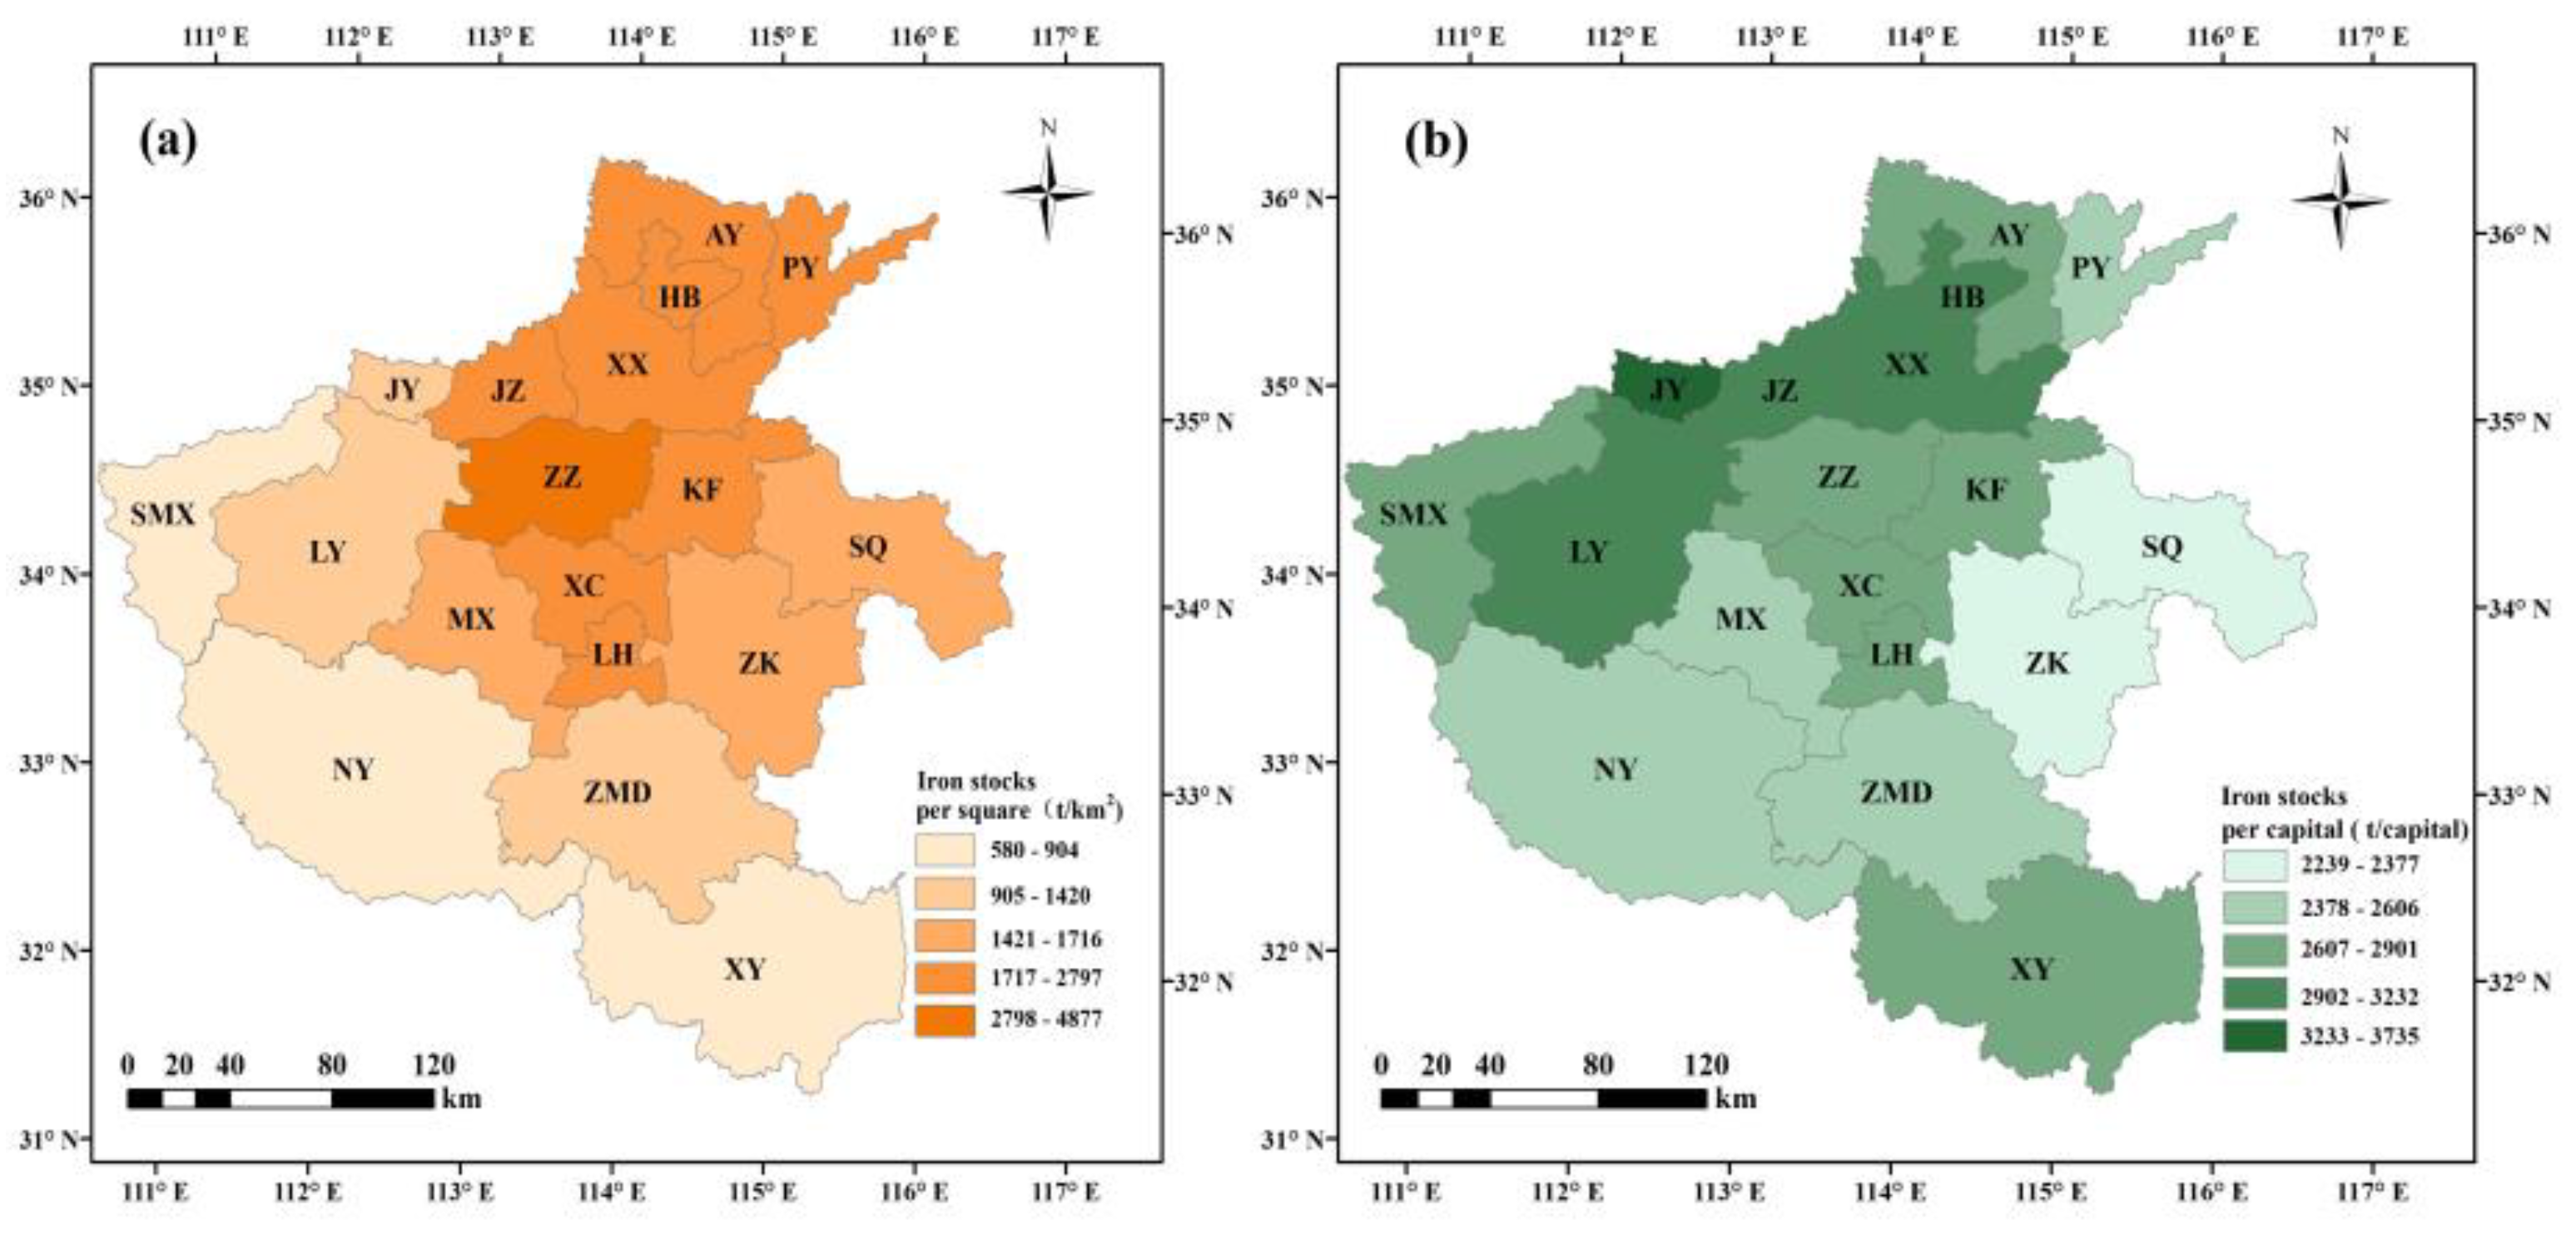
Figure 6.
Correlation of IIUS with per capita GDP and population density.
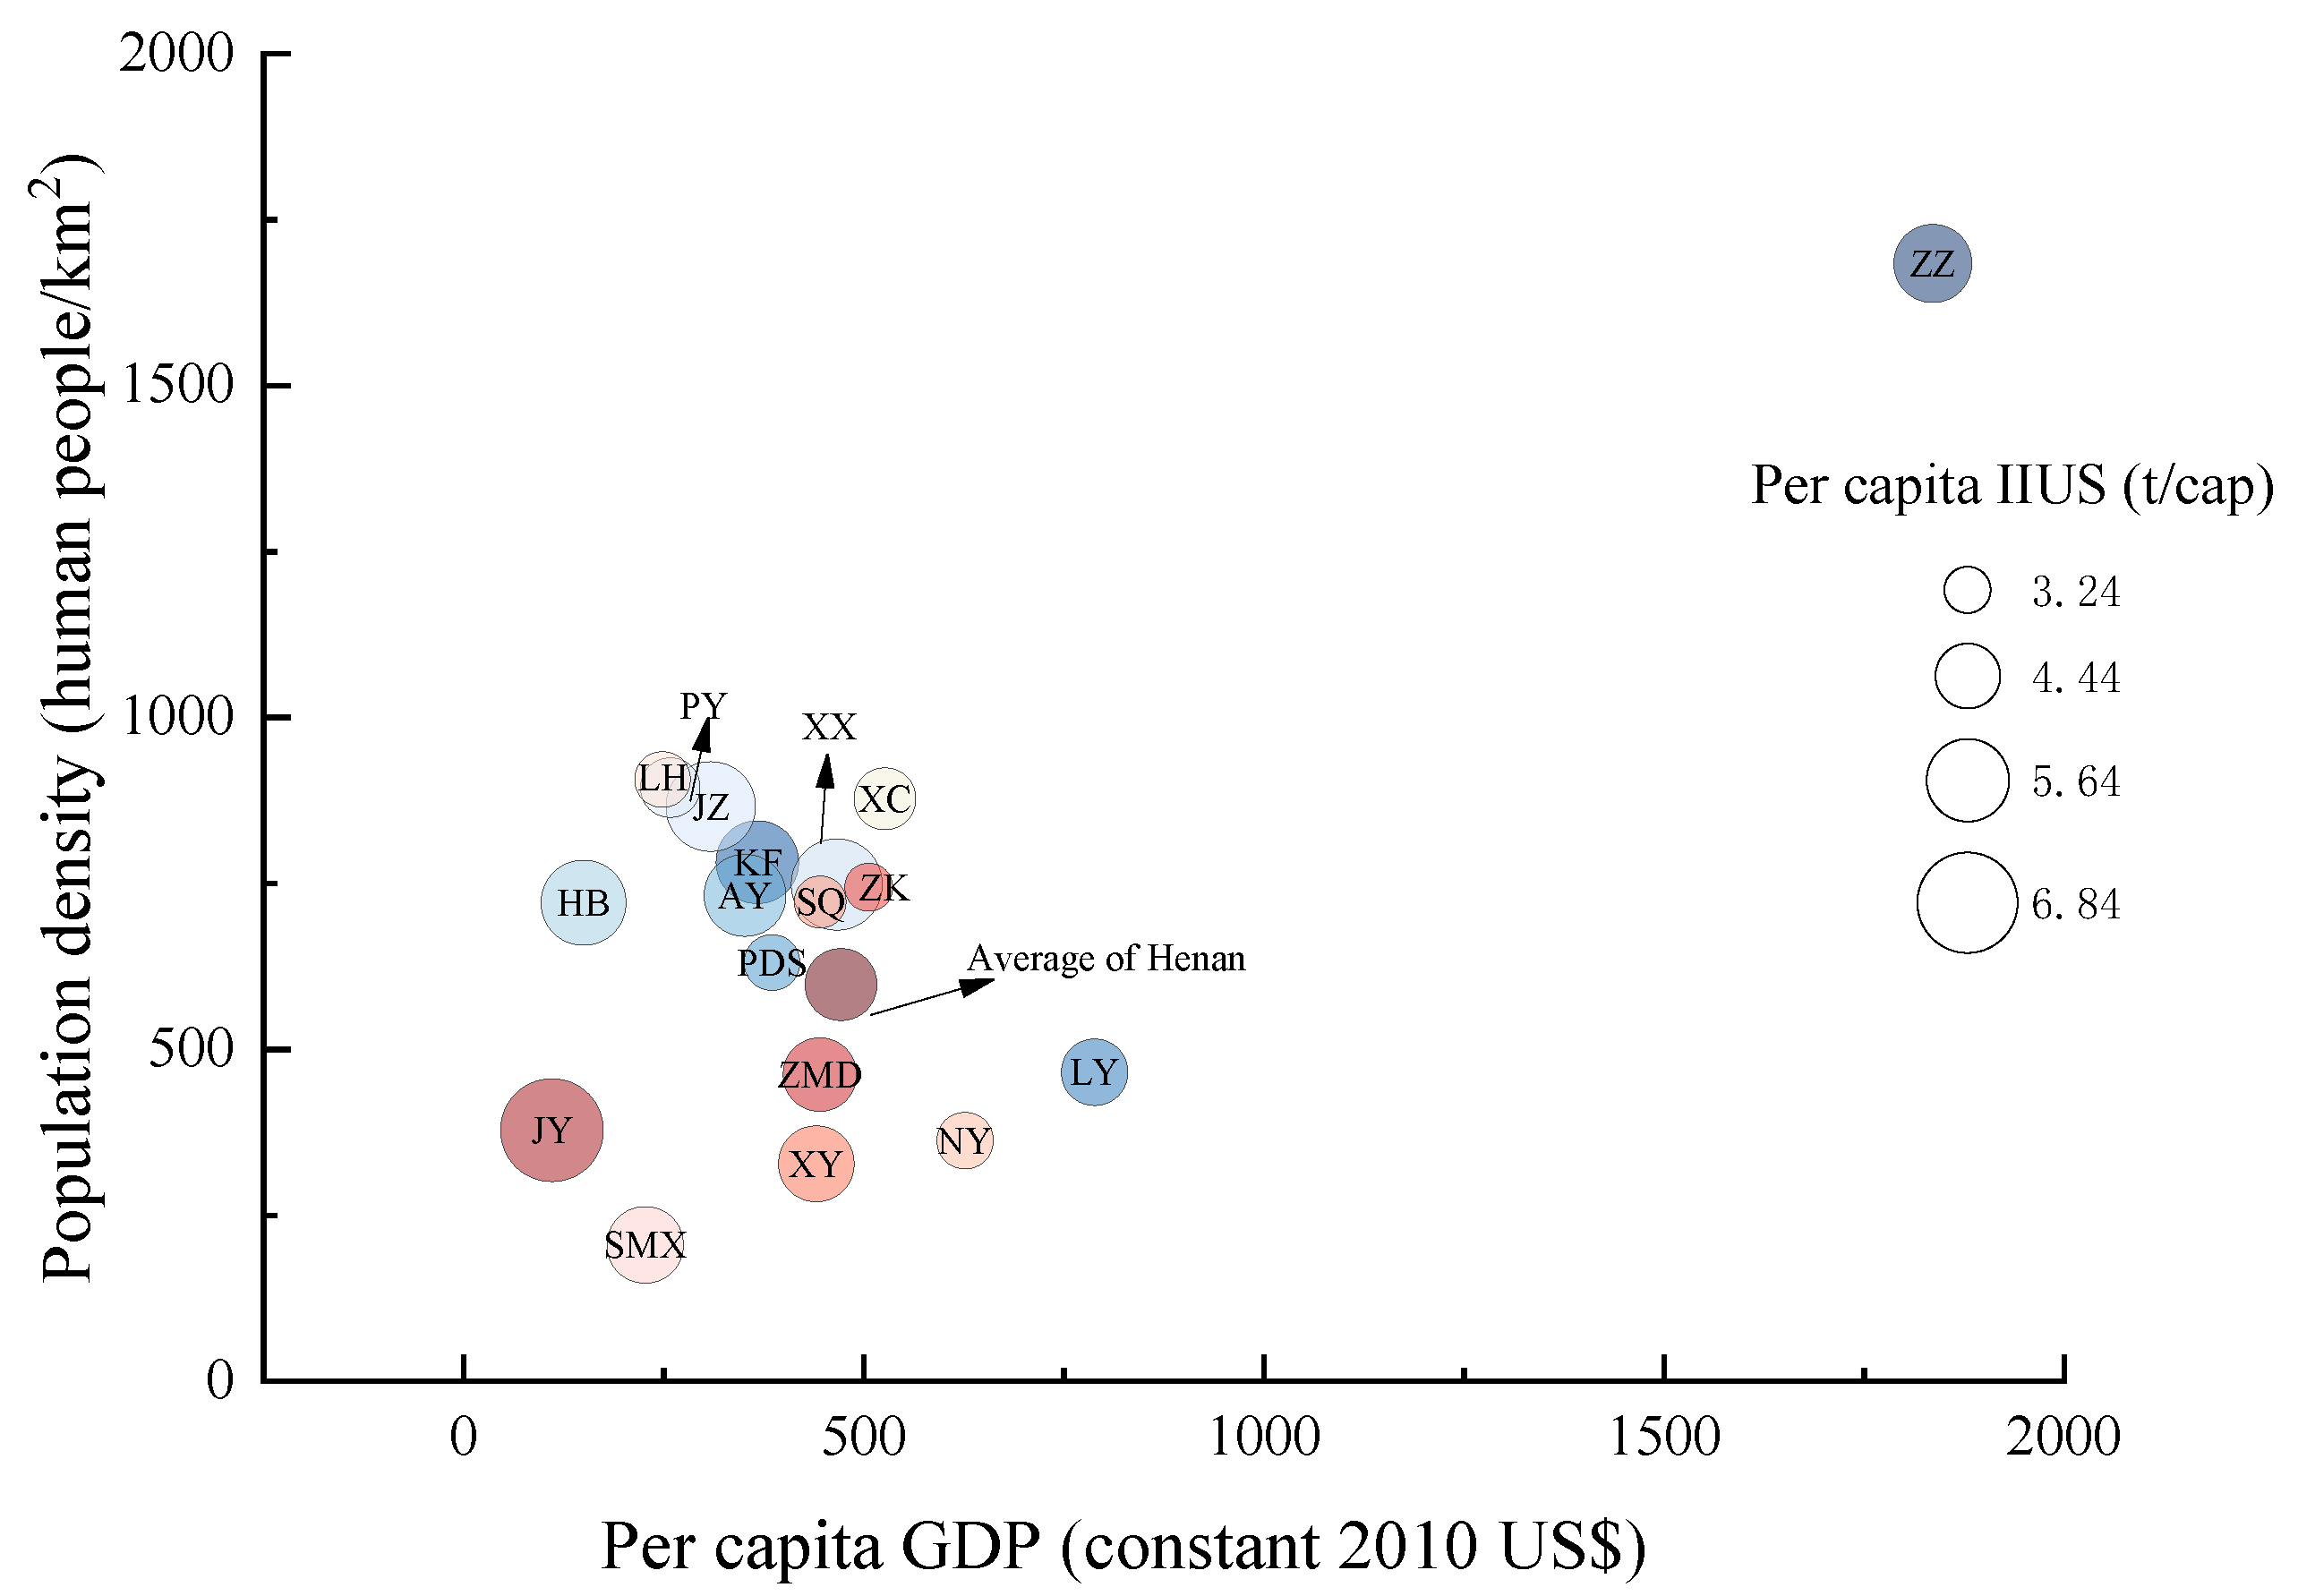
Figure 7.
Local spatial autocorrelation of per capita IIUS.
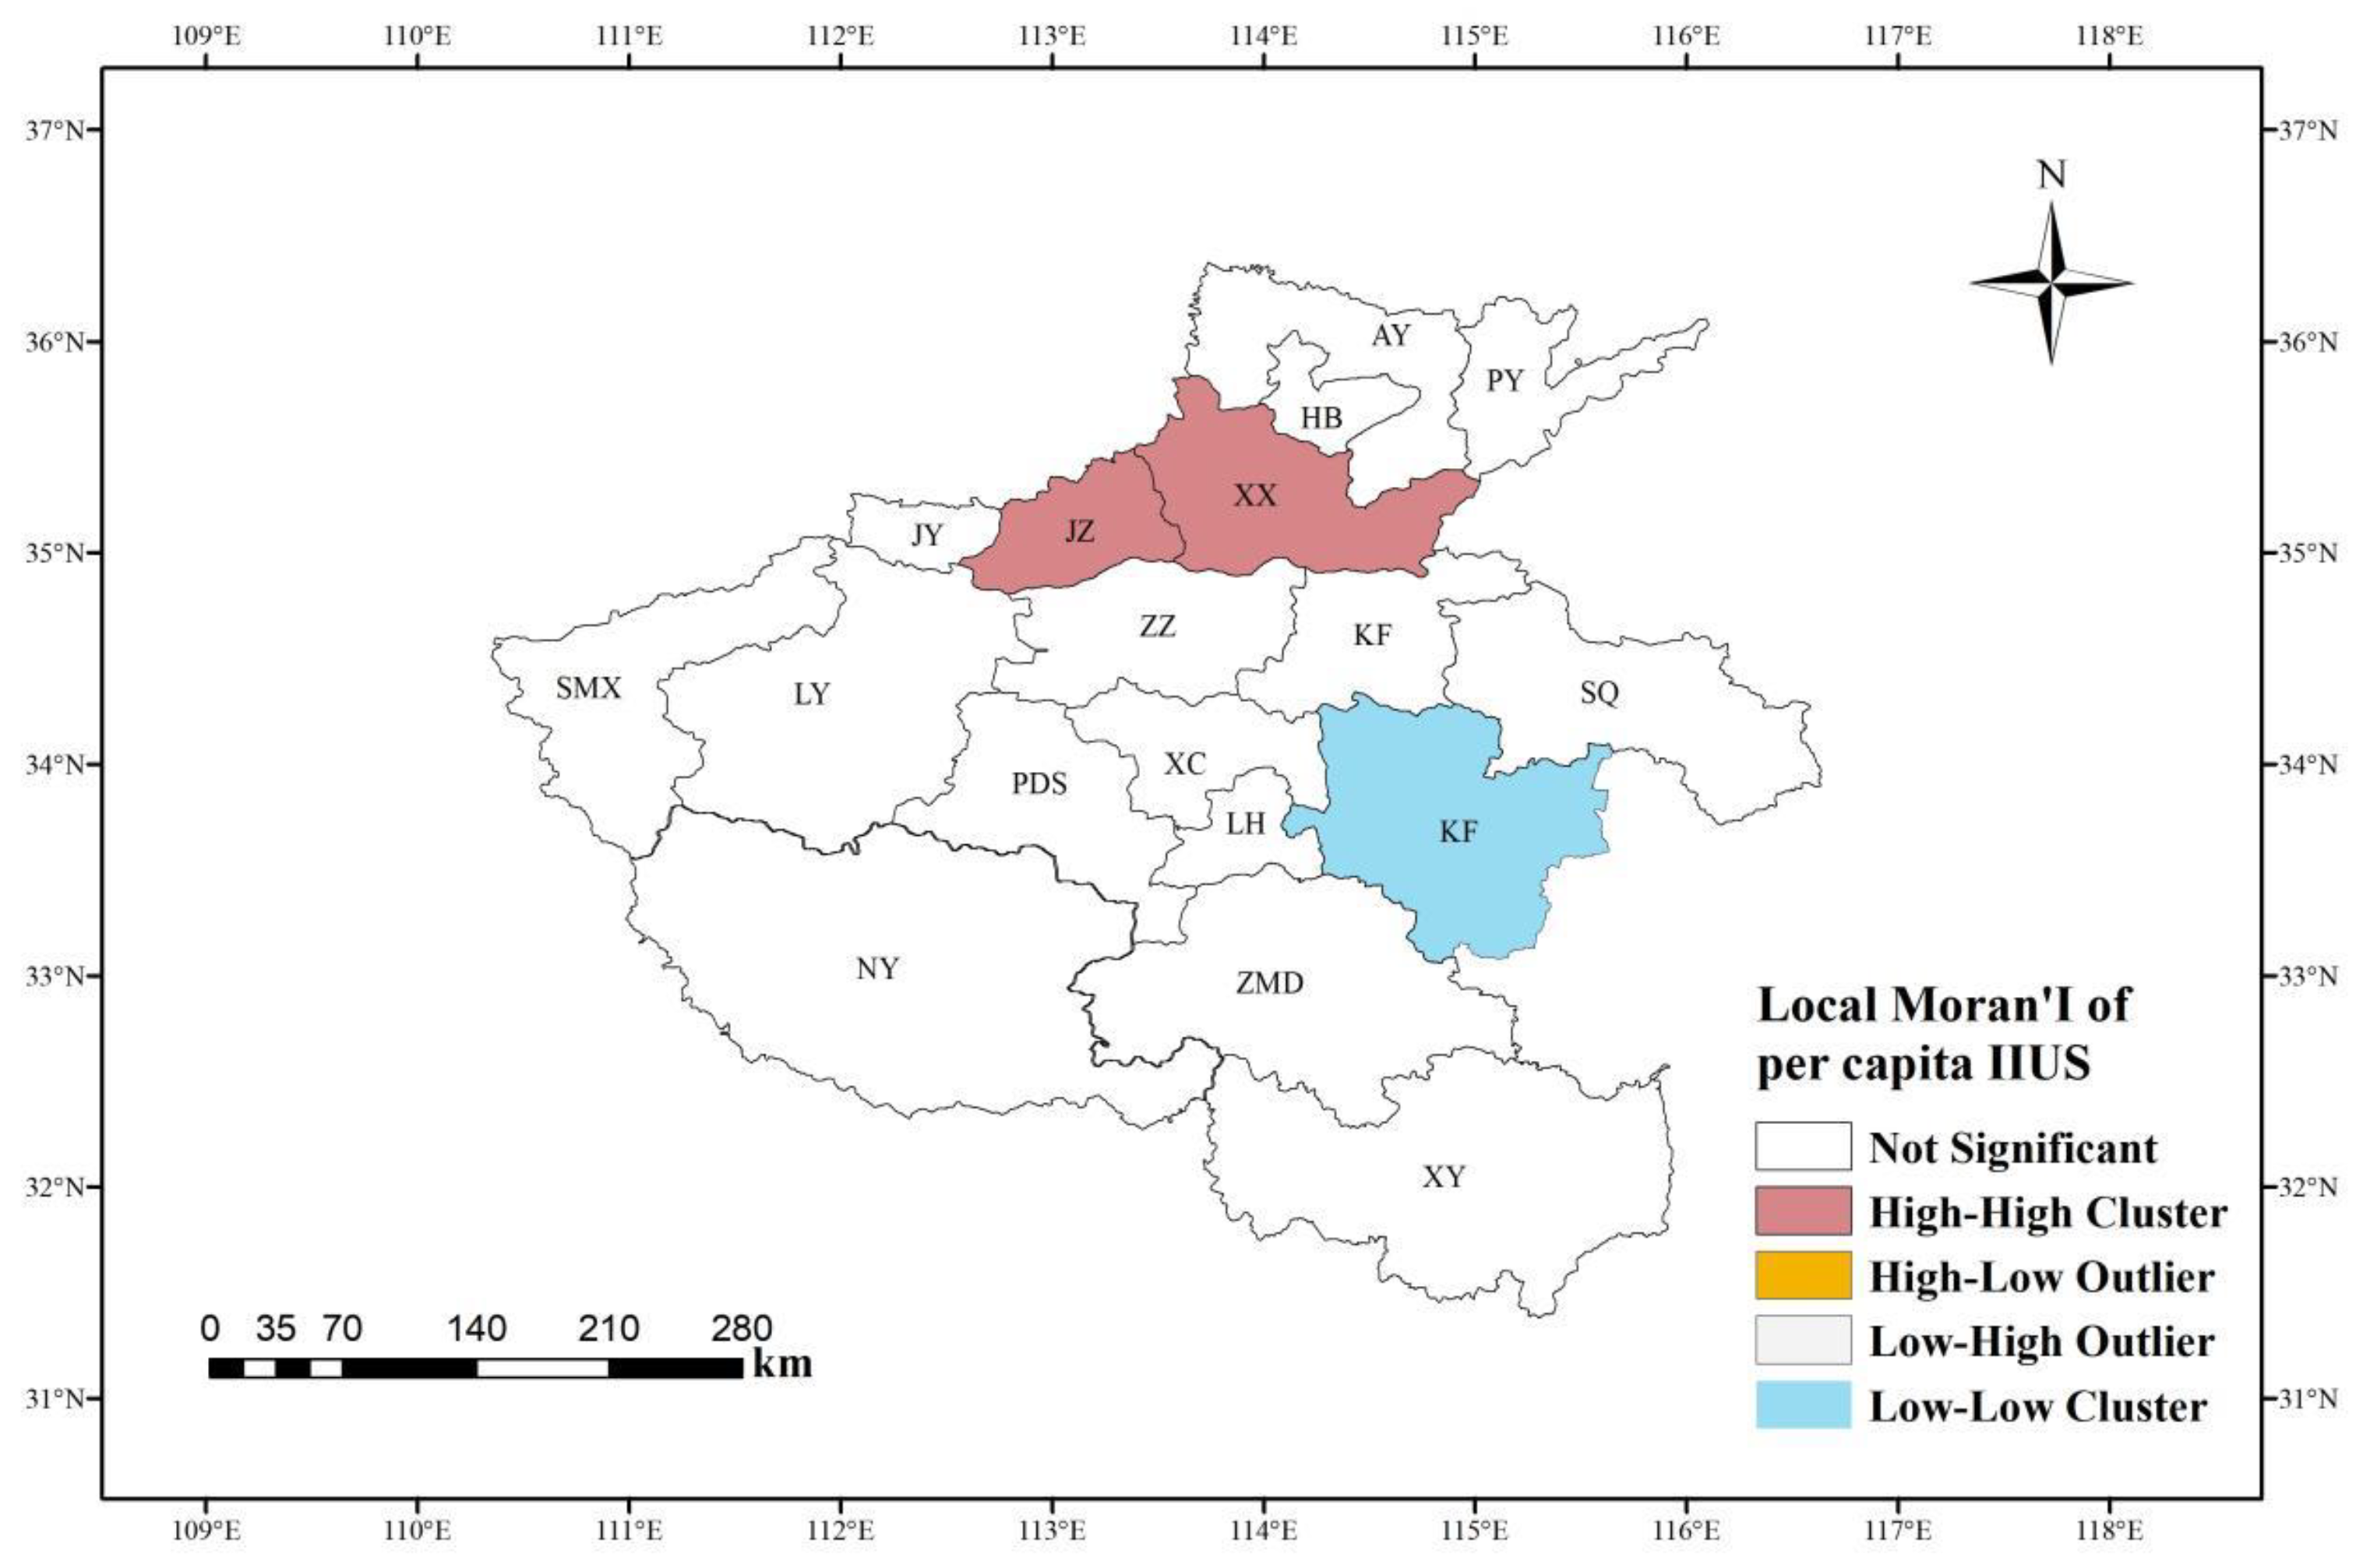
Figure 8.
Decomposition of e (MS, GDP).
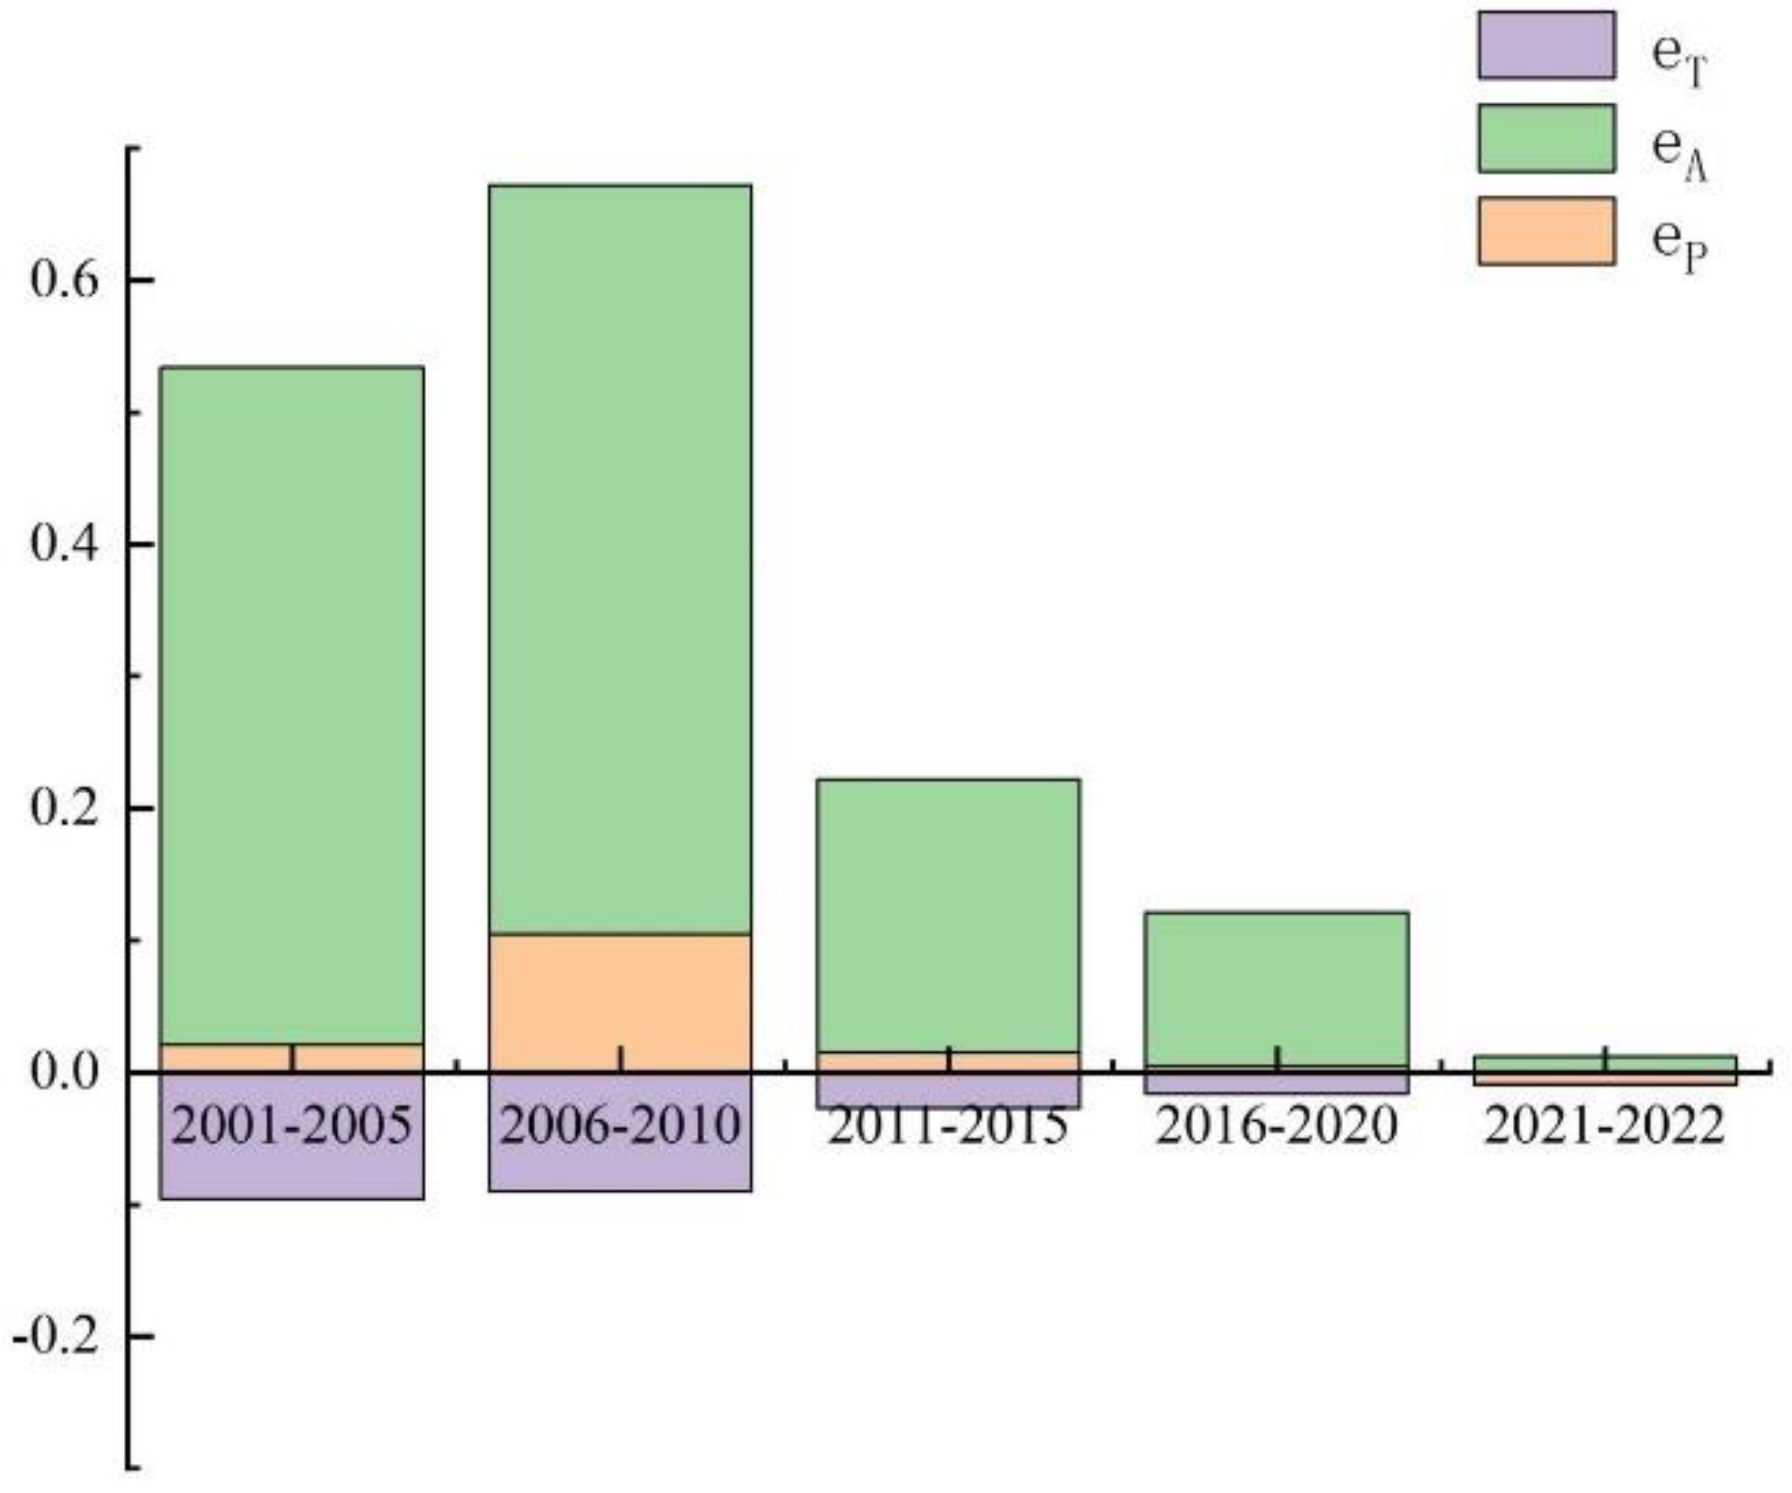

Table 1.
Iron-containing products in Henan Province.
| Sector | Product |
|---|---|
| Buildings | Urban residential buildings, rural residential buildings, urban non-residential buildings and rural non-residential buildings |
| Machinery | Industrial machinery, large and medium tractors, large and medium tractor towing farm machines, small tractors, drainage and irrigation machines, combine harvesters, threshing machines, pump, seed pelleting machinery and other motored machinery for processing of farm products |
| Infrastructure | Roads, bridges, railways, pipelines, street lamps and electricity infrastructures |
| Transportation | Subway, railway, motorcycles, passenger cars, trucks, trails, diesel and electric locomotives |
| Domestic appliances | Kitchen appliances, cleaning and thermoregulation appliances, communication appliances and video and auto appliances |
Table 2.
Decoupling results of the in-use stocks and economic development in Henan Province.
| Years | GDP% | MS% | Decoupling index | Degree of decoupling |
|---|---|---|---|---|
| 2001-2005 | 0.75 | 0.60 | 0.45 | Weak decoupling |
| 2006-2010 | 0.84 | 0.80 | 0.67 | Weak decoupling |
| 2011-2015 | 0.48 | 0.41 | 0.20 | Weak decoupling |
| 2016-2020 | 0.43 | 0.38 | 0.11 | Weak decoupling |
| 2021-2022 | 0.06 | 0.05 | 0.0028 | Weak decoupling |
Table 3.
The comparative analysis of per capita IIUS in different regions.
| Region | Method | Time estimated | Per capita of IIUS (t/cap) | References |
|---|---|---|---|---|
| USA | Top-down | 2002 | 14.3 | USGS (2005) |
| USA | Top-down | 2004 | 11-12 | Müller et al. (2006) |
| USA | Top-down | 2004 | 10.92 | Kozawa et al.(2009) |
| New Haven (USA) | Bottom-up | 2000 | 9.2 | Drakonakis et al. (2007) |
| Australia | Top-down | 2005 | 10±2 | Müller et al. (2011) |
| Canada | Top-down | 2005 | 12±2 | Müller et al. (2011) |
| Wakayama (Japan) | Bottom-up | 2004 | 2.08 | Tanikawa and Hashimoto (2009) |
| CIS & Middle East & Others | Bottom-up | 2019 | 8.2 | Watari (2023) |
| Steiermark (Austria) | Bottom-up | 2003 | 10 | Schöller et al. (2006) |
| Global | Average use life method | 2013 | 2.8 | Yue et al. (2016) |
| China | Bottom-up | 2018 | 5.9 | Song et al. (2020) |
| Handan (China) | Bottom-up | 2005 | 1.33 | Lou et al. (2008) |
| Zhejiang (China) | Bottom-up | 2016 | 5.48 | Yu et al. (2020) |
| Fujian (China) | Bottom-up | 2016 | 7.6 | Hao et al. (2020) |
| Nanjing (China) | Bottom-up | 2016 | 6.2 | Liu et al. (2019) |
| Shenzhen (China) | Bottom-up | 2016 | 2.5 | Liu et al. (2019) |
| Henan (China) | Bottom-up | 2022 | 4.95 | This study |
Table 4.
Data uncertainty of different subcategories.
| Category | Subcategory | Uncertainty | Percentage of total Iron in-use stocks (%) |
|---|---|---|---|
| Buildings | Urban Residential | Low | 29.47 |
| Rural Residential | Low | 5.75 | |
| Urban non-residential | Medium | 19.59 | |
| Rural non-residential | Medium | 12.08 | |
| Infrastructure | Bridge | Low | 5.34 |
| Road | Low | 0.0003 | |
| Pipelines | Low | 1.01 | |
| Electricity Infrastructures | Medium | 0.46 | |
| Highways | Low | 0.01 | |
| Expressways | Low | 0.34 | |
| Street Lamps | Low | 0.05 | |
| Transportation | Passenger cars | Low | 3.82 |
| Trucks | Low | 1.57 | |
| Motorcycles | Low | 0.1 | |
| Trailers | Low | 0.1 | |
| Rail and rail components | Low | 0.1 | |
| Subway | Low | 0.001 | |
| Domestic appliances | Kitchen Appliances | Low | 0.09 |
| Cleaning and Thermoregulation Appliances | Low | 0.61 | |
| Communication Appliances | Medium | 0.0008 | |
| Video and Auto Appliances | Medium | 0.01 | |
| Machinery | Medium | 19.49 |
Disclaimer/Publisher’s Note: The statements, opinions and data contained in all publications are solely those of the individual author(s) and contributor(s) and not of MDPI and/or the editor(s). MDPI and/or the editor(s) disclaim responsibility for any injury to people or property resulting from any ideas, methods, instructions or products referred to in the content. |
© 2024 by the authors. Licensee MDPI, Basel, Switzerland. This article is an open access article distributed under the terms and conditions of the Creative Commons Attribution (CC BY) license (http://creativecommons.org/licenses/by/4.0/).
Copyright: This open access article is published under a Creative Commons CC BY 4.0 license, which permit the free download, distribution, and reuse, provided that the author and preprint are cited in any reuse.


