
Submitted:
21 November 2024
Posted:
25 November 2024
You are already at the latest version
Abstract
TiO2 is an effective nucleating agent to obtain glass-ceramics of the lithium aluminosilicate sys-tem. Reducing conditions of glass melting, which allow to get ions of variable valence in lower oxidation state, can influence the ability of titania to provide proper phase assemblage, structure and properties of lithium aluminosilicate glass-ceramics. The model glass nucleated by TiO2 was melted with and without addition of As2O3. Using heat-treatments from 680° to 1300 °C, XRD, SEM and DSC data, Raman and absorption spectroscopy, transparent glass-ceramics based on nanocrystals of β-quartz and/or γ-Al2O3 with spinel structure and opaque glass-ceramics based on nanocrystals of β-spodumene were obtained and characterized. Three-phase immiscibility develops during secondary heat-treatments. Al2TiO5 crystallizes from aluminotitanate amor-phous regions simultaneously with appearance of β-quartz solid solutions, while traces of ana-tase and then rutile appear at elevated temperatures. Phase assemblage and sequence of phase transformations are independent of the redox conditions of glass melting, while the rate of these transformations is significantly higher in glass melted without addition of As2O3. Absorption in the visible and near-IR spectral ranges in glass melted without addition of As2O3 and corre-sponding glass-ceramics originates from octahedrally coordinated Ti3+ ions and Ti3+-Ti4+ pairs in glass and nanocrystals of γ-Al2O3, Al2TiO5 and β-quartz. Transparent glass-ceramics with thermal expansion coefficient of ~0.3 × 10⁻⁶ K-1 were obtained.
Keywords:
redox conditions
; titanium dioxide
; nucleating agent
; phase transformation
; glass-ceramics
; nanocrystals
; Raman spectroscopy
; absorption spectroscopy
; coefficient of thermal expansion
; X-ray diffraction analy-sis
1. Introduction
Transparent glass-ceramics of the lithium aluminosilicate system combine the unique properties of transparency and close to zero thermal expansion coefficient [1,2,3]. Developed by Stookey more than 60 years ago [4], glass-ceramics of the lithium aluminosilicate system still remain a subject of intensive studies [5-22]. Stookey found out [4] that titania, TiO2, is an effective nucleating agent promoting crystallization of lithium aluminosilicate glasses of special compositions upon heat-treatments [23]. The role of titania as a nucleating agent of the lithium aluminosilicate system was studied by different structure-sensitive methods [24-30] and mechanisms controlling formation of titania-doped glass-ceramics were suggested [5,6,7,8,9,10,11,12,13,14,15,16,17,18,19,20,21,22]. It was demonstrated that they depend on the base glass composition, the nature and concentration of doping ions, and the amount of the nucleating agent. Being a polyvalent ion, titanium can be found in glasses in the form of Ti4+ and Ti3+ ions. Oxidation states of titanium ions depend on the glass melting temperature, oxygen partial pressure in the glass-melting furnace, the concentration of titanium ions and the glass composition [26,31,32,33,34,35,36]. Using titania as a nucleator, oxidizing agents are usually added to the glass batch to avoid unwanted coloration caused by traces of Ti3+ ions formed during the glass melting at high temperatures [1,2]. However, reducing atmosphere of glass melting is required to obtain polyvalent ions in lower oxidation states. Therefore, it is important to know how the reducing atmosphere of glass melting influences phase transformations and properties of glasses of the lithium aluminosilicate system nucleated by TiO2.
There are studies of phase transformations in titania-containing glasses of magnesium aluminosilicate [26,37,38,39,40], fresnoite [41,42,43], zinc aluminosilicate [44,45] systems melted under different redox conditions. In these studies, it was demonstrated that variation of redox conditions of glass melting influences kinetics of liquid-liquid phase separation and of crystallization of metastable phases, compositions and structure of titania-containing phases and generally does not influence crystallization of the stable equilibrium phases [26,37,44]. The aim of the present work is to study the effect of redox conditions of glass melting on phase transformations, structure and properties of lithium aluminosilicate glass-ceramics nucleated by titania, which will help to develop transparent thermal shock resistant glass-ceramics of lithium aluminosilicate system containing polyvalent ions in lower oxidation states important for advanced photonic applications [46].
2. Materials and Methods
2.1. Materials Preparation
The model glass with the composition 12 Li2O∙24 Al2O3∙64 SiO2 (mol%) [27,47] nucleated by 6 mol% TiO2 added on top of the base composition was melted in oxidizing (with addition of 0.5 wt% As2O3) and neutral (without addition of arsenic trioxide) conditions in a laboratory electric furnace in crucibles made of quartz ceramics at 1580 °C for 4 hours (h) with stirring and casted onto a metal plate. The raw materials were reagent grade oxides and lithium carbonate. The weight of the glass batch was 400 g. The glasses were annealed at 640 °C for 1 h and cooled with the annealing furnace to room temperature. Small portions of glasses were quenched by pressing with a metal plate and used for the differential scanning calorimetry (DSC) study. Annealed glasses were transparent and different in color. The glass melted under neutral conditions, referred to as LAS, exhibited a brownish-grey color, while the LASox glass, prepared under oxidizing conditions, displayed a light yellow tint (see Figure 1).
The glasses were cut into pieces with a diamond saw and heat-treated in isothermal conditions in the temperature range from 680 °C to 1200 °C by single and two stage heat-treatments for 6 h at each stage.
2.2. Materials Characterization
2.2.1. The Differential Scanning Calorimetry
The differential scanning calorimetry study was performed using a simultaneous thermal analyzer NETZSCH STA 449 F3 Jupiter with an Ar dynamic flow atmosphere in the temperature range from room temperature to 1300 °C at a heating rate of 10 °C⋅min-1. The quenched initial glasses and glasses heat-treated by single stage heat-treatments at 680 °C, 700 °C, and 720 °C for 6 h, with weight of about 15-20 mg were employed. To determine the character of crystalline phases responsible for exothermic effects on the DSC curves, initial and heat-treated glasses approximately 100 mg in weight were heated in the furnace of the thermal analyzer up to corresponding temperatures. The obtained glass-ceramics were taken out from the cooled furnace and studied by the X-ray diffraction (XRD) analysis.
2.2.2. X-Ray Diffraction Analysis
The XRD study of powdered samples was performed using a Shimadzu XRD-6000 diffractometer with Cu Kα radiation and a Ni filter (λ = 1.5406 Å). The mean crystal sizes were calculated from broadening of X-ray peaks according to Scherrer’s equation:
where λ is the wavelength of X-ray radiation, θ is the diffraction angle, Δ(2θ) is the width of peak at half of its maximum, and K is the constant assumed to be 1 [48]. The mean size of γ-Al2O3 crystals with spinel structure was estimated using the peak with Miller’s indices hkl (440). The mean size of tieilite, Al2TiO5, crystals was determined from the peak with Miller’s indices (020). The mean size of crystals of β-quartz ss was determined from the peak with Miller’s indices (220). The mean size of crystals of β-spodumene ss was calculated using the peak with indices (102). The error in the estimation of the mean size of crystals is ~5-10%.
D = Kλ/Δ(2θ)cosθ
The lattice parameter a of spinel nanocrystals was estimated from the position of the peak with Miller’s indices hkl (440). The lattice parameters of Al2TiO5 were estimated using the peaks with indices (002), (020), (110), (023) and (200). The lattice parameters of β-quartz ss were estimated from the positions of the peaks with Miller’s indices (110) and (211). The lattice parameters of β-spodumene ss were estimated using the peaks with Miller’s indices (111) and (102). The error in estimation of the lattice parameters is ±0.003 Å.
2.2.3. Raman Spectroscopy
Unpolarized Raman spectra were recorded in backscattering geometry using a confocal InVia Renishaw Raman microscope equipped with a ×50 Leica objective (N.A. = 0.75), TE cooled CCD camera and an edge filter. The excitation wavelength was 488 nm (Ar+ ion laser line). The spectral resolution was 2 cm-1. Every spectrum was averaged over 10 acquisitions with duration of 10 s. The samples were either transparent polished flat-parallel plates with a thickness of ~1 mm or opaque pieces of materials.
2.2.4. Scanning Electron Microscopy
The morphology of initial and heat-treated glasses was obtained by scanning electron microscopy (SEM) using Tescan Vega 3 SBH microscope. For the study, the surfaces of the same transparent polished plates and opaque bulk samples, which were used for measuring Raman spectra, were preliminary cleaned in in isopropyl alcohol and benzene, etched in a hydrofluoric acid for about 2 s and washed in distilled water. Particle size was calculated using ImageJ software [49].
2.2.5. Absorption Spectroscopy
Absorption spectra were recorded with a Shimadzu UV-3600 spectrophotometer in the spectral range from 250 to 3300 nm using the same polished flat-parallel plates with a thickness of ~1 mm.
2.2.6. The Linear Coefficient of Thermal Expansion
Thermal expansion coefficients of glasses and glass-ceramics were estimated using a Linseis L 75 VS 1000 dilatometer. The samples were rods with a length from 30 to 50 mm and flat parallel planes with sections of ~5 × 5 mm. The measurements were performed in the temperature range from room temperature to 320 °C with a heating rate of 5 °C⋅min-1.
3. Results
The polished plates of transparent glasses and glass-ceramics and the pieces of opaque glass-ceramics are shown in Figure 2. The initial glasses, glasses heat-treated at 680 °C for 6 h and by two stage heat-treatments with the second hold at temperatures ranging from 720 °C to 900 °C are transparent. The LAS glass-ceramics obtained at 950 °C and at 1000 °C are also transparent, while LASox glass-ceramics obtained at these temperatures are translucent. Both glass-ceramics obtained at 1100 °C are translucent, and those prepared at the second stage at 1200 °C are opaque. Therefore, glasses melted under neutral conditions lose transparency at higher secondary heat-treatment temperatures than glasses melted under oxidizing conditions. The opaque LAS glass-ceramic obtained by the heat-treatment at 1200 °C is grey colored and has a white surface layer, see Figure 2(a).
3.1. Differential Scanning Calorimetry
Figure 3 shows the DSC curves of the quenched LAS and LASox glasses, as well as these glasses heat-treated at 680 °C, 700 °C and 720 °C for 6 h. The shapes of the corresponding DCS curves of LAS and LASox glasses are near similar being different in the values of characteristic crystallization temperatures, see Figure 3 and Table 1. The DSC curve of the quenched LASox glass shows three peaks with markedly different intensities. The first one is a broad peak of a low intensity with Tmax = 802 °C, the second one is a narrow and intense peak with crystallization onset temperature Ton = 851 °C, and crystallization maximum temperature Tmax = 874 °C. The third one is a weak exothermic peak with Tmax = 1186 °C. The first peak is usually assigned to nucleation of the main crystalline phase, the second one to crystallization of lithium aluminosilicate solid solution (ss) with β-quarts structure (β-quarts ss), and the third one to the transformation of β-quartz ss into β-spodumene ss [50,51]. The DSC curve of the LAS glass exhibits a plateau instead of the first peak, see Figure 3 and Table 1. All characteristic crystallization temperatures of the LAS glass are lower than those for the LASox glass, while the glass transition temperatures of both glasses are similar, see Table 3. Therefore, redox conditions of glass melting affect crystallization temperatures and do not affect glass transition temperature of glasses.

Table 1.
Characteristic temperatures of initial quenched and heat-treated glasses shown in DSC curves.
Table 1.
Characteristic temperatures of initial quenched and heat-treated glasses shown in DSC curves.
| Heat-treatment schedule | Tg, °C | Ton1, °C | Tmax1, °C | Ton2, °C | Tmax2, °C | Tmax3, °C |
|---|---|---|---|---|---|---|
| The LAS glass | ||||||
| quenched | 698 | - | - | 847 | 867 | 1175 |
| 680 °С, 6 h | 699 | 810 | 839 | 882 | 909 | 1142 |
| 700 °С, 6 h | 705 | 764 | 810 | 878 | 900 | 1135 |
| 720 °С, 6 h | 708 | 765 | 826 | 871 | 890 | 1140 |
| The LASox glass | ||||||
| quenched | 699 | - | 802 | 851 | 874 | 1186 |
| 680 °С, 6 h | 695 | 799 | 831 | 876 | 901 | 1136 |
| 700 °С, 6 h | 704 | 779 | 809 | 879 | 899 | 1141 |
| 720 °С, 6 h | 708 | 755 | 828 | 876 | 900 | 1136 |
Preliminary heat-treatments lead to a drastic change in the appearance of DSC curves, see Figure 3. The character of this change for LAS and LASox samples is the same, differing in the temperatures of thermal effects. Instead of a narrow exothermic peak of high intensity, two broad peaks of lower intensities appear. The characteristic temperatures for both glasses heat-treated at the nucleation stage are presented in Figure 3 and Table 1. Tmax of the second broad exothermic peak is 35-40 °C higher than this temperature for the initial quenched glass. With increasing the temperature of preliminary heat-treatment, there is a redistribution of intensities of these two peaks in favor of the second one, see Figure 3. Tmax of the second peak and Tg gradually increase, see Table 1. We will explain the reason of this behavior below while discussing the phase composition of the samples. The characteristic Tg, Ton and Tmax temperatures of glasses preliminary heat-treated at 680 °C are similar being somewhat higher for the LAS glass than for the corresponding LASox samples.
The XRD pattern of the glass-ceramic obtained by heating the quenched LAS glass in the furnace of the DSC instrument up to the temperature of the sharp exothermic peak at 880 °С, see Figure 4(a), testifies crystallization of β-quarts ss, traces of tieilite, Al2TiO5, and spinel, see Figure 4(b). On the XRD pattern of the sample heated up to temperature of the third exothermic effect at 1175 °С, additional diffraction peaks appear as compared with the pattern of the sample heated up to 880 °С manifesting transformation of the β-quarts ss into the β-spodumene ss while spinel traces disappeared. Thus, the small high-temperature peak evolving at ~1175 °С is due to crystallization of β-spodumene ss, see Figure 4(b).
Figure 5(a) shows DSC curves of the LAS glass preliminary heat-treated at 680 °C for 6 h with stops at temperatures of 787 °С, 838 °С, 858 °С, and 935 °С. The corresponding XRD patterns are presented in Figure 5(b). The material obtained by the heat-treatment at 680 °С, 6 h + 787 °С, 0 h is X-ray amorphous. The sample obtained by the heat-treatment at 680 °С, 6 h + 838 °С, 0 h contains nanocrystals of γ-Al2O3 with spinel structure and traces of β-quarts ss. We speculate that this exothermic peak is caused by crystallization of spinel, while traces of β-quarts ss appear during cooling the sample with the furnace because the samples heated to the specified temperature could not be immediately removed from the hot furnace of the DSC instrument. The XRD pattern of the sample obtained by the heat-treatment 680 °С, 6 h + 858 °С, 0 h, corresponding to the end of the first exothermic peak and the beginnning of the second one contains peaks of nanocrystals of γ-Al2O3, Al2TiO5 and β-quarts ss. The XRD pattern of glass-ceramic obtained by the heat-treatment at 680 °С, 6 h + 935 °С, 0 h proves crystallization of β-quarts ss and Al2TiO5. We cannot rule out the presence of γ-Al2O3 on this XRD pattern because the most intense peak of γ-Al2O3 overlaps the peaks of β-quarts ss and is therefore difficult to detect.
The XRD pattern of the glass preliminary heat-treated at 680 °C for 6 h and heated in the DSC furnace up to 858 °C is significantly different from the XRD pattern of the quenched glass heated in the DSC furnace up to 880 °C. The XRD pattern of the glass preliminary heat-treated at 680 °C for 6 h and heated in the DSC furnace up to 935 °C is similar to XRD pattern of the quenched glass heated in the DSC furnace up to 880 °C, see Figure 6. Thus, the first peak on the DSC curve of the preliminary heat-treated sample is associated with crystallization of the phase with the spinel structure, and the second peak is caused by crystallization of β-quartz ss and Al2TiO5. On the DSC curve of the quenched sample there is no exothermic peak associated with crystallization of the phase with spinel structure. Therefore, preliminary heat-treatments provoke spinel crystallization and increase crystallization temperature of β-quartz ss and Al2TiO5.
3.2. XRD Study
a,b show XRD patterns of initial glasses of the LAS and LASox compositions and glasses of the same compositions, which underwent heat-treatment at the nucleation stage of 680 °C and two stage heat-treatments with temperature at the second stage ranging from 720 °C to 1200 °C. The holding time at each stage was 6 h. The figures allow to follow the formation of the main crystalline phase, β-quartz ss, in the temperature range from 780 °C to 1000 °C and crystallization of β-spodumene ss in the temperature range from 1100 °C to 1200 °C. Figures 7(c,d) give a closer look on XRD patterns of glasses and glass-ceramics obtained by heat-treatments at the second stage up to 800 °C. Initial LAS and LASox glasses are X-ray amorphous with a maximum of amorphous halo located at 2θ=23.1 ° and 23.3 °, respectively. Glasses heat-treated at the nuclation stage of 680 °C for 6 h remain X-ray amorphous, their XRD patterns are similar to those of initial glasses. The two stage heat-treatment with the second stage at 720 °C for 6 h leads to crystallization of a small fraction of crystals with spinel structure, manifested by an appearance of a broad peak with Miller indice hkl (440) at 2θ≅66.8 °.
Figure 7.
(a,b) XRD patterns of LAS and LASox glasses and glass-ceramics: (a) the LAS; (b) the LASox; (c,d) a closer look on XRD patterns of glasses and glass-ceramics obtained by heat-treatments at the second stage up to 800 °C: (c) the LAS; (d) the LASox; (e,f) a closer look on XRD patterns of glass-ceramics obtained by heat-treatments at the second stage from 850 °C to 1200 °C: (e) the LAS; (f) the LASox. The heat-treatment temperature at the first stage is 680 °C, duration of each stage is 6 h. The patterns are shifted for the convenience of observation.
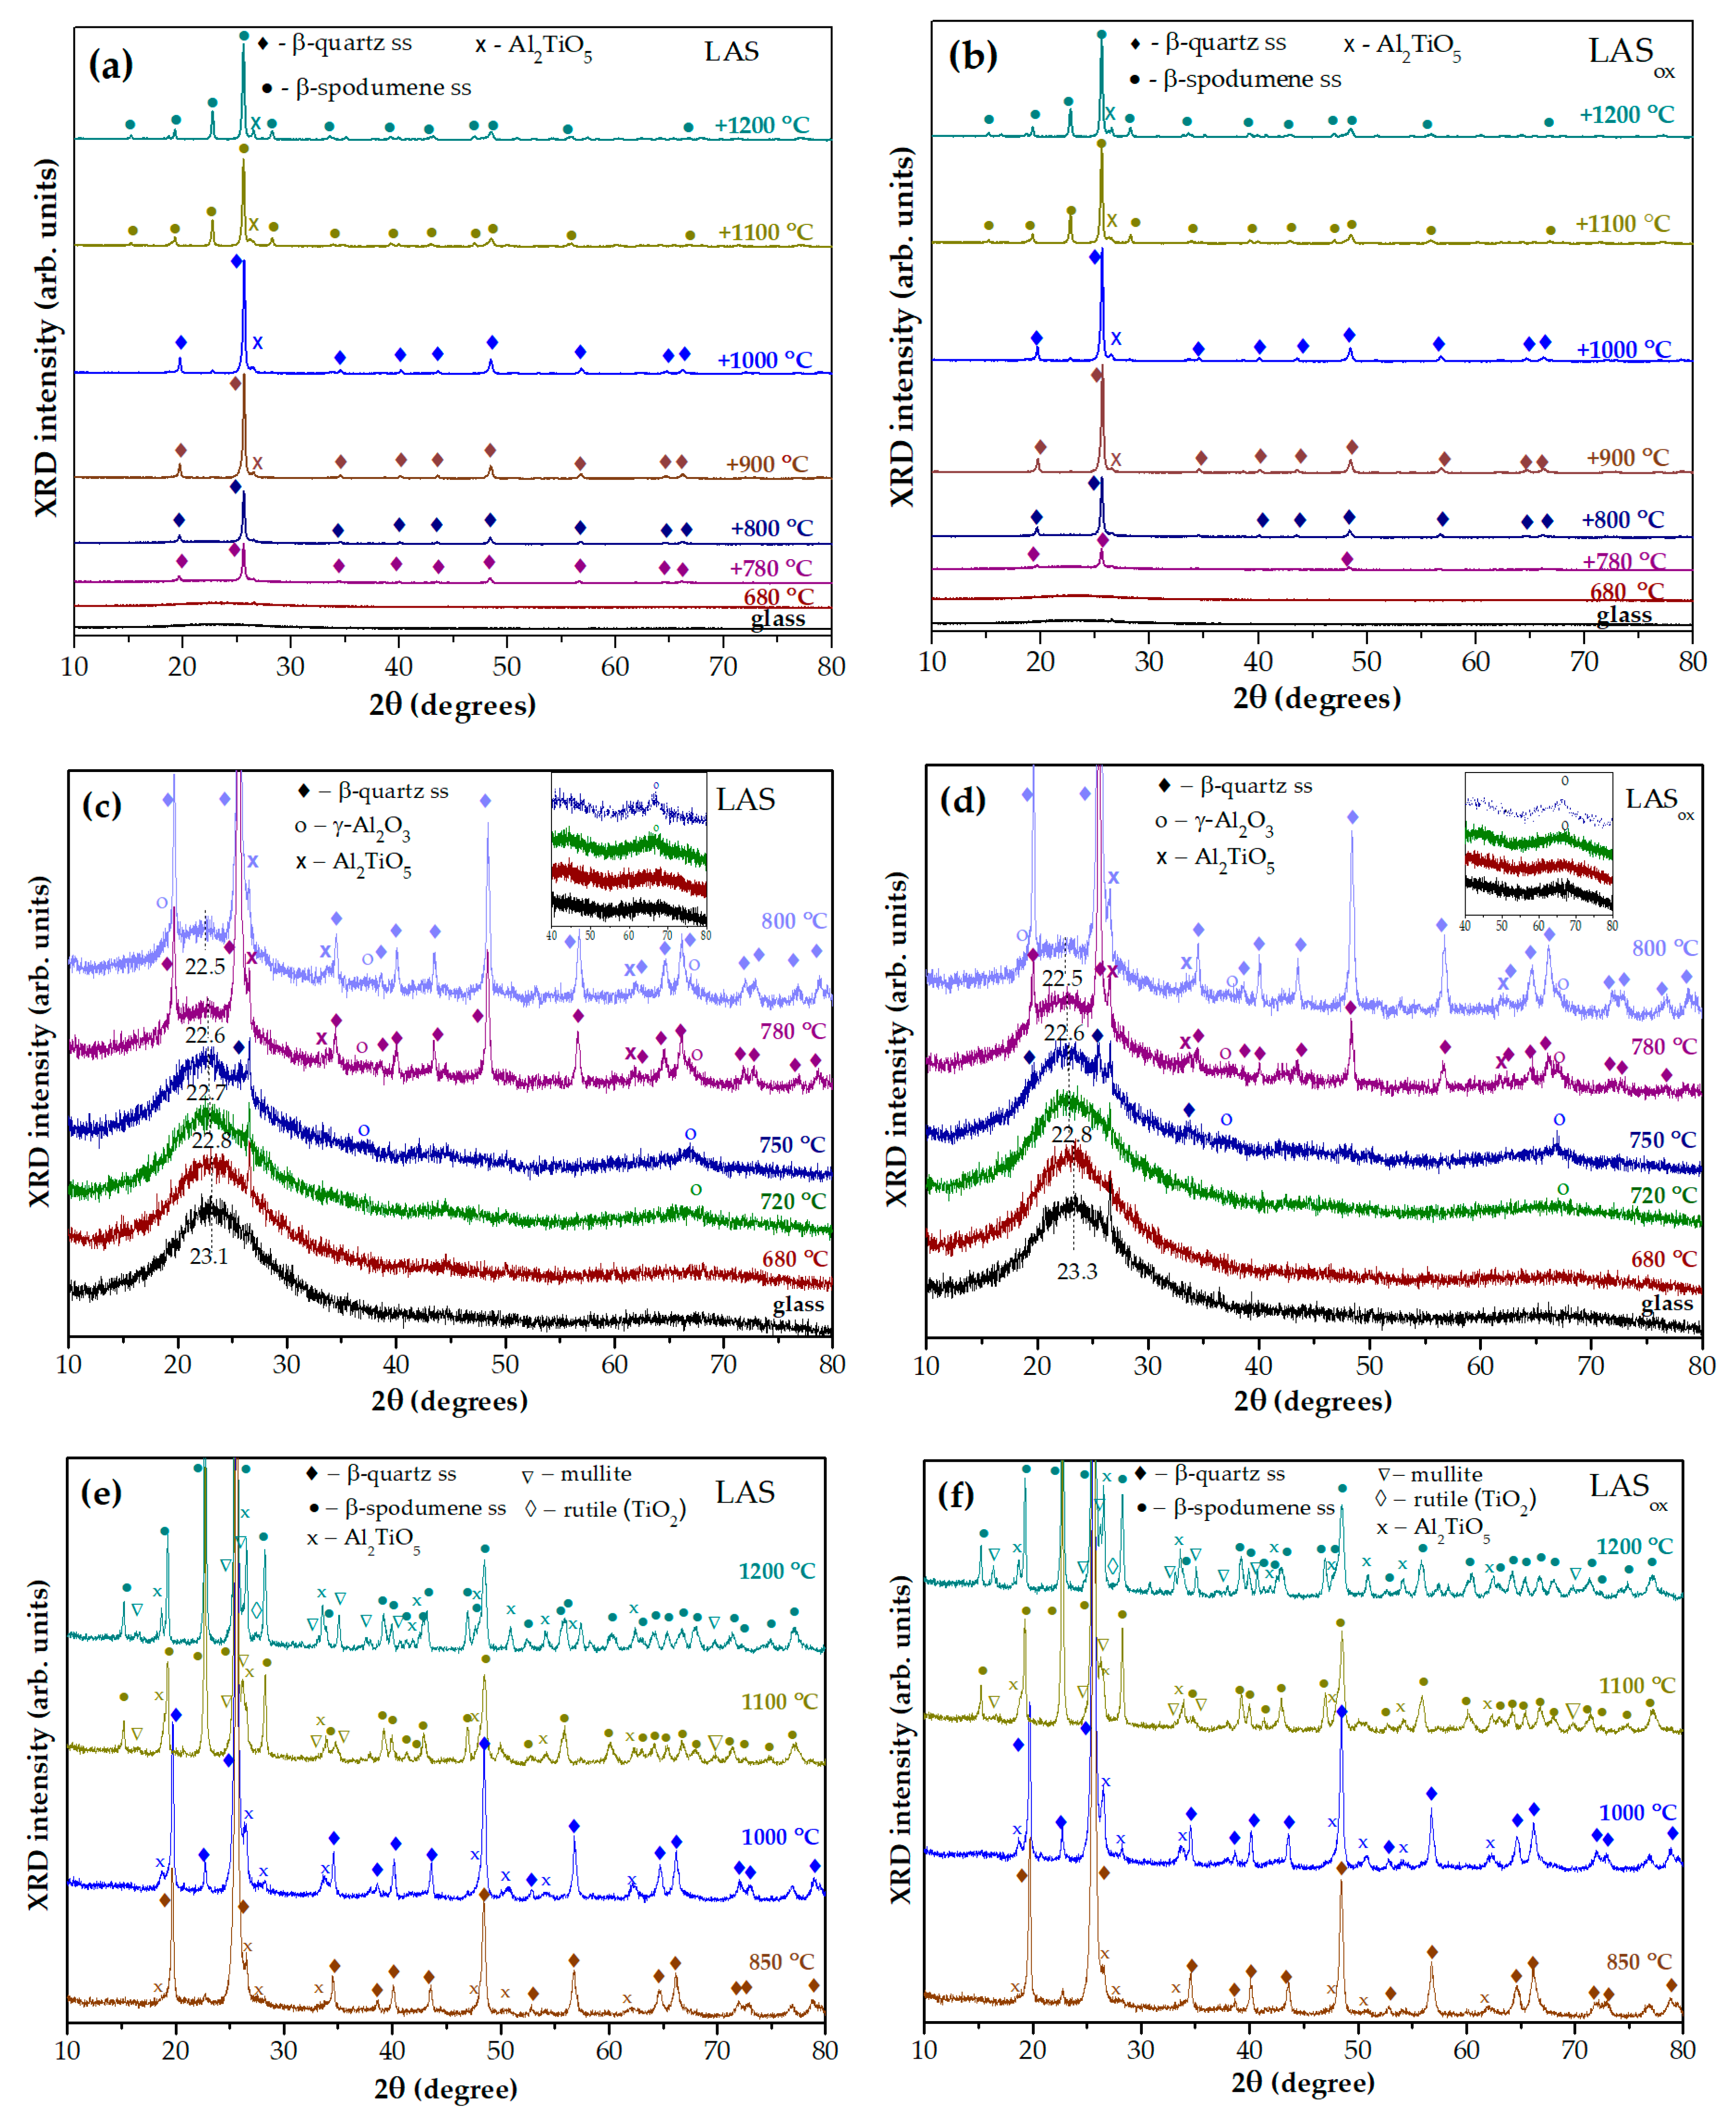
Its low intensity prevents estimation of the lattice parameter a and size of spinel crystals. The position of the amorphous halo shifts to a smaller angle 2θ=22.8 ° for both samples. After the heat-treatment at the second stage at 750 °C for 6 h spinel peaks become more pronounced, which indicates an increase in the volume fraction of this phase. The lattice parameters of spinel crystals are anorm=7.918 Å and aox=7.916 Å, and sizes are Dnorm=4.5 nm and Dox=7.3 nm, respectively. The traces of β-quartz ss are also seen on the patterns. Appearance of spinel and traces of β-quartz ss cause a further change in the composition of the residual glass phase, which is manifested by a shift of the maximum of the amorphous halo to smaller angles, indicating that the residual glass becomes enriched in silica. After heat-treatments at the second stage at 780 °C and 800 °C, the β-quartz ss becomes the predominant crystalline phase, while spinel and tieilite, Al2TiO5, nanocrystals are also found in the XRD patterns. The position of the amorphous halo of a residual glass is shifted to 2θ=22.6 °and then to 2θ=22.5 ° with increasing the heat-treatment temperature, see Figures 7(c,d).
The lattice parameters and mean crystal sizes of spinel obtained at different heat-treatment temperatures are presented in Table 2. We believe that spinel has the composition and structure of γ-Al2O3. The lattice parameter a of the unit cell of the cubic modification of Al2O3 usually takes the value a=7.900 - 7.908 Å [52]. With a slight oxygen deficiency, the parameter a of γ-Al2O3 becomes equal to 7.911 Å (ICDD PDF card #79-1558) and 7.914 Å (ICDD PDF card 79-1557) [53]. The lattice parameter a of γ-Al2O3 crystals in glass-ceramics changes from 7.915 Å to 7.925 Å and increases with increasing the heat-treatment temperature. The difference in the parameter a of γ-Al2O3 nanocrystals in LAS and LASox glass-ceramics is very small. Nevertheless, the lattice parameter a of γ-Al2O3 in LAS glass-ceramics is slightly higher than in LASox ones. The spinel crystal sizes increase with increasing the heat-treatment temperature ranging from 4.5 to 14.0 nm, see Table 2.
Figure 8(a) shows that in spite of the same phase assemblage of glass-ceramics obtained by two stage heat-treatment at 680 °С, 6 h+780° С, 6 h, the crystallinity fractions in the LAS glass-ceramic is much higher than in the LASox one. This difference is levelled out by the heat treatment at 680 °С, 6 h+800° С, 6 h, see Figure 8(b).
Table 2.
Lattice parameters and mean sizes of γ-Al2O3, β-quartz ss and β-spodumene ss in LAS and LASox glass-ceramics.
Table 2.
Lattice parameters and mean sizes of γ-Al2O3, β-quartz ss and β-spodumene ss in LAS and LASox glass-ceramics.
| Heat-treatment schedule | γ-Al2O3 | β-quartz ss | β-spodumene ss | |||||
|---|---|---|---|---|---|---|---|---|
| a, Å | D, nm | a, Å | c, Å | D, nm | a, Å | c, Å | D, nm | |
| The LAS glass | ||||||||
| 680 °С, 6 h+720° С, 6 h | ||||||||
| 680 °С, 6 h+750 °С, 6 h | 7.918 | 4.5 | ||||||
| 680 °С, 6 h+780° С, 6 h | 7.921 | 8.0 | 5.207 | 5.336 | 26 | |||
| 680 °С, 6 h +800 °С, 6 h | 7.925 | 14.0 | 5.196 | 5.350 | 25 | |||
| 680 °С, 6 h +850 °С, 6 h | 5.189 | 5.370 | 22 | |||||
| 680 °С, 6 h +1000 °С, 6 h | 5.186 | 5.362 | 28 | |||||
| 680 °С, 6 h +1100 °С, 6 h | 7.552 | 9.145 | 45 | |||||
| 680 °С, 6 h +1200 °С, 6 h | 7.541 | 9.143 | 45 | |||||
| The LASox glass | ||||||||
| 680 °С, 6 h+720° С, 6 h | ||||||||
| 680 °С, 6 h+750 °С, 6 h | 7.916 | 7.3 | 28 | |||||
| 680 °С, 6 h+780° С, 6 h | 7.915 | 9.4 | 5.207 | 5.319 | 26 | |||
| 680 °С, 6 h +800 °С, 6 h | 7.921 | 10.3 | 5.197 | 5.337 | 26 | |||
| 680 °С, 6 h +850 °С, 6 h | 5.192 | 5.365 | 21 | |||||
| 680 °С, 6 h +1000 °С, 6 h | 5.187 | 5.368 | 27 | |||||
| 680 °С, 6 h +1100 °С, 6 h | 7.550 | 9.153 | 36 | |||||
| 680 °С, 6 h +1200 °С, 6 h | 7.551 | 9.150 | 36 | |||||
Table 3.
Lattice parameters and mean sizes of Al2TiO5 in LAS and LASox glass-ceramics.
| Heat-treatment schedule |
Al2TiO5 | |||||||||
|---|---|---|---|---|---|---|---|---|---|---|
| The LAS glass | The LASox glass | |||||||||
| a, Å | b, Å | c, Å | V, Å3 | D, nm | a, Å | b, Å | c, Å | V, Å3 | D, nm | |
| 680 °С, 6 h+780° С, 6 h | 3.594 | 9.356 | 9.557 | 321.3 | 6.2 | 3.593 | 9.541 | 9.577 | 321.4 | 8.0 |
| 680 °С, 6 h +800 °С, 6 h | 3.595 | 9.365 | 9.564 | 322.0 | 7.1 | 3.594 | 9.358 | 9.577 | 322.1 | 8.7 |
| 680 °С, 6 h +850 °С, 6 h | 3.592 | 9.378 | 9.560 | 322.0 | 8.3 | 3.595 | 9.385 | 9.589 | 323.5 | 10.2 |
| 680 °С, 6 h +900 °С, 6 h | 3.596 | 9.373 | 9.570 | 322.6 | 9.0 | 3.594 | 9.418 | 9.619 | 325.6 | 12.0 |
| 680 °С, 6 h +950 °С, 6 h | 3.597 | 9.454 | 9.590 | 326.1 | 9.4 | 3.594 | 9.421 | 9.628 | 326.0 | 12.0 |
| 680 °С, 6 h +1000 °С, 6 h | 3.598 | 9.456 | 9.624 | 327.4 | 12.2 | 3.594 | 9.457 | 9.633 | 327.4 | 13.7 |
| 680 °С, 6 h +1100 °С, 6 h | 3.596 | 9.456 | 9.663 | 328.6 | 18.8 | 3.595 | 9.460 | 9.677 | 329.1 | 19.4 |
| 680 °С, 6 h +1200 °С, 6 h | 3.591 | 9.488 | 9.716 | 331.0 | 44.1 | 3.592 | 9.489 | 9.708 | 330.9 | 42.0 |
Figures 7(e,f) show the XRD patterns of glass-ceramics obtained by two stage heat-treatments with a second-stage temperature ranging from 850 °C to 1200 °C. After the heat-treatment at 850 °C the crystallinity fraction increases in such extent that amorphous halo disappears. Volume fractions of β-quartz ss and Al2TiO5 gradually increase. β-spodumene ss crystallizes at the expense of β-quartz ss at 1100 °C. Mullite (ICDD PDF card # 79-1458) appears at the same heat-treatment temperature.The lattice parameters and mean crystal sizes of β-quartz ss and β-spodumene ss are presented in Table 2. Their variation with heat-treatment temperature is similar for the LAS and the LASox glasses.
As we mentioned above, the appearance of the surface and the volume of the LAS glass-ceramics obtained by the heat-treatment at 1200 °C are different. The surface is a dense white-colored layer while the volume is grey colored, see Figure 2. Traces of rutile (ICDD PDF card #78-1509) are found on the XRD patterns taken from the grey part of the LAS glass-ceramic. Appearance of rutile is acompanied by some decrease of the tieilite fraction. We failed to find a difference in the phase assemblages of the surface and volume of LASox glass-ceramic obtained by the same heat-treatment. The XRD pattern shows a tiny fraction of rutile in this sample.
Let us discuss the features of crystallization of tieilite, Al2TiO5. As we mentioned above, the onset of crystallization of β-quartz solid solution in glasses at a temperature of 780 °C is accompanied by appearance of a small fraction of Al2TiO5 crystals with mean sizes of ~6 and 8 nm for LAS and LASox glass-ceramics, respectively, see Table 3. Increasing the heat-treatment temperature up to 1200 °C leads to an increase in the size of Al2TiO5 crystals up to ~40 nm, a slow increase in their fraction and a change in their lattice parameters, see Table 3. The values of the lattice parameter a do not change with the heat-treatment temperature within the measurement error and are independent of the redox conditions of glass melting. Lattice parameters b, c and the volume increase with the heat-treatment temperature. An analysis of the evolution of lattice parameters shows that the lattice of Al2TiO5 unit cell, which has a shape of a rectangular parallelepiped elongated in [010] and [001] directions, becomes even more elongated in the same directions under the influence of high temperature. The lattice parameters of tieilite in LAS and LASox glass-ceramics are similar as well as the character of their variation with temperature. The redox conditions of glass melting do not influence significantly the structural transformations in tieilite crystals. A pronounced change in lattice parameters after the heat-treatment at 1200 °C found in the present study can be a prerequisite to decomposition of tieilite with exsolution of rutile [54]. Indeed, as we mentioned above, traces of rutile are found in LASox and in the volume of the LAS glass-ceramics obtained by heat-treatment at 1200 °C. The comparison of XRD patterns of the LAS and the LASox glass-ceramics obtained by heat-treatment at 1200 °C demonstrates that LASox glass-ceramic contains a smaller fraction of rutile and a higher fraction of mulite than the LAS glass-ceramic, compare Figures 7(e,f).
The sequence of phase transformations revealed by XRD study is similar for both glasses: initial glasses and glasses heat-treated at the nucleation stage are X-ray amorphous; nanocrystals of γ-Al2O3 with spinel structure and sizes ranging from 4.5 nm to 14 nm evolve during heat-treatments in the second stage in the temperature range from 720 °C to 800 °C; the main crystalline phase, β-quartz ss, and the crystalline phase of the nucleating agent, tieilite, appear additionally to spinel during the heat-treatment at 780 °C; β-quartz ss are obtained by heat-treatments in the temperature range from 780 °C to 1000 °C; the glass-ceramic prepared by the heat-treatments at 1100 °C contains β-spodumene ss instead of β-quartz ss and traces of mullite; β-spodumene ss is the main crystalline phase of glass-ceramics produced by heat-treatments in the temperature range from 1100 °C to 1200 °C; tieilite nanocrystals with the mean size ranging from ~6 nm to ~45 nm are found in glass-ceramics prepared in the temperature range from 800 °С to 1200 °C; during the heat-treatment at 1200 °C, the crystals of rutile appear in the phase assemblage of glass-ceramics.
In spite of the same phase assemblage of glass-ceramics obtained from glasses melted in different redox conditions, the kinetics of phase transformations and spinel lattice parameters are slightly different. The spinel lattice parameters in the LAS glass-ceramics are larger than in the LASox glass-ceramics. The crystallinity fractions in the LAS glass-ceramic obtained by two stage heat-treatment at 680 °С, 6 h+780 °С, 6 h is much higher than in the LASox one. However, this difference is levelled out by the heat treatment at 680 °С, 6 h+800° С, 6 h. The rutile crystallinity fraction in the LAS glass-ceramics is larger than in the LASox one, while the mullite fraction is smaller.
3.3 Raman Spectroscopy
Figures 9(a,b) show Raman spectra of the initial and heat-treated LAS glass. Raman spectra of initial LAS and LASox (not shown here) glasses are similar and contain broad bands with maxima at 482 cm-1, 800 cm-1, 910 cm-1 and ~1015 cm-1. The wing of the latter band extends to 1200 cm-1. The similar spectrum was obtained in ref. [27] for the glass of the same composition nucleated by 7 mol% TiO2 and melted in oxidizing conditions. The bands at 482 cm-1, 800 cm-1, and ~1000–1200 cm-1 are due to vibrations of bonds in the tetrahedrons of the aluminosilicate network in the glass structure [55], and the band at ~910 cm-1 is due to vibrations of [TiO4] tetrahedra embedded in this network [56]. After the heat-treatment at the nucleation stage at a temperature of 680 °C, minor changes are noticed in the Raman spectrum, see Figure 9(a,b). The high-frequency band slightly broadens and the band with a maximum at 800 cm-1 somewhat increases in intensity compared to the band with a maximum at 910 cm-1, which indicates the development of liquid-liquid phase separation of the initial glass [27]. The position of the band at 482 cm-1 does not change with this heat-treatment.
After the two stage heat-treatment with a temperature of 720 °C at the second stage, significant changes are observed in the Raman spectrum, see Figures 9(a,b). The bands with maxima at 910 cm-1, 800 cm-1, and 482 cm-1 move their positions to 890 cm-1, 810 cm-1, and 472 cm-1, respectively. Instead of the band with a maximum at ca. 1015 cm-1, a band at 1055 cm-1 appears. Intensity of the band at 472 cm-1 increases as compared with the similar band in spectra of the initial glass and glass heat-treated at the nucleation stage. Intensity of the band at ~810 cm-1 increases relatively to the band at ca. 890 cm-1. The increase in the intensity of this band at the expence of the band with a maximum at ca. 890 cm-1 is due to the superposition of vibrations of the [TiO5] and [TiO6] groups in amorphous aluminotitanate regions on a weak band in the 800 cm-1 region, corresponding to vibrations of the tetrahedrons of the aluminosilicate network [30]. These changes are associated with a further development of the liquid-liquid phase separation with the formation of aluminotitanate amorphous regions [27] and a change in the composition of the aluminosilicate glass network, which is in accordance with a change in the position of amorphous halo in the corresponding XRD pattern, see Figure 7(c). Crystallization of γ-Al2O3 with spinel structure revealed by XRD analysis does not show itself in the Raman spectrum of this glass-ceramic. Running ahead, we will say that spectral features of γ-Al2O3, were not detected in Raman spectra of samples obtained by heat-treatments from 750 °C to 800 °C as well, in spite of the fact that XRD analysis reliably identified them. The reason is that bond vibrations in aluminate spinel crystals are very weak compared to bond vibrations in titanium-containing compounds. According to refs [57,58], γ-Al2O3 exhibits narrow peaks with maxima at 315, 410, 520, 713 and 835 cm−1 in the Raman spectrum of γ-Al2O3 corresponding to vibrations of the Al–O bond in tetrahedral structural units of AlO4 [57]. Based on calculations presented in ref. [59], the strongest Raman peak for γ-Al2O3 with spinel structure is located at ~401 cm−1. There are also several bands of medium intensities ranging from 100 cm−1 to 900 cm−1 [59]. In Raman spectra presented in Figure 9(b) there is the band with the maximum at 403 cm-1, which could be the spectroscopic sign of γ-Al2O3. However, this band can be also caused by vibrations in tieilite crystals because this band appears simultaneously with other bands at 250 cm-1, 310 cm-1, and 890 cm-1 characteristic of tieilite, which crystallizes in a larger temperature range of heat-treatments than γ-Al2O3 (see below). We will just mention that we were able to find the spectroscopic signs of crystals with spinel structure only in Raman spectra of spinel-based glass-ceramics of magnesium [60] and zinc aluminosilicate systems [44], where the spinel crystallinity fraction was significantly higher than in the present case.
In the Raman spectrum of the glass-ceramic obtained by the heat-treatment at the second stage at a temperature of 750 °C, the bands with maxima at 472 cm-1 and 815 cm-1 are enhanced, positions of the band maxima change from 810 cm-1 to 815 cm-1 and from 1055 cm-1 to 1068 cm-1, and a very weak band appears at ~144 cm-1. The latter peak can be attributed to the most intense vibration in the Raman spectrum of the metastable modification of TiO2, anatase [25].
In the Raman spectrum of the sample obtained by the heat-treatment at the second stage at a temperature of 780 °C, the band at ~144 cm-1, caused by vibrations in anatase nanocrystals, narrows, the band at 480 cm-1 narrows and intensifies, and the band at ~1080 cm-1 appears. The last two bands are related to vibrations in crystals of β-quartz ss [25,27,61,62]. As we mentioned above, in the spectrum of this glass-ceramics there is a number of bands with maxima at 250 cm-1, 310 cm-1, 403 cm-1, 540 cm-1, and 890 cm-1. They appear simultaneously, and their intensities increase continuously with increasing temperature of heat-treatment. These bands belong to vibrations in tieilite crystals [27], which is in accordance with the XRD data. The Raman spectrum of glass-ceramic obtained by the heat-treatment with a temperature of 900 °C at the second stage shows two anatase bands at ~144 cm-1 and ~638 cm-1 manifesting the maximum anatase crystallinity fraction achieved by this heat-treatment, see Figures 9(a,c). After increasing the heat-treatment temperature at the second stage to 1000 °C, the bands related to anatase disappear. Note that the XRD peaks of anatase coincide in position with the main peaks of β-quartz ss and its small amount cannot be detected by the XRD data [25,47].
As the temperature at the second stage of heat-treatment increases, intensities of the bands at ~460 cm-1 and ~1080 cm-1 increase, their peaks become narrower, see Figure 9(c), which indicates the development of β-quartz ss crystallization. Their positions constantly move to longer wave numbers manifesting enrichment of these crystals with silica [62]. After the second stage heat-treatment at 1100 °C, these bands shift to 490 cm-1 and 1120 cm-1, which can be interpreted as recrystallization of β-quartz ss into β-spodumene ss [47]. Starting from the heat-treatment at 800 °C, a weak band appears at 110 cm-1 simultaneously with increasing intensity and narrowing the bands attributed to β-quartz ss. According to ref. [63], this band can correspond to external vibrations in crystals of β-quartz ss [64]. In Raman spectra of glass-ceramics obtained by heat-treatments at 1100 °C and at 1200 °C, weak bands at ~118 cm−1 and ~190 cm−1 were observed that can be attributed to external vibrations in crystals of β-spodumene ss [61,63], see Figure 9(d).
Figure 9(d) shows the bands at ~260 cm-1, ~445 cm-1 and ~600 cm-1, which are related to crystallization of rutile [65] at the expense of tieilite in the bulk of glass-ceramic obtained by the heat-treatment at a second stage at 1200 °C. We did not find the signs of rutile crystals in the spectrum from the white surface of this sample, which is in accordance with XRD data. XRD patterns of glass-ceramics obtained by heat-treatments at 1100 °C and 1200 °C contain small mullite fractions, see Figure 7(e,f). Raman spectra of synthetic mullites of different compositions have similar spectra with the strongest bands located at 415 cm-1, 600 cm-1, and 980 cm-1 [66]. They can be hidden in the contours of the corresponding broad bands in Raman spectra, see Figure 10(f).
Raman spectra of glass-ceramics obtained by the same heat-treatments that differ most strongly from each other according to Raman spectroscopy data are presented in Figures 10(a-f). Raman spectra of initial glasses, as well as spectra of glasses heat-treated at 680 °C for 6 h are similar to each other, and they are not shown here. The spectra of glass-ceramics obtained by the two stage heat-treatment at 680 °C and at 720 °C for 6 h differ from each other by the ratio of band intensities in the region of high wave numbers, see Figure 10(a). The increase in the relative intensity of the band with a maximum at 800 cm-1 compared to the intensity of the band at 890 cm-1 in the spectrum of the LAS glass-ceramic suggests that the rate of liquid-liquid phase separation in this glass during this heat-treatment is higher than that in the LASox glass, i.e., neutral conditions of glass melting speed up the development of liquid-liquid phase separation in this glass. Crystallization of titanate phases of anatase and tieilite are speeded up in the LAS glass ceramized by the heat-treatment at the second stage at 780 °C as compared with the LASox glass, see Figure 10(b). The same tendency remains true for glass-ceramics obtained by the heat-treatment with the second stage at 900 °C, see Figure 10(c). The higher intensity of the anatase peaks in the Raman spectrum of the LASox glass-ceramic obtained by heat-treatment at 950 °C, see Figure 10(d), means that anatase crystallization in the LASox glass reaches its maximum and will decrease at higher temperatures while the maximum anatase content in the LAS glass-ceramics was reached at previous holding temperature. The traces of anatase crystals remain in the LASox glass-ceramic obtained by heat-treatment at 1000 °C while the LAS glass-ceramic does not show spectral features of this phase, and intensities of peaks assigned to tieilite crystals are higher for the LAS glass-ceramic than for the LASox one, see Figure 10(e). Figure 10(f) shows that the LAS glass-ceramic prepared by heat-treatment at 1200 °C demonstrates rutile bands of higher intensities as compared with the LASox glass-ceramic.
Though Raman spectra of initial glasses and spectra of glasses heat-treated at 680 °C for 6 h are similar to each other, comparison of Raman spectra of glass-ceramics obtained by two stage heat-treatments unambiguously indicates that, despite the fact that the sequence of phase transformations in the titania-containing phase is independent of the redox conditions of glass melting, the rate of these transformations is significantly higher at ceramming of the LAS glass.
3.5. Morphology Characterization by SEM
SEM analysis (Figure 11(a)) reveals the presence of inhomogeneous regions within the bulk of the initial amorphous LAS glass. The calculated size distribution shows a broad profile, with the mean size of the inhomogeneous regions being approximately 27 nm (Figure 12). These inhomogeneities may indicate liquid-liquid phase separation during the glass formation. The broad size distribution may arise from overlapping size distributions of chemically distinct regions. Such regions are likely precursors to the crystallization of various phases upon subsequent heat-treatments.
Following the single step heat-treatment at 680 °C for 6 h, the LAS glass remains X-ray amorphous. However, its SEM image (Figure 11(b)) shows increased inhomogeneity, clearly distinguishing two types of regions. The first type consists of small, spherical, bright regions with a narrow size distribution averaging 16 nm (Figure 12). The second predomonant type features larger, irregular, dark regions with an average size of 74 nm (Figure 12).
After two stage heat-treatment at 680 °C for 6 h and 750 °C for 6 h, the large inhomogeneous regions are not seen on the SEM image anymore. Numerous spherical particles appear in the SEM image of the LAS glass-ceramic, averaging 23 nm in size (Figure 11(c)). The broad shape of the size distribution suggests overlap from multiple chemically distinct particle populations, see Figure 12. XRD analysis confirms crystallization of the spinel phase with mean crystal size of 4.5 nm.
The heat-treatment at 680 °C for 6 h and 780 °C for 6 h promotes significant crystallization of the LAS glass. The SEM image of this glass-ceramic is shown in Figure 11(d). XRD analysis confirms formation of three crystalline phases, β-quartz ss, spinel, and Al2TiO5, see Figure 7(c), with mean crystal sizes of 8 nm, 26 nm and ~6 nm, respectively, see Table 2 and Table 3. The particle size distribution suggests the possible overlap of multiple size distributions corresponding to different phases, see Figure 12. The mean particle size is approximately 21 nm, which is close to the mean size of the predominant crystalline phase of β-quartz ss.
The two step heat-treatment at 680 °C and 800 °C for 6 h results in more extensive crystallization of the LAS glass, see Figure 7(e). XRD analysis confirms the presence of crystalline phases of β-quartz ss, spinel, and Al₂TiO₅. The SEM image reveals significant etching of the material, characterized by numerous large caverns, which may indicate silica depletion, see Figure 11(f). The mean particle size is 31 nm, see Figure 12, which is also close to the mean size of the predominant crystalline phase of β-quartz ss, which is 25 nm, see Table 2.
Following the two step heat-treatment at 680 °C and 1000 °C for 6 h, XRD analysis shows the formation of β-quartz ss, mullite, and Al2TiO5. Signs of the residual glass phase become less prominent. The particle size distribution, similar to previous samples, exhibits a broad profile, likely due to overlapping distributions from different phases, with an average particle size of 30 nm. The size of the predominant crystalline phase of β-quartz ss is 28 nm, see Table 2.
Finally, after two step heat-treatment at 680 °C and 1200 °C for 6 h, the SEM image of the opaque LAS sample shows the presence of micron-sized, needle-like crystals and agglomerates of spherical crystals, see Figure 11(h). The needle-like crystals are very similar to crystals of β-spodumene ss that were crystallized in the lithium aluminosilicate glass of a different composition during its heat-treatment at 1350 °C [19]. XRD analysis confirms the crystallization of β-spodumene (ss), mullite, and Al2TiO5 phases, see Figure 7(e).
The influence of redox conditions of glass melting on phase assamblage of glass-ceramics is revealed by the comparison of SEM images of LAS and LASox glass-ceramics obtained by the heat-treatment at 680 °C and 780 °C for 6 h. In accordance with XRD data, see Figure 8(a), the SEM image of the LASox glass-ceramic shows a significantly reduced extent of crystallization, see Figure 11(e). The particle size distribution for this sample also indicates overlapping distributions, with a mean particle size of 16 nm, which is smaller than the mean particle size of the LAS glass-ceramic. Considering that the main contribution to the increase in mean crystal size comes from larger crystals of β-quartz ss, the smaller mean crystal size in the LASox glass-ceramic indicates a smaller number of these crystals.
3.4. Optical Spectroscopy
Light losses in phase separated glasses and glass-ceramics are determined by absorption due to coloring ions and light scattering on the interfaces of regions of inhomogeneity inherent for such materials. It is generally accepted that coloration of glass-ceramics containing titania as a nucleating agent is mainly caused by intervalent charge transfer transitions between titanium and iron impurity ions in different oxidation states [13,67]. Though we cannot exclude the influence of absorption due to the Fe3+-Ti3+ and Fe2+-Ti4+ intervalence charge transitions on absorption spectra of our materials, we restricted ourselves to the consideration of absorption due to titanium ions. Similar approach was suggested in [67]. Titanium ions can be found in glasses in two oxidation states. The presence of Ti3+ and Ti4+ ions, and Ti3+-Ti4+ pairs defines absorption of glasses under study. Ti4+ ion has electronic configuration 3d0 and does not demonstrate absorption bands due to d-d transitions in the ligand field. Ti4+ ions participate in O-Ti4+ charge transfer bands located in the UV spectral range at ~300 nm [68] and in intervalence charge transfer Ti4+-Ti3+ transitions responsible for coloration in the visible spectral range [69]. Ti3+ ions have electronic configuration 3d1 and demonstrate one broad absorption band in the visible spectral range due to the 2T2g → Eg transition of the Ti3+ ions in octahedral site symmetry. The band often has a shoulder at the long-wavelength side of the absorption band caused by the Jahn–Teller effect [31,33,34,35,69]. The absorption band of Ti3+ ion in tetrahedral (Td) coordination caused by the Eg → 2T2g transition is located in the near infrared region of the spectra [69]. The O-Ti3+ charge transfer band is expected in UV spectral range at ~240 nm [68].
Absorption spectra of initial and heat-treated glasses are shown in Figure 13a–g. For the convenience of comparison, the spectra of the LAS and LASox glasses and glass-ceramics obtained by the same heat-treatment schedule are presented in Figures 14(a-h). The spectra are formed by the absorption edge in the UV spectral range, see Figures 13(d,e), intense absorption of OH- groups spanning from 2700 nm to 3300 nm, see Figures 13(f,g), and light losses in the visible and near IR spectral range, see Figures 13(a-c), which have different origin in the LAS and the LASox glass-ceramics. Note that the LASox glass-ceramics obtained by heat-treatments at 950 °C and 1000 °C at the second stage cracked during heat-treatment, and their spectra were not recorded.
For the initial LAS glass, the UV absorption edge is observed at ~330 nm. In the spectrum of the glass heat-treated at the nucleation stage at 680 °C for 6 h it moves to longer wavelengths by 5 nm. In the spectrum of glass-ceramics obtained by the two stage heat-treatment with the temperature of 720 °C at the second stage, the position of the absorption edge is found at ~343 nm and has near the same position after heat-treatments at 750 °C and 780 °C. After heat-treatment with the temperature of 800 °C at the second stage, the absorption edge shifts to shorter wavelengths, to 334 nm. After increasing the temperature of the second stage to 850 °C and 900 °C, the absorption edge shifts again to longer wavelengths. Its position is equal to 347 nm and 351 nm, respectively. After heat-treatments at 950 °C and 1000 °C, the position of the absorption edge shifts again to shorter wavelengths, see Figure 14(d).
The position of the absorption edge for the LASox glass and its variation with the heat-treatment temperature are surprisingly similar to those of the LAS glass, see Figure 14(a-e,g,h). The position of the absorption edge differs only for glass-ceramics obtained by the heat-treatment at the second stage at 800 °C, see Figure 14(f). The absorption edge in the spectrum of this LASox glass-ceramic is shifted to longer wavelengths compared to its position in the spectrum of the LAS sample. The nonmonotonic transmittance variation during the crystallization of glasses inclined to liquid-liquid phase separation was described in ref. [70] and assigned to incoherent scattering that takes place in a material containing amorphous and crystallized regions of inhomogeneity. The authors of ref. [70] demonstrated that the extinction coefficient can reach a maximum when the crystallinity fraction is 0.5–1.0 and then decrease due to the presence of elements of ordering in the relative position of the crystals.
We used the same raw materials for the preparation of both glasses, which means that the iron content in both glasses was similar. The absorption edge in initial glasses and in glass-ceramics is formed by O2-→Ti4+ and O2-→Ti3+ charge transfer bands [68]. Taking into account that O2-→Ti4+ charge transfer band is located at longer wavelengths than the O2-→Ti3+ one, we may suggest that the content of Ti4+ ions in the LAS and the LASox glasses is very similar, i.e., the content of Ti3+ in the LAS glass is rather low. In glass-ceramics containing β-quarts ss scattering losses are superimposed with the absorption edge.
A broad absorption band is found in the spectrum of the LAS glass. Its intensity increases after heat-treatment at the nucleation stage and with increasing the heat-treatment temperature at the second stage up to 780 °C, see Figure 13(c). After further heat-treatments the absorption band becomes broader, its intensity somewhat decreases. We explain appearance of this absorption band by Ti3+ ions distributed between different amorphous and crystalline phases. Since the absorption edge and light scattering in the obtained multiphase materials are superimposed on the short-wave part of the absorption spectrum, we subtracted absorption due to these losses from experimental absorption spectra of the LAS samples using the corresponding absorption spectra of LASox samples for substraction. The difference spectra are shown in Figure 13(d). The spectrum of the initial glass is a typical absorption spectrum of Ti3+ ions in silicate glasses with a broad peak with a maximum at ~480 nm attributed to d-d transition 2T2g→2Eg of 3d1 electron of Ti3+ ions in octahedral coordination in the ligand field affected by the Jahn-Teller effect [33,34,35]. The tail with a maximum at ~800 nm is assigned to intervalence charge transfer in Ti3+-Ti4+ pairs [71,72]. The absorption intensity increases after the heat-treatment at the nucleation stage, the band maximum shifts to ~500 nm, which is connected with participation of Ti3+ ions in the liquid-liquid phase separation and entering the aluminotitanate amorphous regions. With increasing the heat-treatment temperature at the second stage, the broadband absorption in the visible and near-IR region intensifies, its maximum shifts to ~730 nm in spectra of glass-ceramics obtained by heat-treatments at 750 °C and 780 °C at the second stage. Similar to absorption of Ti3+ ions in corrund crystals [73,77] we attribute this absorption to Ti3+ ions in the ligand field of octahedral symmetry (the shoulder at ~480 nm) and Ti3+-Ti4+ pairs in crystals of γ-Al2O3. In the spectrum of corrundum, the Ti4+ ions in Al3+ sites are considered to be charge-compensated by Al vacancies with one vacancy for every three Ti4+ ions [74]. An increase of the lattice parameters of γ-Al2O3 with heat-treatment temperature found by the XRD analysis can be due to entering the crystals of γ-Al2O3 by Ti3+ ions (ionic radius in octahedral coordination is 0.81 Å) and Ti4+ ions (ionic radius in octahedral coordination is 0.745 Å). Note that ionic radii of Al3+ in octahedral coordination is 0.675 Å.
The shape of the absorption band changes with raising the heat-treatment temperature. Judging by the shape of the absorption band, the spectrum is still mainly formed by absorption of Ti3+-Ti4+ pairs. Taking ino account crystallization of β-quartz ss and tieilite, Al2TiO5, this change of the shape of absorption band can be connected with distribution of titanium ions between the crystalline phases. Spinel does not crystallize in glass-ceramics obtained by heat-treatments at 850 °C – 1000 °C at the second stage. So the broadband spectra of glass-ceramics obtained by these heat-treatments are connected with titanium ions in β-quartz ss and tieilite.
The light losses in the LASox glass-ceramics are mostly caused by light scattering, which has a non-monotoneous dependence on the heat-treatment temperature, as we mentioned above.
Figures 13(f,g) show wide asymmetric absorption bands in the spectral region from ~2700 nm to 3300 nm caused by the presence of OH-groups in glasses and glass-ceramics. Heat-treatment at the nucleation stage at 680 °C for 6 h has no effect on the shape and intensity of this band. Two stage heat-treatments with temperature from 720 °C to 780 °C at the second stage cause a successive change in the spectrum of OH-groups. The intensity in the range from 2750 nm to 3050 nm increases and the intensity in the range from 3050 nm to 3300 nm decreases. Further narrowing of the OH-groups absorption band and growth of its intensity is observed in spectra of glass-ceramics obtained during heat-treatments in the range of crystallization temperatures from 800 °C to 1000 °C. Comparison of the absorption bands of OH-groups in glasses melted in different redox conditions and in corresponding glass-ceramics showed that the intensities of the absorption bands of OH-groups are higher in inital and heat-treated LAS glass than in LASox samples. The shape of the absorption band is the same for the materials obtained by the same heat-treatment shedule, see Figures 14(a-h), which is explained by a similarity of their phase compositions.
3.7. Estimation of the Coefficient of Thermal Expansion
Table 4 lists thermal expansion coefficients (CTE) for initial and heat-treated glasses of the LAS and the LASox compositions in the temperature range from 20 °C to 320 °C. The CTE values of initial glasses are similar and equal to ~4.3 × 10⁻⁶ К-1. After the nucleation heat-treatment at 680 °C for 6 h the CTE values slightly decrease to become ~4.1 × 10⁻⁶ К-1. There is a gradual increase of CTE values with increasing the ceramming temperature to 720 °C and then to 750 °C. Glass-ceramics based on spinel nanocrystals and prepared by the consequent three stage heat-treatment schedule 680 °C, 6 h + 720 °C, 6 h + 750 °C, 6 h have the highest CTE value of ~5.2 × 10⁻⁶ К-1. The CTE value starts to decrease as the first portions of β-quartz ss crystallize (heat-treatment with the last hold at 780 °C for 6 h) and reaches the lowest value of ~0.3 × 10⁻⁶ K-1 for the glass-ceramics obtained by ceramming at the last stage of heat-treatment at 950 °C for 6 h. After heat-treatment of the initial glass at 1200 °C, the CTE increases again to a value of 1.46 × 10⁻⁶ K-1 due to the crystallization of β-spodumene ss. The dependences of the change in the CTE value on the temperature of heat-treatment for samples obtained by crystallization of glasses melted under neutral and oxidizing conditions are similar, which can be explained by the similarity of their phase assemblage.
4. Discussion
Initial glasses melted in neutral and oxidizing conditions are X-ray amorphous and inhomogeneous according to SEM microscopy findings. Inhomogeneity regions have a broad size distribution with a mean size of 27 nm. In accordance with previous studies [27,28], we suggest that liquid-liquid phase separation occurs during the glass melt casting and annealing. Absorption spectra of glasses melted in different redox conditions are different by an appearance of a broadband absorption in the LAS glass mainly assigned to Ti3+ ions in distorted octahedral coordination and Ti3+-Ti4+ pairs in the glass structure. We suggest that these ions are distributed between the lithium aluminosilicate glass matrix and amorphous regions of inhomogeneity composed of octahedrally coordinated titanium and aluminum ions even with formation of Ti3+-Ti4+ clusters [26]. Based on the similarity of XRD patterns, Raman spectra and glass transition temperatures, we speculate that initial glasses melted in neutral and oxidizing conditions have similar structure because of low content of Ti3+ ions. Nevertheless, the role of Ti3+ ions in liquid-liquid phase separation and crystallization of the LAS glass is clearly seen.
The glasses heat-treated at the nucleation stage of 680 °C for 6 h remain X-ray amorphous, their XRD patterns are similar and their Raman spectra are near similar to each other and to those of initial glasses. However, there is a tremendous difference in behavior of their DSC curves, their morphology revealed in the SEM study and their absorption spectra as compared with those of initial glasses. It allows us to conclude that during the heat-treatment at the nucleation stage liquid-liquid phase separation continues to develop in both glasses.
According to data of SEM analysis, two types of amorphous regions with mean sizes of 16 and 74 nm are formed in the glass during its heat-treatment at 680 °C for 6 h. We did not see a similar structure formation in previously studied glasses of the lithium aluminosilicate system. Formation of large amorphous aluminotitanate regions of inhomogeneity in magnesium [75] and zinc [76] aluminosilicate glasses nucleated by titania was previously revealed by a combination of small-angle X-ray scattering and Raman spectroscopy data. Those materials also contained smaller size phase-separated regions enriched in aluminates of corresponding cations [75,76]. We can suggest a similar character of phase separation in glasses under study and suppose that Ti3+ ions are distributed between large aluminotitanate amorphous regions, smaller size aluminate regions and residual glass.
Judging by the data of Raman spectroscopy, glasses cerammed using a two stage heat-treatment with a temperature of the second stage of 720 °C have a well-developed liquid-liquid phase separated structure. During this phase separation, spinel nanocrystals appear in both glasses, and the composition of the residual lithium aluminosilicate glass slightly changes, which is manifested by a change in the position of the amorphous halo in the XRD pattern and the position of the band at ~480 cm-1 in the Raman spectrum. Spinel is the sole crystalline phase in transparent glass-ceramics obtained by heat-treatments at the second stage at 720 °C and 750 °C. Upon crystallization of spinel, titanium ions Ti3+ enter its structure, which is clearly seen in absorption spectra of the LAS glass-ceramics. The change of the position of the maximum of absorption band to longer wavelengths suggests that absorption spectrum in glass-ceramics is mainly formed by the Ti3+-Ti4+ intervalent charge transfer band. This is a spectroscopic confirmation of presence of Ti4+ ions in the spinel structure.
Therefore, based on the DSC, SEM and XRD data, we may conclude that preliminary heat-treatment at 680 °C resulting in formation of a reach phase-separated structure, provokes spinel crystallization during further heat-treatments in the temperature range from 720 °C to 800 °C. According to the similarity of absorption spectra of these glass-ceramics and spectra of Ti3+-doped Al2O3, we speculate that Ti3+ ions enter into spinel crystals. Taking into consideration that, according to findings of Raman spectroscopy, the rate of phase transformations in the titania-containing phase in glass melted in neutral conditions is significantly higher than in glass melted in oxidizing conditions, we suggest that Ti3+ ions enter amorphous aluminotitanate phase-separated regions.
Previously we mentioned the decrease of intensity of the first broad peak on DSC curves of glasses nucleated at 700 °C and its near disappearance in DCS curves of glasses preliminary heat-treated at 720 °C for 6 h. The sample preliminary heat-treated at 720 °C already contained spinel nanocrystals. Therefore, in this sample only high temperature phases of β-quartz ss, tieilite and β-spodumene ss crystallized, which resulted in appearance of the second and the third peaks and the absence of the first peak on the DSC curve.
Specific feature of the morphology of the materials under study is the similarity of the mean size of inhomogeneous regions in the initial glass and in glass-ceramics obtained by two stage heat-treatments in the temperature range up to 1000 °C. Sizes of β-quartz ss crystallized in both glasses in the temperature range from 780 °C to 1000 °C are similar to each other. Our findings are in line with results presented in ref. [46] devoted to the study of the lithium aluminosilicate glass nucleated by a mixture of TiO2 and ZrO2, where the constancy of the size of β-quartz ss crystallized in the temperature range from 860 °C to 960 °C was revealed and discussed.
The comparison of XRD patterns of the LAS and the LASox glass-ceramics obtained by heat-treatment at 1200 °C demonstrates that LAS glass-ceramic contains a larger fraction of rutile and a smaller fraction of mullite than the LASox glass-ceramic. Previously we revealed the difference in lattice parameters of rutile crystallized in zinc aluminosilicate glasses nucleated by TiO2 and melted in different redox conditions [41,42]. In ref. [41] this difference was explained by the presence of Ti3+ ions in the rutile structure. We suggest that in lithium aluminosilicate glass-ceramics Ti3+ ions also participate in formation of rutile nanocrystals, which results in facilitation of their crystallization. Note that the role of small additives of transition metal ions in kinetics of crystallization in glass-ceramics was discussed in ref. [26].
The rate of phase transformations resulted in crystallization of β-quartz ss is significantly higher at heat-treatment of the glass melted in neutral conditions. However, the sequence of phase transformations and phase assemblage of glass-ceramics melted in different redox conditions are independent of the redox conditions of glass melting. This is very promising for the development of transparent lithium aluminosilicate glass-ceramics with close to zero thermal expansion coefficient and doped with various functional ions in the lower oxidation states. Crystallization of β-quartz ss leads to decreasing the value of thermal expansion coefficient. The lowest coefficient of thermal expansion was obtained by the heat-treatment at 950 °C at the second stage. It was ~0.3 × 10⁻⁶ K-1.
5. Conclusions
The model glass of the lithium aluminosilicate system was nucleated solely by titanium oxide and melted with and without addition of As2O3, i.e., under oxidizing and neutral conditions. The glasses were heat-treated in the temperature range from 680 °C to 1300 °C to obtain glass-ceramics. Glass-ceramics developed from glasses melted without addition of As2O3 are black-colored, those fabricated from glasses melted with addition of As2O3 are colorless.
Transparent glass-ceramics based on β-quartz ss and/or γ-Al2O3 nanocrystals and opaque glass-ceramics based on β-spodumene ss nanocrystals were obtained. Crystallization of β-quartz ss was accompanied by nanocrystals of tieilite, Al2TiO5. Crystallization of β-spodumene ss was accompanied by tieilite, mullite (at 1100 °C) and rutile (at 1200 °C).
Preliminary heat-treatment at the nucleation stage causes crystallization of γ-Al2O3 with spinel structure and an increase in the crystallization temperature of β-quartz ss and Al2TiO5 and decrease in the temperature of β-spodumene ss crystallization. Glasses melted under neutral conditions lose transparency at higher secondary heat-treatment temperatures than glasses melted under oxidizing conditions.
Initial X-ray amorphous glasses have inhomogeneous structure with a mean size of regions of inhomogeneity of ca. 27 nm. Preliminary heat-treatment at 680 °C results in formation of a reach bimodal liquid-liquid phase separated structure with mean sizes of inhomogeneous regions of ca. 16 nm and 74 nm. Titanium ions enter both types of inhomogeneous regions. An appearance of a bimodal structure of inhomogeneous regions in the result of heat-treatment at the nucleation stage suggests the development of a three-phase immiscibility in the lithium aluminosilicate glass with a high excess of alumina over lithium oxide, i.e., the formation of two amorphous phases, the aluminotitanate phase and the aluminate phase, dispersed in a high-silica matrix. It is the first time that the three-phase immiscibility is revealed in glasses of the lithium aluminosilicate system.
Nanocrystals of γ-Al2O3 with spinel structure and sizes ranging from 4.5 nm to 14.0 nm appear during heat-treatments at the second stage in the temperature interval from 720 °C to 800 °C. Titanium ions are located in spinel structure as Ti3+ ions in the ligand field of octahedral symmetry and in Ti3+-Ti4+ pairs. Ti3+ ions also enter amorphous aluminotitanate phase-separated regions and facilitate phase transformations in this phase with formation of tieilite, anatase and rutile.
The phase assemblage and sequence of phase transformations is independent of the redox conditions of glass melting, however, the rate of these transformations is significantly higher at ceramming of the glass melted in neutral conditions. This is very promising for the development of transparent glass-ceramics with close to zero thermal expansion coefficient and doped with various functional ions in the lower oxidation states.
The variation of the coefficient of thermal expansion with heat-treatment temperature reflects the variation of the phase composition of the developed materials, does not depend on the redox conditions of glass melting and reaches as low value as ~0.3 × 10⁻⁶ K-1 for glass-ceramics based on nanocrystals of β-quartz ss.
Author Contributions
Conceptualization, O.D. and A.Z.; methodology, I.A., K.B., M.T. and A.B.; software, A.B.; validation, I.A. and O.D.; formal analysis, I.A., A.B. and A.V.; investigation, S.M., S.Z., M.T., A.V., I.A. and O.D.; resources, K.B.; data curation, I.A., A.B. and A.V.; writing—original draft preparation, O.D., I.A., and A.B.; writing—review and editing, O.D., A.Z. and G.S.; visualization, A.M., A.V., A.B.; supervision, O.D.; project administration, O.D.; funding acquisition, O.D and G.S. All authors have read and agreed to the published version of the manuscript
Funding
This work was partly supported by the Russian Science Foundation (Grant 23–23-00446).
Data Availability Statement
This study does not include publicly archived datasets.
Conflicts of Interest
The authors declare no conflicts of interest.
References
- Höland, W.; Beall, G.H. Glass-Ceramic Technology; Wiley: Hoboken, NJ, USA, 2012; pp. 92–97. [Google Scholar]
- Bach, H. .; Krause, D. In Low Thermal Expansion Glass Ceramics; Springer-Verlag: Berlin, Heidelberg, 2005. [Google Scholar]
- Petzoldt, J.; Pannhorst, W. Chemistry and structure of glass-ceramic materials for high precision optical applications. J. Non-Cryst. Solids. 1991, 129, 191–198. [Google Scholar] [CrossRef]
- Stookey, S.D. Method of Making Ceramics and Product Thereof, U.S. Pat. No. 2,920,971, January 12, 1960.
- Beall, G.H.; Karstetter, B.R.; Rittler, H.L. Crystallization and chemical strengthening of stuffed β-quartz glass-ceramics. J. Am. Ceram. Soc. 1967, 5, 181–190. [Google Scholar] [CrossRef]
- Beall, G.H.; Duke, D.A. Transparent glass-ceramics. J. Mater. Sci. 1969, 4, 340–352. [Google Scholar] [CrossRef]
- Beall, G.H.; Pinckney, L.R. Nanophase glass-ceramics. J. Am. Ceram. Soc. 1999, 82, 5–16. [Google Scholar] [CrossRef]
- Zanotto, E. D. A bright future for glass-ceramics. Am. Ceram. Soc. Bull. 2010, 89, 19–27. [Google Scholar]
- Alekseeva, I.P.; Dymshits, O.S.; Tsenter, M.Y., Zhilin A.A. Influence of various alkali and divalent metal oxides on phase transformations in NiO-doped glasses of the Li2O-Al2O3-SiO2-TiO2 system J. Non-Cryst. Solids., 2011, 357, 2209–2214. [CrossRef]
- Fernandez-Martin, C.; Bruno, G.; Crochet. A.; Ovono, D.O.; Comte, M.; Hennet, L. Nucleation and growth of nanocrystals in glass-ceramics: an in situ SANS perspective. J. Am. Ceram. Soc. 2012, 95, 1304–1312. [Google Scholar] [CrossRef]
- Dressler, M.; Rüdinger, B.; Deubener, J. Crystallization kinetics in a lithium alumosilicate glass using SnO2 and ZrO2 additives. J. Non-Cryst. Solids. 2014, 389, 60–65. [Google Scholar] [CrossRef]
- Dymshits, O.; Shepilov, M.; Zhilin, A. Transparent glass-ceramics for optical applications. MRS Bulletin. 2017, 42, 200–205. [Google Scholar] [CrossRef]
- Nakane, S.; Kawamoto, K. Coloration mechanism of Fe ions in β-quartz s.s. glass-ceramics with TiO2 and ZrO2 as nucleation agents. Front. Mater. 2017, 4, 14–19. [Google Scholar] [CrossRef]
- Fu, Q.; Wheaton, B.R.; Geisinger, K.L.; Credle, A.J.; Wang, J. Crystallization, microstructure, and viscosity Evolutions in lithium aluminosilicate glass-ceramics. Front. Mater. 2016, 3, 49. [Google Scholar] [CrossRef]
- Kleebusch, E.; Patzig, C.; Krause, M.; Hu, Y.; Höche, T.; Rüssel, C. The formation of nanocrystalline ZrO2 nuclei in a Li2O-Al2O3-SiO2 glass – a combined XANES and TEM study, Sci. Rep. 2017, 7, 10869. [Google Scholar] [CrossRef]
- Zandona, A.; Patzig, C.; Rüdinger, B.; Hochrein, O.; Deubener, J. TiO2(B) nanocrystals in Ti-doped lithium aluminosilicate glasses, J. Non-Cryst. Solids.: 2019, 2, 100025. [Google Scholar] [CrossRef]
- Glatz, P.; Comte, M.; Montagne, L.; Doumert, B.; Cousin, F.; Cormier, L. Structural evolution at short and medium range distances during crystallization of a P2O5-Li2O-Al2O3-SiO2 glass, J. Am. Ceram. Soc. 2020, 103, 9–4969. [Google Scholar] [CrossRef]
- Backhaus-Ricoult, M.; Comte, M.; Francois, E.; Rezikyan, A.; Wheaton, B. Evolution of electrical, structural, and chemical properties of Li-aluminosilicate glass during crystallization, J. Am. Ceram. Soc. 2024, 107, 2–897. [Google Scholar] [CrossRef]
- Dymshits, O.; Bachina, A.; Alekseeva, I.; Golubkov, V.; Tsenter, M.; Zapalova, S.; Bogdanov, K.; Danilovich, D.; Zhilin, A. Phase transformations upon formation of transparent lithium alumosilicate glass-ceramics nucleated by yttrium niobates 2023, 6, 1490–1507. Ceram 2023, 6, 1490–1507. [Google Scholar] [CrossRef]
- Vigier, M.; Deniard, P.; Gautron, E.; Gautier, N.; Genevois, C.; Ory, S.; Allix, M.; Kacem, I.B.; Jobic, S. Microstructural insights on lithium aluminum silicate (LAS) glass ceramics. Ceram. Int, 2024, 50, 29011–29015. [Google Scholar] [CrossRef]
- Guo, Y.; Wang, J.; Ruan, J.; Han, J.; Xie, J.; Liu, C. Microstructure and ion-exchange properties of glass-ceramics containing ZnAl2O4 and β-quartz solid solution nanocrystals. J. Eur. Ceram. Soc. 2021, 41, 5331–5340. [Google Scholar] [CrossRef]
- Naumov, A.S.; Shakhgildyan, G.Y.; Golubev, N.V.; Lipatiev, A.S.; Fedotov, S.S.; Alekseev, R.O.; Ingat’eva, E.S.; Savinkov, V.I. ; Sigaev, V.N. Tuning the coefficient of thermal expansion of transparent lithium aluminosilicate glass-ceramics by a two-stage heat treatment. Ceram. 2023, 7, 1–14. [Google Scholar] [CrossRef]
- Beall, G.H. Dr. S. Donald (Don) Stookey (1915–2014): Pioneering researcher and adventurer. Front. Mater. 2016, 3, 37. [Google Scholar] [CrossRef]
- Doherty, P. D. Direct observation of the crystallization of Li2O-Al2O3-SiO2 glasses containing TiO2. J. Am. Ceram. Soc. 1967, 50, 77–80. [Google Scholar] [CrossRef]
- Alekseeva, I.P.; Belyaevskaya, N.M.; Bobovich, Ya.S.; Tsenter, M.Ya.; Chuvaeva, T.I. Recording, interpretation, and some examples of application of Raman spectra for glass ceramics activate with titanium (IV) oxide. Opt. Spectrosc. 1978, 45, 927–936. [Google Scholar]
- Khodakovskaya, R.Ya. Chemistry of Titanium-containing Glasses and Glass Ceramics; M., Russia, 1978; pp. 190–198 (in Russian).
- Dymshits, O.S.; Zhilin, A.A.; Petrov, V.I.; Tsenter, M.Ya.; Chuvaeva, T.I.; Golubkov, V.V. A Raman spectroscopic study of phase transformations in titanium-containing lithium aluminosilicate glasses. Glass Phys. Chem. 1998, 24, 79–96. [Google Scholar]
- Alekseeva, I.; Dymshits, O.; Tsenter, M.; Zhilin, A.; Golubkov, V.; Denisov, I.; Skoptsov, N.; Malyarevich, A.; Yumashev, K. Optical applications of glass-ceramics, J. Non-Cryst. Solids, 2010, 356, 3042–3058. [Google Scholar] [CrossRef]
- Kleebusch, E.; Patzig, C.; Krause, M.; Hu, Y.; Höche, T.; Rüssel, C. The effect of TiO2 on nucleation and crystallization of a Li2O-Al2O3-SiO2 glass investigated by XANES and STEM. Sci. Rep. 2018, 8, 2929. [Google Scholar] [CrossRef]
- Kleebusch, E.; Patzig, C.; Höche, T.; Rüssel, C. The evidence of phase separation droplets in the crystallization process of a Li2O-Al2O3-SiO2 glass with TiO2 as nucleating agent – An X-ray diffraction and (S)TEM-study supported by EDX-analysis. Ceram. Int. 2018, 44, 2919–2926. [Google Scholar] [CrossRef]
- Johnston, W.D. Oxidation-reduction equilibria in molten Na2O·2SiO2 glass. J. Am. Ceram. Soc. 1965, 48, 184–90. [Google Scholar] [CrossRef]
- Rawal, B.S; MacCrone, R.K. Optical absorption in an equimolar barium borosilicate glass containing titanium lons. J. Non-Cryst. Solids. 1978, 28, 337–45. [Google Scholar] [CrossRef]
- Kurkjian, C.R.; Peterson, G.E. An EPR study of Ti3++-Ti4+ in TiO2-SiO2 glasses. Phys. Chem. Glasses. 1974, 15, 12–17. [Google Scholar]
- Morinaga, K.; Yoshida, H.; Takebe, H. Compositional dependence of absorption spectra of Ti3+ in silicate, borate, and phosphate glasses. J. Am. Ceram. Soc. 1994, 77, 3113–3118. [Google Scholar] [CrossRef]
- El-Shafi, N.A.; Morsi, M.M. Optical absorption and infrared studies of some silicate glasses containing titanium. J. Mater. Sci. 1997, 32, 5185–5189. [Google Scholar] [CrossRef]
- Andrade, L.H.C.; Lima, S.M.; Novatski, A.; Neto, A.M.; Bento, A.C.; Baesso, M.L.; Gandra, F.C.G.; Guyot, Y.; Boulon, G. Spectroscopic assignments of Ti3+ and Ti4+ in titanium-doped OH_ free low-silica calcium aluminosilicate glass and role of structural defects on the observed long lifetime and high fluorescence of Ti3+ ions. Phys. Rev. B. 2008, 78, 224202–1. [Google Scholar] [CrossRef]
- Vogel, W. Glass Chemistry; Springer, Berlin, Heidelberg, NY, USA, 1994; pp. 313–314. [CrossRef]
- Höland, W.; Wange, P.; Naumann, K.; Vogel, J.; Carl, G.; Jana, C.; Götz, W. Control of phase formation processes in glass-ceramics for medicine and technology. J. Non- Cryst. Solids. 1991, 129, 152–162. [Google Scholar] [CrossRef]
- Shakhgildyan, G.; Avakyan, L.; Ziyatdinova, M.; Atroshchenko, G.; Presnyakova, N.; Vetchinnikov, M.; Lipatiev, A.; Bugaev, L.; Sigaev, V. Tuning the plasmon resonance of gold nanoparticles in phase-separated glass via the local refractive index change. J. Non-Cryst. Solids, 2021, 566, 120893. [Google Scholar] [CrossRef]
- Shakhgildyan, G.; Durymanov, V. , Ziyatdinova, M.; Atroshchenko, G.; Golubev, N.; Trifonov, A.; Chereuta, O.; Avakyan, L.; Bugaev, L.; Sigaev, V. Effect of gold nanoparticles on the crystallization and optical properties of glass in ZnO-MgO-Al2O3-SiO2 system. Crystals, 2022, 12, 287. [Google Scholar] [CrossRef]
- Wisniewski, W.; Thieme, K.; Rüssel, C. Fresnoite glass-ceramics – A review. Prog. Mater. Sci. 2018, 98, 68–107. [Google Scholar] [CrossRef]
- Keding, R.; Rüssel, C. Electrochemical nucleation for the preparation of oriented glass ceramics. J. Non-Cryst. Solids. 1997, 219, 136–141. [Google Scholar] [CrossRef]
- Höche, T.; Kleebe, H.-J.; Brydson, R. Can fresnoite (Ba2TiSi2O8) incorporate Ti3+ when crystallizing from highly reduced melts? Philos. Mag. A. 2001, 81, 825–839. [Google Scholar] [CrossRef]
- Eremeev, K.; Dymshits, O.; Alekseeva, I.; Khubetsov, A.; Zapalova, S.; Tsenter, M.; Basyrova, L.; Serres, J.M.; Mateos, X.; Loiko, P.; Popkov, V.; Zhilin, A. Effect of redox conditions of glass melting on the structure and the properties of titanium-containing gahnite glass-ceramics. J. Eur. Ceram. Soc. 2024, 44, 3362–3380. [Google Scholar] [CrossRef]
- Eremeev, K.N.; Dymshits, O.S.; Alekseeva, I.P.; Khubetsov, A.A.; Tsenter, M.Ya.; Zapalova, S.S.; Basyrova, L.R.; Loiko, P.A.; Zhilin, A.A. Synthesis, structure and spectral properties of transparent glass-ceramics based on nanocrystals of zinc aluminate spinel doped with Ti3+ ions. Opt. Spectrosc. 2024, 132, 152–158. [Google Scholar] [CrossRef]
- Lipatiev, A.; Fedotov, S.; Lotarev, S.; Naumov, A.; Lipateva, T.; Savinkov, V.; Shakhgildyan, G.; Sigaev, V. Direct laser writing of depressed-cladding waveguides in extremely low expansion lithium aluminosilicate glass-ceramics. Opt. Laser Technol. 2021 138, 106846. [CrossRef]
- Alekseeva, I.P.; Bobovich, Y.S.; Tsenter, M.Y.; Chuvaeva, T.I. Raman spectra of glass ceramics belonging to the Li2O-Al2O3-SiO2-TiO2 system and the nature of the phases containing titanium. J. Appl. Spectrosc. 1981, 35, 1008–1012. [Google Scholar] [CrossRef]
- Lipson, H.; Steeple, H. Interpretation of X-Ray Powder Patterns; McMillan, London, N.Y., 1970; p. 344.
- Schneider, C.A.; Rasband, W.S.; Eliceiri, K.W. NIH Image to ImageJ: 25 years of image analysis. Nat. Methods. 2012, 9, 671–675. [Google Scholar] [CrossRef] [PubMed]
- Ovono Ovono, D. , Berre S., Pradeau P., Comte M., Bruno G., Study of the crystallization kinetics of LAS glass by differential scanning calorimetry, X-ray diffraction, and beam bending viscometry. Thermochimica Acta. 2012, 527, 158–164. [Google Scholar] [CrossRef]
- Ovono Ovono, D.; Bruno, G.; Pradeau, P.; Berre, S. Conditions for crystallization of LAS glass-ceramics as a function of nucleating agent amount and heat treatment. Int. J. Appl. Glass Sci. 2013, 4, 20–30. [Google Scholar] [CrossRef]
- Shirasuka, K.; Yanagida, H.; Yamaguchi, G. The preparation of η-alumina and its structure. Mater. Sci. 1976, 84, 610–613. [Google Scholar] [CrossRef]
- Zhou, R.-S.; Snyder, R.L. Structures and transformation mechanisms of the η, γ and θ transition aluminas. Acta Cryst. 1991, B47, 617–630. [Google Scholar] [CrossRef]
- Skala, R.D.; Li, D.; Low, I.M. Diffraction, structure and phase stability studies on aluminium titanate. J. Eur. Ceram. Soc. 2009, 29, 67–75. [Google Scholar] [CrossRef]
- Galeeener, F.L.; Leadbetter, A.J.; Stringfellow, M.W. Comparison of the neutron, Raman and infrared vibrational spectra of vitreous SiO2, GeO2 and BeF2. Phys. Rev. B: Condens. Matter. 1983, 27, 1052–1078. [Google Scholar] [CrossRef]
- Bobovich, Ya.S. Spectroscopic invistigation of titanium coordination in some vitreous materials. Opt. Spectrosk. 1963, 14, 647–654. [Google Scholar]
- Thomas, P.V.; Ramakrishnan, V.; Vaidyan, V.K. Oxidation studies of aluminum thin films by Raman spectroscopy. Thin Solid Films. 1989, 170, 35–40. [Google Scholar] [CrossRef]
- Baronskiy, M.; Rastorguev, A.; Zhuzhgov, A.; Kostyukov, A.; Krivoruchko, O.; Snytnikov, V. Photoluminescence and Raman spectroscopy studies of low-temperature γ-Al2O3 phases synthesized from different precursors. Opt. Mater. 2016, 53, 87–93. [Google Scholar] [CrossRef]
- Liu, Y.; Cheng, B.; Wang, K.; Ling, G.; Cai, J.; Song, C.; Han, G. Study of Raman spectra for γ-Al2O3 models by using first-principles method. Solid State Commun. 2014, 178, 16–22. [Google Scholar] [CrossRef]
- Basyrova, L.; Bukina, V.; Balabanov, S.; Belyaev, A.; Drobotenko, V.; Dymshits, O.; Alekseeva, I.; Tsenter, M.; Zapalova, S.; Khubetsov, A.; Zhilin, A.; Volokitina, A.; Vitkin, V.; Mateos, X.; Serres, J.M.; Camy, P.; Loiko, P. Synthesis, structure and spectroscopy of Fe2+:MgAl2O4 transparent ceramics and glass-ceramics. J. Lumin. 2021, 236, 118090–1. [Google Scholar] [CrossRef]
- Sharma, K.; Simons, B. Raman study of crystalline polymorphs and glasses of spodumene composition quenched from various pressures. Am. Mineral. 1981, 66, 118–126. [Google Scholar]
- Alekseeva, I.; Dymshits, O.; Ermakov, V.; Zhilin, A.; Petrov, V.; Tsenter, M. Raman spectroscopy quantifying the composition of stuffed β-quartz derivative phases in lithium aluminosilicate glass-ceramics. J. Non-Cryst. Solids. 2008, 354, 4932–4939. [Google Scholar] [CrossRef]
- Dymshits, O.; Vitkin, V.; Alekseeva, I.; Khubetsov, A.; Tsenter, M.; Polishchuk, A.; Volokitina, A.; Serres, J.M.; Mateos, X.; Zhilin, A.; Loiko, P. Transparent glass-ceramics based on Co2+-doped γ-GaxAl2−xO3 spinel nanocrystals for passive Q-switching of Er lasers. J. Lumin. 2021, 234, 117993. [Google Scholar] [CrossRef]
- Sprengard, R.; Binder, K.; Brandle, M.; Fotheringham, U.; Sauer, J.; Pannhorst, W. On the interpretation of the experimental Raman spectrum of β-eucryptite LiAlSiO4 from atomistic computer modeling. J. Non-Cryst. Solids. 2000, 274, 264–270. [Google Scholar] [CrossRef]
- Alekseeva, I.P.; Belyaevskaya, N.M.; Bobovich, Ya.S.; Tsenter, M.Ya.; Chuvaeva, T.I. Study of crystallization of glasses activated with TiO2 and ZrO2. Izv. Akad. Nauk SSSR, Neorg. Mater. 1980, 16, 1587–1592. [Google Scholar]
- Bost, N.; Duraipandian, S.; Guimbretière, G.; Poirier, J. Raman spectra of synthetic and natural mullite. Vib. Spectrosc. 2016, 82, 50–52. [Google Scholar] [CrossRef]
- Chavoutier, M.; Caurant, D.; Majérus, O.; Boulesteix, R.; Loiseau, P.; Jousseaume, C.; Brunet, E.; Lecomte, E. Effect of TiO2 content on the crystallization and the color of (ZrO2,TiO2)-doped Li2O-Al2O3-SiO2 glasses. J. Non-Cryst. Solids. 2014, 384, 15–24. [Google Scholar] [CrossRef]
- Loeffler, B.M.; Burns, R.G.; Tossell, J.A.; Vaughan, D.J.; Johnson, K.H. Charge transfer in lunar materials: interpretation of ultraviolet-visible spectral properties of the moon. Proc. Lunar Planet Sci. Conf. 1974, 5, 3007–3016. [Google Scholar]
- Marfunin, A.S. Physics of Minerals and Inorganic Materials: an Introduction, Springer-Verlag Berlin, Heidelberg, NY, USA, 1979; p. 340.
- Petrovski, G.T.; Zhilin, A.A.; Shepilov, M.P.; B’en, V.B.; Li, K.K. Nonmonotonic transmittance variation of a material during the crystallization of liquating glasses. J. Opt. Technol. 2003, 70, 857–863. [Google Scholar] [CrossRef]
- Sanchez, A.; Strauss, A.J.; Aggarwal, R.L.; Fahey, R.E. Crystal Growth, Spectroscopy, and laser characteristics of Ti:Al2O3. IEEE, J. Quantum Electron. 1988, 24, 995–1002. [Google Scholar] [CrossRef]
- Ripenko, V.V.; Khomenko, V.M.; Vyshnevskyi, O.A.; Kosorukov, O.O. Synthesis and physical properties of Li-Al-Si glass-ceramic materials from petalite of Polohivka Deposit (the Ukrainian Shield). Mineral. Journ. (Ukraine). 2017, 39, 53–62. [Google Scholar] [CrossRef]
- Moulton, P.F.; Cederberg, J.G.; Stevens, K.T.; Foundos, G.; Koselja, M; Preclikova, J. Characterization of absorption bands in Ti:sapphire crystals. Opt. Mater. Express. 2019, 9, 2216–2251. [Google Scholar] [CrossRef]
- Mohapatra, S.K.; Kröger, F.A. ; Defect structure of α-Al2O3 doped with titanium. J. Am. Ceram. Soc. 1977, 60, 381–387. [Google Scholar] [CrossRef]
- Golubkov, V.V.; Dymshits, O.S.; Zhilin, A.A.; Chuvaeva, T.I.; Shashkin, A.V. On the Phase Separation and Crystallization of Glasses in the MgO–Al2O3–SiO2–TiO2 System. Glass Phys. Chem. 2003, 29, 254–266. [Google Scholar] [CrossRef]
- Golubkov, V.V.; Dymshits, O.S.; Petrov, V.I.; Shashkin, A.V.; Tsenter, M.Ya.; Zhilin, A.A.; Kang, Uk. Small-angle X-ray scattering and low-frequency Raman scattering study of liquid phase separation and crystallization in titania-containing glasses of the ZnO–Al2O3–SiO2 System, J. Non-Cryst. Solids. 2005, 351, 711–721. [Google Scholar] [CrossRef]
Figure 1.
Photographs of as-casted initial glasses with thickness of ca. 6 mm: (a) LAS; (b) LASox.
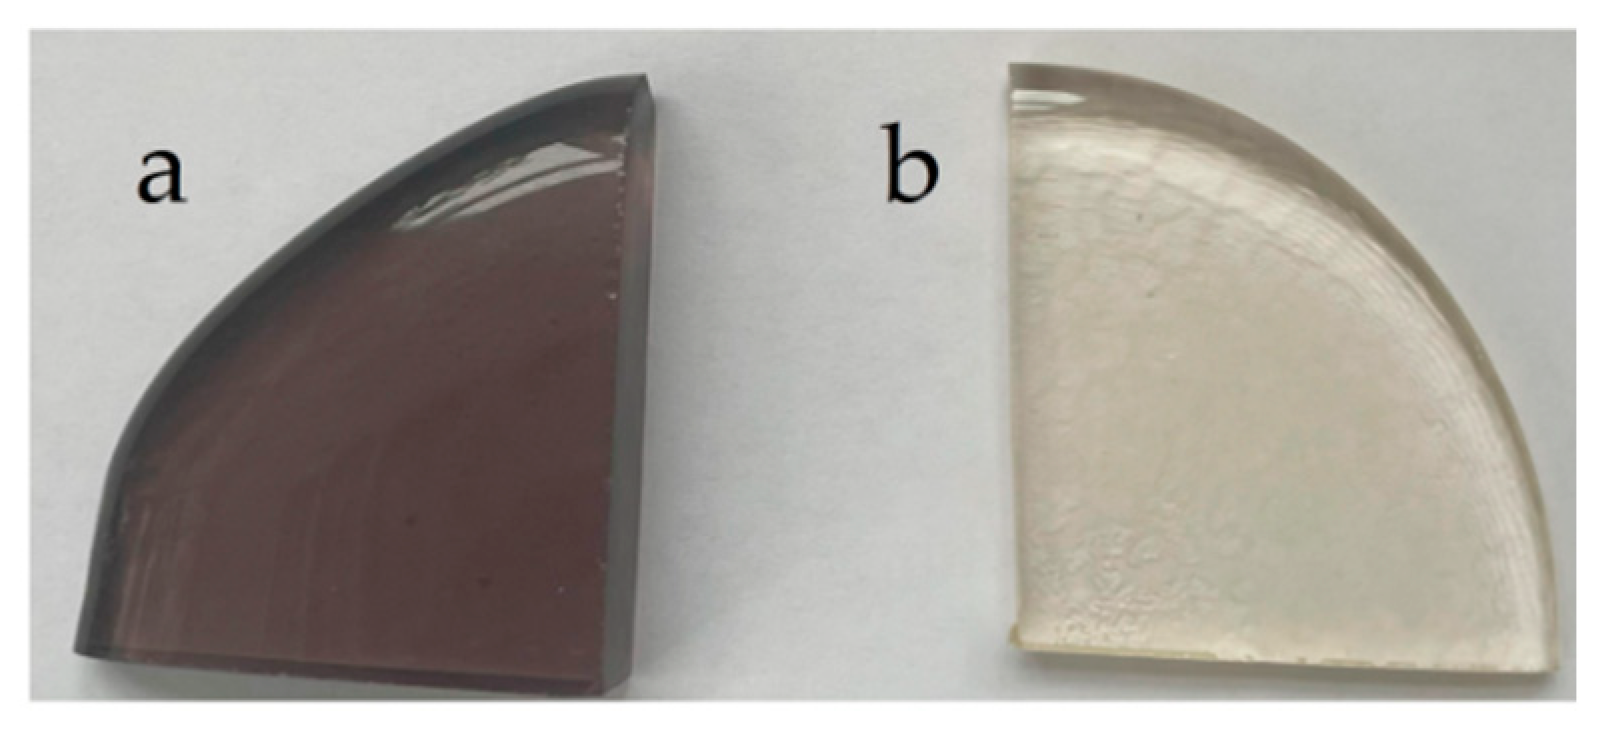
Figure 2.
Photographs of samples of the initial glasses, glasses obtained by the heat-treatment at 680 °C and glass-ceramics prepared by two stage heat-treatments with the first hold at 680 °C and the second hold ranging from 720 °C to 1200 °C: (a) LAS; (b) LASox. The heat-treatment schedules are shown in figures. Holding time at each stage is 6 h. The transparent polished plates have the thickness of 1 mm.
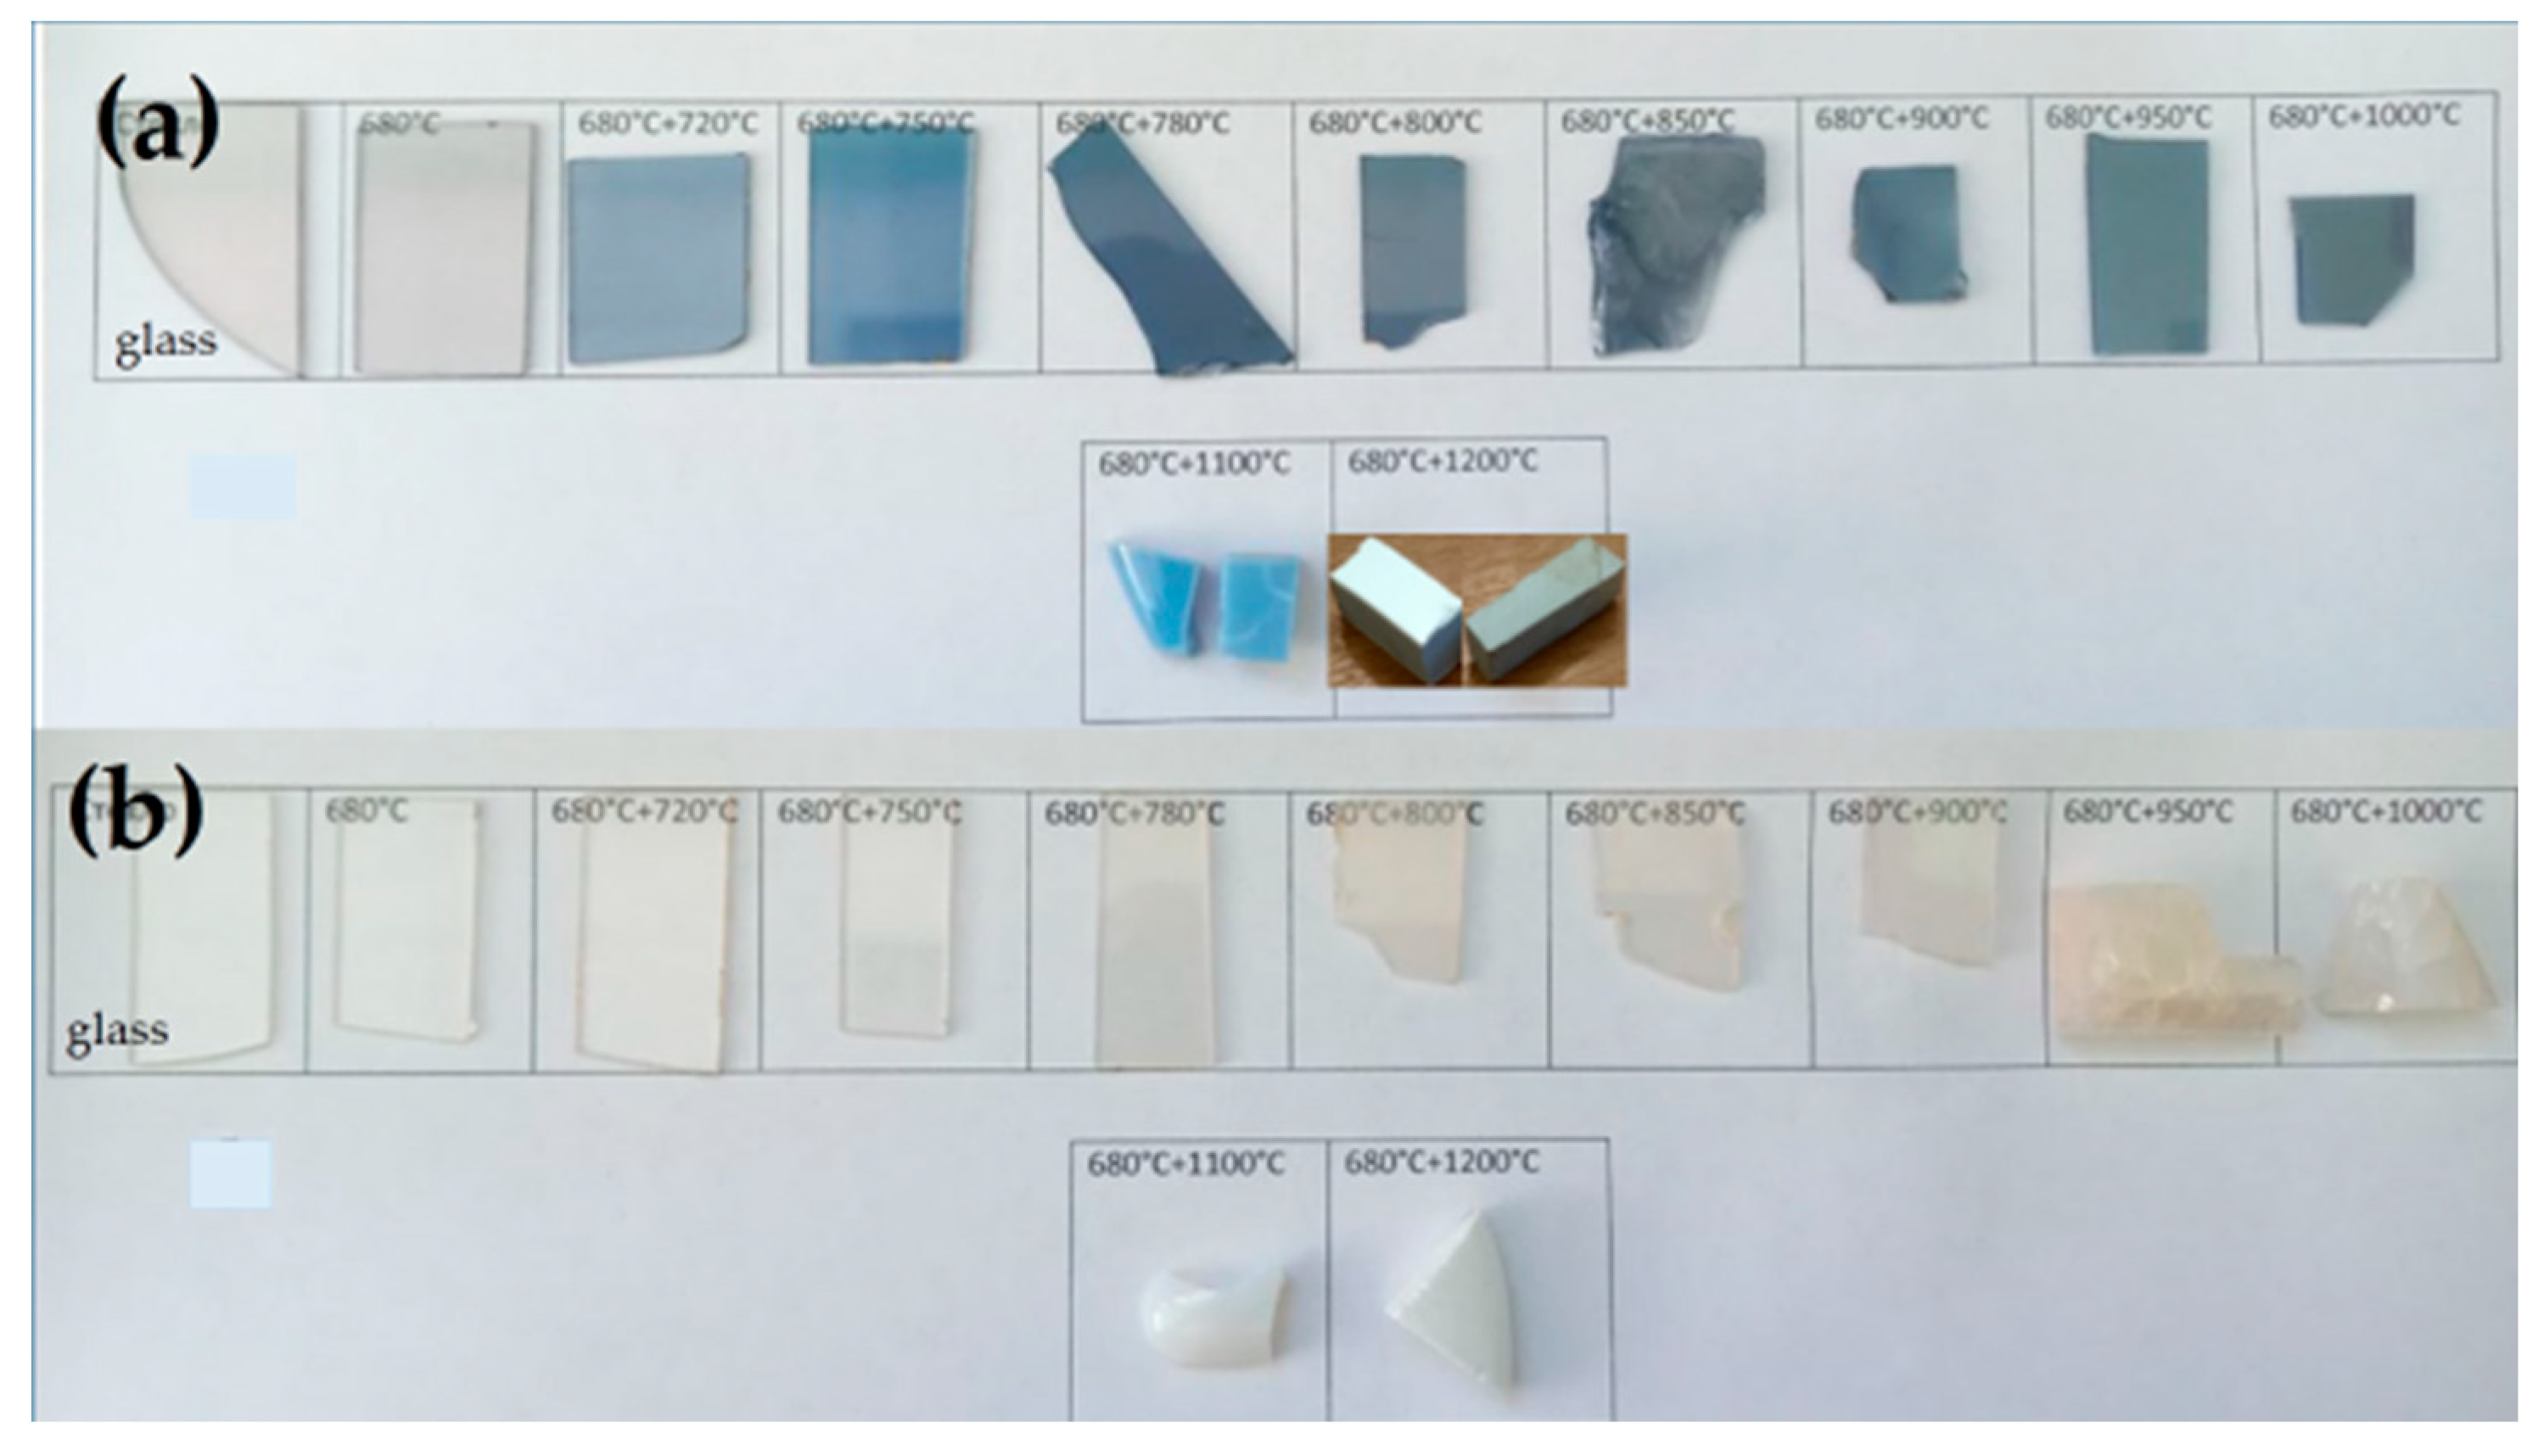
Figure 3.
DSC curves of quenched and heat-treated LAS and LASox glasses. Tg stands for the glass transition temperature, Ton stands for the onset crystallization temperature, Tmax stands for the maximum crystallization temperature The curves are shifted for the convenience of observation.
Figure 3.
DSC curves of quenched and heat-treated LAS and LASox glasses. Tg stands for the glass transition temperature, Ton stands for the onset crystallization temperature, Tmax stands for the maximum crystallization temperature The curves are shifted for the convenience of observation.
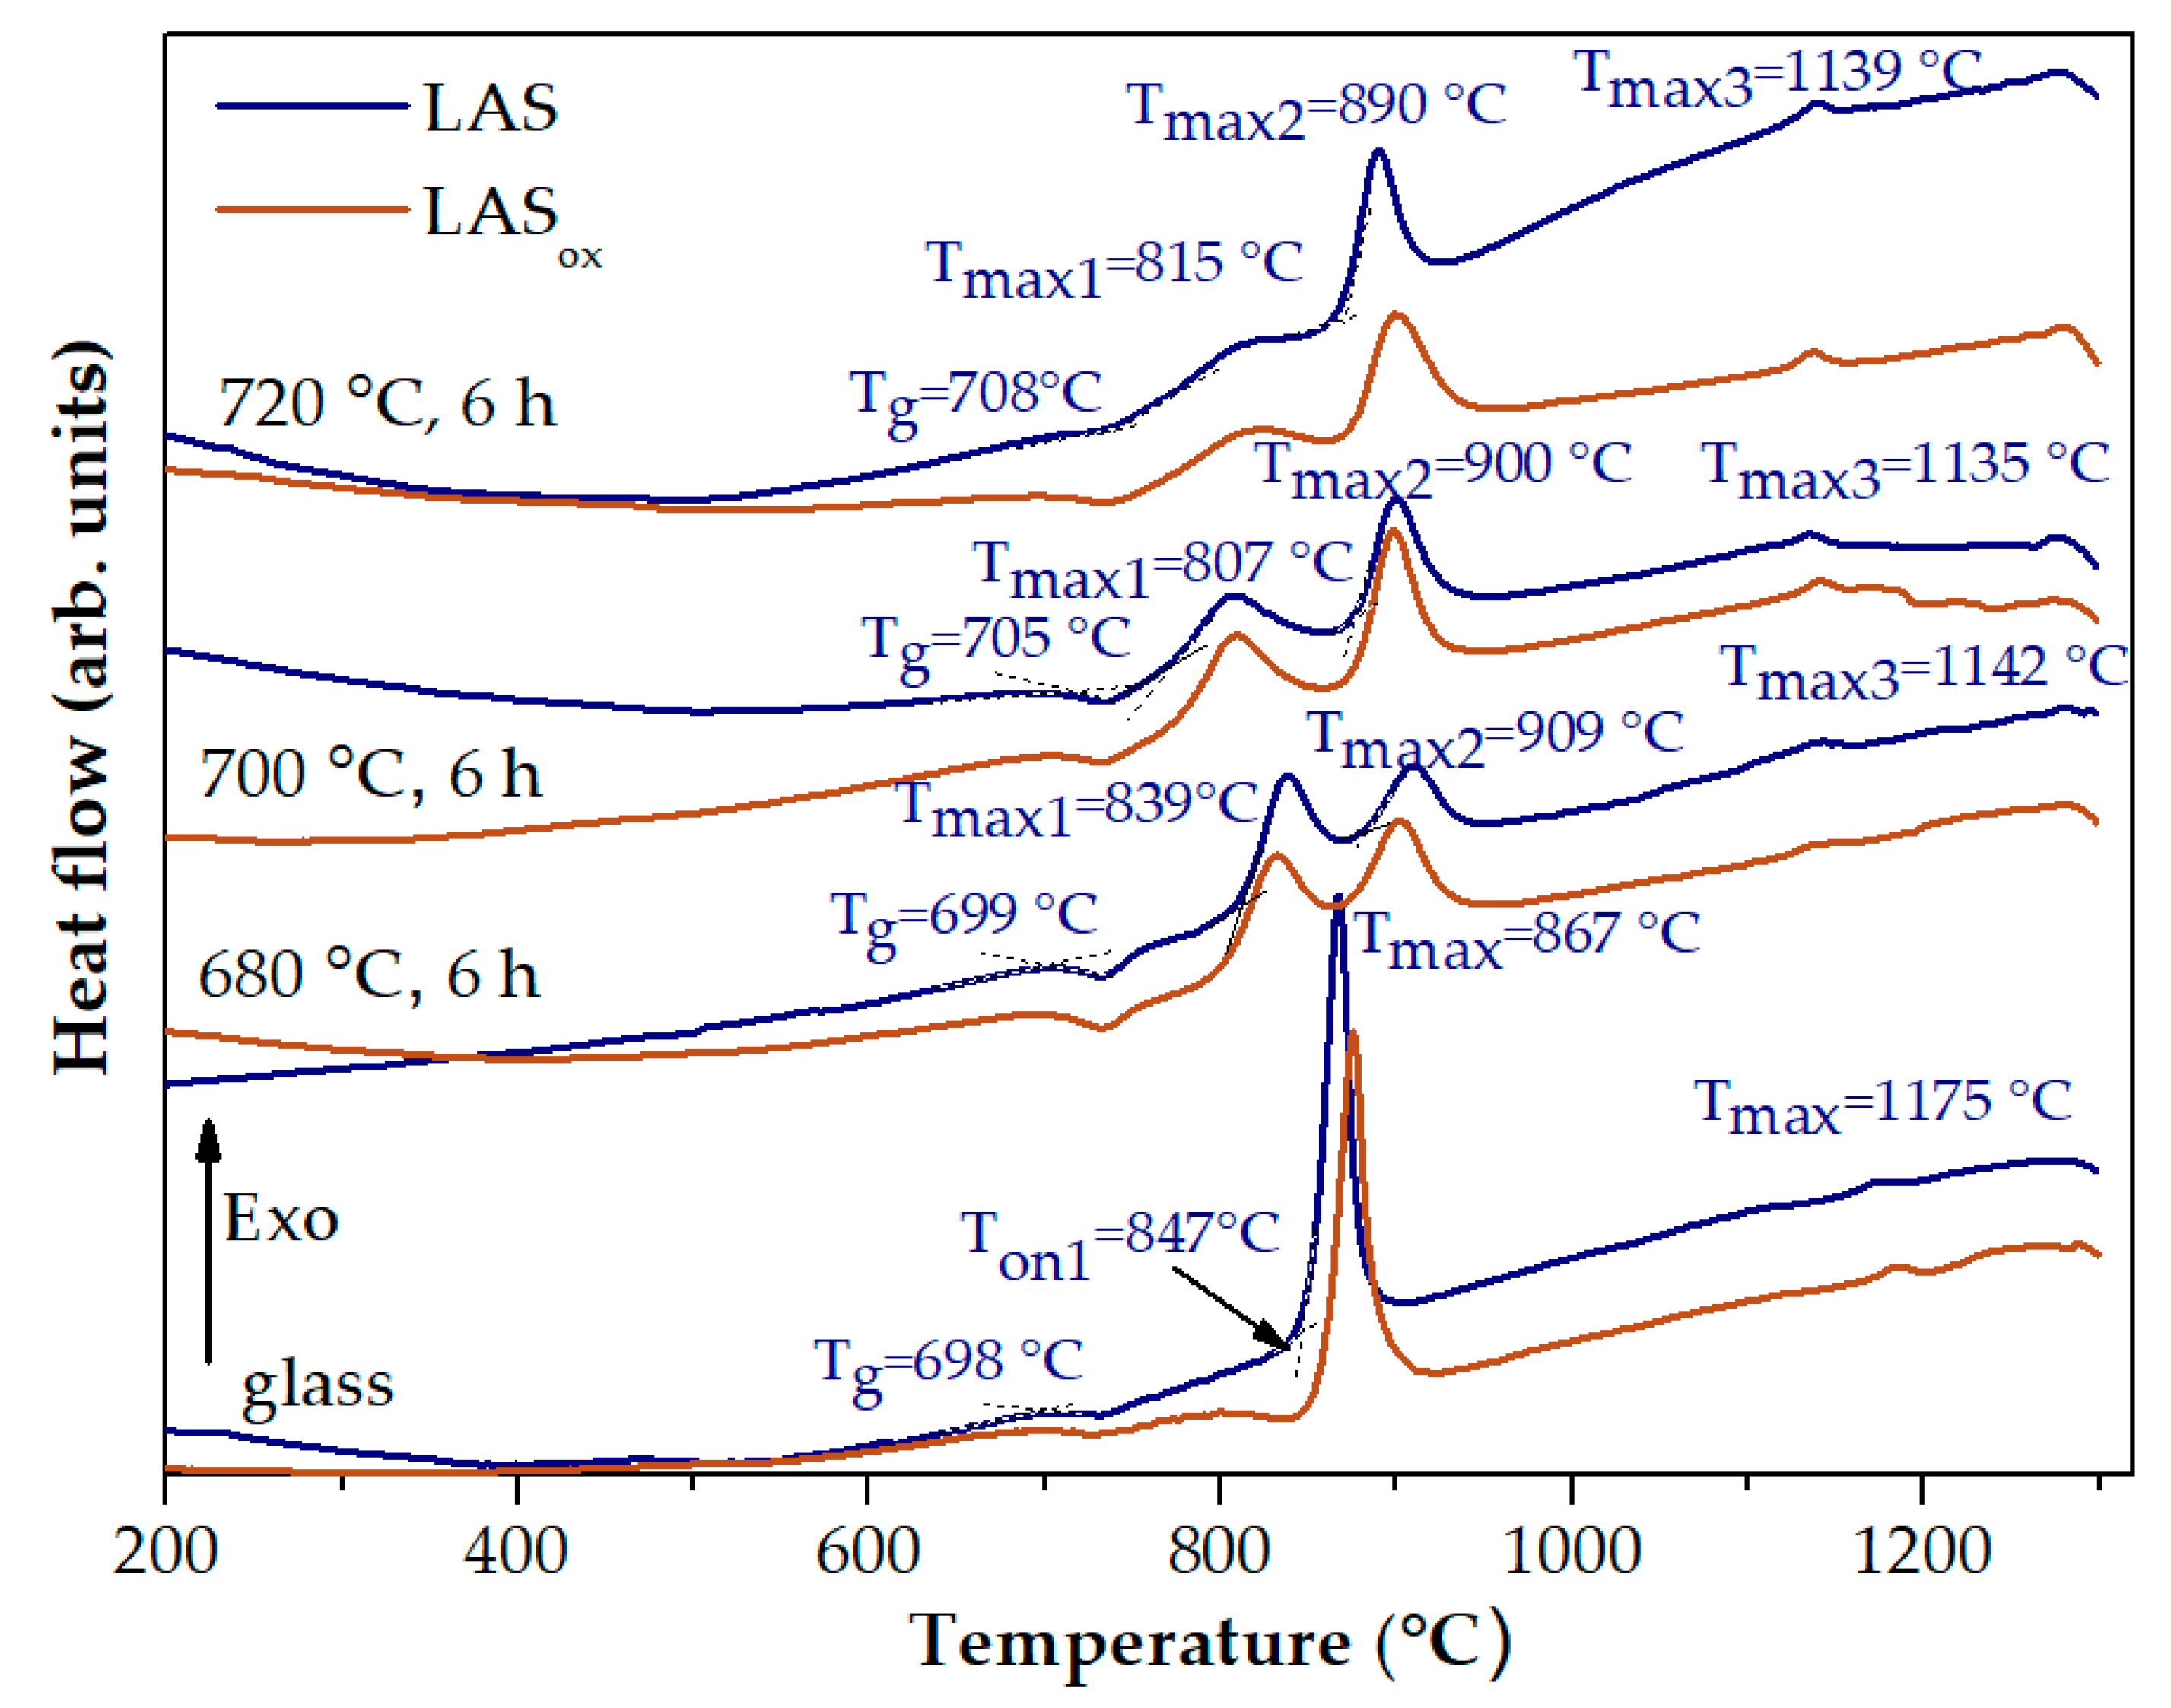
Figure 4.
(a) DSC curves of the quenched LAS glass with stops at temperatures of 880 °C and 1175 °C; (b) XRD patterns of thus obtained LAS glass-ceramics. The curves are shifted for the convenience of observation.
Figure 4.
(a) DSC curves of the quenched LAS glass with stops at temperatures of 880 °C and 1175 °C; (b) XRD patterns of thus obtained LAS glass-ceramics. The curves are shifted for the convenience of observation.
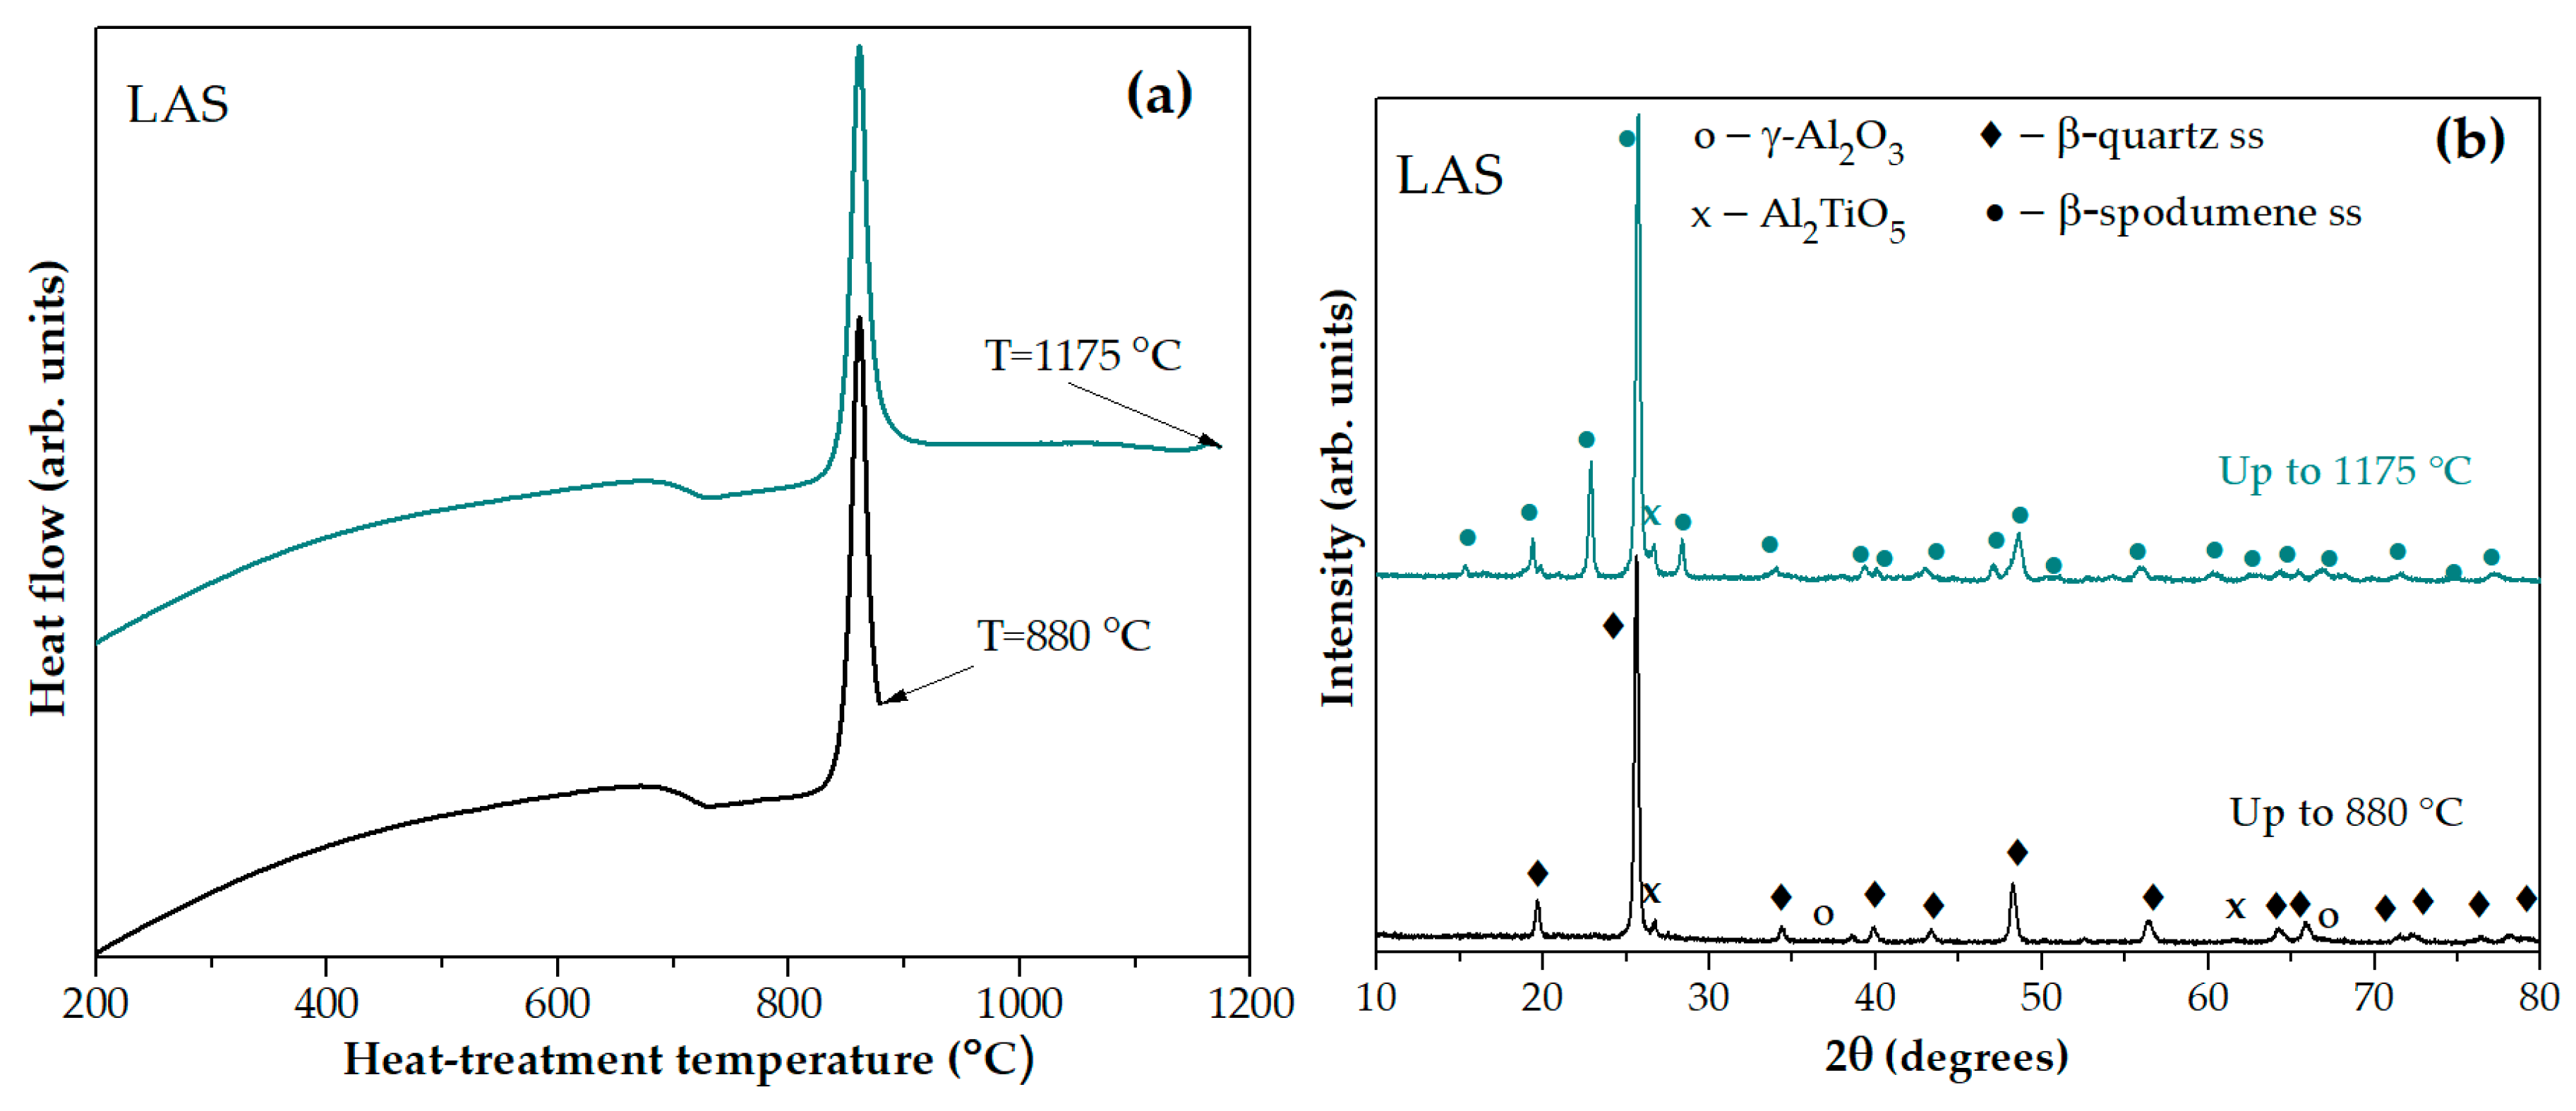
Figure 5.
(a) DSC curves of the LAS glass preliminary heat-treated at 680 °C for 6 h with stops at temperatures of 787 °С, 838 °С, 858 °С, and 935 °С; (b) XRD patterns of thus obtained LAS glass-ceramics. The curves are shifted for the convenience of observation.
Figure 5.
(a) DSC curves of the LAS glass preliminary heat-treated at 680 °C for 6 h with stops at temperatures of 787 °С, 838 °С, 858 °С, and 935 °С; (b) XRD patterns of thus obtained LAS glass-ceramics. The curves are shifted for the convenience of observation.
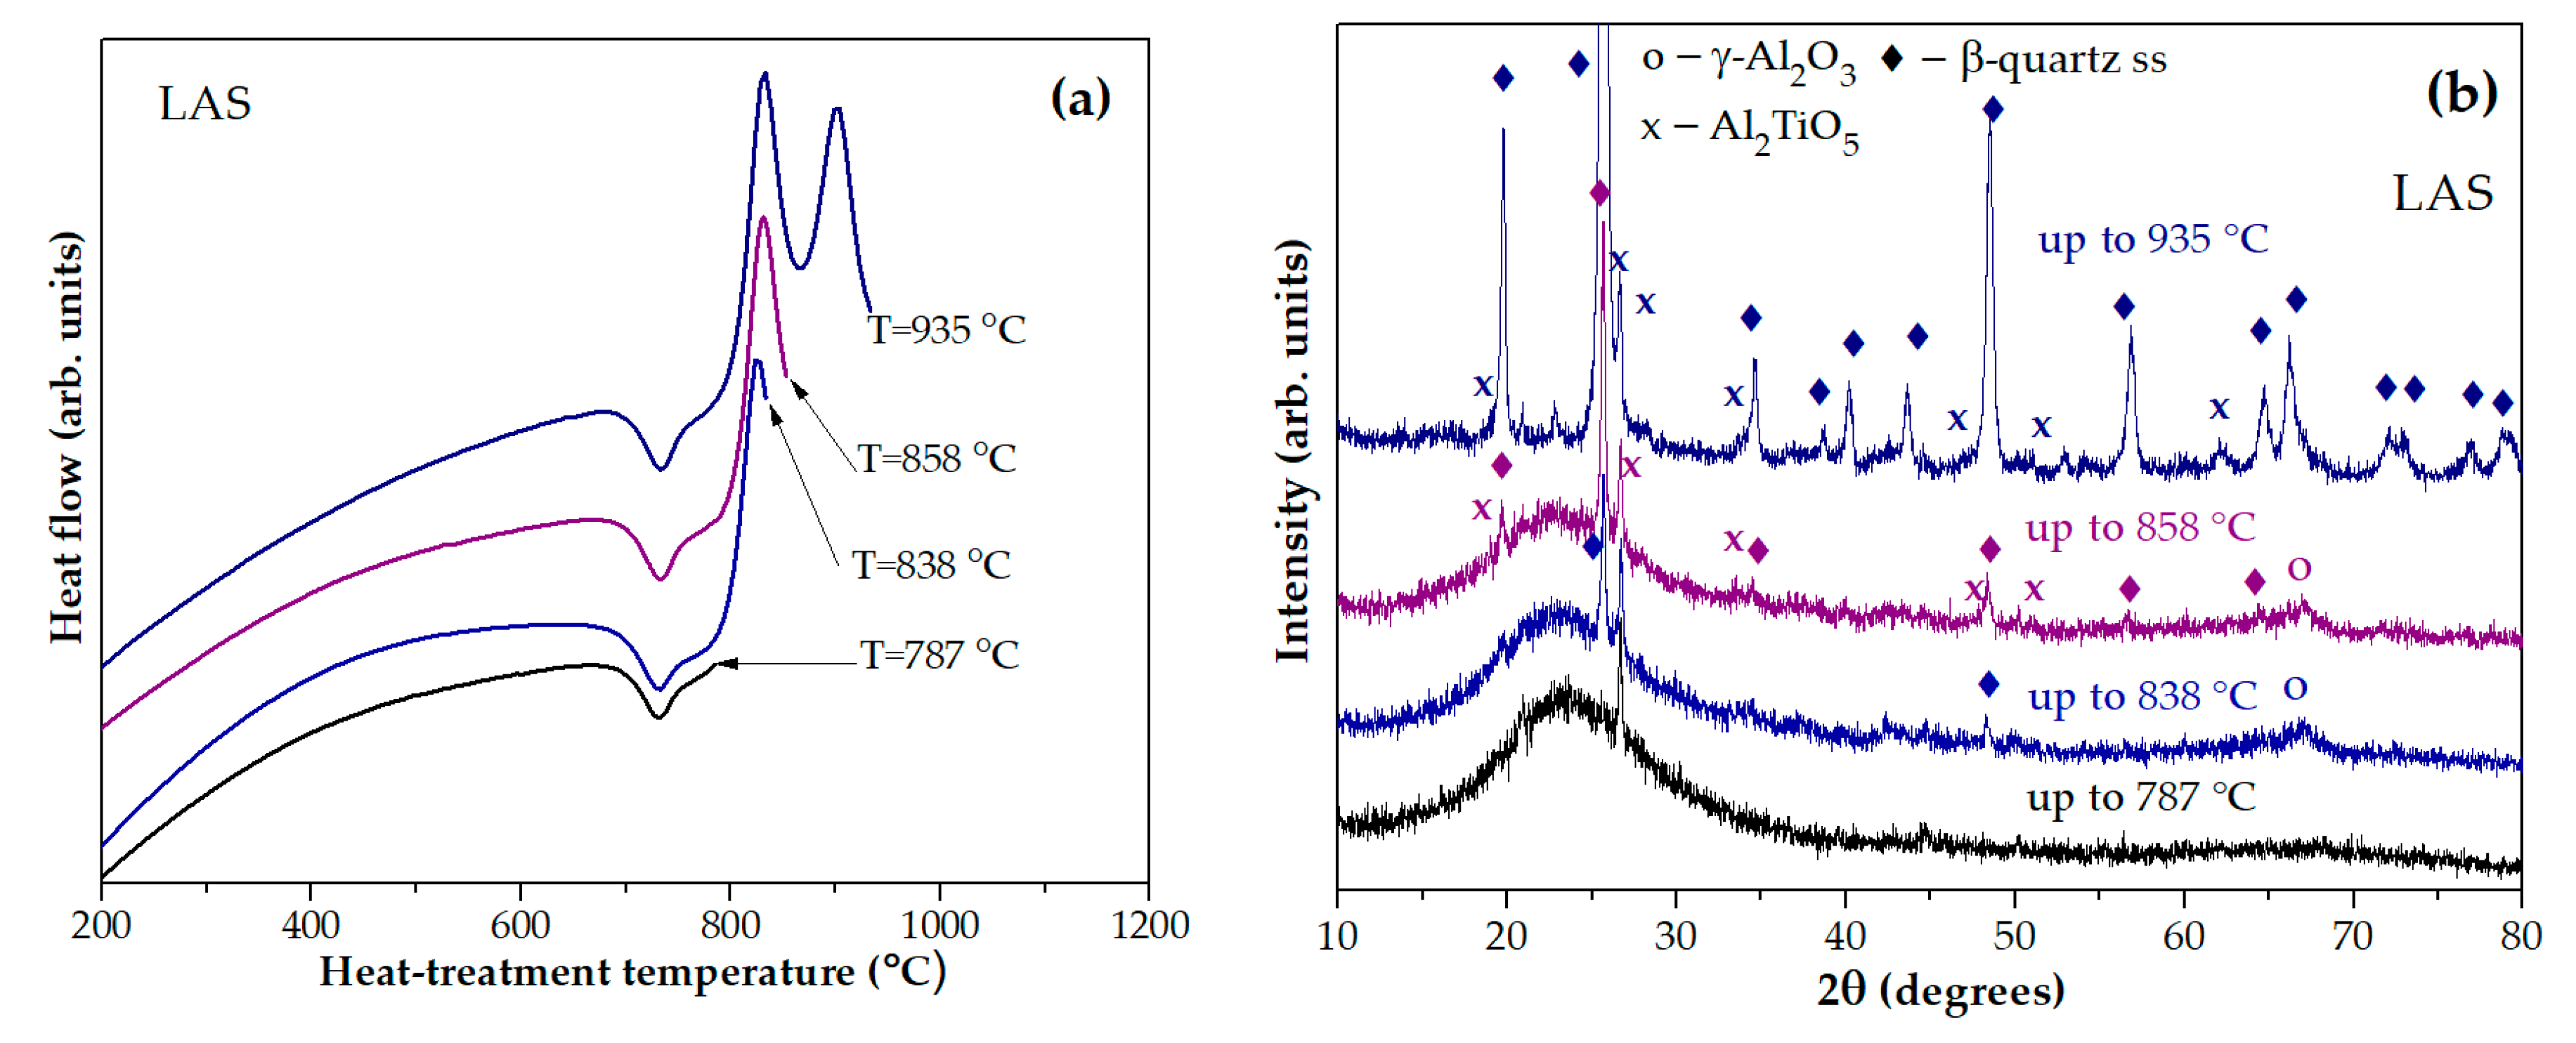
Figure 6.
XRD patterns of the LAS quenched glass and the glass preliminary heat-treated at 680 °C for 6 h and heated in the furnace of the DSC instrument. The heat-treatment schedules are denoted in the figure. The patterns are shifted for the convenience of observation.
Figure 6.
XRD patterns of the LAS quenched glass and the glass preliminary heat-treated at 680 °C for 6 h and heated in the furnace of the DSC instrument. The heat-treatment schedules are denoted in the figure. The patterns are shifted for the convenience of observation.
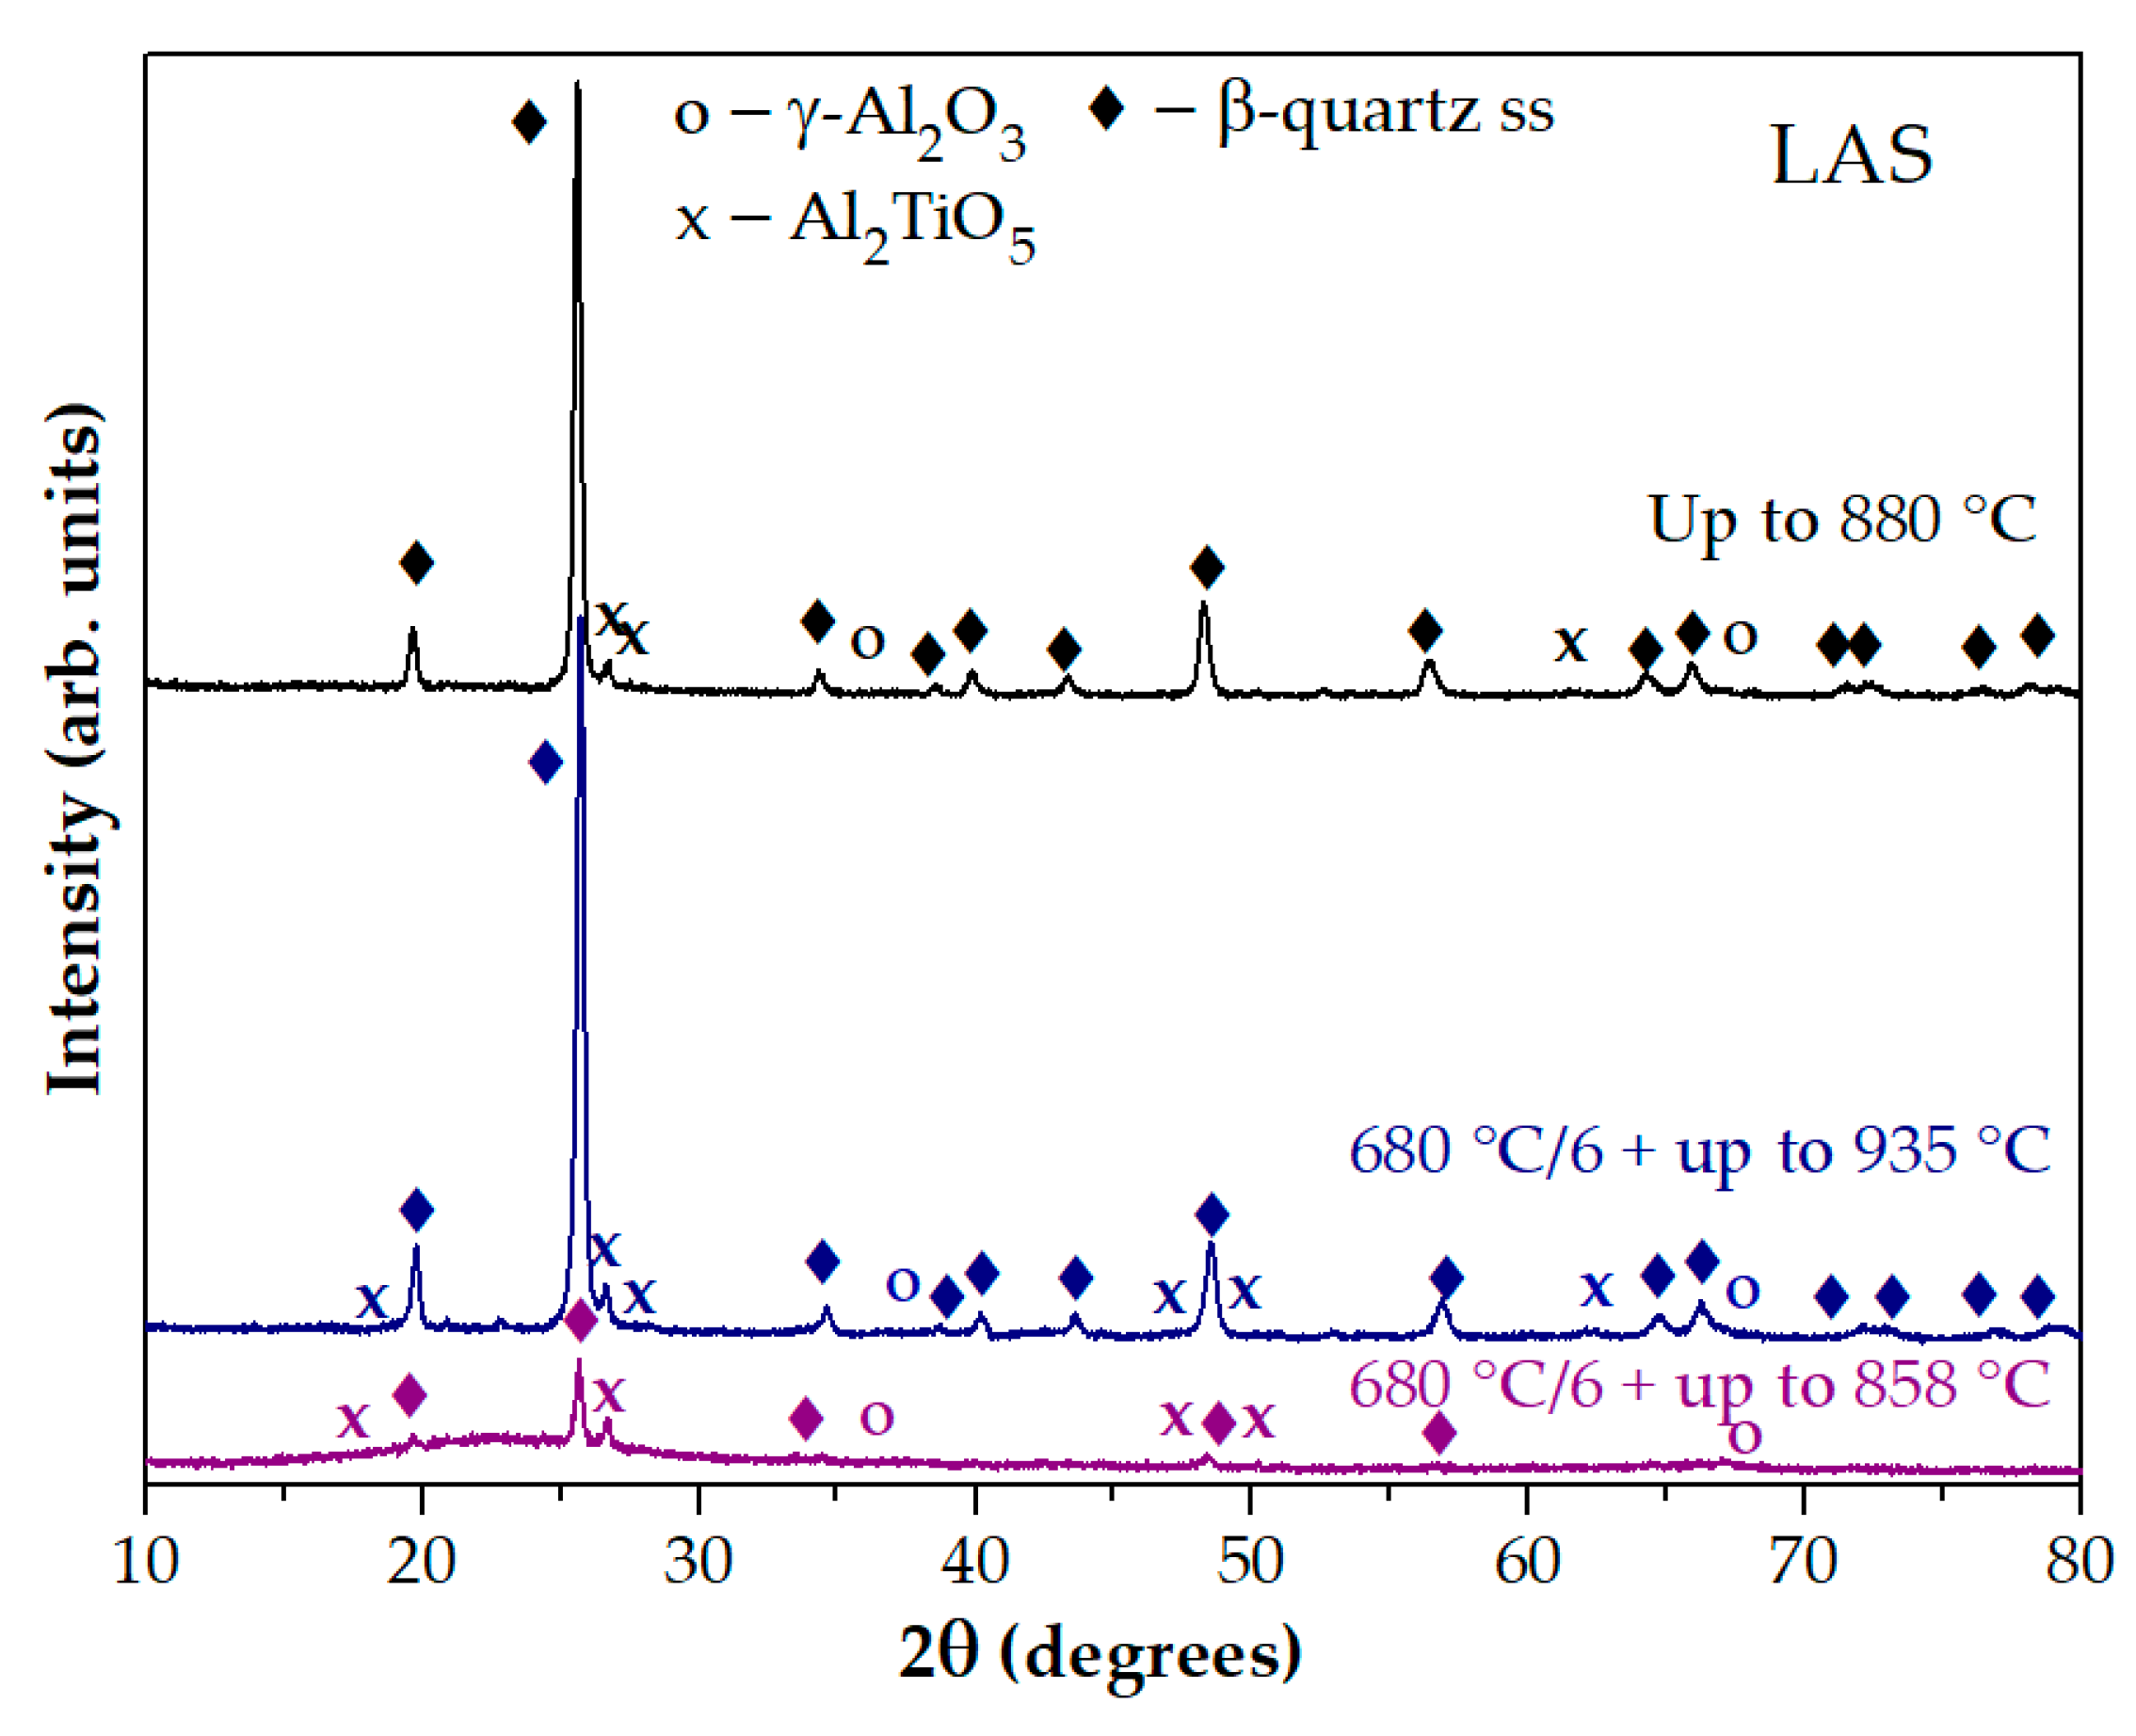
Figure 8.
XRD patterns of the LAS and the LASox glass-ceramics obtained by two stage heat-treatments at: (a) 680 °С, 6 h+780° С, 6 h; (b) 680 °С, 6 h+800° С, 6 h. The patterns are shifted for the convenience of observation.
Figure 8.
XRD patterns of the LAS and the LASox glass-ceramics obtained by two stage heat-treatments at: (a) 680 °С, 6 h+780° С, 6 h; (b) 680 °С, 6 h+800° С, 6 h. The patterns are shifted for the convenience of observation.
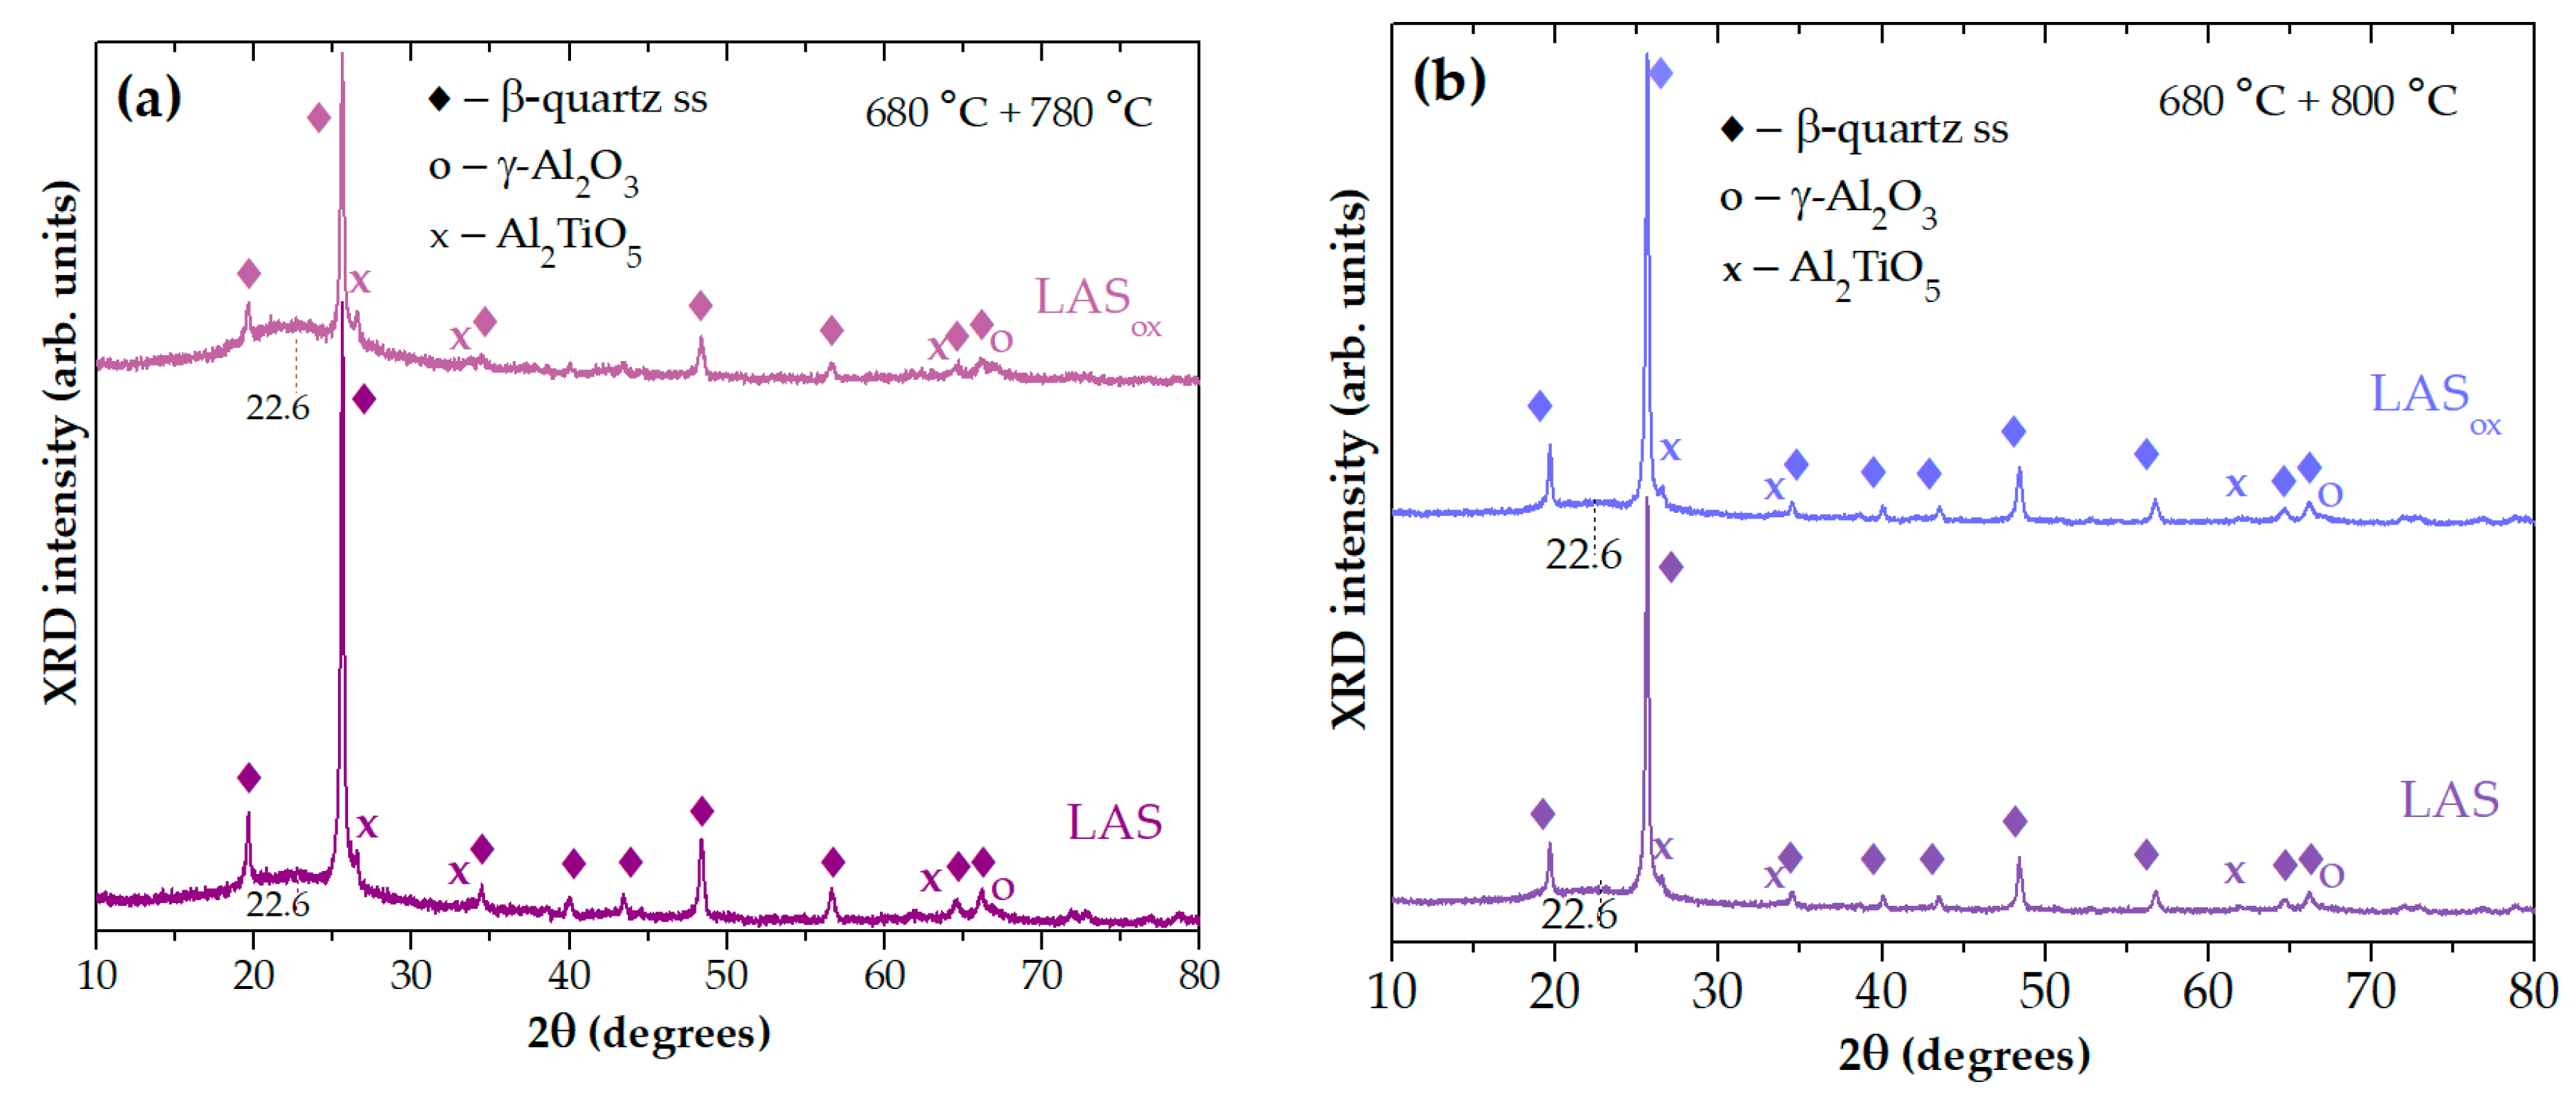
Figure 9.
Raman spectra of the LAS initial glass and glass-ceramics obtained by single and two stage heat-treatments: (a) from the initial glass to 1200 °C at the second stage; (b) from the initial glass up to 780 °C at the second stage; (c) from 800 °C up to 950 °C at the second stage; (d) from 1000 °C up to 1200 °C at the second stage. The holding time at each stage is 6 h. The spectra are shifted for the convenience of observation.
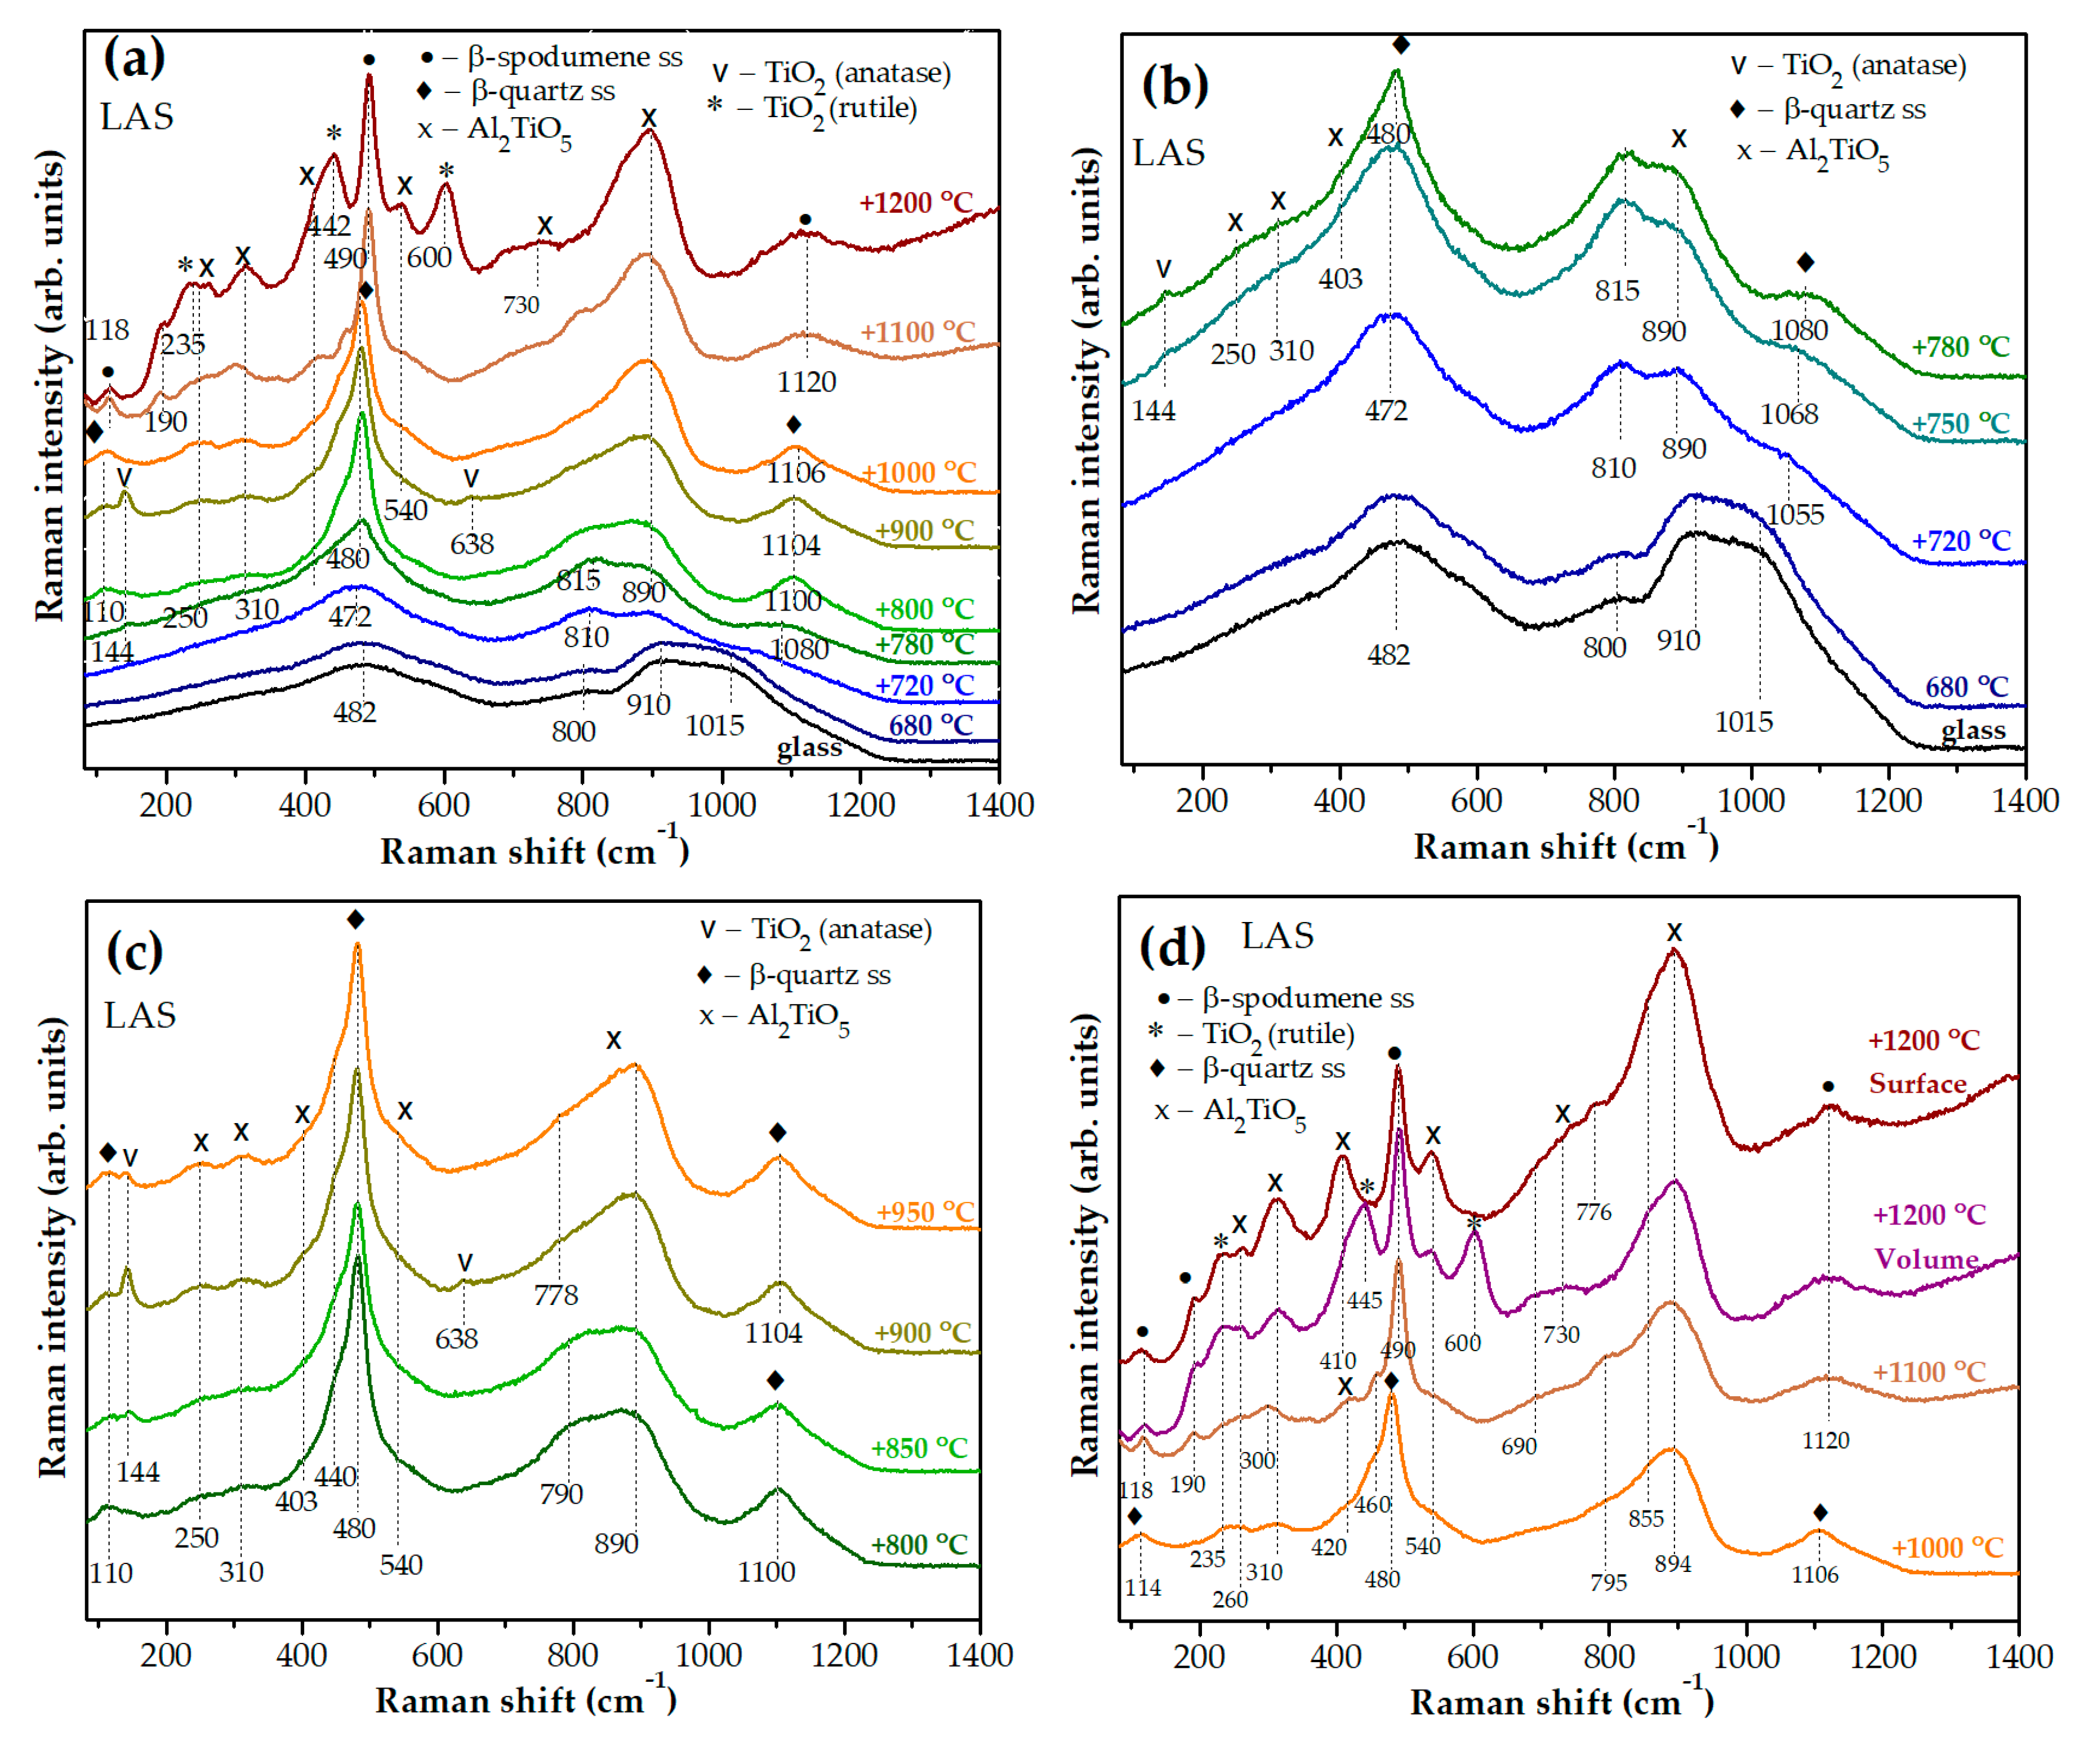
Figure 10.
Raman spectra the LAS and the LASox glass-ceramics obtained by two stage heat-treatments at: (a) 680 °C+720 °C; (b) 680 °C+780 °C; (c) 680 °C+900 °C; (d) 680 °C+950 °C; (e) 680 °C+1000 °C; (f) 680 °C+1200 °C. The holding time at each stage is 6 h. The spectra are shifted for the convenience of observation.
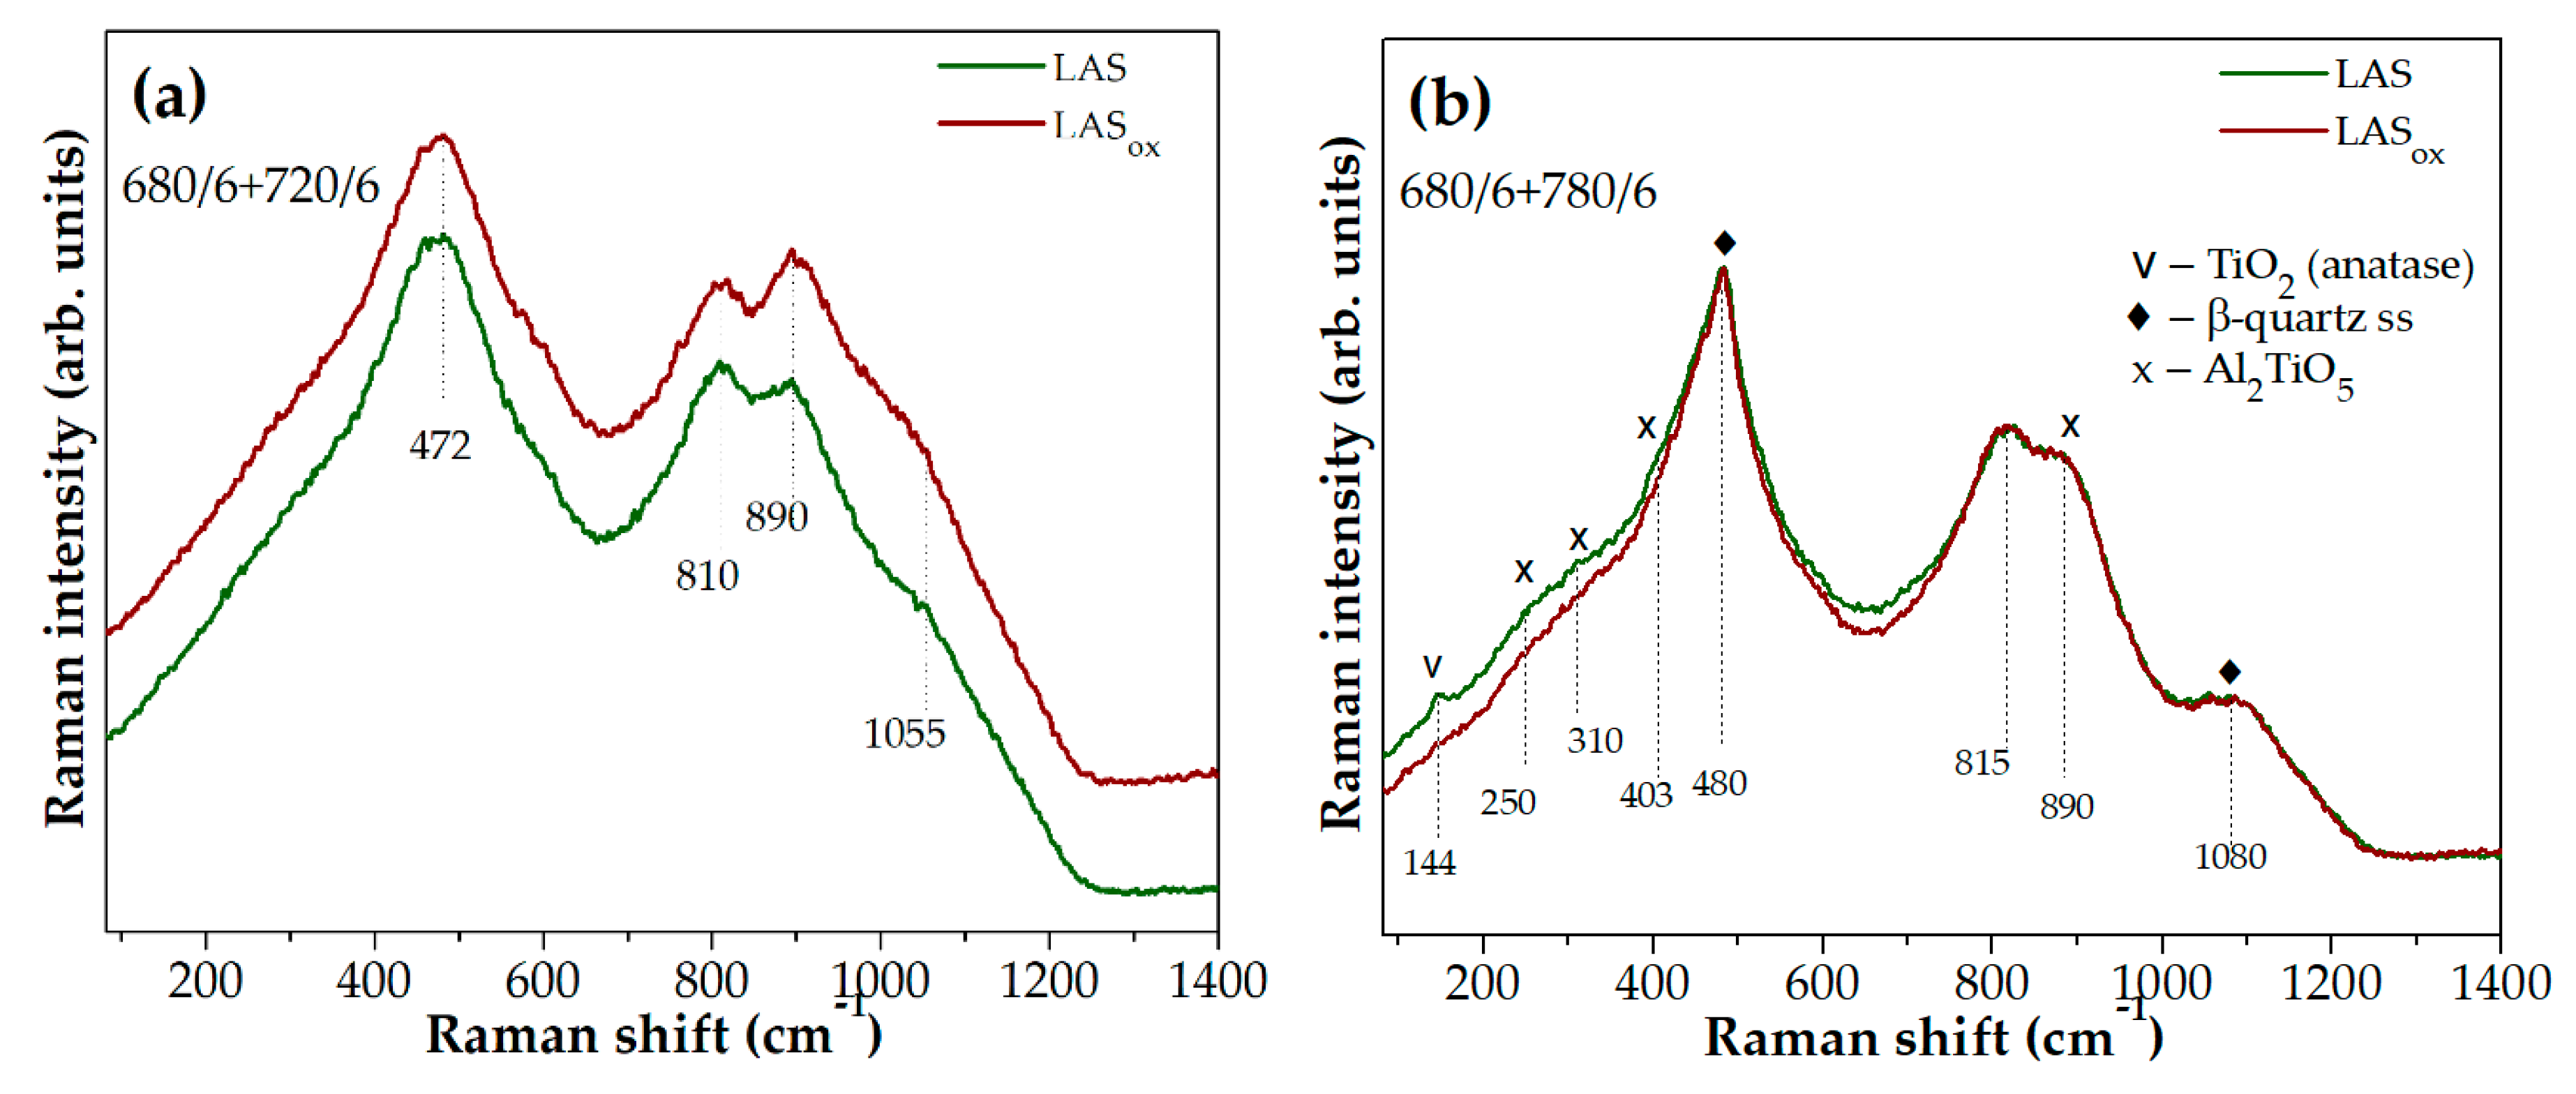
Figure 11.
SEM images of the samples of: (a) the initial LAS glass; (b) the LAS glass after heat-treatment at 680 °C; (c) the LAS glass ceramized at 680 °C and at 750 °C; (d) the LAS glass ceramized at 680 °C and at 780 °C; (e) the LASox glass ceramized at 680 °C and at 780 °C; (f) the LAS glass ceramized at 680 °C and at 800 °C; (g) the LAS glass ceramized at 680 °C and at 1000 °C; (h) the LAS glass ceramized at 680 °C and at 1200 °C. The duration of each hold is 6 h.
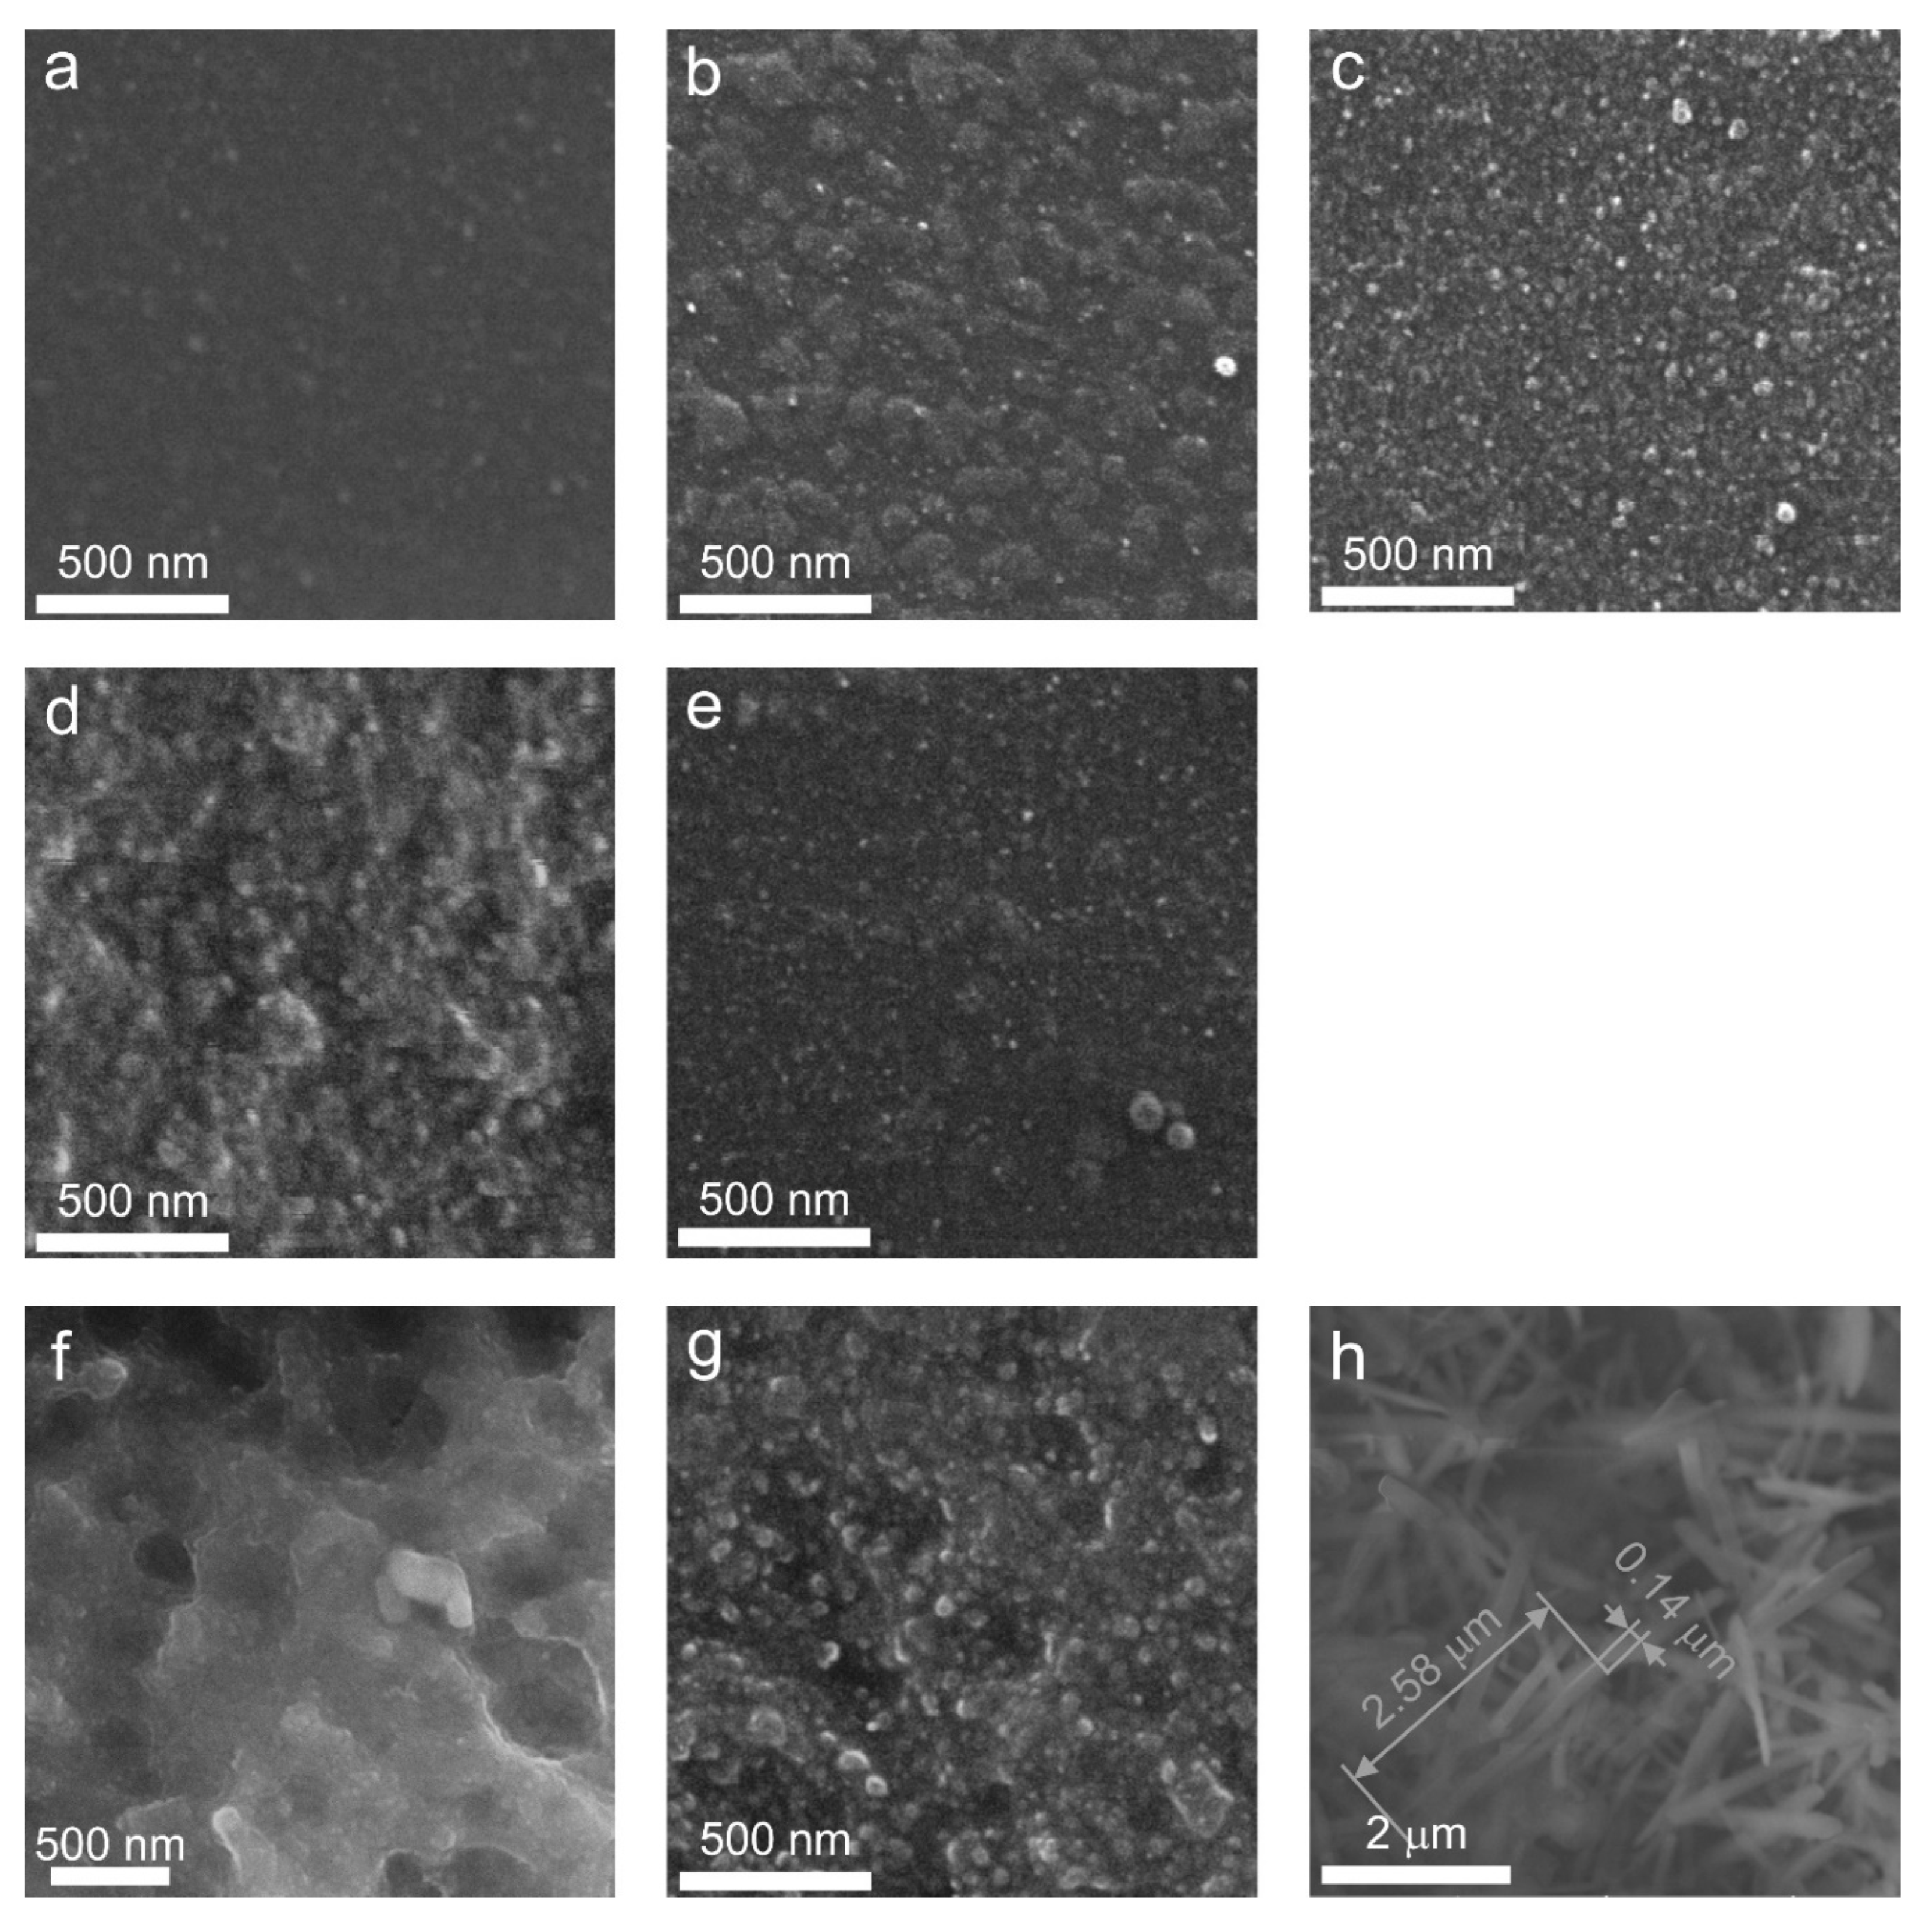
Figure 12.
Particle size distributions in the initial LAS glass and LAS and LASox glass-ceramics calculated from SEM data presented in Figure 11. Heat-treatment schedules and mean crystal sizes are listed in figure.
Figure 12.
Particle size distributions in the initial LAS glass and LAS and LASox glass-ceramics calculated from SEM data presented in Figure 11. Heat-treatment schedules and mean crystal sizes are listed in figure.
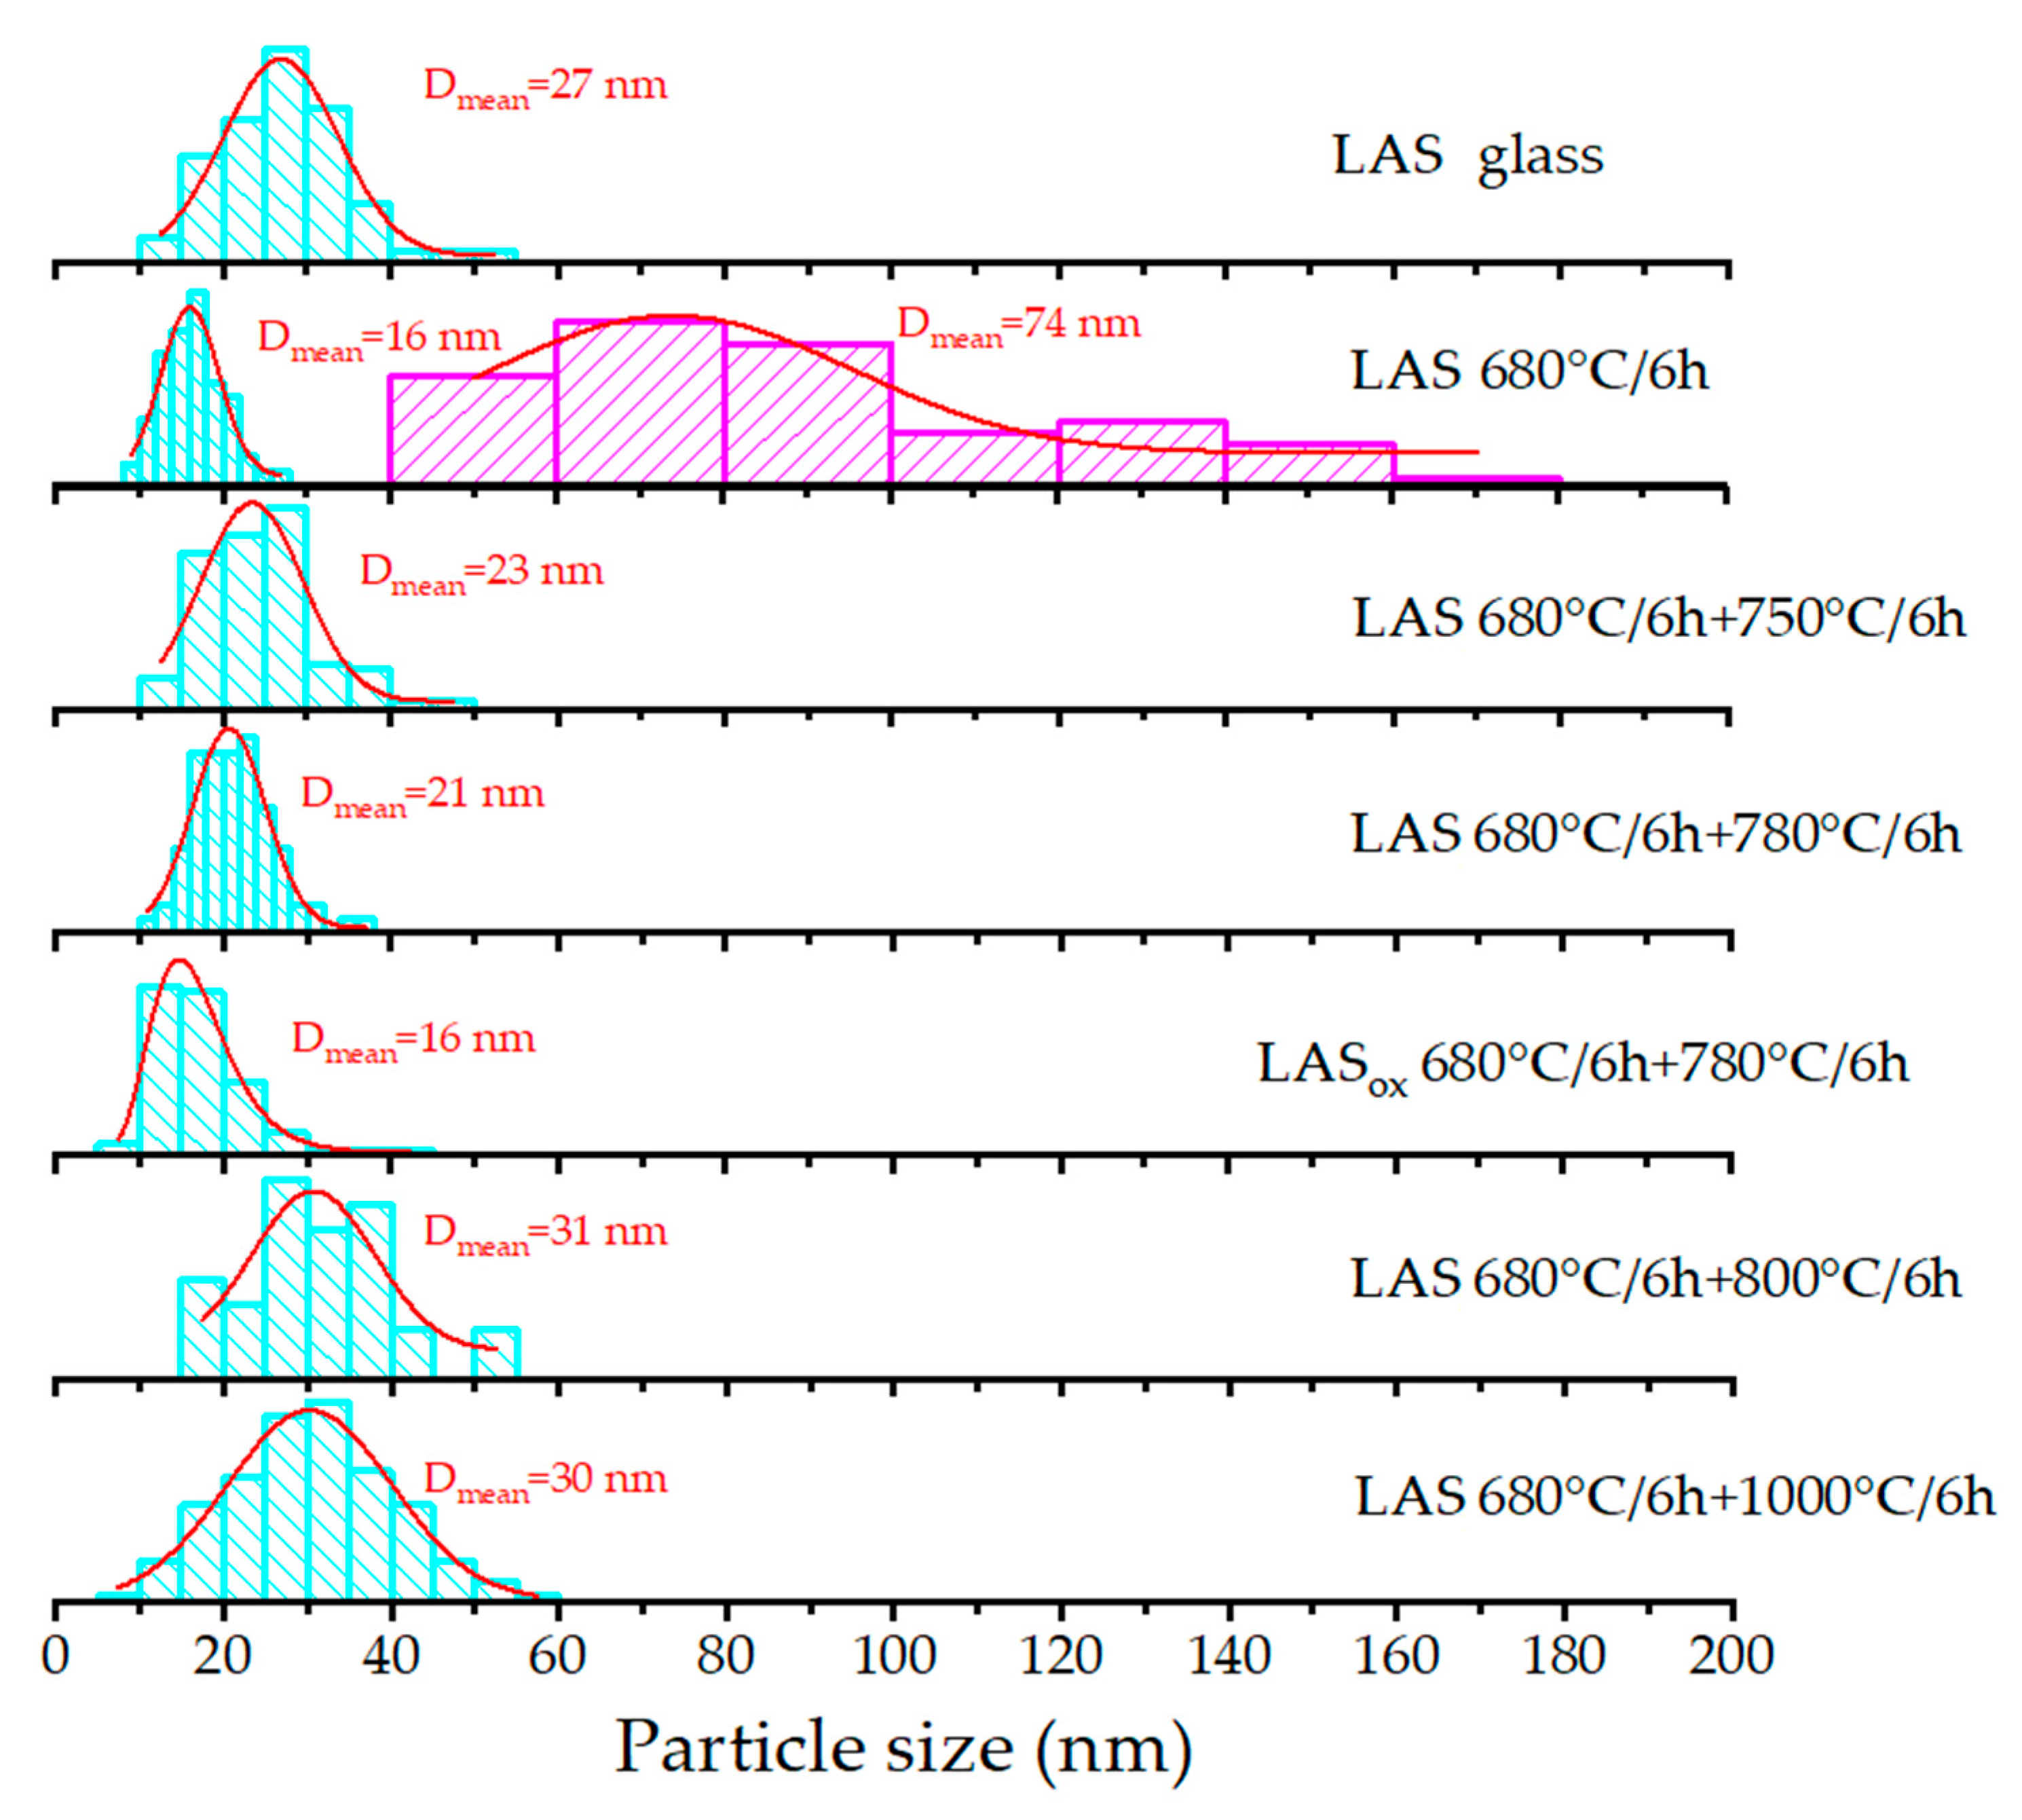
Figure 13.
Absorption spectra in different spectral ranges of the samples of: (a) the initial LAS glass and glass heat-treated up to 1000 °C in the spectral range from 250 nm to 3300 nm; (b) the initial LASox glass and glass heat-treated up to 900 °C in the spectral range from 250 nm to 3300 nm; (c) the LAS glass and glass heat-treated up to 780 °C in the spectral range from 300 nm to 1750 nm; (d) the subtracted spectra; (e) the LAS glass and glass heat-treated up to 1000 °C in the spectral range from 300 nm to 460 nm; (f) the LASox glass and glass heat-treated up to 900 °C in the spectral range from 300 nm to 475 nm; (g) the LAS glass and glass heat-treated up to 1000 °C in the spectral range from 2600 nm to 3300 nm; (h) the LASox glass and glass heat-treated up to 900 °C in the spectral range from 2600 nm to 3300 nm. The duration of each hold is 6 h.
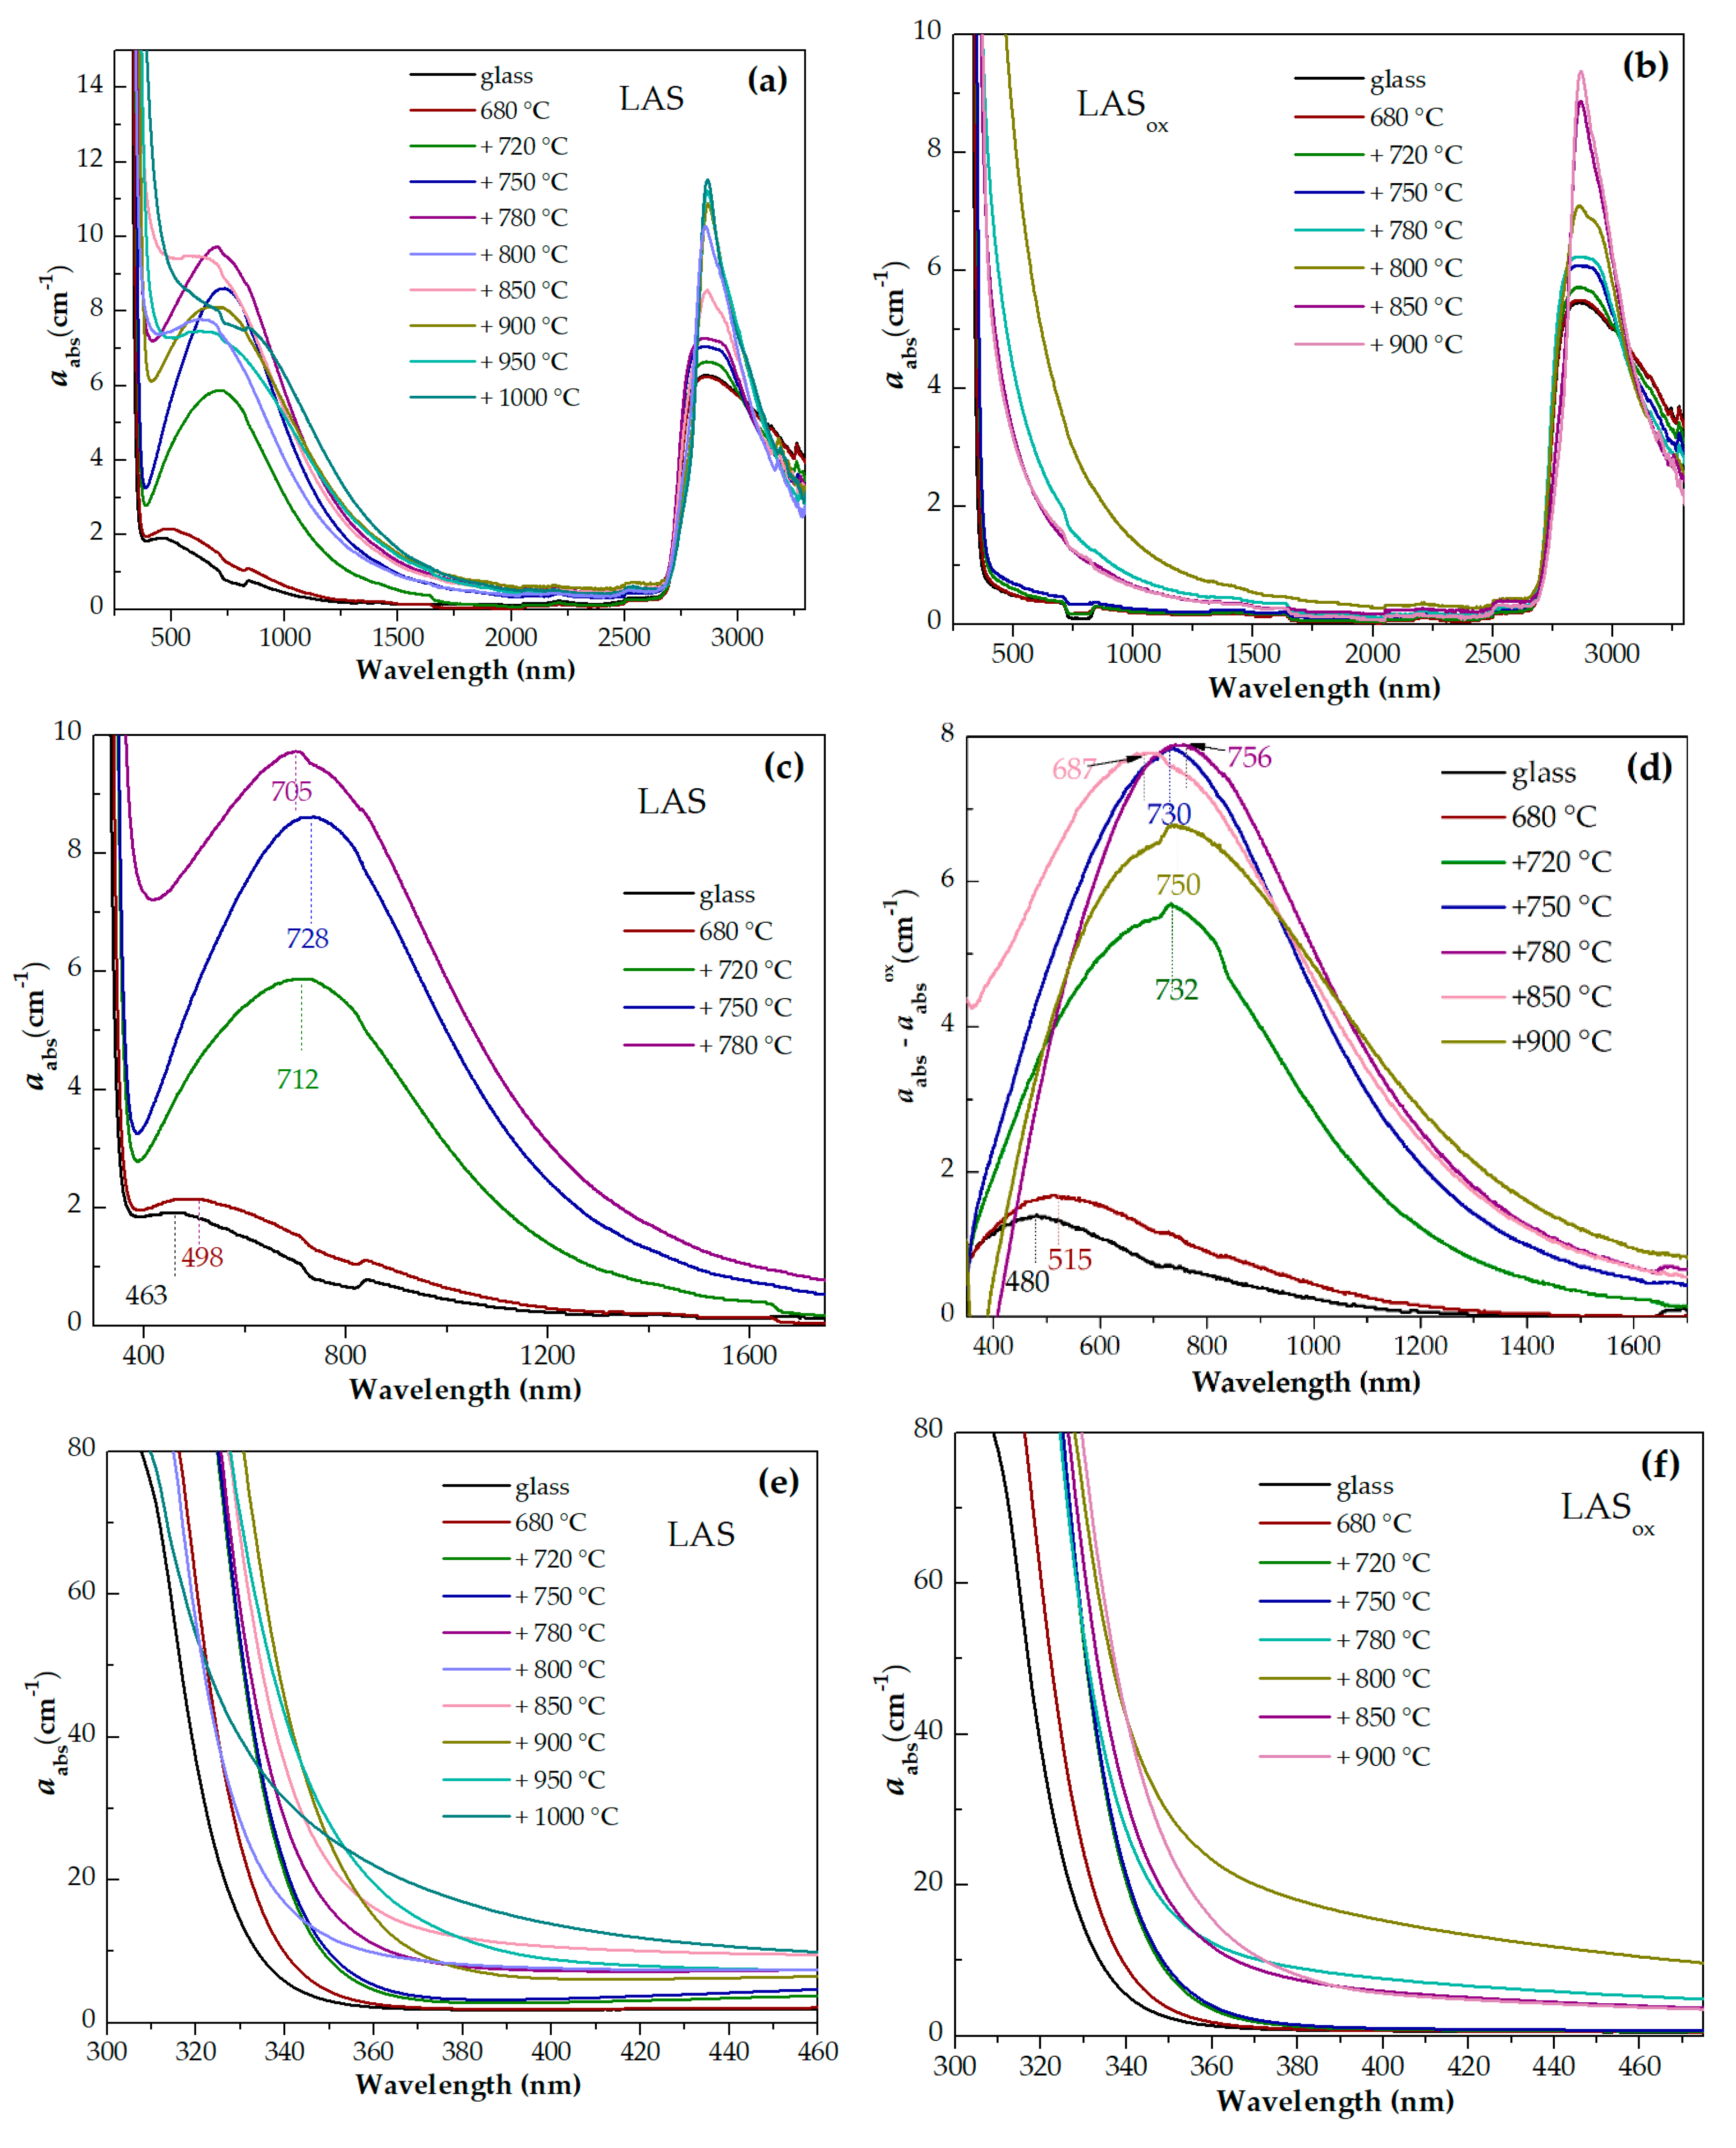
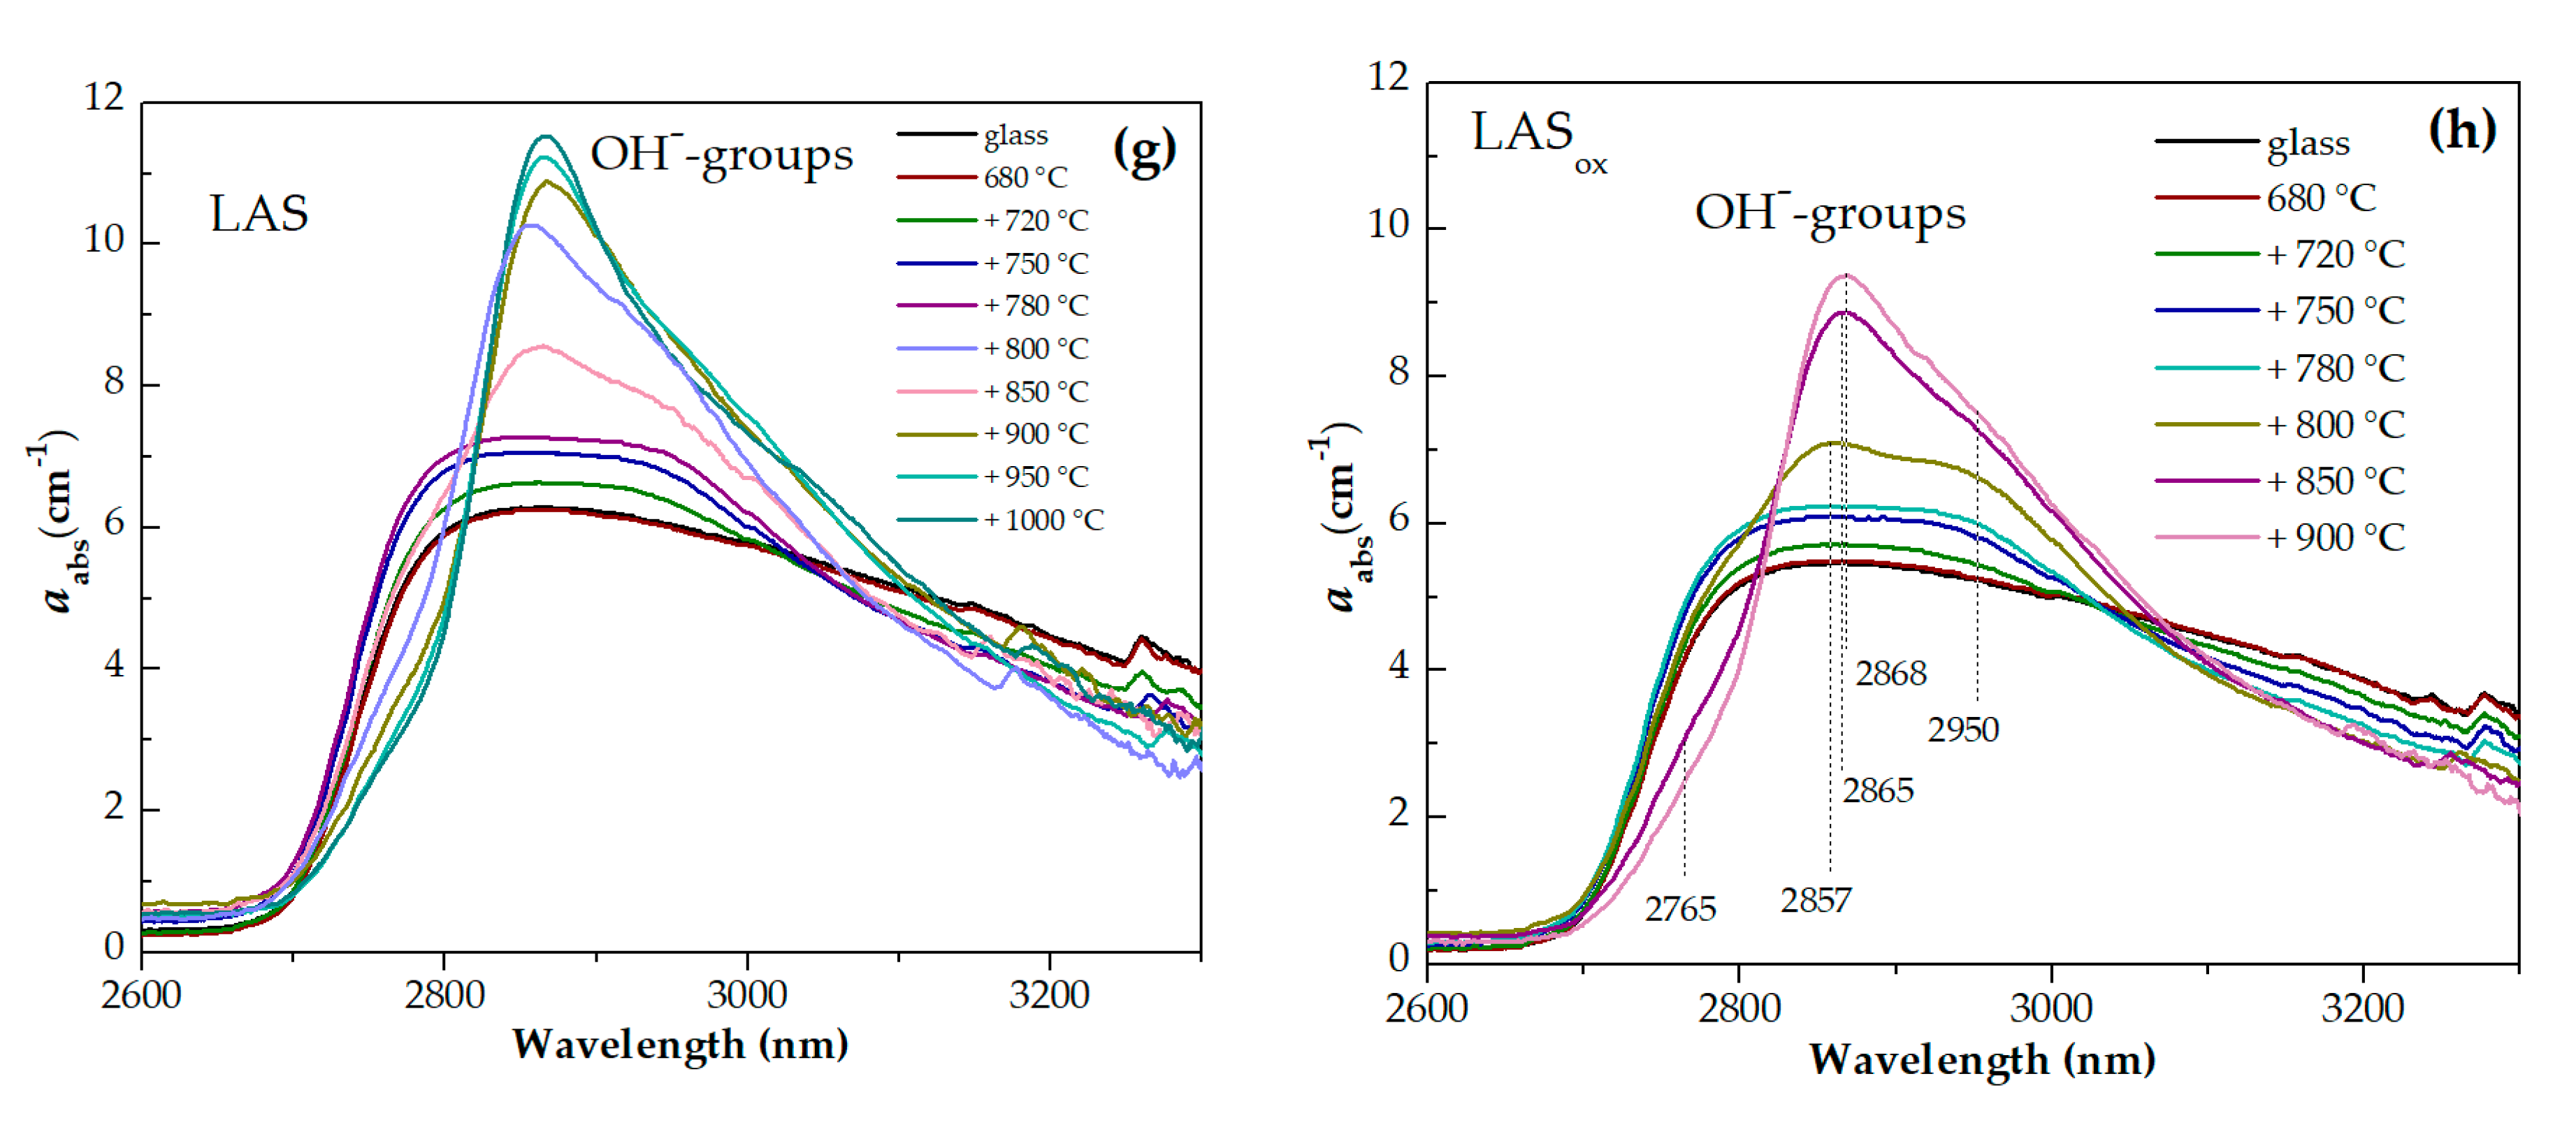
Figure 14.
Absorption spectra of the samples of: (a) the initial LAS and LASox glasses; (b) the LAS and LASox glasses heat-treated at 680 °C; (c) the LAS and LASox glasses heat-treated at 680 °C+720 °C; (d) the LAS and LASox glasses heat-treated at 680 °C+750 °C; (e) the LAS and LASox glasses heat-treated at 680 °C+780 °C; (f) the LAS and LASox glasses heat-treated at 680 °C+800 °C; (g) the LAS and LASox glasses heat-treated at 680 °C+850 °C; (h) the LAS and LASox glasses heat-treated at 680 °C+900 °C. The duration of each hold is 6 h.
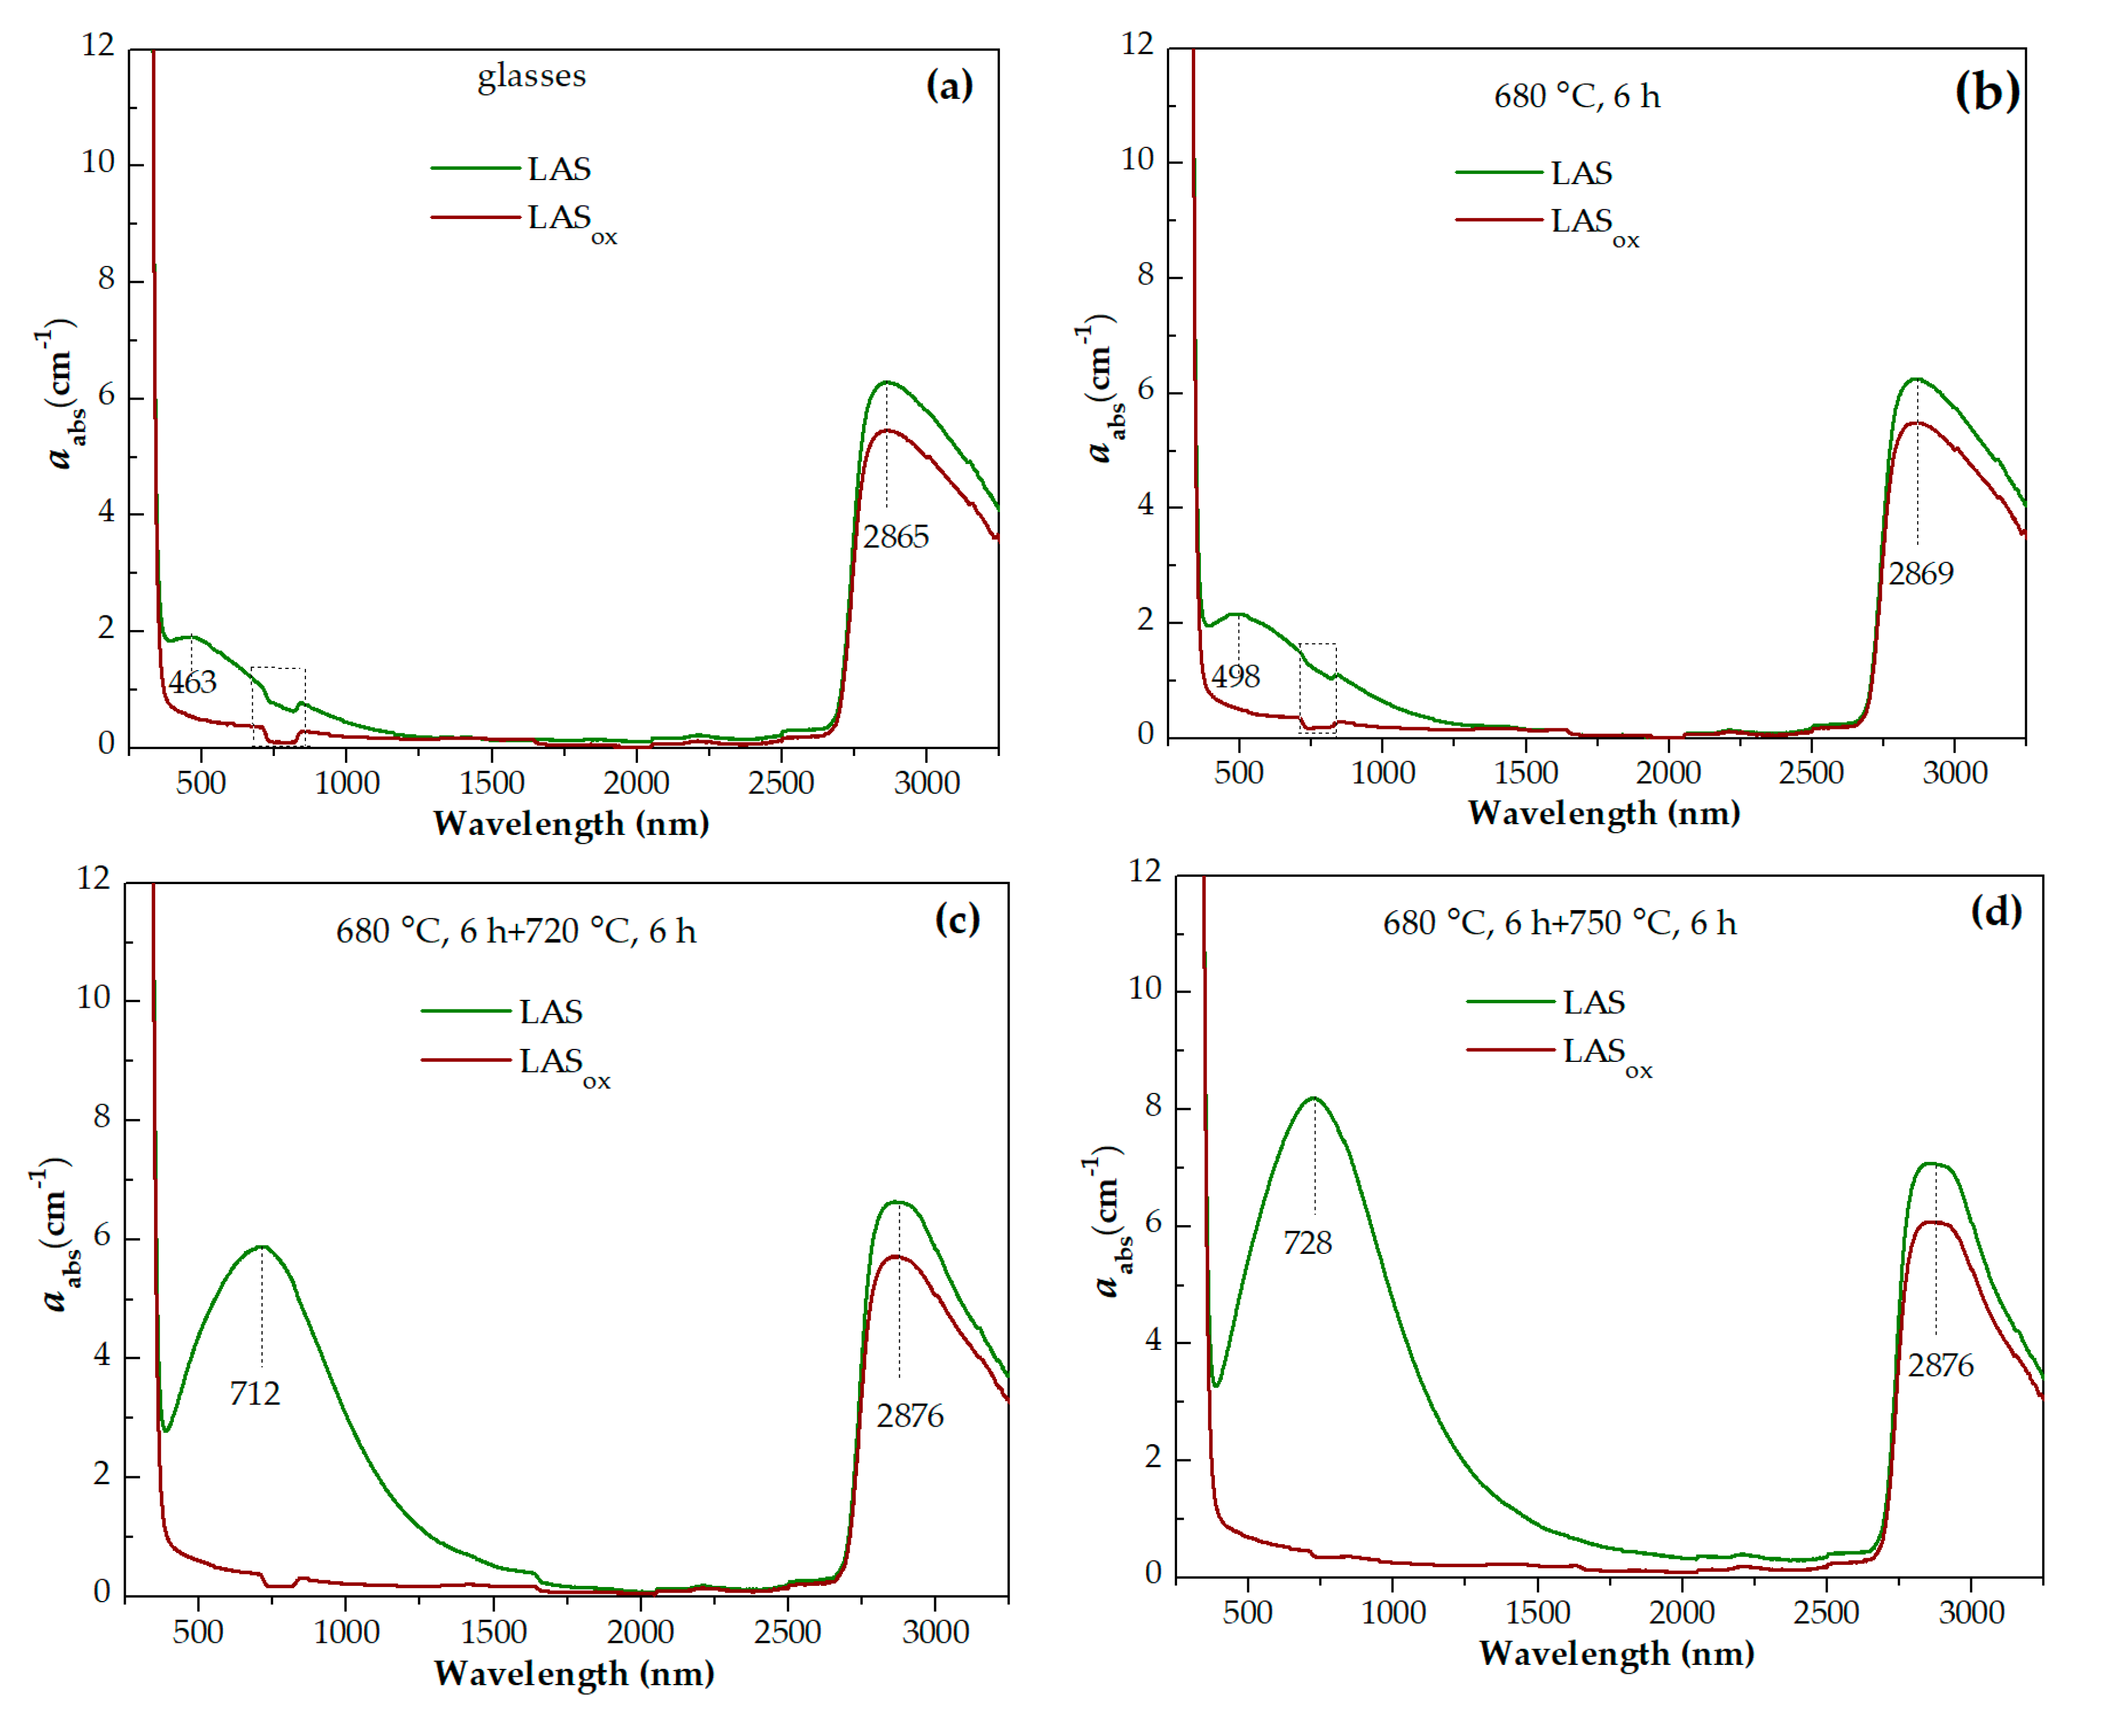
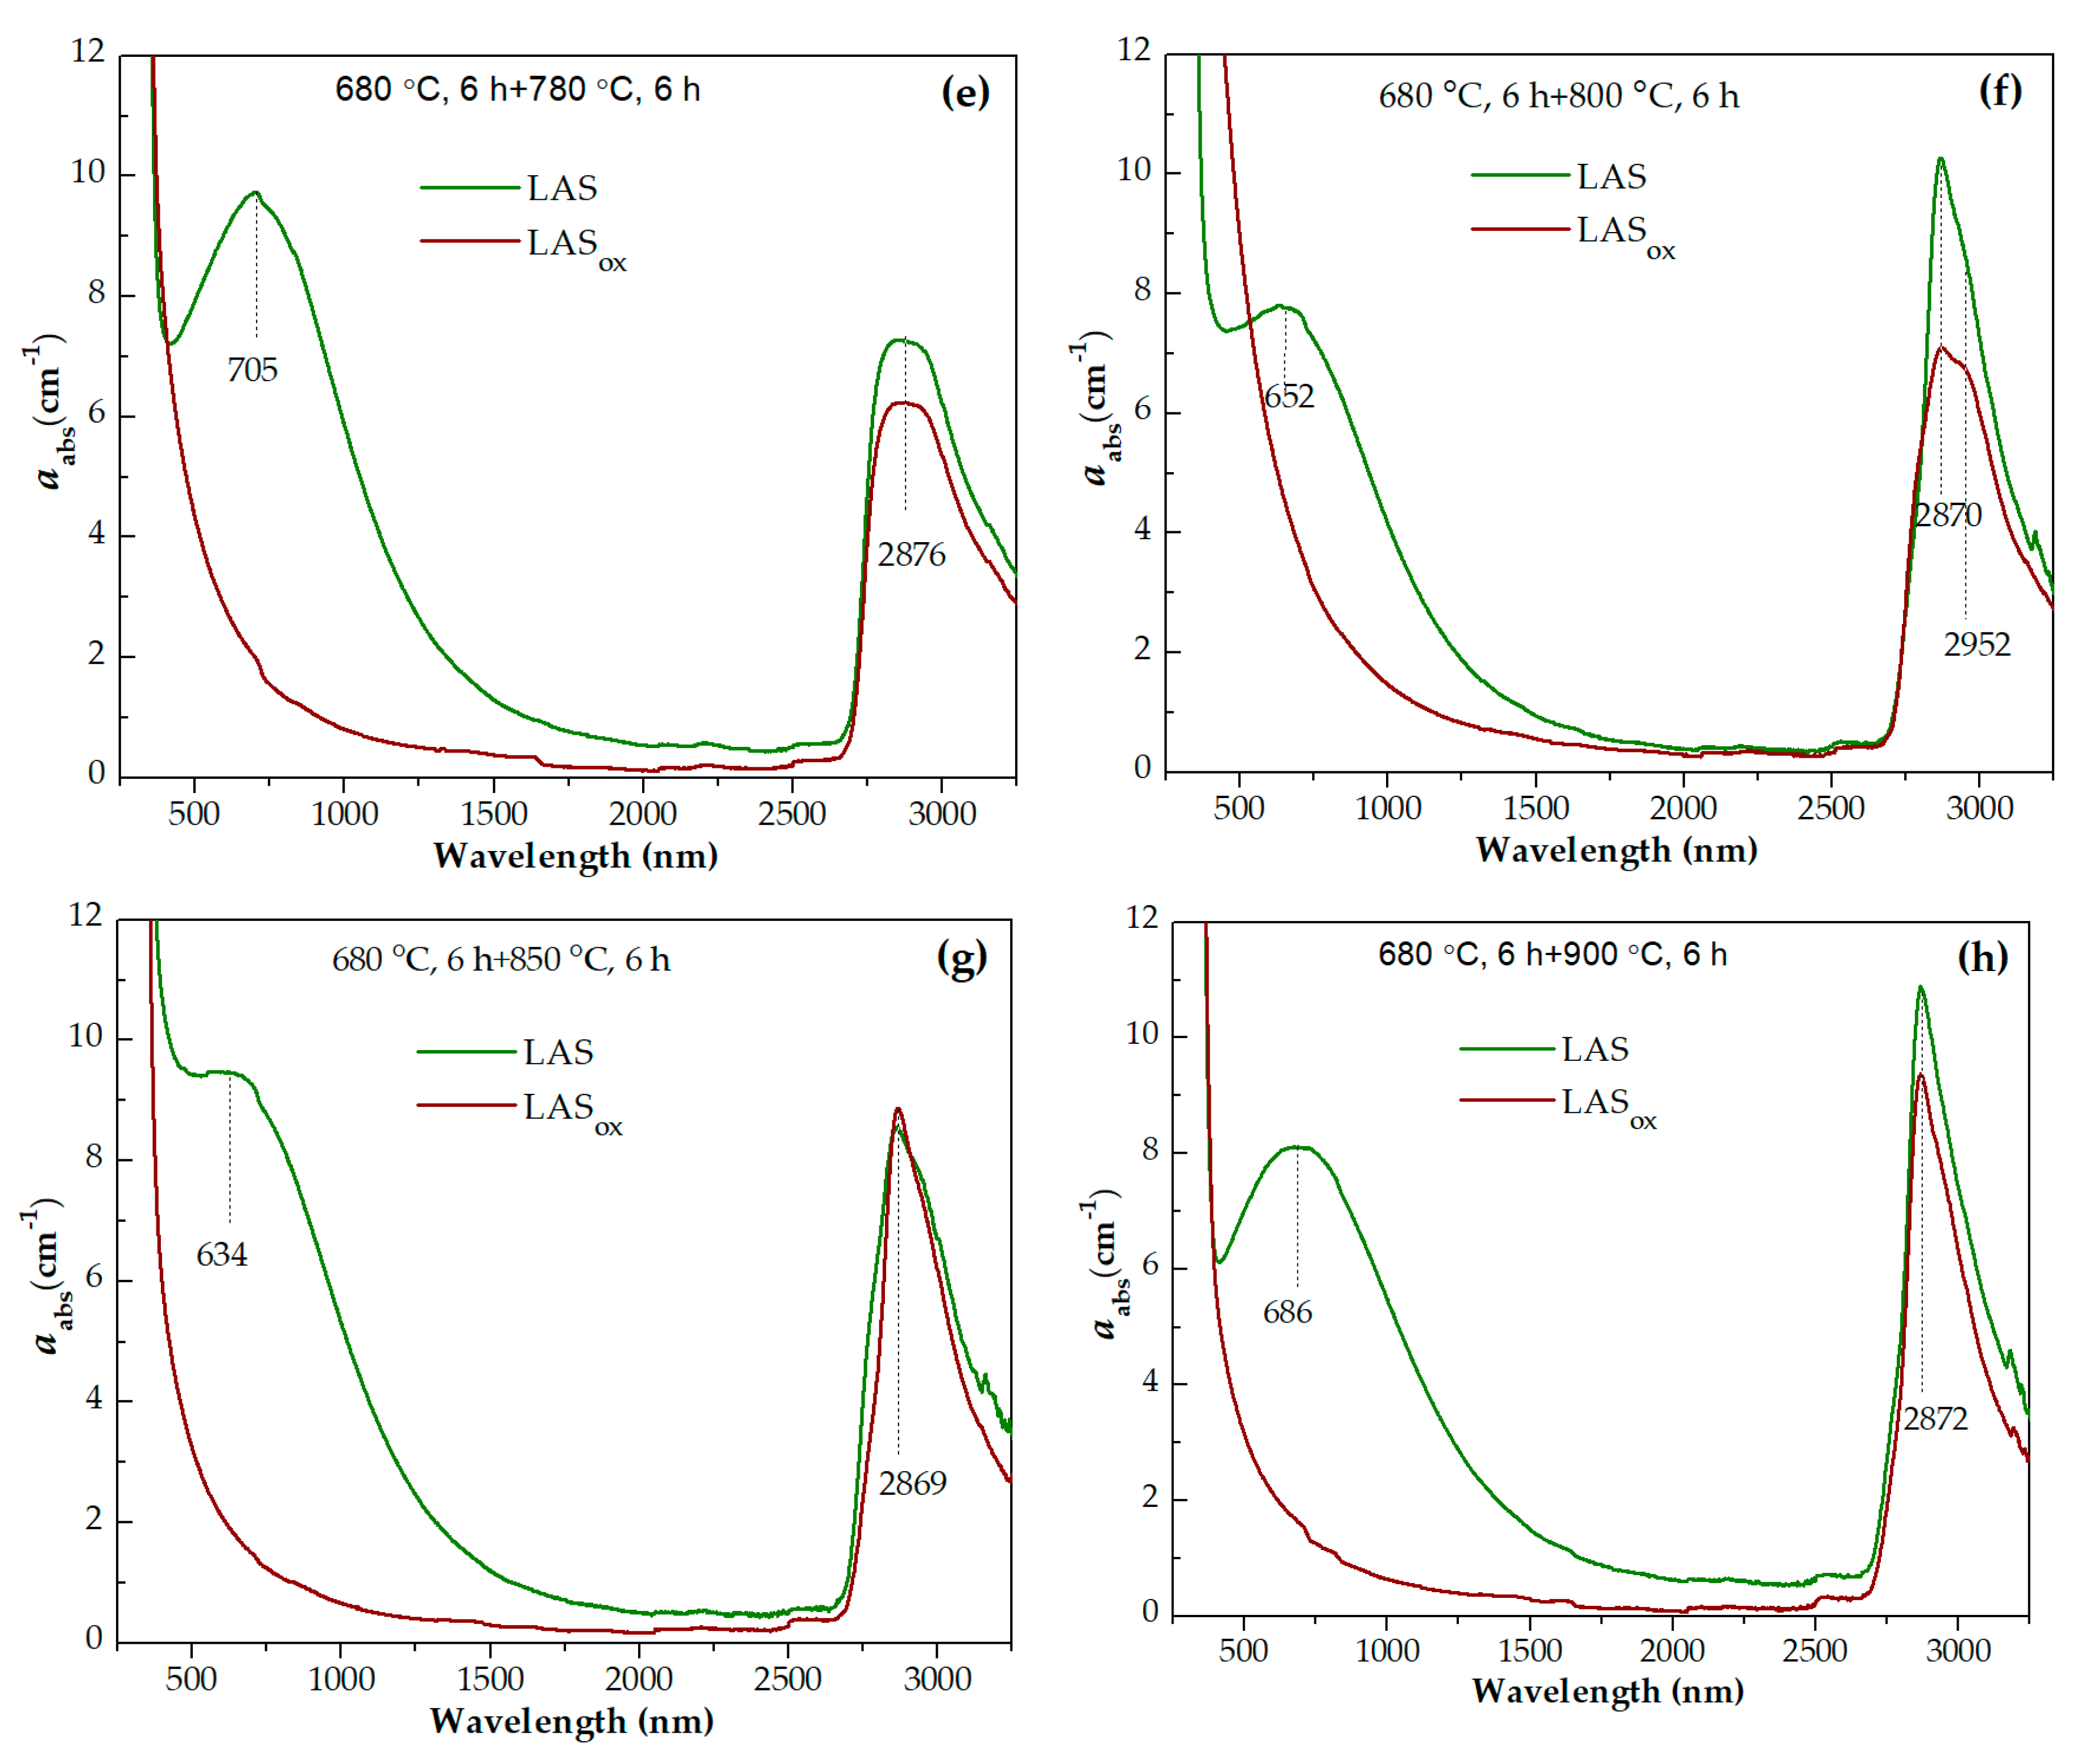
Table 4.
The thermal expansion coefficients (CTE) for initial and heat-treated glasses of the LAS and the LASox compositions in the temperature range from room temperature to 320 °C.
Table 4.
The thermal expansion coefficients (CTE) for initial and heat-treated glasses of the LAS and the LASox compositions in the temperature range from room temperature to 320 °C.
| Heat-treatment schedule | CTE20-320 (× 10-6 К-1) | |
|---|---|---|
| LAS | LASox | |
| Initial glass | 4.35±0.08 | 4.25±0.08 |
| 680 °C, 6 h | 4.19±0.08 | 4.21±0.08 |
| 680 °C, 6 h + 720 °C, 6 h | 4.82±0.09 | 4.57±0.09 |
| 680 °C, 6 h + 720 °C, 6 h + 750 °C, 6 h | 5.36±0.10 | 5.18±0.10 |
| 680 °C, 6 h + 720°C, 6 h + 750 °C, 6 h + 780 °C, 6 h | 4.30±0.08 | 4.85±0.09 |
| 680 °C, 6 h + 780 °C, 6 h | - | 4.85±0.10 |
| 720 °C, 6 h + 800 °C, 6 h | 1.15±0.02 | 1.24±0.01 |
| 720 °C, 6 h + 850 °C, 6 h | 0.61±0.01 | 0.45±0.08 |
| 680 °C, 6 h +720 °C, 6 h +750 °C, 6 h +950 °C, 6 h | 0.30±0.01 | 0.19±0.01 |
| 680 °C, 6 h +1200 °C, 6 h | 1.49±0.03 | 1.42±0.03 |
Disclaimer/Publisher’s Note: The statements, opinions and data contained in all publications are solely those of the individual author(s) and contributor(s) and not of MDPI and/or the editor(s). MDPI and/or the editor(s) disclaim responsibility for any injury to people or property resulting from any ideas, methods, instructions or products referred to in the content. |
© 2024 by the authors. Licensee MDPI, Basel, Switzerland. This article is an open access article distributed under the terms and conditions of the Creative Commons Attribution (CC BY) license (http://creativecommons.org/licenses/by/4.0/).
Copyright: This open access article is published under a Creative Commons CC BY 4.0 license, which permit the free download, distribution, and reuse, provided that the author and preprint are cited in any reuse.


