
Submitted:
19 November 2024
Posted:
20 November 2024
You are already at the latest version
Abstract
Background/Objectives: To obtain bioelectrical data to assess nutritional status for extremely low birth weight (ELBW) infants upon reaching term corrected age. Methods: A descriptive, observational, prospective and single-center study which included ELBW preterm infants was performed. The study variables collected were: gestational age, sex and anthropometry at birth and at term corrected age. Bioelectrical impedance vector analysis (BIVA) was performed by a phase sensitive device (BIA 101 BIVA PRO AKERN srl, Pisa, Italy). The components of the impedance vector –resistance (R) and reactance (Xc)– were normalized for body height (H). For each subject, the measurement was taken between the 36 th and 44 th week of postmenstrual age (PMA). A semi-quantitative analysis of body composition was performed using the vector modality of the BIA. Using the RXc graph method, the bivariate 95% confidence intervals of the mean vectors were constructed. From the bivariate normal distribution of R/H and Xc/H, the bivariate 95%, 75%, and 50% tolerance intervals for this cohort were drawn. The individual impedance vectors were compared with the distribution of the vectors from other populations. Results: 85 ELBW infants (40 male, 45 female) were included, with a mean gestational age at birth of 26+6 weeks (± 1.76). Mean R/H was 870.33 (±143.21) Ohm/m and Xc/H was 86.84 (± 19.05) Ohm/m. We found differences in the bioelectrical data with regard to gender, with resistance values being significantly higher in females. Our ellipses align closely with those from other term neonatal cohorts. Conclusions: Bioelectrical data and the confidence and tolerance ellipses of an ELBW infant cohort are presented and can be used as a reference standard for nutritional assessment at discharge.
Keywords:
preterm
; extremely low birth weight
; bioelectrical impedance
; phase angle
; term corrected age
; nutritional assessment
1. Introduction
The evolution of neonatal care units over the last two decades has led to a significant improvement in survival rates for children born at increasingly earlier gestational ages with lower birth weights [1]. Among these infants, those with ELBW (weight at birth less than 1000 g) stand out for their particular complexity and vulnerability: their growth rate is accelerated, energy stores are low and functional immaturity inhibits their ability to adapt to an unbalanced supply of nutrients, whether in excess or deficiency [2]. For this reason they are considered patients at high risk for nutrition-related complications and their growth often deviates from what is expected. Feeding is a fundamental aspect of their care while in neonatal intensive care and impacts not only on their weight, but also on their psychomotor development, making it a major challenge for neonatologists [3]. In this context, nutritional intervention is designed to promote adequate catch-up growth, taking into account gestational age, prior history of intrauterine growth restriction, or the degree of postnatal malnutrition which often affects these patients during hospitalization [4]. In clinical practice, catch-up growth is achieved when a patient reaches the 10th percentile in weight. Nevertheless, this anthropometric measurement, while the most sensitive parameter in the short term, is limited in its ability to provide comprehensive nutritional information and is often altered by the state of hydration.
In this context it becomes increasingly important to assess body composition (BC). In utero, from weeks 24-27, numerous changes occur which must be understood in order to guide the nutritional support of premature infants: body mass quadruples, body water as a percentage of body weight decreases, and the proportion of both lean body mass and fat mass progressively increases [5, 6].
Previous observational studies using dual energy x-ray absorptiometry (DXA), air-displacement plethysmography (ADP) and magnetic resonance imaging (MRI), have shown that when a very preterm infant reaches term corrected age they have a higher proportion of fat mass and a lower proportion of lean mass compared to those infants born at term [7, 8]. Additionally, these differences in BC can lead to increased metabolic risk as an adult. Some of the risk factors associated with metabolic syndrome, such as arterial hypertension, dyslipidemia, impaired glucose tolerance or increased insulin resistance, correlate inversely with birthweight and appear more frequently when there is rapid postnatal weight gain [9]. However, for reasons not well understood, we know these possible changes in premature infants’ BC are not always sustained in the long term [10].
Over the last few years, bioelectrical impedance analysis (BIA) has become a widely used method to study BC in a simple, inexpensive, mobile, non-invasive and reproducible manner that doesn’t require patient cooperation. It is grounded on the fact that different components of the human body show different resistance (impedance) to electrical currents. Lean muscle mass, which contains most of the body’s fluids and electrolytes, is a good conductor of electricity (low impedance) while fat mass acts as an insulator (high impedance). BIA analyzers introduce a low-frequency alternating current to record impedance (Z) and its two components: resistance (R) and reactance (Xc). R is the simple and constant resistance tissue presents to the flow of current while Xc reflects the delay in the current flow, indicative of the tissue’s ability to store energy. In short, R is inversely correlated with hydration and electrolyte content of a tissue and Xc is related to cell size and membrane integrity. In addition to R and Xc, BIA provides a third parameter, phase angle (Pha), a measurement obtained from the ratio of reactance to resistance (Pha = arctangent (Xc / R) × 180° / π), independent of conventional regression equations for estimating body composition. Some authors advocate that this parameter could be a more sensitive tool for evaluating nutritional status due to its relationship with body cell mass [11] and it has been suggested as a predictor of mobility and mortality in various clinical situations [12-14].
BIA results can be assessed quantitatively (conventional BIA) or qualitatively (Bioelectrical impedance vector analysis, BIVA). Conventional analysis uses predictive equations that turn raw bioelectrical values into BC variables in order to estimate hydric volumes. To do so, it is necessary to use models that have been developed and validated in populations similar to the study group. Although valid models have been established for adults and older children, conventional BIA relies on a series of assumptions about density, hydration, and geometric proportions that do not hold true in the newborn population, leading to potentially serious errors if applied to newborn populations, especially in the case of premature infants.
These difficulties are circumvented in BIVA, a type of analysis developed by Piccoli et al [15], which does not depend on predictive models or equations as it uses direct vector impedance measurements which are then compared with data obtained from a reference population through RXc graphs. This reference graph is made up of three concentric ellipses corresponding to the 50th, 75th, and 95th percentiles of the normal distribution of the impedance vector of the reference population. BIVA is a highly attractive strategy for clinical practice in neonatal populations. Following the initial Piccoli et Al study [16], who included 163 subjects (87 males, 75 females) with postnatal ages of 1 to 7 days, other authors have successfully applied this technique on newborns and young infants [17-19]. Impedance vector distribution in neonates was determined in Spain by Redondo del Rio et al [20]. These authors evaluated a group of 154 healthy term newborns (79 males, 75 females) aged 24 to 72 hours, showing lower values of resistance and slightly higher reactance values compared to Italian newborns in the first 7 days from the Picolli et al group. This study proposed tolerance ellipses for Spanish term neonates. However, few studies have examined the preterm population and bioimpedance analysis is limited. Our goal is to offer the first bioelectrical data for ELBW infants upon reaching term corrected age.
2. Materials and Methods
Study Design and Subjects
A descriptive, observational, prospective, single-center study which included ELBW preterm infants born between July 2021 and February 2024. The study was carried out in the level III neonatal unit of 12 de Octubre University Hospital in Madrid, Spain, a reference centre for the care of premature infants. Inclusion criteria were: ELBW in a stable condition at the time of pre-discharge or at the time of first follow-up appointment (between 36th and 44th weeks of PMA) whose parents agreed to participate in the study by signing an informed consent form. The study was conducted in accordance with the Declaration of Helsinki, and the protocol was approved by the Ethics Committee of 12 de Octubre University Hospital Research Institute (Project identification code 21/154; date of acceptance 13th April 2021). The following data were collected: gestational age, sex and anthropometry (weight and height) at birth and at the time of examination with the corresponding Z-scores using Fenton’s growth charts [21] up to 44 weeks of PMA. Finally, the weight-gain velocity from birth to the time of examination was estimated using Patel’s formula in grams (g) per kilogram per day [22]. Patients were classified according to their obstetric history and anthropometry, depending on the presence or absence of intrauterine growth restriction (IUGR), small for gestational age (SGA), and extrauterine growth restriction (EGR). IUGR was defined as estimated fetal weight at the time of ultrasound below the 3rd percentile for gestational age and sex, regardless of the presence of Doppler hemodynamic changes, or estimated fetal weight at the time of ultrasound between the 3rd-10th percentile for gestational age and fetal sex when associated with one or more of the following Doppler hemodynamic changes: umbilical artery pulsatility index (PI) above the 95th percentile for gestational age and/or mean uterine artery PI above the 95th percentile and/or middle cerebral artery PI or cerebroplacental ratio below the 5th percentile for gestational age [23]. SGA was defined as a sex-adjusted birth weight under the tenth percentile (≤ 1.28 Z-score). EUGR at discharge from the neonatal unit was defined as the difference between Z-scores at birth and discharge with <−2 SD as severe, −2 to −1 SD as moderate using Fenton’s growth charts.
Bioelectrical Impedance Vector Analysis
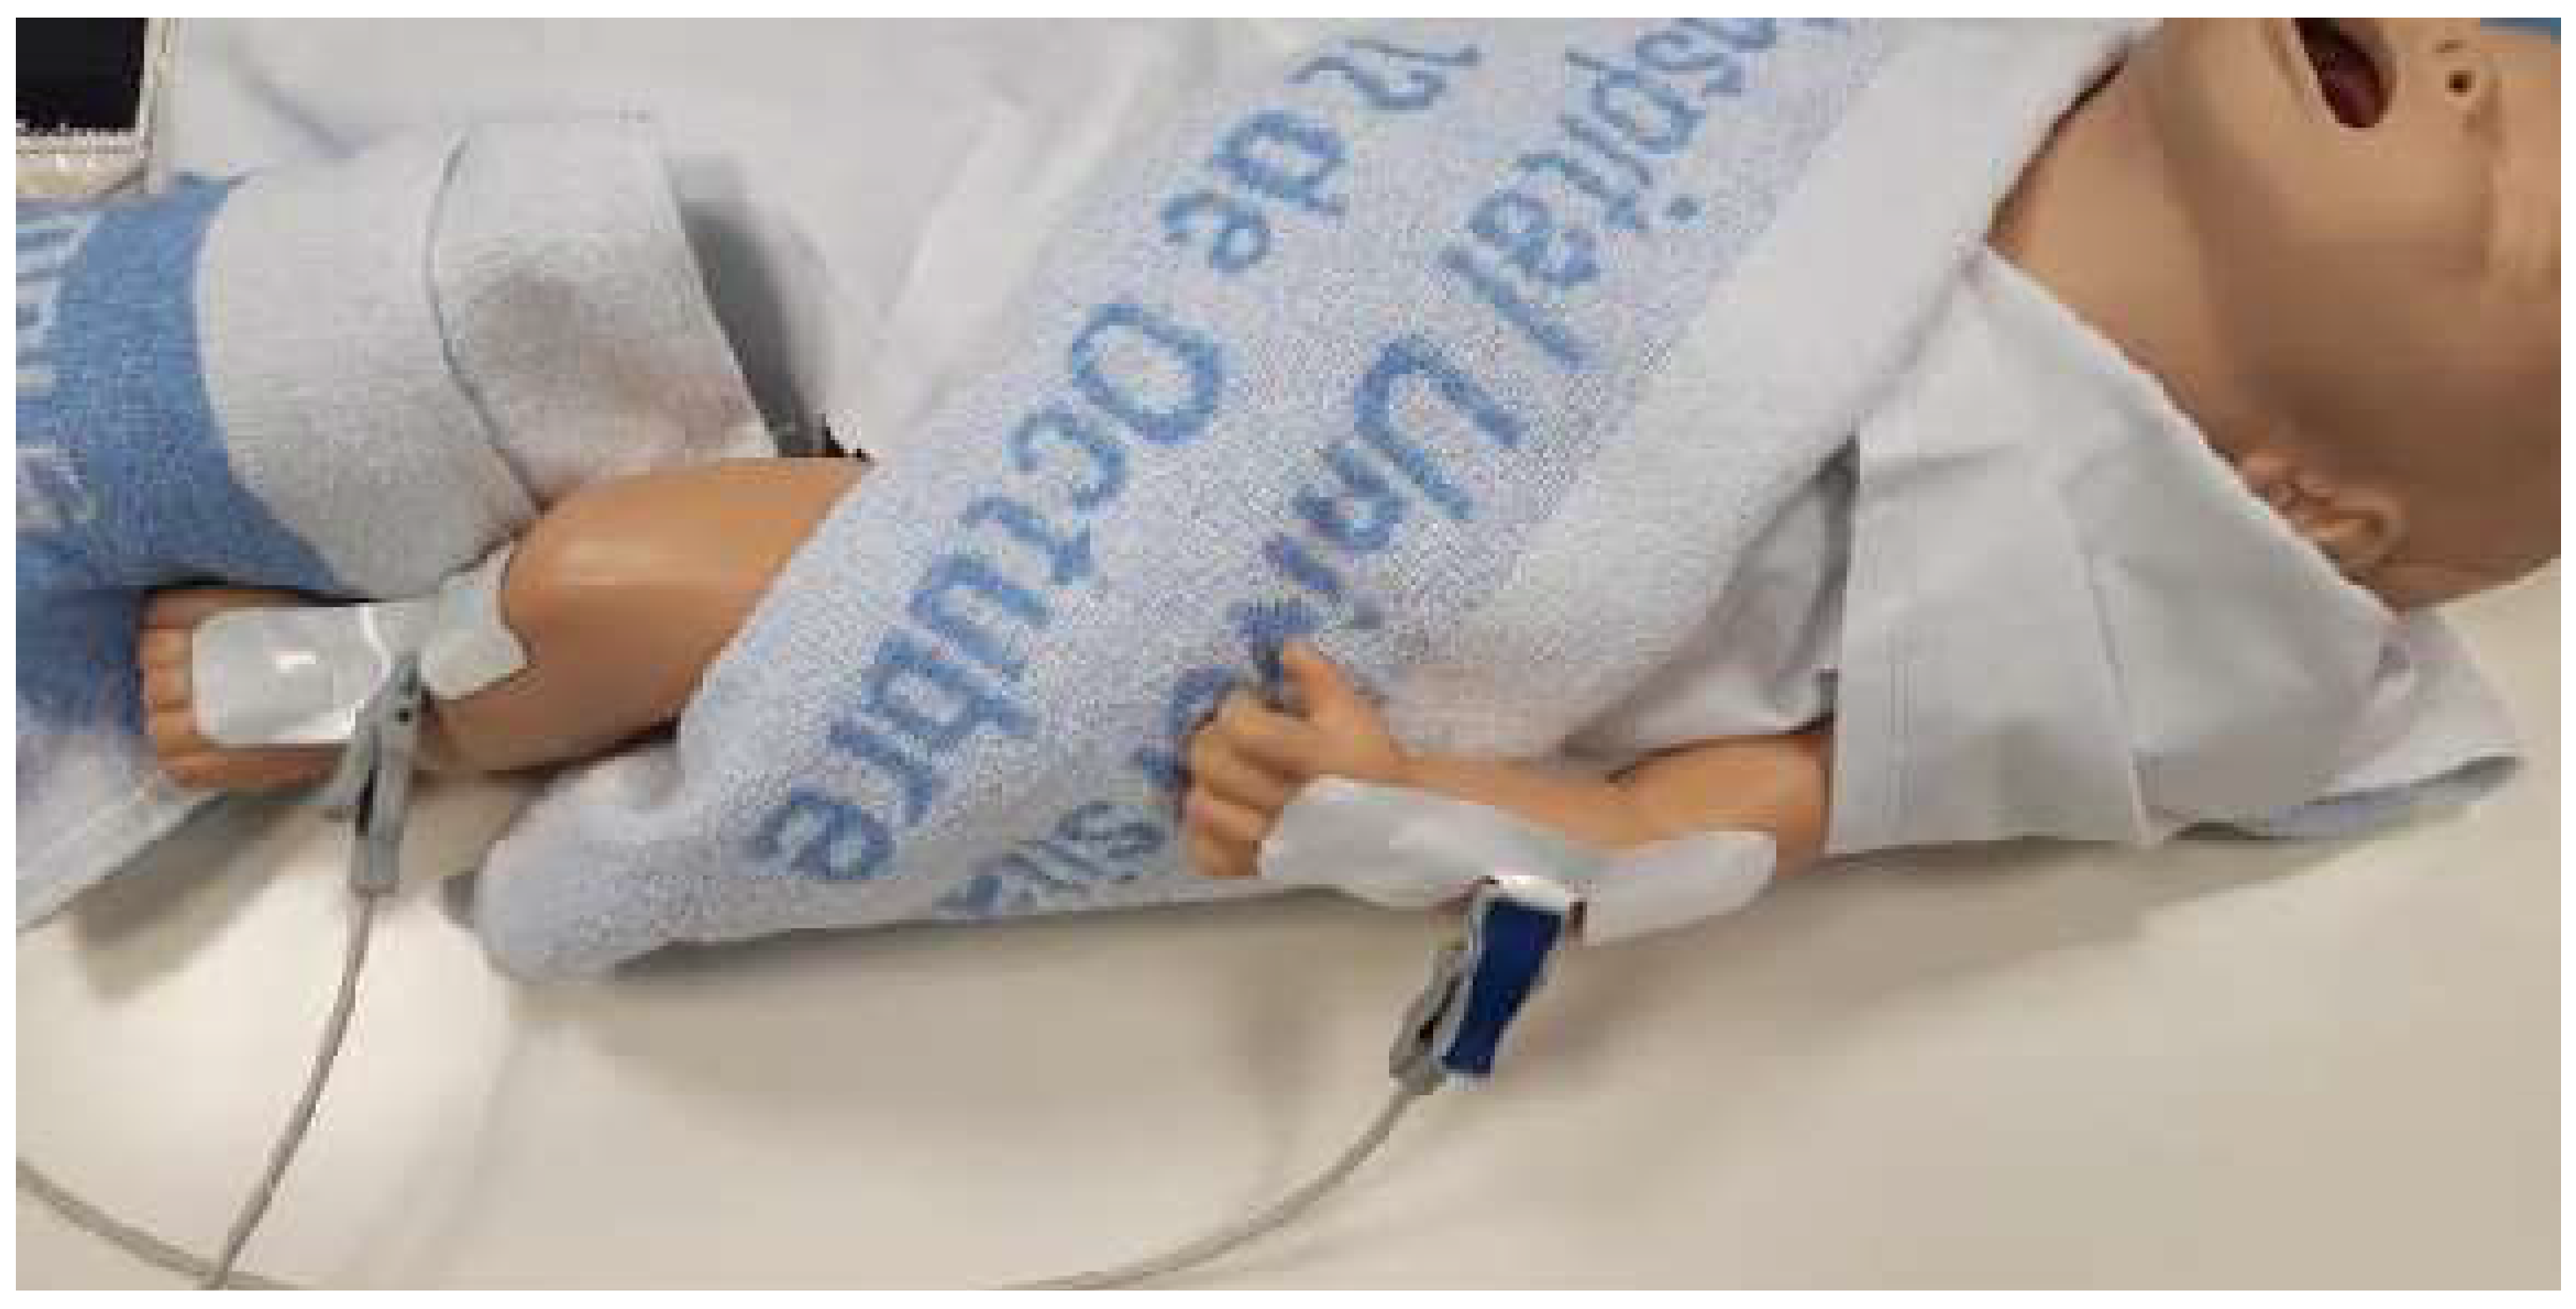
Bioimpedance analysis was performed by a phase sensitive device (BIA 101 BIVA PRO AKERN srl, Pisa, Italy) working with alternating sinusoidal electric current of 245 microampere at an operating frequency of 50 kHz (±1%). The device was calibrated every morning using the standard control circuit supplied by the manufacturer with a known impedance [resistance (R) = 380 ohm; reactance (Xc) = 45 ohm]. The accuracy of the device was 0.1% for R and 0.1% for Xc. The components of the impedance vector–R and Xc– were normalized for body height (H). For each subject, a measurement was taken in triplicate between 36th and 44th weeks of PMA, with the result being the average (± standard deviation) calculated after verifying normal distribution. BIA analysis was carried out on patients at baseline condition, preferably before feeding. Patients were placed in a supine position, undressed, on a non-conductive surface (crib mattress or examination table), ensuring no contact with any metallic surface. The skin that would be in contact with the electrodes was previously cleaned with a 2% chlorhexidine solution. Arms were extended and placed slightly away from the body and it was ensured that ankles and thighs were not touching each other (occasionally a towel or sheet was used to separate lower limbs). An effort was made to keep the patient calm or even asleep while measurements were being taken and physical contact between the patient and family members or hospital staff was avoided. Two sets of adhesive Ag/AgCl low impedance electrodes (BIVATRODES Akern Srl; Florence, Italy), designed for accurate and sensitive bioimpedance measurements were placed preferably on the hand (blue electrodes) and right foot (gray electrode, figure 1). In patients with intravenous lines or other local pathologies (burns, lymphedema) electrodes were placed on the upper and lower limbs free of devices and/or lesions. If the patient was receiving intravenous treatment, when possible infusion was stopped while measurements were taken. Before and after each measurement the electrodes were cleaned with 70% alcohol. In cases in which the patient was in isolation, the equipment was placed in a sterile plastic bag. Three measurements were taken, preferably by a single researcher, with the result being the average of the bioelectrical parameters. The electrodes were allowed to remain in place for up to 5 hours, although the measure was taken within 2-3 minutes for most patients. Niltac® spray or liquid vaseline was used to remove the electrodes after measurement.
Figure 1.
Placement of the electrodes on the patient.
Statistical Analyses
A semi-quantitative analysis of body composition was performed using the vector modality of the BIA, that is to say that the components of the impedance vector (R and Xc) were normalized by the length of the neonates (R/H [ohm/m] and Xc/H [ohm/m]). Using the RXc graph method, the bivariate 95% confidence intervals (ellipses) of the mean vectors were constructed. From the bivariate normal distribution of R/H and Xc/H, the bivariate 95%, 75%, and 50% tolerance intervals for this cohort of ELBW infants were drawn. Furthermore, the individual impedance vectors were compared with the distribution of the vectors of other populations, including the reference of Piccoli [15] and a Spanish healthy term newborns cohort by Redondo del Río [20] (ellipses of tolerance at 50%, 75%, and 95%). Quantitative variables were described using the mean and standard deviation (SD). Qualitative variables were described using absolute and relative frequencies. Inference between populations for bioelectrical data was performed using Student’s t-test, ANOVA, the chi-square (χ²) test, or Fisher’s exact test when the number of subjects in several categories was less than 5, based on the nature of the variables. Spearman’s correlation was used to test the association between R/H and Xc/H. All the analysis was performed using SAS 9.4 with a significance level of 5%. Normal distribution of bioelectrical data was evaluated using the Shapiro Wilk test. The two-sample Hotelling’s T2 test was used to compare the differences in the mean bioelectrical impedance vector between the reference values provided by Piccoli et al [15].
3. Results
85 ELBW infants (40 male, 45 female) were included, with a mean gestational age at birth of 26+6 (± 1.76) weeks and a mean birth weight of 756.20 (± 164.75) g and a weight z-score of -0.75 (± 0.85). The average length of stay in the neonatal care unit was 90.82 (± 24.38) days and the mean weight upon discharge was 2532.47 (± 484.79) g and a weight z-score of -2.10 (± 1.11). The mean impedance vector values were obtained for the whole sample prior to discharge or at the first follow-up visit. BIA was carried out with a mean corrected age of 39+1 weeks (± 2.12). At the time of measurement, the mean weight and length were 2402.28 (± 458.79) g and 43.68 (± 2.55) cm, respectively. The results of the bioelectrical data normalized for height (R/H and Xc/H) for the entire sample, categorized by gender, are shown in Table 1.
Statistically significant differences were found according to gender for the raw R, supporting the construction of both total and separate (males and females) 95% confidence ellipses of the mean impedance vector (Figure 2 A and B).
Mean impedance vector with the reference 50%, 75% and 95% tolerance ellipses for extremely premature infants with birth weight < 1000 g at term corrected age is represented in Figure 3.
Subsequently, the patients included in the study were classified according to different intra and extrauterine growth patterns. 40% of patients had a history of IUGR and 32.94% were SGA. 43.53% met the criteria for moderate EGR and 20% severe EGR, with an average growth velocity during hospitalization of 12.11 (± 1.66) g/Kg/day. Table 2 and Table 3 summarize the bioelectrical data for these categories. Figure 4 and Figure 5 show the confidence ellipses based on the criteria of SGA and mild, moderate or severe EUGR.
Data from our cohort were compared with the bioelectrical results of healthy neonates in the first 7 days from Piccoli et al and healthy neonates in the first 3 days from Redondo del Río et al (Figure 5).
Finally, the comparison of individual vectors of the evaluated ELBW infants at term corrected age with the reference tolerance ellipses of the study performed by Redondo del Río et al is shown in Figure 6.
4. Discussion
This study describes, for the first time, bioelectrical data for ELBW preterm infants at term corrected age. Additionally, the confidence and tolerance ellipses are constructed, which can be used as a reference pattern for the nutritional evaluation of this population.
For ELBW infants, there is increasing evidence that growth during admission to neonatal units has an impact on their overall outcome. However, there is much controversy about the definition of optimal growth in this population of newborns and what the best parameters to monitor it or to achieve this adequate growth are [24, 25]. Although nutritional recommendations for preterm infants are under constant review and discussion, they generally use fetal growth rates as a reference point, an objective that oftentimes is not met before hospital discharge or at the age of term, leading almost unavoidably to malnutrition, especially in those infants with lower gestational age and weight. Furthermore, even when anthropometric values are similar, the clinical situation can vary greatly from one patient to the next. For this reason BIA is being used in clinical practice, even in the newborn population, in order to evaluate nutritional status more thoroughly. BIA is rapid, reproducible, non-invasive and safe. However, there are few studies focusing on the preterm infant population, BC data obtained by BIA is scarce and in the case of ELBW this data is practically non-existent. To date, only a few isolated studies have been published in which subjects have higher gestational ages and average weight [26, 27].
To the best of our knowledge, the data we present belongs to the largest newborn cohort of ELBW infants ever reported, in which the data were obtained at term corrected age and using the vector modality of the BIA (BIVA). For the first time, confidence and tolerance ellipses for ex-preterm infants weighing less than 1000 grams at the time of birth are presented. These data could be used as a reference pattern for the nutritional evaluation of this collective at the time of discharge.
We compared our results with those obtained by Redondo del Río et al, who evaluated a group of 154 healthy Spanish newborns (79 males, 75 females) aged 24 to 72 hours, with a gestational age greater than or equal to 37 weeks (37-41 weeks) and an appropriate weight for gestational age. Just as in Redondo del Rio et al, we found differences in the bioelectrical data with regard to gender, with resistance values being significantly higher in females. However, these differences haven’t been confirmed in other studies of term neonates and young infants, consequently its clinical significance can’t be precisely established, nor can we say with certainty that different reference ellipses must be used with this population. Still, based on our experience it could be beneficial, as shown in figure 1A where the ellipses show minimal overlap. On the other hand, in the different growth patterns studied (IUGR, SGA, EGR) we only found statistically significant differences in the case of the SGA population. It can be observed that the SGA group showed higher R/H and Xc/H values, which suggests decreased hydration and an increase in total cell mass. The IGR group showed the same tendency (higher R/H and Xc/H values with respect to non-IGR patients) although the differences didn’t reach statistical significance. Considering the size of these subgroups it could be imprecise to rise hypothesis, but these results may show an intervention bias in favor of SGA and IGR population at birth, with more early and aggressive nutritional interventions. In contrast, the bioelectrical data in the different EGR categories (mild, moderate, and severe) were very similar, and therefore unsurprisingly their confidence ellipses showed considerable overlap.
Our ELBW infants group was compared with healthy neonates in the first 7 days from Piccoli et al and healthy neonates in the first 3 days from Redondo del Rio et al. In both populations newborns were born at term. Values obtained were similar to those found in these studies, as can be visualized by the confidence ellipses of the 3 groups (Figure 6), what implies that is technically feasible to perform BIVA in the population of ELBW infants at term age.
Our ellipses align most closely with those from the Redondo del Rio et al cohort. For this reason, individual impedance vectors of our ELBW infants were represented in the ellipses from this group. Considering body composition according to vector placement, most of our patients were located at the lower right and left quadrant (known for their association with cachectic and obese sections in adult patients) as they had, on average, lower values of reactance (Xc/H = 86.84 Ohm/m in our study, Xc/H = 93.4 Ohm/m in that of Redondo del Rio et al). Considering term newborns as reference population, our data showed therefore a lower vector length, suggesting more fluids than the term neonates, possibly due to inflammation or a worse cellular quality.
As a primary limitation, the sample sizes of patient subgroups according to their intra- and extrauterine growth patterns may not have been large enough to detect differences in the parameters studied here. This is a single-center study targeting an extraordinarily vulnerable population with high mortality and morbidity, making it difficult to recruit participants. Although all the phase angles values were similar across all the analyzed subgroups, included in all categories of EGR, the design of our study did not allow for analysis of the prognostic value of BIVA in this context. Future studies focusing on the impact of extrauterine growth on biolectrial impedance are needed.
Bioelectrical impedance in newborns is a growing field with significant potential for clinical nutrition research. Studying BC in this critical stage of development can help to discover the characteristics of catch-up growth, personalize nutritional interventions for this population and improve their long-term health outcomes.
5. Conclusions
The study of bioelectrical parameters in ELBW population is feasible and can be of great value to guide nutritional management. The confidence and tolerance ellipses of a broad ELBW infant cohort at term corrected age are presented which can be used as a reference standard for nutritional assessment at discharge.
Author Contributions
Conceptualization, R.N.-R., D.E.-V., N.R.G.-L., M.G.-D. and C.P.-A.; methodology, N.R.G.-L. and C.P.-A; software, D.E.-V., N.R.G.-L; validation, R.N.-R., D.E.-V. and N.R.G.-L; formal analysis, R.N.-R. and D.E.-V.; investigation, R.N.-R., D.E.-V., C.R.C., C.D.D.-P., S.V.-R.; resources, N.R.G.-L. and C.P.-A.; data curation, R.N.-R. and D.E.-V; writing—original draft preparation, R.N.-R., D.E.-V. and N.R.G.-L.; writing—review and editing, C.P.-A.; funding acquisition, C.P.-A. All authors have read and agreed to the published version of the manuscript.
Funding
This research was funded by Familia Alonso Foundation.
Institutional Review Board Statement
The study was conducted in accordance with the Declaration of Helsinki, and the protocol was approved by the Ethics Committee of 12 de Octubre University Hospital Research Institute (Project identification code 21/154; date of acceptance 13th April 2021).
Informed Consent Statement
Informed consent was obtained from all subjects involved in the study.
Data Availability Statement
Research data presented in this study are available on request from the corresponding author.
Acknowledgments
The authors of this work want to express their gratitude to all families of ELBW infants for their participation. Furthermore, we appreciate the effort of all the neonatologist and nursing staff of the neonatology unit of 12 de Octubre University Hospital. We also would like to thank Cristina Martín-Arriscado from Clinical Research Unit of 12 de Octubre University Hospital and finally to Mariano Molina from Bionet medical andAKERN's scientific team for their technical support.
Conflicts of Interest
The authors declare no conflicts of interest.
References
- Patel, RM. Short- and Long-Term Outcomes for Extremely Preterm Infants. Am J Perinatol. 2016, 33, 318–328. [Google Scholar] [CrossRef] [PubMed]
- Wiedmeier JE, Joss-Moore LA, Lane RH; et al. Early postnatal nutrition and programming of the preterm neonate. Nutr Rev. 2011, 69, 76–82. [Google Scholar] [CrossRef] [PubMed]
- Avila-Alvarez A, Solar Boga A, Bermúdez-Hormigo C. Extrauterine growth restriction among neonates with a birthweight less than 1,500grams. An Pediatr (Barc). 2018, 89, 325–332. [Google Scholar]
- Ramel SE, Haapala J, Super J. Nutrition, Illness and Body Composition in Very Low Birth Weight Preterm Infants: Implications for Nutritional Management and Neurocognitive Outcomes. Nutrients. 2020, 12, 145. [Google Scholar] [CrossRef]
- E E Ziegler, A M O'Donnell, S E Nelson. Body composition of the reference fetus. Growth. 1976, 40, 329–41. [Google Scholar]
- Andrews ET, Beattie RM, Johnson MJ. Measuring body composition in the preterm infant: Evidence base and practicalities. Clin Nutr. 2019, 38, 2521–2530. [Google Scholar] [CrossRef]
- N A Al-Theyab, T J Donovan, Y A Eiby. Fat trajectory after birth in very preterm infants mimics healthy term infants. Pediatr Obes. 2019, 14, e12472. [Google Scholar] [CrossRef]
- Mark J Johnson, Stephen A Wootton, Alison A Leaf. Preterm birth and body composition at term equivalent age: a systematic review and meta-analysis Pediatrics. 2012, 130, e640–e649. [Google Scholar]
- Allan Vaag. Low birth weight and early weight gain in the metabolic syndrome: consequences for infant nutrition. Int J Gynaecol Obstet. 2009, 104 Suppl 1, S32-4.
- Ruys CA, van de Lagemaat M, Finken MJ. Follow-up of a randomized trial on postdischarge nutrition in preterm-born children at age 8 y. Am J Clin Nutr. 2017, 106, 549–558. [Google Scholar] [CrossRef]
- Bellido D, García-García C, Talluri A. Future lines of research on phase angle: Strengths and limitations. Rev Endocr Metab Disord. 2023, 24, 563–583. [Google Scholar] [CrossRef]
- Garlini LM, Alves FD, Ceretta LB, Perry IS, Souza GC, Clausell NO. Phase angle and mortality: a systematic review. Eur J Clin Nutr. 2019, 495-508.
- Zamberlan P, Feferbaum R Associate Professor of Pediatrics, Doria Filho U. Bioelectrical Impedance Phase Angle and Morbidity and Mortality in Critically Ill Children. Nutr Clin Pract. 2019, 34, 163–171. [Google Scholar] [CrossRef] [PubMed]
- Coradine AVP, Lima MN, Sarquis AL. Can Phase Angle in Newborns at Neonatal Intensive Care Units Be an Indicator of Mortality and Prognosis? JPEN J Parenter Enteral Nutr. 2021, 45, 1192–1196. [Google Scholar] [CrossRef] [PubMed]
- Piccoli A, Rossi B, Pillon L. A new method for monitoring body fluid variation by bioimpedance analysis: the RXc graph. Kidney Int. 1994, 46, 534–539. [Google Scholar] [CrossRef] [PubMed]
- Piccoli A, Vassiolios F, Peruzzi L; et al. Reference values of the bioelectrical impedance vector in neonates in the first week after birth. Nutrition. 2002, 18, 383–387. [Google Scholar] [CrossRef]
- L'Abée C, Poorts-Borger PH, Gorter EH. The bioelectrical impedance vector migration in healthy infants. Clin Nutr. 2010, 29, 222–226. [Google Scholar] [CrossRef]
- Margutti AV, Monteiro JP, Camelo JS Jr. Reference distribution of the bioelectrical impedance vector in healthy term newborns. Br J Nutr. 2010, 104, 1508–1513. [Google Scholar] [CrossRef]
- Savino F, Maccario S, Cresi F. Bioimpedance vector analysis in breastfed and formula-fed infants in the first six months of life. Adv Exp Med Biol. 2004, 554, 501–504. [Google Scholar]
- María P. Redondo-del-Río, Carla Escribano-García, María A. Camina-Martín. Bioelectrical impedance vector values in a Spanish healthy newborn population for nutritional assessment. Am J Hum Biol. 2019, 31, e23244. [Google Scholar]
- Fenton TR, Kim JH. A systematic review and meta-analysis to revise the Fenton growth chart for preterm infants. BMC Pediatr. 2013, 20, 59. [Google Scholar] [CrossRef]
- Patel AL, Engstrom JL, Meier PP. Accuracy of methods for calculating postnatal growth velocity for extremely low birth weight infants. Pediatrics. 2005, 116, 1466–1473. [Google Scholar] [CrossRef]
- Gordijn SJ, Beune IM, Thilaganathan B; et al. Consensus definition of fetal growth restriction: a Delphi procedure. Ultrasound Obstet Gynecol. 2016, 48, 333–339. [Google Scholar] [CrossRef] [PubMed]
- Frank R. Greer, Irene E. Olsen. How fast should the preterm infant grow? Curr Pediatr Rep 2013, 1, 240–246. [Google Scholar] [CrossRef]
- Villar J, Giuliani F, Barros F; et al. Monitoring the Postnatal Growth of Preterm Infants: A Paradigm Change. Pediatrics. 2018, 141, e20172467. [Google Scholar] [CrossRef] [PubMed]
- Margutti AV, Bustamante CR, Sanches M. Bioelectrical impedance vector analysis (BIVA) in stable preterm newborns. J Pediatr (Rio J). 2012, 88, 253–258. [Google Scholar] [CrossRef]
- Tortorella CCDS, Chao BMP, Rabito EI. Bioelectrical Impedance in Premature Newborns and Its Relationship with Diet Therapy in a Neonatal Intensive Care Unit. Nutrients. 2024, 16, 601. [Google Scholar] [CrossRef]
Figure 2.
Mean impedance vector with the 95% confidence ellipse for ELBW infants at term corrected age. (a) Total cohort; (b) By gender.
Figure 2.
Mean impedance vector with the 95% confidence ellipse for ELBW infants at term corrected age. (a) Total cohort; (b) By gender.
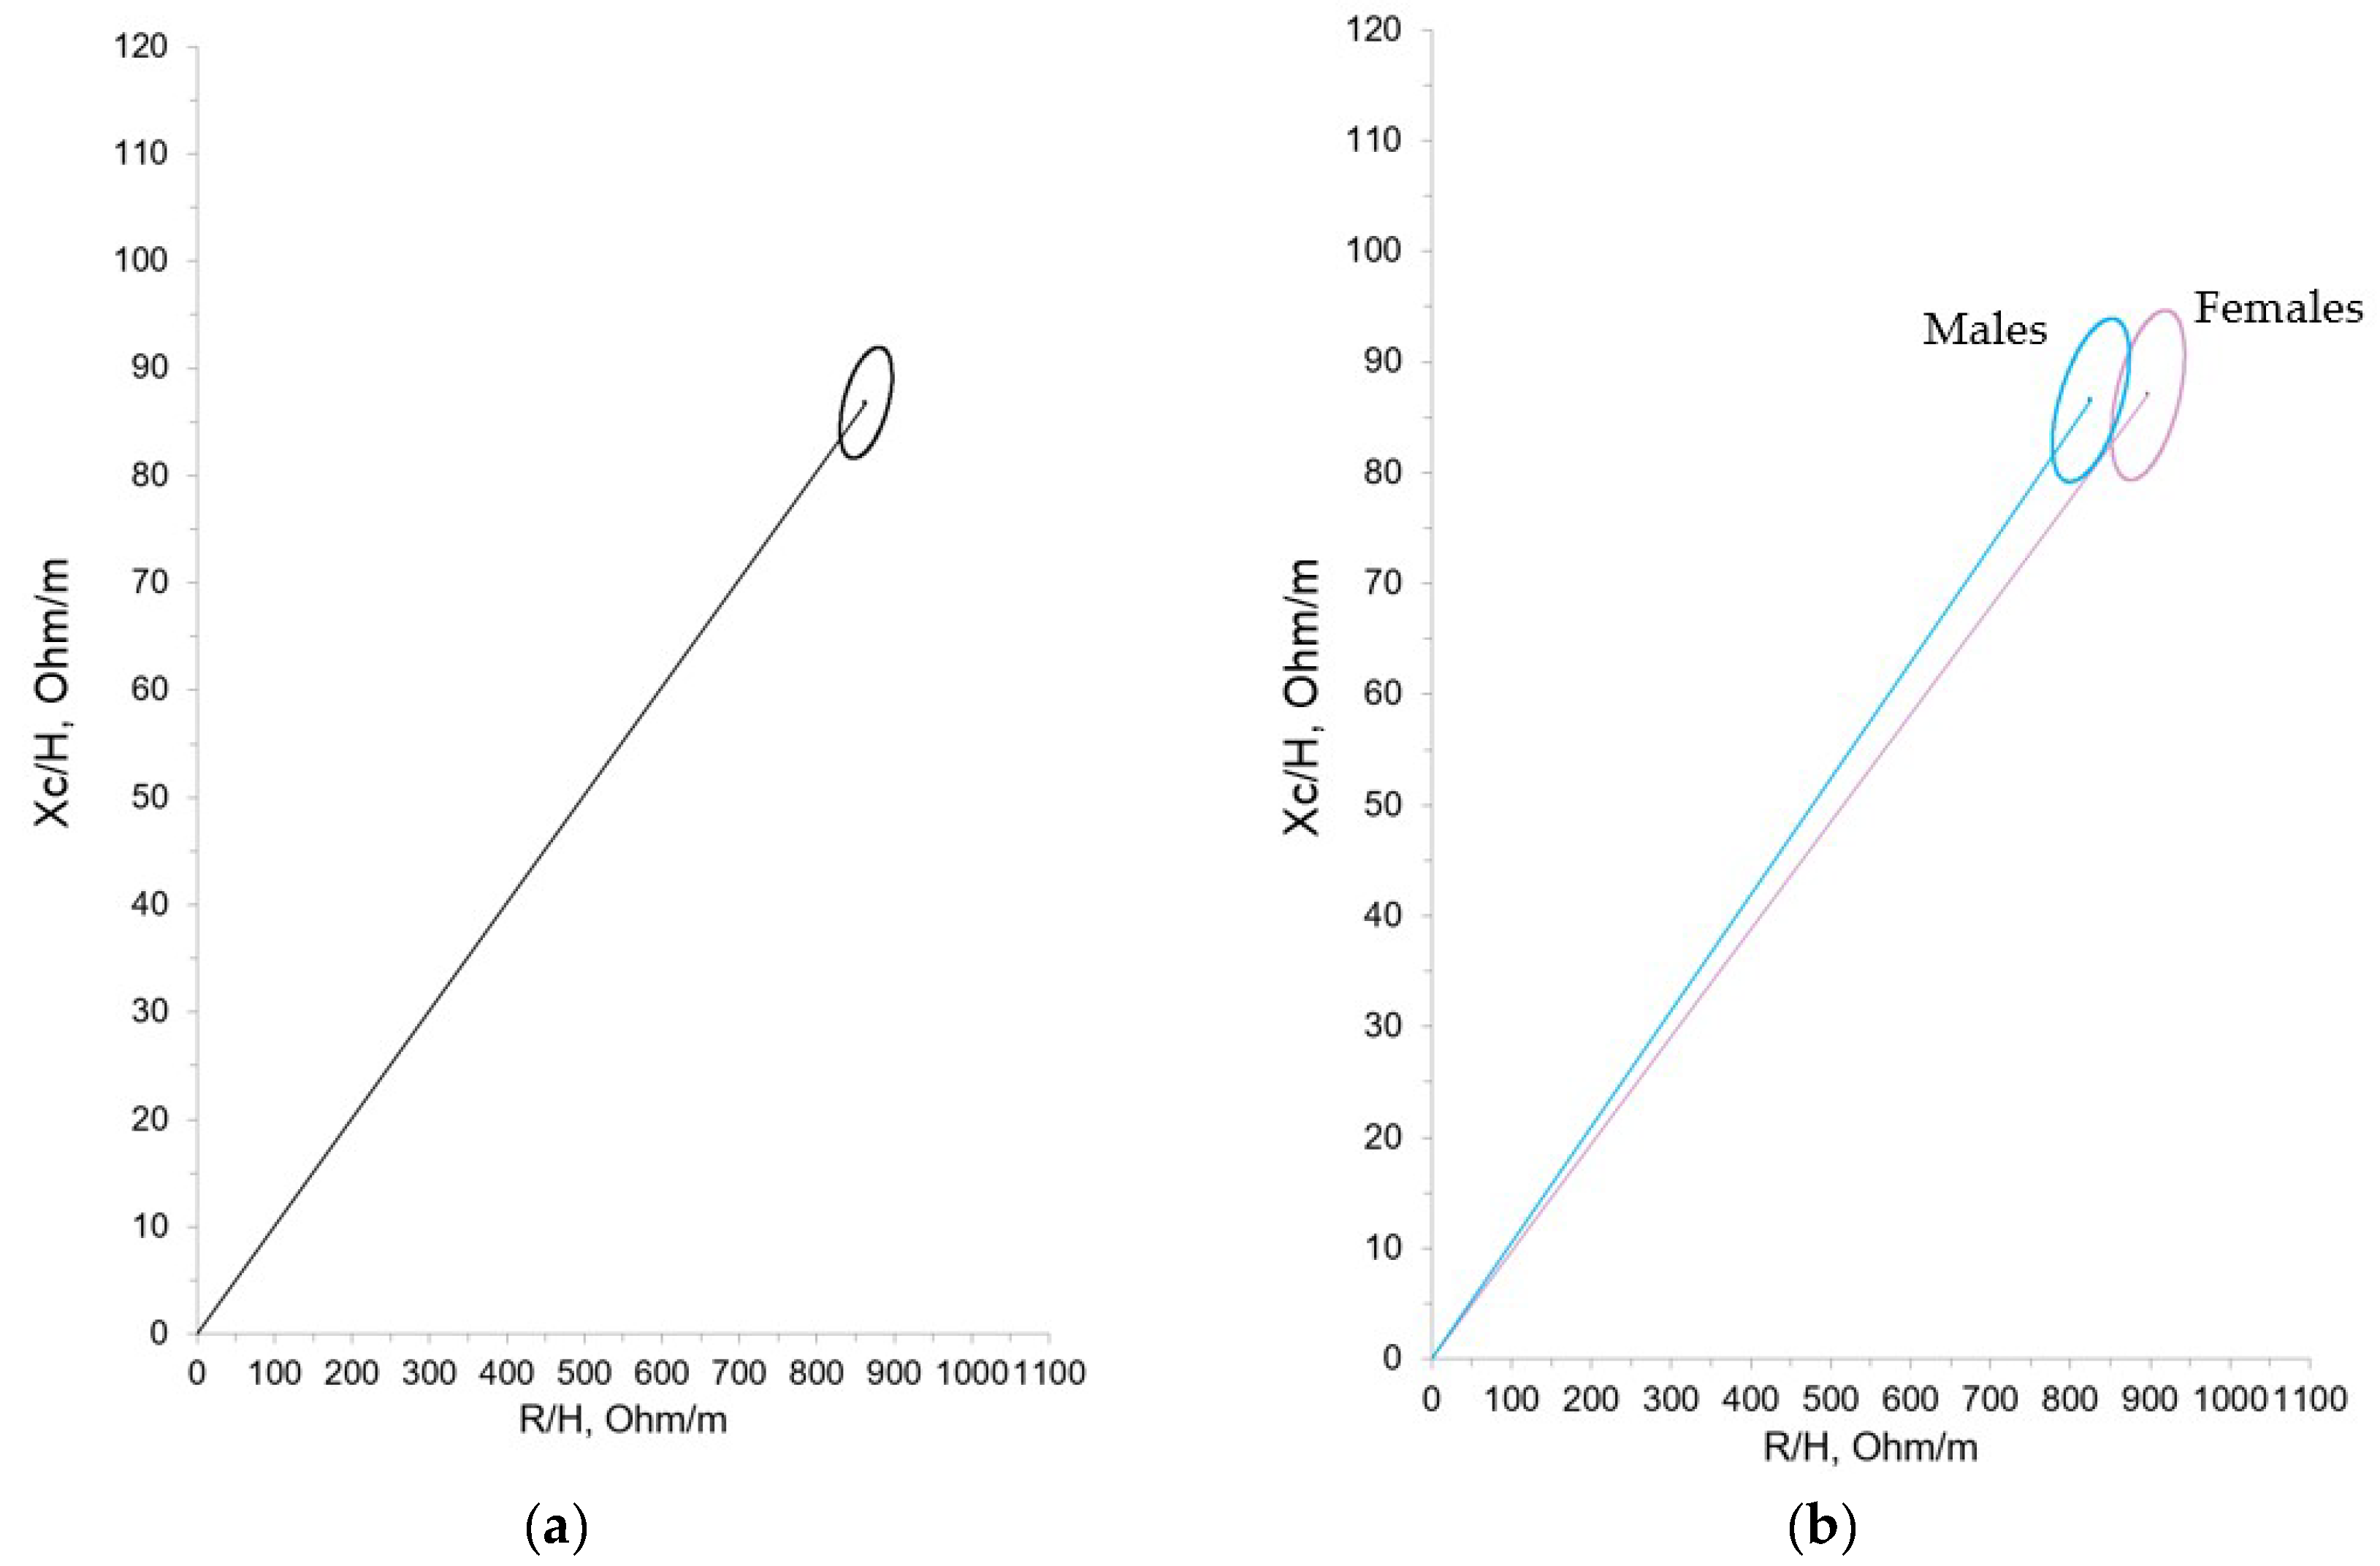
Figure 3.
Tolerance ellipses for extremely premature infants at term corrected age.
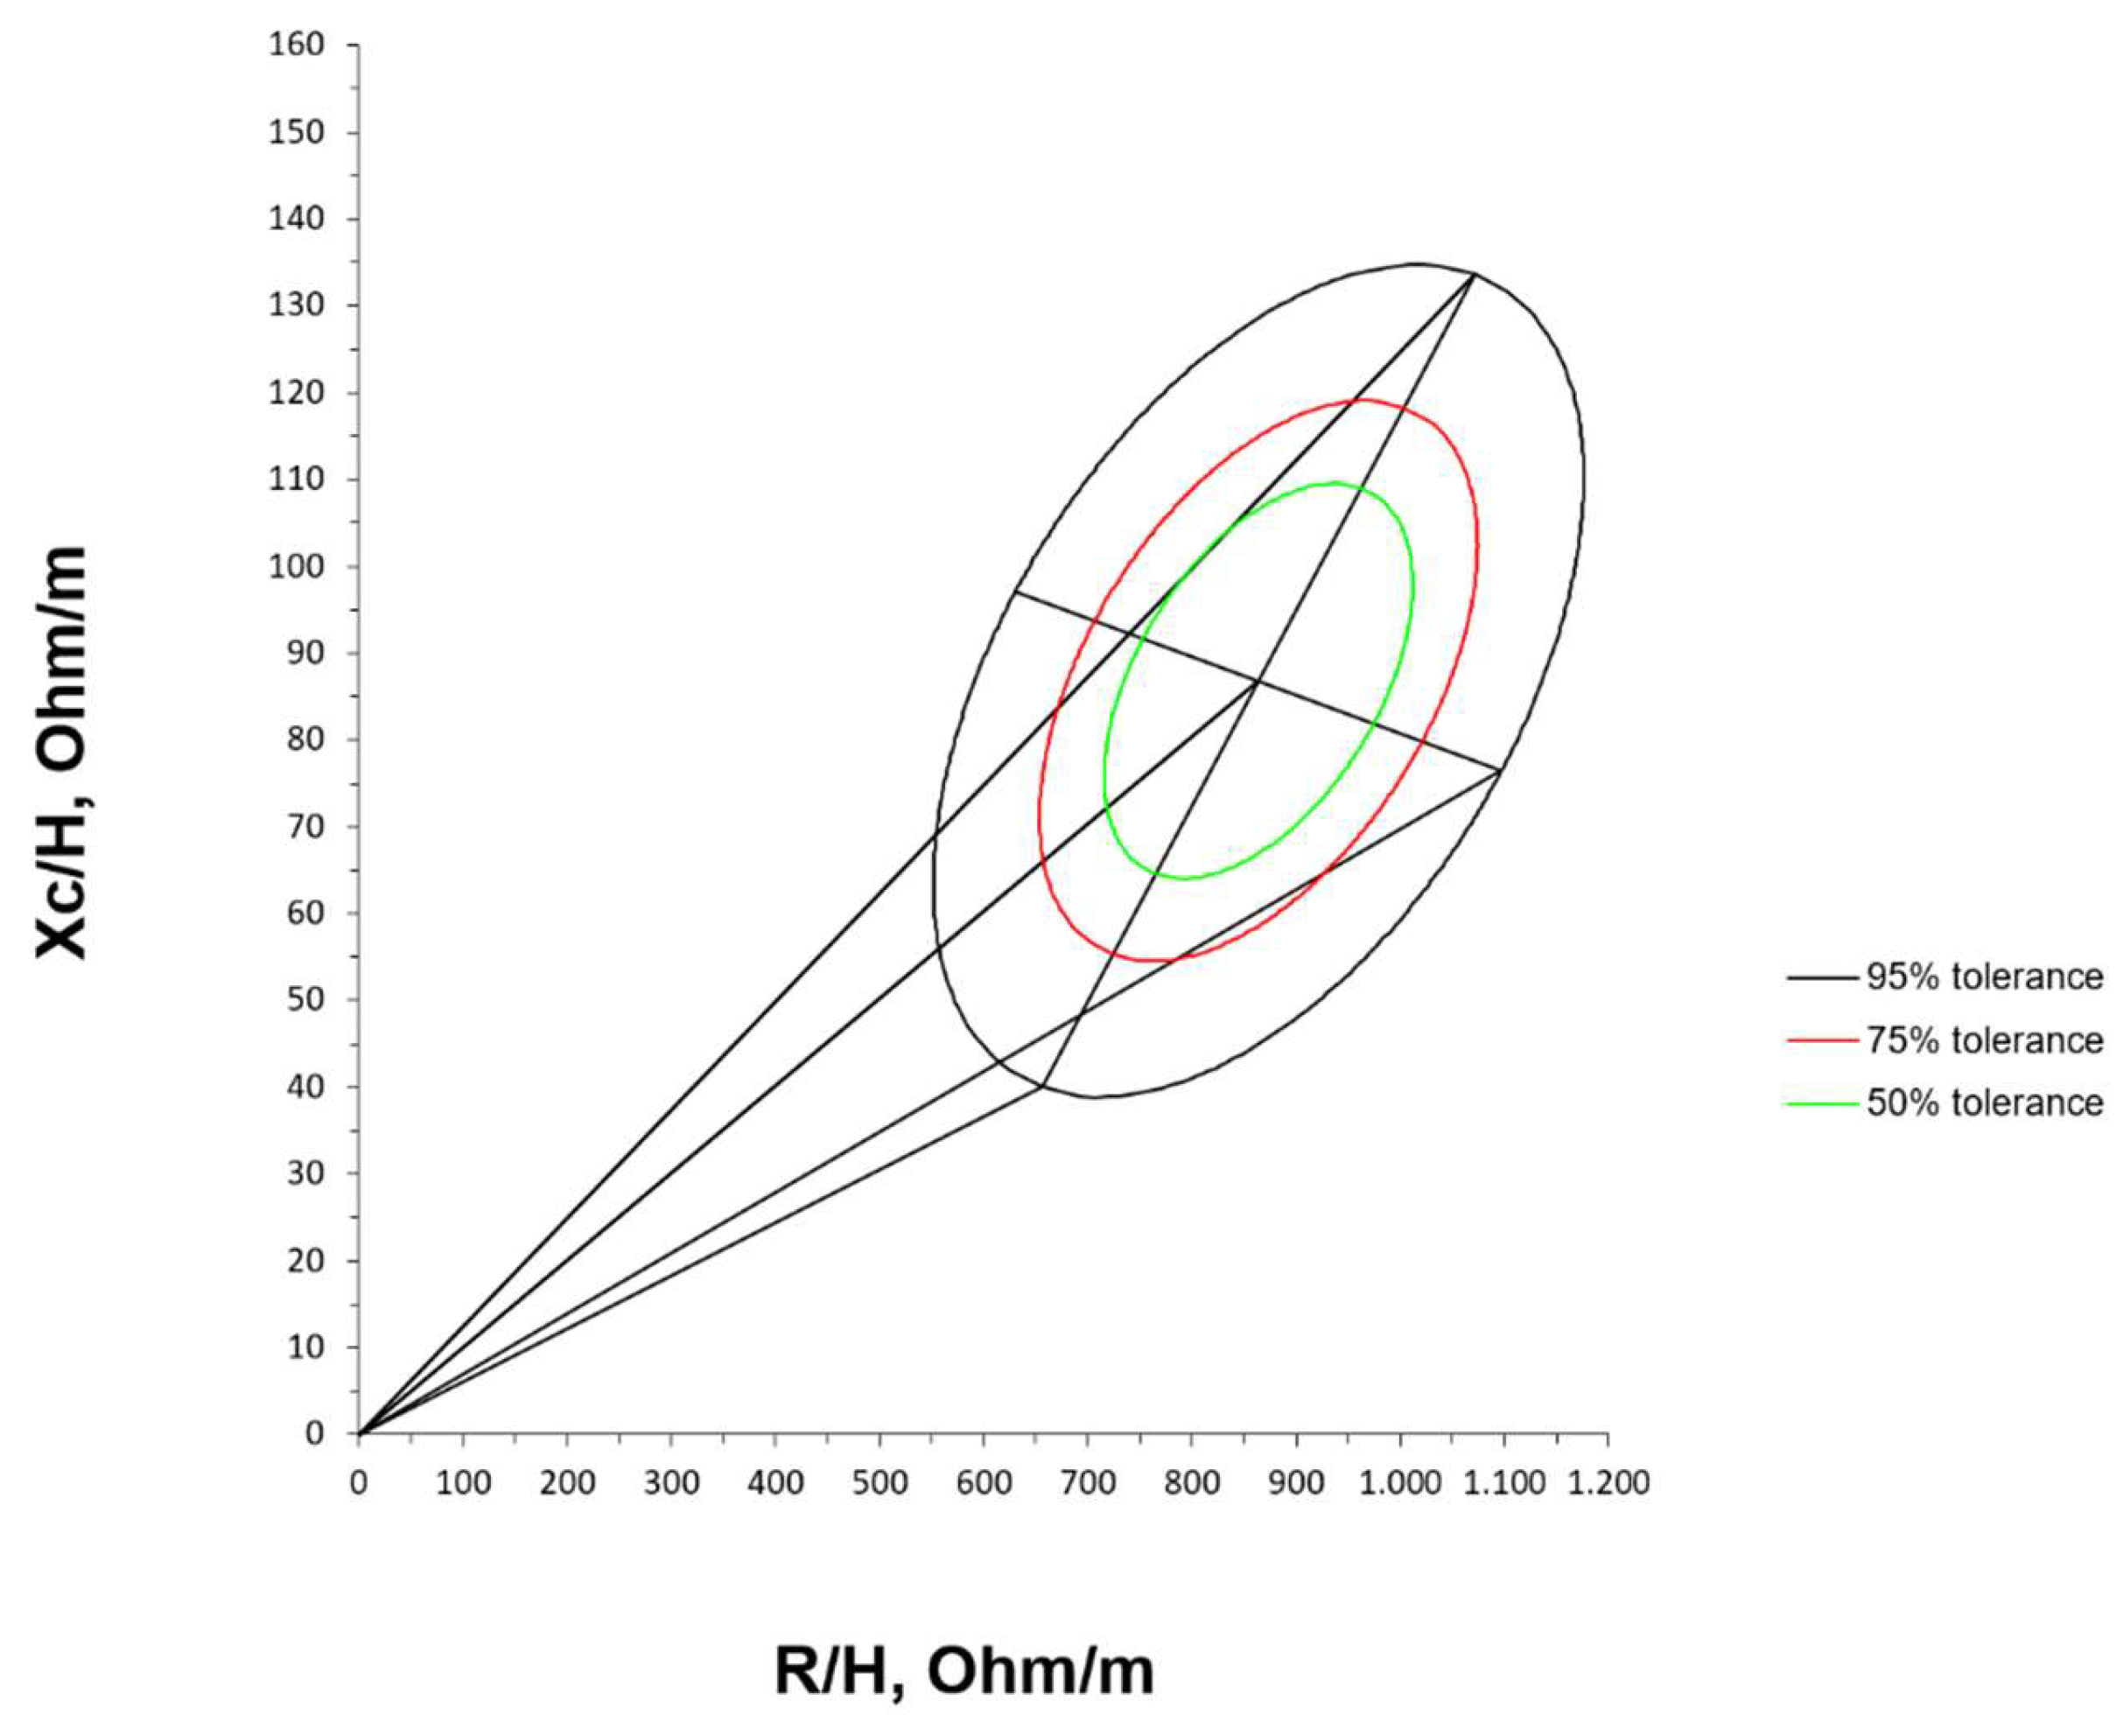
Figure 4.
Mean impedance vector with the 95% confidence ellipse for ELBW infants at term corrected age. (a) According to SGA; and (b) According to EUGR.
Figure 4.
Mean impedance vector with the 95% confidence ellipse for ELBW infants at term corrected age. (a) According to SGA; and (b) According to EUGR.
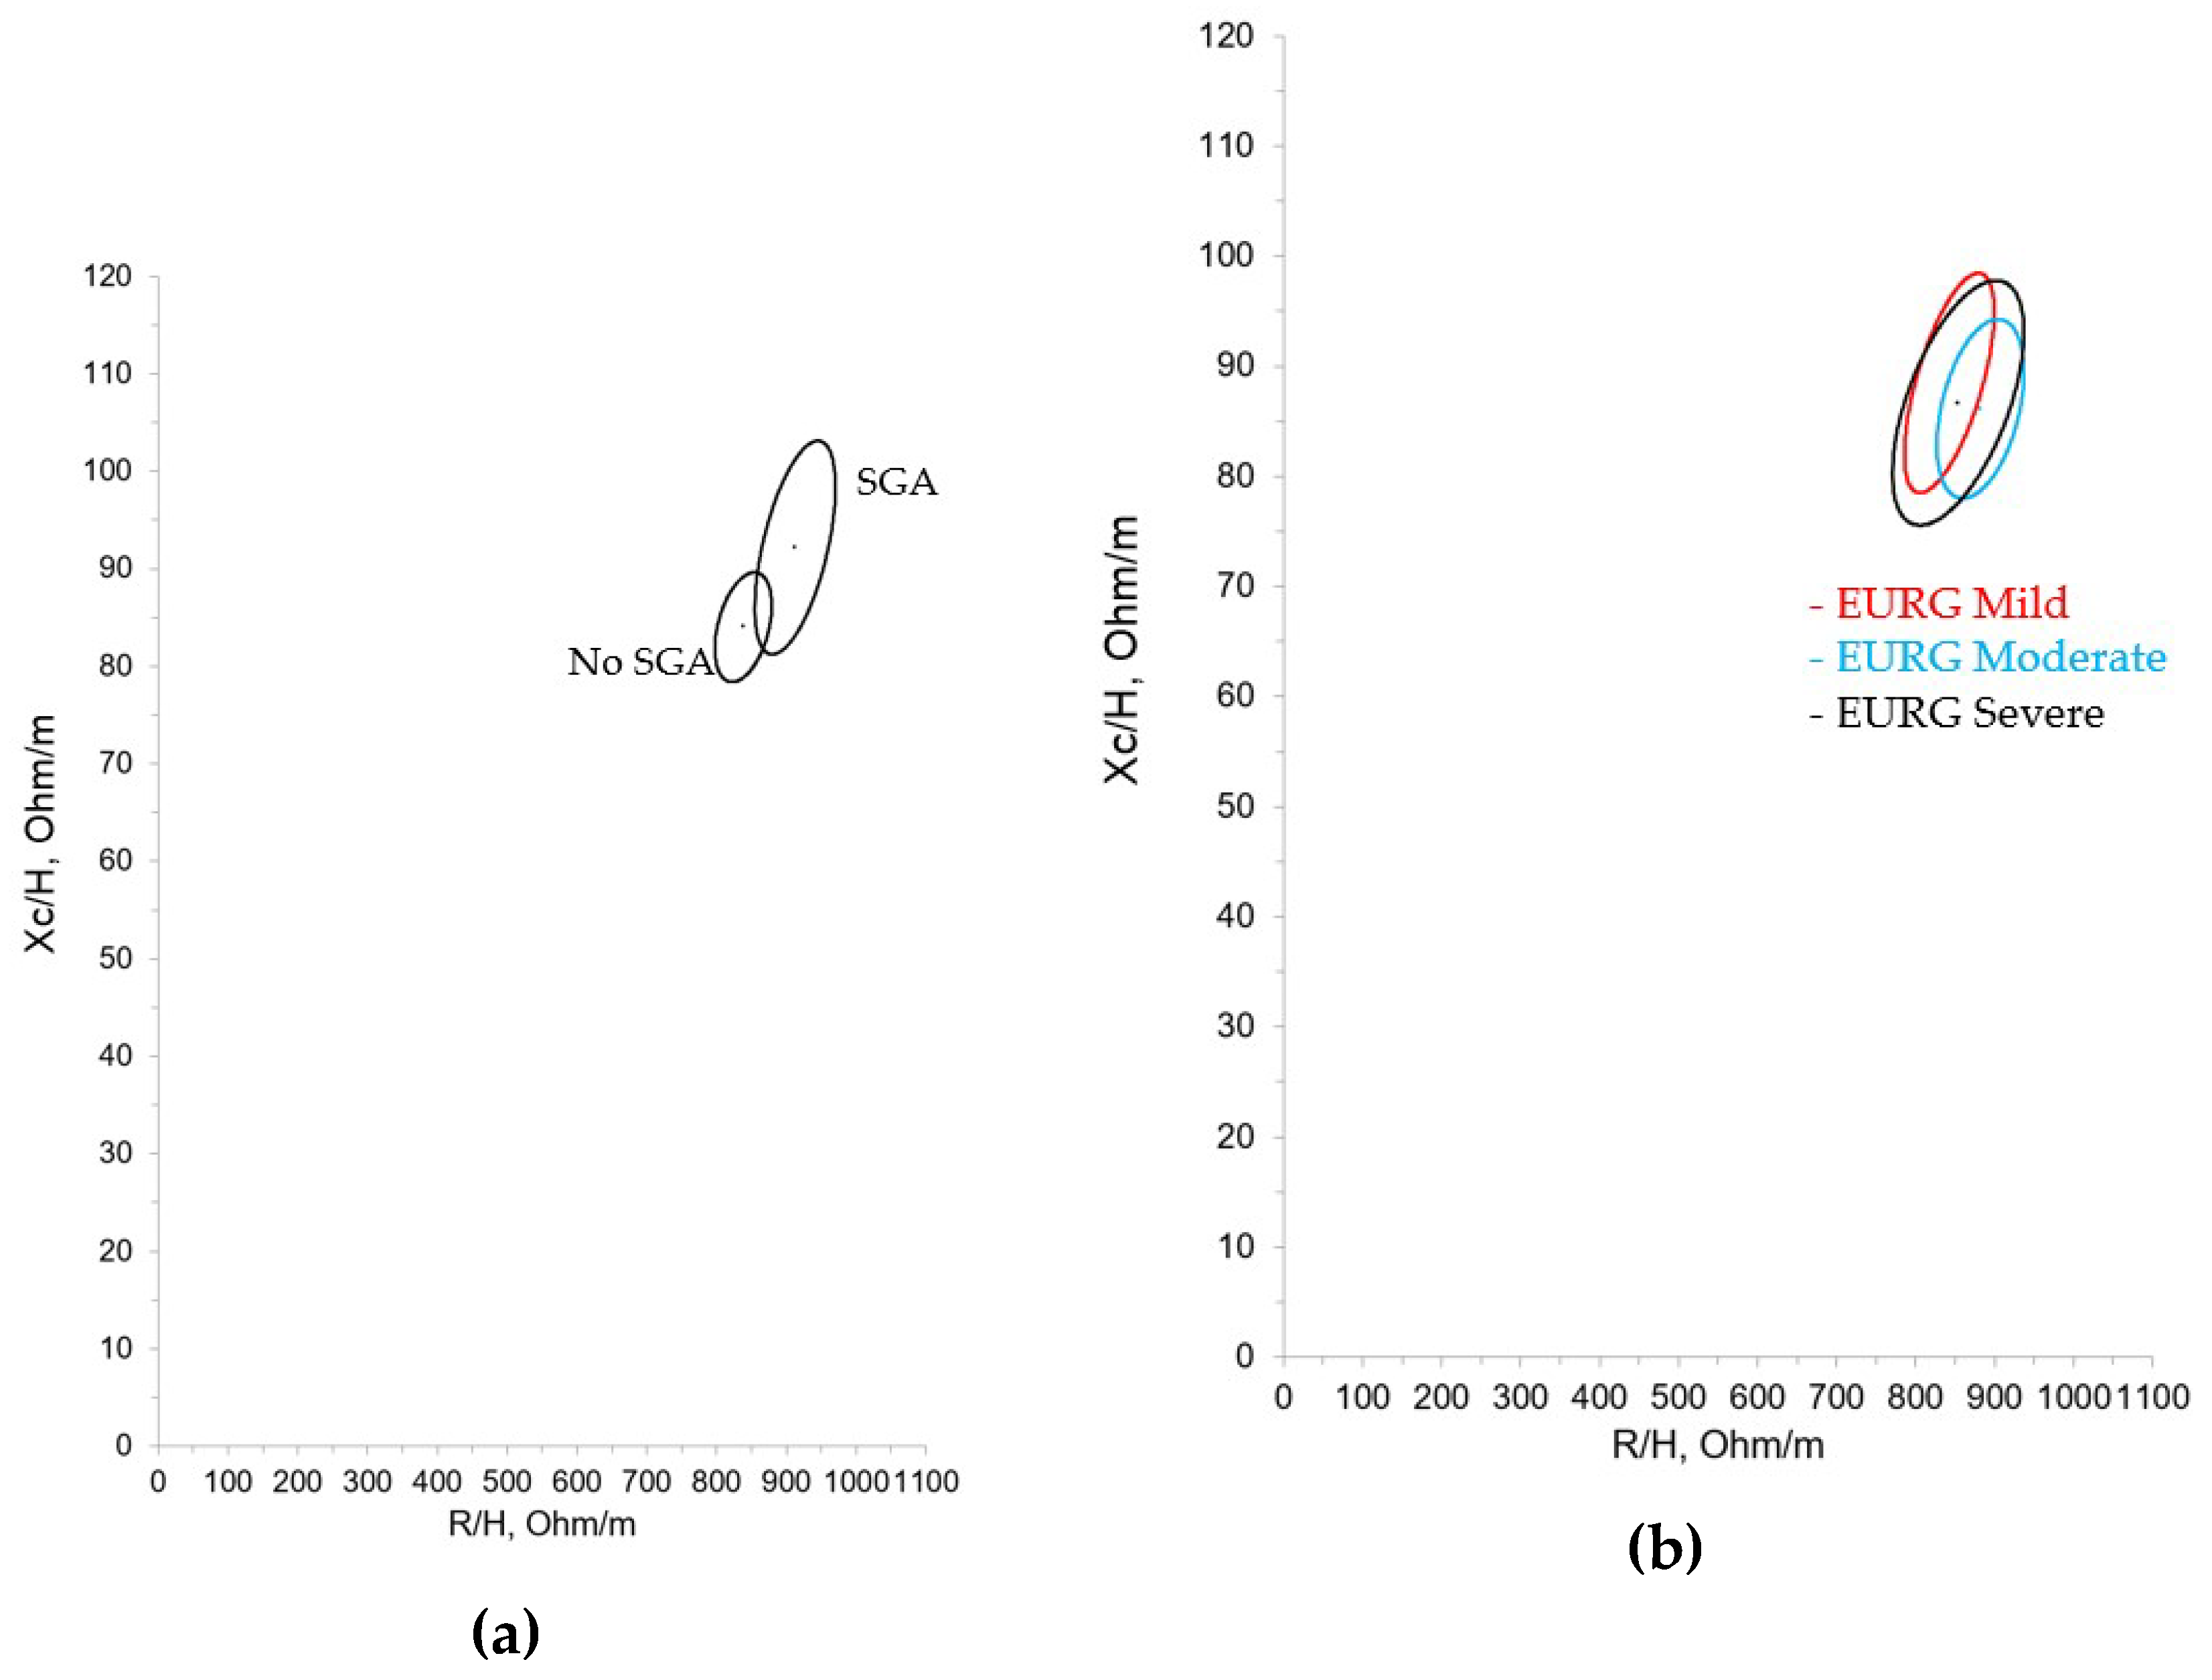
Figure 5.
Mean impedance vector with the 95% confidence ellipse for our cohort, Redondo del Río et al and Piccoli et al population.
Figure 5.
Mean impedance vector with the 95% confidence ellipse for our cohort, Redondo del Río et al and Piccoli et al population.
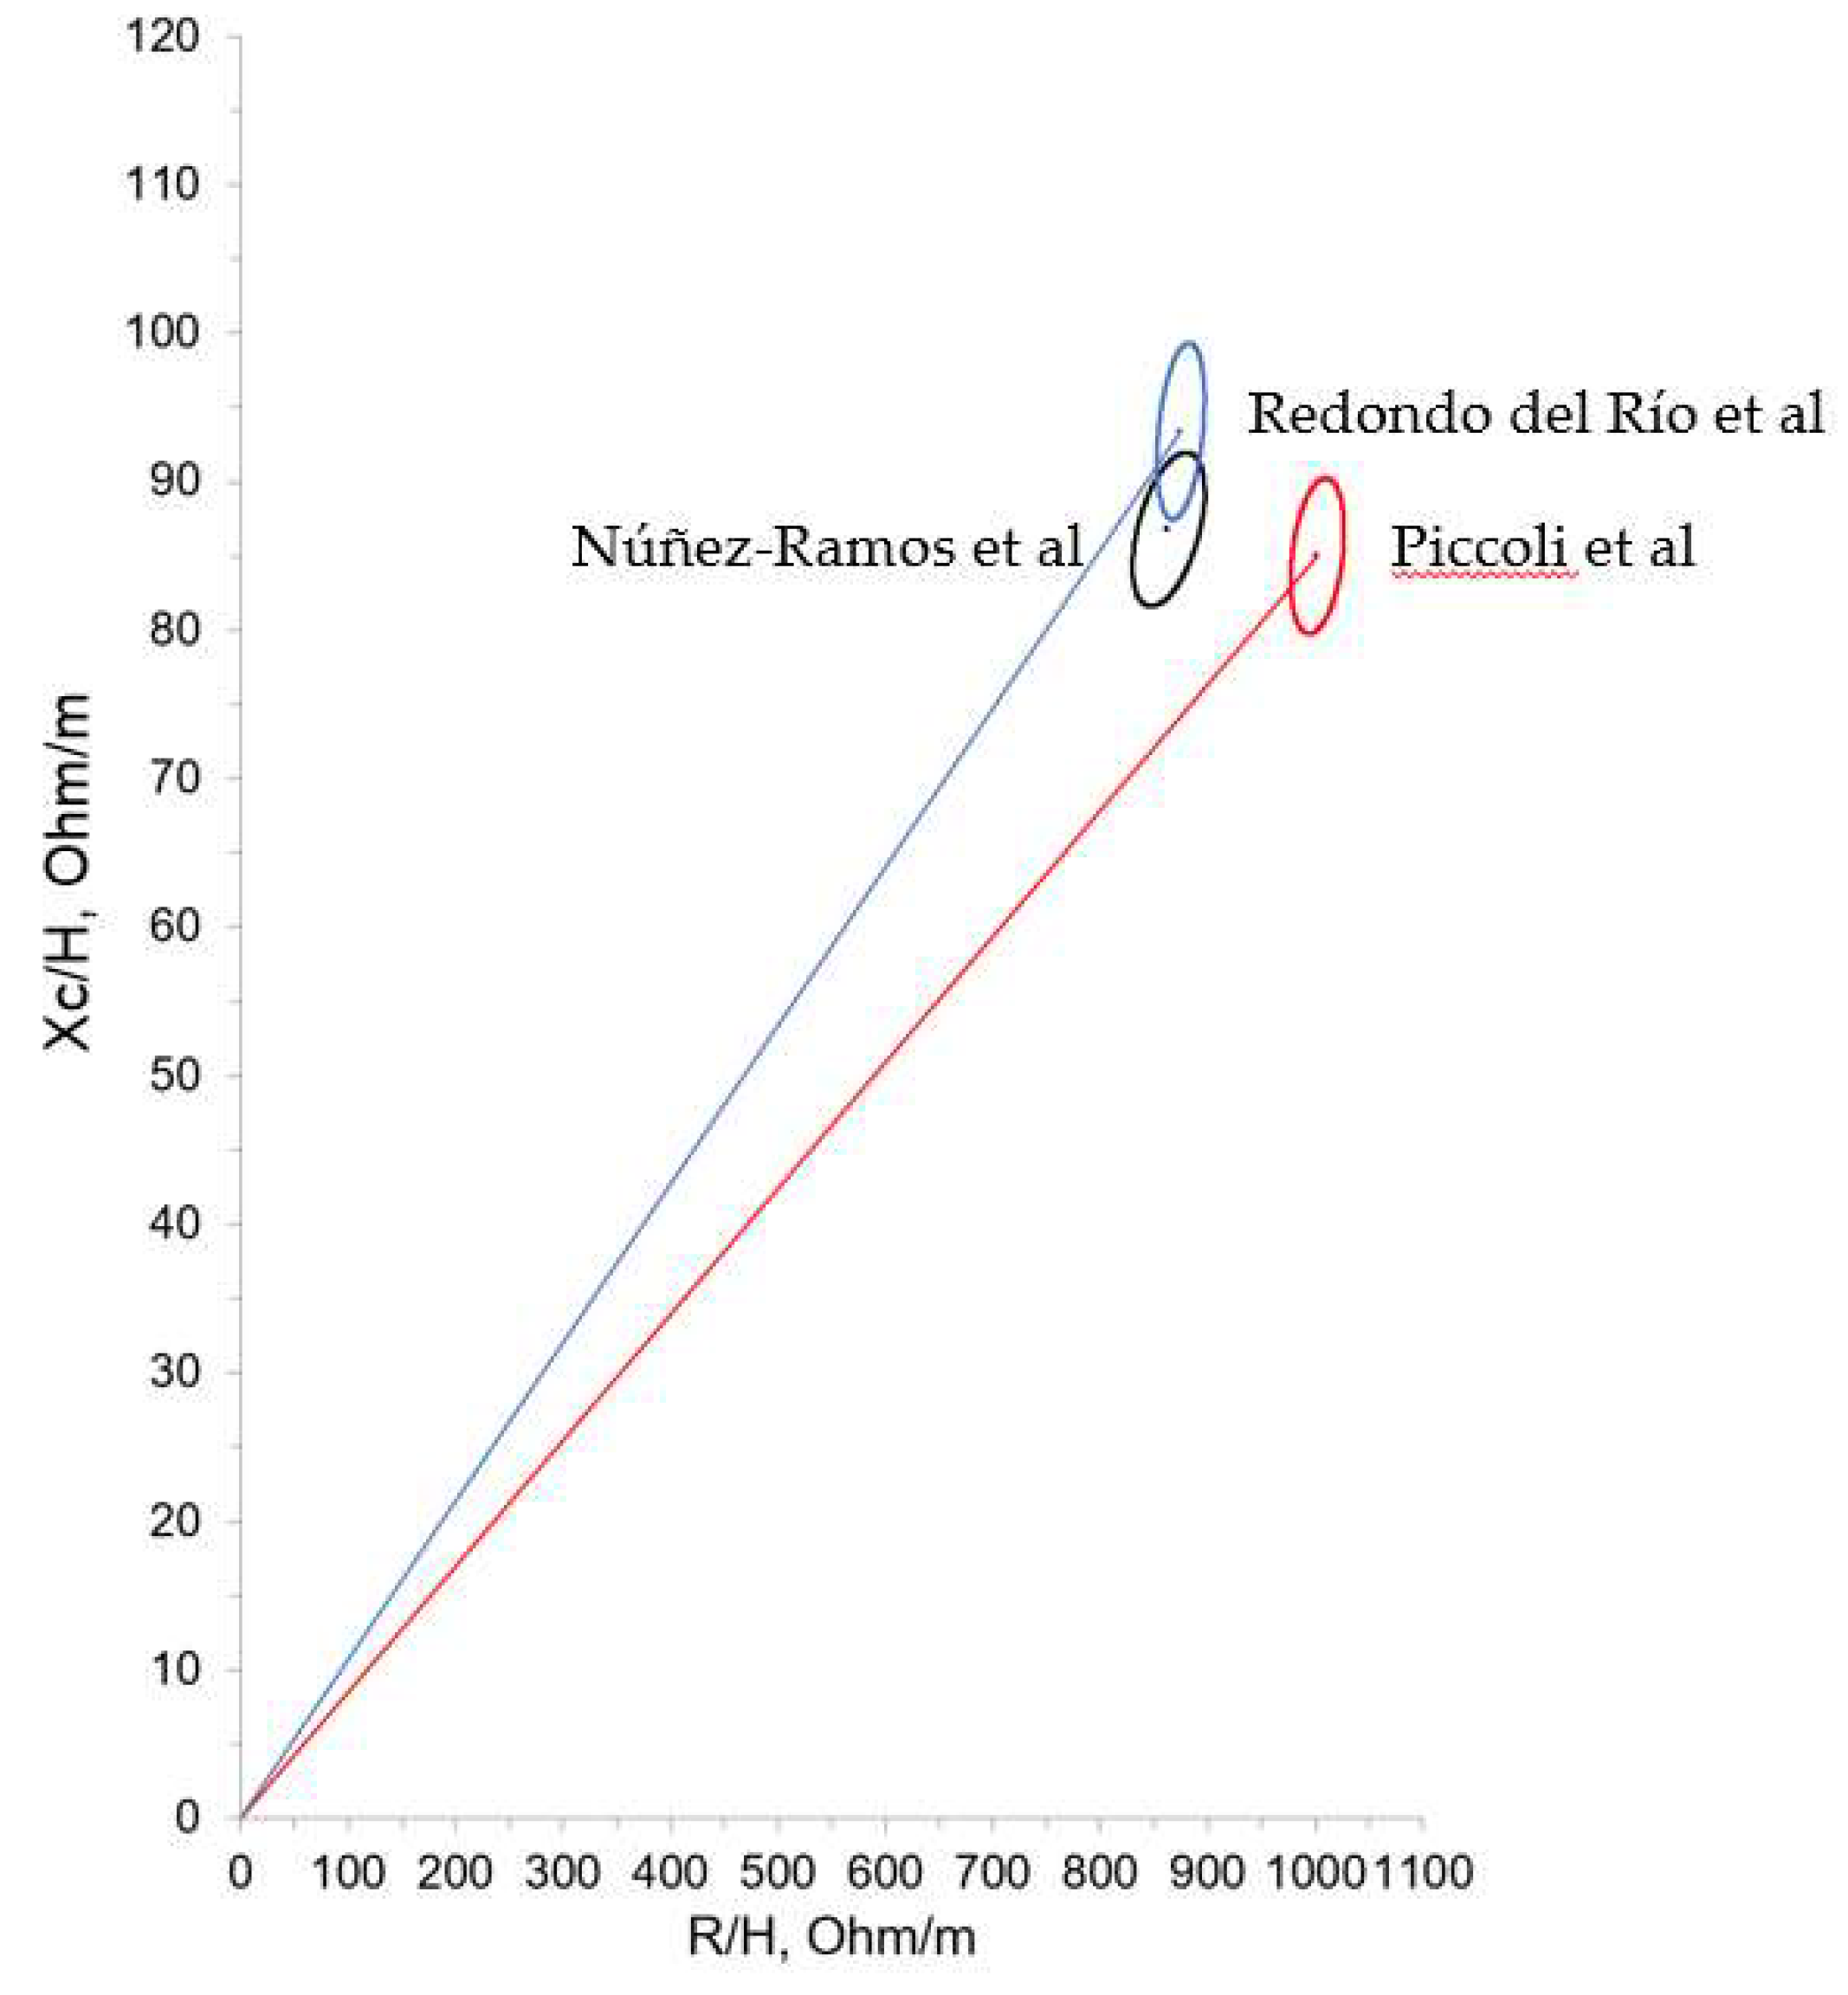
Figure 6.
Individual impedance vectors in Redondo et al. ellipses.
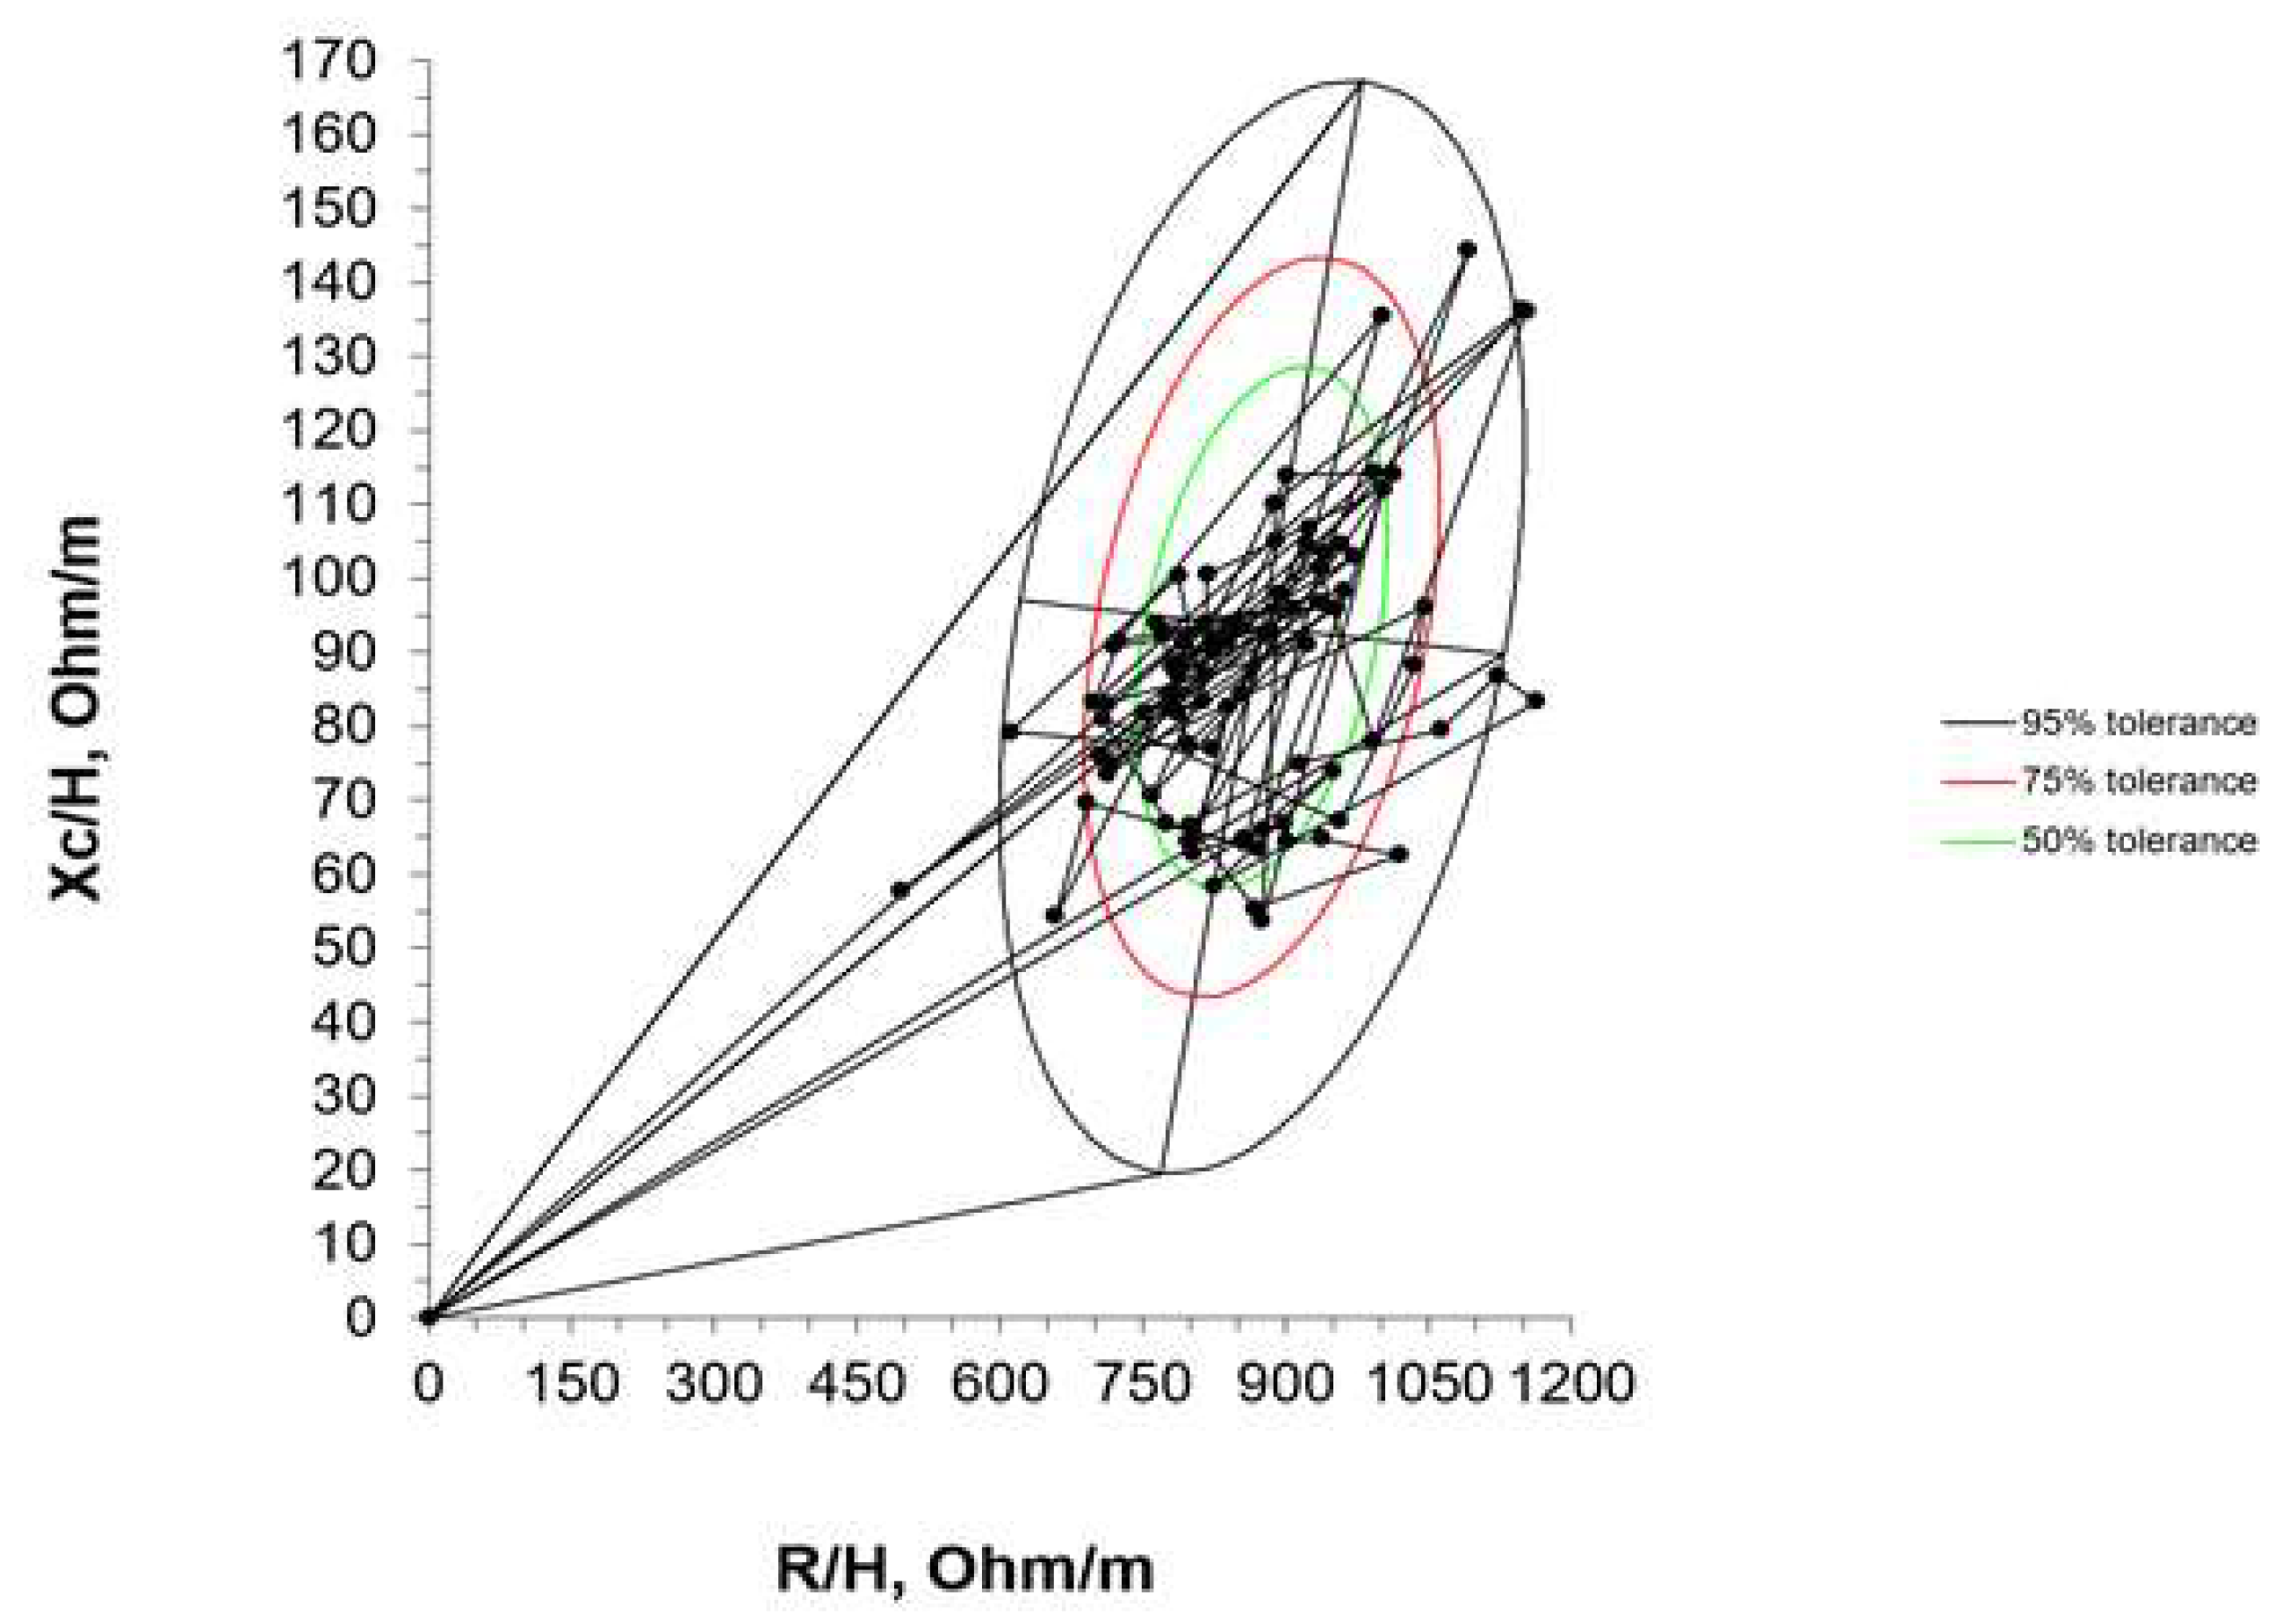

Table 1.
Bioelectrical data categorized by gender, expressed as mean (SD).
| Variable (mean y SD) | Total sample (n=85) | Females (n=45) | Males (n=40) | P Value |
|---|---|---|---|---|
| R (Ohm) | 379.14 (± 59.03) | 392.69 (± 44.87) | 363.90 (± 69.17) | 0.024 |
| R/H (Ohm/m) | 870.33 (±143.21) | 897.27 (± 120.11) | 840.01 (± 161.61) | 0.065 |
| Xc (Ohm) | 37.78 (± 7.82) | 38.02 (± 8.09) | 37.51 8( ± 7.60) | 0.77 |
| Xc/H (Ohm/m) | 86.84 (± 19.05) | 87.00 (± 20.02) | 86.65 (± 18.15) | 0.93 |
| Phase angle | 5.65 (± 1.09) | 5.44 (± 1.09) | 5.88 (± 1.05) | 0.061 |
| r | 0.4145 * | 0.4013 * | 0.4227 * |
r, linear correlation coefficient between R/H and Xc/H. * p< 0,05.
Table 2.
Bioelectrical data categorized by gender, expressed as mean (SD).
| Variable (mean and SD) | Total sample (n= 85) | IUGR | SGA | ||||
|---|---|---|---|---|---|---|---|
| Yes (n=34 ) | No (n=51 ) | P value | Yes (n=28) | No (n=57) | P value | ||
| R/H (Ohm/m) | 870.33 (±143.21) | 901.18 (± 180.71) | 849.75 (± 180.74) | 0.11 | 938.30 (±164.75) | 836.93 (± 119.31) | 0.002 |
| Xc/H (Ohm/m) | 86.84 (± 19.05) | 88.35 (± 22.68) | 85.83 (±16.37) | 0.55 | 92.26 (± 22.86) | 84.17 (± 16.45) | 0.065 |
| Phase angle | 5.65 (± 1.09) | 5.55 (±1.10) | 5.71 (± 1.09) | 0.51 | 5.56 (±1.13) | 5.69 (± 1.08) | 0.59 |
| R | 0.4145 * | 0.5951 * | 0.2678 | 0.5484 * | 0.3404 * | ||
r, linear correlation coefficient between R/H and Xc/H. * p< 0,05.
Table 3.
Bioelectrical data categorized according to EGR expressed as mean (SD).
| Variable (mean y SD) | EGR | |||
|---|---|---|---|---|
| Mild (n=31) | Moderate (n=37) | Severe (n=17) | P Value | |
| R/H (Ohm/m) | 867.93 (± 167.77) | 879.94 (± 132.31) | 853.76 (± 122.47) | 0.82 |
| Xc/H (Ohm/m) | 88.37 (± 20.48) | 85.63 (± 19.37) | 86.67 (± 16.35) | 0.84 |
| Phase angle | 5.87 (± 1.10) | 5.49 (± 1.18) | 5.74 (± 0.84) | 0.51 |
| r | 0.4480 * | 0.4144 * | 0.2696 | |
r, linear correlation coefficient between R/H and Xc/H. * p< 0,05.
Disclaimer/Publisher’s Note: The statements, opinions and data contained in all publications are solely those of the individual author(s) and contributor(s) and not of MDPI and/or the editor(s). MDPI and/or the editor(s) disclaim responsibility for any injury to people or property resulting from any ideas, methods, instructions or products referred to in the content. |
© 2024 by the authors. Licensee MDPI, Basel, Switzerland. This article is an open access article distributed under the terms and conditions of the Creative Commons Attribution (CC BY) license (http://creativecommons.org/licenses/by/4.0/).
Copyright: This open access article is published under a Creative Commons CC BY 4.0 license, which permit the free download, distribution, and reuse, provided that the author and preprint are cited in any reuse.


