Preprint
Article

This version is not peer-reviewed.

Assessment of the Nutritional Status of a Hospitalized Children by Using Growth Parameters Ad Indicators: A Cross-Sectional Study

Submitted:

21 November 2024

Posted:

22 November 2024

You are already at the latest version

Abstract

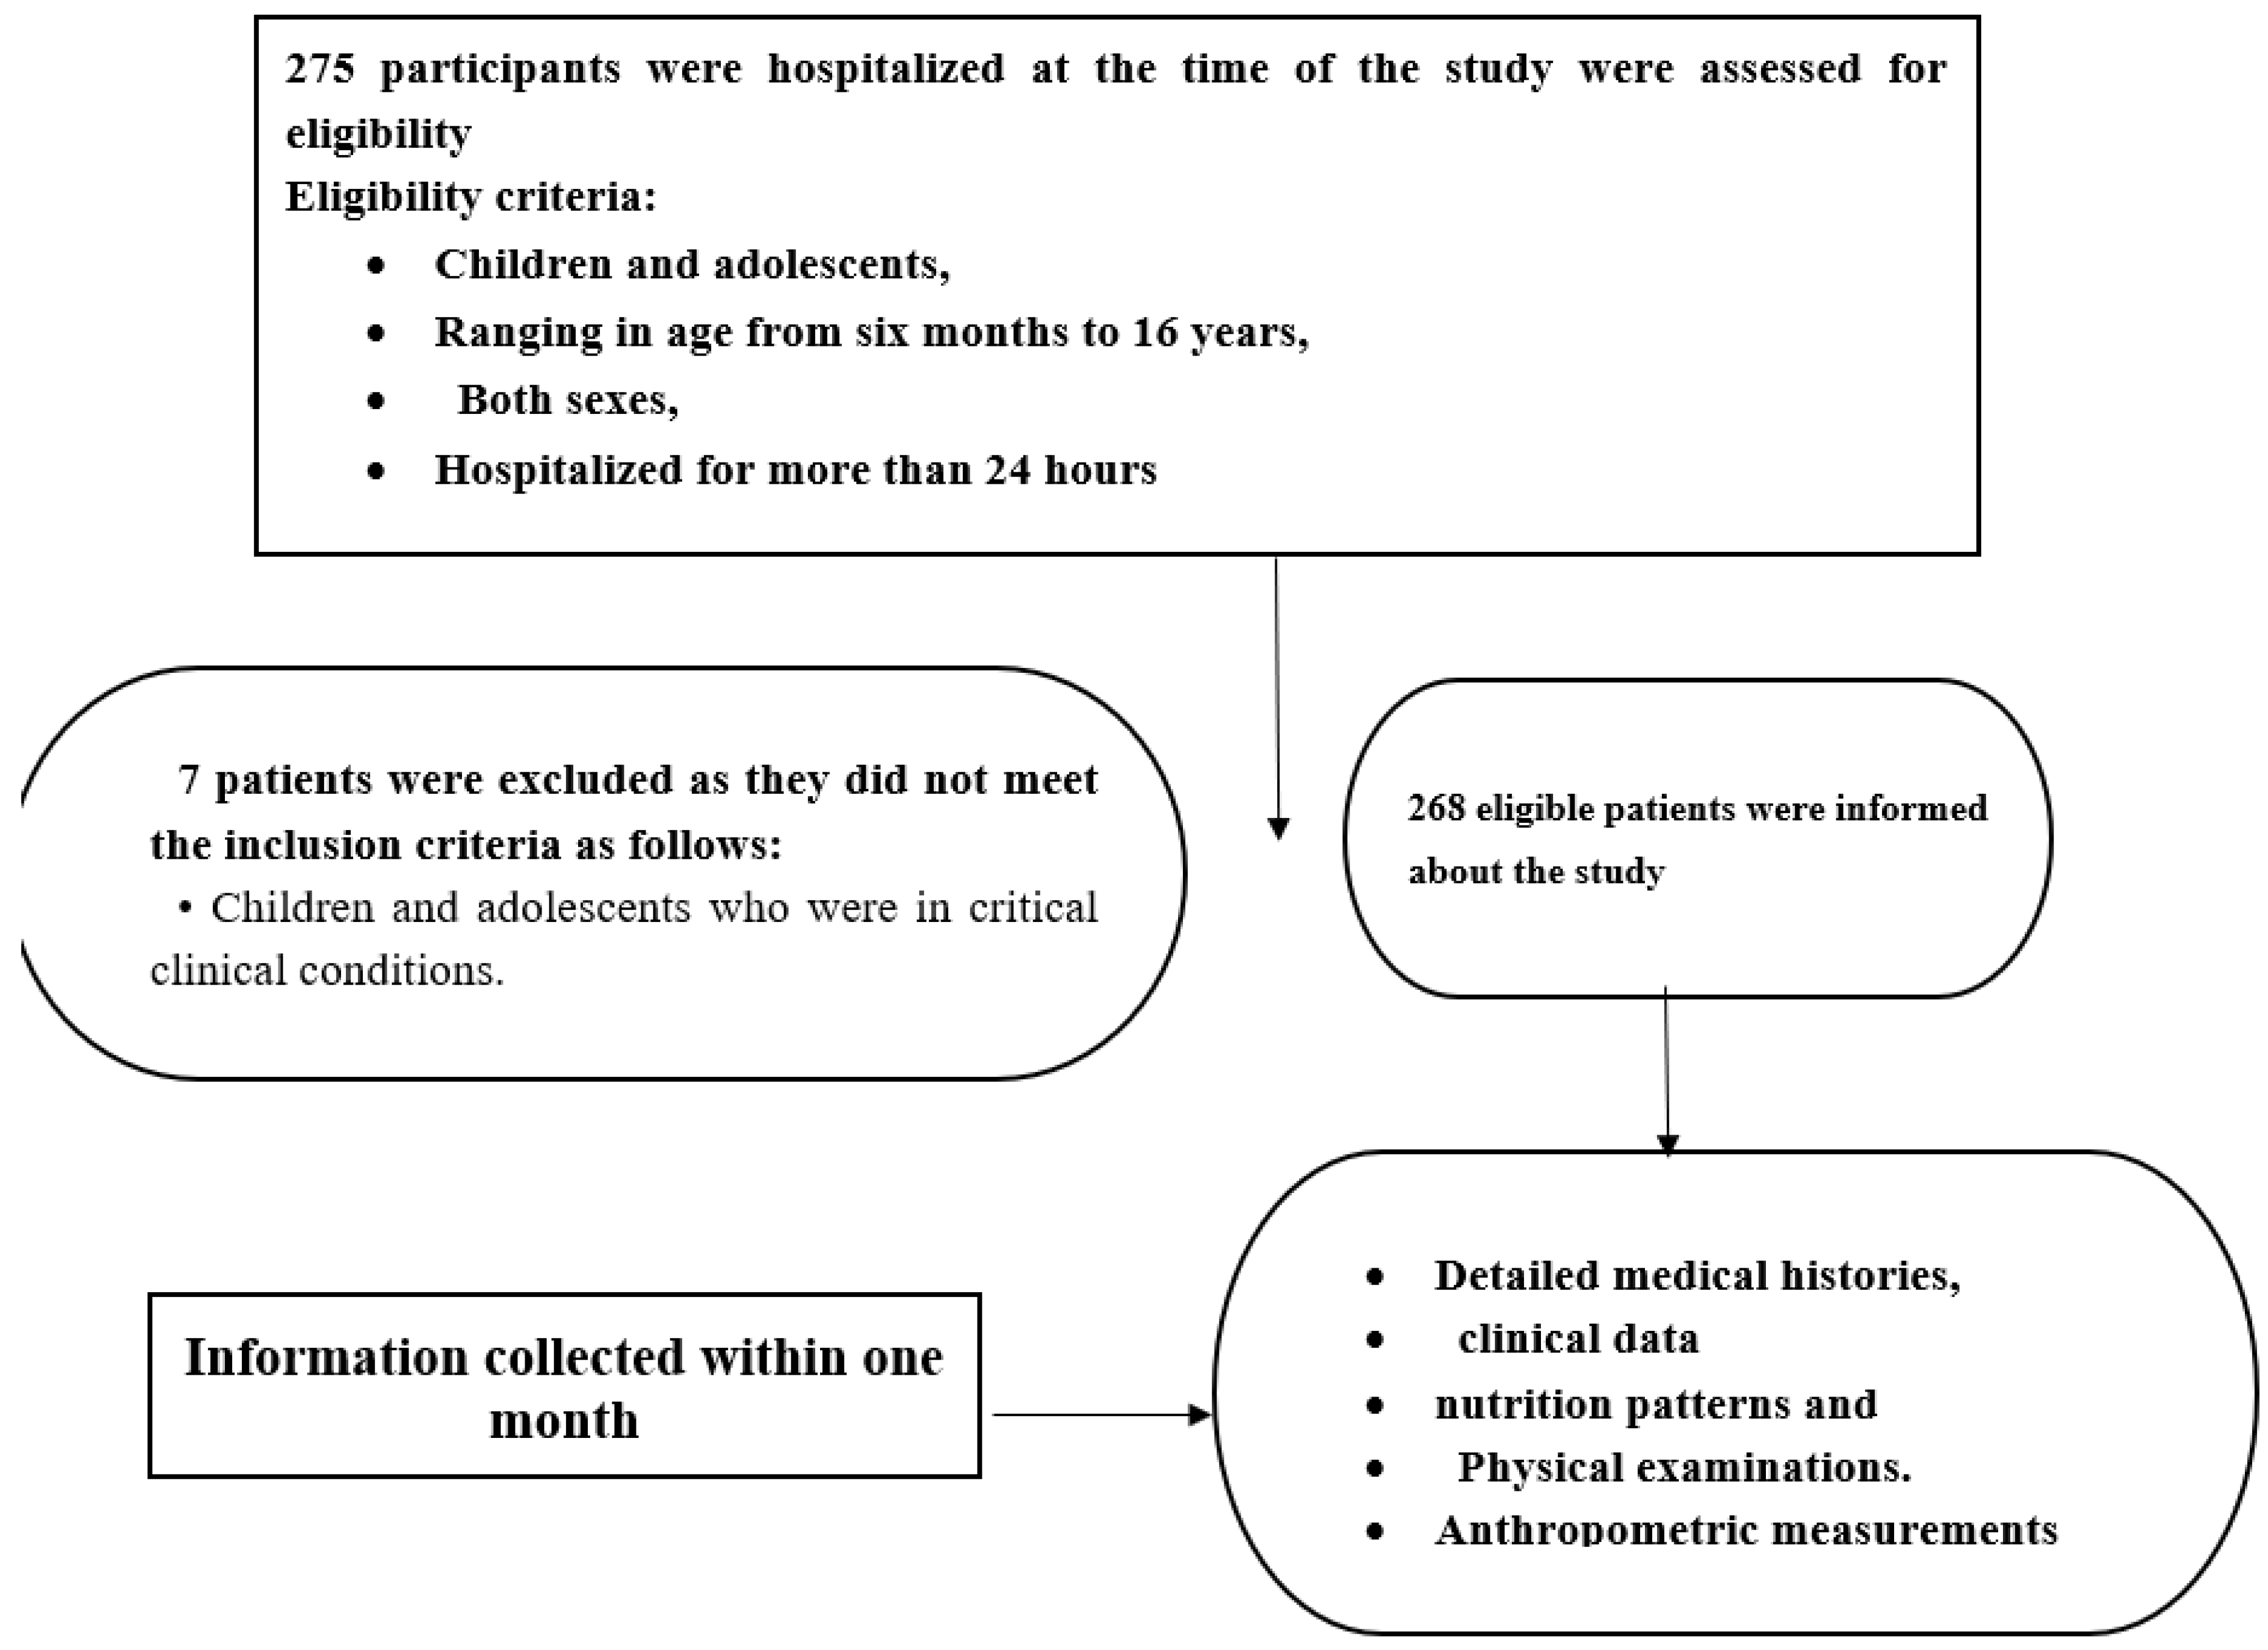
Background: Child development is multifaceted and depends on various elements including diet, genetic makeup, environmental conditions, and exposure to infections. Proper nutrition significantly impacts a child’s capacity to manage and recover from illness. Thus, evaluating nutritional health is a fundamental aspect of pediatric healthcare. Objective: The current study assesses the nutritional status of hospitalized children and adolescents by analyzing growth parameters related to age, weight, height, and gender, identifying disparities , and determining influencing risk factors. Methods: A single-center cross-sectional study was conducted at Mohamed El-Alamin Hamed Hospital for children in Khartoum-Sudan. The study focused on children and adolescents aged six months to 16 years who were hospitalized for over 24 hours, excluding those in critical conditions, selected by purposive sampling. Caregivers were interviewed after consent was obtained, with data collected through detailed medical histories, physical examination, and a specialized questionnaire. Results: Two hundred sixty-eight subjects were enrolled in this study. Among them, males accounted for 146 (54.5%), with a male-to-female ratio of 1.2:1. A total of 199 (74.2%) of the subjects had a height/length for age >-2 z-score (normal), 49 (18.3%) had a <-3 z-score (severe stunting), whereas 20 (7.4%) had -3 to -2 z-score (moderate stunting). Sixteen (6.0%) children were classified as weighing 1+ to +2 SD (overweight), and 14 (5.2%) were >+3 SD (obese). Regarding nutrition status, 161 (60%) had normal malnutrition, 32 (11.9%) had moderate wasting, and 45 (16.8%) had severe wasting. Grade 2 edema was observed in four (8.9%) children, and only three (9.4%) had grade 3 edema. Malnutrition risk factors significantly correlated with the female gender, hospital admission rate, and the absence of exclusive breastfeeding (p<0.001). Conclusion: The study reveals critical insight into pediatric nutritional health. A notable prevalence of stunting and acute malnutrition was observed, particularly among the youngest age groups, with a higher frequency of stunting in males. Severe acute malnutrition and muscle wasting were more common among females, while overweight and obesity were prevalent in children aged 5-10 years. The findings underscore the importance of early nutritional interventions, especially considering the significant correlation found between malnutrition risk factors and variables such as age, gender, hospital admission rate, and exclusive breastfeeding.

Keywords: 
;  ;  ;  ;  ;  ;  

Introduction

Importance of Nutritional Assessment and Growth Monitoring in Pediatric Care

Children's growth is a complex process influenced by a variety of factors such as nutritional status, infections, genetics, and environment. Proper nutrition has a significant impact on a child's ability to resist and recover from illnesses; hence, nutritional assessment is an important part of pediatric care. This evaluation includes a thorough medical history, a physical exam, and measurements of growth parameters such as weight, height (or stature/length), mid-upper arm circumference (MUAC), and head circumference. Age- and gender-specific growth charts are important tools for detecting abnormalities and comparing growth to established reference standards. They help to plan nutritional interventions, manage health conditions, and monitor disease progression. Growth monitoring is quick, inexpensive, and non-invasive, relying on simple instruments that require trained personnel to ensure measurement accuracy and proper equipment use(1-3).

Key indices and Their Implications for Assessing Child Nutrition

1. Weight for Height Index: This index reflects recent weight changes. Low weight for height indicates muscle wasting and can signal acute malnutrition, often linked to severe illness, starvation, or chronic conditions. Conversely, elevated weight-for-height may indicate overweight. The lean body mass index (BMI) is used in population surveys to assess obesity, heaviness, and their burden (3-5).
2. Height-for-Age Index: This index reflects skeletal growth, with low height-for-age (stunting) often indicating chronic malnutrition and the inability to achieve standard linear growth due to nutritional deficits or health issues(1-4).
3. Weight-for-Age Index: This measure compares body mass to chronological age and can detect underweight, wasting, or stunting, though it may be influenced by the child's height and weight. Assessing both height-for-age and weight-for-height helps distinguish between a short child and a thin yet tall child, providing information about acute versus chronic health and nutrition issues(4-6).
4. Mid-Upper Arm Circumference (MUAC), MUAC for Age, MUAC for Height, BMI for Age, and Head Circumference: These indicators assess chronic nutritional concerns in children, providing a fuller picture of their health status (6,7).
A detailed medical history can uncover malnutrition-related health conditions, such as chronic diseases, disabilities, and medication use. Physical signs, like fatty stools, may suggest malabsorption or conditions like pancreatic insufficiency or celiac disease. At the same time, symptoms like sunken eyes and poor skin elasticity may indicate dehydration, especially following diarrhea. Laboratory tests, such as serum albumin (which indicates dietary protein adequacy), urinary creatinine (which indicates muscle catabolism), and serum transferrin (which measures iron levels), can provide information about nutritional status (8).
A thorough dietary history, including 24-hour dietary recall, helps assess nutritional intake and vaccination status to prevent infections that could exacerbate malnutrition. Malnutrition in children and adolescents often results from chronic causes and has lifelong impacts, including delayed mental development, intellectual disabilities, and growth retardation (9).

Role of Nutritional Intervention and a Balanced Diet in Pediatric Care

Early nutritional intervention is crucial in improving a child’s long-term health and quality of life (10-12). Nutritional status balances food intake and the body's ability to use it, and it is influenced by health, physical activity, and biochemical processes. A well-balanced diet that includes essential nutrients for daily use is essential for good nutrition. The term "malnutrition" encompasses both "under nutrition" and "overnutrition," including indicators such as underweight, wasting (acute malnutrition), stunting, and overweight. Each reflects various nutritional imbalances that can lead to developmental delays, intellectual disabilities, and other lifelong health impacts in children and adolescents.

Study Rationale

Good nutrition is crucial for growth and development. Child growth is an important indicator of health internationally. The right to health and sufficient food are fundamentally human rights. The Millennium Development Goals (MDGs) highlight the significance of preventing poverty, hunger, child and maternal deaths, human immunodeficiency virus (HIV)/acquired immunodeficiency syndrome (AIDS) eradication, malaria, tuberculosis, and other infectious diseases. Despite all these commitments, mortality is still high among young children in African countries. Developed countries have less than a 1% risk of infant death, whereas, in developing countries, the risk is around 10% or even higher. These disparities can be significant among the poor and rich or rural and urban societies within the same country (4, 13-16). In our practice, we observed many subjects hospitalized due to minor diseases, and some were undernourished. Therefore, we aim to measure the magnitude of this problem.

Current Research Questions to Address the Gaps

  • What is the prevalence of undernutrition among hospitalized children and adolescents?
  • What specific growth charts are used in growth screening for pediatric nutritional assessment?
  • What potential risk factors may affect the anthropometric measurements of hospitalized children and adolescents?

Aims and Objectives

The main objective of this study was to assess the nutritional status of the hospitalized children and adolescents by using growth parameters according to their age, weight, height, and gender, and to determine the risk factors that may affect their anthropometric measurements.

Ethical Approval

All work conducted in this research aligned with Helsinki's research ethics. The collected data were used only for analysis to ensure privacy and confidentiality. Ethical approval was obtained from the administrative authorities at the Hospital (Institute review board). The study was exempt from human-subject study requirements and did not require ongoing Institutional Review Board (IRB) oversight because it posed no more than minimal risk. Additionally, all research procedures fell within the exemption categories of the Federal Ministry of Health-IRB regulations. Written informed consent was obtained from the child’s caregiver before interviewing them, the study’s purpose was explained, and their support was enlisted to safeguard the patient's autonomy.

Materials and methods

Study Setting

A single-center cross-sectional study was conducted at Mohamed El-Alamin Hamed Hospital for children. The hospital is located in the east of Omdurman with total area of 7200 m2 with length 120 meter and width 60 meter. This hospital was established in 1986 by Mohammed Al-Amin Hamid. The hospital is a suitable setting that comprises ten units providing inpatient and outpatient medical services. Pediatric team members had a fixed day per week and an extra day on the weekend through rotation, supervised by two consultant pediatricians. The study took place from February to March 2023.

Study Criteria

The study included participants who were children and adolescents, ranging in age from six months to 16 years, of any gender. They qualified for the study if they had been hospitalized for more than 24 hours during the study period and their parents had provided written informed consent to be part of the study. We enrolled all participants who came to the hospital during the data collection period and sequentially matched the inclusion criteria. However, we excluded any children and adolescents who were still in critical clinical conditions (Figure1).

Data Collection

The researchers directly interviewed caregivers after explaining the aim and purpose of the study and obtaining their consent. Detailed medical histories, clinical data, nutrition patterns and physical examinations were collected. A specially designed questionnaire was used to collect the study variables, including demographic information and risk factors. To ensure standardization in the administration of the instruments and to accommodate illiterate caregivers, the researchers read the questions to the caregivers (family history, social history, socio-economic status, provisional and confirmed diagnosis). Anthropometric measurements were taken using scales suitable for the child’s age. An infantometer was used to measure the length of children under two years, and a stadiometer for those aged two years and above. Infants were weighed on the Infant Beam Scale, which was regularly cleaned and re-zeroed. A validated electronic weight scale was used for older children. Length was measured to the nearest 0.1 cm, and weight to the nearest 0.05 kg. The MUAC was measured to the nearest 1 mm using the United Nations International Children's Emergency Fund (UNICEF) standard and a tri-color MUAC tape. Wasting and edema were also assessed. The researchers, with the voluntary assistance of two nutritionists from the hospital’s staff, performed all measurements using standardized techniques and recorded the obtained data. The anthropometric measurements for each child were plotted on appropriate WHO and CDC growth charts for children from birth to 20 years, including weight-for-height and height-for-age charts.
Response 2: We have added the bellow figure in the method section
Figure 1. Flow chart illustrates the number of participants selected.
Preprints 140415 g001

Statistical Analysis

The data collected were entered into a Microsoft Excel spreadsheet and analyzed using the Statistical Package for the Social Sciences (SPSS) version 25. The results are presented in terms of frequency and percentages for categorical variables, and mean and standard deviation for continuous variables with a normal distribution. Because the sample size was relatively small with tied ranks, Kendall’s tau-b test was used to measure the association strength of the participants’ age, gender, height, weight, and BMI with malnutrition risk factors. Kendall’s tau-b test values range from -1 to 1. A value of -1 indicates a perfect negative association, 0 indicates no association, and 1 indicates a perfect positive association. The correlation was considered significant at the 0.01 level (2-tailed). A P-value of <0.05 was considered significant.

Results

General Socio-Demographic and Clinical Characteristics

A total of 268 participants were enrolled in the study. The age range spanned from six months to 15.5 years, with the predominant age group being those aged ten years or older, comprising 114 (42.5%) of the participants. Of these, 146 (54.5%) were males and 122 (45.5%) were females, resulting in a male-to-female ratio of 1.2:1. A majority, 217 (81.0%), resided in urban areas, while 51 (19.0%) came from rural areas. Regarding the common diseases among participants that led to hospital admission, gastroenteritis was the cause in 79 (29.5%) cases. Furthermore, crises of sickle cell anemia were responsible for 54 (20.1%) admissions, upper respiratory tract infections (URI) for 51 (19.0%), neurological conditions such as epilepsy for 31 (11.6%), urinary system diseases for 18 (6.7%), and other miscellaneous health problems for 21 (7.8%). Additionally, 163 (60.8%) participants were hospitalized for the first time, 59 (22.0%) for the second time, and 46 (17.2%) had been hospitalized more than twice within six months [Table 1].

Prevalence of stunting among hospitalized children and adolescents

Approximately 69 (25.7%) of children across all age groups experienced some form of stunting (either severe or moderate), of them 49 (71%) of the subjects were severely stunted, with a height-for-age less than -3 z-score, while 20 (29%) exhibited moderate stunting, with a z-score between -2 to -3 (calculated as per stunted children not from overall). The remaining had a normal height/length for their age, with a z-score greater than -2. The highest percentage of stunting (both severe and moderate) was observed in the youngest age group of less than 12 months, where 22 out of 71 children (31.0%) were affected. In contrast, the lowest prevalence of stunting was found in the age group of 10 years and older, with 24 out of 114 children (21.1%) affected. Severe stunting was most frequently observed among children aged 5-9 years (23.8%), while moderate stunting was most common among children below 12 months (14.1%) [Table 2].
Prevalence of Wasting and Overnutrition Among Hospitalized Children and Adolescents
We found that 77 (28.7%) participants experienced some form of wasting, amongst which 45 (58.4%) participants had severe wasting or SAM (z-score <-3 SD), 32 (41.6%) had moderate wasting or MAM (z-score <-3 to -2 SD). 161 (60.1%) had a normal weight-for-height/length. The overall prevalence of wasting or acute malnutrition (both SAM and MAM) was highest in the age group of 1-3 years (42.5%), and lowest in the age group of 10 years and above (18.4%). Severe wasting or SAM was most prevalent in the 3-5 year age group (22.7%), while moderate wasting or MAM was most common in the 1-3 year group (20.0%). This indicates a significant concern for wasting or acute malnutrition in early childhood. Additionally, 30 (11.2%) participants demonstrated overnutrition, amongst whom 16 (53.3%) were overweight (z-score +1 to +2 SD) and 14 (46.6%) were obese (z-score >+3 SD). When assessing the prevalence of overnutrition (both overweight and obesity), the highest prevalence was observed in the 5-10 year age group (42.9%), with the lowest in the 1-3 year age group (5.0%). Overweight and obesity were also notable among children aged 5-10 years (23.8% and 19.0%, respectively). This suggests that nutritional issues may shift from undernutrition to overnutrition as children age [Table 3].

Prevalence of Malnutrition Among Hospitalized Children and Adolescents Using MUAC Measurements

Out of the study participants, 57 (21.3%) exhibited some level of malnutrition, of them 41 (71.9%) were classified as having severe malnutrition, while 16 (28.1%) had moderate malnutrition, while the majority 212 (79.1%) presented no indications of muscle wasting. In terms of age groups, the overall incidence of malnutrition was most prevalent in children under 12 months (40.8%) and least prevalent in those aged 10 years and above (7.0%). Younger age groups (<12 months) had a higher percentage of children with severe malnutrition (31.0%) compared to older age groups. The percentage of children with moderate malnutrition was relatively small across all age groups, as most children fell either into the severe malnutrition category or within the normal range. The percentage of children with a normal MUAC increased with age, with the highest percentage in the 5-9 years age group (95.2%), followed by those aged 10 years and above (93.0%), indicating a better nutritional status in older children [Table 4].

Gender Differences in Anthropometric Measurements

Gender-based categorization of anthropometric measurements is provided in [Table 5]. Severe stunting was present in 18.3% [13.6 - 22.9] of all children, with a slightly higher prevalence in males (19.18%) [12.7 - 25.6] compared to females (17.2%) [11.5 - 24.9]. Moderate stunting was less common, affecting 7.4% [4.9 - 11.2] of all children, and was again slightly more prevalent in males (8.2%) [4.7 - 13.7]. This indicates that stunting was a significant issue in both genders, but had a marginally higher impact on males. Regarding the MUAC measurements, 41 (15.33%) [11 - 19.6] of participants had severe malnutrition, being more prevalent in females (18%) [11.1 - 24.9] than in males (13%) [7.6 - 18.4]. Moderate malnutrition was less common, observed in 16 (5.9%) [3.3 - 8.8] participants, and was also more prevalent in males (6.8%) [2.7 - 10.9]. Among participants with severe malnutrition, 4 (8.9%) had grade 2 edema, while 3 (9.4%) with moderate malnutrition had grade 3 edema. In terms of overnutrition, 6.0% [4.4 - 11.1] were overweight and 5.2% [3.7 - 10.0] were obese, with males having a slightly higher prevalence of both overweight (6.8%) [4.5 - 14.3] and obesity (6.1%) [3.9 - 13.3] compared to females.

Relationship Between Child Health Variables and Malnutrition Risk Factors

When assessing the risk factors for nutritional problems, 163 (60.8%) participants had received exclusive breastfeeding. During the study period, 194 (72.3 %) children were weaned while staying at the hospital, with 116 (59.8%) of them being weaned abruptly. Approximately 105 (39.0%) of the interviewed mothers (next of kin or carers) reported that they usually weaned their babies at 12-18 months, while 77 (29.0%) did so at 18-24 months. The study revealed that 108 (41.3%) of the mothers had a primary educational level, 32.3% were illiterate, and 109 (40.7%) of the children's fathers were illiterate. Additionally, 241 (90.0%) of the participant mothers were homemakers, while 78.7% of the fathers earned their income through unskilled freelance work. When analyzing the correlation of malnutrition risk factors with child health variables, as shown in [Table 6], a significant negative correlation was found between age and vaccination (τb = -0.135**). This suggested that older children were less likely to receive vaccinations, or that vaccinations were typically administered at younger ages. Similarly, there was a negative correlation between age and weaning age (τb = -0.365**), indicating that weaning occurred at a younger age as the child's age increased. Conversely, a positive correlation was identified between age and weaning mechanism (τb = 0.230**), hinting at a preference for different weaning methods as children grew older. Additionally, a significant positive correlation between age and the occurrence of diagnoses (τb = 0.136**) implied that older children might have experienced more diagnoses. Gender also played a role, showing a positive correlation with vaccination (τb = 0.141*), which suggested a disparity in vaccination rates between genders. Vaccination itself correlated positively with weaning age (τb = 0.177**), indicating that vaccinated children tended to be weaned later. There was, however, a negative correlation between vaccination and hospital admissions (τb = -0.114*), suggesting that vaccination could have been linked to reduced admissions, and a similar negative correlation was observed between breastfeeding duration and admissions (τb = -0.121*), indicating that extended breastfeeding might have correlated with fewer hospital visits. Weaning age positively correlated with weaning mechanism (τb = 0.257*), suggesting that as the age at which children were weaned increased, there tends to be a corresponding change in the method of weaning. Finally, there was a positive correlation between the method of weaning and the occurrence of medical diagnoses (τb = 0.147*), which could imply that certain weaning methods might be associated with varied likelihoods of certain diagnoses.
We have provided some studies to compare with the current study in Appendix 1. [Appendix 1 Comparison of the nutritional status of the hospitalized children using the growth parameters the current study and other similar studies conducted in Sudan and internationally (2015-2023)].

Discussion

We assessed the nutritional status of the hospitalized children and adolescents using the growth parameters and evaluated the risk factors that may affect their anthropometric measurements (age, gender, weight, and height). Two hundred sixty-eight children and adolescents aged seven months to 15.5 years were enrolled in the study. Of the total, 146 (54.5%) were males, and most of the participants 217 (81.0%), lived in urban areas, while 51 (19.0%) were from rural regions.

Prevalence of Stunting Among Hospitalized Children and Adolescents

Our study highlighted that the overall prevalence of stunting (or chronic malnutrition) among the participants was 25.7%, which is below the average for the Africa region (30.7%) (33). Of this, severe stunting accounted for 18.3%, while moderate stunting comprised 7.5%. A community-based study by Mengesha et al. (11) in South Ethiopia found a stunting rate of 37.7%, with main risk factors being an unsafe water supply and food insecurity. Likewise, a study by Suryana et al. in Dikemukiman Peureumeu Settlement, Kaway XVI Subdistrict, West Aceh Regency, Indonesia, observed a stunting prevalence of 49.4%. These higher rates may be attributed to differences in study design, as they were conducted at the community level among vulnerable participants, and may not reflect the situation in hospitals. Other studies reporting consistently higher rates of stunting include those by Habimana et al. (34.1%), Zoakah et al. (34.9%), Chataut et al. (37.5%), Tekile et al. (38.3%), and Rachmi et al (ranging from 50.8% in 1993 to 36.7% in 2007). In 2008, stunting rates in Western Africa were reported at 37.7%, Central Africa at 41.5%, Eastern Africa at 50.0%, and Southern Africa at 30.2% (34). Our findings align with this data, indicating the higher levels of stunting in Eastern Africa. Likewise, recent literature categorizes Western and Southern Africa as regions with a high prevalence of stunting, typically ranging from 20% to less than 30%, while Central and Eastern Africa show significantly higher prevalence, exceeding 30% (35, 36).
In our study, stunting prevalence varied across age groups, with the highest percentage (31.0%) observed in children under 12 months and the lowest (21.1%) in those 10 years and older. This contrasts with a study in Southern Ethiopia, which found a higher likelihood of stunted growth in children aged 24-35 months (37). Mengesha et al. also noted that children below six months and those aged 6-11 months were less likely to experience stunted growth compared to those older than 24 months. Similarly, a study by Kasajja et al. in Uganda's Kabale district indicated a greater propensity for stunted growth in children aged 24-35 months and 36-47 months (38). Another study in the Acholi sub-region found the highest stunting prevalence among children aged 30-41 months (39), while other studies identified higher risks of stunted growth in children aged 11-23 months and 12-23 months (40, 41). Literature suggests that low height-for-age in children aged 24-35 months indicates ongoing inadequate growth (stunting), whereas in older children above 36 months, it signifies persistent growth failure (being stunted) (38).
Additionally, our study revealed a gender disparity in stunting rates, with both severe (19.7%) and moderate (8.2%) stunting being more prevalent in males. Kasajja et al.’s study also indicated a marginally higher occurrence of stunting in male children (42.2%), though the difference was not statistically significant (38). In a study by Jonah et al., conducted in three major countries in Sub-Saharan Africa (Ghana, Kenya, and Zambia), stunting prevalence between 2007 and 2014 was significantly higher among male children (42). Observations suggest that male children in Sub-Saharan Africa are more prone to stunting, potentially due to differences in health vulnerabilities and energy requirements (43, 44). There is also evidence suggesting that male children may be more susceptible to infections, which can lead to reduced food intake and a higher risk of further infections, thus perpetuating a cycle of stunting (44). Stunting can have enduring impacts, including diminished educational achievements, increased susceptibility to non-communicable diseases, decreased work efficiency, and various socio-economic challenges (45).

Prevalence of Wasting and Overnutrition Among Hospitalized Children and Adolescents

In our study, the overall prevalence of wasting among participants was 28.7%, a rate significantly exceeding the 6.0% regional average for Africa and surpassing the World Health Assembly's global nutrition goal, which aims for a child wasting prevalence below 5% (46). Of this, 16.8% was classified as severe wasting, while 11.9% was moderate wasting. Danso et al., in their research at Child Welfare Clinics in Ghana, found a wasting prevalence of 27.5%. In a health facility-based study in Yemen’s southern governorates of Lahj and Abyan, Al-Waleedi uncovered a high rate of acute malnutrition at 21.3% (47). Meanwhile, Chataut et al., through a community-based survey in Nepal, documented a 14.6% wasting rate. In another cross-sectional analysis in Nepal, Inoue and colleagues reported that 9.2% of hospital-admitted children aged 6 months to 15 years experienced wasting, decreasing slightly to 8.5% upon discharge (48). The Ethiopia Demographic and Health Survey by Tekile et al. reported a 10.1% prevalence of wasting. A study from Tanzania found a 1.41% prevalence of wasting in children at hospitals and primary care centers (49). These findings align with reports from various countries, both developed and developing, indicating significant malnutrition incidence among hospitalized patients. In Canada, a 2014 study by Groleau et al. found a 13.3% prevalence of acute malnutrition in hospitalized children (50), and another study from the same year reported a 6.9% rate in children admitted to pediatric departments (51). In developing countries like Malaysia, research indicated an 11% prevalence of acute undernutrition in hospitalized children (52), and a Pakistani study revealed a 21% stunting rate in children at outpatient clinics (53). Fouad et al., in a study at a public academic hospital in Egypt, reported a 6.6% prevalence of wasting. Hospital-based studies in Brazil (54), Romania (55), and Vietnam (56) recorded wasting prevalence of 16.1%, 17.7%, and 19.0%, respectively.
The highest incidence of wasting in our study was observed in the age group of 1-3 years, with a rate of 42.5%. Conversely, the lowest percentage of wasting was recorded in the age group of 10 years and older, at 18.4%. Danso et al. discovered the most significant incidence of wasting in children aged 1 to 2 years (57), a finding in line with previous research conducted in Ghana (58, 59). Meanwhile, Ocheke et al (60). identified the highest prevalence of wasting in the 6-11 months age group, at 9.3%. On the other hand, Tyagi et al (61). provided evidence of a high prevalence of wasting in children aged 5-9 years.
Prevalence of severe wasting was slightly higher in males 25 (17.1%) compared to females 20 (16.4%) where moderate wasting higher in females 24 (19.7%) males 8 (5.5%). Juma et al. observed that boys were more affected by wasting than girls, corroborating the findings of other studies indicating that male children are more prone to acute malnutrition than females (61-65). The issue of gender disparities in the likelihood of stunting is noteworthy and deserves further investigation to fully comprehend and address the malnutrition challenges associated with it.
On the other hand, the overall prevalence of overnutrition in our study was 11.2%, with 6% being overweight and 5.2% classified as obese. Nouri et al. conducted research in Azerbaijan and found that the incidence of obesity and overweight in their sample was 1.3% and 5.1%, respectively (67). Dehghani et al. reported that in their study, 10% of the participants were overweight, 4% were obese, and 1% were severely obese (68). According to research by Veghari and Vakili, the rate of overweight varied from 3.3% to 5.2% between 1998 and 2013 (69). Another study from Iran noted a 10.4% prevalence of overweight (70). The research conducted by Saengnipanthkul et al. reported a greater proportion of overweight and obesity, at 11.3% compared to 3.8% (71). Comparatively, a multicenter study in Spain identified overweight and obesity in 37.9% of children, a figure significantly higher than that observed in our study (72). The highest incidence of overnutrition was observed in the 5-10 years age group, reaching 42.9%, whereas the lowest was in the 1-3 years age group, at 5%. In the research conducted by Tyagi et al., the highest rates of overweight (27%), obesity (8.1%), and severe obesity (1.3%) were observed in children aged 10-14 years, followed by those aged 15-19 years (61).
Regarding gender disparities, both overweight and obesity were more common in male children, with overweight affecting 6.8% and obesity 6.1% of male participants. Tyagi et al. found that 22.1% of boys and 15.2% of girls were overweight, while 7.8% of boys and 3.6% of girls were classified as obese (61). Comparable findings were observed in studies from India in 2016 (74) and 2017 (75). Conversely, a 2015 study in India revealed a higher prevalence of overweight and obesity among girls (10.4%) compared to boys (6.9%) (76).

Prevalence of Malnutrition Among Hospitalized Children And Adolescents Using MUAC Measurements

In our study, the overall prevalence of malnutrition among participants, as determined by MUAC measurements, was 21.3%, with 15.3% experiencing severe malnutrition and 6% moderate malnutrition. Dehghani and colleagues found malnutrition in 14% of their subjects based on MUAC criteria, including 2.3% with severe malnutrition (68), 3.5% with moderate malnutrition, and 8.3% at risk of malnutrition. Laghari and colleagues, in their research on children under five in District Sanghar, Pakistan, reported that 66.1% of the examined children were malnourished (79).
The highest malnutrition rate in our study, 40.8%, was observed in the youngest age group of less than 12 months, while the lowest rate, 7%, was seen in those aged 10 years and above. Laghari et al. noted a greater prevalence of malnutrition in the younger age group of 6-11 months, with a decline in malnutrition rates as children grew older, and the lowest rates in the older age groups (79). Grellety et al. also found younger children to be more severely malnourished, as indicated by lower MUAC measurements (80).
There was a notable gender disparity in malnutrition rates in our study, with females (35.2%) more affected than males (5.4%), underscoring the need for targeted nutritional interventions to address these disparities effectively. Our findings are in line with existing literature. Laghari et al. (79) found a notably high incidence of severe malnutrition among females, possibly due to societal gender biases, a trend also observed in studies from Sudan (80), Bangladesh (66, 73) and Papua New Guinea (77). Contrarily, Ubesie and team found a higher prevalence of malnutrition among male children (78).

Relationship Between Child Health Variables and Malnutrition Risk Factors

An assessment of food insecurity in sub-Saharan Africa during 2014-2015 revealed that about 26% of individuals over 15 years experienced severe food insecurity, posing a challenge to meeting the sustainable development goals (SDGs) target 2.1 in the region (7). Micronutrients, including vitamins and minerals, are essential for optimal growth and development. Micronutrient deficiency, a form of hidden hunger, can be acute or chronic and may occur alone or in combination with undernutrition or obesity (17-19). Several factors, such as the availability of food choices, maternal nutrition knowledge, food purchases, race, and gender, can influence children's nutritional status, physical growth, and cognitive development (20-29).
Sudan has a higher malnutrition rate than other North African and Middle Eastern countries, with more than two million children suffering from stunting. Twenty-two percent experience acute malnutrition, and about half a million are at risk of life-threatening illnesses. The health, education, and poverty levels of mothers’ influence breastfeeding habits, hygiene practices, and family taboos. The literacy rate among women can also impact their cultural knowledge, especially in rural communities (30). Early weaning can lead to stunting, compromise immunity, and young mothers often face pressure from their own mothers, relatives, or peers for advice. To achieve optimal and sustained health outcomes, it is essential to address maternal illiteracy, raise awareness about proper breastfeeding and weaning practices, and ensure adequate food quality and quantity. Collaborative efforts with all stakeholders in the community are crucial in this endeavor.

Study Limitation

The study's primary limitation was that it was conducted at a single center with a limited sample size, which may not fully represent the broader population. As a cross-sectional study, causality could not be established for any of the associated variables, limiting the ability to infer direct cause-and-effect relationships. Furthermore, the study did not enroll all hospitalized children and adolescents, which may have resulted in a selection bias and impacted the generalizability of the findings.

Conclusion

The study highlights that stunting affects approximately a quarter of children across various age groups, with the most significant rates observed in infants and those aged 5-10 years, alongside a marginal higher incidence in males, indicating the extensive issue of malnutrition. It reveals a pronounced occurrence of wasting, particularly in the 1-3 year age bracket, and a trend toward overnutrition in older children, signifying a transition from undernutrition to overnutrition risks as children age, with boys being more prone. MUAC measurements disclose a substantial prevalence of malnutrition, particularly acute among children under 5 and more prevalent in females, underscoring the necessity for targeted nutritional interventions. The results suggest the vital influence of breastfeeding practices, parental education, and socioeconomic factors on the nutritional status and health outcomes of children, pointing out the intricate relationship between age, gender, vaccination, and weaning practices as determinants of malnutrition risk factors. The assessment and evaluation of children’s nutritional status in any health facility is critical. In underdeveloped countries, comprehensive and robust global screening and prevention of malnutrition risk factors are imperative to ensure normal growth and development.

Funding

This research received no grant from governmental, commercial, or non-profit sectors.

Abbreviations

AIDS Acquired Immune Deficiency Syndrome
URTI Upper Respiratory Tract Infection
BMI Body Mass Index
GAM Global Acute Malnutrition
HAZ Height-for-age Z-score
HIV Human Immune Deficiency Virus
IRB Institute Review Board
MAM Moderate Acute Malnutrition
MDGs Millennium Development Goals
MUAC Mid-Upper Arm Circumference
SAM Severe Acute Malnutrition
SDGs Sustainable Development Goals
UNICEF United Nations International Children's Emergency Fund
WHZ Weight-for-height Z-score

Author’s contribution

All authors shared equally in the conceptualization, methodology, validation, data curation, writing the original draft, approval of the manuscript, and the name's order.

Acknowledgments

We express sincere gratitude and thank fullness to the children and their families for their kind participation in the study—also, the Nutrition staff at the hospital for their kind help and assistance. We would like to acknowledge the following universities: (colleges and deans of Research Affairs): Karary University-Omdurman-Sudan, National University-Sudan, Al Ain University-Abu Dhabi-UAE, Gulf Medical University-Ajman-UAE, Dubai Pharmacy College-Dubai-UAE, University of Almaarefa- (Diriyah)-Riya-dh-Saudi Arabia, Taif University-Saudia Arabia, Imam Abdulrahman Bin Faisal University-Saudi Arabia, University of Sharjah-UAE; and Ambulatory Healthcare Services-Abu Dhabi Health Services (SEHA)-UAE.

Conflicts of Interest

No conflict of interest to disclose.

Appendix 1 Comparison of the nutritional status of the children using the growth parameters the current study and other similar studies conducted in Sudan and internationally (2015-2023)
Relevant studies↓ Study setting Study design Country Number of patients Stunting/ chronic malnutrition
Wasting/ acute malnutrition
MUAC Overnutrition
Severe
(%)
Moderate
(%)
Severe
(%)
Moderate
(%)
Severe
(%)
Moderate
(%)
Overweight
(%)
Obesity
(%)
Current study, Elgadal et al., 2023 (Unpublished) Hospital-based study Cross-sectional study Sudan 268 18.3 7.5 16.8 11.9 15.3
6.0 6.0 5.2
Choy C.C. et al., 2023
Ola Tuputupua’e “Growing Up” in Samoa project Mixed longitudinal cohort study Samoa 437 Overall stunting: 1.6 NA NA NA NA Overall overweight/obesity: 36.2
Fouad H.M. et al., 2023 Hospital-based study Cross-sectional study Egypt 505 Overall stunting: 3.0 Overall wasting: 6.6 NA NA 8.5 2.4
Danso F. et al., 2023 CWC Cross-sectional study Ghana 240 Overall stunting: 12.5 Overall wasting: 27.5 NA NA NA NA
Habimana J.D. et al., 2023 Rwanda CFSVA Cross-sectional study Rwanda
817 Overall stunting: 34.1 NA NA NA NA NA NA
Saengnipanthkul S. et al., 2023 Hospital-based study Prospective cohort study Thailand 816 Overall stunting: 23.6 Overall wasting: 14.3 NA NA 11.3 3.8
Abbreviation: CFSVA- Comprehensive food security and vulnerability analysis, CWC- Child Welfare Clinics, MUAC- Mid Upper Arm Circumference
CONT: Appendix 1 Comparison of the nutritional status of the hospitalized children using the growth parameters the current study and other similar studies conducted in Sudan and internationally (2015-2023)
Relevant studies↓ Study setting Study design Country Number of patients Stunting/ chronic malnutrition
Wasting/ acute malnutrition
MUAC Overnutrition
Severe
(%)
Moderate
(%)
Severe
(%)
Moderate
(%)
Severe
(%)
Moderate
(%)
Overweight
(%)
Obesity
(%)
Current study, Elgadal et al., 2023 (Unpublished) Hospital-based study Cross-sectional study Sudan 268 18.3 7.5 16.8 11.9 15.3
6.0 6.0 5.2
Siddiqa M. et al., 2023 PDHS Cross-sectional study Pakistan 4226 Overall stunting: 37.7 Overall wasting: 8.0 NA NA NA NA
Mengesha, A. et al. South Ethiopia Overall stunting: 37.7
Al-Waleedi A.A. et al., 2022 Multi-center hospital-based study Cross-sectional study Yemen 951 Overall stunting: 41.3 6.2 15.1 NA NA NA NA
Inoue A. et al., 2022 Hospital-based study Cross-sectional study Nepal 426 4.7 (at admission), 5.2 (at discharge) 14.3 (at admission), 14.8 (at discharge) 2.6 (at admission), 2.8 (at discharge) 6.6 (at admission), 5.6 (at discharge) NA NA NA NA
Suryana Y.F. et al., 2021 Community-based survey Cross-sectional study Indonesia 81 Overall stunting: 49.4 NA NA NA NA NA NA
Abbreviation: PDHS- Pakistan Demographic and Health Survey, MUAC- Mid Upper Arm Circumference
CONT: Appendix 1 Comparison of the nutritional status of the hospitalized children using the growth parameters the current study and other similar studies conducted in Sudan and internationally (2015-2023)
Relevant studies↓ Study setting Study design Country Number of patients Stunting/ chronic malnutrition
Wasting/ acute malnutrition
MUAC Overnutrition
Severe
(%)
Moderate
(%)
Severe
(%)
Moderate
(%)
Severe
(%)
Moderate
(%)
Overweight
(%)
Obesity
(%)
Current study, Elgadal et al., 2023 (Unpublished) Hospital-based study Cross-sectional study Sudan 268 18.3 7.5 16.8 11.9 15.3
6.0 6.0 5.2
Chataut J. et al., 2020 Community-based survey Cross-sectional study Nepal 302 Overall stunting: 37.5 Overall wasting: 14.6 NA NA NA NA
Tekile A.K. et al., 2019 EDHS Cross-sectional study Ethiopia 9495 Overall stunting: 38.3 Overall wasting: 10.1 NA NA NA NA
Dehghani S.M. et al., 2018 Hospital-based study Cross-sectional study Iran 430 Overall stunting: 48.5 Overall wasting: 47.0 2.3 3.5 10.0 Obese: 16.0
Severe obese: 1.0
Lee W.S. et al., 2017 Hospital-based study Cross-sectional study Malaysia 285 Overall stunting: 14.0 Overall wasting: 11.0 2.0 5.3 NA NA
Rachmi C.N. et al., 2016 IFLS Longitudinal survey Indonesia 4101 Overall stunting:
1993 (wave 1): 2084 (50.8)
1997 (wave 2): 1994 (48.6)
2000 (wave 3): 1838 (44.8)
2007 (wave 4): 1506 (36.7)
NA NA NA NA At risk of overweight and overweight/obese
1993 (wave 1): 423 (10.3)
1997 (wave 2): 435 (10.6)
2000 (wave 3): 480 (11.7)
2007 (wave 4): 677 (16.5)
Abbreviation: EDHS- Ethiopia demographic and health survey, IFLS- Indonesia family life survey, MUAC- Mid Upper Arm Circumference
CONT: Appendix 1 Comparison of the nutritional status of the hospitalized children using the growth parameters the current study and other similar studies conducted in Sudan and internationally (2015-2023)
Relevant studies↓ Study setting Study design Country Number of patients Stunting/ chronic malnutrition
Wasting/ acute malnutrition
MUAC Overnutrition
Severe
(%)
Moderate
(%)
Severe
(%)
Moderate
(%)
Severe
(%)
Moderate
(%)
Overweight
(%)
Obesity
(%)
Current study, Elgadal et al., 2023 (Unpublished) Hospital-based study Cross-sectional study Sudan 268 18.3 7.5 16.8 11.9 15.3
6.0 6.0 5.2
Veghari G. et al., 2016 Community-based survey Cross-sectional study Iran 7575 Overall stunting:
1998: 32.8
2004: 13.4
2013: 15.7
NA NA NA NA 1998: 8.5
2004: 3.3
2013: 5.2
1998: 4.6
2004: 1.2
2013: 3.5
Juma O.A. et al., 2016 Hospital-based study Cross-sectional study Tanzania 63237 Overall stunting: 8.37
Overall wasting: 1.41 NA NA NA NA
Pileggi V.N. et al., 2016 Hospital-based study Cross-sectional study Brazil 292 NA NA Overall wasting: 16.1 NA NA 19.17 NA
Laghari Z. A. et al., 2015 Community-based survey Cross-sectional study Pakistan 511 NA NA NA NA 10.2 12.7 NA NA
Abbreviation: MUAC- Mid Upper Arm Circumference

References

  1. Herrera Cuenca, M., Proaño, G. V., Blankenship, J., Cano-Gutierrez, C., Chew, S. T. H., Fracassi, P., Keller, H., Venkatesh Mannar, M. G., Mastrilli, V., Milewska, M., & Steiber, A. (2020). Building Global Nutrition Policies in health care: Insights for tackling malnutrition from the Academy of Nutrition and Dietetics 2019 Global Nutrition Research and policy forum. Journal of the Academy of Nutrition and Dietetics, 120(8), 1407–1416. [CrossRef]
  2. Nutrition [Internet]. Who.int. 2021. Available from: https://www.who.int/topics/nutrition/en.
  3. Azzouz, J. Z., Safdar, O. Y., Awaleh, F. I., Khoja, A. A., Alattas, A. A., & Jawhari, A. A. (2021). Nutritional assessment and management in paediatric chronic kidney disease. Journal of Nutrition and Metabolism, 2021, 1–7. [CrossRef]
  4. McCarthy, H., Dixon, M., Crabtree, I., Eaton-Evans, M. J., & McNulty, H. (2012). The development and evaluation of the screening tool for the assessment of malnutrition in paediatrics (stamp©) for use by Healthcare staff. Journal of Human Nutrition and Dietetics, 25(4), 311–318. [CrossRef]
  5. Johnson, M. J., Wiskin, A. E., Pearson, F., Beattie, R. M., &amp; Leaf, A. A. (2014). How to use: Nutritional assessment in neonates. Archives of Disease in Childhood - Education & Practice Edition, 100(3), 147–154. [CrossRef]
  6. Centers for Disease Control and Prevention. (n.d.). Use and interpretation of the WHO and CDC Growth Charts for children from birth to 20 years in the United States. Centers for Disease Control and Prevention. https://stacks.cdc.gov/view/cdc/106996.
  7. Sissaoui, S., De Luca, A., Piloquet, H., Guimber, D., Colomb, V., Peretti, N., Bouniol, A., Breton, A., Chouraqui, J.-P., Coste, M.-E., Djeddi, D., Dorigny, B., Goulet, O., Gottrand, F., Hermouet, P., Lambe, C., Leke, A., Leprince, S., Mas, E., … Hankard, R. (2013). Large scale nutritional status assessment in pediatric hospitals. E-SPEN Journal, 8(2). [CrossRef]
  8. Fufa, D. A., & Laloto, T. D. (2021). Factors associated with undernutrition among children aged between 6–36 months in Semien Bench District, Ethiopia. Heliyon, 7(5). [CrossRef]
  9. Larson-Nath, C., & Goday, P. (2019). Malnutrition in children with chronic disease. Nutrition in Clinical Practice, 34(3), 349–358. [CrossRef]
  10. De Sanctis, V., Soliman, A., Alaaraj, N., Ahmed, S., Alyafei, F. ., & Hamed, N. (2021). Early and Long-term Consequences of Nutritional Stunting: From Childhood to Adulthood: Early and Long-term Consequences of Nutritional Stunting. Acta Biomedica Atenei Parmensis, 92(1), 11346. [CrossRef]
  11. Mengesha, A., Hailu, S., Birhane, M., & Belay, M. M. (2021). The prevalence of stunting and associated factors among children under five years of age in southern Ethiopia: Community Based Cross-sectional study. Annals of Global Health, 87(1). [CrossRef]
  12. Beser, O. F., Cokugras, F. C., Erkan, T., Kutlu, T., Yagci, R. V., Ertem, D., Yaşöz, G., Yüksekkaya, H. A., Artan, R., Önal, Z., Coşkun, M. E., Aydoğan, A., Zorlu, P., Akçaboy, M., Tosun, M. S., Urgancı, N., Kaya, R. G., Satar, M., Yüce, A., … Kırbıyık, F. (2018). Evaluation of malnutrition development risk in hospitalized children. Nutrition, 48, 40–47. [CrossRef]
  13. Imani, B., Nasab, M. H., Gholampour, Z., Abdollahpour, N., & Mehrbakhsh, Z. (2015). Assessment of malnutrition based on three nutritional risk scores in hospitalized Iranian children. Pediatrics, 135(Supplement_1). [CrossRef]
  14. Saengnipanthkul, S., Chongviriyaphan, N., Densupsoontorn, N., Apiraksakorn, A., Chaiyarit, J., Kunnangja, S., Wongpratoom, S., Papakhee, S., Det-amnatkul, W., Monwiratkul, J., Saengpanit, P., Limthongthang, P., & Panthongviriyakul, C. (2021). Hospital-acquired malnutrition in paediatric patients: A multicentre trial focusing on prevalence, risk factors, and impact on clinical outcomes. European Journal of Pediatrics, 180(6), 1761–1767. [CrossRef]
  15. Ong, S. H., & Chen, S. T. (2020). Validation of Paediatric Nutrition Screening Tool (PNST) among hospitalized Malaysian children. Journal of Tropical Pediatrics, 66(5), 461–469. [CrossRef]
  16. Giha, I. H., Shaddad, M. I., Yusuf, A., Paga, I. A., Noma, M., & Homeida, M. (2019). Nutritional Status and Its Related Factors in Khalwa Residents, Khartoum State, Sudan. [CrossRef]
  17. Mkhize, M., & Sibanda, M. (2020). A review of selected studies on the factors associated with the nutrition status of children under the age of five years in South Africa. International Journal of Environmental Research and Public Health, 17(21), 7973. [CrossRef]
  18. Ekholuenetale, M., Tudeme, G., Onikan, A., & Ekholuenetale, C. E. (2020). Socioeconomic inequalities in hidden hunger, undernutrition, and overweight among under-five children in 35 sub-saharan Africa countries. Journal of the Egyptian Public Health Association, 95(1). [CrossRef]
  19. Gödecke, T., Stein, A. J., & Qaim, M. (2018). The global burden of chronic and hidden hunger: Trends and determinants. Global Food Security, 17, 21–29. [CrossRef]
  20. Siwela, M., Pillay, K., Govender, L., Lottering, S., Mudau, F. N., Modi, A. T., & Mabhaudhi, T. (2020a). Biofortified crops for Combating hidden hunger in South Africa: Availability, acceptability, micronutrient retention and bioavailability. Foods, 9(6), 815. [CrossRef]
  21. Monzani, A., Ricotti, R., Caputo, M., Solito, A., Archero, F., Bellone, S., & Prodam, F. (2019). A systematic review of the Association of Skipping Breakfast with weight and cardiometabolic risk factors in children and adolescents. what should we better investigate in the future? Nutrients, 11(2), 387. [CrossRef]
  22. Harding, K. L., Aguayo, V. M., & Webb, P. (2017). Hidden hunger in South Asia: A review of recent trends and persistent challenges. Public Health Nutrition, 21(4), 785–795. [CrossRef]
  23. Archero, F., Ricotti, R., Solito, A., Carrera, D., Civello, F., Di Bella, R., Bellone, S., & Prodam, F. (2018). Adherence to the Mediterranean diet among school children and adolescents living in northern Italy and unhealthy food behaviors associated to overweight. Nutrients, 10(9), 1322. [CrossRef]
  24. Cunha, D. B., Bezerra, I. N., Pereira, R. A., & Sichieri, R. (2018). At-home and away-from-home dietary patterns and BMI z-scores in Brazilian adolescents. Appetite, 120, 374–380. [CrossRef]
  25. Rachmi, C. N., Jusril, H., Ariawan, I., Beal, T., & Sutrisna, A. (2020). Eating behaviour of Indonesian adolescents: A systematic review of the literature. Public Health Nutrition, 24(S2). [CrossRef]
  26. Chen, L., Zhu, H., Gutin, B., & Dong, Y. (2019). Race, gender, family structure, socioeconomic status, dietary patterns, and Cardiovascular Health in Adolescents. Current Developments in Nutrition, 3(11). [CrossRef]
  27. Perez-Cueto, F. J. (2019). An umbrella review of systematic reviews on Food Choice and nutrition published between 2017 and-2019. Nutrients, 11(10), 2398. [CrossRef]
  28. Lage Barbosa, C., Brettschneider, A.-K., Haftenberger, M., Lehmann, F., Frank, M., Heide, K., Patelakis, E., Perlitz, H., Krause, L., Houben, R., Butschalowsky, H. G., Richter, A., Kamtsiuris, P., & Mensink, G. B. M. (2017). Comprehensive assessment of food and nutrient intake of children and adolescents in Germany: Eskimo II – The eating study as a Kiggs module. BMC Nutrition, 3(1). [CrossRef]
  29. Bongaarts, J. (2016). WHO, UNICEF, UNFPA, World Bank Group, and United Nations Population Divisiontrends in maternal mortality: 1990 to 2015GENEVA: World Health Organization, 2015. Population and Development Review, 42(4), 726–726. [CrossRef]
  30. Abu-Manga, M., Al-Jawaldeh, A., Qureshi, A. B., Ali, A. M., Pizzol, D., & Dureab, F. (2021). Nutrition assessment of Under-five children in Sudan: Tracking the achievement of the Global Nutrition Targets. Children, 8(5), 363. [CrossRef]
  31. Lenters, L. (2016) Management of severe and moderate acute malnutrition in children, Reproductive, Maternal, Newborn, and Child Health: Disease Control Priorities, Third Edition (Volume 2). Available at: https://www.ncbi.nlm.nih.gov/books/NBK361900/ (Accessed: 21 August 2024).
  32. (No date) Algorithm for managing malnutrition in adults. Available at: https://www.fantaproject.org/sites/default/files/resources/Namibia%20flipchart%20algorithm%20adults_Sept2010.pdf (Accessed: 21 August 2024).
  33. Sudan (no date) Global Nutrition Report | Country Nutrition Profiles - Global Nutrition Report. Available at: https://globalnutritionreport.org/resources/nutrition-profiles/africa/northern-africa/sudan/ (Accessed: 21 August 2024).
  34. Black, R. E., Allen, L. H., Bhutta, Z. A., Caulfield, L. E., de Onis, M., Ezzati, M., Mathers, C., & Rivera, J. (2008). Maternal and child undernutrition: Global and regional exposures and health consequences. The Lancet, 371(9608), 243–260. [CrossRef]
  35. Bongaarts, J. (2021). FAO, IFAD, UNICEF, WFP and whothe state of food security and nutrition in the World 2020. Transforming Food Systems for affordable healthy DIETSFAO, 2020, 320 p. Population and Development Review, 47(2), 558–558. [CrossRef]
  36. de Onis, M., Borghi, E., Arimond, M., Webb, P., Croft, T., Saha, K., De-Regil, L. M., Thuita, F., Heidkamp, R., Krasevec, J., Hayashi, C., & Flores-Ayala, R. (2018). Prevalence thresholds for wasting, overweight and stunting in children under 5 years. Public Health Nutrition, 22(1), 175–179. [CrossRef]
  37. Moges B, Feleke A, Meseret S, Doyore F. Magnitude of Stunting and Associated Factors Among 6–59 Months Old Children in Hossana Town. Southern Ethiopia J Clinic Res Bioeth. 2015;6:207. [CrossRef]
  38. Kasajja, M., Nabiwemba, E., Wamani, H. et al. Prevalence and factors associated with stunting among children aged 6–59 months in Kabale district, Uganda. BMC Nutr 8, 79 (2022). [CrossRef]
  39. Wamani H. Report on Nutrition and Food Security Assessment in Acholi Sub-region. 2012. (http://www.unr.ug).
  40. Yalew BM, Amsalu F, Bikes D. Prevalence and Factors Associated with Stunting, Underweight and Wasting: A Community Based Cross Sectional Study among Children Age 6-59 Months at Lalibela Town. Northern Ethiopia J Nutr Disorders Ther. 2014;4:147. [CrossRef]
  41. Ramos, C. V., Dumith, S. C., & César, J. A. (2015). Prevalence and factors associated with stunting and excess weight in children aged 0-5 years from the Brazilian semi-arid region. Jornal de Pediatria, 91(2), 175–182. [CrossRef]
  42. Jonah, C.M.P., Sambu, W.C. & May, J.D. A comparative analysis of socioeconomic inequities in stunting: a case of three middle-income African countries. Arch Public Health 76, 77 (2018). [CrossRef]
  43. Wamani H, Astrom AN, Peterson S, et al. Boys are more stunted than girls in Sub-Saharan Africa: A meta-analysis of 16 demographic and health surveys. BMC Pediatr. 2007;7:17. [CrossRef]
  44. Quamme, S. H., & Iversen, P. O. (2022). Prevalence of child stunting in Sub-Saharan africa and its risk factors. Clinical Nutrition Open Science, 42, 49–61. [CrossRef]
  45. Walker, S. P., Chang, S. M., Powell, C. A., Simonoff, E., & Grantham-McGregor, S. M. (2007). Early childhood stunting is associated with poor psychological functioning in late adolescence and effects are reduced by psychosocial stimulation. The Journal of Nutrition, 137(11), 2464–2469. [CrossRef]
  46. Karlsson, O., Kim, R., Guerrero, S., Hasman, A., & Subramanian, S. V. (2022). Child wasting before and after age two years: A cross-sectional study of 94 countries. eClinicalMedicine, 46, 101353. [CrossRef]
  47. Al-Waleedi, A.A., Bin-Ghouth, A.S. Malnutrition among hospitalized children 12–59 months of age in Abyan and Lahj Governorates / Yemen. BMC Nutr 8, 78 (2022). [CrossRef]
  48. Inoue, A., Dhoubhadel, B.G., Shrestha, D. et al. Risk factors for wasting among hospitalised children in Nepal. Trop Med Health 50, 68 (2022). [CrossRef]
  49. Juma OA, Enumah ZO, Wheatley H, et al. Prevalence and assessment of malnutrition among children attending the Reproductive and Child Health clinic at Bagamoyo District Hospital. Tanzania BMC Public Health. 2016;16:1094. [CrossRef]
  50. Groleau V, Thibault M, Doyon M, Brochu EE, Roy CC, Babakissa C. Malnutrition in hospitalized children: prevalence, impact, and management. Can J Diet Pract Res. 2014 Spring;75(1):29–34. doi: . [CrossRef]
  51. Baxter JA, Al-Madhaki FI, Zlotkin SH. Prevalence of malnutrition at the time of admission among patients admitted to a Canadian tertiary-care pediatric hospital. Pediatric Child Health. 2014;19(8):413–7. Return to ref 20 in article. [CrossRef]
  52. Lee, W.-S., & Ahmad, Z. (2017). The prevalence of undernutrition upon hospitalization in children in a developing country: A single hospital study from Malaysia. Pediatrics &amp; Neonatology, 58(5), 415–420. [CrossRef]
  53. Fatima, Sehrish et al. “Stunting and associated factors in children of less than five years: A hospital-based study.” Pakistan journal of medical sciences vol. 36,3 (2020): 581–585. doi:. [CrossRef]
  54. Pileggi, V. N., Monteiro, J. P., Margutti, A. V. B., & Camelo Jr., J. S. (2016). Prevalence of child malnutrition at a University Hospital using the World Health Organization criteria and Bioelectrical Impedance Data. Brazilian Journal of Medical and Biological Research, 49(3). [CrossRef]
  55. Mărginean, O., Pitea, A. M., Voidăzan, S., & Mărginean, C. (2014). Prevalence and assessment of malnutrition risk among hospitalized children in Romania. Journal of health, population, and nutrition, 32(1), 97–102.
  56. Huong PT, Lam NT, Thu NN, Quyen TC, Lien DT, Anh NQ, et al. Prevalence of malnutrition in patients admitted to a major urban tertiary care hospital in Hanoi, Vietnam. Asia Pac J Clin Nutr. 2014;23(3):437-44.
  57. Danso, F., & Appiah, M. A. (2023). Prevalence and associated factors influencing stunting and wasting among children of Ages 1 to 5 years in Nkwanta South Municipality, Ghana. Nutrition, 110, 111996. [CrossRef]
  58. Welaga Miah, R., & Awingura Apanga, P. (2016). Risk factors for undernutrition in children under five years old: Evidence from the 2011 Ghana Multiple Indicator Cluster Survey. Journal of AIDS &amp; Clinical Research, 7(7). [CrossRef]
  59. Darteh, E. K., Acquah, E., & Kumi-Kyereme, A. (2014). Correlates of stunting among children in Ghana. BMC Public Health, 14(1). [CrossRef]
  60. Ocheke, I., John, C., & Puoane, T. (2014). Factors influencing the pattern of malnutrition among acutely ill children presenting in a tertiary hospital in Nigeria. Nigerian Journal of Paediatrics, 41(4), 326. [CrossRef]
  61. Tyagi, S., Hiremath, R., Ramakrishna, T., Chourey, N., & Ghodke, S. (2023). Prevalence of underweight, stunting, wasting and obesity among urban school going children – need for action. Medical Journal of Dr. D.Y. Patil Vidyapeeth, 16(7), 63. [CrossRef]
  62. Dukhi, N. (2020). Global prevalence of malnutrition: Evidence from literature. Malnutrition. [CrossRef]
  63. Sand A, Kumar R, Shaikh BT, Somrongthong R, Hafeez A, Rai D. (2018). Determinants of severe acute malnutrition among children under five years in a rural remote setting: A hospital-based study from district Tharparkar-Sindh. Pakistan Pak J Med Sci. 34(2):260-5. [CrossRef]
  64. Thurstans, S., Opondo, C., Seal, A., Wells, J., Khara, T., Dolan, C., Briend, A., Myatt, M., Garenne, M., Sear, R., & Kerac, M. (2020). Boys are more likely to be undernourished than girls: A systematic review and meta-analysis of sex differences in undernutrition. BMJ Global Health, 5(12). [CrossRef]
  65. Danso, F., & Appiah, M. A. (2023). Prevalence and associated factors influencing stunting and wasting among children of Ages 1 to 5 years in Nkwanta South Municipality, Ghana. Nutrition, 110, 111996. [CrossRef]
  66. Ferdous, F., Das, S. K., Ahmed, S., Farzana, F. D., Latham, J. R., Chisti, M. J., Ud-Din, A. I., Azmi, I. J., Talukder, K. A., & Faruque, A. S. (2013). Severity of diarrhea and malnutrition among under five-year-old children in rural Bangladesh. The American Society of Tropical Medicine and Hygiene, 89(2), 223–228. [CrossRef]
  67. Nouri Saeidlou, S., Babaei, F., & Ayremlou, P. (2014). Malnutrition, overweight, and obesity among urban and rural children in north of West Azerbijan, Iran. Journal of Obesity, 2014, 1–5. [CrossRef]
  68. Dehghani, S. M., Javaherizadeh, H., Heidary, M., Honar, N., Ataollahi, M., Ilkanipour, H., & Moravej, H. (2018). Stunting, wasting, and Mid Upper Arm circumpherence status among children admitted to Nemazee Teaching Hospital. Nutrición Hospitalaria. [CrossRef]
  69. Veghari, G. (2015). The comparison of under-five-children’s nutrition status among ethnic groups in north of Iran, 1998 - 2013; results of a three stages cross-sectional study. Iranian Journal of Pediatrics, 25(4). [CrossRef]
  70. Jafari, S., Fouladgar, M., Naeeni, M., Fakhri, M., Fatemi, S., Heidari, K., & Bagheri, S. (2014). Body mass index, weight-for-age, and stature-for-age indices in Iranian school children in relation to weight and growth disorders: A population-based survey. International Journal of Preventive Medicine, 5(14), 133. [CrossRef]
  71. Saengnipanthkul, S., Apiraksakorn, A., Densupsoontorn, N., & Chongviriyaphan, N. (2023). Prevalence and risk factors for pediatric acute and chronic malnutrition: A multi-site tertiary medical center study in Thailand. Asia Pacific journal of clinical nutrition, 32(1), 85–92. [CrossRef]
  72. Moreno Villares, J. M., Varea Calderón, V., Bousoño García, C., Lama Moré, R., Redecillas Ferreiro, S., Peña Quintana, L., & Sociedad Española de Gastroenterología (2013). Evaluación del estado nutricional de niños ingresados en el hospitalen en España; estudio DHOSPE (Desnutrición Hospitalaria en el Paciente Pediátrico en España) [Nutrition status on pediatric admissions in Spanish hospitals; DHOSPE study]. Nutricion hospitalaria, 28(3), 709–718. [CrossRef]
  73. Mostafa K. S. (2011). Socio-economic determinants of severe and moderate stunting among under-five children of rural Bangladesh. Malaysian journal of nutrition, 17(1), 105–118.
  74. Pal, A., Pari, A. K., Sinha, A., & Dhara, P. C. (2017). Prevalence of undernutrition and associated factors. International Journal of Pediatrics and Adolescent Medicine, 4(1), 9–18. [CrossRef]
  75. Kaur S, Bains K, Kaur H Assessment of Stunting and Malnutrition among School-going Children from different Cultural Regions of Punjab, India. Indian J Ecol 2017;44: 898-903.
  76. Jakkula, R., Kamath, R., & Kumar, S. (2015). Nutritional status assessment of school children in Bellary District, Karnataka. Journal of Dr. NTR University of Health Sciences, 4(1), 13. [CrossRef]
  77. Smith, T., & Heywood, P. (1991). Mid-upper-arm circumference (MUAC) in relation to other indices of nutritional status in Papua New Guinea. Papua and New Guinea medical journal, 34(1), 26–34.
  78. Ubesie, A. C., Ibeziako, N. S., Ndiokwelu, C. I., Uzoka, C. M., & Nwafor, C. A. (2012). Under-five protein energy malnutrition admitted at the University of in Nigeria Teaching Hospital, enugu: A 10 Year Retrospective Review. Nutrition Journal, 11(1). [CrossRef]
  79. Laghari, Z. A., Soomro, A. M., Tunio, S. A., Lashari, K., Baloach, F. G., Baig, N. M., & Bano, S. (2015). MALNUTRITION AMONG CHILDREN UNDER FIVE YEARS IN DISTRICT SANGHAR, SINDH, PAKISTAN. Gomal Journal of Medical Sciences, 13(1). https://link.gale.com/apps/doc/A418348521/AONE?u=anon~70b8ec03&sid=googleScholar&xid=67df5acd.
  80. Grellety, E., Krause, L. K., Shams Eldin, M., Porten, K., & Isanaka, S. (2015). Comparison of weight-for-height and mid-upper arm circumference (MUAC) in a therapeutic feeding programme in South Sudan: Is Muac alone a sufficient criterion for admission of children at high risk of mortality? Public Health Nutrition, 18(14), 2575–2581. [CrossRef]
Table 1. Socio-demographic characteristics of the participants, reasons and numbers of hospitalization (n=268).
Variables Responses F (%)
Age of the participants <12 months 71 (26.5%)
1 - <3 years 40 (14.9%)
3 - <5 years 22 (8.2%)
5 - 9 years 21 (7.8%)
>10 Years 114 (42.5%)
Gender Males 146 (54.5%)
Females 122 (45.5%)
Residence Urban areas 217 (81.0%)
Rural areas 51 (19.0%)
Reasons for hospital admission Sickle cell anaemia 54 (20.1%)
Upper respiratory tract infections (ARI) 51 (19.0%)
Epilepsy 31 (11.6%)
Urinary system diseases 18 (6.7%)
Other health problems 21 (7.8%)
Number of hospitalization Hospitalized for the first time 163 (60.8%)
Hospitalised for the second time 59 (22.0%)
Hospitalized more than twice within six months 46 (17.2%)
Table 2. The rate of stunting among participants based on height-for-age (N=268).
Age groups <-3 HAZ-score
F (%)
-3 to -2 HAZ-score
F (%)
Overall stunting
F (%)
>-2 HAZ-score
F (%)
Total
<12 months 12 (16.9%) 10 (14.1%)* 22 (31.0%)* 49 (69.0%) 71
1 - <3 years 8 (20.0%) 4 (10.0%) 12 (30.0%) 28 (70.0%) 40
3 - <5 years 4 (18.2%) 1 (4.5%) 5 (22.7%) 17 (77.3%)* 22
5 - 9 years 5 (23.8%)* 1 (4.8%) 6 (28.6%) 15 (71.4%) 21
≥10 years 20 (17.5%) 4 (3.5%) 24 (21.1%) 90 (78.9%) 114
Total 49 20 69 199 268
Keys: (F): Frequency; (%): Percent; (HAZ): height-for-age z-score; *: The highest percent in a column; According to the WHO’s reference standards; HAZ-score <-3: Severe stunting; HAZ-score -3 to -2: Moderate stunting; HAZ-score >-2: Normal.
Table 3. The rate of wasting and over nutrition among participants based on weight-for-height (N=268).
Age groups <-3 WHZ-score
F (%)
-3 to -2 WHZ-score
F (%)
Overall wasting
F (%)
-2 to +1 WHZ-score
F (%)
+1 to +2 WHZ-score
F (%)
>+3 WHZ-score
F (%)
Overall overnutrition
F (%)
Total
<12 months 12 (16.9%) 13 (18.3%) 25 (35.2%) 39 (54.9%) 4
(5.6%)
3
(4.2%)
7
(9.9%)
71
1 - <3 years 9 (22.5%) 8 (20.0%)* 17 (42.5%)* 21 (52.5%) 1
(2.5%)
1
(2.5%)
2
(5.0%)
40
3 - <5 years 5 (22.7%)* 3 (13.6%) 8 (36.4%) 10 (45.5%) 2 (9.1%) 2 (9.1%) 4
(18.2%)
22
5 - 9 years 2 (9.5%) 4 (19.0%) 6
(28.6%)
6 (28.6%) 5 (23.8%)* 4 (19.0%)* 9
(42.9%)*
21
≥10 years 17 (14.9%) 4
(3.5%)
21 (18.4%) 85 (74.6%)* 4
(3.5%)
4
(3.5%)
8
(7.0%)
114
Total 45 32 77 161 16 14 30 268
Keys:(F): Frequency; (%): Percent; (WHZ): weight-for-height z-score; *: The highest percent in a column; Note Bene. According to the WHO’s reference standards, WHZ-score <-3: Severe wasting; WHZ-score -3 to -2: Moderate wasting; WHZ-score -2 to +1: Normal; WHZ-score +1 to +2: Overweight; WHZ-score >+3: Obese.
Table 4. MUAC measurement and the presence of edema about age (N=268).
Age groups F (%) Malnutrition among age groups F(%)
<12 months (n=71)
<115 mm Severe 22 (31.0%)* 29 (40.8%)*
115 to 125 mm Moderate 7 (9.9%)
>125 mm Normal 42 (59.2%) -
1 - <3 years (n=40)
<115 mm Severe 11 (27.5%) 15 (37.5%)
115 to 125 mm Moderate 4 (10.0%)*
>125 mm Normal 25 (62.5%) -
3 - <5 years (n=22)
<115 mm Severe 2 (9.1%) 3 (13.6%)
115 to 125 mm Moderate 1 (4.5%)
>125 mm Normal 19 (86.4%) -
5 - 9 years ( n=21)
<135 mm Severe 1 (4.8%) 2 (9.5%)
135 - 145 mm Moderate 1 (4.8%)
>145 mm Normal 20 (95.2%)* -
≥10 years (n=114)
<160 mm Severe 5 (4.4%) 8 (7.0%)
160 - 185 mm Moderate 3 (2.6%)
>185 mm Normal 106 (93.0%) -
Overall malnutrition 57 (21.3%)
Keys: (F): Frequency; (%): Percent; (MUAC): Mid-upper arm circumference; *: The highest percent in a column; According to the WHO’s reference standards, Age group 6 months to 5 years: MUAC <115 mm: Severe malnutrition; MUAC 115 to 125 mm: Moderate malnutrition; MUAC >125 mm: Normal. Age group 5 to 9 years: MUAC <135 mm: Severe malnutrition; MUAC 135 to 145 mm: Moderate malnutrition; MUAC >145 mm: Normal. Age group ≥10 years: MUAC <160 mm: Severe malnutrition; MUAC 160 to 185 mm: Moderate malnutrition; MUAC >185 mm: Normal.
Table 5. Gender-specific discrepancies in anthropometric measurements among participants (N=268).
Categories All (N = 268
F (%) [95% CI]
Males (N = 146)
F (%) [95% CI]
Females (N= 122)
F (%) [95% CI]
Stunting
Severe stunting (<-3 z-score) 49 (18.3%)
[13.6 - 22.9]
28 (19.18%)
[12.7 - 25.6]
21 (17.2%)
[11.5 - 24.9]
Moderate stunting (<-3 to -2 z-score) 20 (7.4%)
[4.9 - 11.2]
12 (8.2%)
[4.7 - 13.7]
8 (6.6%)
[3.4 - 12.4]
Normal height-for-age (>-2 z-score) 199 (74.25%)
[69 - 79.6]
112 (76.71%)
[76.5 - 83.6]
87 (71.31%)
[63.4 - 79.5]
MUAC
Severe malnutrition 41 (15.33%)
[11 - 19.6]
19 (13.01%)
[7.6 - 18.4]
22 (18.03%)
[11.1 - 24.9]
Moderate malnutrition 16 (5.97%)
[3.3 - 8.8]
10 (6.85%)
[2.7 - 10.9]
6 (4.92%)
[1.1 - 8.7]
Normal (no malnutrition) 212 (79.1%)
[74.2 - 83.9]
101 (69.9%)
[61.7 - 76.7]
111 (91.8%)
[86 - 96]
Wasting
Severe wasting (<-3 SD) 45 (16.8%)
[12.17 - 21.43]
25 (17.1%)
[10.0 - 24.2]
20 (16.4%)
[9.0 - 23.8]
Moderate wasting (-3 to -2 SD) 32 (11.9%)
[7.9 - 15.8]
8 (5.5%)
[3.1 - 7.9]
24 (19.7%)
[12.1 - 27.3]
Overnutrition
Overweight (+1 to +2 SD) 16 (6.0%)
[4.4 - 11.1]
10 (6.8%)
[3.8 - 9.8]
6 (4.9%)
[2.6 - 7.2]
Obesity (>+3 SD) 14 (5.2%)
[3.7 - 10.0]
9 (6.1%)
[3.5 - 8.9]
5 (4.1%)
[2.1 - 6.1]
Normal weight-for-height/length (-2 to +1 SD) 161 (60.1%)
[54.2 - 66.0]
94 (64%)
[56.6 - 72.2]
67 (54.9%)
[46 - 63.7]
Keys: (F): Frequency; (CI): Confidence interval; (%): Percent; (MUAC): Mid-upper arm circumference.
Table 6. Correlation of participant’s pediatric health with malnutrition risk factors (N=268).
Kendall’s tau_b
Correlation Coefficient
Age Gender Vaccination Breast feeding Weaning age Weaning
mechanism
Admissions Diagnosis
Age 1 -0.03 -0.135** 0.00 -0.365** 0.230** 0.046 0.136**
Gender -0.03 1 0.141* 0.00 -0.07 0.135 0.044 -0.015
Vaccination -0.135** 0.141* 1 0.108 0.177** -0.045 -0.114* -0.045
Breast feeding 0.00 -0.001 0.108 1 -0.03 0.011 -0.121* -0.015
Weaning age -0.365** -0.071 0.177** -0.03 1 0.257** -0.03 -0.066
Weaning mechanism 0.230** 0.135 -0.05 0.011 0.257** 1 -0.009 0.147*
Admissions 0.046 0.044 -0.114* -0.121* -0.03 -0.009 1 0.096
Diagnosis 0.136** -0.015 -0.05 -0.02 -0.07 0.147* 0.096 1
Keys: ** Correlation is significant at the 0.01 level (2-tailed); * Correlation is significant at the 0.05 level (2-tailed).
Disclaimer/Publisher’s Note: The statements, opinions and data contained in all publications are solely those of the individual author(s) and contributor(s) and not of MDPI and/or the editor(s). MDPI and/or the editor(s) disclaim responsibility for any injury to people or property resulting from any ideas, methods, instructions or products referred to in the content.
Copyright: This open access article is published under a Creative Commons CC BY 4.0 license, which permit the free download, distribution, and reuse, provided that the author and preprint are cited in any reuse.
Prerpints.org logo

Preprints.org is a free preprint server supported by MDPI in Basel, Switzerland.

Subscribe

Disclaimer

Terms of Use

Privacy Policy

Privacy Settings

© 2025 MDPI (Basel, Switzerland) unless otherwise stated