
Submitted:
17 August 2024
Posted:
20 August 2024
You are already at the latest version
Abstract
Background: Malnutrition screening in hospitalized children is essential, and the STAMP is a val-idated tool for this purpose. The study aimed to modify STAMP for a Saudi context and assess the sensitivity and specificity of both the original and modified tools. Method: A cross-sectional study was conducted among 307 hospitalized children, where both the original and Saudi-modified STAMP were applied. Anthropometric measurements were also recorded, and statistical analysis was used to assess the tools' validity. Results: The Saudi-modified STAMP identified a higher percentage of children at high risk of malnutrition compared to the original STAMP (91.6% vs. 62.9%). The sensitivity, specificity, positive predictive value, negative predictive value, accuracy, and agreement of the Saudi-modified STAMP compared to the original were 94.3%, 13.2%, 64.8%, 57.7%, 0.654, and 0.089, respectively. Conclusion: The Saudi-modified STAMP showed excellent sensitivity and varied negative predictive value, indicating its potential effectiveness in screening for malnutrition among hospitalized children compared to the original STAMP and using an-thropometric measurements as references.
Keywords:
pediatric malnutrition
; validation
; screening tools
1. Introduction
Pediatric malnutrition is a prevalent condition, associated with impaired growth and development, unfavorable clinical outcomes, longer hospital stays, delayed recovery, and increased healthcare costs (1,2). Consequently, it is imperative to comprehensively assess the nutritional status of pediatric patients, employ various validated methods, and collaborate with a multidisciplinary team of healthcare professionals to deliver optimal nutritional interventions as an integral part of their hospital care(1,2). Multiple studies have globally reported a wide range in the prevalence of malnutrition among hospitalized children, varying from 6.1% to 55.6% (3,4). The observed differences in prevalence rates can be attributed to variations in defining criteria and the geographical areas examined. The lack of a standardized definition is responsible for the underestimation of the prevalence of malnutrition, while the World Health Organization (WHO) defined pediatric malnutrition as a nutritional imbalance either undernutrition (stunting, wasting, or underweight ) or overnutrition (overweight) (5), Mehta and his collages define pediatric malnutrition (undernutrition) as an imbalance between nutritional intake and needs, leading to cumulative shortfalls in energy, protein, or micronutrients that may have a deleterious impact on development, growth, and other clinical outcomes (6).
According to the WHO, malnutrition is a significant contributor to childhood mortality, accounting for approximately 45% of all cases (5). Most medical conditions cause malnutrition through leads to a lack of appetite, disturbs the digestive system, and/or increases nutritional needs (7). Worldwide, the main causes of mortality come from preventable and/or treatable medical conditions such as preterm birth complications, birth asphyxia/trauma, pneumonia, diarrhea, malaria, and infectious diseases (8). In Saudi Arabia, respiratory infections, neonatal disorders, pneumonia, and acute diarrhea are recognized as significant contributors to mortality rates, potentially influencing the nutritional status of individuals (9,10).
Evaluation of the nutritional status of hospitalized children is strongly recommended by internationally recognized organizations such as the European Society for Pediatric Gastroenterology, Hepatology, and Nutrition, the European Society for Clinical Nutrition and Metabolism, and the American Society for Parenteral and Enteral Nutrition (ASPEN) (11–13). Indeed, numerous tools have been developed and validated to screen pediatric malnutrition in hospital settings. These tools aim to assist healthcare professionals in screening the risk of malnutrition among hospitalized children (14–16). The Screening Tool for the Assessment of Malnutrition in Pediatrics (STAMP) was specifically designed to be incorporated into the admission screening procedure for pediatric patients. One of the strengths of STAMP is that it can be completed by any healthcare professional, even without formal nutrition training. This feature allows for its widespread use within hospital settings, ensuring that malnutrition screening becomes a routine part of patient care (17,18). STAMP was developed and validated by a team from the Royal Manchester Children’s Hospitals and the University of Ulster. It is a simple 5-step tool designed for screening malnutrition on admission and during the hospitalization of children aged 2 to 16 years (17,19). This tool has been created to provide efficient and effective means of identifying malnutrition risk in pediatric patients (17,19)
In addition, the validation of screening tools commonly involves the use of reference standards, such as anthropometric measurements, dietary intake assessments, and nutrition-related biochemical markers (20). These indicators are considered to be the most common standards for detecting pediatric malnutrition (21). The Academy of Nutrition and Dietetics and ASPENs recommended the following anthropometric measurements (weight for height z score, body mass index for age z score, length/height for age z score, and mid-upper arm circumference) as primary indicators to diagnose pediatric malnutrition (22).
Based on the literature review conducted, and to the best of our knowledge, there is limited studies that have modified and evaluated the sensitivity and specificity of the original and a modified nutrition screening tools using anthropometry measurements as reference standards. Additionally, no previous studies have been conducted in the Middle Eastern, specifically Saudi Arabian, contexts to modify and evaluate the sensitivity and specificity of nutrition screening tools in detecting malnutrition. Therefore, the aim of this study is to assess the validity of the original STAMP, and the Saudi modified STAMP in detecting malnutrition upon admission of Saudi pediatric patients. The original STAMP, along with anthropometric measurements, and dietary intake assessments using 24hrs dietary recall method will be used as reference standards in this evaluation.
2. Materials and Methods
2.1. Study Design and Sitting
Cross-sectional evaluation of diagnostic tools study assessed the validity of the Saudi modified Screening Tool for the Assessment of Malnutrition in Pediatrics (S-mSTAMP) and the original Screening Tool for the Assessment of Malnutrition in Pediatrics (oSTAMP) on admission using anthropometric measurements as reference standards to assess the malnutrition risk among Saudi hospitalized children at Prince Sultan Military Medical City (PSMMC).
2.2. Study Population
The sample size was calculated based on the sensitivity (Se), specificity (Sp), and prevalence of malnutrition as found in Perez Solis et al.’s paper (23), by using the following formulas; (1) n=(z^2×p(1-p))/∆^2 , n will be (a+c) if we used Se as P, and n will be (b+d) if we use Sp as p, (2) n=((a-c))/prevalence, (3) n=((b+d))/((1-prevalence) ). The total sample size required for this study was 292. The inclusion criteria were as follows: Saudi children of both genders aged from six months to 14 years who are admitted to the emergency ward at PSMMC. The exclusion criteria were children with edema, ascites, fluid retention, major congenital anomalies (heart defects, neural tube defects, and Down syndrome), and non-Saudi children.
2.3. Ethical Board Approval
This study was conducted at PSMMC, Riyadh, Saudi Arabia between November 2022, and November 2023. The study was approved by the Research Ethics Committees at PSMMC (Institutional Review Board Approval No: E2001), and at King Saud University (Institutional Review Board Approval No: E-22-7184).
2.4. Sociodemographic Data and Medical Variables of the Patient
Sociodemographic variables of the parents were taken by the researchers through interviews, which were sex ( Male or Female), age, education (None, Elementary, Secondary, High school, Graduate, Postgraduate), city of origin of parents, marital status (Married, Divorced, Widowed), number of children, occupation (Homemaker, Office employee, Trader, Worker, Military), and monthly household income (Less than 5000 SR, 5000- 10000 SR, 11000- 20000 SR, More than 20000 SR); also sociodemographic variables of the children were taken by the researcher through interviews, which was age and Sex (Boy, Girl) (24). Medical variables of the patient were taken from the medical fill, which is the diagnosis, amount of time hospitalized, and time since diagnosis (24).
2.5. Anthropometric Measurements
Clinical nurses and researchers performed the measurements using standardized methods as per hospital policy. Weight, length, and mid-upper arm circumference (MUAC) were measured, and Body Mass Index (BMI) and growth parameters were statistically measured and presented as z-scores. Weight: All subjects less than one year were weighed on DETECTO’s MB130 digital scale and more than one year were weighed using a Digital Pearson Scale with a precision of 10 g on admission. The length was taken on admission using measurement tape for patients less than two years, and more than two years was used Digital Pearson Scale while standing and facing the scale to the approximate 0.5 cm without shoes. BMI was calculated by dividing weight in kilograms by square height in meters. Growth parameters included weight for length/ height z-score for children less than five years, and BMI for age z-score for children older than five years were calculated using World Health Organization growth charts (WHOGCs) for children younger than 2 years, Central for Disease Prevention and Control growth charts (CDCGCs) for children older than 2 years, and Saudi growth charts (SGCs) for children aged from 6 months to 14 years. Then, the malnutrition cutoffs were determined for each patient based on the Academy of Nutrition and Dietetics/American Society of Parenteral and Enteral Nutrition (ASPEN) 2014 Pediatric Malnutrition Consensus Statement. Based on weight for length/ height z-score and BMI for age z-score, patients were classified as overweight/obese/very obese/normal weight with Z-scores between ≥ 3 and -0.99, mild malnutrition from -1 to -1.99, moderate malnutrition from -2 to -2.99, and severe malnutrition ≥ -3. Patient nutrition status was consolidated into two groups “malnutrition” (mild malnutrition, moderate malnutrition, and severe malnutrition), and “Absence of malnutrition” (overweight/obese/very obese/normal) (22,25).
MUAC was measured by researchers within 48 hours of admission. First, determine the midpoint of the left upper arm (between the tip of the shoulder and the tip of the elbow), then use tape to determine the MUAC value, and finally, we classified the nutritional status depending on MUAC cutoffs, which differed according to age groups, children aged between 6 -59 months old with MUAC < 115 mm, 5 - 9 years < 135 mm, or 10 – 14 years < 160 mm were suffered of severe acute malnutrition; and children age between 6 -59 months ≥ 115 to < 125 mm, or 5 - 9 years ≥ 135 to < 145 mm, 10 – 14 years ≥ 160 to < 185 mm were suffered of moderate acute malnutrition (26).
2.6. Nutritional Screening
2.6.1. The Original Screening Tool for the Assessment of Malnutrition in Pediatrics (oSTAMP)
As a routine policy, the original STAMP was applied by clinical nurses who completed a nutrition screen at the time of admission by assessing nutrition risk based on 3 steps: each Step was scored out of three (see Supplementary Materials S1). First, it scores the nutritional implications of the admission diagnosis, where 3 was definite nutritional implications, 2 was possible nutritional implications, and 0 was no nutritional implications. Then it assessed the nutritional intake of the child, where no change in eating patterns and good nutritional intake scored 0, recently decreased or poor nutritional intake scored 2, or no nutritional intake scored 0. Lastly, Weight and height for age were assessed using the centile quick reference tables, where 0 to 1 centile spaces/columns apart scored 0, > 2 centile spaces/= 2 columns apart scored 1, or > 3 centile spaces/≥3 columns apart (or weight < 2nd centile) scored 3. The overall risk of malnutrition was categorized into three categories based on a total score of the previous three steps, at high risk if equal to or more than 4, at medium risk if the score was between 2 and 3, or at low risk if the score was between 0 to 1 (17,19).
2.6.2. Saudi Modified Screening Tool for the Assessment of Malnutrition in Pediatrics (S-mSTAMP)
After the clinical nurses applied the original STAMP, the researchers (Dietitians) applied Saudi-modified STAMP. The modification in the original STAMP was in two out of three Steps (see Supplementary Materials S2). First, in diagnosis Steps added the main medical conditions that contributed to childhood mortality among Saudi children as a definite nutritional implication added respiratory infection and neonatal disorders, and as a possible nutritional implication pneumonia, and acute diarrhea (9,10). The modification in weight and height for age was by using the centile quick reference tables based on SGCs (27).
2.7. Statistical Analysis
The statistical analysis was performed using IBM SPSS Statistics for Windows (version 26; IBM Corp., Armonk, NY, USA). The normality of all the quantitative variables was tested before performing the analysis using the Shapiro-Wilk test. Missing data were treated using Mean/Median/Mode imputation. Descriptive analysis results for continuous data were shown as means ± standard divisions (SD) for normally distributed data or median and interquartile range (IQR) for data not normally distributed. Descriptive analysis results for categorical data were shown as frequencies and percentages. The chi-square or Fisher test was used for categorical variables. For continuous data, the student’s t-test was used for normally distributed variables and the Mann-Whitney U test was used for not normally distributed variables to compare patients at low risk of malnutrition with patients at high risk of malnutrition. A p-value of < 0.05 was used to report the statistical significance and precision of the estimates.
The screening tool was validated using the area under the ROC curve (AUC), sensitivity (Se), specificity (Sp), negative (NPV), and positive (PPV) predictive value. Se and NPV were given more weight when validating screening tools. Se and Sp values were rated as > 90 excellent, 80 to 90 good, 70 to 80 fair, 60 to 70 insufficient, and 50 to 60 poor, which the overall degree of Se, SP, PPV, and NPV were high > 90, moderate 80 to 90, low < 80 (28). The agreement between the Saudi-modified STAMP and the original STAMP was analyzed by the Kappa (κ) value. κ values were rated as > 0.90 almost perfect, 0.8 to 0.9 strong, 0.6 to 0.79 moderate, 0.40 to 0.59 weak, 0.21 to 0.39 minimal, 0 to 0.20 none, which the overall level of agreement was high if >0.8, moderate 0.6 to 0.79, and low < 0.59 (29).
3. Results
3.1. Sociodemographic Characteristics
Sociodemographic data of children’s caregivers were taken, 256 females 83.4%; and 51 males 16.6% were included, the mean age was 36.4 years old. The majority were university graduates; almost all of them were living in Riyadh, married, and homemakers. Monthly family income from 5000 to 10000 SR was higher, representing 45.6 % of our study population.
A total of 307 hospitalized children were included in the analysis 139 girls 45.3%; 168 boys 54.7%, with the age ranging from 6 to 170 months (median 59 months, interquartile range (IQR);72 months). Under investigation and asthma was considered the main admission diagnosis documented in the patient's medical records presented in 57.7% and 33.9%, respectively. The main medical condition cause of childhood mortality in Saudi Arabia, pneumonia was considered the main admission diagnosis documented in our study by 12.4%. followed by respiratory infection, acute diarrhea, and neonatal disorder, as shown in (Table 1).
3.2. Nutrition Status Characteristics Based on Anthropometric Measurements
The nutritional status based on anthropometric measurements is presented in (Table 2). Most patients presented with a normal nutritional status based on World Health Organization growth charts (WHOGCs), Central for Disease Prevention and Control growth charts (CDCGCs), and Saudi growth charts (SGCs) for both weight for height z score and Body Mass Index (BMI) for age z scores except Saudi BMI for age z score most of the patients were overweight (see Supplementary Materials S3). We categorized the patient's nutritional status into two groups where we combined all undernutrition categories under the malnourished group named malnutrition; and combined the normal with all overnutrition categories named absence of malnutrition.
3.3. Nutritional Status Characteristics Based on the Original and the Saudi Modified Screening Tool for the Assessment of Malnutrition in Pediatrics
Table 3 presents a summary of each part of STAMPs which shows most patients' diagnoses were matched with no nutritional implication based on both the Original Screening Tool for the Assessment of Malnutrition in Pediatrics (oSTAMP) and The Saudi Modified Screening Tool for the Assessment of Malnutrition in Pediatrics (S-mSTAMP) at 229 (74.6%) and 155 (50.5%), respectively. Most of our sample had no change in eating patterns and good nutritional intake at 160 (52.1%) based on oSTAMP, while recently decreased or poor nutritional intake at 154 (50.2%) based on S-mSTAMP. Additionally, most of the patients based on oSTAMP were at 0 to 1 centile spaces/columns apart by 175 (57%), while based on S-mSTAMP were at > 3 centile spaces/≥3 columns apart (or weight < 2nd centile) by 128 (41.7%). Finally, most of the patients were classified at medium risk of malnutrition based on the oSTAMP, while at high risk of malnutrition based on S-mSTAMP, 121 (39.4%), and 189 (61.5%), respectively. The nutrition risks were presented as high risks or low risks, in the high-risk group combined high with medium risk, while low risks were presented alone.
3.4. Anthropometric Characteristics of Hospitalized Children According to Original and Saudi Modified Screening Tool for the Assessment of Malnutrition in Pediatrics
Regarding the anthropometric measurements, there was no significant difference between the two groups (at high risk & at low risk) when using the oSTAMP or S-mSTAMP (Table 4-A and Table 4-B). Growth status z scores parameters defined nutritional status, most patients presented with an absence of malnutrition based on WHOGCs, CDCGCs, and SGCs, while malnutrition was presented by 31% and 23.2% based on weight for height z scores using WHOGCs &CDCGCs, and SGCs respectively; presented by 28.3%, and 25.7% based on BMI for age z scores using CDCGCs, and SGCs respectively; and presented by 32.2% based on mid-upper arm circumference (MUAC).
A Fisher's Exact Test suggests that there is no significant difference between the nutritional status based on growth status z score parameters, including Saudi weight for height, Saudi BMI for age, WHO and CDC weight for height, and CDC BMI for age z scores, and the nutritional status based on S-mSTAMP (p= 1, p=0.356, p=174, and p=0.235, respectively), but, patients at high risk of malnutrition according to S-mSTAMP was higher than patients at low risk based on Saudi weight for height, Saudi BMI for age, WHO and CDC weight for height, and CDC BMI for age z scores, which were 23.6%, 27%, 32.6%, and 29.9, compared with patients at low risk 18.2%, 13.3%, 9.1%, and 13.3, respectively. The average MUAC was 153.37 ± 40.69. Also, the t-test suggests that there are no significant differences between patients presenting with malnutrition and absence of malnutrition (p=0.621) as shown in (Table 4-A).
Also, A Pearson Chi-Square test suggests that there is no significant difference between the nutritional status based on growth status z score parameters, including Saudi weight for height, Saudi BMI for age, WHO and CDC weight for height, and CDC BMI for age z scores, and the nutritional status based on the oSTAMP (p= 0.0.268, p=0.263, p=0.146, and p=0.740, respectively). While patients presented with at high risk of malnutrition were comparable to the patients presented with at low risk of malnutrition based on Saudi weight for height, Saudi BMI for age, WHO and CDC weight for height, and CDC BMI for age z scores, which were 26.4%, 28.4%, 35.6%, and 29.1%, compared with at low risk 18.8%, 20%, 24.6%, and 26.5%, respectively as shown in (Table 4-B)
3.5. Prevalence of Malnutrition, Validity, and Agreements of Saudi Modified Screening Tool for the Assessment of Malnutrition in Pediatrics using Original Screening Tool for the Assessment of Malnutrition in Pediatrics
The prevalence of malnutrition based on S-mSTAMP diagnosis part, nutritional intake part, weight and height for age part, and overall nutritional status part were 25.1%, 47.9%, 43%, and 62.9%, respectively.
Table 5 shows the validity of S-mSTAMP using Se and Sp, PPV, NPV, and AUC as indicators, and using oSTAMP as the reference standard. The Se was excellent at 94.8%, but Sp was fair at 65.7%, with PPV at 48% and NPV at 97.4%, when using the diagnosis part. For the nutritional intake part, Se was good at 82.3%, but a loss of Sp, was poor at 30.6%; PPV was 52.2% and NPV was 65.3%. There was a good Se when using weight and height for the age part at 75.8%, but the loss in the Sp at 36%, while PPV was 47.2% and an NPV was 66..3%. The overall nutritional status shows good Se, but poor Sp at 13.2 %, while a PPV was 64.8% and an NPV was 57.7%.
The AUC clearly showed a good discriminative ability of the diagnosis part to determine nutritional status AUC=0.856, CI (0.810-0.902), p=0.001 (Figure 1-a). while showed a failed discriminative ability of the nutritional intake part (Figure 1-b) and weight and height for age part (Figure 1.c) to determine nutritional status AUC=0.576, CI (0.512-0.640), p=0.021, and AUC=0.595, CI (0.531-0.659), p=0.04, respectively. Also, showed a poor discriminative ability of the overall nutritional status part to determine nutritional status AUC=0.654, CI (0.592-0.715), p=0.001(Figure 1-d).
Cohen's κ was run to determine if there was an agreement between diagnosis parts of STAMP in both Saudi modified and original on whether 307 patients were at low risk of malnutrition or at high risk of malnutrition. There was moderate agreement between the two diagnosis parts in STAMP in both Saudi modified and original versions, κ = 0.457, p =0.001. While there was no to slight agreement between the two nutritional intake parts, two weight and height for age part, and two overall nutritional status parts of STAMP in both Saudi modified and original versions κ = 0.126, p =0.008, κ = 0.109, p =0.027, and κ = 0.089, p =0.023, respectively.
3.6. Prevalence, Validity, and Agreements of Saudi Modified Screening Tool for the Assessment of Malnutrition in Pediatrics Using Anthropometric as Reference Standard
The prevalence of malnourished patients based on WHO & CDC weight for height z score, CDC BMI for age z score, Saudi weight for height z score, and Saudi BMI for age z score were 31%, 28.3%, 23.2%, and 25.7%, respectively.
Table 6 shows a good Se of the overall nutritional status of S-mSTAMP when compared to the nutritional status of WHO & CDC weight for height z score, CDC BMI for age z score, Saudi weight for height z score, and Saudi BMI for age z score, and increased in NPV, but the loss of specificity and reduced in PPV, (Se: 97.9%, NPV: 90.9%, Sp: 9.3%, PPV: 32.6%, respectively), (Se: 95.3%, NPV: 86.7%, Sp: 11.9%, PPV: 29.9%, respectively), (Se: 94.4%, NPV: 81.8%, Sp: 7.6%, PPV: 23.6%, respectively), and (Se: 94.9%, NPV: 86.7%, Sp: 11.5%, PPV: 27%, respectively), respectively.
3.7. Prevalence, Validity, and Agreements of the Original Screening Tool for the Assessment of Malnutrition in Pediatrics Using Anthropometric Measurements & Dietary Intake as Reference Standard
The prevalence of malnourished patients based on WHO & CDC weight for height z score, CDC BMI for age z score, Saudi weight for height z score, and Saudi BMI for age z score, were 56.7%, 28.3%, 23.2%, and 25.7%, respectively.
Table 7 shows the Se, Sp, PPV, and NPV of oSTAMP using anthropometric measurements as reference standards. The Sn, Sp, PPV, and NPV of oSTAMP based on WHO & CDC weight for height, CDC BMI for age, Saudi weight for height, and Saudi BMI for age, were (Se: 54.2%, Sp: 33.3%, PPV: 64.4%, NPV: 24.6%, respectively), (Se: 69.8%, Sp: 33%, PPV: 29%, NPV: 73.5%, respectively), (Se:66.7%, Sp: 43.7%, PPV: 26.4%, NPV: 81.3%, respectively), and (Se: 74.4%, Sp: 35.4%, PPV: 28.4%, NPV: 80%, respectively), respectively.
4. Discussion
4.1. Main Findings
In the current study, a validation of the Saudi modified tool was conducted by incorporating modifications to enhance its applicability among Saudi hospitalized children. We specifically added the primary medical condition that contributes to mortality in Saudi children and related to malnutrition, relying on information from reputable sources such as the World Health Organization (WHO) and the Central for Disease Control and Prevention (CDC), were reported from Saudi Ministry of Health (30–33). Additionally, we utilized Saudi growth charts (SGCs) as part of our screening processes (30–33).
The study's main interesting finding was the prevalence of malnutrition as determined by the original Screening Tool for the Assessment of Malnutrition in Pediatrics (oSTAMP) and Saudi modified Screening Tool for the Assessment of Malnutrition in Pediatrics (S-mSTAMP) tools, which yielded rates of 59% and 91.6%, respectively. It is possible that the differences in prevalence between the two tools can be attributed to the modifications applied, which were tailored to better suit the study population, also who’s applying screening for the patient which in oSTAMP applied by nurses and S-mSTAMP applying by dietitians, where shows differences in nutritional intake parts between the tools. The approach used to classify the nutritional status of STAMPs was similar to that employed by other researchers, wherein the moderate and high-risk (HR) categories were combined to form a group designated as the malnutrition group. This group exhibited a notably high prevalence rate of 79% (34). Another study conducted on the outpatient Egyptian population, utilizing the STAMP tool, revealed a malnutrition prevalence of 24.2%. It is possible that these results can be attributed to the STAMP tool being more suitable for inpatient populations, as mentioned previously (21). Our study revealed a prevalence of malnutrition of 23.2% and 25.7% based on weight-for-height and Body Mass Index (BMI)-for-age z-scores using the SGCs. Additionally, when using the World Health Organization growth charts (WHOGCs) and Central for Disease Control and Prevention growth charts (CDCGCs), the prevalence was 31%, and 28.3%. These findings are consistent with previous studies, which have reported malnutrition prevalence rates of 19.5% and 23.2% when using WHOGCs, weight-for-height, and BMI-for-age z-scores, respectively (34).
However, the observed difference between the nutritional status identified using the oSTAMP and S-mSTAMP tools, and anthropometric measurements such as weight-for-height and BMI-for-age z-scores, were not found to be statistically significant in our study. The oSTAMP assessment showed malnutrition prevalence rates of 26.4%, 28.4%, 35.6%, and 29.1% based on Saudi weight-for-height, Saudi BMI/age, WHO/CDC weight-for-height, and CDC BMI-for-age z-scores, respectively. Similarly, the S-mSTAMP assessment indicated malnutrition prevalence rates of 23.6%, 27%, 32.6%, and 29.9% based on Saudi weight-for-height, Saudi BMI-for-age, WHO/CDC weight-for-height, and CDC BMI-for-age z-scores, respectively. These results demonstrate comparability between the two assessment tools for identifying malnutrition. These results closely align with those reported by Shu Hwa Ong et al., where the STAMP tool demonstrated a malnutrition prevalence rate of 35.4% using an objective assessment that incorporated anthropometric measurements such as weight-for-height z score, weight-for-age z score, BMI-for-age z score, and MUAC. The assessment followed the ASPEN/AND definition of malnutrition and considered various variables (34).
However, the findings of the current study do not support the previous research that demonstrated a significant association between STAMP and the WHO weight-for-height z-score. The previous study reported a higher prevalence of malnutrition, about 73.5%, when utilizing the WHO weight-for-height z-score as a reference standard in conjunction with STAMP for children under 2 years old (21). This disparity may be attributed to the challenges associated with using STAMP for children within this age group, as the accuracy of nutritional intake assessment using STAMP could be compromised. Consequently, there is a potential for overestimation of malnutrition rates when employing STAMP in this particular age bracket (21).
The results of this study align with a previous observational study, where the mean ± SD of mid-upper arm circumference (MUAC) was 159 ± 1.6, similar to the mean of 153.37 ± 40.69 in our study (34). However, there was a notable difference in the standard deviation (SD) between the two studies. This dissimilarity may be attributed to the fact that our study adopted a different reference for determining nutritional status based on MUAC, which included all patients up to 14 years old, in contrast to the previous study that relied on the WHO standard for patients up to 59 months old (34).
In our study, we assessed the validity and accuracy of S-mSTAMP by comparing it to the oSTAMP as a reference standard. Our findings reveal excellent sensitivity (Se) (94.3%), poor Negative Predictive Value (NPV) (57.7%), loss of specificity (Sp) (13.2%), and insufficient Positive Predictive Value (PPV) (64.8%). The accuracy of the S-mSTAMP demonstrates poor discriminative ability, and the agreement between the S-mSTAMP and the oSTAMP indicates no agreement in determining nutritional status (AUC: 0.654, κ: 0.089, p=0.023). It is encouraging to compare these results with those found by M Reed (2020), who reported 89% sensitivity and 97% specificity for electronic health records using the original STAMP as a reference standard (35). Additionally, they found a PPV of 60%, an NPV of 94%, and an overall accuracy of 85%. This level of sensitivity and PPV is comparable to what we observed in our study. However, Reed's study demonstrated significantly higher specificity, accuracy, and NPV. The differences in performance may be attributed to the use of electronic health records, which can help reduce human error, as well as the implementation of training for staff to ensure accurate use of both STAMP tools. Another study evaluated the efficacy of STAMP in two ways: based on the WHOGC; and on the Hellenic growth charts (HGC) used dietetic assessment as a reference standard, showed the agreement of WHOGC STAMP was 0.28, while HGC STAMP was 0.26); and Se, Sp, PPV, and NPV of WHOGC STAMP vs HGC STAMP were 84.4% vs 78.3 (36).
Additionally, in the current study, the validity of S-mSTAMP and the oSTAMP in determining nutritional status using anthropometric measurements as reference standards. The S-mSTAMP showed excellent sensitivity, good NPV, poor specificity and PPV in determining nutritional status based on WHO/CDC weight for height, CDC BMI for age, Saudi weight for height, Saudi BMI for age, energy intake, and protein intake (Se: 97.9%, NPV: 90.9%, Sp: 9.3%, PPV: 32.6%), (Se: 95.3%, NPV: 86.7%, Sp: 11.9%, PPV: 29.9%), (Se: 94.4%, NPV: 81.8%, Sp: 7.6%, PPV: 23.6%), (Se: 94.9%, NPV: 86.7%, Sp: 11.5%, PPV: 27%), (Se: 94.9%, NPV: 57.7%, Sp: 16.1%, PPV: 72.2%), and (Se: 94.4%, NPV: 88.5%, Sp: 9.1%, PPV: 18.1%). The oSTAMP showed insufficient sensitivity and NPV; and poor specificity and PPV, in determining nutritional status based on the majority of reference standards, WHO/CDC weight for height, CDC BMI for age, Saudi weight for height, Saudi BMI for age, energy intake, and protein intake (Se: 54.2%, NPV: 24.6%, Sp: 33.3%, PPV: 64.4%), (Se: 69.8%, NPV: 73.5%, Sp: 33.3%, PPV: 29%), (Se: 66.7%, NPV: 81.3%, Sp: 43.7%, PPV: 26.4%), (Se: 74.4%, NPV: 80%, Sp: 35.4%, PPV: 28.4%), (Se: 64.5%, NPV: 33.3%, Sp: 40.9%, PPV: 71.5%), and (Se: 72.2%, NPV: 86.8%, Sp: 39.1%, PPV: 20.2%). It's interesting to compare the results of the current study with those of other studies that have assessed the validity of STAMP in determining nutritional status. Ong et al., found that STAMP had a fair Se of 76.32% and a poor Sp of 18.18%, with a poor NPV of 47.06%. PPV of STAMP indicates that 45% of the children classified as at high risk of malnutrition were truly malnourished (34). Similarly, Tuokkola et al. (2019) reported excellent Se and NPV at 100%, but a loss of Sp at 69% and a poor PPV of 17% when using anthropometric measurements as a reference standard (37). On the other hand, Sayed et al. (2023) used weight for height as the gold standard, finding that STAMP had fair Se at 73.5% and good specificity at 81.4% for predicting wasting (21). Another European study by Chourdakis et al. (2016) used height/length, weight, and BMI as reference standards and reported fair Se (79.04%), excellent NPV (90.10%), poor Sp (42.68%), and poor PPV (23.57%) (14). Overall, these findings indicate some variability in the performance of STAMP in different studies, particularly in terms of Se, Sp, NPV, and PPV. This variability may be related to each study's specific reference standards and different methodologies. This research project presents a significant opportunity to advance the understanding of pediatric undernutrition and enhance the effectiveness of malnutrition screening tools for hospitalized children, particularly in the context of Saudi Arabia.
4.2. Strengths and Limitations
This study is unique in that it not only validated the original screening tool but also a modified pediatric screening tool to better align with the characteristics of our population. By shedding light on the strengths and weaknesses of the pediatric malnutrition screening process as a clinical practice, this study aims to contribute valuable insights to the field. Since this project was conducted during the transitional phase from paper to electronic health records, the accuracy of the tool application may have been compromised, leading to potential discrepancies among the results. Furthermore, differences in anthropometric measurement assessment between the WHO/CDC GCs and SGCs, where electronic measurements were used versus human measurements, may have impacted the accuracy of SGCs due to potential human error. It is also important to note that this study was an observational cross-sectional study conducted at a single center in the emergency ward during winter season, limiting the generalizability of the results.
4.3. Implications for Practice and Future Direction
A multicenter, multi-season prospective cross-sectional study is necessary to assess the screening process upon admission and during hospitalization for children in a nationwide context. Additionally, a longitudinal prospective cohort study is recommended to evaluate the validity and agreement between different tools, such as oSTAMP and the mSTAMP, on a large sample size that encompasses diverse populations at a national level. The assigned healthcare providers for implementing the nutrition screening process needs nutritional education, and/or involved dietitians or assigned healthcare providers with a nutritional background while considering the appropriate staff load to keep good performance and improve the quality of patient care. Standardizing the reference used for screening and assessments at the nationwide practice level can enhance patient outcomes by facilitating early detection of malnutrition, improving the accuracy of clinical practice, reducing the financial burden, decreasing hospital stays, and increasing bed availability.
5. Conclusions
In conclusion, our study revealed that approximately 62.9% and 91.6% of hospitalized children were identified as HR of malnutrition when using the oSTAMP and A mSTAMP, respectively. Notably, S-mSTAMP demonstrated excellent sensitivity and varied in its NPV for screening malnutrition among hospitalized children, relying on the oSTAMP, and anthropometric measurements as reference standards. Furthermore, it is crucial for hospitals and healthcare facilities to incorporate screening tools suitable for their population into their protocols and guidelines to ensure the comprehensive screening, assessment, and management of pediatric malnutrition in hospital settings.
Supplementary Materials
The following supporting information can be downloaded at the website of this paper posted on Preprints.org, Supplementary Material S1: 5 The original screening tool for the assessment of malnutrition in pediatrics; Supplementary Material S2: A modified screening tool for the assessment of malnutrition in pediatrics; Supplementary Material S3: Nutrition status of the patients based on anthropometric measurements.
Author Contributions
Conceptualization, S.A. and K.A.; methodology, S.A. and K.A.; validation, S.A., A.M. and G.A.; formal analysis, S.A. and K.A.; investigation, S.A., A.M., G.A. and S.A.A.; resources, S.A. and S.A.A.; data curation, S.A.; writing—original draft preparation, S.A.; writing—review and editing, S.A., K.A., A.M., G.A. and S.A.A.; visualization, S.A.; supervision, S.A. and K.A.; project administration, S.A. All authors have read and agreed to the published version of the manuscript.
Funding
This research received no external funding.
Institutional Review Board Statement
The study was conducted at Prince Sultan Military Medical City (PSMMC), Riyadh, Saudi Arabia. The study was approved by the Research Ethics Committees at PSMMC (Institutional Review Board Approval No: E2001), and at King Saud University (Institutional Review Board Approval No: E-22-7184).
Informed Consent Statement
Informed consent was obtained from all subjects involved in the study.
Data Availability Statement
The data supporting this study’s findings are available from the corresponding author upon request.
Acknowledgments
The authors extend their appreciation to the Deanship of Scientific Research at King Saud University for the logistic support of this work through the Research Assistant Internship Program, and to the Scientific Research Center, Dietetics department, and Emergency department at Prince Sultan Military Medical City.
Conflicts of Interest
The authors declare no conflict of interest.
References
- Pelletier, D.L.; Frongillo, E.A.; Habicht, J.P. Epidemiologic evidence for a potentiating effect of malnutrition on child mortality. Am J Public Health. 1993, 83, 1130–1133. [Google Scholar] [CrossRef] [PubMed]
- Pollack, M.M.; Ruttimann, U.E.; Wiley, J.S. Nutritional Depletions in Critically Ill Children: Associations with Physiologic Instability and Increased Quantity of Care. Journal of Parenteral and Enteral Nutrition. 1985, 9, 309–313. [Google Scholar] [CrossRef] [PubMed]
- Campanozzi, A.; Russo, M.; Catucci, A.; Rutigliano, I.; Canestrino, G.; Giardino, I.; et al. Hospital-acquired malnutrition in children with mild clinical conditions. Nutrition. 2009, 25, 540–547. [Google Scholar] [CrossRef]
- Wang, Y.J.; Zhou, H.J.; Liu, P.J.; Liu, G.L.; Zheng, Y.; Wei, B.; et al. Risks of undernutrition and malnutrition in hospitalized pediatric patients with spinal cord injury. Spinal Cord. 2017, 55, 247–254. [Google Scholar] [CrossRef] [PubMed]
- WHO (World Health Organization). Malnutrition. Available online: https://www.who.int/news-room/fact-sheets/detail/malnutrition (accessed on 20 July 2023).
- Mehta, N.M.; Corkins, M.R.; Lyman, B.; Malone, A.; Goday, P.S.; Carney, L.; et al. Defining Pediatric Malnutrition. Journal of Parenteral and Enteral Nutrition. 2013, 37, 460–481. [Google Scholar] [PubMed]
- National Health Service. Malnutrition. Available online: https://www.nhs.uk/conditions/malnutrition/causes/#:~:text=Some%20health%20conditions%20that%20can,as%20chronic%20obstructive%20pulmonary%20disease) (accessed on 3 October 2023).
- World Health Organization. 10 Facts on Child Health. Children: Reducing mortality. Available online: http://www.who.int/mediacentre/ factsheets/fs178/en/ (accessed on 20 October 2023).
- Wang, H.; Abbas, K.M.; Abbasifard, M.; Abbasi-Kangevari, M.; Abbastabar, H.; Abd-Allah, F.; et al. Global age-sex-specific fertility, mortality, healthy life expectancy (HALE), and population estimates in 204 countries and territories, 1950–2019: a comprehensive demographic analysis for the Global Burden of Disease Study 2019. The Lancet. 2020, 396, 1160–1203. [Google Scholar] [CrossRef] [PubMed]
- Asiri, A.M.; Alomary, S.A.; AL Qahtani, S.A.; Adam, I.F.; Amer, S.A. Determinants of the Underlying Causes of Mortality during the First Wave of COVID-19 Pandemic in Saudi Arabia: A Descriptive National Study. Int J Environ Res Public Health. 2021, 18, 12647. [Google Scholar] [CrossRef] [PubMed]
- Agostoni, C.; Axelson, I.; Colomb, V.; Goulet, O.; Koletzko, B.; Michaelsen, K.F.; et al. The Need for Nutrition Support Teams in Pediatric Units: A Commentary by the ESPGHAN Committee on Nutrition. Pediatr Gastroenterol Nutr. 2005, 41, 8–11. [Google Scholar]
- Cederholm, T.; Barazzoni, R.; Austin, P.; Ballmer, P.; Biolo, G.; Bischoff, S.C.; et al. ESPEN guidelines on definitions and terminology of clinical nutrition. Clinical Nutrition. 2017, 36, 49–64. [Google Scholar] [CrossRef] [PubMed]
- Wonoputri, N.; Djais, J.T.B.; Rosalina, I. Validity of Nutritional Screening Tools for Hospitalized Children. J Nutr Metab. 2014, 2014, 1–6. [Google Scholar] [CrossRef]
- Chourdakis, M.; Hecht, C.; Gerasimidis, K.; Joosten, K.F.; Karagiozoglou-Lampoudi, T.; Koetse, H.A.; et al. Malnutrition risk in hospitalized children: use of 3 screening tools in a large European population. Am J Clin Nutr. 2016; 103, 1301–1310. [Google Scholar] [CrossRef] [PubMed]
- Hartman, C.; Shamir, R.; Hecht, C.; Koletzko, B. Malnutrition screening tools for hospitalized children. Curr Opin Clin Nutr Metab Care. 2012, 15, 303–309. [Google Scholar] [CrossRef]
- Huysentruyt, K.; Devreker, T.; Dejonckheere, J.; De-Schepper, J.; Vandenplas, Y.; Cools, F. Accuracy of Nutritional Screening Tools in Assessing the Risk of Undernutrition in Hospitalized Children. J Pediatr Gastroenterol Nutr. 2015, 61, 159–166. [Google Scholar] [CrossRef] [PubMed]
- McCarthy, H.; Dixon, M.; Crabtree, I.; Eaton-Evans, M.J.; McNulty, H. The development and evaluation of the Screening Tool for the Assessment of Malnutrition in Paediatrics (STAMP©) for use by healthcare staff. Journal of Human Nutrition and Dietetics. 2012, 25, 311–318. [Google Scholar] [CrossRef]
- Becker, P.J.; Gunnell, B.S.; Wong, V.M.; Corkins, M.R.; Spear, B.A.; Spoede, E.; et al. Validity and Reliability of Pediatric Nutrition Screening Tools for Hospital, Outpatient, and Community Settings: A 2018 Evidence Analysis Center Systematic Review. J Acad Nutr Diet. 2020, 120, 288–318. [Google Scholar] [CrossRef] [PubMed]
- Carey, A.; et al. A pilot study evaluating the use of STAMP© nutrition screening tool in hospitalized infants. Abstracts/Clin Nut ESPEN. 2015, 174–212. [Google Scholar]
- Klanjsek, P.; Pajnkihar, M.; Marcun, V.N.; Povalej, B.P. Screening and assessment tools for early detection of malnutrition in hospitalised children: a systematic review of validation studies. BMJ Open. 2019, 9, e025444. [Google Scholar] [CrossRef] [PubMed]
- Sayed, S.; El-Shabrawi, M.H.F.; Abdelmonaem, E.; El-Koofy, N.; Tarek, S. Value of Nutritional Screening Tools Versus Anthropometric Measurements in Evaluating Nutritional Status of Children in a Low/Middle-Income Country. Pediatr Gastroenterol Hepatol Nutr. 2023, 26, 213. [Google Scholar] [CrossRef]
- Becker, P.J.; Nieman, C.L.; Corkins, M.R.; Monczka, J.; Smith, E.; Smith, S.E.; et al. Consensus Statement of the Academy of Nutrition and Dietetics/American Society for Parenteral and Enteral Nutrition: Indicators Recommended for the Identification and Documentation of Pediatric Malnutrition (Undernutrition). J Acad Nutr Diet. 2014, 114, 1988–2000. [Google Scholar] [CrossRef]
- Pérez-Solís, D.; Larrea-Tamayo, E.; Menéndez-Arias, C.; Molinos-Norniella, C.; Bueno-Pardo, S.; Jiménez-Treviño, S.; et al. Assessment of Two Nutritional Screening Tools in Hospitalized Children. Nutrients 2020, 12, 1221. [Google Scholar] [CrossRef]
- Toledano-Toledano, F.; Rodríguez-Rey, R.; Moral-de-la-Rubia, J.; Luna, D. A Sociodemographic variables questionnaire (Q-SV) for research on family caregivers of children with chronic disease. BMC Psychol. 2019, 7, 85. [Google Scholar] [CrossRef] [PubMed]
- Klanjšek, P.; Pajnkihar, M.; Marčun, V.N.; Močnik, M.; Golob-Jančič, S.; Povalej-Bržan, P. Development and Validation of a New Screening Tool with Non-Invasive Indicators for Assessment of Malnutrition Risk in Hospitalised Children. Children. 2022, 9, 731. [Google Scholar] [CrossRef]
- NACS. Available online: https://www.fantaproject.org/sites/default/files/resources/NACS-Users-Guide-Module2-May2016.pdf (accessed on 19 December 2022).
- El-Mouzan, M.; Al-Herbish, A.; Al-Salloum, A.; Qurachi, M.; Al-Omar, A. Growth charts for Saudi children and adolescents. Saudi Med J. 2007, 28, 1555–1568. [Google Scholar] [PubMed]
- Neelemaat, F.; Meijers, J.; Kruizenga, H.; van-Ballegooijen, H.; van-Bokhorst-de-van-der-Schueren, M. Comparison of five malnutrition screening tools in one hospital inpatient sample. J Clin Nurs. 2011, 20, 2144–2152. [Google Scholar] [CrossRef] [PubMed]
- McHugh, M.L. Interrater reliability: the kappa statistic. Biochem Med (Zagreb). 2012, 22, 276–282. [Google Scholar] [CrossRef]
- Central of Disease Control and Prevention. Saudi Arabia Top 10 Causes of Death. 2019. (accessed on 12 October 2023).
- World Health Organization. Child and adolescent health. Available online: https://www.emro.who.int/child-adolescent-health/data-statistics/saudi-arabia.html (accessed on 12 October 2023).
- El-Mouzan, M.; Al-Salloum, A.; Alqurashi, M.; Al-Herbish, A.; Al-Omar, A. The LMS and Z scale growth reference for Saudi school-age children and adolescents. Saudi Journal of Gastroenterology. 2016, 22, 331. [Google Scholar] [CrossRef] [PubMed]
- El-Mouzan, M.I.; Shaffi, A.; Al-Salloum, A.; Alqurashi, M.M.; Al-Herbish, A.; Al-Omer, A. Z-score growth reference data for Saudi preschool children. Ann Saudi Med. 2017, 37, 10–15. [Google Scholar] [CrossRef] [PubMed]
- Ong, S.H.; Chee, W.S.S.; Lapchmanan, L.M.; Ong, S.N.; Lua, Z.C.; Yeo, J.X.N. Validation of the Subjective Global Nutrition Assessment (SGNA) and Screening Tool for the Assessment of Malnutrition in Paediatrics (STAMP) to Identify Malnutrition in Hospitalized Malaysian Children. J Trop Pediatr. 2019, 65, 39–45. [Google Scholar] [CrossRef]
- Reed, M.; Mullaney, K.; Ruhmann, C.; March, P.; Conte, V.H.; Noyes, L.; et al. Screening Tool for the Assessment of Malnutrition in Pediatrics (STAMP) in the Electronic Health Record: A Validation Study. Nutrition in Clinical Practice 2020, 35, 1087–1093. [Google Scholar] [CrossRef] [PubMed]
- Katsagoni, C.N.; Cheirakaki, O.; Hatzoglou, A.; Zerva, O.; Koulieri, A.; Loizou, K.; et al. Malnutrition in Hospitalised Children—An Evaluation of the Efficacy of Two Nutritional Screening Tools. Nutrients 2021, 13, 1279. [Google Scholar] [CrossRef]
- Tuokkola, J.; Hilpi, J.; Kolho, K.L.; Orell, H.; Merras-Salmio, L. Nutritional risk screening—a cross-sectional study in a tertiary pediatric hospital. J Health Popul Nutr. 2019, 38, 8. [Google Scholar] [CrossRef] [PubMed]
Figure 1.
Receiver-operating characteristic (ROC) curve plot of the true positive rate (sensitivity) rate against the false positive rate (1-specificity) (a) at the diagnosis part of the modified Screening Tool for the Assessment of Malnutrition in Pediatrics (mSTAMP) compared with the diagnosis part of the original Screening Tool for the Assessment of Malnutrition in Pediatrics (oSTAMP); (b) at nutritional intake of S-mSTAMP compared with the nutritional intake of oSTAMP; (c) at weight and height for age of S-mSTAMP compared with the weight and height for age of oSTAMP; (d) at the overall nutritional status of S-mSTAMP compared with the overall nutritional status of oSTAMP.
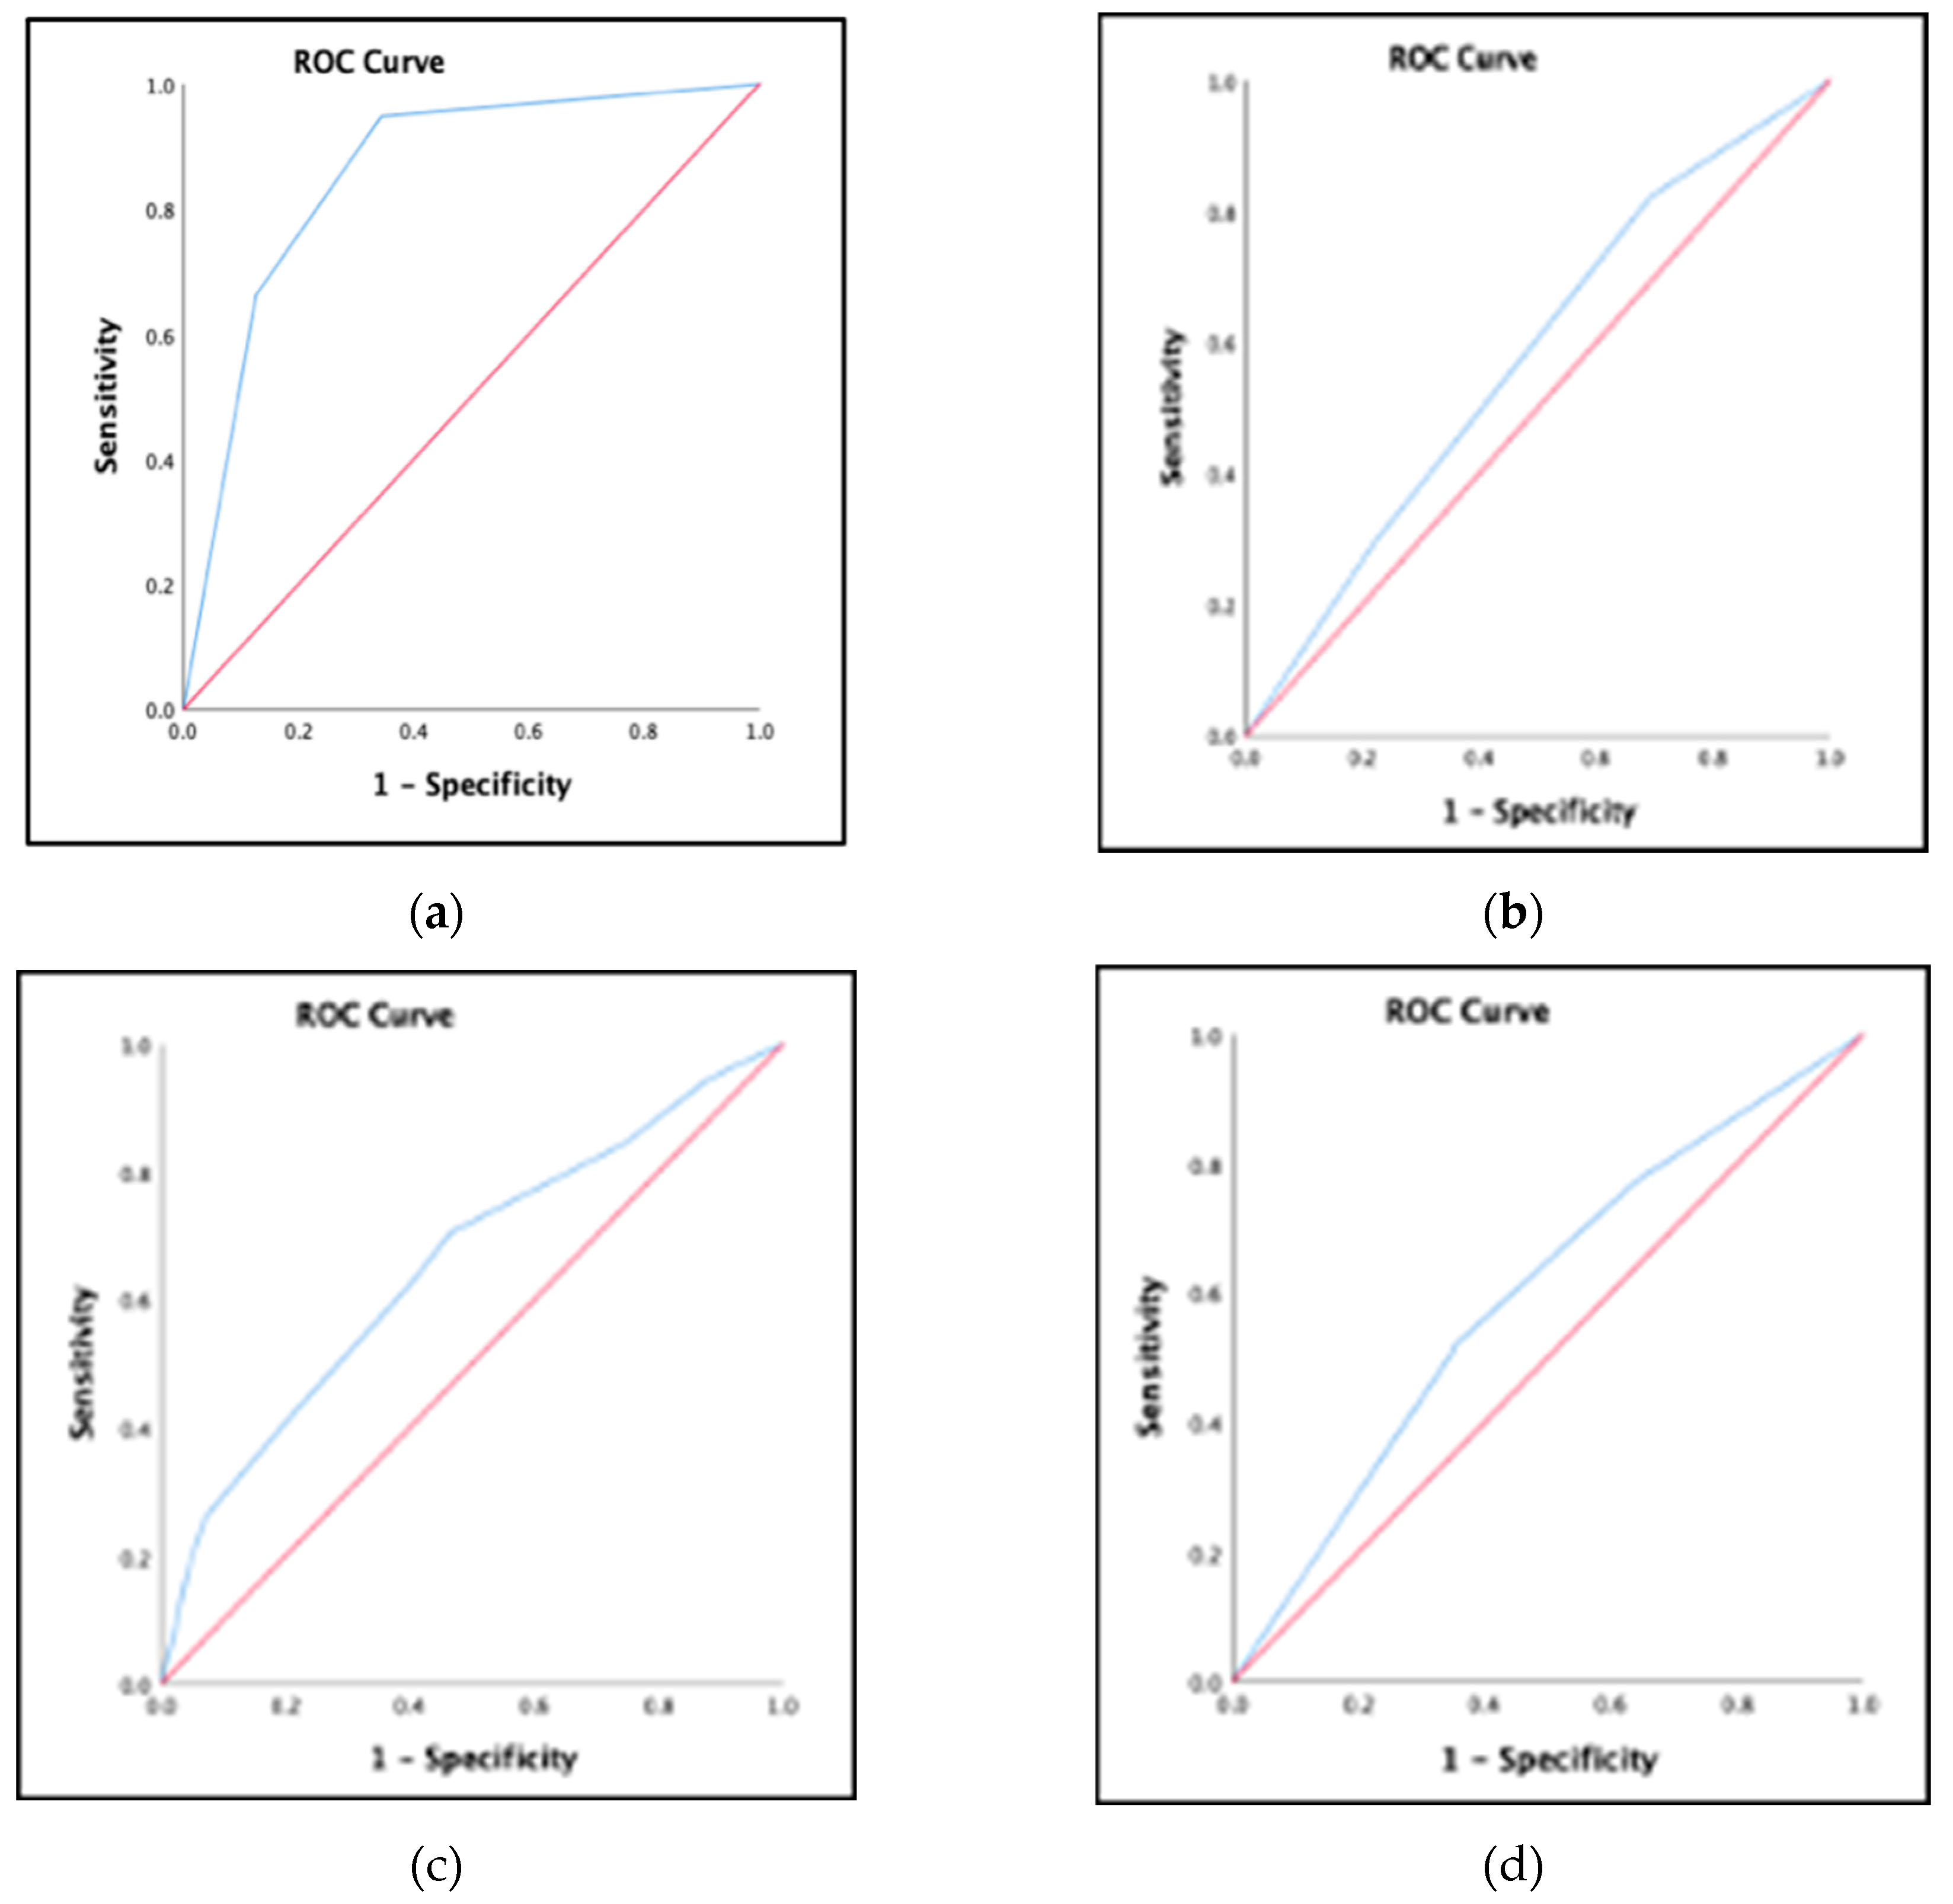

Table 1.
Characteristics of the patients & patients' caregivers.
| Variable | All (n=307) |
|---|---|
| Caregiver’s characteristics Age of the Caregiver* Gender of Caregiver*** Male Female |
36.40 ± 6.70 51 (16.6%) 256 (83.4%) |
| Patient’s Characteristics Age (months)** Gender*** Boy Girl Wight (kg)** Length/Height (cm)* MUAC (mm )* BMI (kg/m2)* Admission Diagnosis Documented*** Bowel failure, intractable diarrhea Burn and major trauma Liver disease Major surgery Food allergies/ intolerance Oncology on active treatments Renal disease/ failure Inborn errors of metabolism Coeliac disease Gastro-esophageal reflux Diabetes Respiratory syncytial virus Minor surgery Asthma Neuromuscular conditions Under investigations Pneumonia Acute diarrhea Respiratory Infection Neonatal disorder |
59 (72) 168 (54.7%) 139 (45.3%) 15.2 (13.5) 104.2 ± 26.73 153.37 ± 40.69 17.12 ± 4.69 11 (3.6%) 4 (1.3%) 3 (1%) 6 (2%) 4 (1.3%) 1 (0.3%) 8 (2.6%) 14 (4.6%) 1 (0.3%) 12 (3.9%) 9 (2.9%) 1 (0.3%) 1 (0.3%) 104 (33.9%) 18 (5.9%) 177 (57.7%) 38 (12.4%) 12 (3.9%) 16 (5.2%) 7 (2.3%) |
1 MUAC =Mid-upper arm circumference, BMI= body mass index, * data were presented as mean ± standard deviation (SD), ** data were presented as median & (IQR), *** data were presented as number and percentage n (%).
Table 2.
Nutrition Status of the Patients Based on Anthropometric Measurements.
| Variables | Sample size |
|---|---|
|
Weight for height z score (WHO/CDC) * Malnutrition Absence of malnutrition |
N=155 (age <59 months) 48 (31%) 107 (69%) |
|
Weight for height z score (Saudi) * Malnutrition Absence of malnutrition |
N=155 (age <59 months) 36 (23.2%) 119 (76.8%) |
|
BMI for age z score (CDC) * Malnutrition Absence of malnutrition |
N=152 (age > 59 months) 43 (28.3%) 109 (71.7%) |
|
BMI for age z score (Saudi) * Malnutrition Absence of malnutrition |
N=152 (age > 59 months) 39 (25.7%) 113 (74.3%) |
WHO=World Health Organization, CDC= Central of Disease Control and Prevention, BMI= body mass index, * data were presented as number and percentage n (%).
Table 3.
Characteristics of each part of both Screening Tool for the Assessment of Malnutrition in Pediatrics.
Table 3.
Characteristics of each part of both Screening Tool for the Assessment of Malnutrition in Pediatrics.
| STEPs | Original STAMP | Saudi-Modified STAMP |
|---|---|---|
|
STEP 1 – DIAGNOSIS* Does the child have a diagnosis that has any nutritional implications? | ||
| Definite nutritional implications Possible nutritional implications No nutritional implications |
51 (16.6%) 27 (8.8%) 229 (74.6%) |
80 (26.1%) 72 (23.5%) 155 (50.5%) |
|
STEP 2 - NUTRITIONAL INTAKE* What is the child's nutritional intake? | ||
|
No change in eating patterns and good nutritional intake Recently decreased or poor nutritional intake No nutritional intake |
160 (52.1%) 124 (40.4%) 23 (7.5%) |
75 (24.4%) 154 (50.2%) 78 (25.4%) |
|
STEP 3 - WEIGHT AND HEIGHT* Using the centile quick reference tables to determine the child's measurements | ||
| 0 to 1 centile spaces/columns apart > 2 centile spaces/= 2 columns apart > 3 centile spaces/≥3 columns apart (or weight < 2nd centile) |
175 (57%) 93 (30.3%) 39 (12.7%) |
94 (30.6%) 85 (27.7%) 128 (41.7%) |
|
STEP 4 - OVERALL RISK OF MALNUTRITION* Add the scores from steps 1–3 together to calculate the child's overall risk of malnutrition. | ||
| High risk Medium risk Low risk |
72 (23.5%) 121 (39.4%) 114 (37.1%) |
189 (61.5%) 92 (30%) 26 (8.5%) |
| Nutritional status* | ||
| At high risk At low risk |
193 (62.9%) 114 (37.1%) |
281 (91.6%) 26 (8.5%) |
STAMP= Screening Tool for the Assessment of Malnutrition in Paediatrics * data were presented as number and percentage n (%).
Table 4-A.
Anthropometric characteristics of hospitalized children according to Saudi-modified Screening Tool for the Assessment of Malnutrition in Pediatrics.
Table 4-A.
Anthropometric characteristics of hospitalized children according to Saudi-modified Screening Tool for the Assessment of Malnutrition in Pediatrics.
| Overall Saudi Modified STAMP Score (n=307) | p-value | ||||
|---|---|---|---|---|---|
| Anthropometric Measurements | Nutritional Status | All | At low risk | At high risk | |
| Saudi weight for height z scores (n=155) ** | Malnutrition Absence of malnutrition |
36 (23.2%) 119 (76.8%) |
2 (18.2%) 9 (81.8%) |
34 (23.6%) 110 (76.4%) |
1a |
| Saudi BMI for age z scores (n=152) ** | Malnutrition Absence of malnutrition |
39 (25.7%) 113 (74.3%) |
13 (86.7%) 1 (9.1%) |
37 (27%) 100 (73%) |
0356a |
| WHO and CDC weight for height z scores (n=155) ** | Malnutrition Absence of malnutrition |
48 (31%) 107 (69%) |
10 (90.9%) 2 (13.3%) |
47 (32.6%) 97 (67.4%) |
0.174 a |
| CDC BMI for age z scores (n=152) ** |
Malnutrition Absence of malnutrition |
43 (28.3%) 109 (71.7%) |
2 (13.3%) 13 (86.7%) |
41 (29.9%) 96 (70.1%) |
0.235 a |
| MUAC (n=307) * | 153.37 ± 40.69 |
157.15 ± 35.61 |
153.02 + 41.16 |
0.621 b |
|
STAMP= Screening Tool for the Assessment of Malnutrition in Paediatrics WHO= world health organization, CDC= Central of disease and control, MUAC =Mid-upper arm circumference, BMI= body mass index *data were presented as mean ± standard deviation (SD), data were presented as number and percentage n (%), a- Fisher's Exact Test, b-independent t-test. P-value ≤ 0.05 is considered statistically significant.
Table 4-B.
Anthropometric characteristics of hospitalized children according to original Screening Tool for the Assessment of Malnutrition in Pediatrics.
Table 4-B.
Anthropometric characteristics of hospitalized children according to original Screening Tool for the Assessment of Malnutrition in Pediatrics.
| Overall Saudi-Modified STAMP Score (n=307) | p-value | ||||
|---|---|---|---|---|---|
| Anthropometric Measurements | Nutritional Status | All | At low risk | At high risk | |
| Saudi weight for height z scores (n=155) ** | Malnutrition Absence of malnutrition |
36 (23.2%) 119 (76.8%) |
12 (18.8%) 52 (81.3%) |
24 (26.4%) 67 (73.6%) |
0.268a |
| Saudi BMI for age z scores (n=152) ** | Malnutrition Absence of malnutrition |
39 (25.7%) 113 (74.3%) |
10 (20%) 40 (80%) |
29 (28.4%) 73 (71.6%) |
0.263 a |
| WHO and CDC weight for height z scores (n=155) ** | Malnutrition Absence of malnutrition |
48 (31%) 107 (69%) |
16 (24.6%) 49 (75.4%) |
32 (35.6%) 58 (64.4%) |
0.146 a |
| CDC BMI for age z scores (n=152) ** |
Malnutrition Absence of malnutrition |
43 (28.3%) 109 (71.7%) |
13 (26.5%) 36 (73.5%) |
30 (29.1%) 73 (70.9%) |
0.740 a |
| MUAC (n=307) * | 153.37 ± 40.69 |
153.51 ± 42.58 | 153.27 ± 39.64 | 0.961 b |
|
STAMP= Screening Tool for the Assessment of Malnutrition in Paediatrics WHO= world health organization, CDC= Central of Disease and Control, MUAC =Mid-upper arm circumference, BMI= body mass index *data were presented as mean ± standard deviation (SD), **data were presented as number and percentage n (%), a- Chi-square test, b-independent t-test. P-value ≤ 0.05 is considered statistically significant.
Table 5.
Prevalence of Malnutrition, Validity, and Agreements of Saudi Modified Screening Tool for the Assessment of Malnutrition in Pediatrics using Original Screening Tool for the Assessment of Malnutrition in Pediatrics.
Table 5.
Prevalence of Malnutrition, Validity, and Agreements of Saudi Modified Screening Tool for the Assessment of Malnutrition in Pediatrics using Original Screening Tool for the Assessment of Malnutrition in Pediatrics.
| Statistical Parameters of Concurrent Validity | Diagnosis | Nutritional Intake | Anthropometrics | Overall nutritional status |
|---|---|---|---|---|
| Sensitivity Specificity Positive Predictive Value Negative Predictive Value Kappa AUC (CI 95%) Prevalence |
94.8% 65.7% 48% 97.4% 0.457,p=0.001 0.856(0.810-0.902), p=0.001 25.1% |
82.3% 30.6% 52.2% 65.3% 0.126,p=0.008 0.576(0.512-0.640), p=0.021 47.9% |
75.8% 36% 47.2% 66..3% 0.109, p=0.027 0.595 (0.531-0.659), p=0.04 43% |
94.3% 13.2% 64.8% 57.7% 0.089, p=0.023 0.654 (0.592-0.715), p=0.001 62.9% |
STAMP= Screening Tool for the Assessment of Malnutrition in Paediatrics AUC = Area Under Curve, C.I.: confidence interval. P-value ≤ 0.05 is considered statistically significant.
Table 6.
Prevalence, Validity, and Agreements of Saudi Modified Screening Tool for the Assessment of Malnutrition in Pediatrics using Anthropometric Measurements as Reference Standard .
Table 6.
Prevalence, Validity, and Agreements of Saudi Modified Screening Tool for the Assessment of Malnutrition in Pediatrics using Anthropometric Measurements as Reference Standard .
| Statistical Parameters of Concurrent Validity | WHO &CDC weight for height z score | CDC BMI for age z score | Saudi weight for height z score | Saudi BMI for age z score |
|---|---|---|---|---|
| Sensitivity Specificity Positive Predictive Value Negative Predictive Value Prevalence |
97.9% 9.3% 32.6% 90.9% 31% |
95.3% 11.9% 29.9% 86.7% 28.3% |
94.4% 7.6% 23.6% 81.8% 23.2% |
94.9% 11.5% 27% 86.7% 25.7% |
STAMP= Screening Tool for the Assessment of Malnutrition in Paediatrics WHO= World Health Organization, CDC= Central of Disease Control and Prevention, BMI= body mass index, RDA= Recommended Dietary Allowances.
Table 7.
Prevalence, Validity, and Agreements of The Original Screening Tool for the Assessment of Malnutrition in Pediatrics using Anthropometric Measurements as Reference Standard .
Table 7.
Prevalence, Validity, and Agreements of The Original Screening Tool for the Assessment of Malnutrition in Pediatrics using Anthropometric Measurements as Reference Standard .
| Statistical Parameters of Concurrent Validity | WHO &CDC weight for height z score | CDC BMI for age z score | Saudi weight for height z score | Saudi BMI for age z score |
|---|---|---|---|---|
| Sensitivity Specificity Positive Predictive Value Negative Predictive Value Prevalence |
54.2% 33.3% 64.4% 24.6% 56.7% |
69.8% 33% 29% 73.5% 28.3% |
66.7% 43.7 26.4% 81.3% 23.2% |
74.4% 35.4% 28.4% 80% 25.7% |
STAMP= Screening Tool for the Assessment of Malnutrition in Paediatrics WHO= World Health Organization, CDC= Central of Disease Control and Prevention, BMI= body mass index, RDA= Recommended Dietary Allowances.
Disclaimer/Publisher’s Note: The statements, opinions and data contained in all publications are solely those of the individual author(s) and contributor(s) and not of MDPI and/or the editor(s). MDPI and/or the editor(s) disclaim responsibility for any injury to people or property resulting from any ideas, methods, instructions or products referred to in the content. |
© 2024 by the authors. Licensee MDPI, Basel, Switzerland. This article is an open access article distributed under the terms and conditions of the Creative Commons Attribution (CC BY) license (http://creativecommons.org/licenses/by/4.0/).
Copyright: This open access article is published under a Creative Commons CC BY 4.0 license, which permit the free download, distribution, and reuse, provided that the author and preprint are cited in any reuse.


