Preprint
Article

This version is not peer-reviewed.

Early Malnutrition Risk Detection for Quality Patient Care: An Analysis of Nutrition Risk Screening Tools in Kenyan Referral Hospitals

A peer-reviewed article of this preprint also exists.

Submitted:

23 October 2025

Posted:

27 October 2025

You are already at the latest version

Abstract

Systematic reviews and original research articles should have a structured abstract of Background & objectives: Malnutrition is a prevalent condition linked to increased morbidity and mortality among hospitalized adult patients. This study assessed the effectiveness of three Nutrition Risk Screening (NRS) tools i.e. NRS-2002, Malnutrition Universal Screening Tool (MUST), and Malnutrition Screening Tool (MST) across Kenyatta National Hospital, Moi Teaching and Referral Hospital, and Kisii National Teaching and Referral Hospital in Kenya. Materials and Methods: A cross-sectional analytical design involved 420 adult inpatients screened within 24 hours of admission, using body mass index (BMI) as the reference standard. Results: Among hospitalized adults in three Kenyan referral hospitals, participants were predominantly middle-aged (median = 35.5 years). The NRS-2002 identified the highest malnutrition risk prevalence (85.7%), followed by MST (71.7%) and MUST (51.0%), whereas BMI classified only 23.8% as at risk. Both NRS-2002 and MUST showed perfect sensitivity (1.000) but MUST demonstrated higher specificity (0.65) and superior diagnostic accuracy (AUC = 0.82). Agreement with BMI was low across all tools, though MUST showed the best overall consistency and balance between sensitivity and specificity. Conclusion: The study revealed significant variation in malnutrition risk detection across NRS tools. While NRS-2002 was highly sensitive, it tended to overestimate risk. The MUST demonstrated the best overall balance of sensitivity, specificity, and diagnostic accuracy. Adoption of the MUST as the standard screening tool in Kenyan referral hospitals is recommended to enhance early malnutrition detection and improve patient care outcomes.

Keywords: 
;  ;  

1. Introduction

The introduction should briefly place the study in a broad context and highlight why it is Malnutrition is among the most prevalent comorbidities in hospitalized patients, affecting 20–50% of this population globally [1,2,3,4,5,6,7] It is frequently associated with adverse clinical outcomes, including prolonged length of stay (LOS), poorer discharge status, and diminished quality of life [8,9,10] Malnutrition constitutes an independent risk factor for morbidity and mortality, imposes substantial burdens on healthcare systems, and has been shown to extend hospitalization duration in clinical care settings [8,9,12,13]. At least one-third of patients are malnourished upon admission; if untreated, approximately two-thirds of these patients experience further deterioration in nutritional status during hospitalization [14,15] Hospitalization costs increased by over 60% among patients with malnutrition, primarily due to extended LOS and expenses related to managing nutrition-related and medical complications [16,17]. Patients with malnutrition have a threefold greater risk of surgical site infection than well-nourished patients and are more likely to be readmitted within 15 days post-discharge [19,20,21]. A study by Prof. Renée Blaauw examining hospital malnutrition in the African continent, comparing South Africa, Kenya, and Ghana, demonstrated that malnutrition is highly prevalent and poses a serious threat to morbidity and mortality, contributing to prolonged hospitalization [22] Similar patterns have been reported in Turkey [23].
Despite the high prevalence of malnutrition among patients prior to admission, the condition is frequently neglected, undiagnosed, and untreated, earning the designation “the skeleton in the hospital closet” [24,25,26,27,28]. Low-cost strategies for identifying at-risk patients through validated Nutrition Risk Screening (NRS) tools and delivering adequate nutrition support hold significant potential to improve outcomes and reduce healthcare expenditures [29,30,31,32]. However, although multiple validated NRS tools exist, no consensus has been established regarding the most effective tool for identifying hospitalized patients at risk of malnutrition [33,34]. The application of these screening instruments has not been specifically evaluated in Kenyan healthcare facilities, a context characterized by high mortality rates among hospitalized patients [33]. There remains a paucity of data on NRS practices in East Africa, including Kenya, where most research has focused on nutritional status assessment without addressing NRS. The present study identified discrepancies among three NRS tools i.e. Nutrition Risk Screening Tool–2002 (NRS–2002), Malnutrition Universal Screening Tool (MUST), and Malnutrition Screening Tool (MST), in detecting patients who were malnourished or at risk of malnutrition.

2. Materials and Methods

2.1. Study Design and Variables

This hospital-based, cross-sectional analytical study assessed nutritional risk among adult inpatients in three Kenyan National Referral Hospitals. Data were collected using three validated NRS tools: the NRS–2002, MUST, and MST. Independent variables representing malnutrition risk factors included recent unintentional weight loss, reduced food intake or appetite, and the presence of an acute disease condition. Dependent variables comprised the proportions of cases classified as at risk of malnutrition or normal according to each tool. Diagnostic performance was evaluated by calculating sensitivity, specificity, and receiver operating characteristic (ROC) curves. The European Society for Parenteral and Enteral Nutrition (ESPEN) diagnostic criterion for malnutrition, defined as body mass index (BMI) <18.5, served as the reference standard [35].

2.2. Study Location and Target Population

The study was conducted in the medical and surgical wards of Kenyatta National Hospital (KNH), Moi Teaching and Referral Hospital (MTRH), and Kisii Teaching and Referral Hospital (KTRH). These public facilities provide specialized medical services nationwide, receive referrals from all regions, and function as research and training centres for healthcare professionals. The study population comprised adult patients aged 18–64 years who were admitted to the medical and surgical wards within 24 hours of hospitalization.

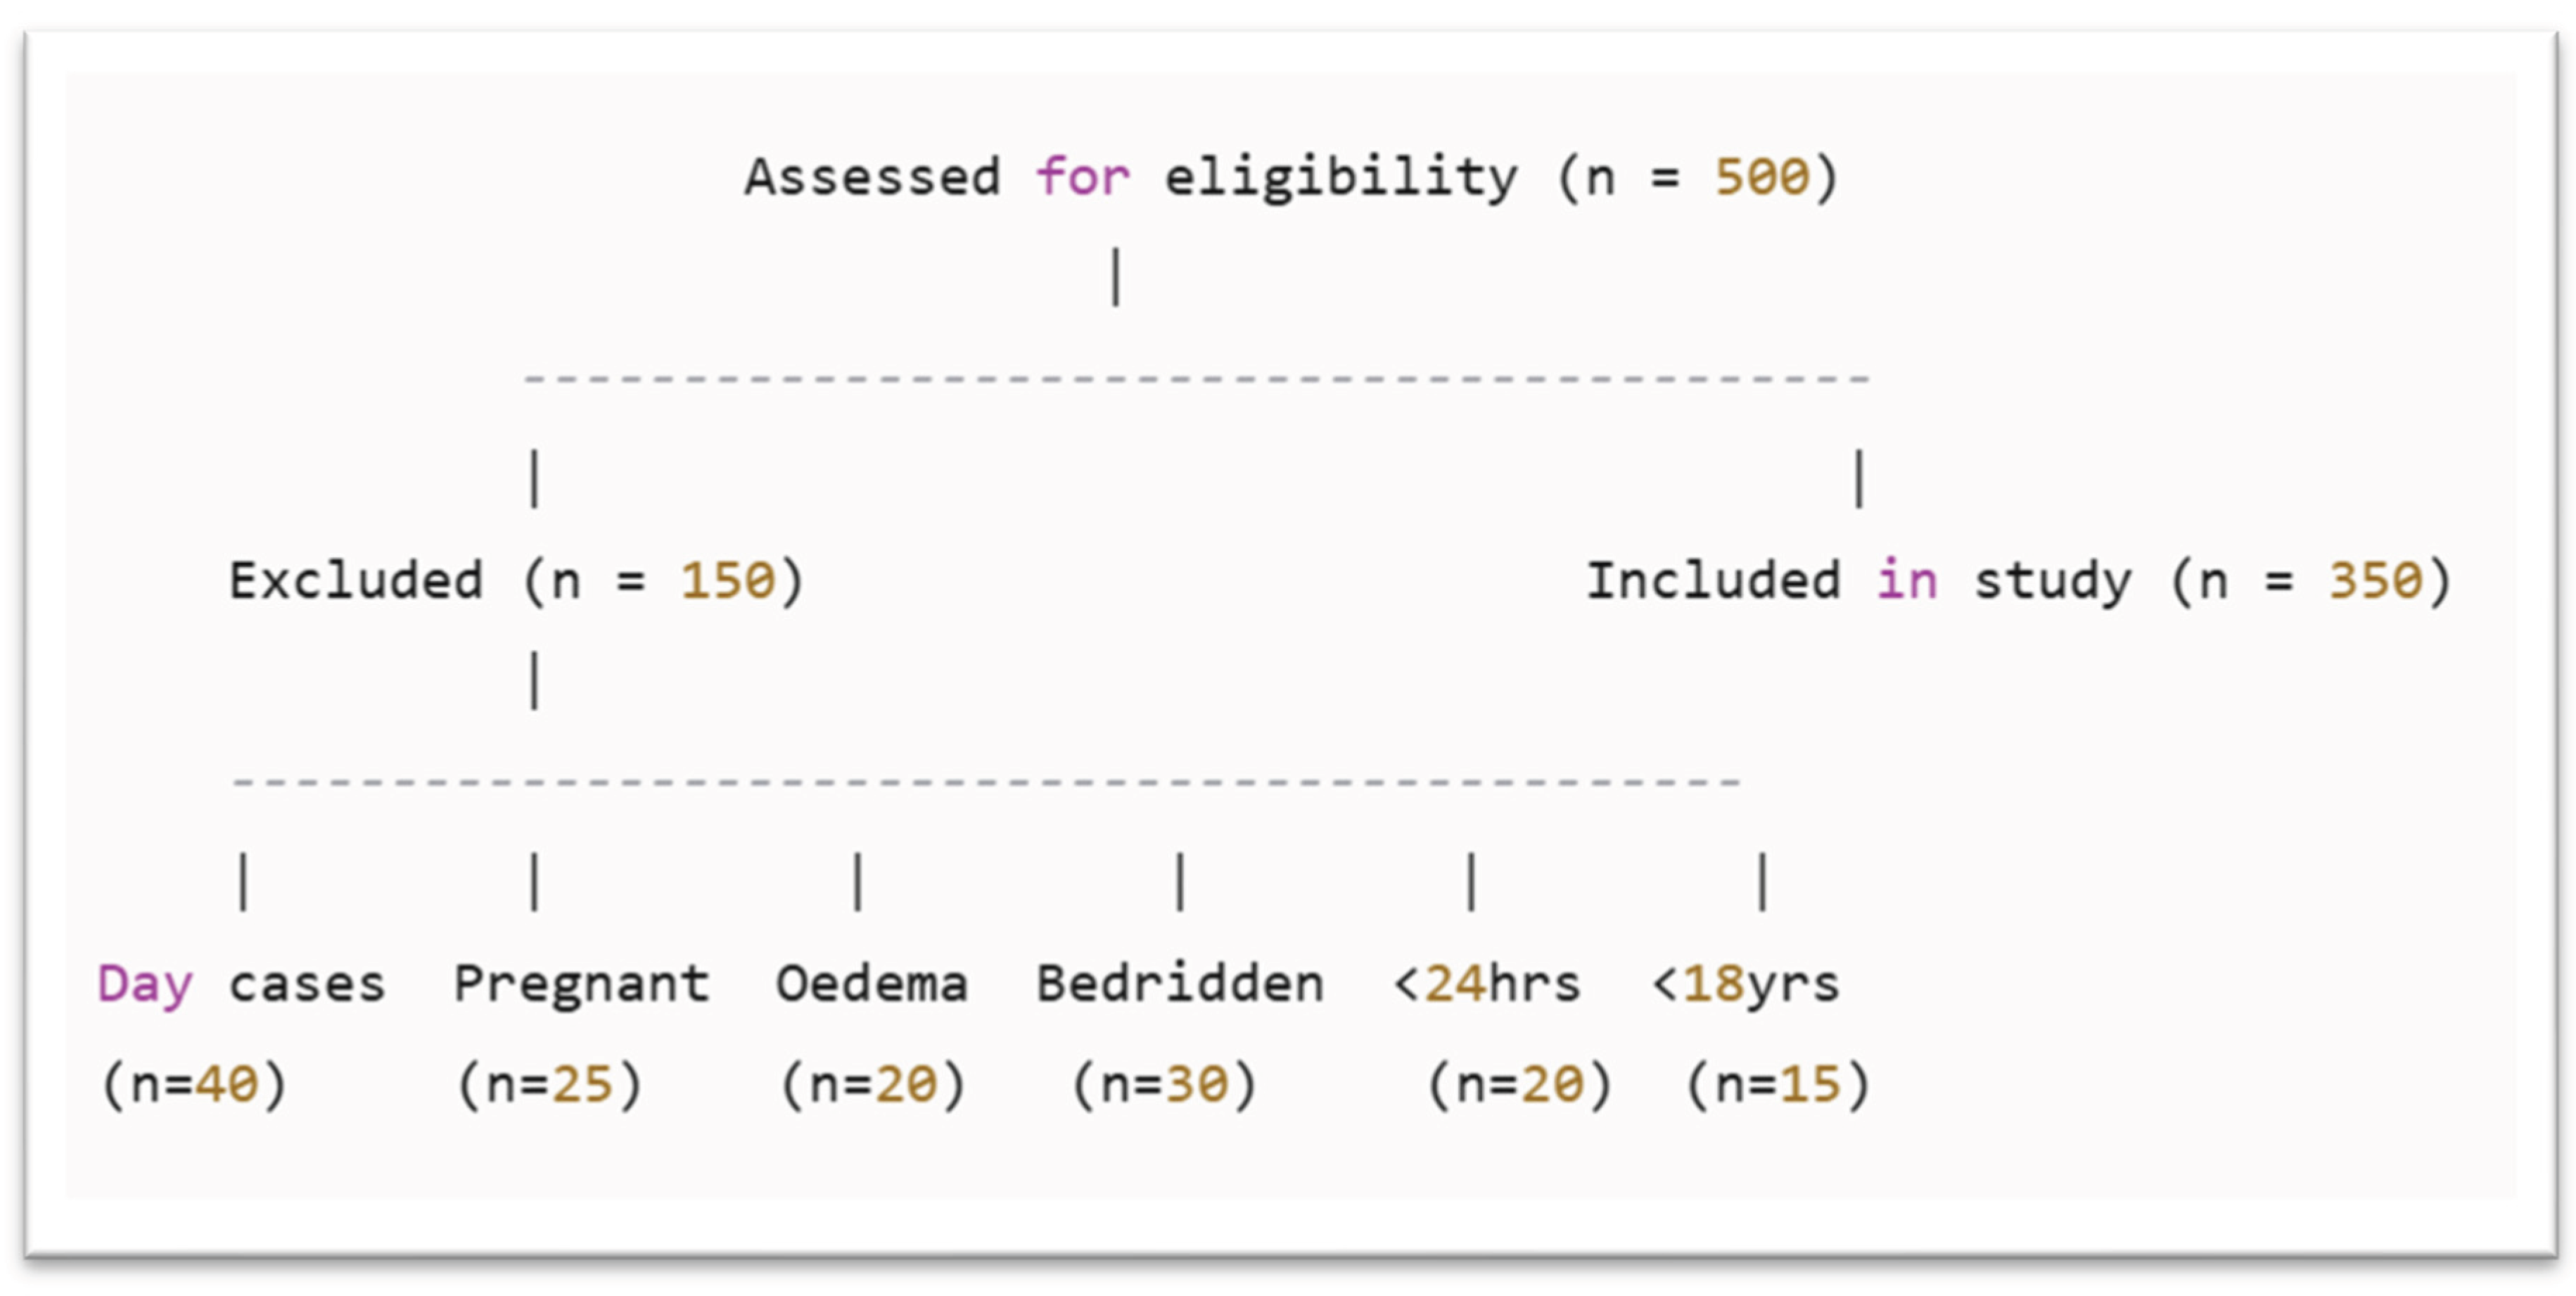
2.3. Exclusion Criteria

Patients admitted for day cases, pregnant or breastfeeding females, individuals with moderate to severe edema, and bedridden patients were excluded to preserve the accuracy and validity of NRS. Patients hospitalized for <24 hours were excluded because comprehensive clinical assessments are not conducted during brief admissions, and detailed nutritional screening is not feasible within such encounters. Females who were pregnant or breastfeeding were excluded due to physiological changes, including fluid retention, altered body composition, and weight gain related to pregnancy and lactation. These factors compromise the accuracy of anthropometric measurements and reduce the reliability of standard adult screening tools. Bedridden patients were excluded because measuring body weight and height accurately is often impractical. Additionally, prolonged immobility and pre-existing conditions, such as muscle wasting or fluid retention, may alter body composition and limit BMI validity. Patients with moderate to severe oedema experience fluid accumulation, artificially increasing body weight and potentially leading to underestimation of malnutrition risk when BMI is used. Individuals aged <18 years were excluded, as paediatric patients require age-specific and developmentally appropriate nutritional screening instruments.
A total of 150 patients were excluded based on predefined criteria. Specifically, 40 patients were excluded due to being day case admissions, as they did not meet the minimum 24-hour hospital stay required for comprehensive clinical and nutritional screening for further assessment. The excluded were as follows:
  • Twenty-five women who were pregnant or breastfeeding were excluded.
  • Twenty patients with moderate to severe oedema were excluded.
  • Thirty bedridden patients
  • Twenty patients were excluded because their hospital stay was less than 24 hours
  • Fifteen individuals under the age of 18 were excluded, as the study focused solely on adult patients and required the use of age-appropriate nutritional assessment tools.
A total of 500 patients were assessed for eligibility (Figure 3).

2.4. Sample Size

Sample size was determined using the formula for a single population proportion [36], with a 95% confidence interval and 5% precision. A prevalence of malnutrition risk of 50% (0.5) was assumed to yield the maximum sample size, given the lack of prior studies in this context. An additional 5% was added to account for nonresponse. Finite population correction was applied to produce a sample proportional to the target population.
n   =   Z 2 P ( 1 P ) e 2 ; where
  • N: Desired sample size
  • e: Desired margin of error/desired precision (0.05)
  • Z: Standard normal deviate at 95% confidence level (1.96)
  • p: The prevalence of hospital malnutrition/nutritional risk in the target population was assumed to (0.5).
There was no previous national study with a hospital malnutrition rate comparable to that of the study.
= ( 1.96 ) 2 × 0.5 ( 1 0.5 ) ( 0.05 ) 2
= 385 patients
A 5% nonresponse rate was incorporated into the final sample size, resulting in 420 patients equally allocated across three hospitals. Each facility enrolled 140 patients as follows: KNH (80 males, 60 females), MTRH (60 males, 80 females), and KTRH (96 males, 44 females).

2.5. Sampling Techniques

The three public National Referral and Teaching Hospitals were purposively selected as they were the only gazetted level 6 public teaching and referral hospitals in Kenya, excluding the National Spinal Injury Referral Hospital, which was omitted due to its specialization in spinal injury cases. In each hospital, stratified random sampling was used to select males and females from the medical and surgical wards. Subsequently, patients were chosen through simple random sampling using a Table of Random Numbers from the list of patients admitted in the preceding 24 hours. Patients who provided consent were enrolled and screened within 24 hours of admission. This process continued daily until the required sample size was reached.

2.6. Study Instruments and Data Collection

All participants were screened within 24 hours of admission using the following NRS tools: NRS-2002, MUST, and MST. Relevant variables from each tool were recorded. Anthropometric data, including weight and height, were measured following standard procedures. Weight was recorded to the nearest 100 g using Seca 763 scales, and height was measured to the nearest 1 mm using a stadiometer. BMI was calculated using the formula BMI = kg/m2. BMI served as the reference standard for evaluating the performance of the screening tools, based on the ESPEN diagnostic criteria [35].

2.7. Reference Standard for the Study

The study adopted BMI as the reference standard, applying the ESPEN diagnostic criterion for malnutrition, defined as BMI < 18.5 kg/m². This method aligns with several previous studies that utilized the same standard [5,35,37,38,39].

2.8. Data Quality Assurance

Research assistants were selected from qualified nurses and nutritionists/dietitians and underwent a 3-day intensive training covering objectives, procedures, and interviewing techniques. All NRS tools used had been previously validated. To ensure accuracy in anthropometric measurements, data quality checks were conducted, including digit preference score analysis for weight and height to detect rounding errors.

2.9. Data Analysis

Data were initially organized in Excel and later imported into SPSS version 22 and STATA for analysis. The diagnostic performance of NRS-2002, MUST, and MST in identifying malnutrition risk among adult inpatients was assessed. Evaluation metrics included sensitivity (proportion of malnourished individuals correctly identified), specificity (proportion of well-nourished individuals correctly identified), positive predictive value (PPV: proportion of patients with a positive screening result who were malnourished), and negative predictive value (NPV: proportion of patients with a negative screening result who were truly well-nourished) [12,29,40,41,42]– interpretation of the scores is illustrated in Table 1. Inter-rater reliability was measured using Cohen’s kappa statistics, which evaluates agreement between raters using BMI as the reference standard. ROC curves were used to assess tool performance. The area under the curve (AUC) was interpreted as follows:
1)
0.90 ≤ AUC ≤ 1.00: Excellent performance
2)
0.80 ≤ AUC < 0.90: Good performance
3)
0.70 ≤ AUC < 0.80: Fair performance
4)
0.60 ≤ AUC < 0.70: Poor performance
5)
0.50 ≤ AUC < 0.60: Failure
The ESPEN diagnostic criterion (BMI < 18.5) was used in previous studies [35]. Statistical significance was determined at α = 0.05, with p-values < 0.05 considered statistically significant (95% confidence intervals [CIs]).

Ethical Considerations

Approval to conduct the research was granted by the Kenyatta University Graduate School ref. no. H87/37116/2017. This research was approved by the National Commission for Science, Technology, and Innovation (NACOSTI). no. NACOSTI/P/21/10259. Ethical approval was issued by Kenyatta University Ethical Review Committee (KUERC) vide approval. no. PKU/2187/I1331, and Kenyatta National Hospital-University of Nairobi (KNH-UON) Ethical Research Committee Research proposal vide ref. no. P547/07/2021, and the Moi Teaching Referral Hospital (MTRH) Institutional Research Ethics Committee (IREC) approval vide Ref. no. 0004112. The authority to conduct the research was in accordance with the respective ERC committees of KNH-UON (P547/07/2021), MTRH (ELD/MTRH/R&P/10/2/V.2/2010), and Kisii Teaching & Referral Hospital (KTRH) (ISERC/KTRH/002/22).

3. Results

3.1. Characteristics of the Study Participants

The study population was generally middle-aged. The 25th percentile for age was 24 years, the median (50th percentile) was 35.5 years, and the 95th percentile was 65 years, indicating that most participants were between 18 and 40 years (Figure 1). At KTRH, participants were older (median age: 45.5 years) compared to the overall population. In contrast, KNH and MTRH had younger distributions (median: 35.5 years), with similar upper age limits (95th percentile: 65 years). Overall, the three hospitals exhibited comparable demographic patterns, with a predominance of younger and middle-aged adults.

3.2. Prevalence of Hospital Malnutrition Risk

Malnutrition risk was assessed using the NRS-2002, MUST, and MST tools, in addition to BMI classification (Table 2a).
  • NRS-2002 identified the highest prevalence of malnutrition risk (85.7%),
  • MST indicated 71.7%,
  • MUST identified 51.0%,
  • While BMI classified only 23.8% as at risk.
Across hospitals, NRS-2002 consistently detected the highest prevalence (85–86%), followed by MST (61–83%), and MUST (49–54%). BMI consistently reported the lowest rates (22–30%).Pairwise comparisons using McNemar’s test revealed statistically significant differences between tools (p < 0.0001), confirming variability in risk detection accuracy (Table 2b).

3.3. Evaluation of the Effectiveness of Nutritional Screening Tools

The diagnostic performance of the three tools was assessed using sensitivity, specificity, PPV, NPV, and ROC curves (Table 3).
  • Sensitivity: NRS-2002 and MUST both achieved perfect sensitivity (1.000), while MST showed slightly lower sensitivity (0.8725).
  • Specificity: NRS-2002 had the lowest (0.1886), MST moderate (0.3333), and MUST the highest (0.6478).
  • Predictive Values: Both NRS-2002 and MUST had perfect NPV (1.000), while MUST recorded the highest PPV (0.4766).
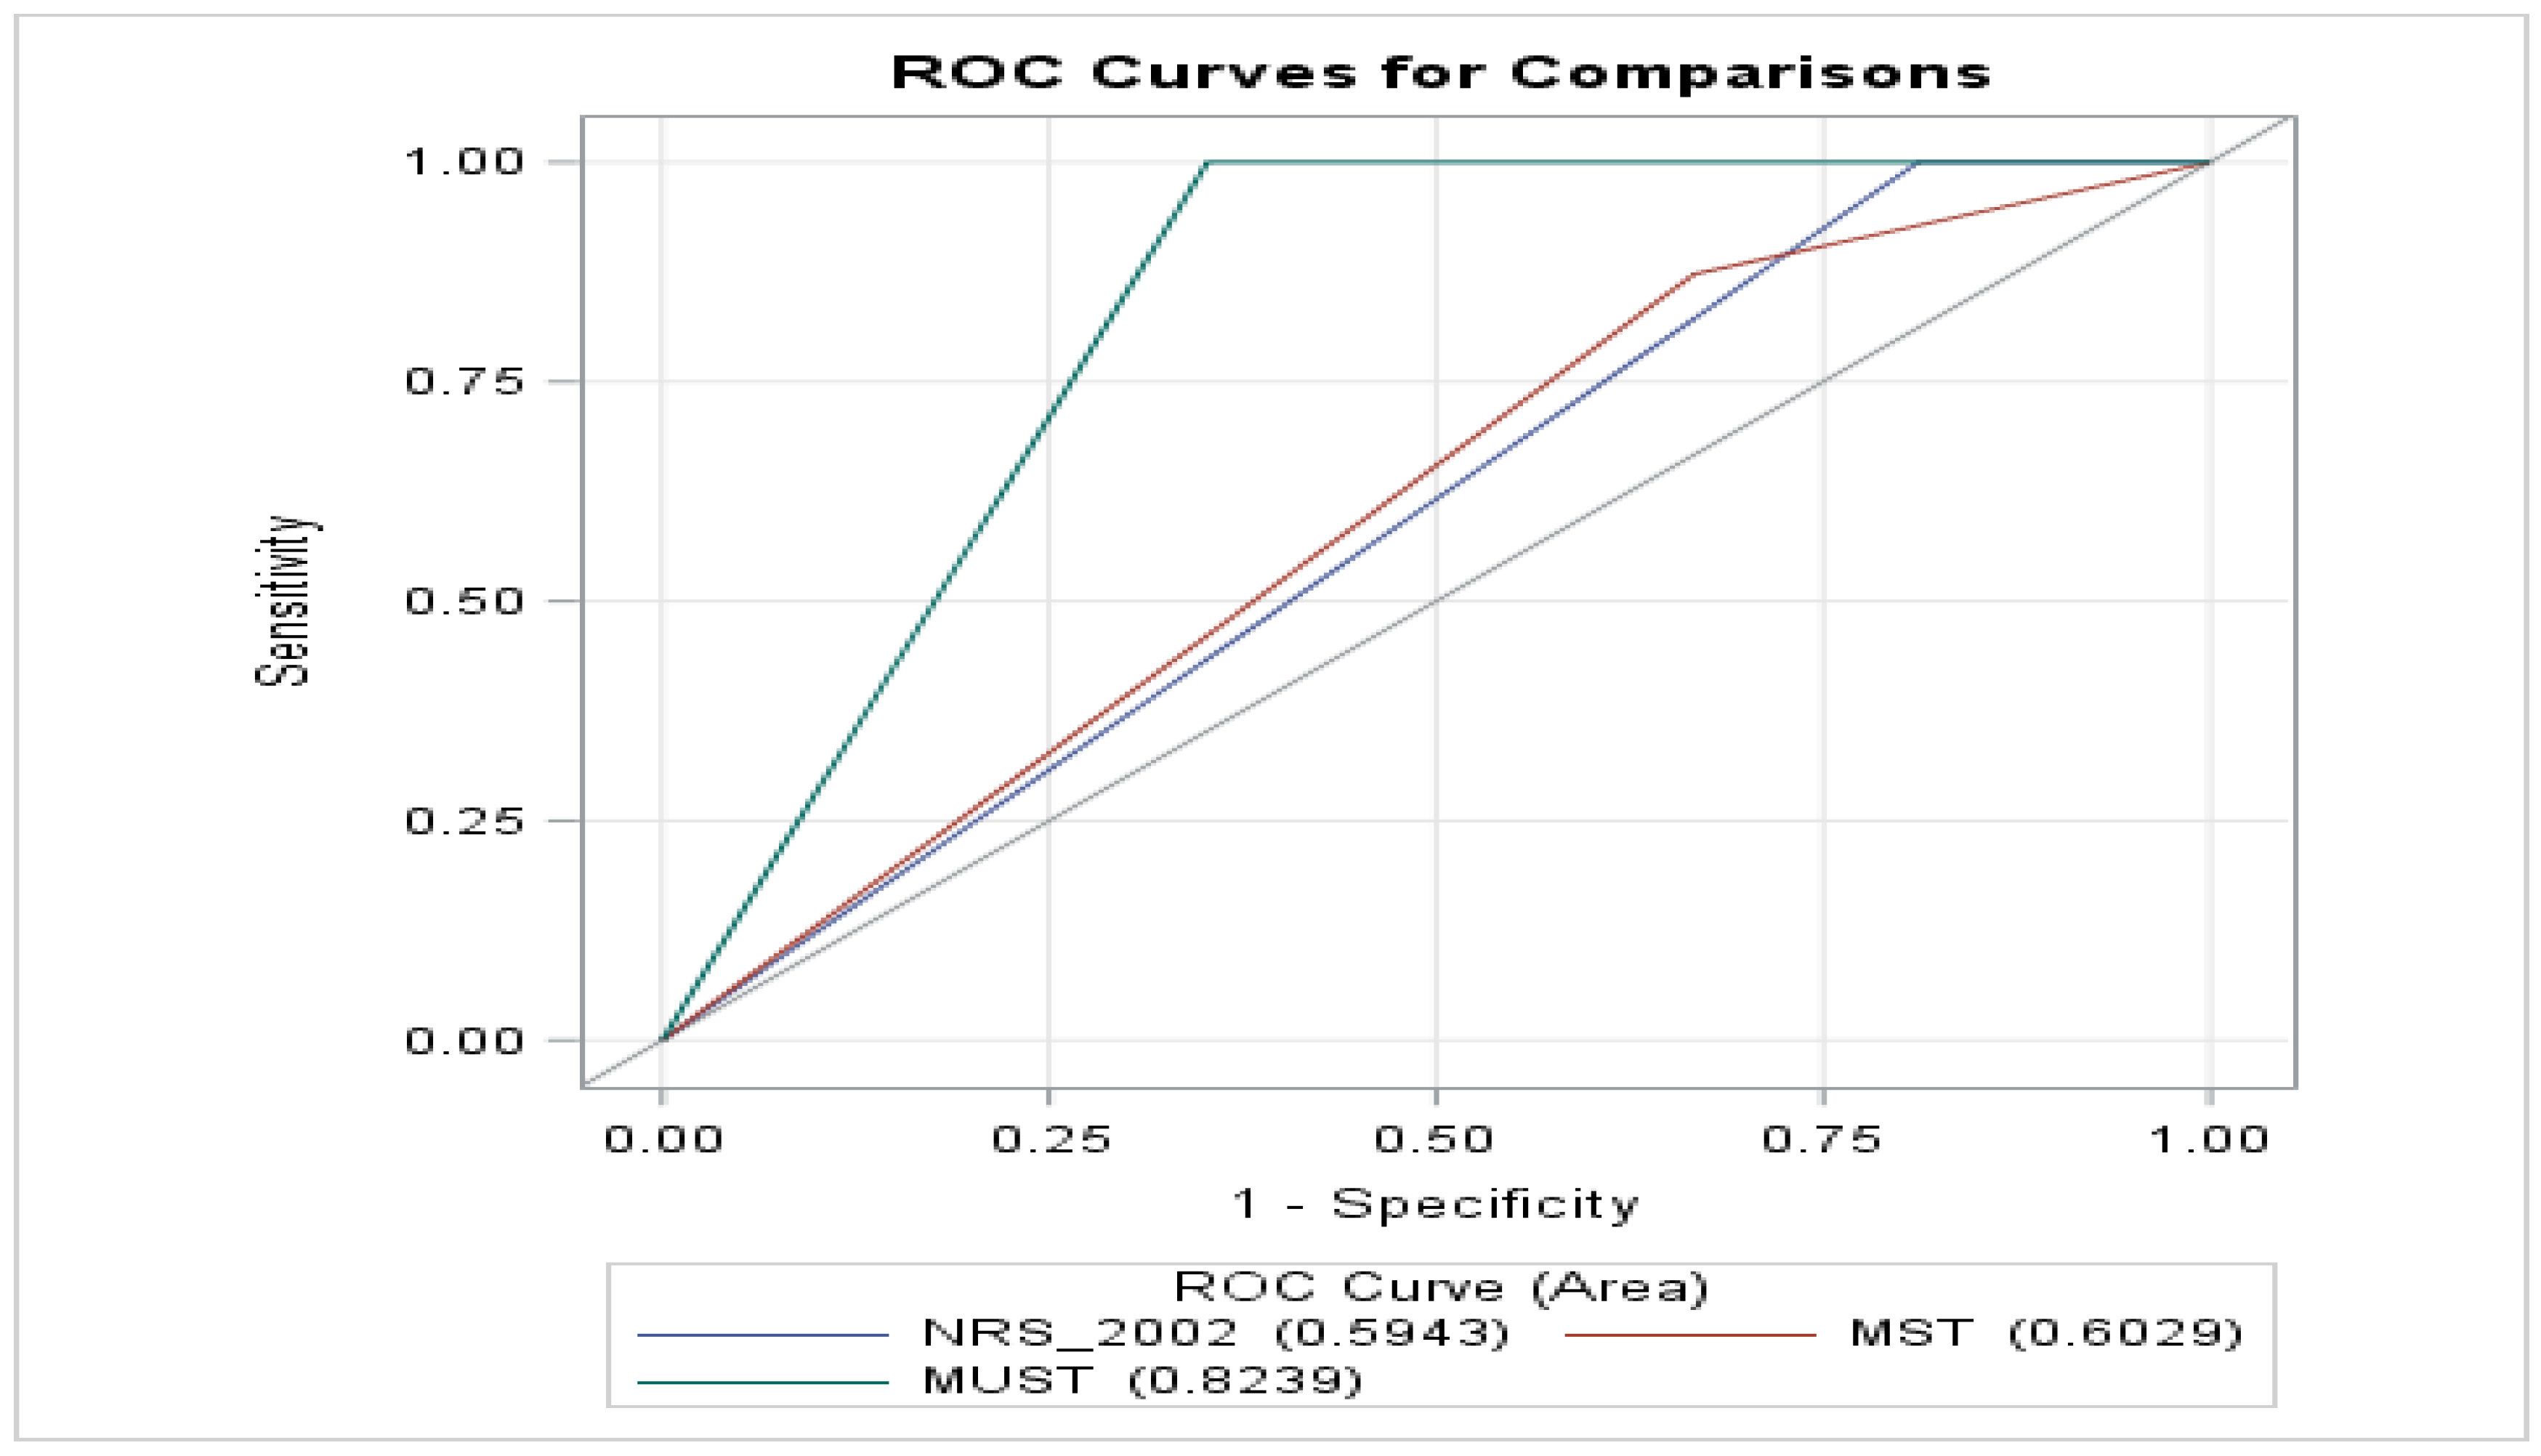
  • ROC Analysis: MUST achieved the largest AUC (0.8239), indicating superior discriminative ability. MST (0.6029) and NRS-2002 (0.5943) performed comparatively lower (Figure 2).
Overall, MUST demonstrated the best balance between sensitivity, specificity, and predictive accuracy.

3.4. ROC Contrast Estimation – Comparison of NRS-2002, MUST, and MST

ROC contrast estimation confirmed that MUST outperformed both NRS-2002 and MST in diagnosing malnutrition risk.
  • No significant difference was found between NRS-2002 and MST (p = 0.6996).
  • MUST vs. NRS-2002: positive contrast estimate (0.2296), indicating better diagnostic accuracy.
  • MUST vs. MST: positive estimate (0.2210, p < 0.05), showing significantly superior performance.These results further confirmed MUST’s higher AUC (0.8239) compared to MST (0.6029) and NRS-2002 (0.5943), reflecting its superior diagnostic capacity (Figure 2).
Figure 2. Receiver operating Characteristics Curves.
Preprints 182077 g002
Figure 3. Flowchart of Participant Selection and Exclusion Criteria.
Preprints 182077 g003

3.5. Agreement between NRS Tools and BMI

Kappa statistics showed poor agreement between the screening tools and BMI classification (Table 4 and Table 5).
  • NRS-2002: κ = 0.2115 (p = 0.001)
  • MUST: κ = 0.2539 (p < 0.0001)
  • MST: κ = 0.1254 (p < 0.001)
Similarly, inter-tool agreement was low to slight:
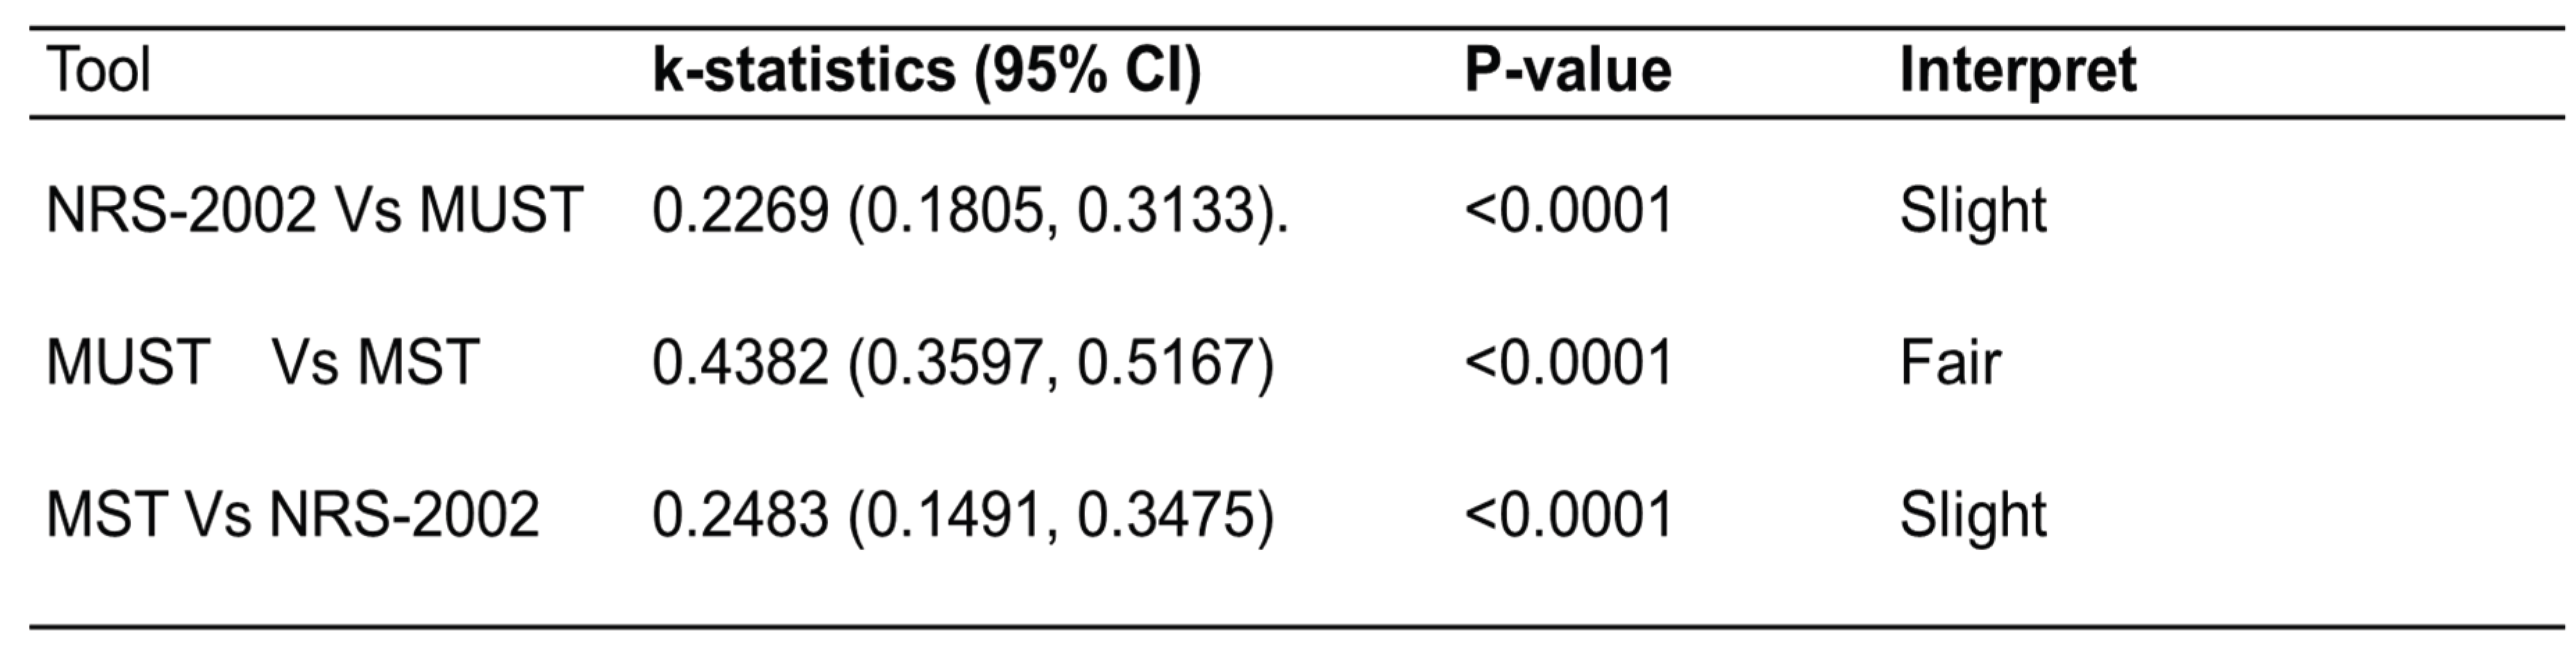
  • NRS-2002 vs. MUST: κ = 0.2269
  • MUST vs. MST: κ = 0.2483
  • MST vs. NRS-2002: κ = 0.2269
These findings indicate limited consistency among tools and between the screening instruments and BMI, reinforcing the need for tool selection suited to specific clinical contexts.

4. Discussion

This study revealed substantial disparities in the prevalence of malnutrition risk as assessed by three NRS tools. The reference criterion, (BMI), identified malnutrition in the smallest proportion of participants (23.8%). In contrast, the NRS-2002, MUST, and MST detected malnutrition risk in 85.7%, 51%, and 71.7% of participants, respectively. The BMI reference standard demonstrated the lowest prevalence and posed the least risk of overestimation. These findings indicate notable variability in the tools’ performance. Moreover, the prevalence of malnutrition varies across tools, populations, and clinical settings [23,45].
NRS-2002 identified the highest malnutrition risk, whereas BMI revealed the lowest. Similar studies have reported high nutritional risk in diverse populations using different screening tools (35, 46-49]. Conversely, other research has described lower prevalence rates, underscoring the inconsistency of tool performance across demographic groups and care settings [50]. NRS-2002 has been shown to frequently overestimate malnutrition risk among hospitalized patients [51,52]. Despite similarities between NRS-2002 and MUST, their differing evaluation criteria likely explain the variation in prevalence, as observed in prior studies [53]. Although praised for its sensitivity, the NRS-2002’s tendency to overestimate risk can result in unnecessary nutritional interventions, straining hospital resources and affecting patient care. Conversely, the BMI reference standard may fail to identify many patients at risk, potentially delaying intervention and leading to underestimation of malnutrition.
The absence of consensus on an ideal NRS tool remains a barrier to standardized nutritional care. The ESPEN strongly recommends NRS-2002 based on its content validity, strength, and capacity to accurately diagnose and predict nutritional risk [7,54]. Despite concerns about overestimation, ESPEN endorses the NRS-2002; however, its application across diverse clinical environments remains contentious. The lack of a universally accepted screening tool is further reflected in inconsistent findings across studies. Some research reports high nutritional risk prevalence with various NRS tools [46,47,48,49]. This discrepancy likely arises from differences in population characteristics, clinical contexts, and tool-specific criteria. For example, MUST and MST demonstrated differing prevalence rates, highlighting their distinct methodologies and evaluation standards [55].
Among the three tools, MUST exhibited the best overall performance, with high sensitivity, specificity, NPV, and the largest AUC. Although NRS-2002 achieved perfect sensitivity and NPV, it had low specificity and PPV, contributing to a higher rate of false positives. While widely implemented, NRS-2002 has been criticized for poor specificity [18,56]. MST demonstrated moderate sensitivity but had limitations in specificity and predictive accuracy. These findings suggest that although all three tools can identify malnutrition risk, their reliability varies, with MUST demonstrating the most balanced and effective performance in this analysis.
This study found that NRS-2002 and MUST showed slight agreement, indicating limited consistency in patient classification. In contrast, MUST exhibited fair agreement, suggesting better reliability compared to the other tools. Agreement between MUST and MST, and between MST and NRS-2002, remained slight, demonstrating limited concordance among these pairs. The fair agreement with MUST underscores its potential as a more dependable screening instrument. This inconsistency aligns with prior research [52,56]. Notably, the agreement between NRS-2002 and MUST in the present study corresponds to findings by Bellanti et al. [57]. In contrast, other investigations, including Neelemaat et al. [34], have reported higher specificity and sensitivity, possibly due to employing different reference standards. Misclassification remains a concern with NRS tools; earlier studies documented misclassification rates of 38% for NRS-2002 and 18% for MUST [17,18]. Overall, MUST demonstrated superior diagnostic accuracy in identifying patients at nutritional risk compared with NRS-2002 and MST. All three tools exhibited high NPVs, effectively identifying patients not at risk of malnutrition. However, low PPVs indicated their limitations in correctly classifying patients who were malnourished or at risk.
The agreement between the nutritional screening tools and BMI was evaluated using Cohen's κ coefficient. NRS-2002 and MST demonstrated fair agreement with BMI, whereas MST exhibited no intra-researcher agreement. Significant statistical differences were identified between the tools and BMI (p<0.05). Agreement strength was fair between MST and NRS-2002 and between NRS-2002 and MUST, while it was moderate between MUST and MST. The AUC analysis for predicting malnutrition risk revealed no significant difference between NRS-2002 and MST (P=0.1489) but significant differences between NRS-2002 vs. MUST vs. MST (p<0.05). These findings align with previous studies indicating a lack of consensus on the optimal NRS tool [23,45,58,59,60]. Bellanti et al. [57] reported that MUST and NRS-2002 exhibit higher specificity, especially in older adults.
ROC analysis showed that MUST achieved the best performance, with good AUC values compared to MST and NRS-2002, which demonstrated fair and poor values, respectively. Despite high NPVs (>89%), all three tools had low PPVs (<50%), consistent with findings from diverse hospital settings [55].
The study concluded that none of the three nutritional screening tools exhibited high statistical efficacy for predicting malnutrition because of limited validity. However, MUST demonstrated superior criterion validity compared to NRS-2002 and MST. Although ESPEN guidelines recommend NRS-2002 for hospital use, these results suggest that MUST may be more effective for malnutrition screening. The findings offer valuable insights for selecting appropriate tools to better identify and manage adult inpatients at risk of malnutrition. Further research is necessary to validate these findings across different populations and settings. The study’s specific focus on Kenyan national teaching and referral hospitals restricts generalizability, requiring additional research in other regions with similar contexts [59].
Despite the important contributions, this study had several limitations. First, it did not examine associations between nutritional risk and underlying disease conditions leading to hospitalization. Second, using BMI as the reference standard introduces potential bias, especially in patients with edema or fluid overload, as BMI may overestimate body fat in athletes and individuals with muscular build and underestimate it in older adults and individuals with muscle loss. Although several studies have employed BMI as a reference standard [5,35,37,38,39], these studies also indicate that BMI often shows limited accuracy and underestimates risk in specific patient groups. BMI frequently underperforms as a standalone standard for nutritional risk or malnutrition. While BMI remains a convenient assessment tool, it is increasingly evident that nutritional screening tools should be validated against more robust standards or combined with complementary measures. Finally, this study assessed only three NRS tools, excluding other validated tools due to practical constraints. The research was limited to three Kenyan national teaching and referral hospitals, and the results may not be generalizable to other populations or settings. All pairwise comparisons demonstrated significant differences in malnutrition risk prevalence across tools.

5. Conclusions

This study assessed the prevalence of malnutrition among hospitalized adult patients in three Kenyan national teaching and referral hospitals using three NRS tools: the NRS-2002, MUST, and MST. Low prevalence rates identified by BMI may underestimate malnutrition risk and consequently delay necessary interventions. Although widely accepted as a reference standard, BMI might not be an ideal benchmark for NRS, as factors such as edema, hydration status, lean body mass, and adipose tissue can influence BMI values [61,62]. The largest discrepancy was observed between the NRS-2002 and the MUST, suggesting that the MUST may fail to detect cases identified by the NRS-2002. While the NRS-2002 is the most sensitive, it is prone to overestimating malnutrition risk, which may strain hospital resources. These findings underscore the substantial variability in screening outcomes and indicate that tool selection directly affects the identification of at-risk patients. Selecting an appropriate NRS instrument suited to the clinical context and patient population is essential for accurate detection. Despite concerns regarding overestimation, the ESPEN strongly endorses the NRS-2002 [7,63]. Although simpler, the MST demonstrated limited accuracy in this setting. Variations in malnutrition prevalence across the tools may arise from their distinct methodologies, evaluation criteria, and differences in population demographics and clinical environments [43,55]. The results revealed significant differences in malnutrition risk identification. In this study, the MUST showed the most favorable overall performance, consistent with other research findings [64]. Although all tools demonstrated high sensitivity and NPV, their low specificity and limited correlation with BMI raise concerns about their ability to accurately identify malnutrition. While NRS-2002 is sensitive, it may overestimate risk, whereas the MUST provide a more balanced assessment. Considering its favorable balance of sensitivity and specificity, ease of application, and performance, MUST is recommended as the standard NRS instrument in similar hospital settings. Its adoption may facilitate timely, targeted nutritional interventions and improve patient outcomes.
The study recommends the following: (a) Adopt the MUST as the primary screening tool for adult inpatients in Kenyan referral hospitals; (b) Develop implementation guidelines and protocols tailored to Kenyan clinical settings, integrating the MUST into routine hospital admission processes; and (c) Establish national nutrition screening policies reflecting evidence-based practices while allowing flexibility for context-driven tool selection to ensure timely and accurate risk detection.
These findings highlight the importance of context-specific, evidence-based nutritional screening approaches. By adopting the MUST tool and supporting its integration into clinical workflows, healthcare systems in Kenya can strengthen nutritional care. The significant disparities among instruments underscore the absence of a universally optimal screening tool and reinforce the need for context-appropriate selection. Further research evaluating NRS tools across diverse patient demographics and clinical contexts in Kenya and other low- and middle-income countries is necessary to validate these results and advance evidence-based practice.

Supplementary Materials

The following supporting information can be downloaded at the website of this paper posted on Preprints.org.

Author Contributions

Mahat Mohamed led the project, including Conceptualization, Data curation, Formal analysis, Investigation, Methodology, Project administration, Resources, Supervision, Visualization, Writing – original draft, Writing – review & editing. Prof. Sophie Ochola conducted the formal analysis and prepared visualisations as well as Supervision, Validation, Visualization, review & editing.

Funding

Please add: This research received no external funding..

Institutional Review Board Statement

Approval to conduct the research was granted by the Kenyatta University Graduate School ref. no. H87/37116/2017. This research was approved by the National Commission for Science, Technology, and Innovation (NACOSTI). no. NACOSTI/P/21/10259. Ethical approval was issued by Kenyatta University Ethical Review Committee (KUERC) vide approval. no. PKU/2187/I1331, and Kenyatta National Hospital-University of Nairobi (KNH-UON) Ethical Research Committee Research proposal approval vide ref. no. P547/07/2021, and the Moi Teaching Referral Hospital (MTRH) Institutional Research Ethics Committee (IREC) approval vide Ref. no. 0004112. The authority to conduct the research was in accordance with the respective ERC committees of KNH-UON (P547/07/2021), MTRH (ELD/MTRH/R&P/10/2/V.2/2010), and Kisii Teaching & Referral Hospital (KTRH) (ISERC/KTRH/002/22).

Informed Consent Statement

Informed consent was obtained from all subjects involved in the study.

Data Availability Statement

The data is available from the corresponding author upon reasonable request.

Acknowledgments

I extend my heartfelt gratitude to my supervisors, Prof. Sophie Ochola for her patience, unwavering guidance, and steadfast support during this study. Their invaluable insights and encouragement were instrumental in this journey. I am also deeply grateful to my family for their selfless sacrifices, unwavering support, and generosity in dedicating time and resources to help me complete this PhD thesis. Their belief in me is a source of strength and inspiration.

Conflicts of Interest

The authors declare no conflicts of interest.

Abbreviations

The following abbreviations are used in this manuscript:
BMI
Body Mass Index
KNH
Kenyatta National Hospital
KTRH
Kisii Teaching and Referral Hospital
MST
Malnutrition Screening Tool
MTRH
Moi Teaching and Referral Hospital
MUST
Malnutrition Universal Screening Tool
NPV
Negative Predictive Value
NRS
Nutrition Risk Screening
NRS-2002
Nutrition Risk Screening-2002
PPV
Positive Predictive Value

Appendix

  • Appendix 1: Informed Consents for Patients
  • Appendix 2: KU Graduate School Research Authorization
  • Appendix 3: KU-ERC Research Approval
  • Appendix 4: NACOSTI Research Approval License
  • Appendix 5: KNH-UON ERC Research proposal approval
  • Appendix 6: MTRH Authority to Conduct Research
  • Appendix 7: MTRH Institutional Research Ethics Committee (IREC) Approval
  • Appendix 8: KTRH Institutional Research Ethics Committee (IREC) authority

References

  1. Correia, M. I. T. D.; Waitzberg, D. L. The Impact of Malnutrition on Morbidity, Mortality, Length of Hospital Stay and Costs Evaluated through a Multivariate Model Analysis. Clinical Nutrition 2003, 22(3), 235–239. [Google Scholar] [CrossRef]
  2. Oflynn, J.; Peake, H.; Hickson, M.; Foster, D.; Frost, G. The Prevalence of Malnutrition in Hospitals Can Be Reduced: Results from Three Consecutive Cross-Sectional Studies. Clinical Nutrition 2005, 24(6), 1078–1088. [Google Scholar] [CrossRef]
  3. Correia, M. Isabel T. D.; Hegazi, Refaat A.; Higashiguchi, Takashi; Michel, Jean-Pierre; Reddy, B. Ravinder; Tappenden, Kelly A.; Uyar, Mehmet; Muscaritoli, Maurizio. Evidence-Based Recommendations for Addressing Malnutrition in Health Care: An Updated Strategy from the feedM.E. Global Study Group. Journal of the American Medical Directors Association 2014, 15(8), 544–550. [Google Scholar] [CrossRef]
  4. Behiry, Mervat E.; Salem, Marwa R. High Prevalence of Malnutrition among Hospitalized Patients in a Tertiary Care Hospital by Using Malnutrition Universal Screening Tool. The Egyptian Journal of Internal Medicine 2019, 31(3), 326–331. [Google Scholar] [CrossRef]
  5. van Vliet, Iris M. Y.; Gomes-Neto, Antonio W.; de Jong, Margriet F. C.; Bakker, Stephan J. L.; Jager-Wittenaar, Harriët; Navis, Gerjan J. Malnutrition Screening on Hospital Admission: Impact of Overweight and Obesity on Comparative Performance of MUST and PG-SGA SF. European Journal of Clinical Nutrition 2021, 75(9), 1398–1406. [Google Scholar] [CrossRef] [PubMed]
  6. van Vliet, Iris M. Y.; Gomes-Neto, António W.; de Jong, Margriet F. C.; Jager-Wittenaar, Harriët; Navis, Gerjan J. High Prevalence of Malnutrition Both on Hospital Admission and Predischarge. Nutrition 2020, 77, Article 110814. [Google Scholar] [CrossRef]
  7. Visser, Janicke; Cederholm, Tommy; Philips, Lauren; Blaauw, Renée. Prevalence and Related Assessment Practices of Adult Hospital Malnutrition in Africa: A Scoping Review. Clinical Nutrition ESPEN 2024, 63, 121–132. [Google Scholar] [CrossRef] [PubMed]
  8. Neumann, S. A.; Miller, M. D.; Daniels, L.; Crotty, M. Nutritional Status and Clinical Outcomes of Older Patients in Rehabilitation. Journal of Human Nutrition and Dietetics 2005, 18(2), 129–136. [Google Scholar] [CrossRef]
  9. Kaur, S.; Miller, M. D.; Halbert, J.; Giles, L. C.; Crotty, M. Nutritional Status of Adults Participating in Ambulatory Rehabilitation. Asia-Pacific Journal of Clinical Nutrition 2008, 17(2), 199–207. [Google Scholar] [CrossRef] [PubMed]
  10. Nip, W. F. R.; Perry, L.; McLaren, S.; Mackenzie, A. Dietary Intake, Nutritional Status and Rehabilitation Outcomes of Stroke Patients in Hospital. Journal of Human Nutrition and Dietetics 2011, 24(5), 460–469. [Google Scholar] [CrossRef]
  11. Neumann, S. A.; Miller, M. D.; Daniels, L.; Crotty, M. Nutritional Status and Clinical Outcomes of Older Patients in Rehabilitation. Journal of Human Nutrition and Dietetics 2005, 18(2), 129–136. [Google Scholar] [CrossRef]
  12. Goiburu, M. E.; Goiburu, M. M. Jure; Bianco, H.; Díaz, J. Ruiz; Alderete, F.; Palacios, M. C.; Cabral, V.; Escobar, D.; López, R.; Waitzberg, D. L. The Impact of Malnutrition on Morbidity, Mortality and Length of Hospital Stay in Trauma Patients. Nutrición Hospitalaria 2006, 21(5), 604–610. [Google Scholar] [CrossRef]
  13. Barker, Lisa A.; Gout, Belinda S.; Crowe, Timothy C. Hospital Malnutrition: Prevalence, Identification and Impact on Patients and the Healthcare System. International Journal of Environmental Research and Public Health 2011, 8(2), 514–527. [Google Scholar] [CrossRef]
  14. Giner, Manuel; Laviano, Alessandro; Meguid, Michael M.; Gleason, John R. In 1995 a Correlation between Malnutrition and Poor Outcome in Critically Ill Patients Still Exists. In Nutrition 1996, 12(1), 23–29. [Google Scholar] [CrossRef]
  15. Banks, Merrilyn; Bauer, Judith; Graves, Nicholas; Ash, Susan. Malnutrition and Pressure Ulcer Risk in Adults in Australian Health Care Facilities. Nutrition 2010, 26(9), 896–901. [Google Scholar] [CrossRef]
  16. Planas, M.; Audivert, S.; Pérez-Portabella, C.; Burgos, R.; Puiggrós, C.; Casanelles, J. M.; Rosselló, J. Nutritional Status among Adult Patients Admitted to a University-Affiliated Hospital in Spain at the Time of Genoma. Clinical Nutrition 2004, 23(5), 1016–1024. [Google Scholar] [CrossRef] [PubMed]
  17. Deer, Rachel; McCall, Mackenzie; Volpi, Elena. Comparison of Malnutrition Screening Tools for Use in Hospitalized Older Adults (OR36-02-19). Current Developments in Nutrition 2019, 3 Suppl 1, OR36-02-19. [Google Scholar] [CrossRef]
  18. Deer, Rachel R.; Goodlett, Shawn; Volpi, Elena. Comparison of Four Malnutrition Screening Tools to the Subjective Global Assessment (SGA) in a Cohort of Acutely Ill Older Adults. The FASEB Journal 2017, 31 Suppl 1, 151.4. [Google Scholar] [CrossRef]
  19. Lim, Su L.; Ong, Kian C. B.; Chan, Yiong H.; Loke, Wai C.; Ferguson, Maree; Daniels, Lynne. Malnutrition and Its Impact on Cost of Hospitalization, Length of Stay, Readmission and 3-Year Mortality. Clinical Nutrition 2012, 31(3), 345–350. [Google Scholar] [CrossRef]
  20. Agarwal, Ekta; Ferguson, Maree; Banks, Merrilyn; Batterham, Marijka; Bauer, Judith; Capra, Sandra; Isenring, Elisabeth. Malnutrition and Poor Food Intake Are Associated with Prolonged Hospital Stay, Frequent Readmissions, and Greater in-Hospital Mortality: Results from the Nutrition Care Day Survey 2010. Clinical Nutrition 2013, 32(5), 737–745. [Google Scholar] [CrossRef] [PubMed]
  21. Sharma, Yogesh; Miller, Michelle; Kaambwa, Billingsley; Shahi, Rashmi; Hakendorf, Paul; Horwood, Chris; Thompson, Campbell. Malnutrition and Its Association with Readmission and Death within 7 Days and 8–180 Days Postdischarge in Older Patients: A Prospective Observational Study. BMJ Open 2017, 7(11), e018443. [Google Scholar] [CrossRef]
  22. Blaauw, Renée; Achar, Esther; Dolman, Robin C.; Harbron, Janetta; Moens, Merel; Munyi, Faith; Nyatefe, Dzifa; Visser, Janicke. The Problem of Hospital Malnutrition in the African Continent. Nutrients 2019, 11(9), Article 2028. [Google Scholar] [CrossRef]
  23. Doganay, Mutlu; Halil, Meltem G.; Uyar, Mehmet; Kocatakan, Pinar; Dikmeer, Ayse; Cakir, Burcu Kelleci; Kilicturgay, Sadik; et al. Prevalence of Malnutrition Risk in Hospitalized Patients: A Large Nationwide Study. Journal of Health, Population, and Nutrition 2025, 44(1), 137. [Google Scholar] [CrossRef]
  24. Coats, Gamble; Katherine, G.; Morgan, Sarah L.; Bartolucci, Alfred A.; Weinsier, Roland L. Hospital-Associated Malnutrition: A Reevaluation 12 Years Later. Journal of the American Dietetic Association 1993, 93(1), 27–33. [Google Scholar] [CrossRef]
  25. Ferguson, M. Uncovering the Skeleton in the Hospital Closet. What Next? Australian Journal of Nutrition & Dietetics 2001, 58(2), 83–84. [Google Scholar]
  26. Elia, M.; Zellipour, L.; Stratton, R. J. To Screen or Not to Screen for Adult Malnutrition? Clinical Nutrition 2005, 24(6), 867–884. [Google Scholar] [CrossRef]
  27. Watterson, C.; Fraser, A.; Banks, M.; Isenring, E.; Miller, M.; Silvester, C.; Hoevenaars, R.; Bauer, J.; Vivanti, A. P.; Ferguson, M. Evidence Based Practice Guidelines for the Nutritional Management of Malnutrition in Adult Patients across the Continuum of Care. Nutrition and Dietetics 2009, 66(s3), S1–S34. [Google Scholar] [CrossRef]
  28. Ahmed, Nadim; Haboubi, N. Assessment and Management of Nutrition in Older People and Its Importance to Health. Clinical Interventions in Aging 2010, 5, 207–216. [Google Scholar] [CrossRef]
  29. Skipper, Annalynn; Ferguson, Maree; Thompson, Kyle; Castellanos, Victoria H.; Porcari, Judy. Nutrition Screening Tools: An Analysis of the Evidence. Journal of Parenteral and Enteral Nutrition 2012, 36(3), 292–298. [Google Scholar] [CrossRef] [PubMed]
  30. Kirkland, Lisa L.; Shaughnessy, Erin. Recognition and Prevention of Nosocomial Malnutrition: A Review and a Call to Action! The American Journal of Medicine 2017, 130(12), 1345–1350. [Google Scholar] [CrossRef]
  31. Yıldırım, Reyyan; Candaş, Bahar; Usta, M. Arif; Erkul, Oğuz; Türkyılmaz, Serdar; Güner, Ali. Comparison of Nutritional Screening Tools in Patients Undergoing Surgery for Gastric Cancer. Medical Bulletin of Haseki 2020, 58(2), 153–161. [Google Scholar] [CrossRef]
  32. Botero, Liliana; Banks, Merrilyn D.; Gordon, Emily H.; Bauer, Judy; Young, Adrienne M. Incidence and Outcomes of in-Hospital Nutritional Decline: A Prospective Observational Cohort Study in Adult Patients. Clinical Nutrition 2024, 43(5), 1057–1064. [Google Scholar] [CrossRef]
  33. Sunguya, B. F. P.; Koola, J. I.; Atkinson, S. Infections Associated with Severe Malnutrition among Hospitalised Children in East Africa. Tanzania Health Research Bulletin 2006, 8(3), 189–192. [Google Scholar] [CrossRef]
  34. Neelemaat, Floor; Meijers, Judith; Kruizenga, Hinke; van Ballegooijen, Hanne; van Bokhorst-de van der Schueren, Marian. Comparison of Five Malnutrition Screening Tools in One Hospital Inpatient Sample. Journal of Clinical Nursing 2011, 20(15–16), 2144–2152. [Google Scholar] [CrossRef]
  35. Cederholm, T.; Bosaeus, I.; Barazzoni, R.; Bauer, J.; Van Gossum, A.; Klek, S.; Muscaritoli, M.; et al. Diagnostic Criteria for Malnutrition—An ESPEN Consensus Statement. Clinical Nutrition 2015, 34(3), 335–340. [Google Scholar] [CrossRef]
  36. Al-Subaihi, A. A. Sample Size Determination. Influencing Factors and Calculation Strategies for Survey Research. Saudi Medical Journal 2003, 24(4), 323–330. [Google Scholar]
  37. Boléo-Tomé, Carolina; Monteiro-Grillo, Isabel; Camilo, Maria; Ravasco, Paula. Validation of the Malnutrition Universal Screening Tool (MUST) in Cancer. British Journal of Nutrition 2012, 108(2), 343–348. [Google Scholar] [CrossRef]
  38. Gottschall, C.; Tarnowski, M.; Machado, P.; Raupp, D.; Marcadenti, A.; Rabito, E. I.; Silva, F. M. Predictive and Concurrent Validity of the Malnutrition Universal Screening Tool Using Mid-upper Arm Circumference Instead of Body Mass Index. Journal of Human Nutrition and Dietetics 2019, 32(6), 775–780. [Google Scholar] [CrossRef] [PubMed]
  39. Hassanin, Islam A.; Hassanein, Hazem; Elmenshawy, Pillar; El-Gameel, Dina; Elsheikh, Aya A.; El-Kobrosly, Aya; Samir, Bassant; Emil, Rafael; Alaa, Merihan; Selim, Dina H. Malnutrition Score and Body Mass Index as Nutritional Screening Tools for Hemodialysis Patients. Clinical Nutrition ESPEN 2021, 42, 403–406. [Google Scholar] [CrossRef] [PubMed]
  40. Jones, J.Mary M. Reliability of Nutritional Screening and Assessment Tools. Nutrition 2004, 20(3), 307–311. [Google Scholar] [CrossRef] [PubMed]
  41. Coutu, T. Nutrition Screening in the Adult Stroke Population Using the Canadian Nutrition Screening Tool in Comparison with the Subjective Global Assessment”. Master’s thesis Electronic Thesis and Dissertation Repository, University of Western Ontario, 2017. Available online: https://ir.lib.uwo.ca/etd/4668.
  42. Monaghan, Thomas F.; Rahman, Syed N.; Agudelo, Christina W.; Wein, Alan J.; Lazar, Jason M.; Everaert, Karel; Dmochowski, Roger R. Foundational Statistical Principles in Medical Research: Sensitivity, Specificity, Positive Predictive Value, and Negative Predictive Value. Medicina 2021, 57(5), 503, Bookshelf: ID: NBK580496. [Google Scholar] [CrossRef] [PubMed]
  43. van Bokhorst-de van der Schueren, Marian A. E.; Guaitoli, Patrícia R.; Jansma, Elise P.; de Vet, Henrica C. W. Nutrition Screening Tools: Does One Size Fit All? A Systematic Review of Screening Tools for the Hospital Setting. Clinical Nutrition 2014, 33(1), 39–58. [Google Scholar] [CrossRef] [PubMed]
  44. McHugh, ML. Interrater reliability: the kappa statistic. Biochem Med (Zagreb) 2012, 22(3), 276–282. [Google Scholar] [CrossRef]
  45. Seid, Ahmed M.; Fentahun, Netsanet. Prevalence of Malnutrition among Old People in Africa: Systematic Review and Meta-analysis. BMJ Open 2022, 12(11), e065197. [Google Scholar] [CrossRef]
  46. Inciong, Jesus F. B.; Chaudhary, Adarsh; Hsu, Han-Shui; Joshi, Rajeev; Seo, Jeong-Meen; Trung, Lam Viet; Ungpinitpong, Winai; Usman, Nurhayat. Hospital Malnutrition in Northeast and Southeast Asia: A Systematic Literature Review. Clinical Nutrition ESPEN 2020, 39, 30–45. [Google Scholar] [CrossRef]
  47. Li, Tao; Zhang, Yalan; Gong, Cheng; Wang, Jing; Liu, Bao; Shi, L.; Duan, Jun. Prevalence of Malnutrition and Analysis of Related Factors in Elderly Patients with COVID-19 in Wuhan, China. European Journal of Clinical Nutrition 2020, 74(6), 871–875. [Google Scholar] [CrossRef]
  48. Yuan, Yajun; Wang, Nan; Ou, Xueqing. Caution Should Be Exercised for the Detection of SARS-CoV-2, Especially in the Elderly. Journal of Medical Virology 2020, 92(9), 1641–1648. [Google Scholar] [CrossRef]
  49. Susetyowati, Susetyowati; Sholikhati, Amalia S.; Cahyaningrum, Dinda K.; Rachmawati, Azizah I.; Handaya, Adeodatus Y. Comparison of Tools for Nutritional Assessment and Screening of Hospitalized Patients: A Study on Surgical Patients. Medeniyet Medical Journal 2023, 38(1), 70–77. [Google Scholar] [CrossRef]
  50. Wakahara, Toshitatsu; Shiraki, Makoto; Murase, Kayoko; Fukushima, Hideki; Matsuura, Katsuhiko; Fukao, Ayumi; Kinoshita, Sachiko; et al. Nutritional Screening with Subjective Global Assessment Predicts Hospital Stay in Patients with Digestive Diseases. Nutrition 2007, 23(9), 634–639. [Google Scholar] [CrossRef]
  51. Poulia, Kalliopi-Anna; Yannakoulia, Mary; Karageorgou, Dimitra; Gamaletsou, Maria; Panagiotakos, Demosthenes B.; Sipsas, Nikolaos V.; Zampelas, Antonis. Evaluation of the Efficacy of Six Nutritional Screening Tools to Predict Malnutrition in the Elderly. Clinical Nutrition 2012, 31(3), 378–385. [Google Scholar] [CrossRef] [PubMed]
  52. Poulia, Kalliopi-Anna; Klek, Stanislaw; Doundoulakis, Ioannis; Bouras, Emmanouil; Karayiannis, Dimitrios; Baschali, Aristea; Passakiotou, Marili; Chourdakis, Michael. The Two Most Popular Malnutrition Screening Tools in the Light of the New ESPEN Consensus Definition of the Diagnostic Criteria for Malnutrition. Clinical Nutrition 2017, 36(4), 1130–1135. [Google Scholar] [CrossRef]
  53. Wolters, Maike; Volkert, Dorothee; Streicher, Melanie; Kiesswetter, Eva; Torbahn, Gabriel; O’Connor, Eibhlís M.; O’Keeffe, Mary; MaNuEL consortium. Prevalence of Malnutrition Using Harmonized Definitions in Older Adults from Different Settings—A MaNuEL Study. Clinical Nutrition 2019, 38(5), 2389–2398. [Google Scholar] [CrossRef]
  54. Reber, Emilie; Gomes, Filomena; Vasiloglou, Maria F.; Schuetz, Philipp; Stanga, Zeno. Nutritional Risk Screening and Assessment. Journal of Clinical Medicine 2019, 8(7), Article 1065. [Google Scholar] [CrossRef]
  55. Silva, David Franciole Oliveira; Lima, Severina Carla Vieira Cunha; Sena-Evangelista, Karine Cavalcanti Mauricio; Marchioni, Dirce Maria; Cobucci, Ricardo Ney; de Andrade, Fábia Barbosa. Nutritional Risk Screening Tools for Older Adults with COVID-19: A Systematic Review. Nutrients 2020, 12(10), Article 2956. [Google Scholar] [CrossRef] [PubMed]
  56. Wang, Hongyue; Wang, Bokai; Zhang, Xunan; Feng, Changyong. Relations among Sensitivity, Specificity and Predictive Values of Medical Tests Based on Biomarkers. General Psychiatry 2021, 34(2), e100453. [Google Scholar] [CrossRef]
  57. Bellanti, Francesco; Lo Buglio, Aurelio; Quiete, Stefano; Pellegrino, Giuseppe; Dobrakowski, Michał; Kasperczyk, Aleksandra; Kasperczyk, Sławomir; Vendemiale, Gianluigi. Comparison of Three Nutritional Screening Tools with the New GLIM Criteria for Malnutrition and Association with Sarcopenia in Hospitalized Older Patients. Journal of Clinical Medicine 2020, 9(6), Article 1898. [Google Scholar] [CrossRef] [PubMed]
  58. Leuenberger, Michèle; Kurmann, Silvia; Stanga, Zeno. Nutritional Screening Tools in Daily Clinical Practice: The Focus on Cancer. Supportive Care in Cancer 2010, 18 Suppl 2, 17–27. [Google Scholar] [CrossRef]
  59. Tu, Mei-Yu; Chien, Tsair-Wei; Chou, Ming-Ting. Using a Nutritional Screening Tool to Evaluate the Nutritional Status of Patients with Colorectal Cancer. Nutrition and Cancer 2012, 64(2), 323–330. [Google Scholar] [CrossRef] [PubMed]
  60. Demirel, Birsen; Atasoy, Beste M. Comparison of Three Nutritional Screening Tools to Predict Malnutrition Risk and Detect Distinctions between Tools in Cancer Patients Receiving Radiochemotherapy. Nutrition and Cancer 2018, 70(6), 867–873. [Google Scholar] [CrossRef]
  61. Kesari, A.; Noel, J. Y. Nutritional Assessment. In StatPearls; StatPearls Publishing: Treasure Island, FL, 2023; Available online: https://www.ncbi.nlm.nih.gov/books/NBK580496/ (accessed on 1 Jul 2025).
  62. NCBI. Bookshelf: ID: NBK580496. [PubMed]
  63. Wolters, Maike; Volkert, Dorothee; Streicher, Melanie; Kiesswetter, Eva; Torbahn, Gabriel; O’Connor, Eibhlís M.; O’Keeffe, Mary; et al. Prevalence of Malnutrition Using Harmonized Definitions in Older Adults from Different Settings—A MaNuEL Study. Clinical Nutrition 2019, 38(5), 2389–2398. [Google Scholar] [CrossRef] [PubMed]
  64. Cortés-Aguilar, Regina; Malih, Narges; Abbate, Manuela; Fresneda, Sergio; Yañez, Aina; Bennasar-Veny, Miquel. Validity of Nutrition Screening Tools for Risk of Malnutrition among Hospitalized Adult Patients: A Systematic Review and Meta-analysis. Clinical Nutrition 2024, 43(5), 1094–1116. [Google Scholar] [CrossRef] [PubMed]
Figure 1. Cumulative Distribution & Percentiles by Age Group.
Preprints 182077 g001
Table 1. Interpretation of screening tool validity and reliability.
Validity High Moderate Low
Sensitivity
Specificity
Negative predictive value
Agreement (Cohens kappa)
≥90%
≥90%
≥90%
≥0.8
70%–89%
70%–89%
70%–89%
0.6–0.79
<70%
<70%
<70%
<0.6
Source: Indicators (34; 43;44).
Table 2a. Prevalence of hospital malnutrition risk estimated by different NRS tools and by ESPEN (BMI) criteria.
Tool Category Proportions of normal and at-risk cases per facility
Overall, N=420 KTRH, N=140 KNH, N=140 MTRH, N=140
NRS-2002 Normal
At-risk
60 (14.3)
360 (85.7)
19 (13.6)
121 (86.4)
20 (14.3)
120 (85.7)
21 (15.0)
119 (85.0)
MUST Normal
At-risk
206 (49)
214 (51)
64 (45.7)
76 (54.3)
71 (50.7)
69 (49.3)
71 (50.7)
69 (49.3)
MST Normal
At-risk
119 (28.3)
301 (71.7)
54 (38.6)
86 (61.4)
41 (29.3)
99 (70.7)
24 (17.1)
116 (82.9)
BMI Normal
At-risk
320 (76.2)
100 (23.8)
109 (77.9)
31 (22.1)
101 (72.1)
39 (29.9)
108 (77.1)
32 (22.9)
Table 2b. Pairwise comparison between NRS tools in determining malnutrition risk.
Comparison P-Value
NRS vs. MST
NRS vs. MST
MUST vs. MST
<0.0001
<0.0001
<0.0001
Table 3. Performance of NRS tools against BMI.
NRS-2002 MUST MST
Se
Sp
NPV
PPV
AUC
1.0000 (0.9645–1.0000)
0.1886 (0.1457–0.2317)
1.0000 (0.9404–1.0000)
0.2833 (0.2373–0.3329)
0.5943 (0.5728–0.6159)
1.0000 (0.9645–1.0000)
0.6478 (0.5925–0.7003)
1.0000 (0.9823–1.0000)
0.4766 (0.5953–0.7003)
0.8239 (0.7976–0.8502)
0.8725 (0.8078–0.9373)
0.3333 (0.2817–0.3881)
0.8907 (0.8347–0.9468)
0.2956 (0.2441–0.3472)
0.6029 (0.5613–0.6445)
Note:Reference = BMI; Se (sensitivity), Sp (specificity), Negative Predictive Value (NPV), Positive PredictiveValue (PPV), AUC - Area under thereceiver operating characteristic curve
Table 4. Agreement among the NRS tools and BMI based on k-statistics.
Tool k-statistics P-value Interpret
NRS-2002
MUST
MST
0.2115 (0.1061–0.3169)
0.2539 (0.2008–0.3069)
0.1254 (0.0290–0.1822)
0.0011
<0.0001
<0.0001
low
low
low
Table 5. Agreement among the NRS tools based on k-statistics.Table 6. ROC Contrast Estimation.
Preprints 182077 i001
Disclaimer/Publisher’s Note: The statements, opinions and data contained in all publications are solely those of the individual author(s) and contributor(s) and not of MDPI and/or the editor(s). MDPI and/or the editor(s) disclaim responsibility for any injury to people or property resulting from any ideas, methods, instructions or products referred to in the content.
Copyright: This open access article is published under a Creative Commons CC BY 4.0 license, which permit the free download, distribution, and reuse, provided that the author and preprint are cited in any reuse.
Prerpints.org logo

Preprints.org is a free preprint server supported by MDPI in Basel, Switzerland.

Subscribe

Disclaimer

Terms of Use

Privacy Policy

Privacy Settings

© 2025 MDPI (Basel, Switzerland) unless otherwise stated