2. Methodology
2.1. Design Process
The design process for this study is as follows:
Selection and Improvement: Choose the type of floating platform based on the local environmental conditions and make necessary improvements.
Modeling: Use 3D modeling software to create the platform model and calculate its physical parameters.
Stability Analysis: Confirm the platform’s stability through static water analysis and iterate to find the optimal configuration by using ANSYS AQWA.
Hydrodynamic Analysis: Perform hydrodynamic calculations using ANSYS AQWA.
System Design and Testing: Use Orcina OrcaFlex to design the mooring and counterweight suspension systems. Conduct free decay tests to determine the natural period and calculate regular wave responses to obtain the Response Amplitude Operator (RAO). Compare different configurations for surge, heave, and pitch degrees of freedom to find the optimized counterweight suspension system solution
Criteria Check: Input environmental conditions and check against design criteria, including Ultimate Limit State (ULS), Accidental Limit State (ALS), Serviceability Limit State (SLS), and Fatigue Limit State (FLS) to ensure the design meets all necessary requirements.
2.2. Design Concept
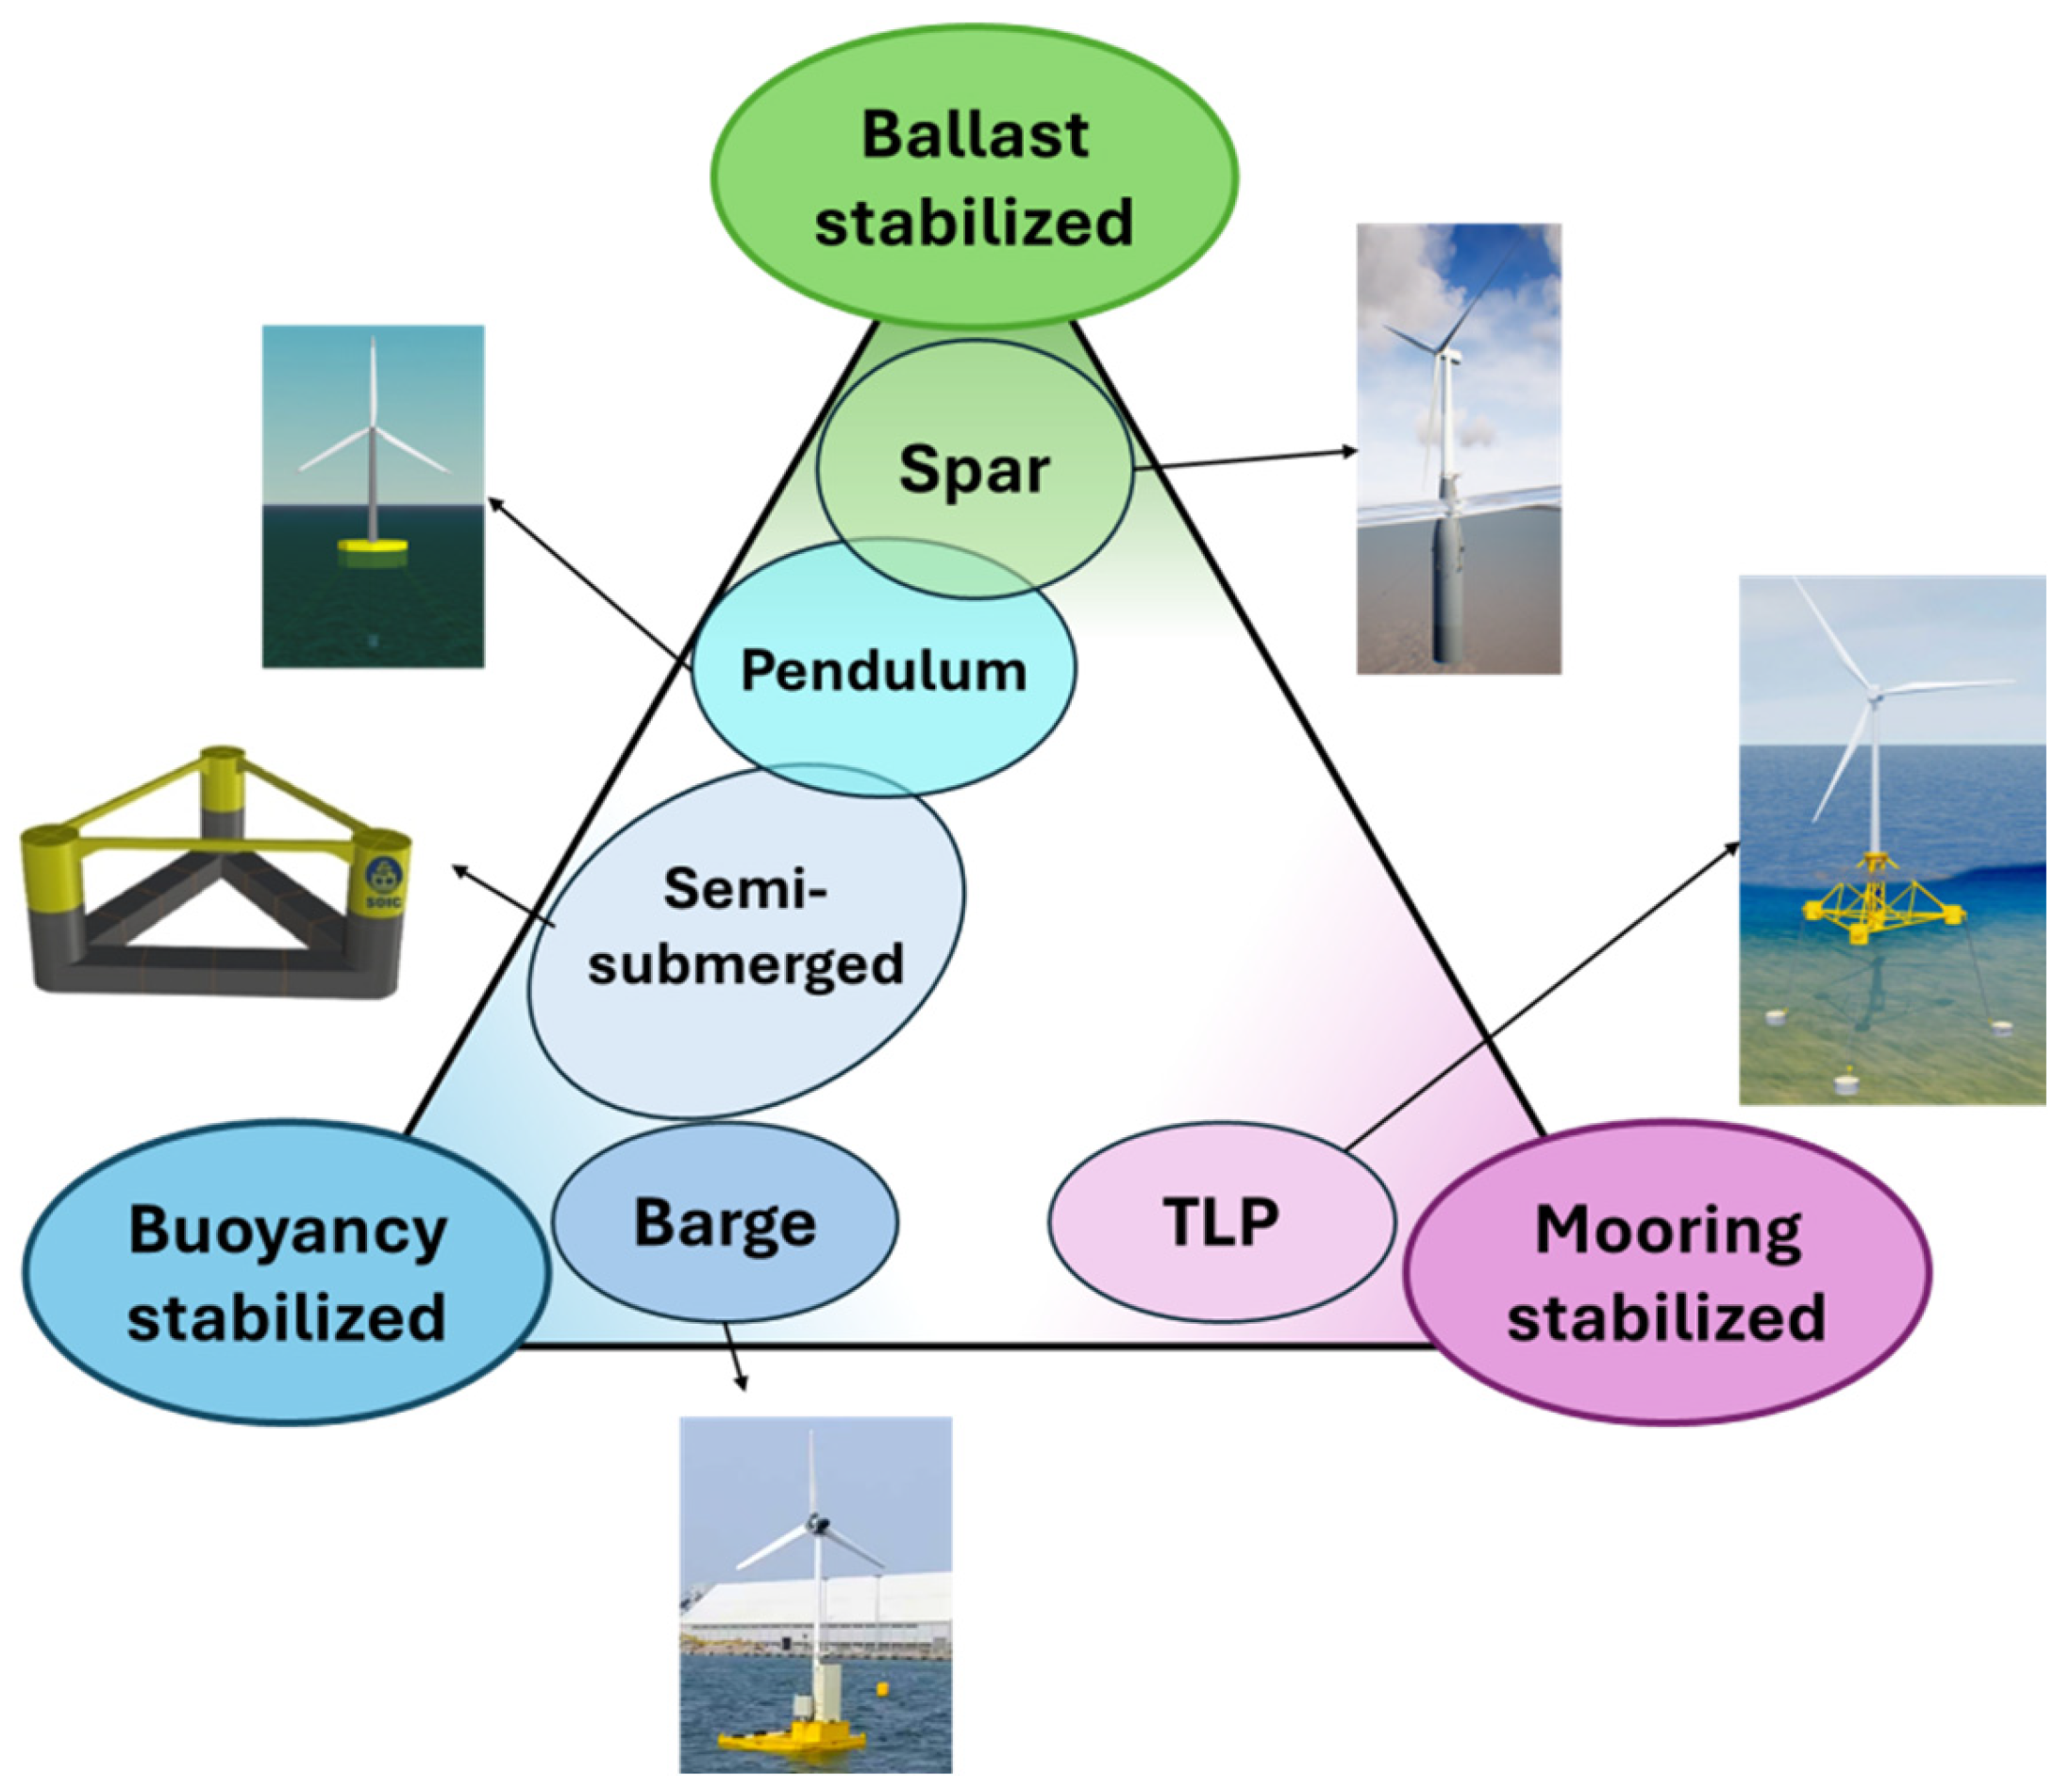
According to the study by Johannessen et al. (2018), the design of floating platforms must consider six important factors: stability, natural period, assembly procedures, overall dimensions, mass, and cost. Therefore, the design concept will focus on the water depth and environmental conditions at the site, as well as assess the feasibility and cost of maritime engineering to determine the type of floating platform.
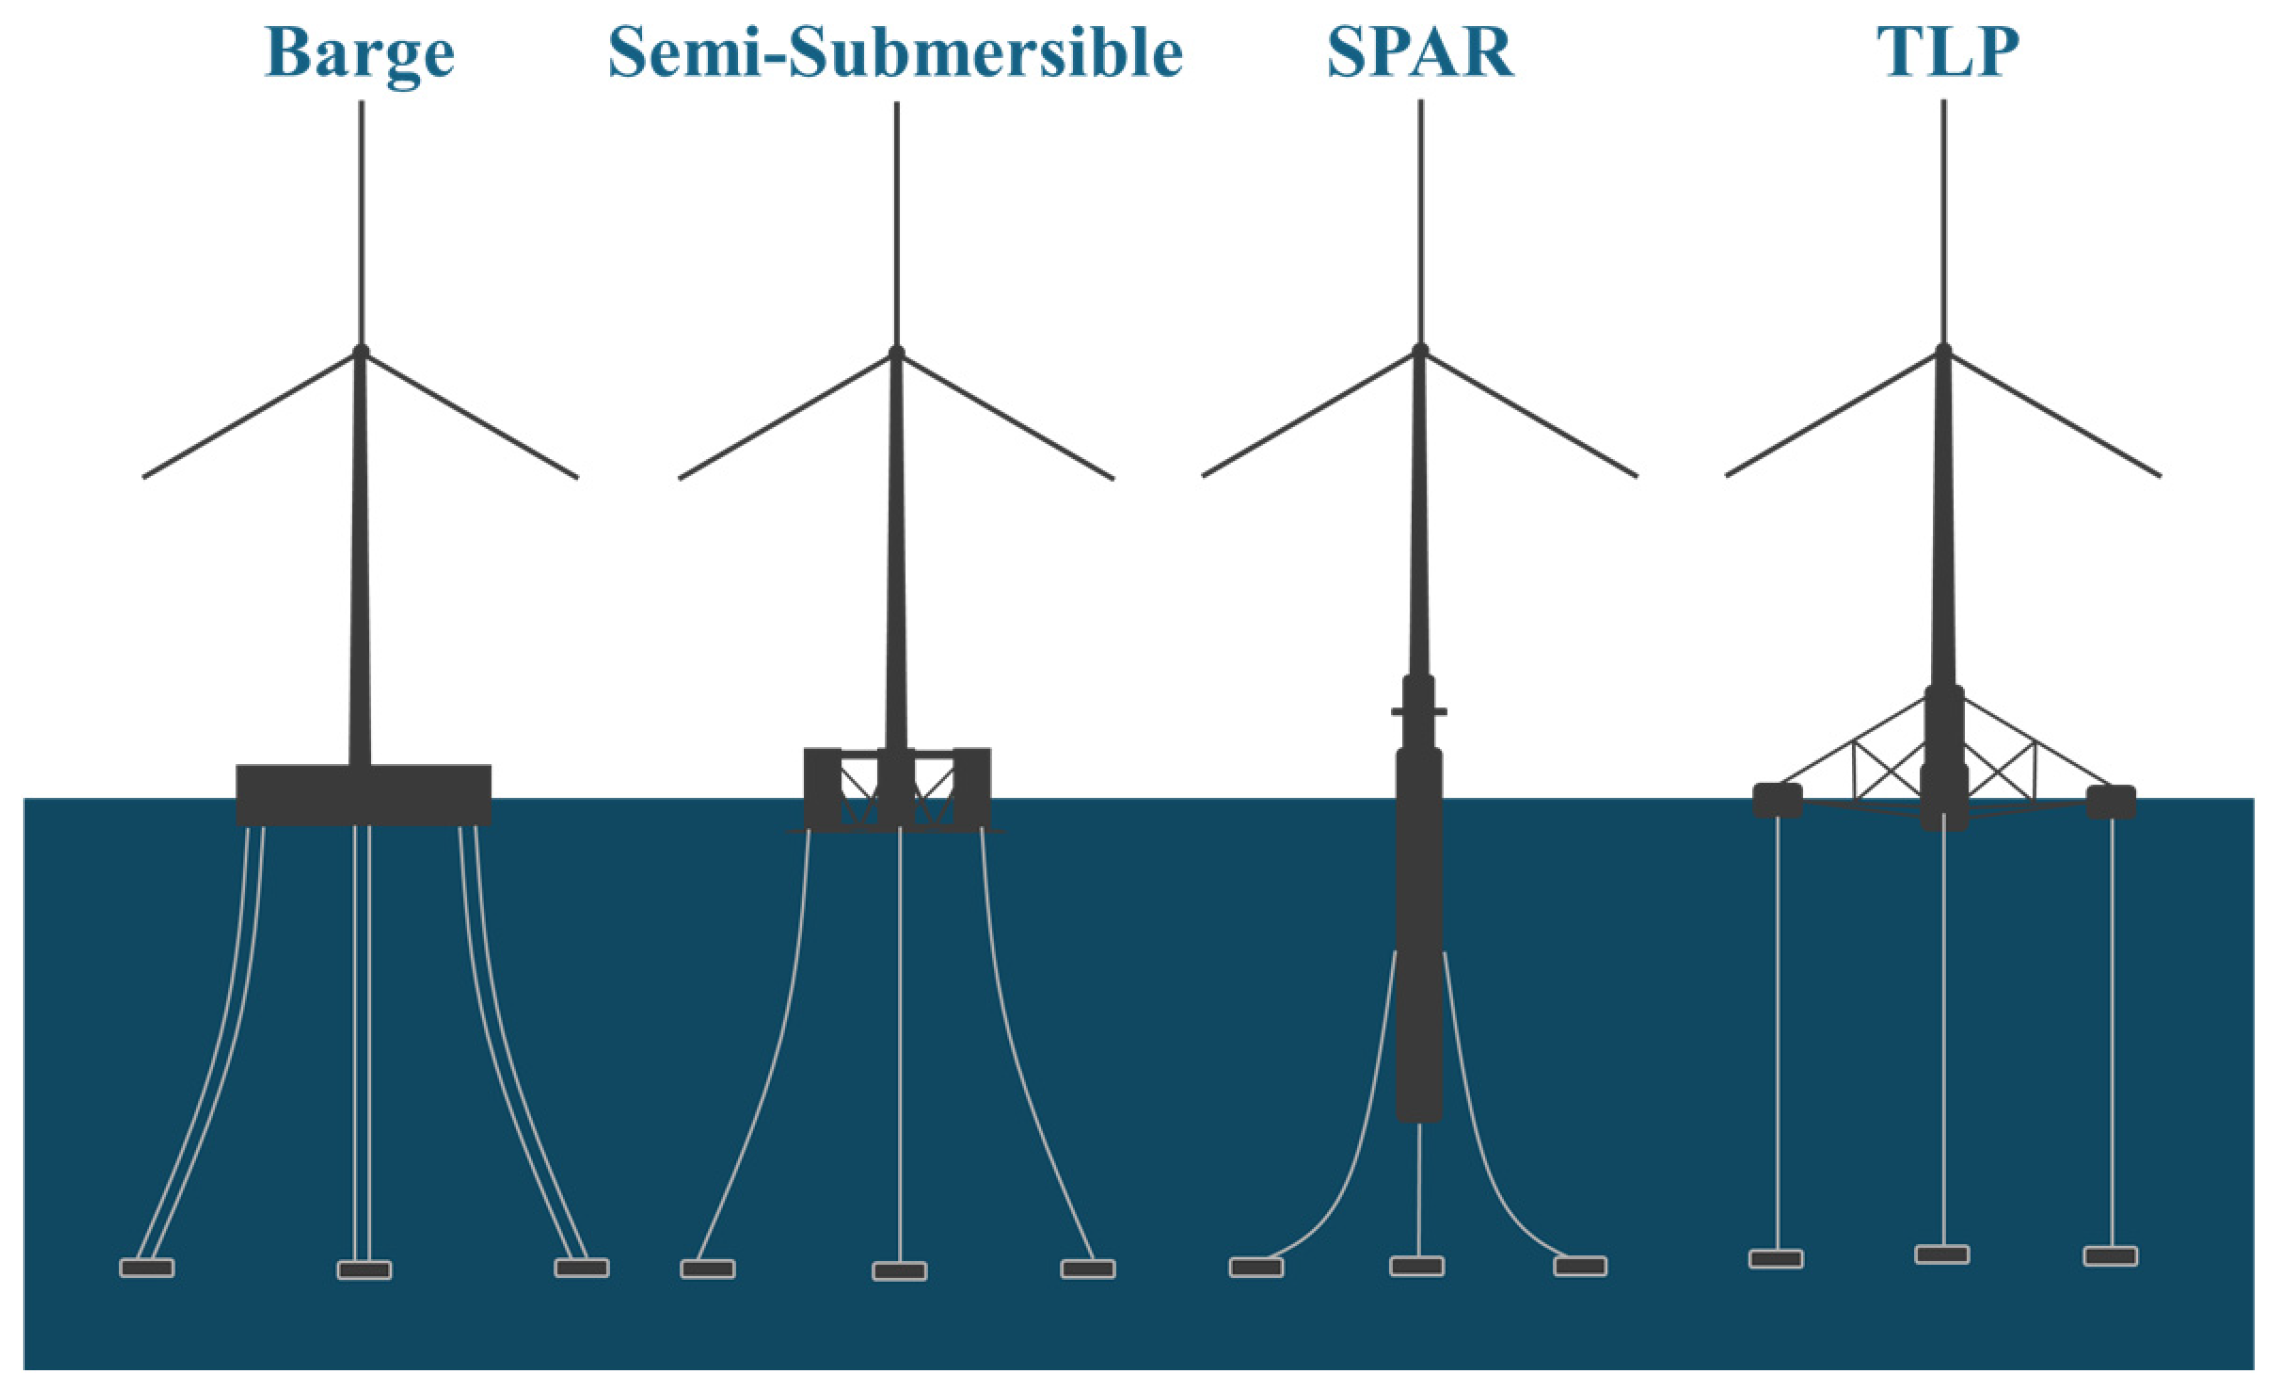
Based on the literature review, semi-submersible and barge-type platforms are considered suitable for shallow water areas due to their shallow draft. According to DNV-RP-0286, typical natural periods for different platform types are referenced in
Table 1. Although both semi-submersible and barge-type platforms may experience resonance in vertical motion, this effect can be mitigated using heave plates. Additionally, barge-type platforms can further reduce vertical motion using moonpools.
Barge-type platforms are more prone to resonance in pitch motion. However, semi-submersible platforms have higher production costs. Therefore, the cost of semi-submersible platforms is higher than that of barge-type platforms. To increase the natural period of pitch motion, a counterweight suspension system can extend the natural period of pitch motion, making the barge-type platform a potentially suitable choice for the Taiwan Strait.
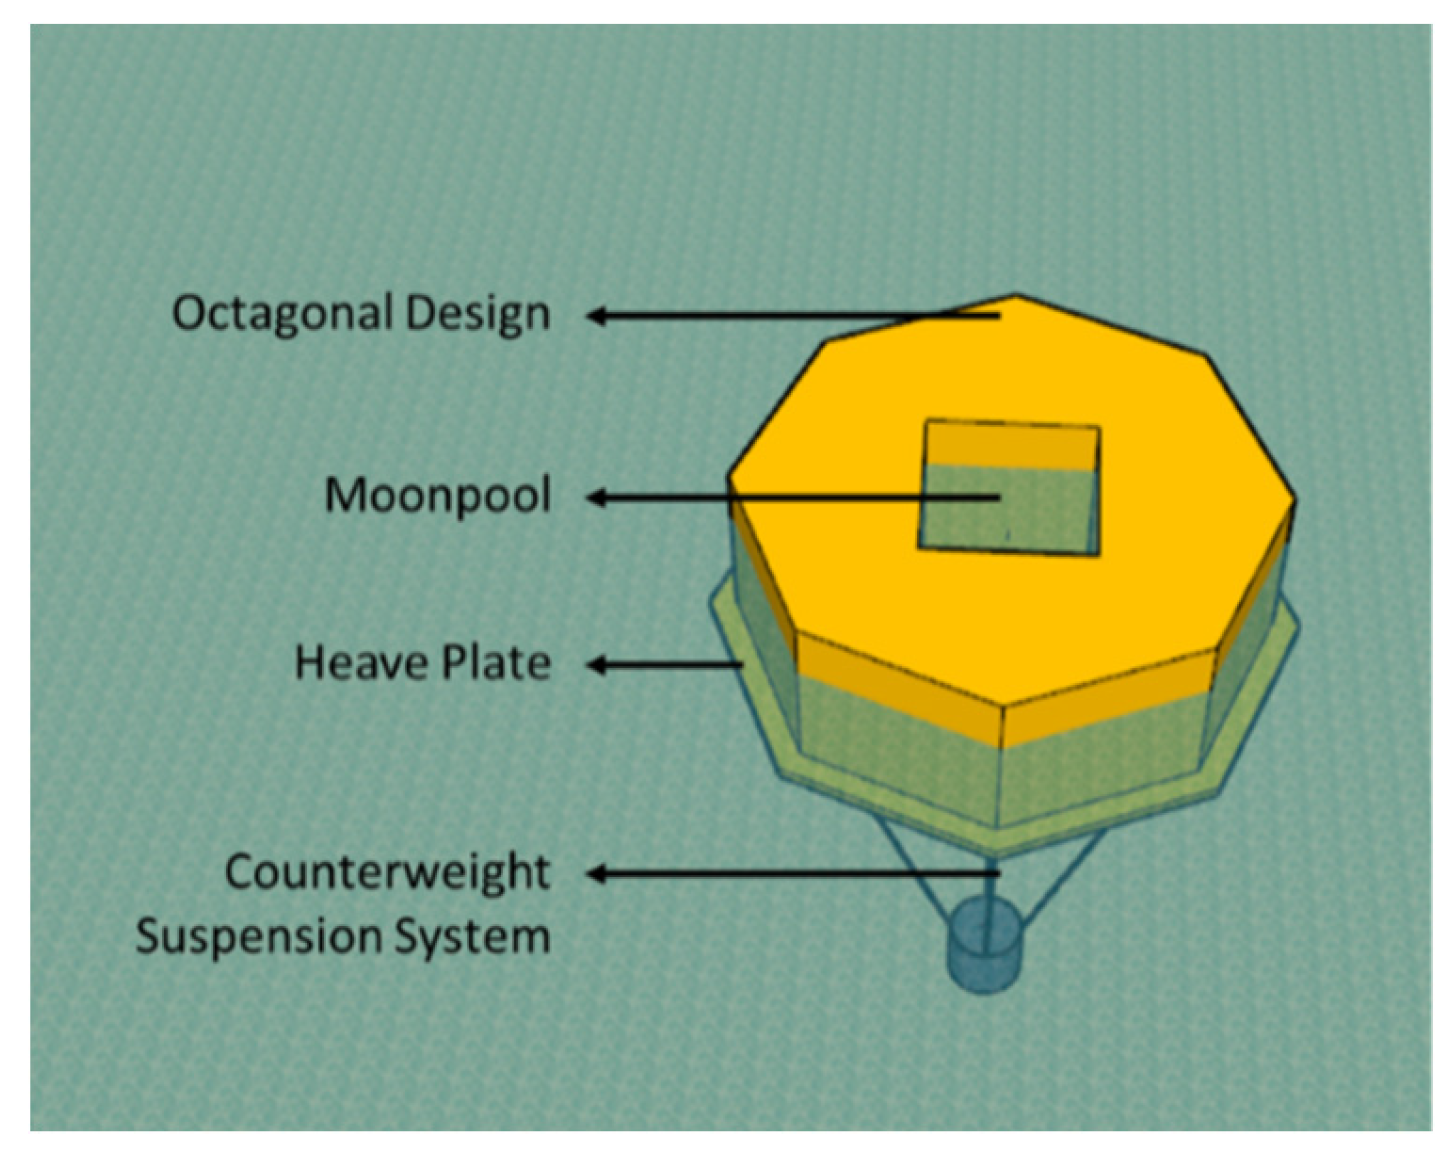
Based on the following design concept, the floating platform is illustrated in
Figure 3. This floating platform is named
Suspensa OctaFloat (SOF), due to its combination of an octagonal design and a counterweight suspension system.
For square barge-type platforms, The square shape has a larger surface area exposed to incoming wave forces, making it more susceptible to larger wave loads. To reduce the force area in the wave direction and address the construction difficulties of large-diameter cylindrical shapes and the potential vortex-induced vibrations (VIV), an octagonal design has been chosen as a solution.
Since barges are prone to resonance in vertical motion, which results in larger responses, moonpools and heave plates can be used to reduce vertical motion, thereby improving the safety of maintenance personnel and the stability of the floating platform during operation.
Due to the tendency of barges to resonate in pitch motion, the counterweight suspension system is used to increase the natural period of the floating platform’s pitch motion. This system can extend the natural period to approximately 16–18 seconds, while the 250-year return period peak period for the Taoyuan environment in the Taiwan Strait is 15 seconds. This means the counterweight suspension system can prevent pitch motion resonance and enhance stability under extreme conditions. Additionally, the counterweight suspension system lowers the center of gravity and provides restoring moment, making the floating platform more stable during operation.
Furthermore, given the frequent typhoons in the Taiwan Strait, the extreme conditions are quite severe. The barge design also allows for stabilization of the platform using ballast water in the event of suspension system failure, preventing platform capsizing if the suspension lines break.
2.3. Ansys AQWA
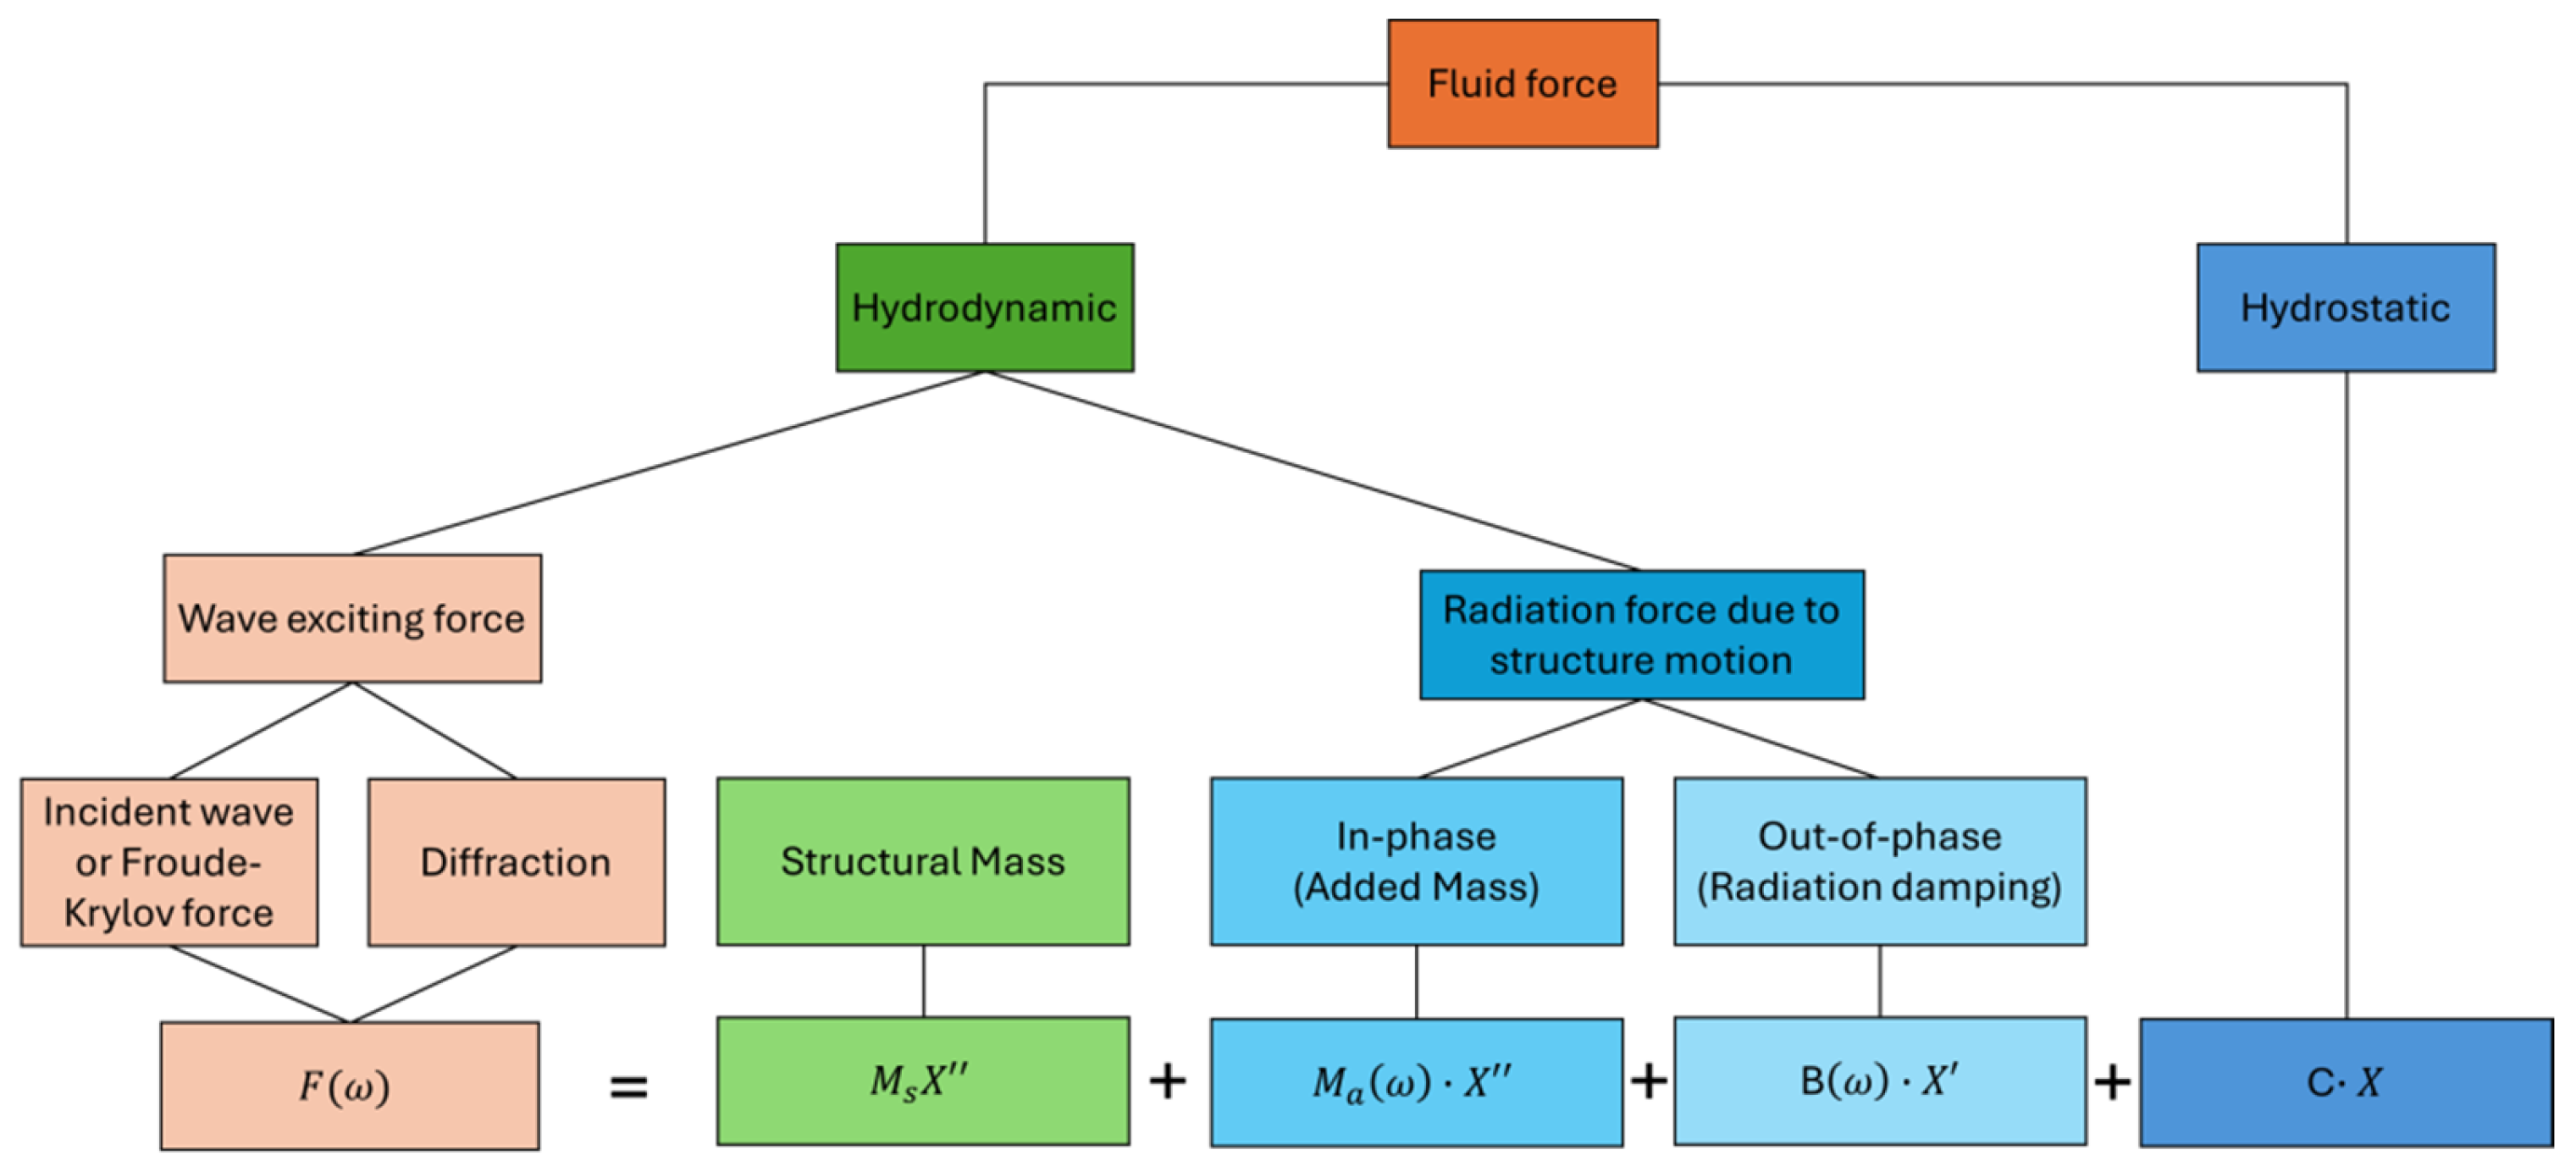
ANSYS AQWA, a hydrodynamic analysis software is used for modeling various applications such as floating structures, ships, FPSOs and FOWTs. It employs boundary element and finite element boundary methods to deal with potential flow problems. In its calculations, AQWA assumes the fluid is homogeneous, incompressible, inviscid, and irrotational, following the governing equation as Laplace equation. The software utilizes a three-dimensional Green’s function source distribution method and three-dimensional radiation and diffraction theory to compute first or second-order wave forces, added mass, radiation damping, and hydrostatic stiffness of the floating structure. This overview is based on the theoretical framework presented in the ANSYS AQWA Theory Manual (2021 R1), as shown in
Figure 4.
2.4. Orcina OrcaFlex
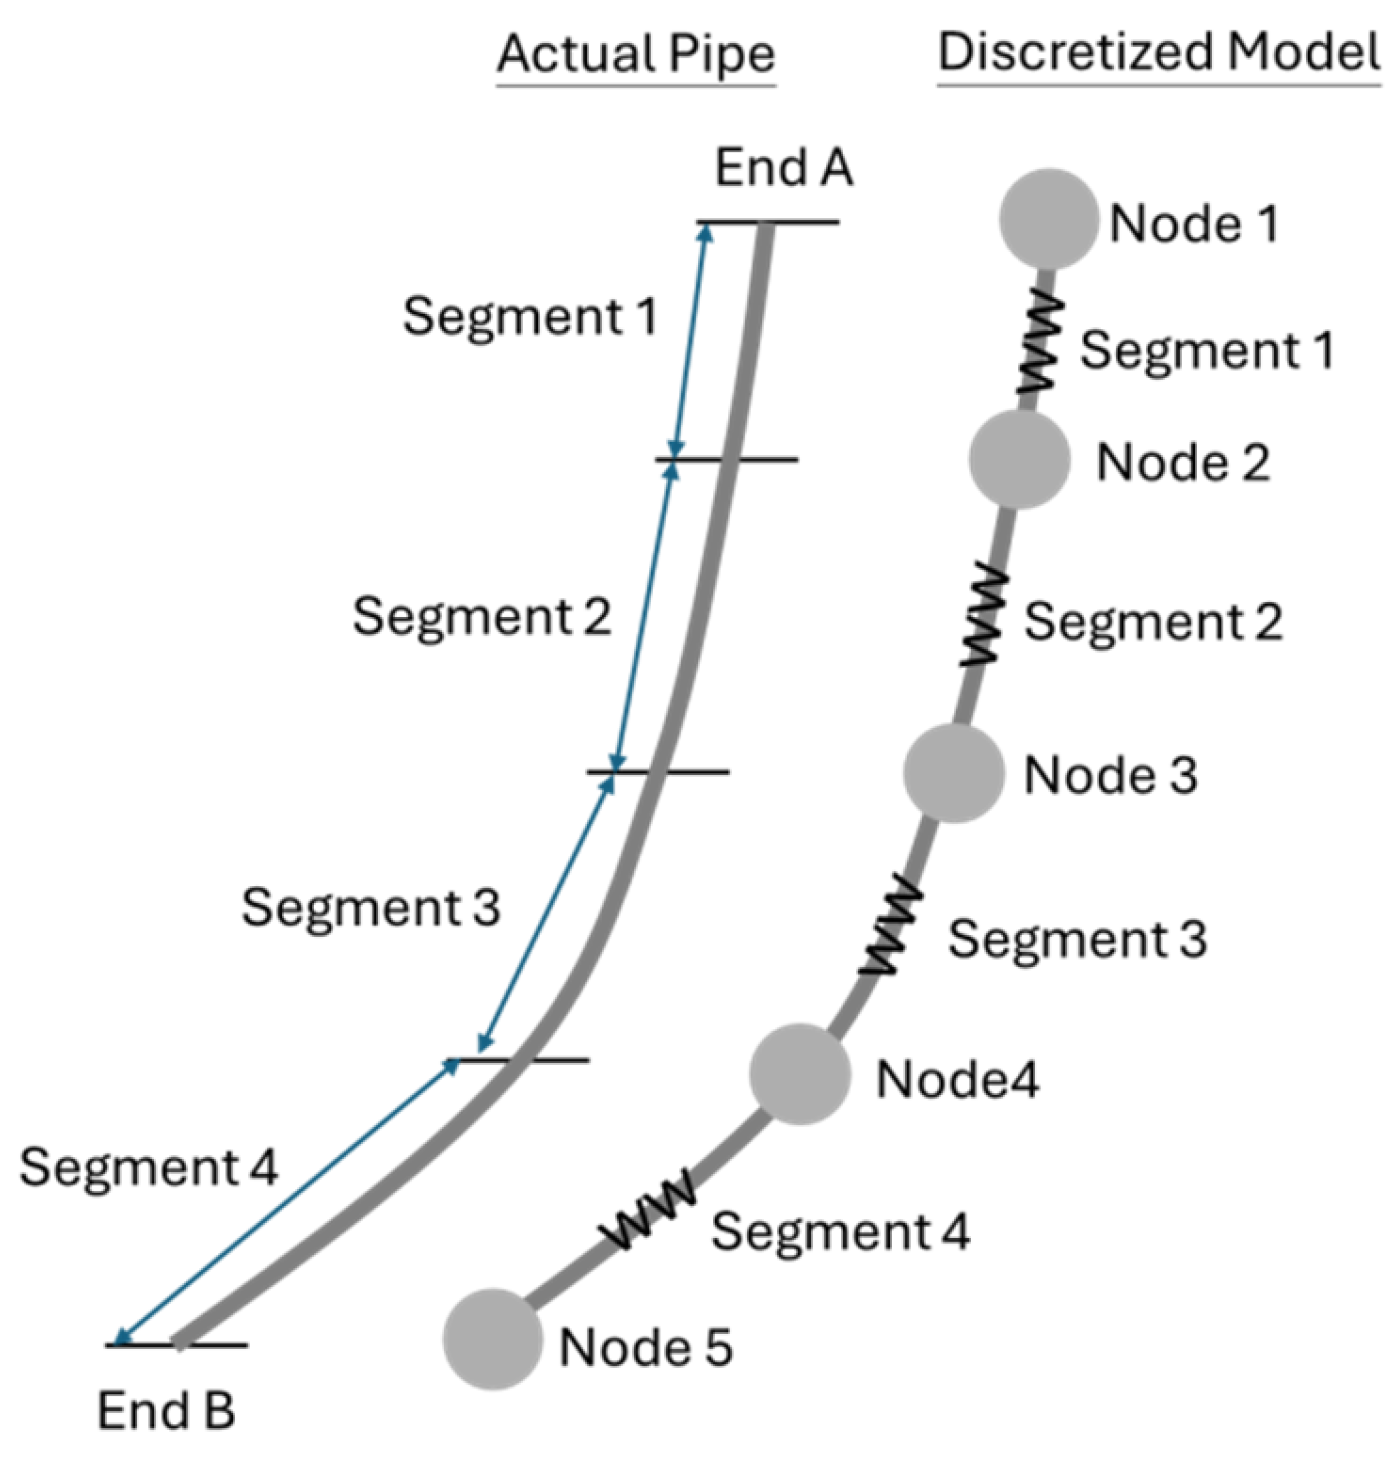
OrcaFlex, a dynamic analysis software developed by Orcina, finds widespread use in various industries such as oil & gas, wet renewables, oceanography, seismic studies, defense, and aquaculture. Tests conducted in OrcaFlex cover a range of applications, including riser systems, mooring performance, pipelay and pipelines, towed systems, cable structures, and earthquake loading.
OrcaFlex calculates the wind thrust on the wind turbine using the Boundary Element Method (BEM), computes the wave forces using hydrodynamic parameters imported from Ansys AQWA, and determines the drag force using the drag coefficient.The floater’s motion and the tension on the mooring and suspension lines under various climatic circumstances are simulated by means of wind-wave-current coupling.
This study employs OrcaFlex to analyze the designs of the floating platform, mooring system, and counterweight suspension system. However, OrcaFlex lacks the capability to calculate three-dimensional diffraction and radiation in hydrodynamics. Therefore, we first conduct these hydrodynamic calculations in ANSYS AQWA and then import the results into OrcaFlex for further analysis.
Due to the diameter of the mooring and suspension lines being much smaller than the wavelength, they are considered small structural elements. Therefore, in OrcaFlex, the Morison equation is used, and the mooring and suspended lines are modeled using a finite element approach known as the lumped mass method (as shown in
Figure 5).
2.5. Turbsim
TurbSim (Turbulence Simulation) is a wind field simulation tool developed by the National Renewable Energy Laboratory (NREL) for generating wind speed time series to simulate the variation of wind speeds in a wind field.
This study follows the IEC 61400-1 standard and utilizes the IEC Kaimal model along with the design conditions specified in DNV-ST-0437. For extreme conditions, the EWM is applied, whereas the NTM is used for operational conditions.
2.6. Fatigue Analysis
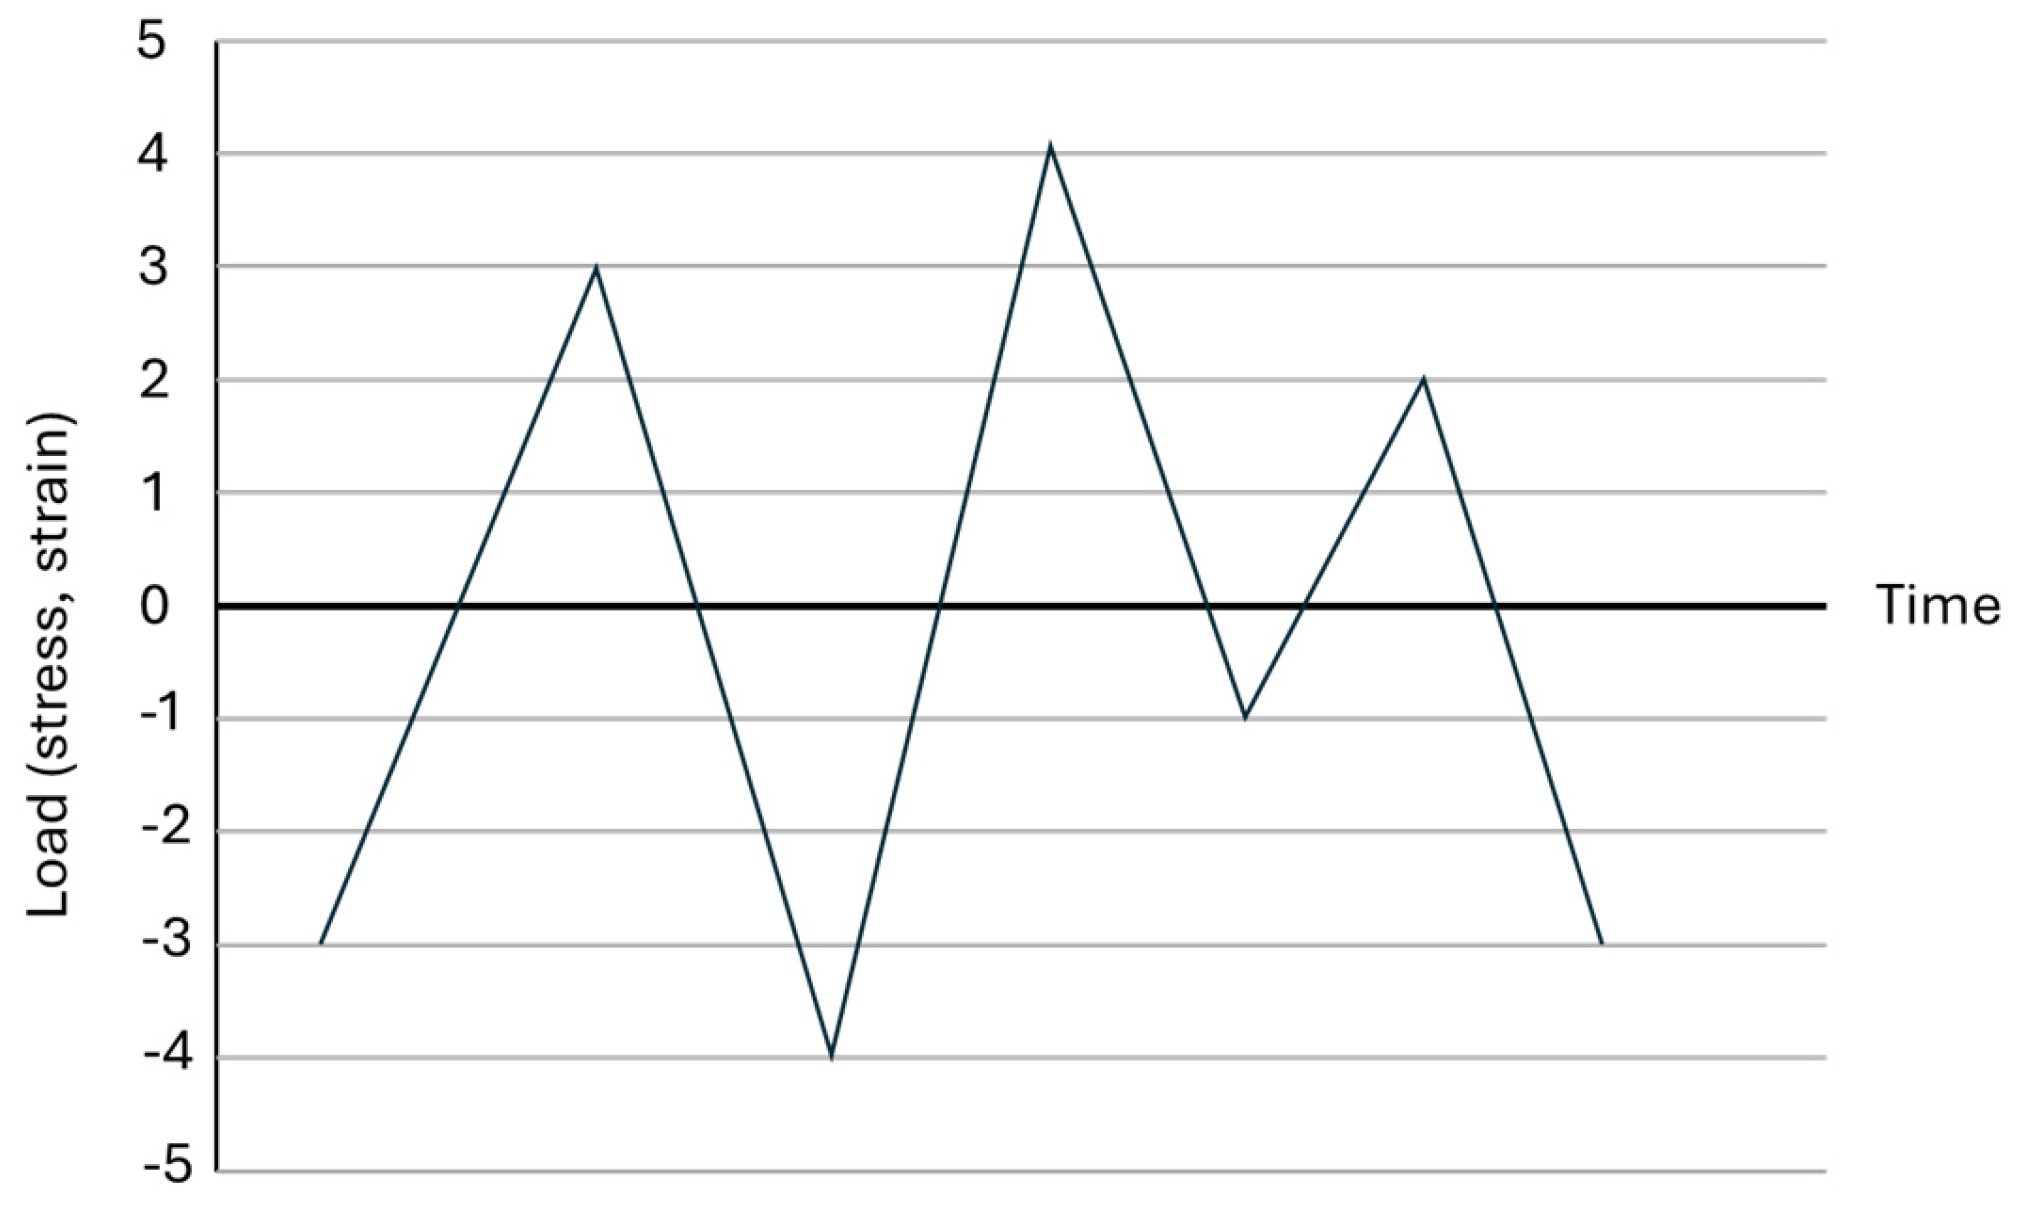
Mooring systems and suspension systems are subjected to continuous cyclic loading from metocean conditions. According to API RP 2SK, this study utilizes Palmgren-Miner’s rule in conjunction with the rainflow counting method.
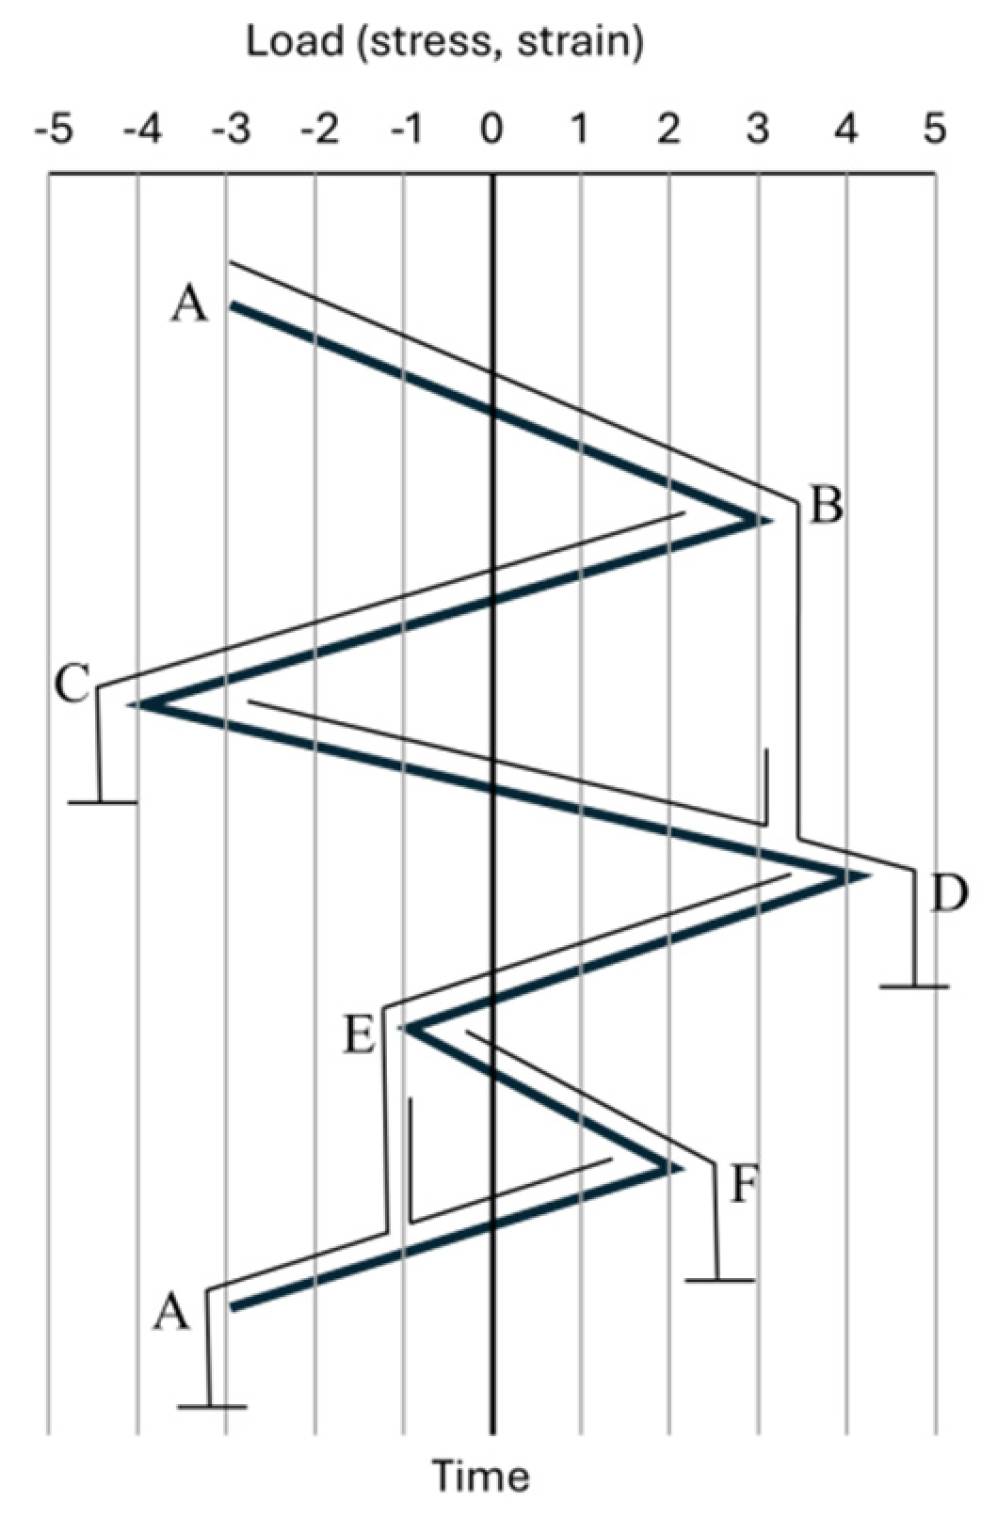
Figure 6 depicts the amplitude of mooring loading in the random variable load-time domain, while
Figure 7 illustrates the rainflow cycle counting method. It is assumed that the uniaxial cycle counting method is employed for each load, and fatigue damage is calculated as follows:
where
is number of cycles of operation,
is the total number of cycles that produces failure at that stress level.
After that, the characteristic cumulative damage
can be defined as the sum of all damages over a total of
blocks.
The event of failure is defined as ≥ 1.0
The American Petroleum Institute (API) established a standard (API RP 2SK, 2005) that outlines the tension range linked to the fatigue life of each mooring component. In 2008, API introduced the T-N curve for mooring lines, which expresses the number of cycles to failure and the corresponding tension range as follows:
which can also be given as:
where
is defined as fatigue mechanism occurs after a certain number of cycles,
is tension range,
intercept parameter of the curve,
is the reference breaking strength, and m is the slope of T-N curve.
2.7. Dynamic Response and Mooring System Criteria
To ensure the stability and safety of the floating platform under extreme and operational conditions, DNV-ST-0119 provides mooring system design specifications, DNV-RP-0286 presents guidelines for the dynamic response of the floating platform, and COREWIND D2.1 provides maximum surge offset requirement.
Mooring system design criteria (DNV-ST-0119)
For the mooring system, the design criteria are based on the Ultimate Limit State (ULS) (50-year return period sea state) and the Accidental Limit State (ALS). The following is a description of the mooring design specifications.
The design tension
in a mooring line is the sum of two factored characteristic tension components
and
in which
is characteristic mean tension,
is characteristic dynamic tension, and
and
are load factors given in
Table 2.
The characteristic capacity of the body of the mooring line
may be obtained from the minimum breaking strength
of new components as:
The design criteria in the ULS and ALS are:
The above is the design criteria of the mooring system made of chain. Tension level of fibers should not exceed 70% MBS in ULS.
Ultimate and Serviceability Limit State values (DNV-RP-0286)
In DNV-RP-0286, there are criteria during operational load cases and non-operational load cases.
- -
-
max. tilt at tower top during operational load cases e.g., DLC 1.2, 1.6 (SLS):
- -
permanent value: 0.5 degrees
- -
mean value in the time series: 5 degrees
- -
max. value in the time series: 10 degrees
- -
max. tilt at tower top during non-operational cases e.g., DLC 6.1, 6.2 (ULS): 15 degrees
- -
max. acceleration at tower top during operational cases e.g., DLC 1.2, 1.6 (SLS): 0.3g
- -
max. acceleration at tower top during non-operational cases e.g., DLC 6.1, 6.2 (ULS): 0.6g
COREWIND D2.1 noted that the maximum surge offset is 30 m under 100 meters water depth.
To summarize the above criteria, the following criteria will be verified in this study (as shown in
Table 3).
Fatigue Limit State criteria (DNV-ST-0119)
In DNV-ST-0119, the design cumulative damage
is obtained by multiplying the characteristic cumulative damage
by the design fatigue factor
(as shown in
Table 4).
The design criteria in fatigue are
Figure 1.
Classification of floating platforms.
Figure 1.
Classification of floating platforms.
Figure 2.
Types of floating platforms.
Figure 2.
Types of floating platforms.
Figure 3.
Design concept of Suspensa OctaFloat.
Figure 3.
Design concept of Suspensa OctaFloat.
Figure 4.
Theoretical framework of Ansys AQWA.
Figure 4.
Theoretical framework of Ansys AQWA.
Figure 5.
Lumped mass method in OrcaFlex.
Figure 5.
Lumped mass method in OrcaFlex.
Figure 6.
Schematic diagram of load-time domain history.
Figure 6.
Schematic diagram of load-time domain history.
Figure 7.
Rainflow cycle counting method.
Figure 7.
Rainflow cycle counting method.
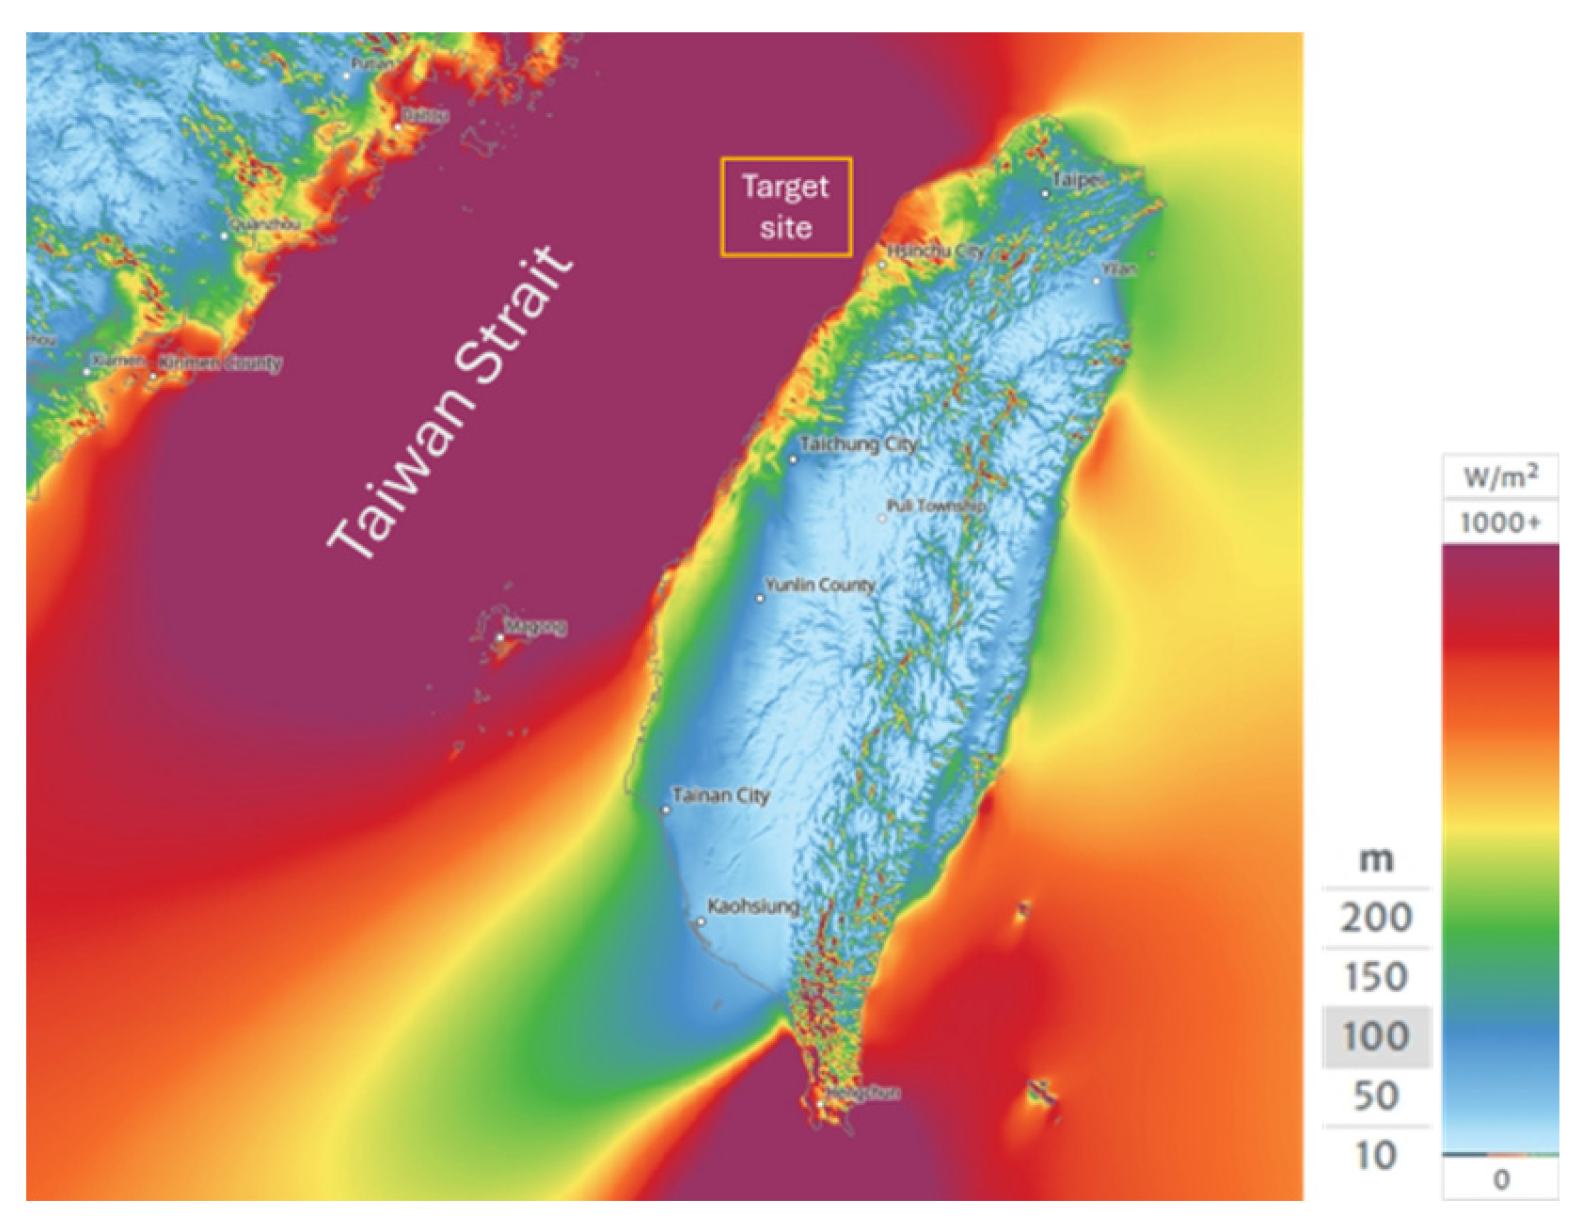
Figure 8.
Taiwan Wind Mean Power Density Map (Retrieve from: GLOBAL WIND ATLAS).
Figure 8.
Taiwan Wind Mean Power Density Map (Retrieve from: GLOBAL WIND ATLAS).
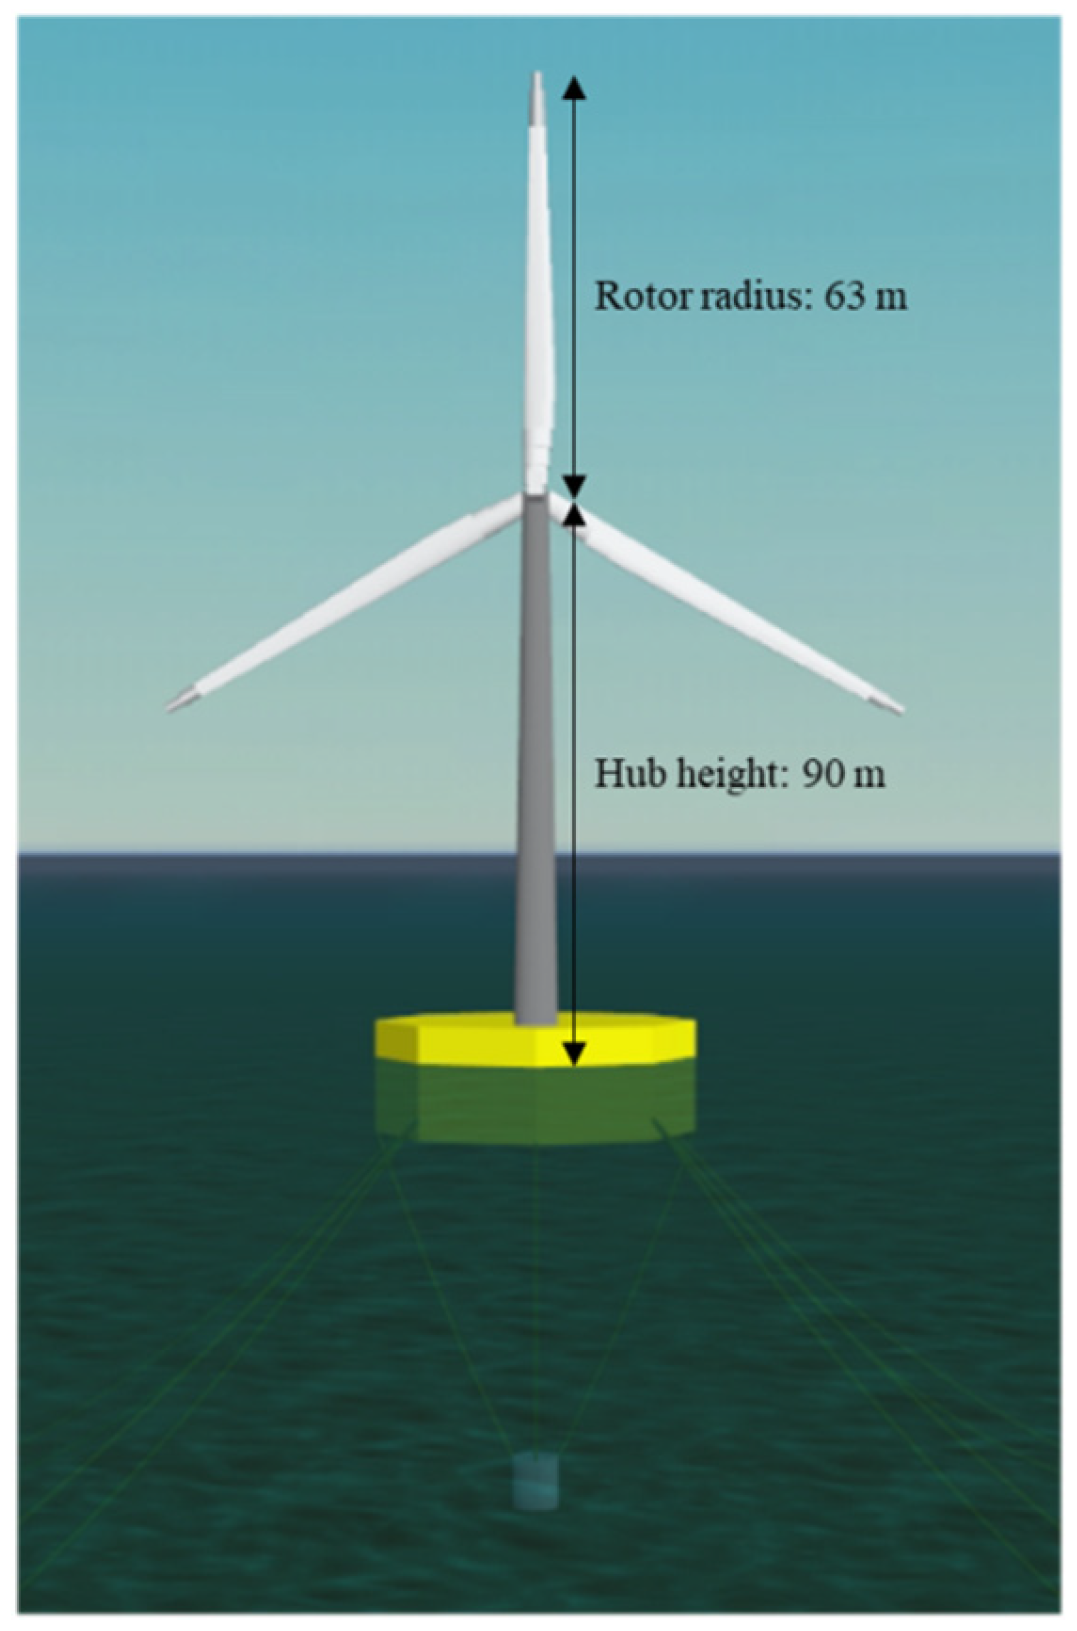
Figure 9.
NREL 5-MW Reference Wind Turbine.
Figure 9.
NREL 5-MW Reference Wind Turbine.
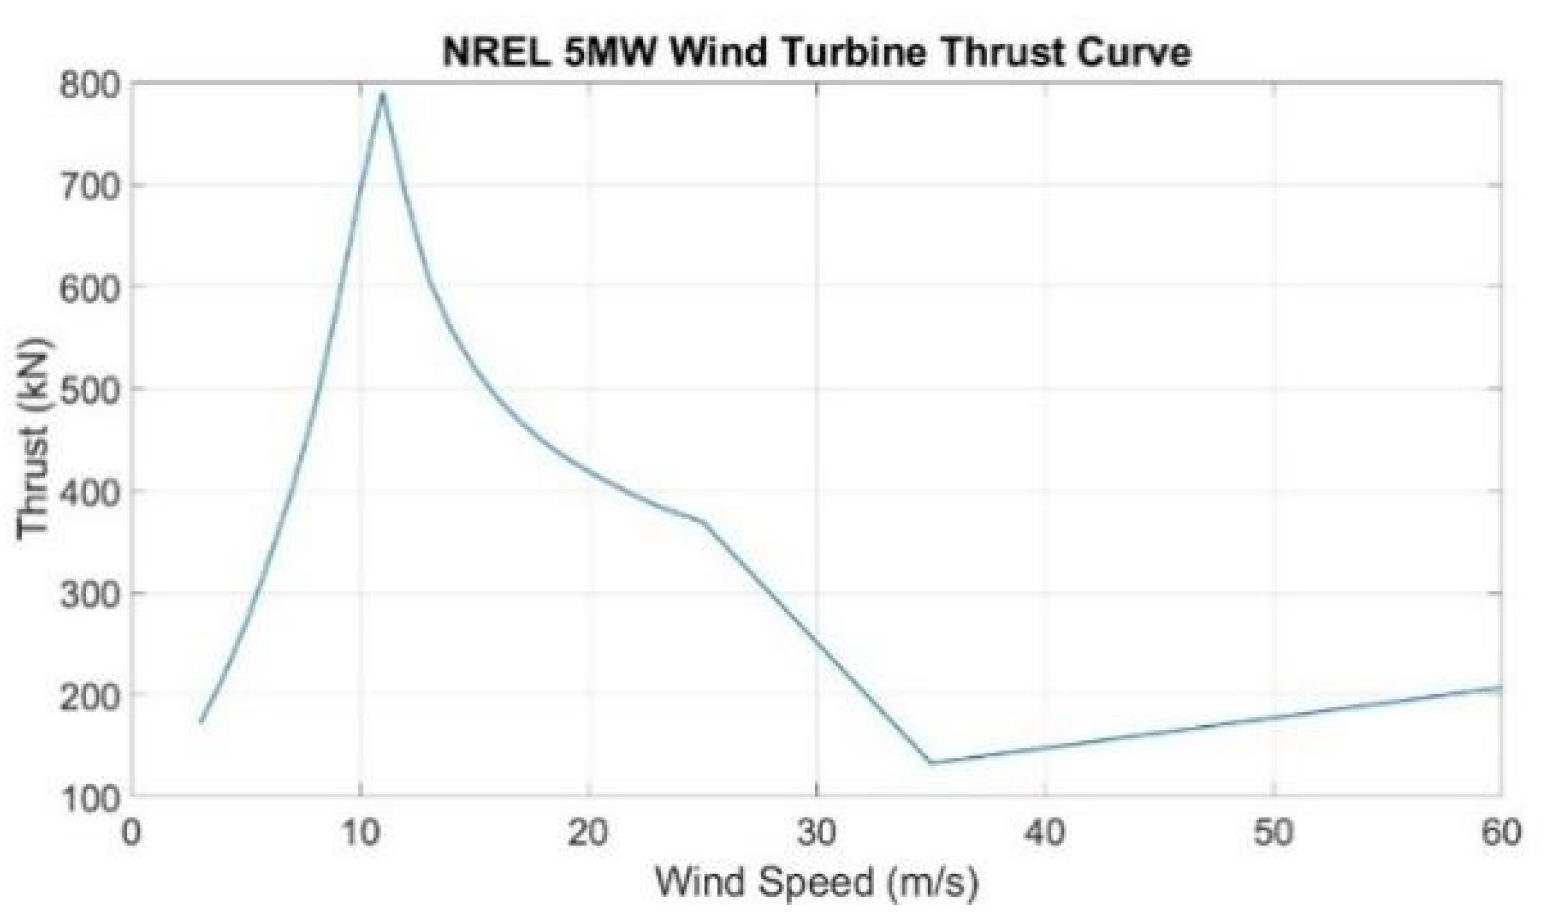
Figure 10.
NREL 5-MW Reference Wind Turbine Thrust Curve (right) (Resource: Chuang et al. (2021)).
Figure 10.
NREL 5-MW Reference Wind Turbine Thrust Curve (right) (Resource: Chuang et al. (2021)).
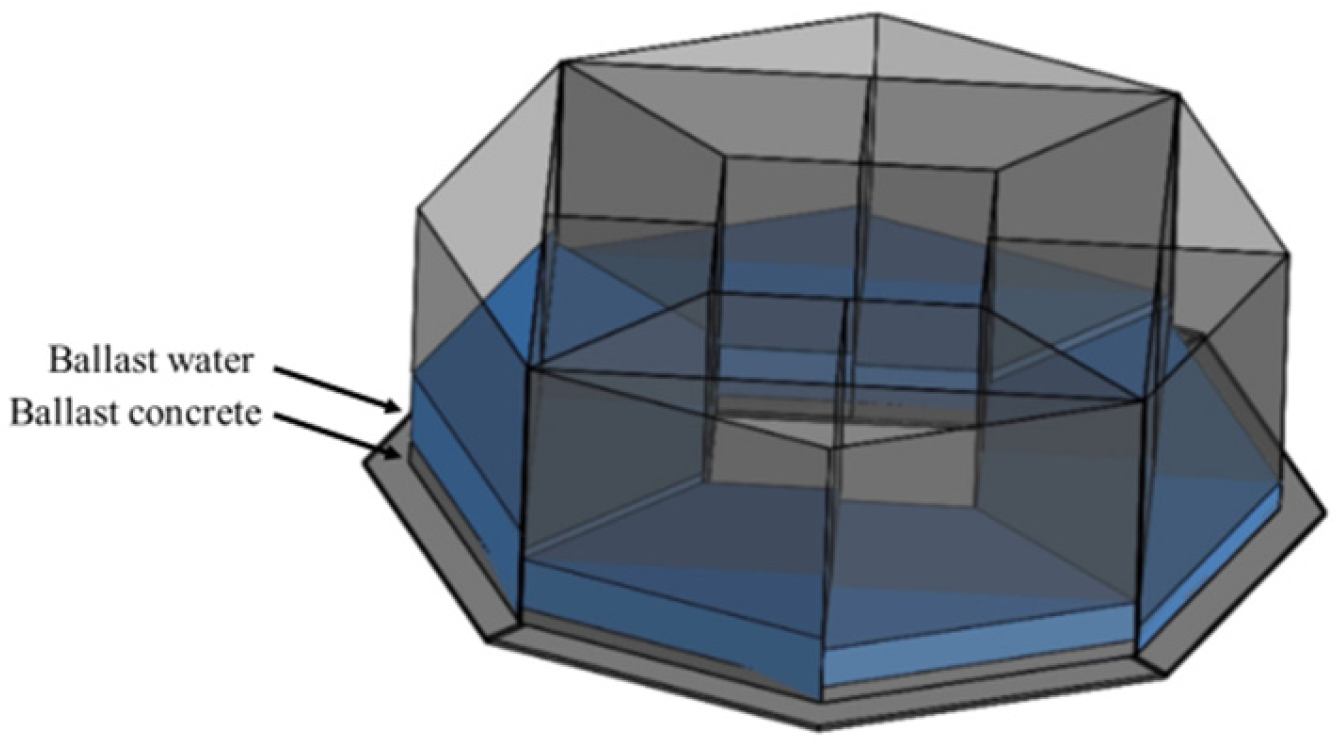
Figure 11.
SuspensaOctaFloat perspective view (including ballast).
Figure 11.
SuspensaOctaFloat perspective view (including ballast).
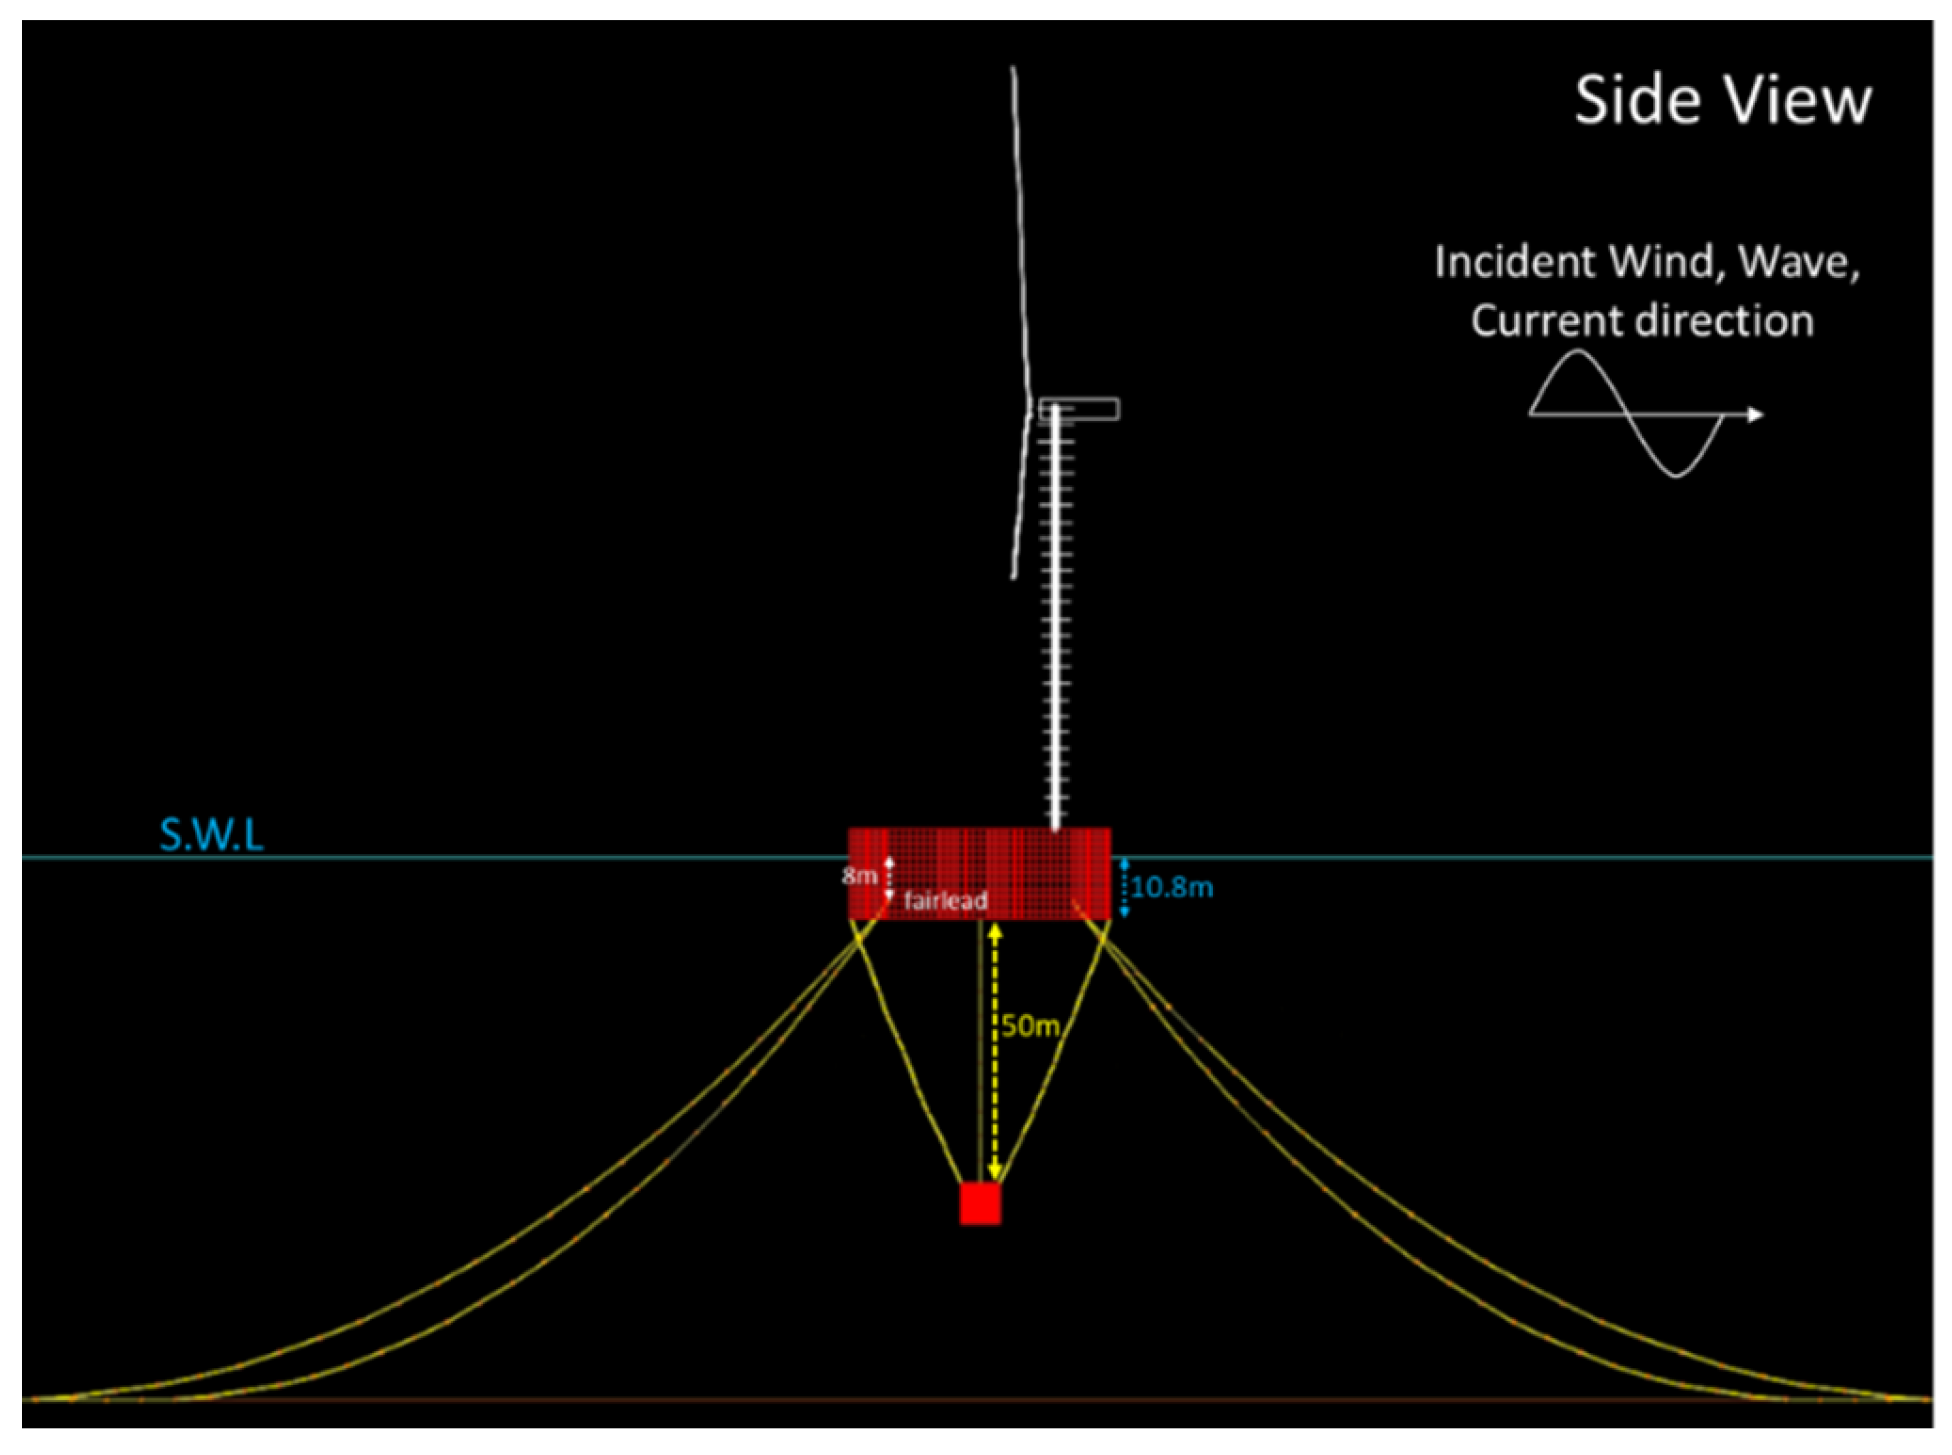
Figure 12.
Scale of Suspensa OctaFloat with NREL 5-MW wind turbine (side view).
Figure 12.
Scale of Suspensa OctaFloat with NREL 5-MW wind turbine (side view).
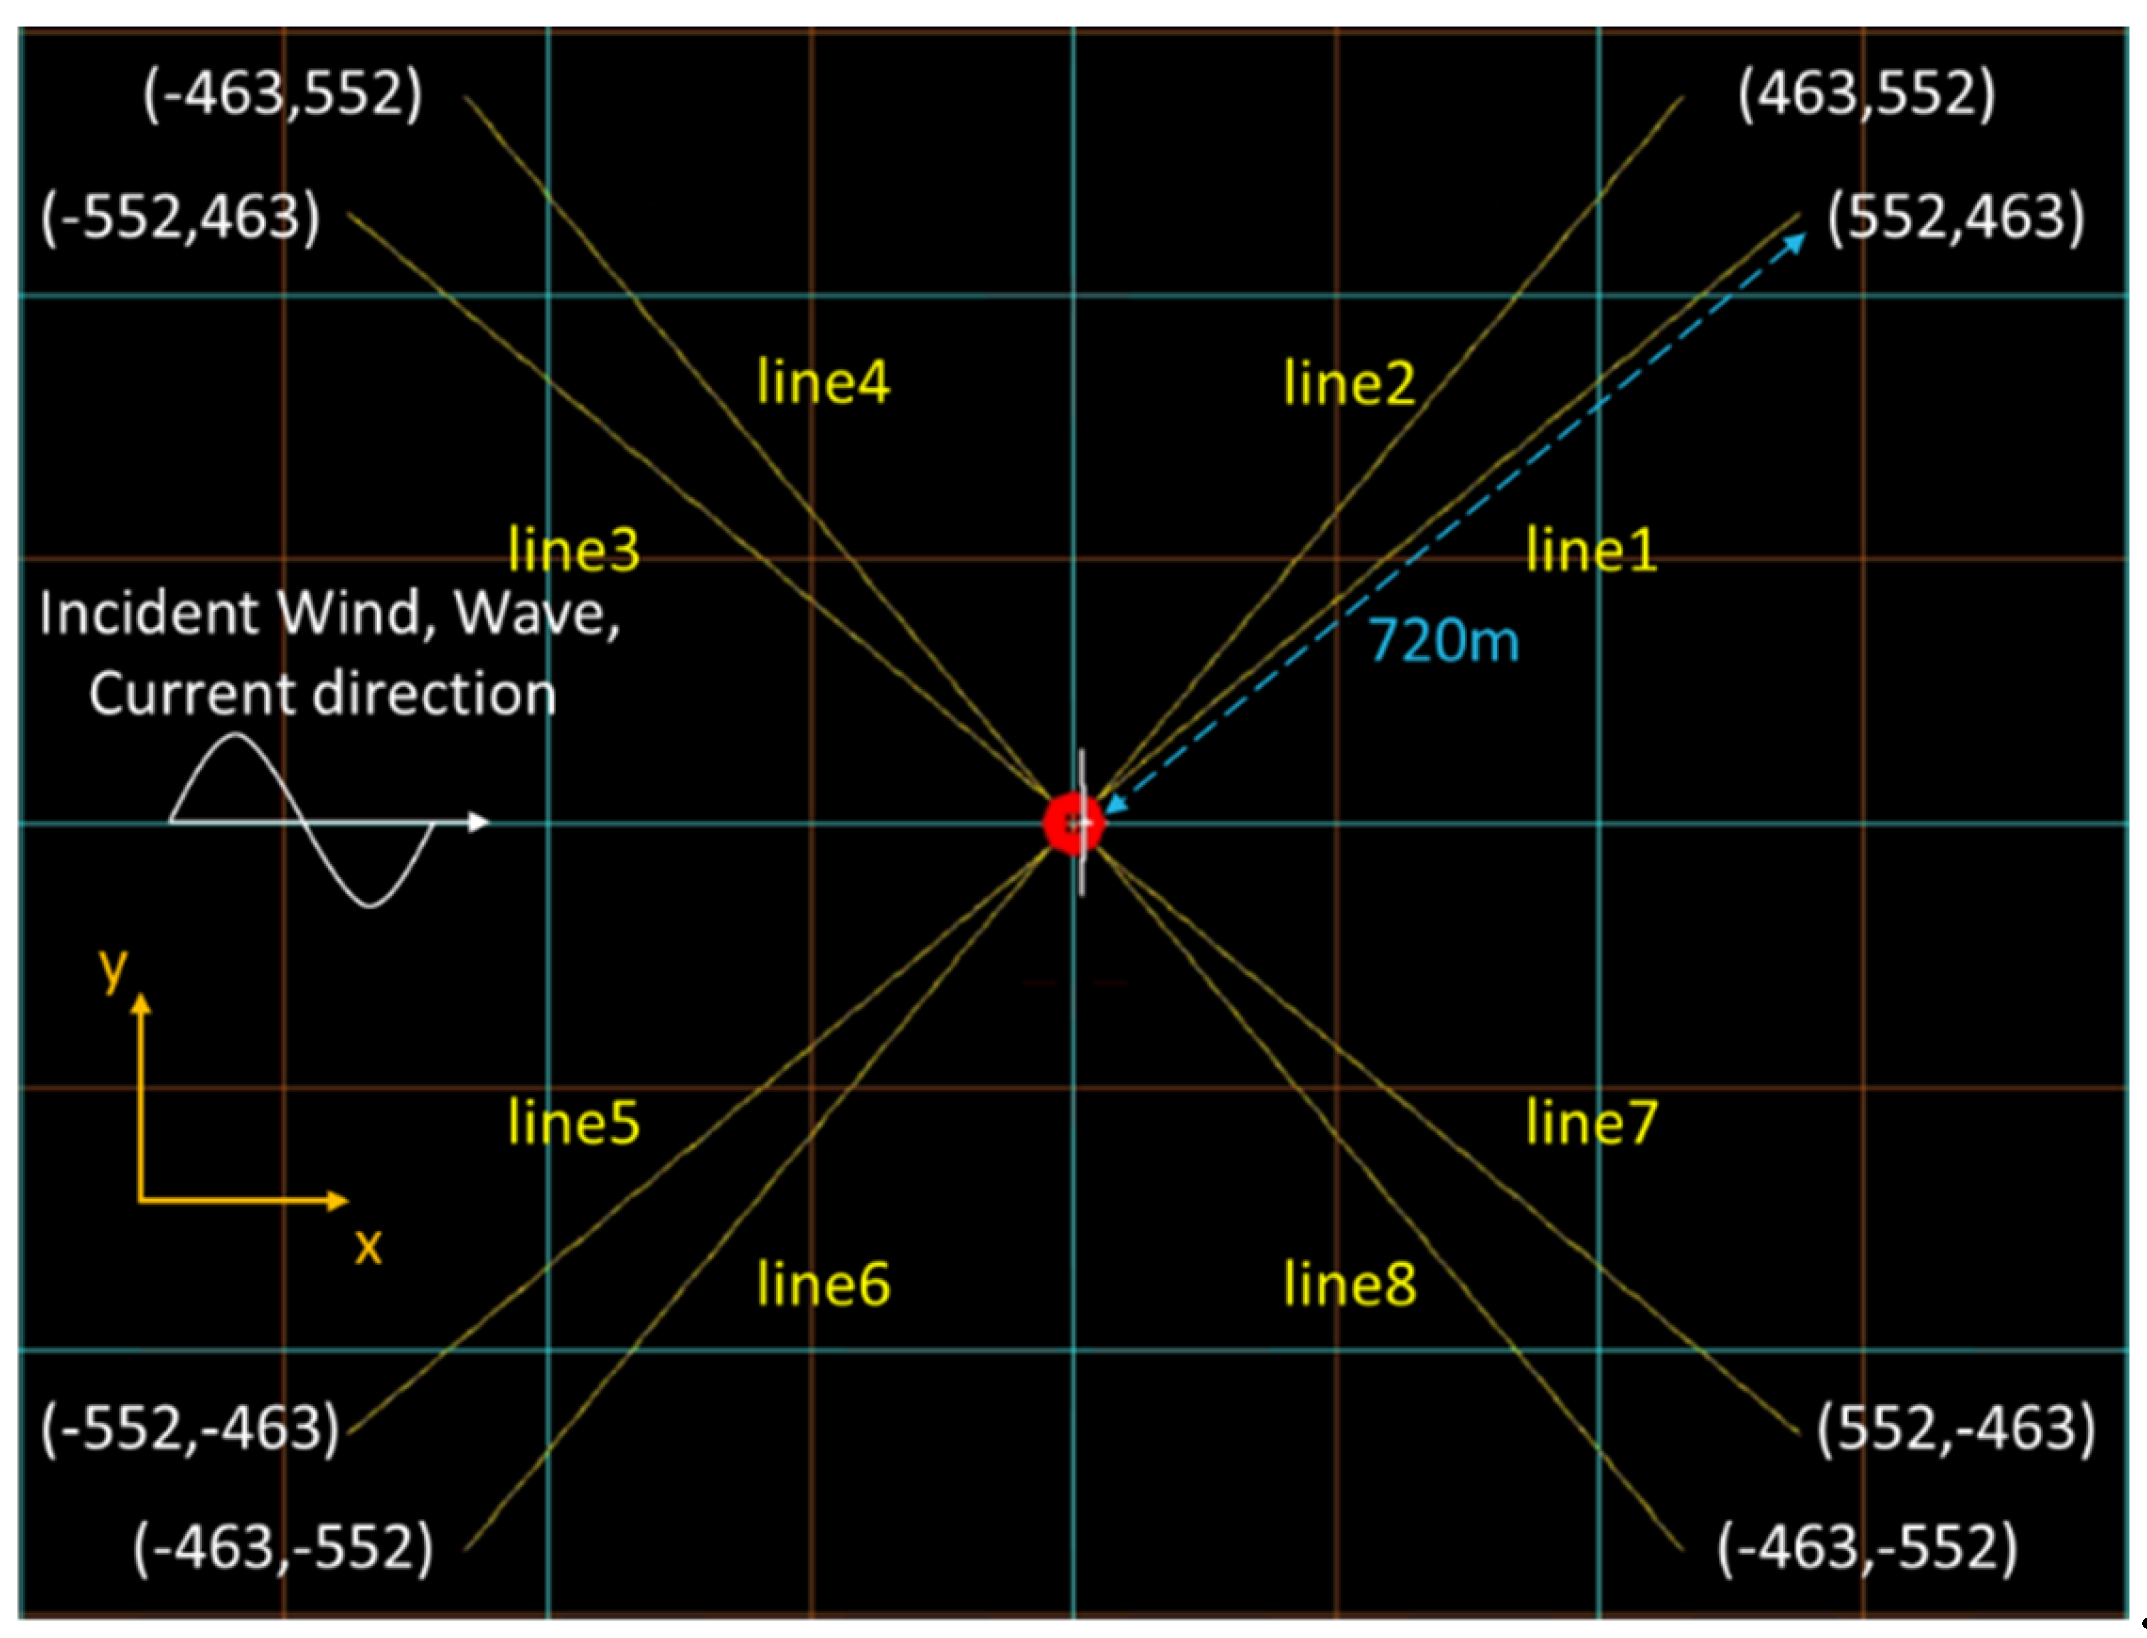
Figure 13.
4×2 Mooring system configuration in site Hsinchu (top view) (Unit: m).
Figure 13.
4×2 Mooring system configuration in site Hsinchu (top view) (Unit: m).
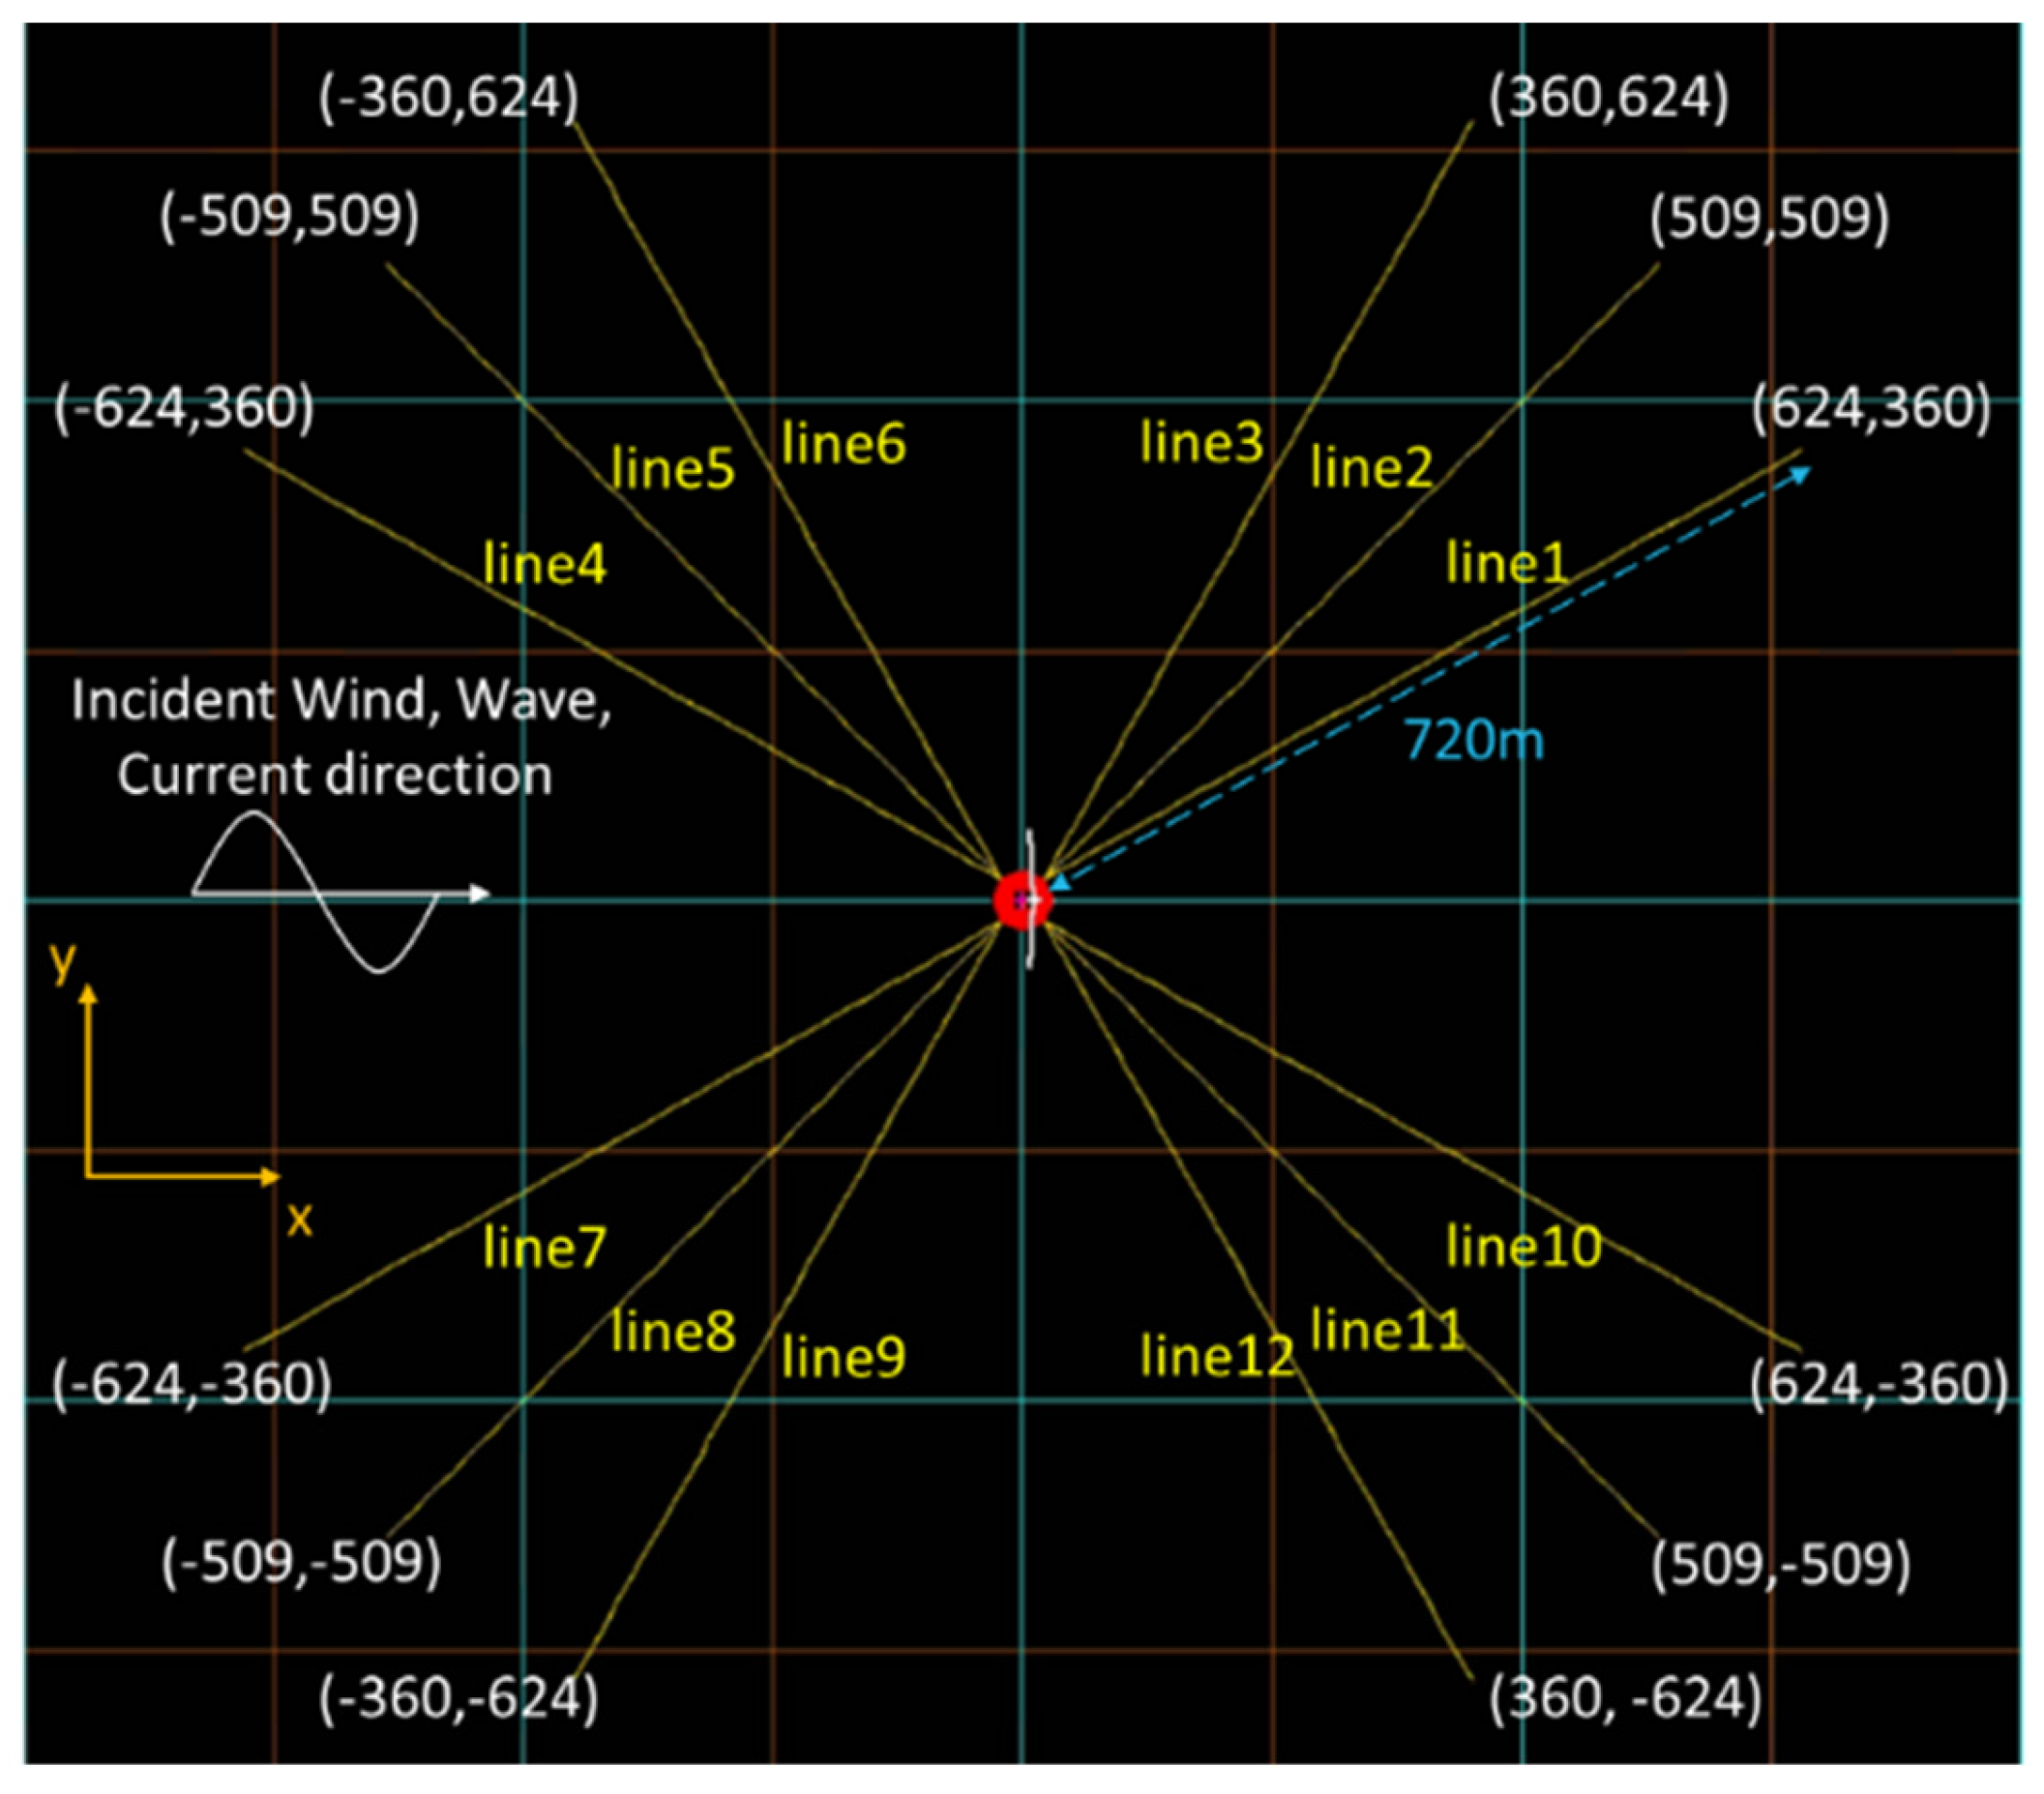
Figure 14.
4×3 Mooring system configuration in site Hsinchu (top view) (Unit: m).
Figure 14.
4×3 Mooring system configuration in site Hsinchu (top view) (Unit: m).
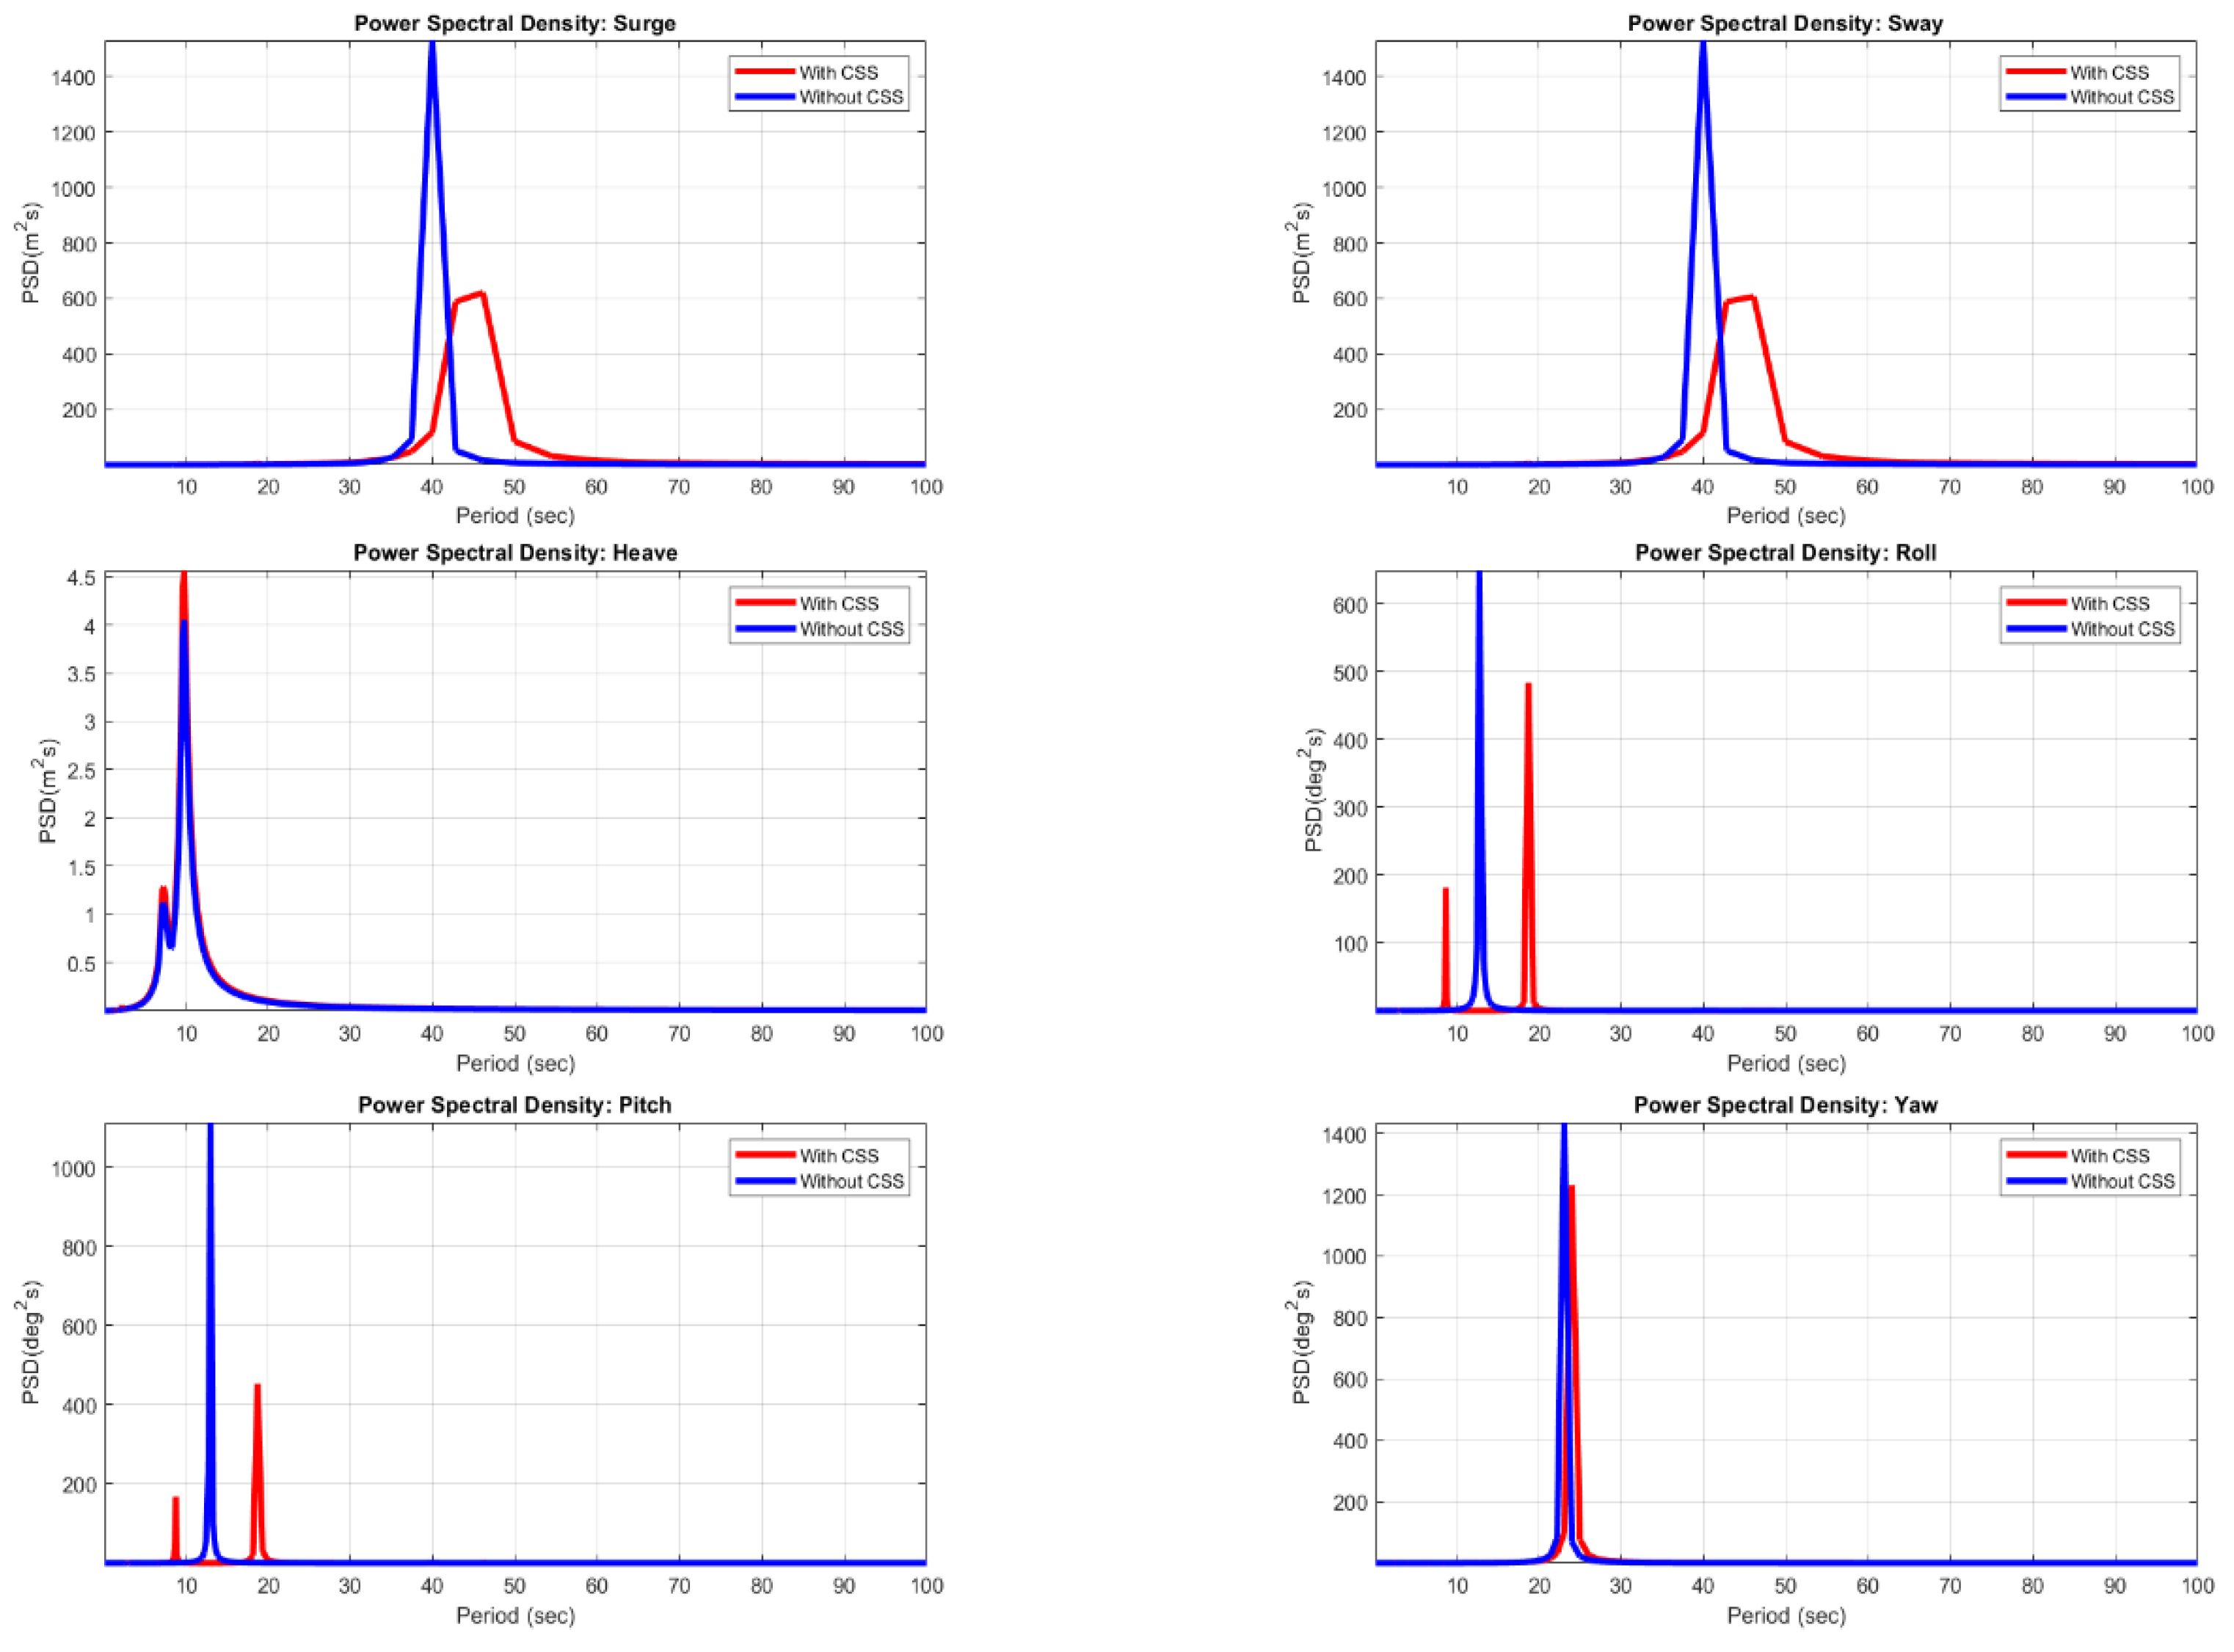
Figure 15.
Power spectral density for six degrees of freedom.
Figure 15.
Power spectral density for six degrees of freedom.
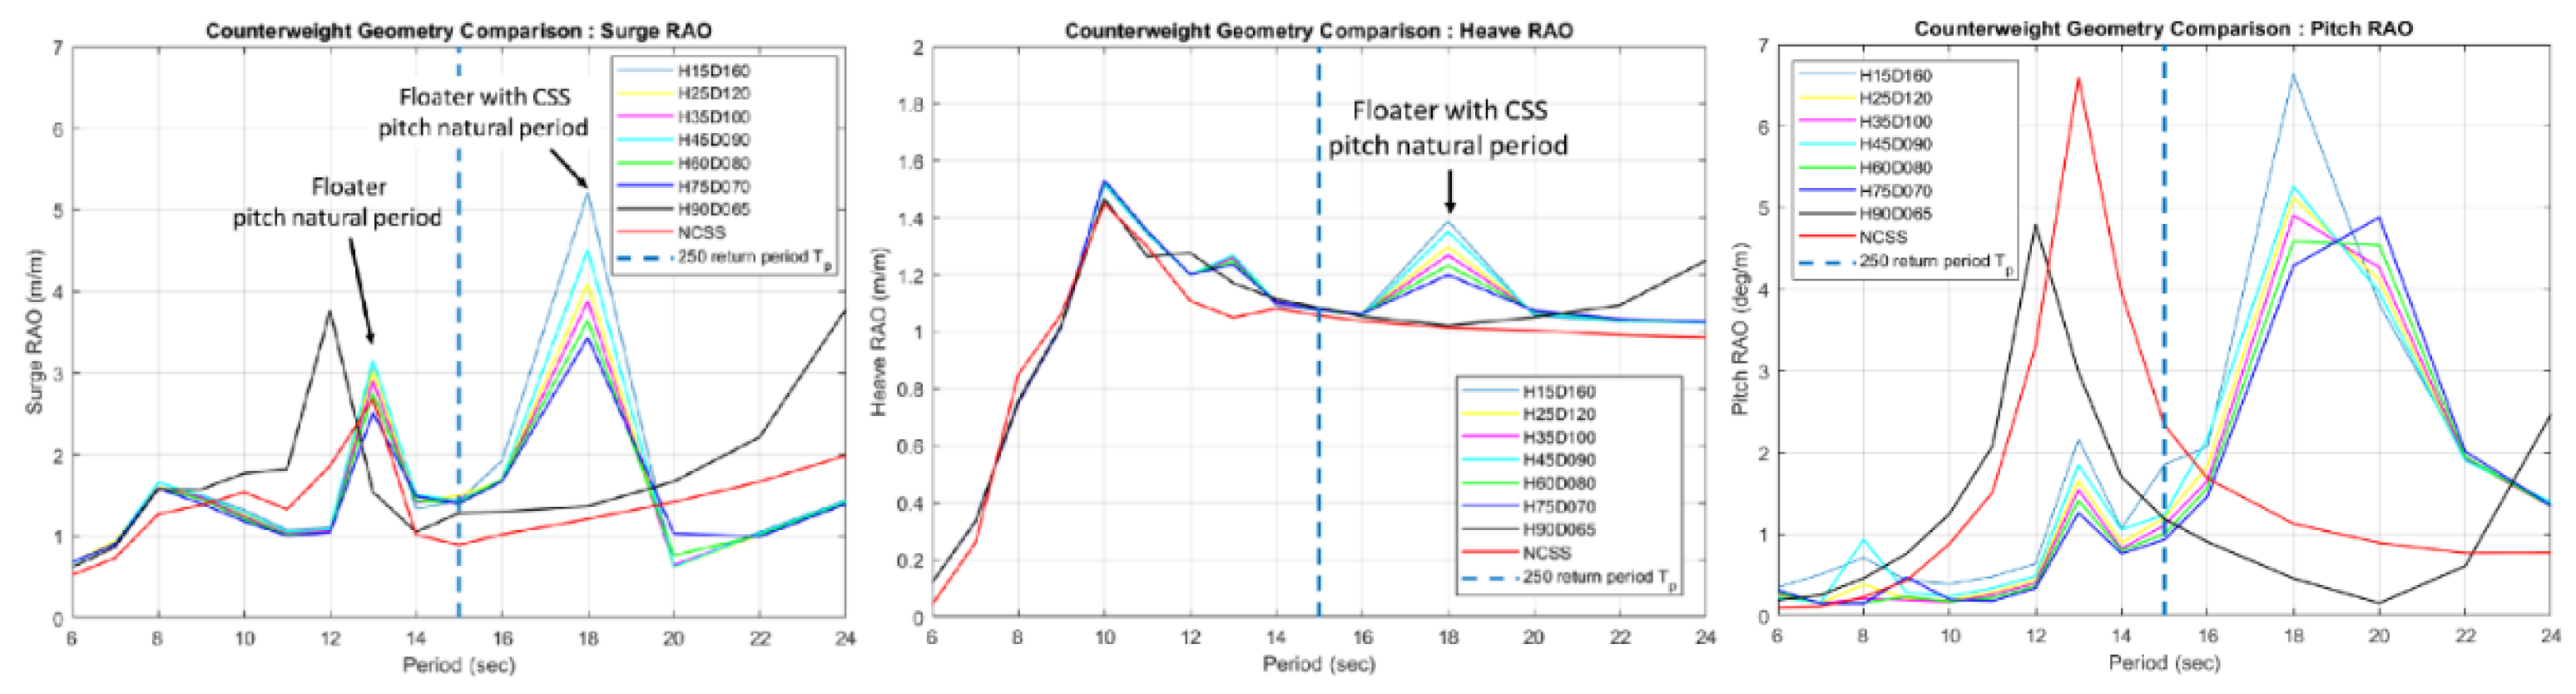
Figure 16.
Comparison of different counterweight geometries for surge, heave, and pitch DOFs.
Figure 16.
Comparison of different counterweight geometries for surge, heave, and pitch DOFs.
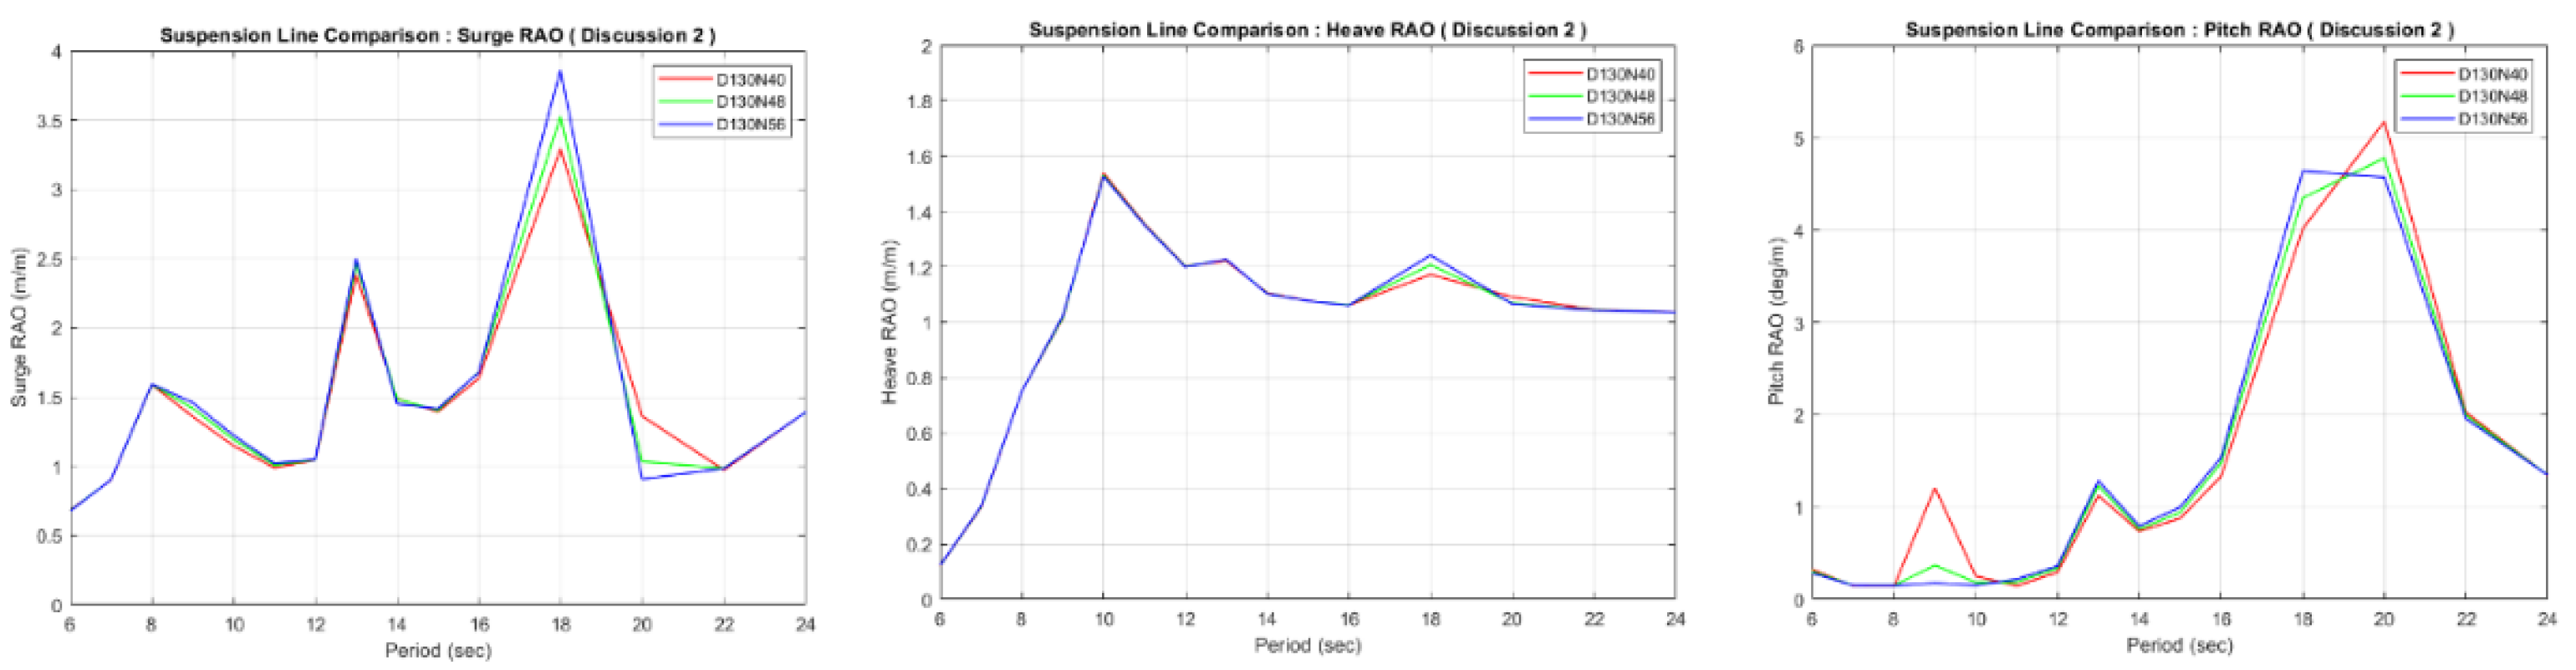
Figure 17.
Comparison of surge, heave, and pitch RAO at the same stiffness ratio.
Figure 17.
Comparison of surge, heave, and pitch RAO at the same stiffness ratio.
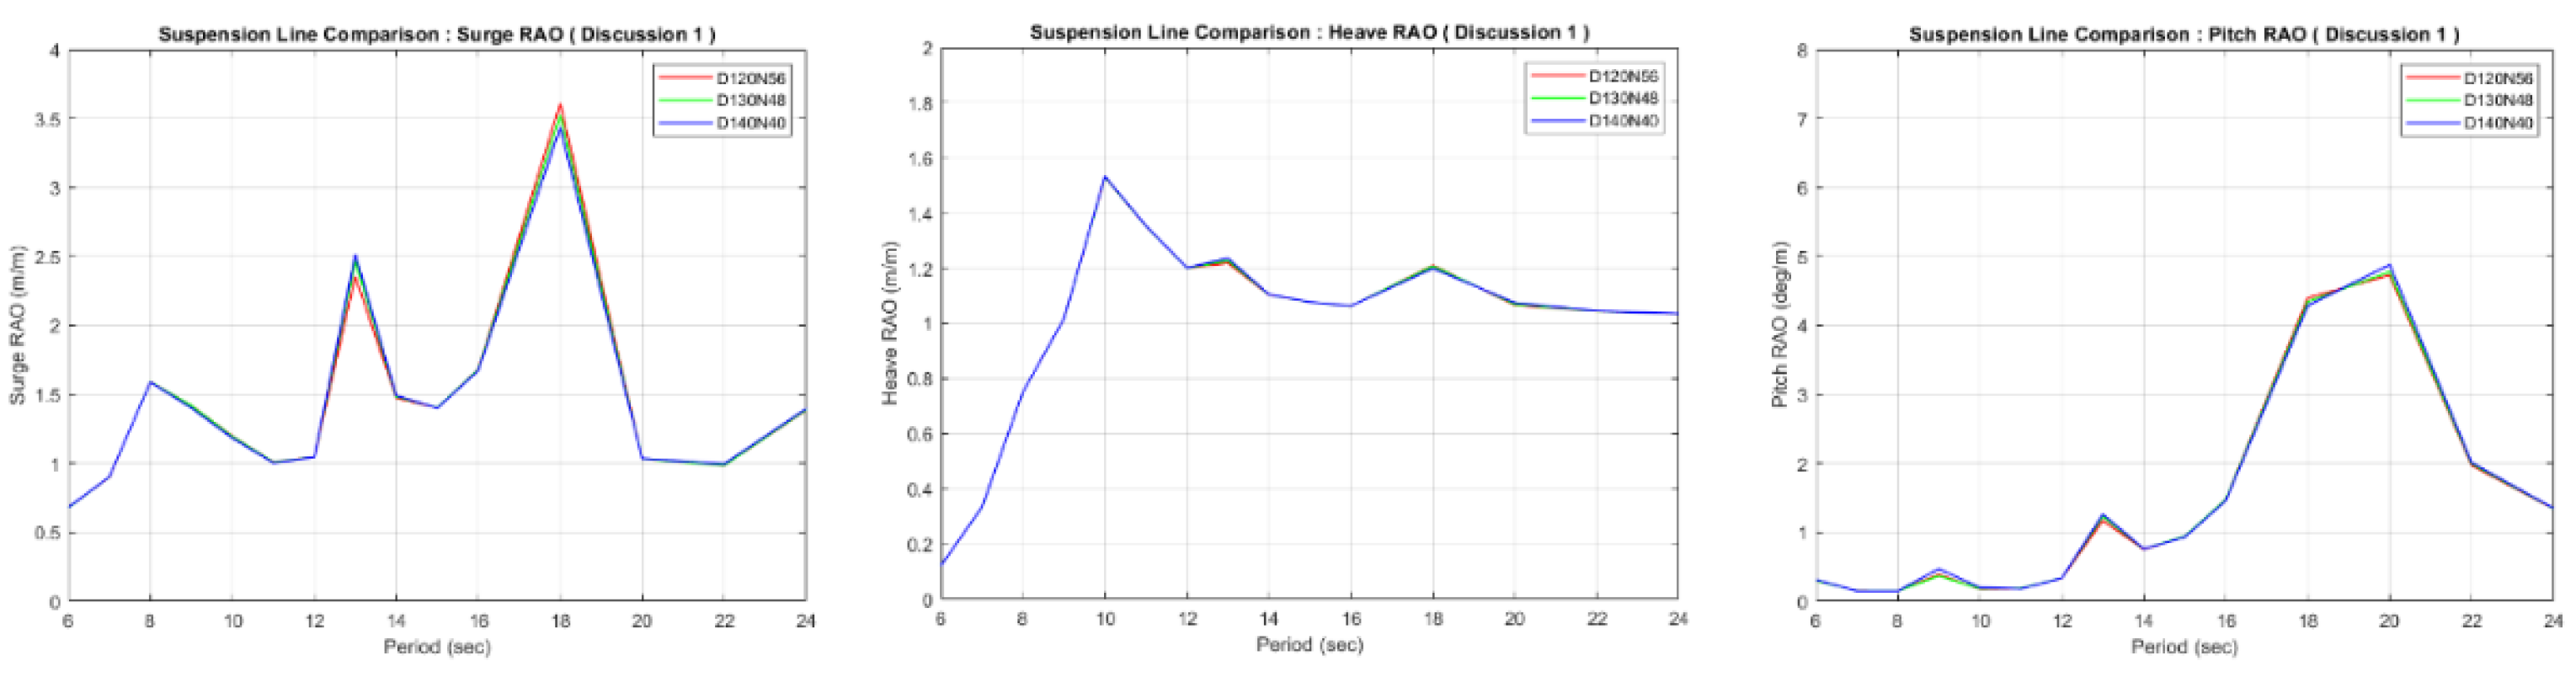
Figure 18.
Comparison of surge, heave, and pitch RAO at different stiffness ratios.
Figure 18.
Comparison of surge, heave, and pitch RAO at different stiffness ratios.
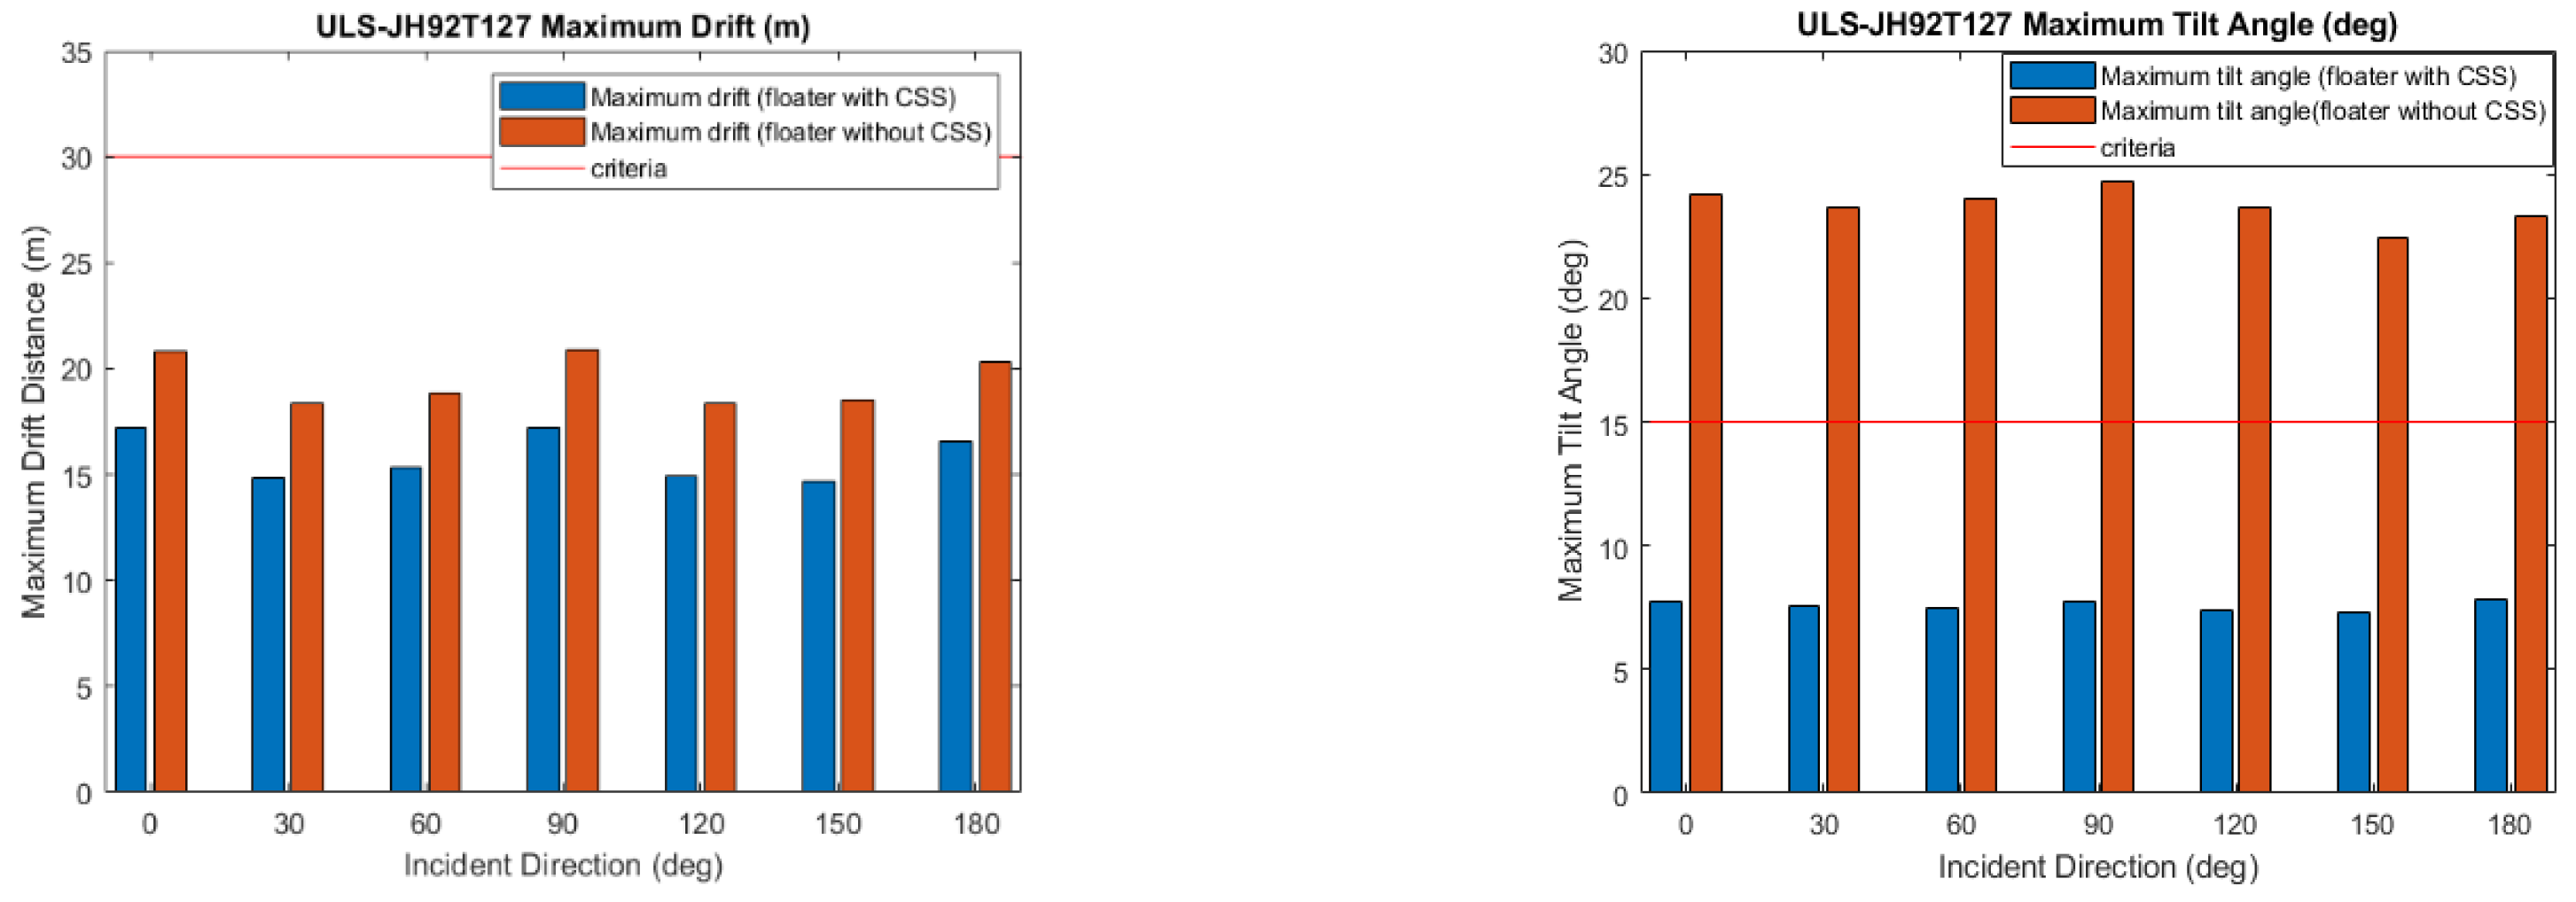
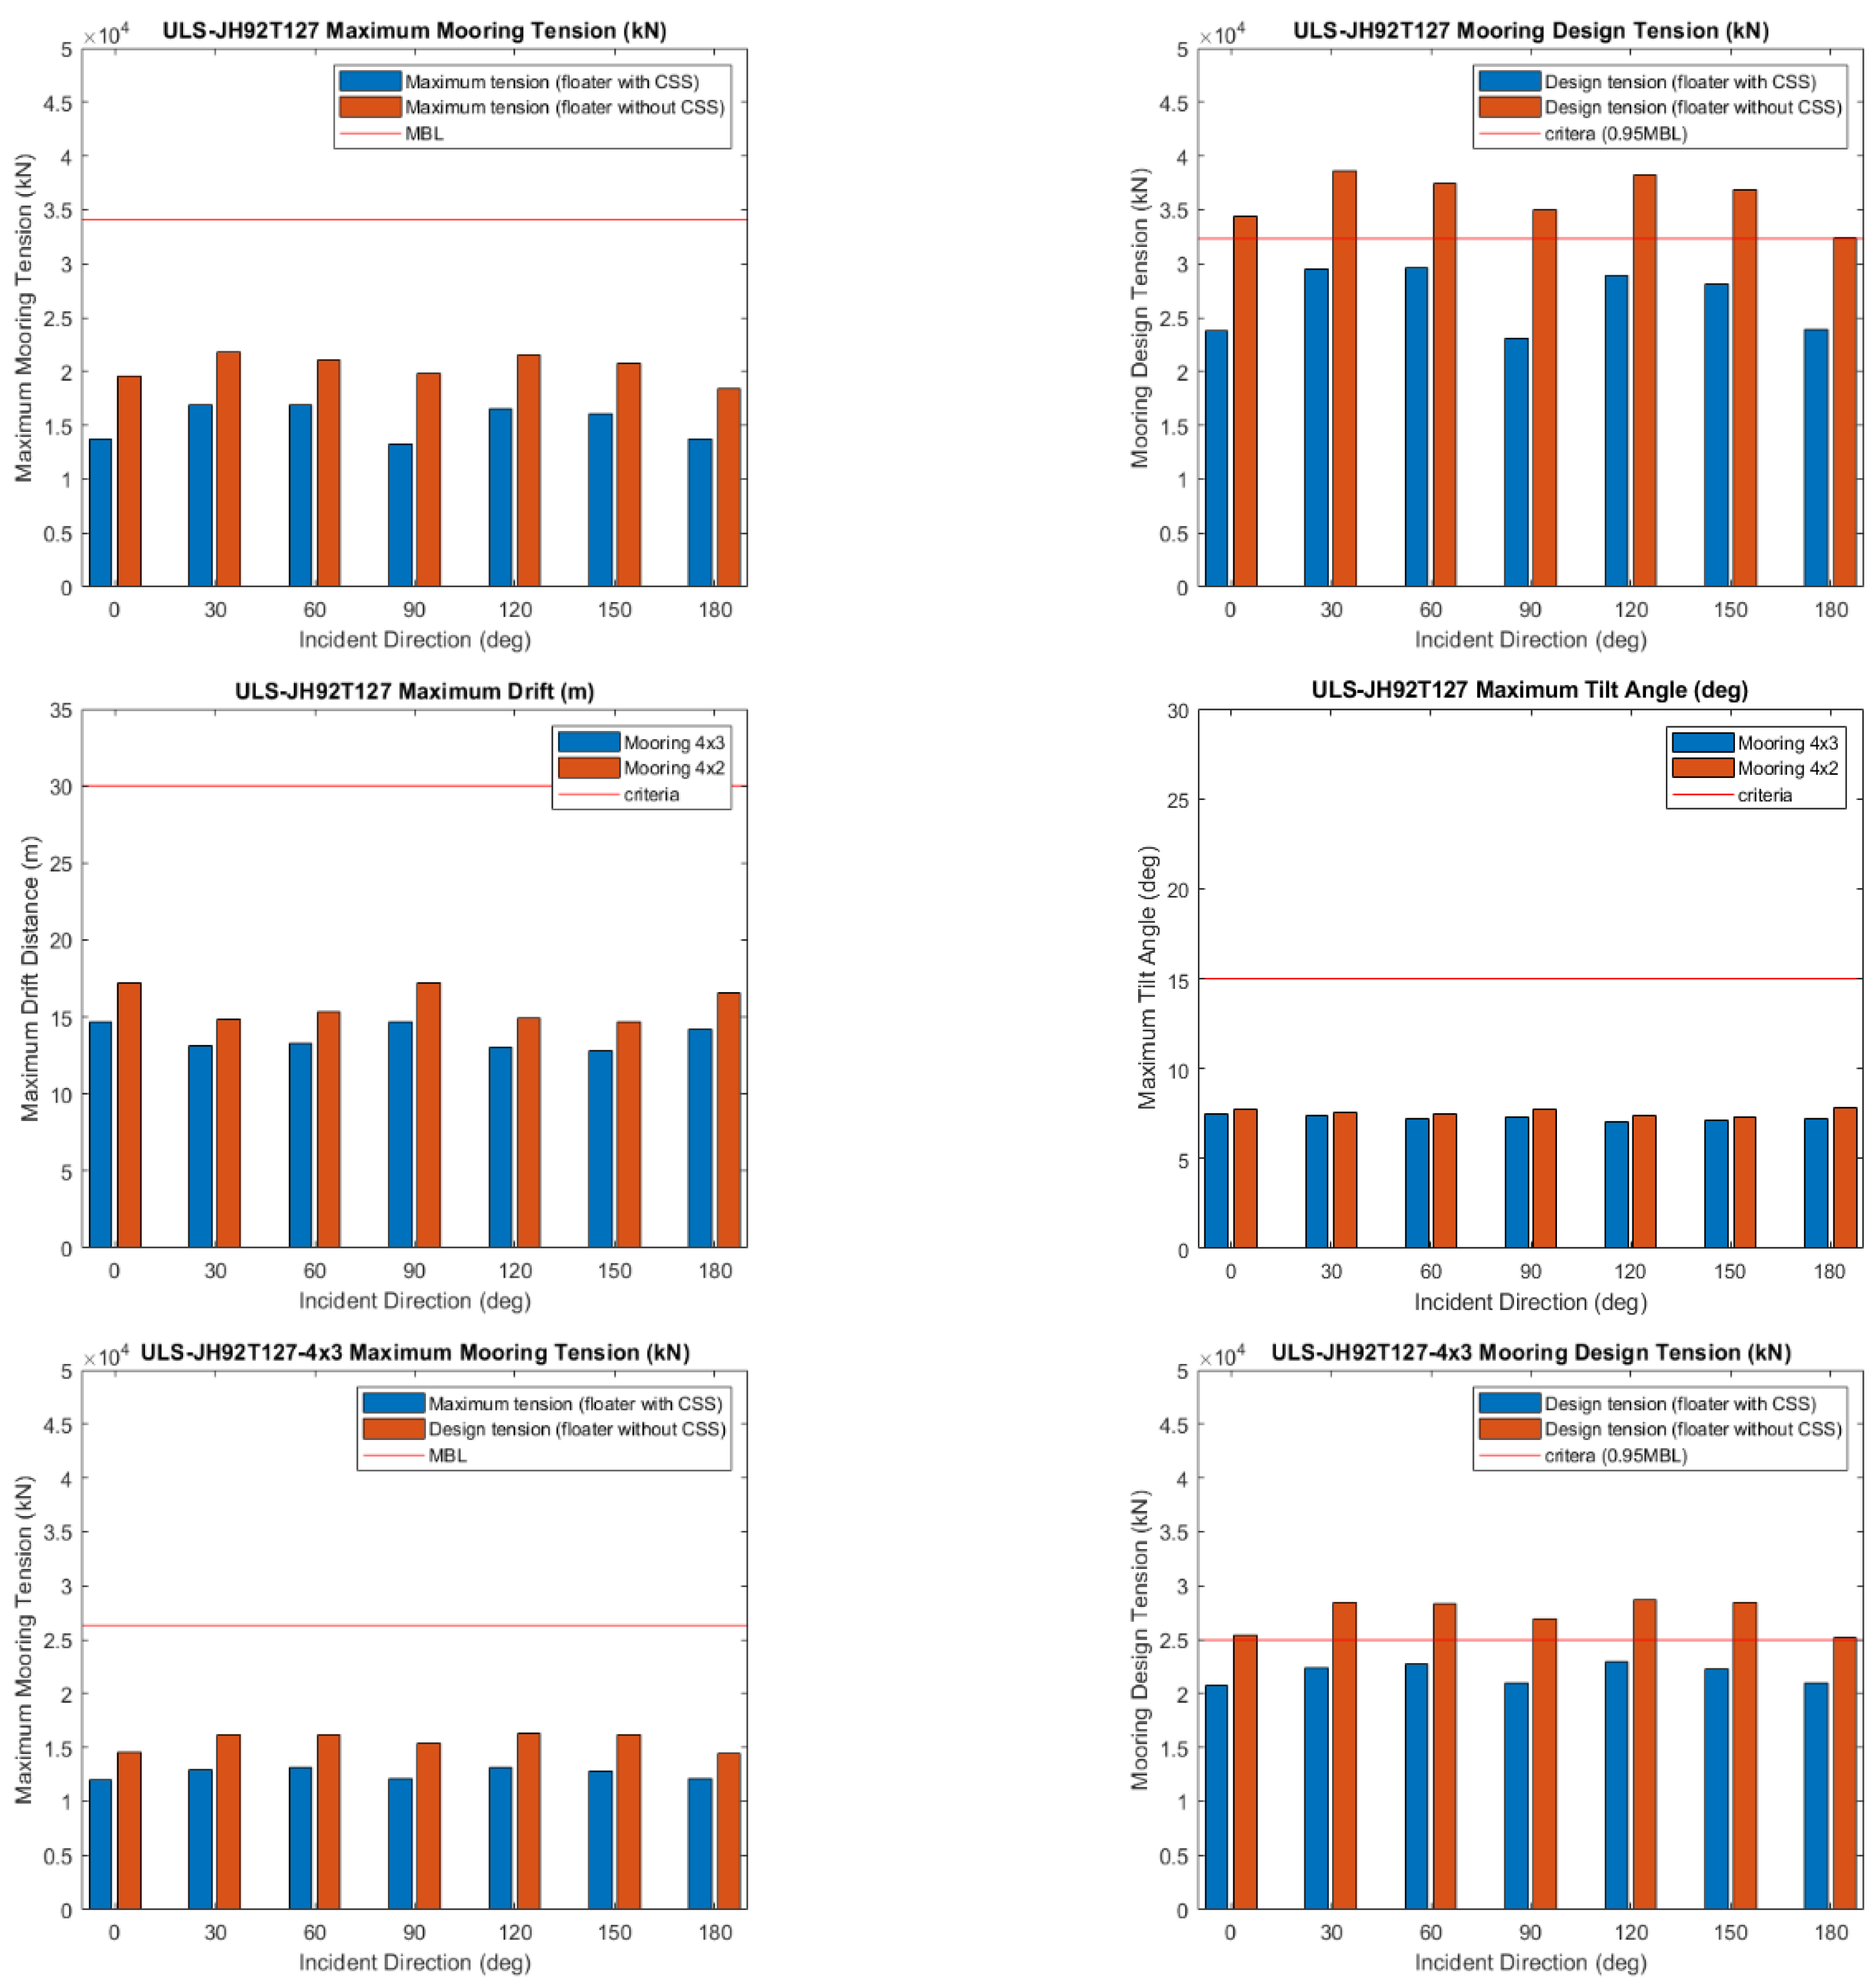
Figure 19.
Validation of ULS Condition. (1)(2)(3)(4) Compare 4×2 mooring system with and without CSS for dynamic response and mooring tension. (5)(6) Compare the dynamic response of the platform between 4×2 and 4×3 mooring configurations. (7)(8) Compare the mooring tension of 4×3 mooring configuration with and without CSS.
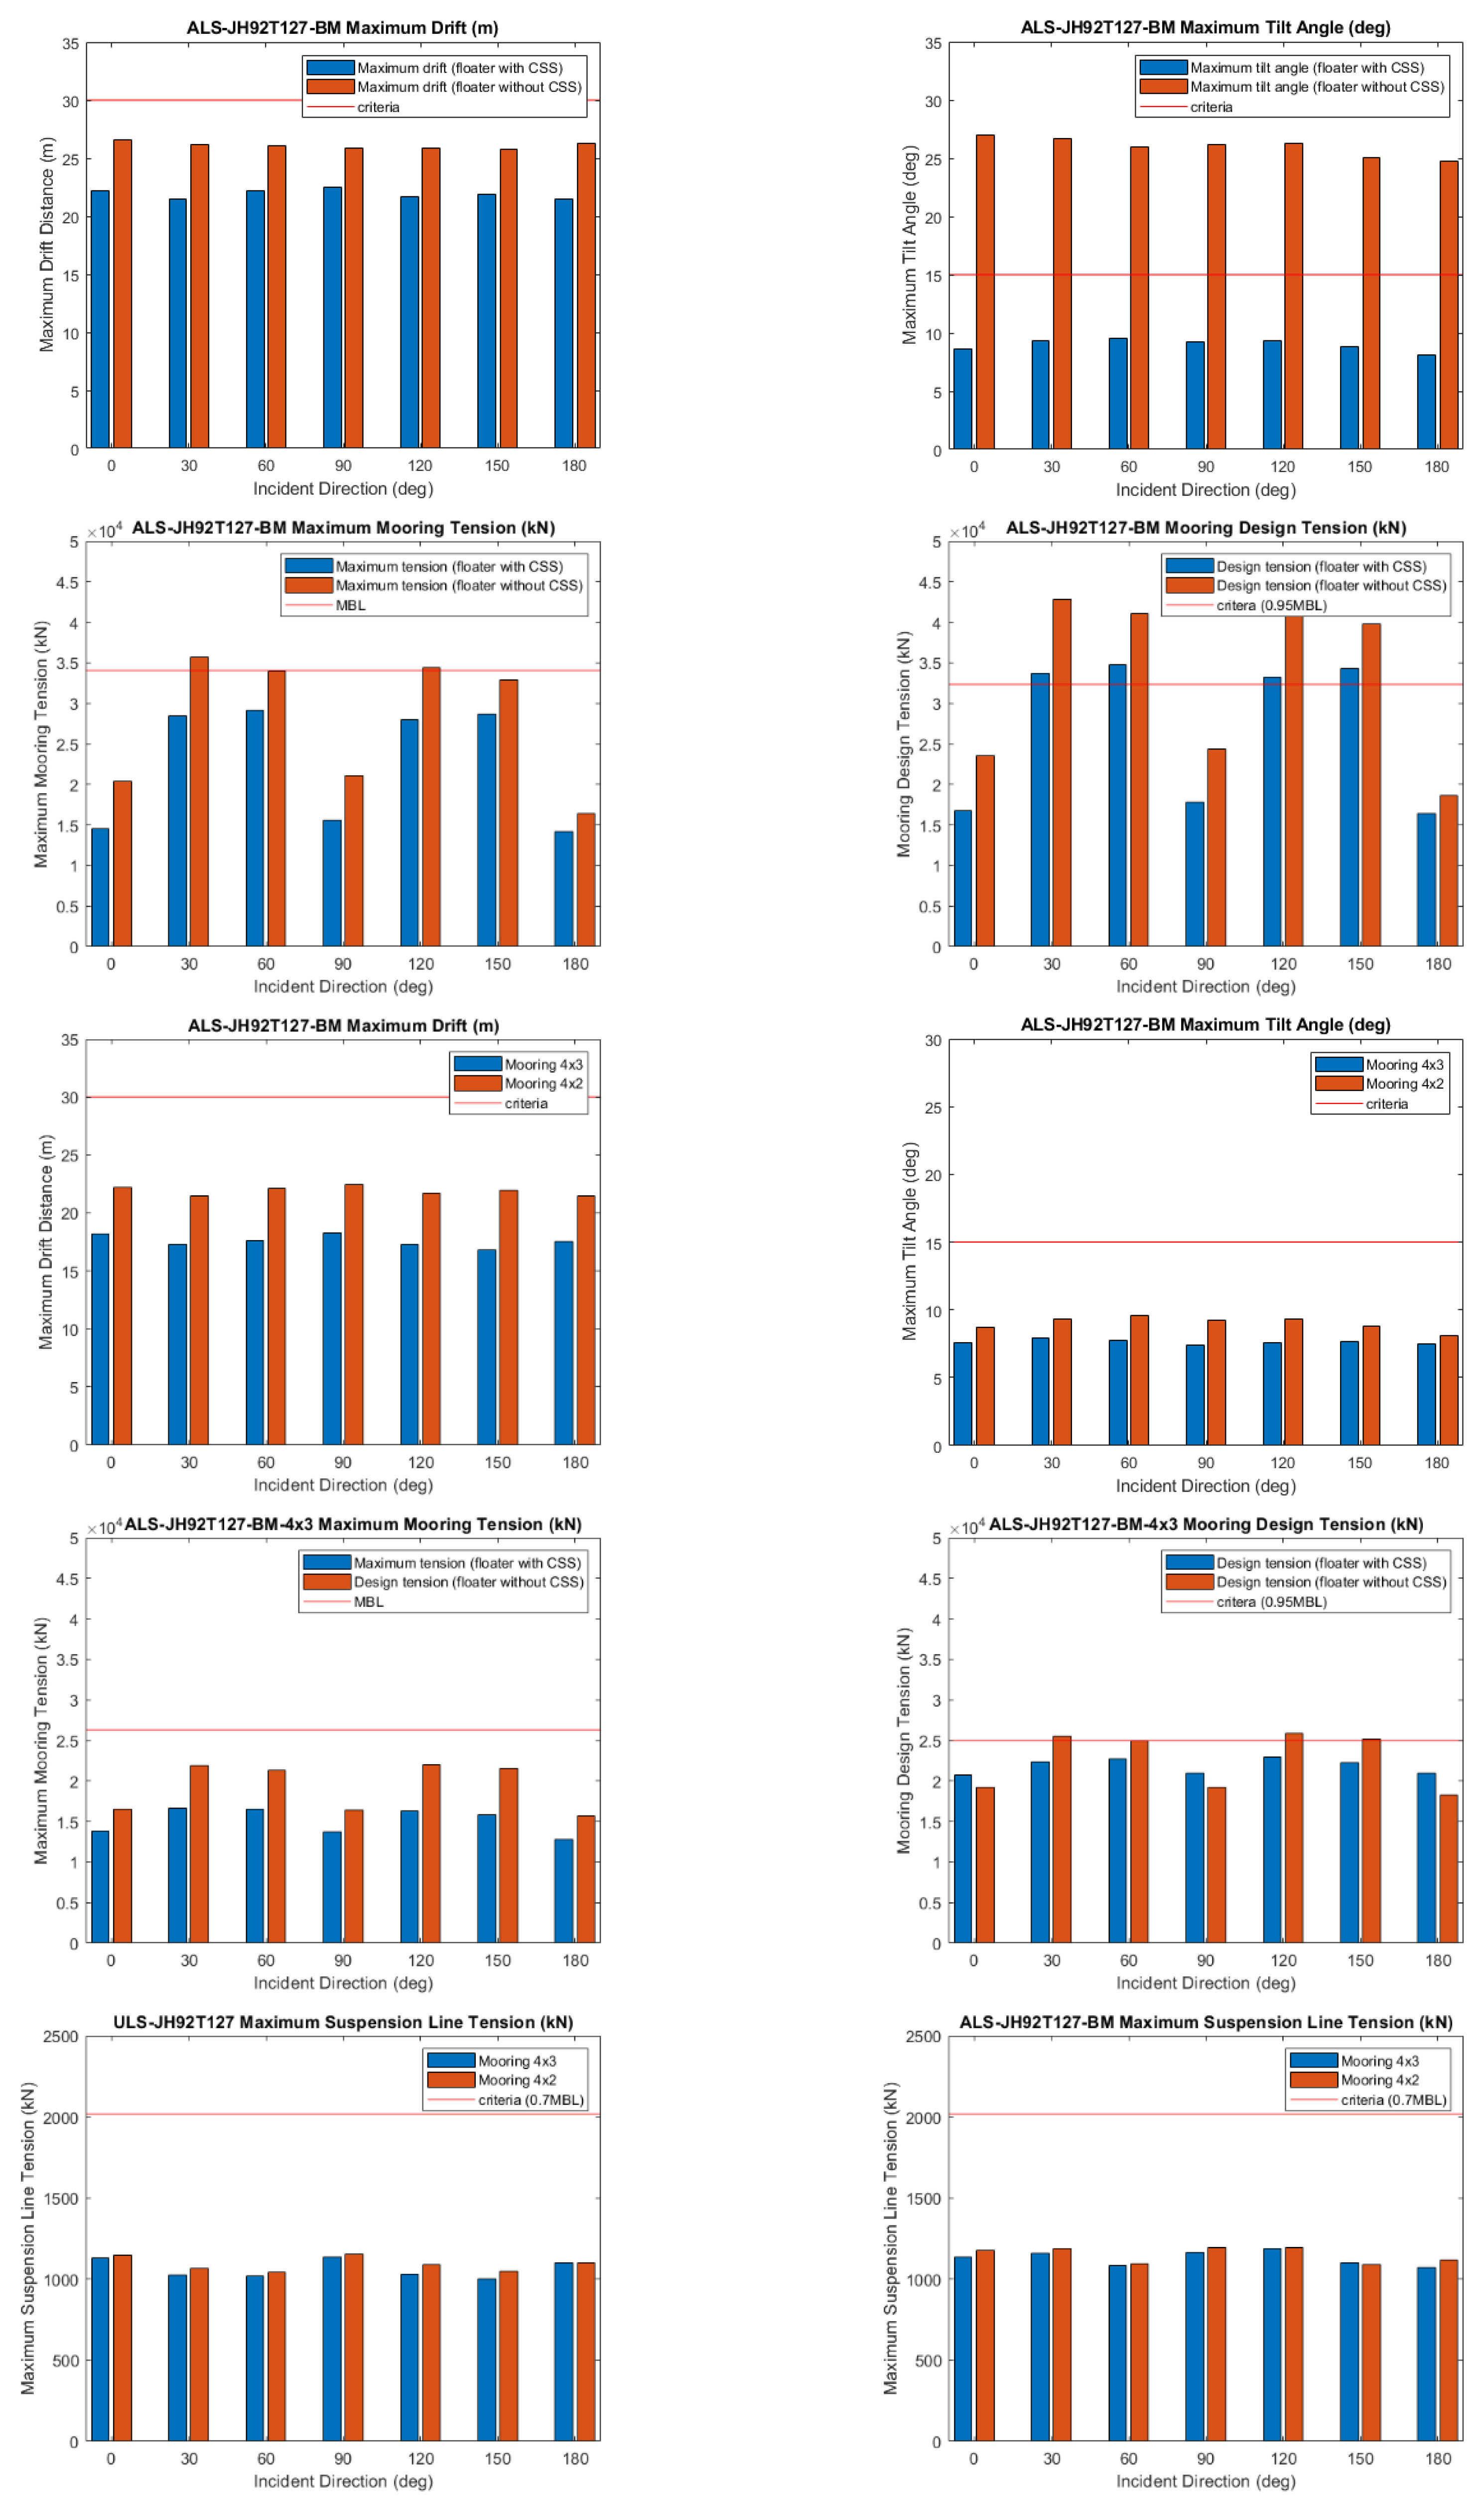
Figure 20.
Validation of ALS Condition. (1)(2)(3)(4) Compare 4×2 mooring system with and without CSS. (5)(6) Compare the dynamic response of platform between 4×2 and 4×3 mooring configurations. (7)(8) Compare the mooring tension of 4×3 mooring configuration with and without the CSS. (9)(10) Compare the suspension ropes tension.
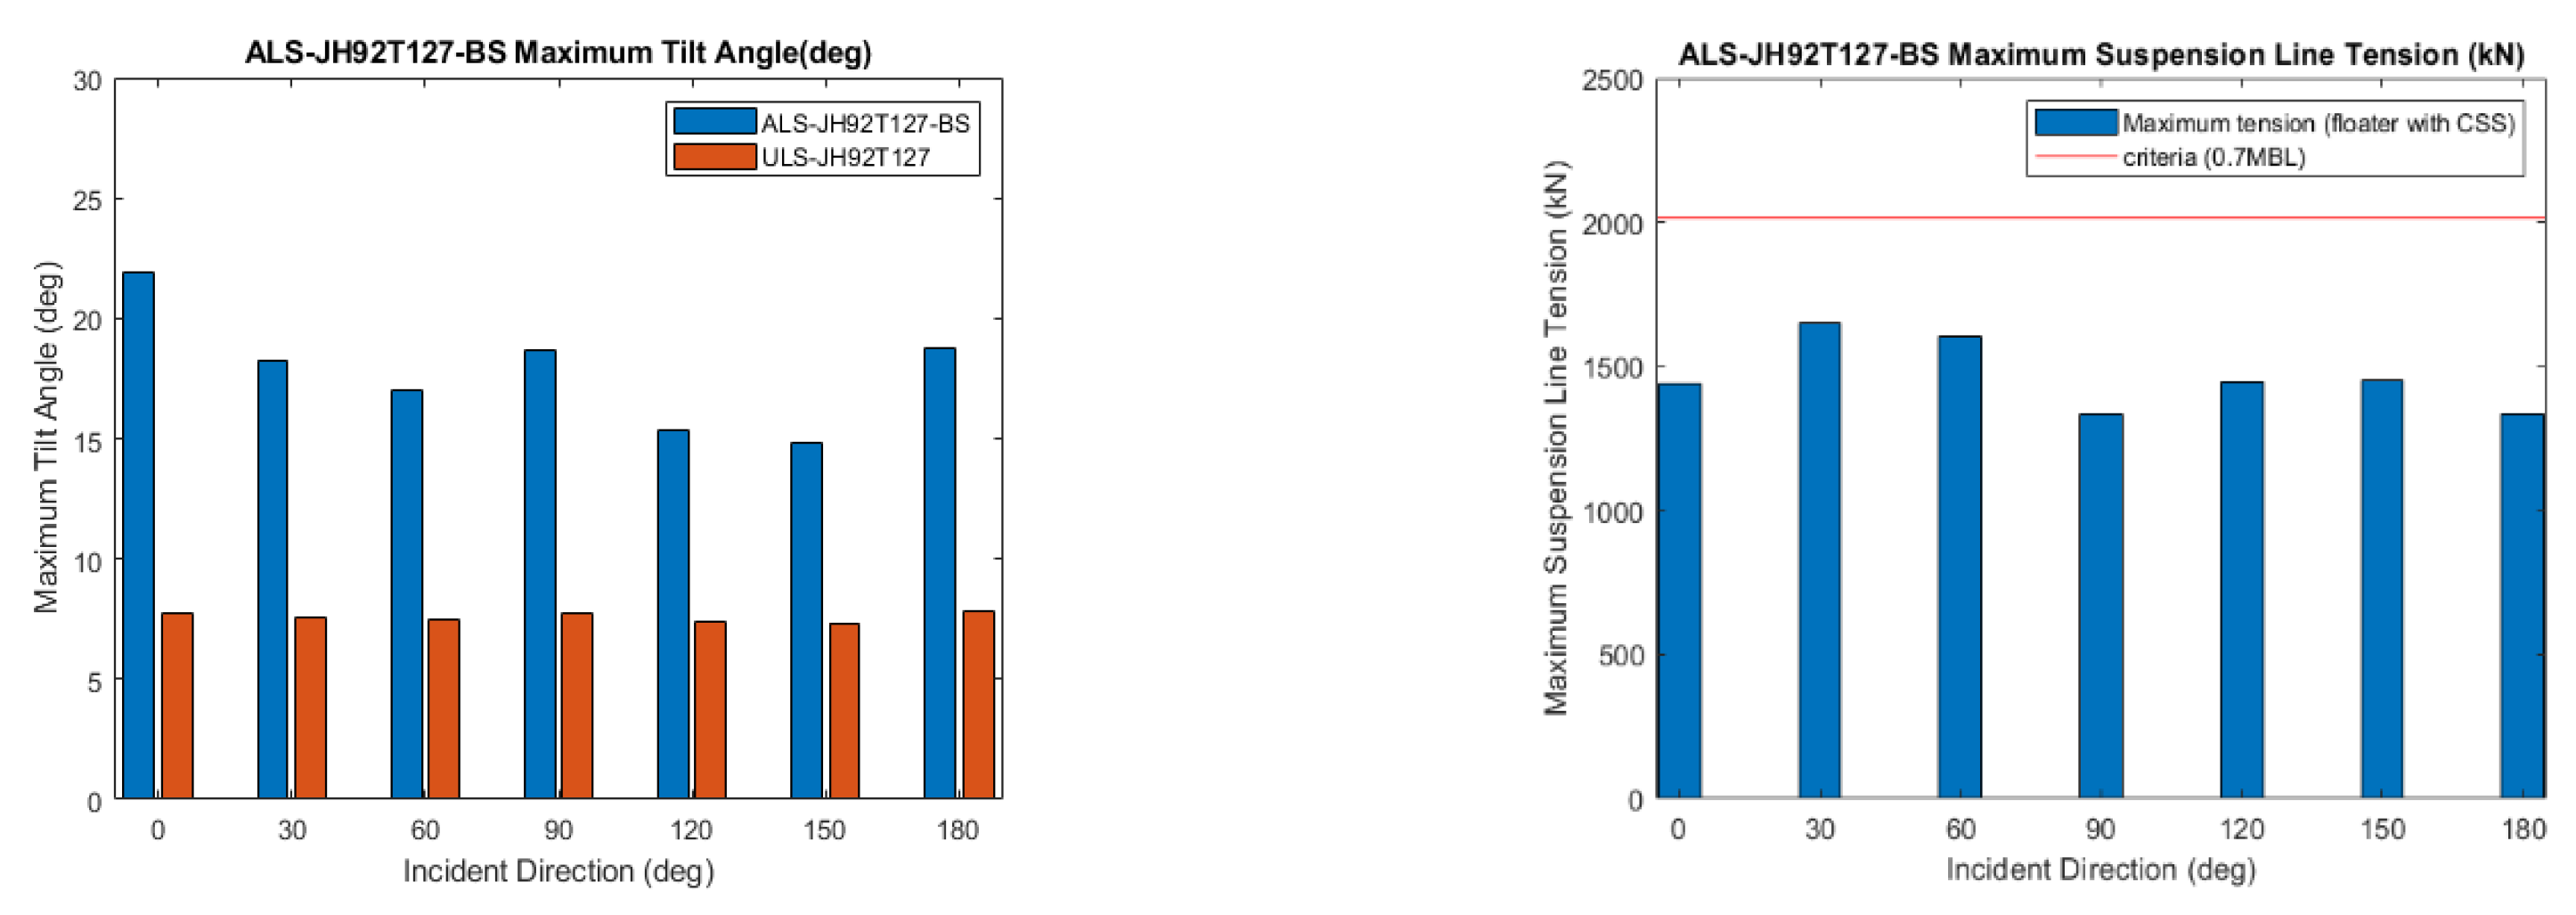
Figure 21.
Maximum tilt angle (left) and suspension line tension (right) under suspension lines failure.
Figure 21.
Maximum tilt angle (left) and suspension line tension (right) under suspension lines failure.
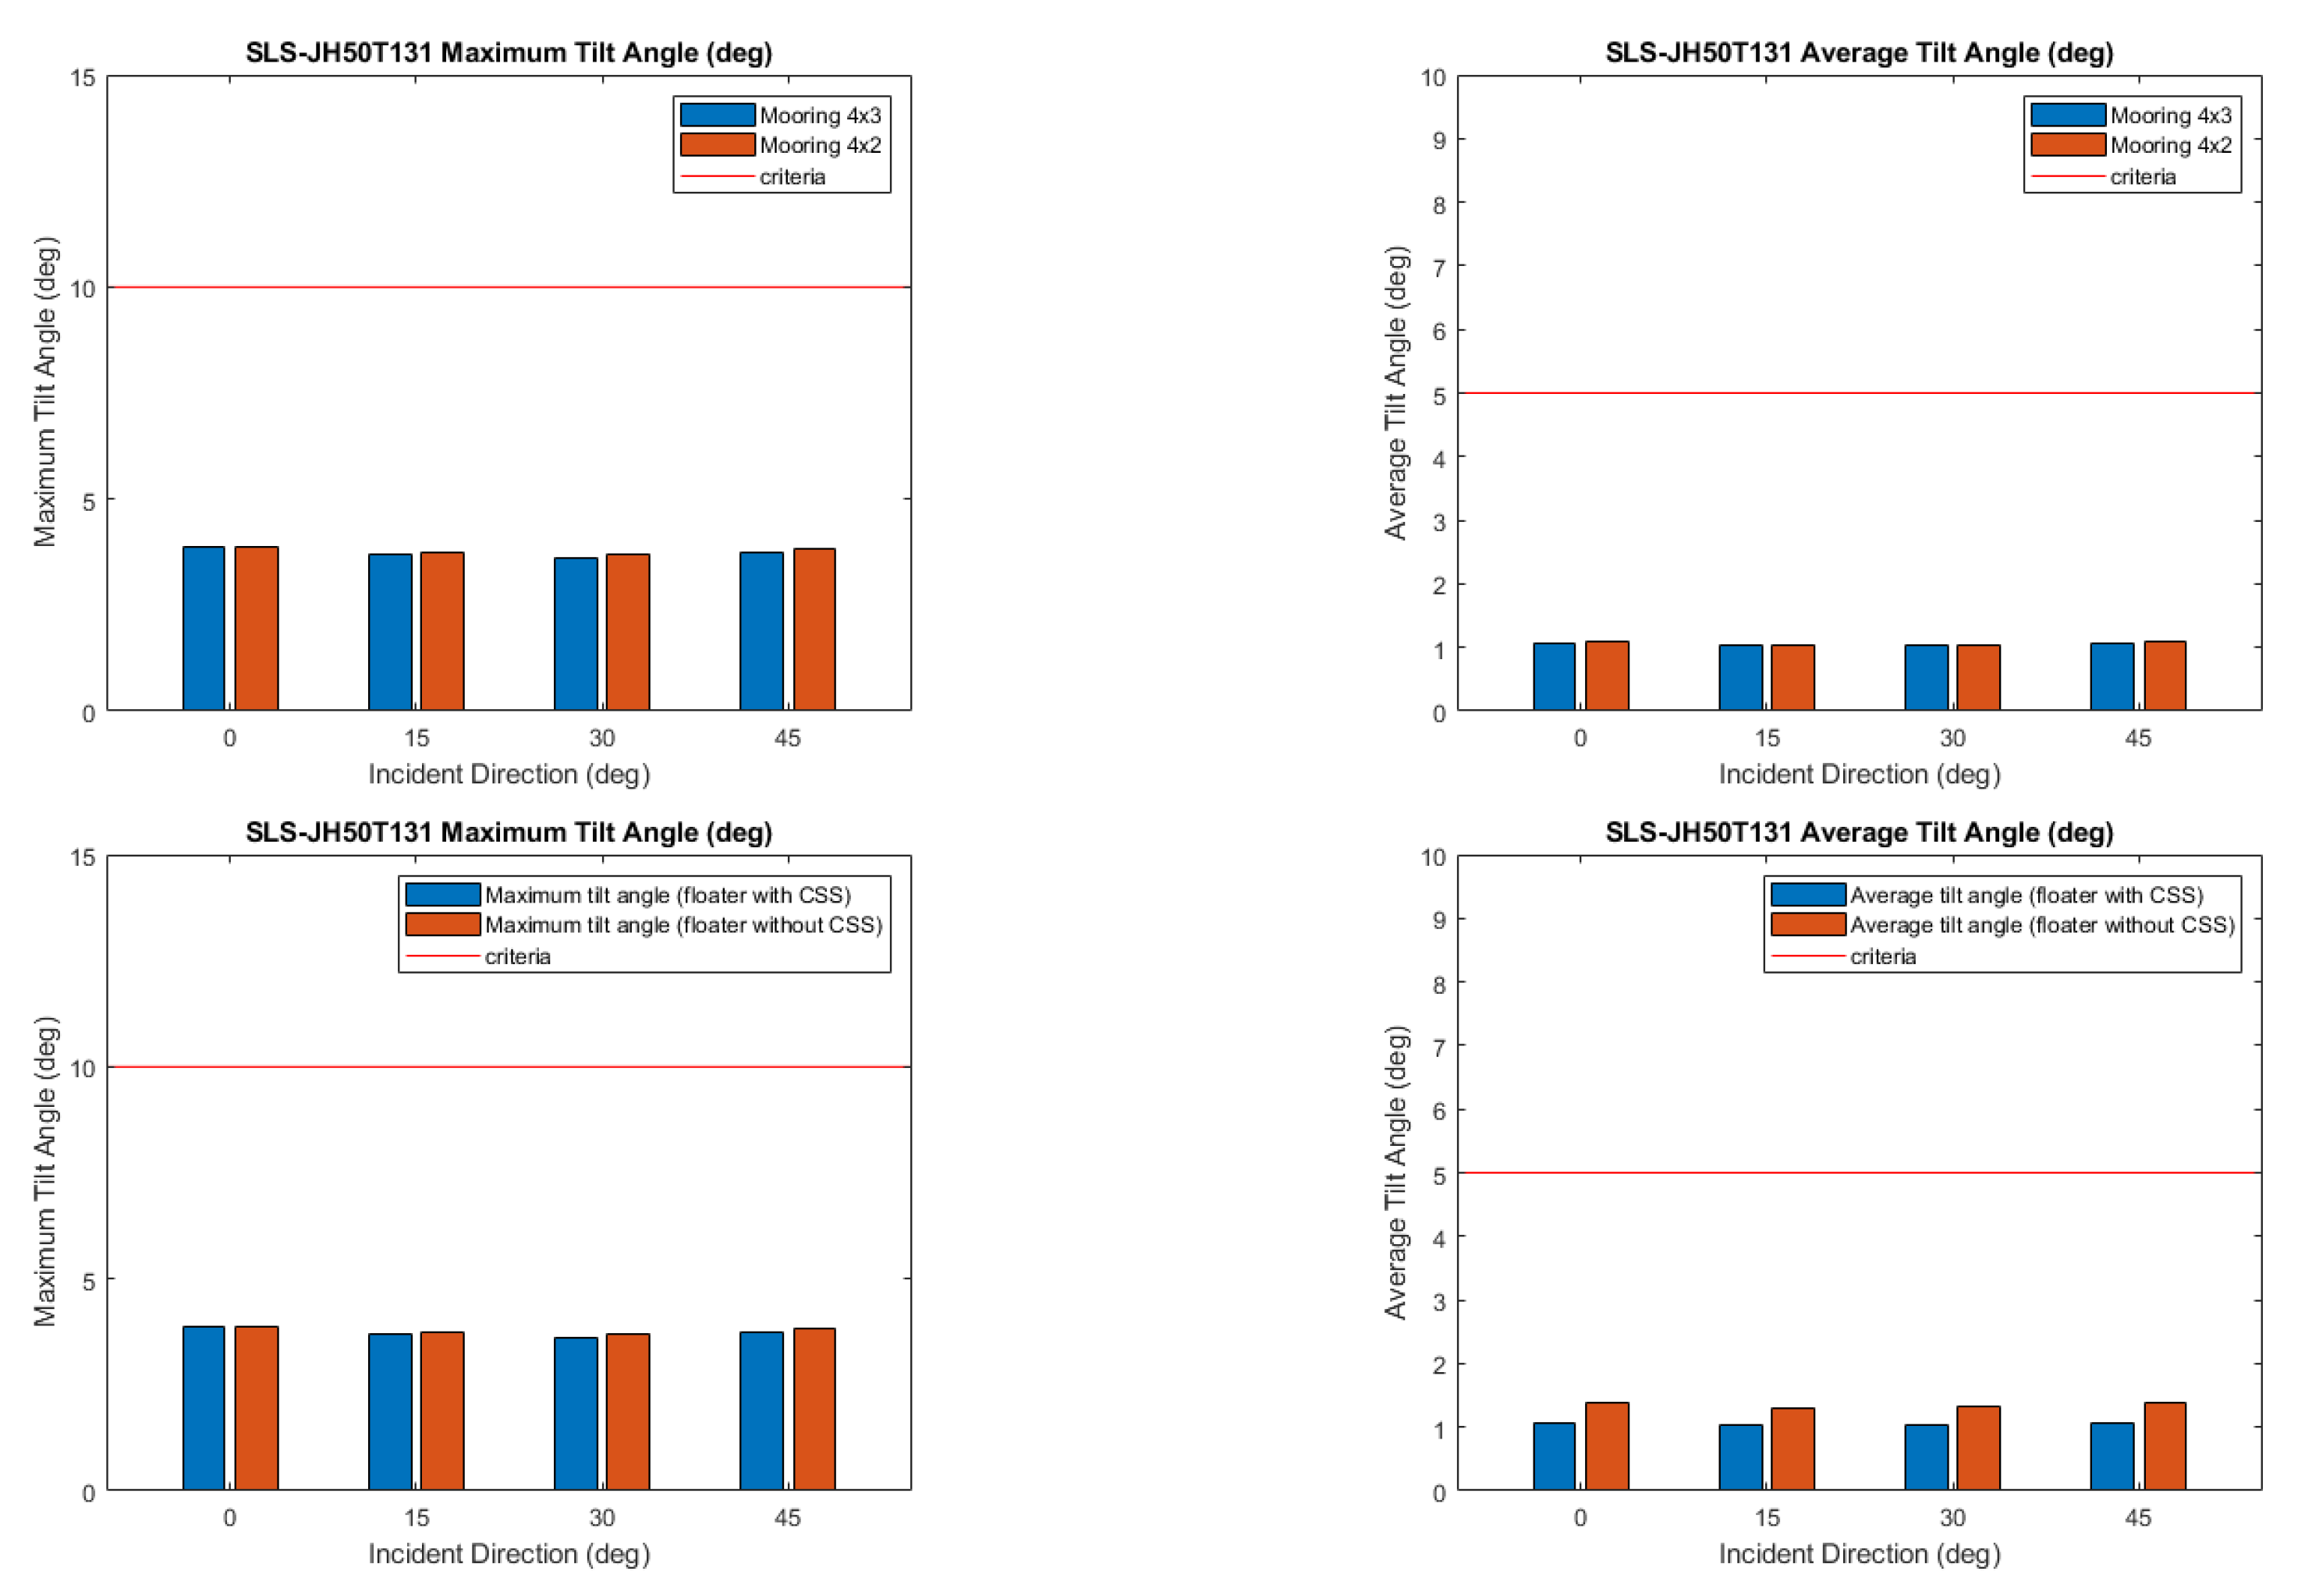
Figure 22.
Validation of SLS Condition. (1)(2) compare 4×2 and 4×3 mooring configurations, while (3)(4) compare floater with and without CSS under 4×3 mooring configuration.
Figure 22.
Validation of SLS Condition. (1)(2) compare 4×2 and 4×3 mooring configurations, while (3)(4) compare floater with and without CSS under 4×3 mooring configuration.
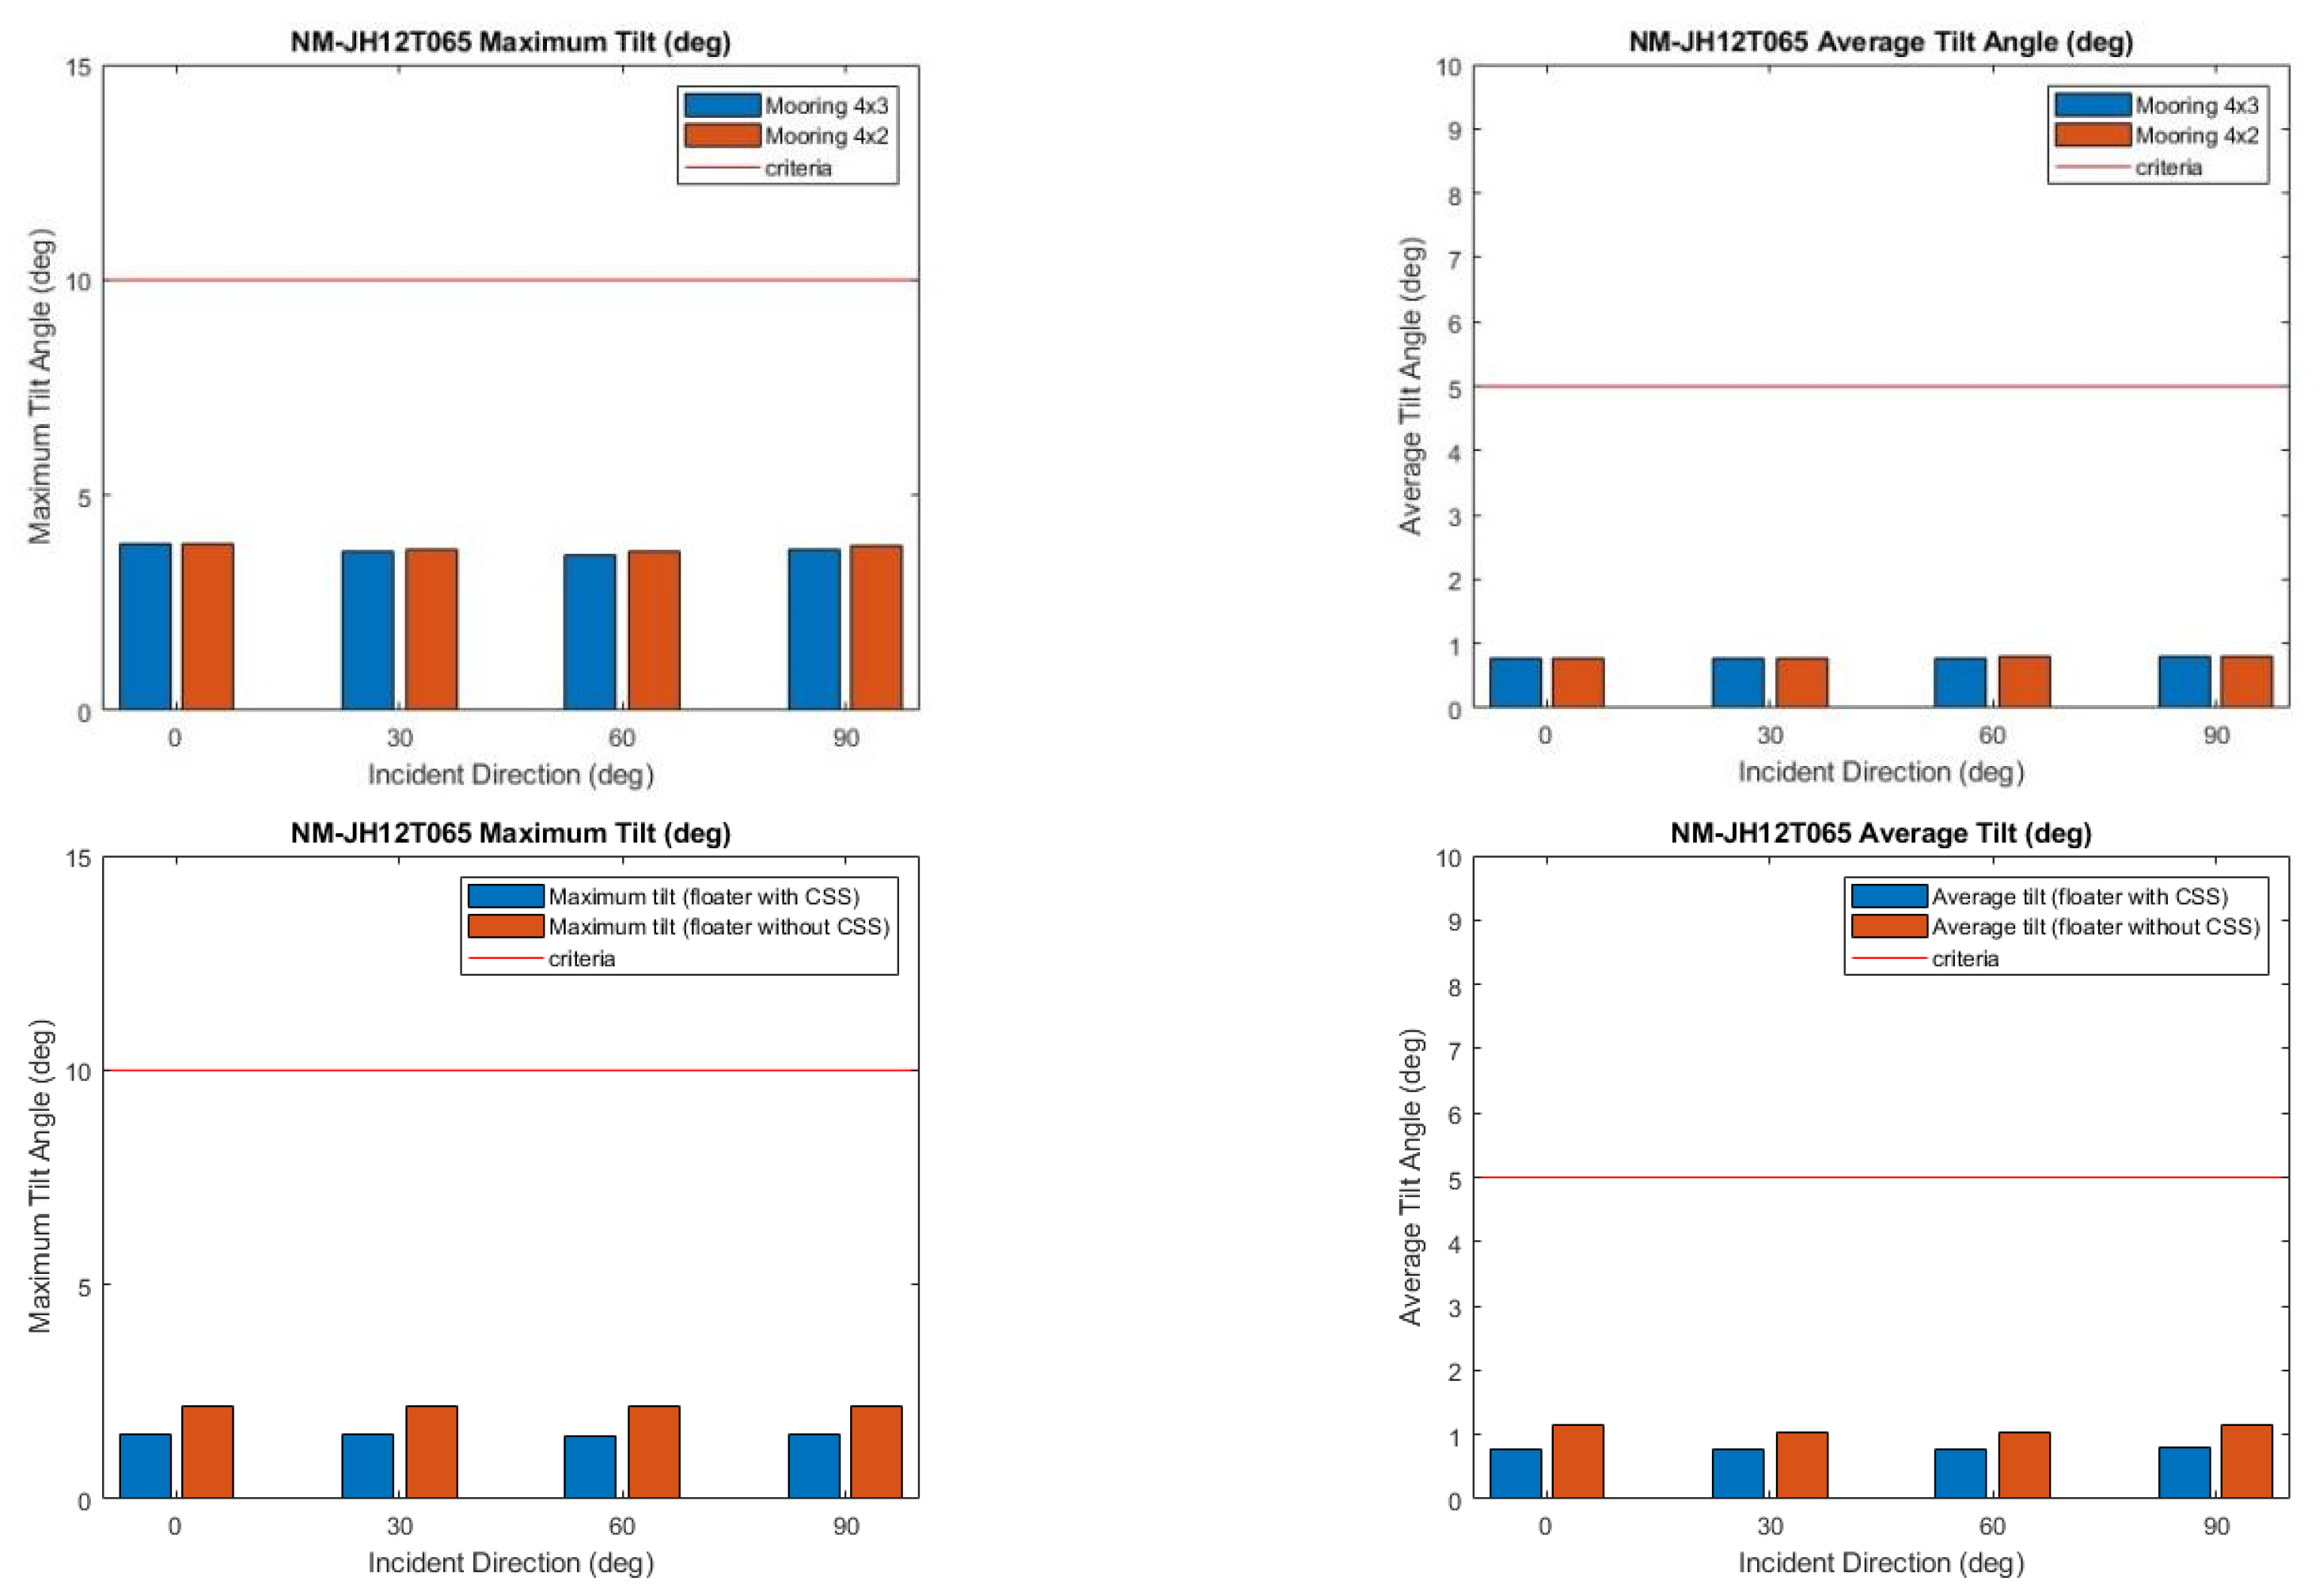
Figure 23.
Validation of Normal Sea State. (1)(2) compare 4×2 and 4×3 mooring configurations, while (3)(4) compare floater with and without CSS under 4×3 mooring configuration.
Figure 23.
Validation of Normal Sea State. (1)(2) compare 4×2 and 4×3 mooring configurations, while (3)(4) compare floater with and without CSS under 4×3 mooring configuration.
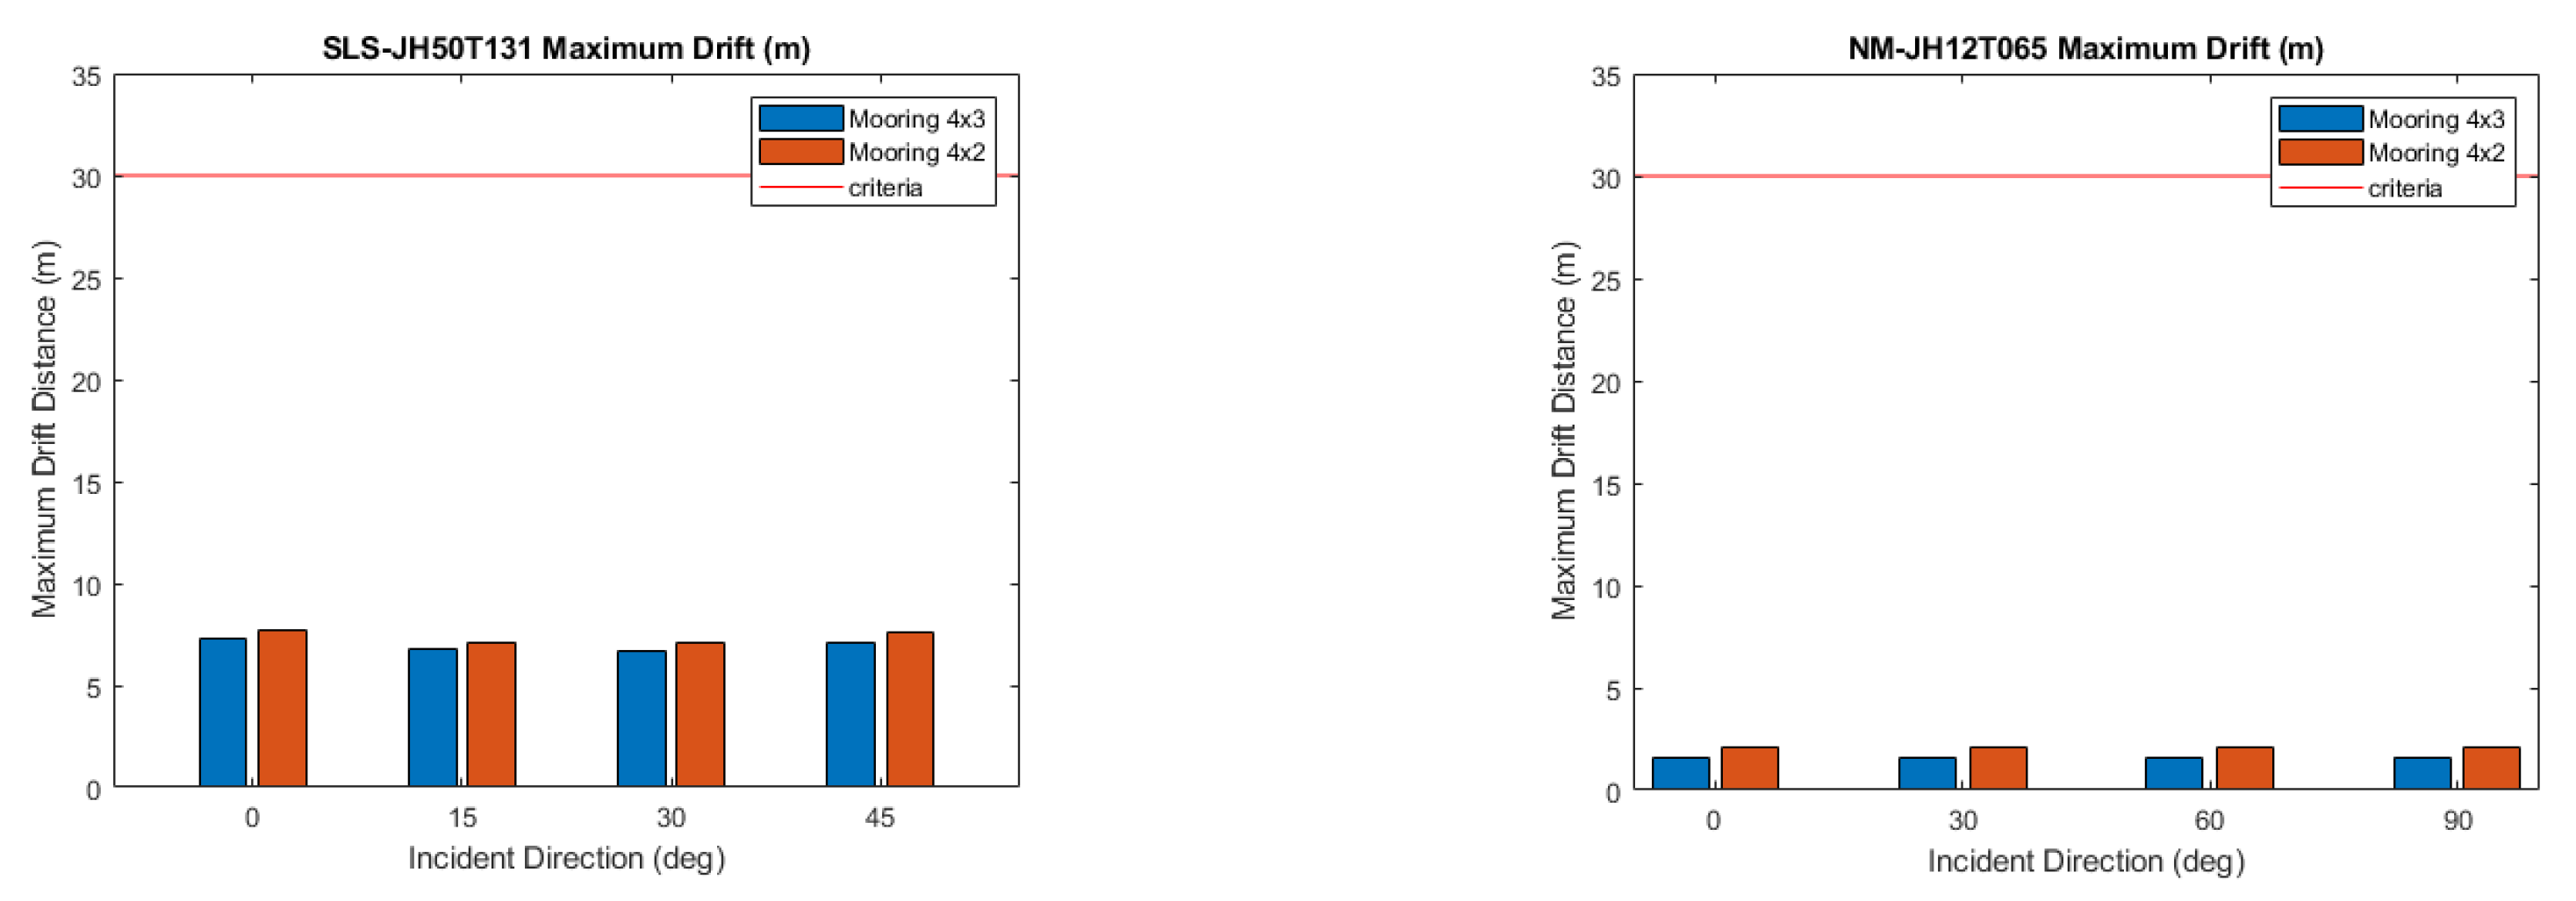
Figure 24.
Maximum drift range under different mooring configurations for SLS (left) and Normal Sea State (right) during operational conditions.
Figure 24.
Maximum drift range under different mooring configurations for SLS (left) and Normal Sea State (right) during operational conditions.
Table 1.
Natural periods of different floating platform types (Resource: DNV-RP-0286).
Table 1.
Natural periods of different floating platform types (Resource: DNV-RP-0286).
| Type of motion |
Spar |
Semi-submersible |
TLP |
Barge |
| Units |
[s] |
[s] |
[s] |
[s] |
| Surge |
~100 (catenary) |
~100 (catenary) |
15-60 2)
|
~100 |
| Heave |
25-40 3)
|
15-25 3)
|
1-2 |
5-10 |
| Pitch |
25-40 3)
|
25-40 3)
|
2-5 |
9-16 |
| Yaw |
5-20 1)
|
50-80 1)
|
8-20 2)
|
50-100 1)
|
- 1)
Yaw frequency is sensitive to mean line tension, water depth and mooring attachment point. Dependency maybe higher for shallow water (catenary). - 2)
The large range in TLP periods reflect the sensitivity to water depth. - 3)
Typically try to avoid wave frequency range |
Table 2.
Load factor requirements for design of mooring lines (DNV-ST-0119).
Table 2.
Load factor requirements for design of mooring lines (DNV-ST-0119).
| Limit state |
Load factor |
Consequence class |
| 1 |
2 |
| ULS |
|
1.3 |
1.5 |
| ULS |
|
1.75 |
2.2 |
| ALS |
|
1.00 |
1.00 |
| ALS |
|
1.10 |
1.25 |
Table 3.
Criteria be inspected in this study.
Table 3.
Criteria be inspected in this study.
| Standard Requirements |
Turbine State |
| Max tilt |
Operational |
| Mean tilt |
Operational |
| Max tilt |
Parking |
| Max drift m |
Both |
| Mooring design : |
ULS and ALS |
| Fiber ropes design |
ULS and ALS |
Table 4.
Minimum requirements for design fatigue factors, DFF, for mooring line and steel tendon (DNV-ST-0119).
Table 4.
Minimum requirements for design fatigue factors, DFF, for mooring line and steel tendon (DNV-ST-0119).
| Consequence class |
DFF |
| 1 |
5 |
| 2 |
10 |
Table 5.
Environmental conditions in site Hsinchu, Taiwan.
Table 5.
Environmental conditions in site Hsinchu, Taiwan.
| Condition |
Normal |
Northeast monsoon (SLS) |
50-year return period
(ULS) |
|
1.22 |
5.0 |
9.2 |
|
6.5 |
13.1 |
12.7 |
|
8.8 |
11.4 |
57 |
| Wind profile |
NTM |
NTM |
EWM |
|
0.4 |
0.88 |
1.159 |
| Turbine |
Operating |
Operating |
Parking |
Table 7.
Parameters of Suspensa OctaFloat.
Table 7.
Parameters of Suspensa OctaFloat.
| Parameters |
Unit |
Value |
| Circumcircle diameter |
[m] |
48 |
| Freeboard |
[m] |
5.4 |
| Draft |
[m] |
10.8 |
| Floater weight |
[ton] |
12,880 |
| Turbine |
[-] |
NREL 5-MW |
| Suspended counterweight |
[ton] |
2,000 |
| CG (platform including ballast) |
[m] |
(-0.57,0,-7.15) |
Table 8.
4×2 Mooring system configuration.
Table 8.
4×2 Mooring system configuration.
| Parameter |
Value (unit) |
| Selected Site |
Hsinchu, Taiwan |
| Mooring system type |
Catenary type |
| Water depth |
100 (m) |
| Anchor radius |
720 (m) |
| Fairlead depth |
8 (m) |
| Chain size and grade |
200 (mm), R4S |
| MBL |
34,048 (kN) |
Table 9.
4×3 Mooring system configuration.
Table 9.
4×3 Mooring system configuration.
| Parameter |
Value (unit) |
| Selected Site |
Hsinchu, Taiwan |
| Mooring system type |
Catenary type |
| Water depth |
100 (m) |
| Anchor radius |
720 (m) |
| Fairlead depth |
8 (m) |
| Chain size and grade |
180 (mm), R4 |
| MBL |
26,277.7 (kN) |
Table 10.
Formulas for synthetic rope MBL and axial stiffness (d is in meters).
Table 10.
Formulas for synthetic rope MBL and axial stiffness (d is in meters).
| Synthetic rope type |
MBL (kN) |
Axial stiffness (kN) |
| Nylon ropes (wet) |
|
|
| Polyester ropes |
|
|
| Polypropylene ropes |
|
|
Table 11.
Counterweight suspension system preliminary design parameters.
Table 11.
Counterweight suspension system preliminary design parameters.
| Symbol |
L1(24,0), L2(0,24), L3(-24,0), L4(0,-24) (x,y: fairlead position) |
| Material |
Polyester rope bundle |
| Depth of counterweight |
60.8 m under S.W.L. (top of counterweight) |
| Counterweight |
Cylinder geometry |
Table 12.
Case symbol of counterweight suspension system optimization.
Table 12.
Case symbol of counterweight suspension system optimization.
| Case symbol |
Counterweight height |
Counterweight diameter |
| H15D160 |
1.5 m |
16.0 m |
| H25D120 |
2.5 m |
12.0 m |
| H35D100 |
3.5 m |
10.0 m |
| H45D090 |
4.5 m |
9.0 m |
| H60D080 |
6.0 m |
8.0 m |
| H75D070 |
7.5 m |
7.0 m |
| H90D065 |
9.0 m |
6.5 m |
| NCSS |
- |
- |
Table 13.
Case symbol of suspension line optimization.
Table 13.
Case symbol of suspension line optimization.
| Case symbol |
Suspension line nominal diameter |
Number of ropes |
| D130N40 |
130 mm |
40 (10 ropes per bundle) |
| D130N48 |
130 mm |
48 (12 ropes per bundle) |
| D130N56 |
130 mm |
56 (14 ropes per bundle) |
| D120N56 |
120 mm |
56 (14 ropes per bundle) |
| D140N40 |
140 mm |
40 (10 ropes per bundle) |
| NCSS |
- |
- |
Table 14.
Case symbol of irregular wave simulation.
Table 14.
Case symbol of irregular wave simulation.
| Case symbol |
Significant wave height |
Peak period |
Direction(deg) |
| ULS-JH92T127 |
9.2 m |
12.7 sec |
0,30,60,90,120,150,180 |
| ALS-JH92T127-BS |
9.2 m |
12.7 sec |
0,30,60,90,120,150,180 |
| ALS-JH92T127-BM |
9.2 m |
12.7 sec |
0,30,60,90,120,150,180 |
| SLS-JH50T131 |
5.0 m |
13.1 sec |
0,15,30,45 |
| NM-JH12T065 |
1.22 m |
6.5 sec |
0,30,60,90 |
Table 15.
Natural period of 6 DOFs (unit: second).
Table 15.
Natural period of 6 DOFs (unit: second).
| Natural Period |
Surge |
Sway |
Heave |
Roll |
Pitch |
Yaw |
| With CSS |
46.16
42.86 |
46.16
42.86 |
9.84
7.31 |
18.75
8.70 |
18.75
8.83 |
24.00 |
| Without CSS |
40.01 |
40.01 |
9.84
7.23 |
12.77 |
13.05 |
23.08 |
Table 16.
Counterweight geometry optimization trials.
Table 16.
Counterweight geometry optimization trials.
| Case symbol |
Counterweight height |
Counterweight diameter |
Moment of inertia |
| H15D160 |
1.5 m |
16.0 m |
64,000.0 |
| H25D120 |
2.5 m |
12.0 m |
36,000.0 |
| H35D100 |
3.5 m |
10.0 m |
25,000.0 |
| H45D090 |
4.5 m |
9.0 m |
20,250.0 |
| H60D080 |
6.0 m |
8.0 m |
16,000.0 |
| H75D070 |
7.5 m |
7.0 m |
12,250.0 |
| H90D065 |
9.0 m |
6.5 m |
10,562.5 |
| NCSS |
- |
- |
- |
Table 19.
Counterweight suspension system detail configuration.
Table 19.
Counterweight suspension system detail configuration.
| Material |
Polyester rope bundle |
| Nominal diameter |
130 mm |
| Number of ropes |
48 (412) |
| Stiffness ratio |
|
| MBL |
2,880.88kN |
| Counterweight geometry |
Cylinder—H75D070 |
Table 20.
Environmental load for ULS Condition.
Table 20.
Environmental load for ULS Condition.
| Environmental Condition |
ULS |
|
9.2 |
|
12.7 |
|
57 |
| Wind profile |
EWM |
|
1.119 |
| Turbine Condition |
Parking |
Table 21.
Environmental load for SLS Condition.
Table 21.
Environmental load for SLS Condition.
| Environmental Condition |
SLS |
|
5.0 |
|
13.1 |
|
11.4 |
| Wind profile |
NTM |
|
0.88 |
| Turbine Condition |
Operation |
Table 23.
Monthly wave height statistics of Hsinchu Buoys (2002~2021).
Table 23.
Monthly wave height statistics of Hsinchu Buoys (2002~2021).
| Month. |
Average significant wave height ( (m) |
Average wave period ( (sec) |
Load direction (deg) |
Exposure Time (hr) |
| January |
1.3 |
5.0 |
0 |
744 |
| February |
1.2 |
4.9 |
0 |
672 |
| March |
1.0 |
4.7 |
0 |
744 |
| April |
0.8 |
4.5 |
22.5 |
720 |
| May |
0.6 |
4.3 |
22.5 |
744 |
| June |
0.7 |
4.2 |
90 |
720 |
| July |
0.6 |
4.2 |
90 |
744 |
| August |
0.6 |
4.5 |
90 |
744 |
| September |
0.9 |
4.8 |
0 |
720 |
| October |
1.2 |
4.9 |
0 |
744 |
| November |
1.2 |
4.9 |
0 |
720 |
| December |
1.4 |
5.0 |
0 |
744 |
Table 24.
Maximum fatigue damage of mooring line and suspension line.
Table 24.
Maximum fatigue damage of mooring line and suspension line.
| Mooring configuration |
Material |
Lifespan (years) |
Cumulated damage |
Design damage |
Criteria |
| 42 |
Chain |
9.58E+02 |
1.04E-03 |
1.04E-02 |
Pass |
| Polyester (suspension line) |
3.15E+07 |
3.17E-08 |
3.17E-07 |
Pass |
| 43 |
Chain |
2.44E+03 |
4.09E-04 |
4.09E-03 |
Pass |
| Polyester (suspension line) |
3.45E+07 |
2.90E-08 |
2.90E-07 |
Pass |
Table 25.
Criteria check table for turbine parking conditions.
Table 25.
Criteria check table for turbine parking conditions.
| Cases |
Mooring configuration |
Max drift |
Max tilt angle |
Design Tension |
Suspension line |
| ULS-JH92T127 |
With CSS |
42 |
Pass |
Pass |
Pass |
Pass |
| 43 |
Pass |
Pass |
Pass |
Pass |
| ALS-JH92T127-BM |
42 |
Pass |
Pass |
Fail |
Pass |
| 43 |
Pass |
Pass |
Pass |
Pass |
| ULS-JH92T127 |
Without CSS |
42 |
Pass |
Fail |
Fail |
- |
| 43 |
Pass |
Fail |
Fail |
- |
| ALS-JH92T127-BM |
42 |
Pass |
Fail |
Fail |
- |
| 43 |
Pass |
Fail |
Fail |
- |
Table 26.
Criteria check table for operational conditions.
Table 26.
Criteria check table for operational conditions.
| Cases |
Mooring configuration |
Max drift |
Max tilt angle |
Average tilt angle |
Suspension line |
| SLS-JH50T131 |
With CSS |
42 |
Pass |
Pass |
Pass |
Pass |
| 43 |
Pass |
Pass |
Pass |
Pass |
| NM-JH12T065 |
42 |
Pass |
Pass |
Pass |
Pass |
| 43 |
Pass |
Pass |
Pass |
Pass |
SLS-
JH50T131 |
Without CSS |
42 |
Pass |
Pass |
Pass |
- |
| 43 |
Pass |
Pass |
Pass |
- |
| NM-JH12T065 |
42 |
Pass |
Pass |
Pass |
- |
| 43 |
Pass |
Pass |
Pass |
- |