
Submitted:
18 November 2024
Posted:
20 November 2024
You are already at the latest version
Abstract
This study evaluated the stability and reusability of amino-functionalized nanocellulose aero-gels as CO₂ adsorbent materials. The modified aerogels, synthesized via a controlled silylation using N-[3-(trimethoxysilyl) propyl] ethylenediamine (DAMO), demonstrated excellent thermal stability up to 250°C (TGA) and efficient CO₂ adsorption through chemisorption, which was the main adsorption mechanism. The performance of the aerogels was assessed using both, adsorp-tion isotherms and the decay pressure technique, revealing that CO₂ adsorption capacity in-creased with higher amino group loading (4.62, 9.24, and 13.87 mmol of DAMO). At 298 K and 4 bar, CO₂ adsorption capacity increased proportionally with the amino group concentration, reaching values of 3.17, 5.98, and 7.86 mmol of CO₂ g-1 polymer, respectively. Furthermore, over 20 adsorption/desorption cycles, the aerogels maintained 95% CO₂ desorption at ambient tem-perature, indicating their potential for industrial use. These findings highlight the aerogels suitability as stable, reusable materials for large scale CO₂ capture and storage technologies.
Keywords:
nanocellulose aerogels
; CO2 capture
; amino load
1. Introduction
CO2 is considered the most important greenhouse gas, due to the continuous increase in atmospheric CO2 concentration from 310 ppm in 1960 to 410 ppm in 2019 [1]. To reduce CO2 concentrations, it is necessary to implement measures such as: reducing deforestation, promoting the use of more efficient energy, using renewable energy sources, and applying carbon capture and storage (CCS) as well as capture and storage utilization (CCU) technologies [2]. The main carbon capture technologies are based on absorption and adsorption operations, membrane separation and cryogenic distillation technologies, the first two being the most studied [3].
Adsorption technologies using solid porous materials seems to be an efficient alternative for CO2 capture due to its reusable nature, low cost, versatility, and easy operations. The literature reports different adsorbent materials with high selectivity, including amine-modified silica, amines supported on porous carbon and/or on other metal oxides such as alumina, zeolites, metal oxides, and metal organic frameworks (MOF) [4,5]. The development of some of these materials is limited due to drawbacks such as their hydrophilic nature, which requires a drying step prior to use. Therefore, the introduction of hydrophobic sites has been considered to overcome this limitation. In fact, hydrophobic microporous solids are more resistant to the presence of water vapor but tend to absorb less CO2 [4,6]. Furthermore, the high temperatures required for the regeneration of these materials after being used for CO2 adsorption is also a major obstacle [4,6]. To address the limitations presented by inorganic absorbents, during the last decade the use of bio-based absorbents for CO2 capture has been extensively investigated, emphasizing cellulose nanofibril (CNF) [7,8].
The chemical modification of CNF for CO2 capture using silane coupling agents is considerably investigated [7,8,9,10,11,12,13]. Gebald et al. 2014 was the first to suggest the use of nanocelluloses as a solid support for CO2 adsorption, achieving an adsorption of 1.39 mmol CO2 g-1 [14].
Similarly, nanocellulose adsorbents were modified using aminosilanes: N-(2-aminoethyl)-3-aminopropylmethyldimethoxysilane, phthalimide (1,3-dihydro-1,3-dioxoisoindole), N-(2-aminoethyl)-3-aminopropylmethyldimethoxysilane, (3-trimethoxysilylpropyl) diethylenediamine, N-(2-aminoethyl)-3-aminopropylmethyldimethoxysilane (AEAPDMS), achieving a CO2 adsorption between 0.5-5 mmol CO2 g-1 [7,8,9,10,11,12,13]. Valdebenito et al., 2018 reported the synthesis of nanocellulose thin films for CO2 adsorption from corn husks, oat hulls, kraft pulp and modified them using 3- aminopropyltrimethoxysilane, N-(2-aminoethyl)-3-aminopropyltrimethoxysilane, [3-(trimethoxysilyl) propyl] ethylenediamine and (3-trimethoxysilylpropyl) diethylenetriamine. The nanocellulose film derived from kraft pulp and modified using [3-(trimethoxysilyl) propyl] ethylenediamine had the highest CO2 adsorption capacity of 2.11 mmol g-1 at room temperature and atmospheric pressure. It is worth noting that this modified nanocellulose thin film has the highest amine content, but the lowest surface area, demonstrating that chemisorption was the dominant adsorption type [8].
Due to the significant effect of amino loading on CO₂ adsorption capacity, it is valuable to further explore how this variable affects the maximum CO₂ reversible adsorption capacity of the aerogel (CO2 adsorption and desorption stages) and its lifespan.
The main objective of this study was to evaluate the maximum reversible CO₂ adsorption capacity, stability, and lifespan of amino-functionalized nanocellulose aerogels as CO₂ adsorbent materials. By using the Decay Pressure Technique, which allows measurements at pressures higher than atmospheric, to assess the effect of pressure on CO₂ adsorption. This approach provided valuable insights into the potential of these materials for long-term use in CCS and CCU technologies.
2. Materials and Methods
The nanocellulose hydrogels were obtained from commercial cellulose (kraft pulp), the N-[3-(Trimethoxysilyl) propyl] ethylenediamine (DAMO), (2,2,6,6,6-tetramethylpiperidinyl-1-oxyl) TEMPO, NaClO, NaClO2, NaOH, glacial Acetic acid and ethanol were purchased from Merck/Sigma Aldrich.
2.1. Synthesis of Nanocellulose Aerogels
The nanocellulose hydrogels were obtained from commercial cellulose (kraft pulp), the N-[3-(Trimethoxysilyl) propyl] ethylenediamine, (DAMO, see Figure 1), (2,2,6,6-tetramethylpiperidinyl-1-oxyl) TEMPO, NaBr, NaClO, NaClO2, NaOH, glacial Acetic acid and ethanol were purchased from Merck/Sigma Aldrich.
The TEMPO-mediated oxidation of cellulose suspension was carried out according to Saito et al., (2005) with some modifications [15]. The oxidized fibers were dispersed in deionized water with a pulp concentration of 1 wt. % and then homogenized with a high-pressure homogenizer (NS1001L PANDA 2K-GEA) 8 times at a pressure drop of 800 bars to produce nanocellulose hydrogels. To produce nanocellulose aerogels from hydrogels, the lyophilization technique of an aqueous suspension of nanocellulose was used. This suspension was poured into a mold, then the samples were frozen at -21 °C for at least 24 hours to be lyophilized (FreeZone 6, Labconco) at -41 °C and 0.01 mbar for 12-30 hours depending on the amount of water to remove. At the end of this process, nanocellulose aerogels were obtained.
2.2. Nanocellulose Aerogels Silylation with N-[3-(Trimethoxysilyl) Propyl] Ethylenediamine (DAMO)
The obtained aerogels were functionalized with 3 different amino group loads: 4.62, 9.24 and 13.87 mmol portion of N-[3-(Trimethoxysilyl) propyl] ethylenediamine were hydrolyzed in a mixture of ethanol/water (95/5, wt.%). The pH was adjusted to 3.5 by adding acetic acid, and the solution was stirred at room temperature for 2 h. Then nanocellulose aerogel was immersed into this solution. The solution was stirred for 2 hours at room temperature. This protocol was repeated for the 3 amino group loadings. The modified nanocellulose aerogels were thoroughly washed with ethanol (soxhlet extraction with ethanol) before being dried at room temperature in a closed system and stored in a desiccator to avoid humidity [8].
2.3. Characterization
The nanocellulose aerogels functional groups analysis was carried out through Infrared Spectroscopy (FTIR). The FTIR analyses were performed using an Agilent Tensor 27 instrument in Fourier Transform mode (FTIR), and a total of 40 scans were collected, ranging from 400 to 4000 cm-1 [7,8].
Thermo-gravimetric analysis was performed using a STA 6000 apparatus from Perkin Elmer, at a heating rate of 10 °C min-1 up to 800 °C under the nitrogen atmosphere (flow rate = 90 mL min-1). About 30 mg of each sample were analyzed. [7,8,13]
Scanning Electron Microscopy (VP-SEM) Analysis was performed. The samples were adhered to the sample holder with double-sided carbon tape. The sample was visualized using a Backscatter detector (BSE) in variable pressure without any further sputtering under the following parameters: 10 KV energy, 20 Pa pressure, WD 10 mm in Scanning Electron Microscope (Hitachi SU3500, Tokyo, Japan), and images were acquired and analyzed with Hitachi software controller and Image J 1.53k Java 1.8.0_172 Software (Wayne Rasband and contributors, National Institutes of Health, Betheda, MA, USA) [8,9,13].
For X- Ray Photoelectron Spectroscopy (XPS) analysis Axis Ultra DLD electron spectrometer was used. Survey scans were recorded using monochromated Al Kα irradiation 50 W, 0.1 eV step and 160 eV analyzer pass energy. Analysis = 700um x 300 um Charge neutraliser ON; Narrows scans (elemental quantification & peak fitting): pass energy = 20 eV; Energy calibration by putting C 1s C-(C, H) component @285.0 eV [7,8].
2.4. CO2 Adsorption Measurements
The CO2 adsorption was measured through CO2 adsorption isotherms at 273 K (relative pressure:0.00002-0.02) in Micromeritis Tristar II 3020 equipment, using samples degassing at room temperature for 48 hours. The adsorption isotherms were adjusted using the BET, Langmuir, Freundlich and Temkin models (see Table 2) [7,8,13].
The Pressure-decay technique was used to determine CO2 adsorption capacity. The dual-chamber gas sorption cell was like Koros et al. (1976). Before measurements, 0.7 g–1 g of the sample was weighed and dried for 1 h at 70 ◦C (343 K). CO2 sorption experiments were carried out at 25 ◦C (298 K) and 4 bar. CO2 sorption capacity was calculated using Equations (1) and (2) [16].
Here, wCO2/g is the weight of gas adsorbed by the sample, Pi and Ti give the pressure and the temperature in the gas chamber, respectively; those parameters at equilibrium are represented as Peq and Teq; Vgc is the gas chamber’s volume, Vp is the volume of the sample, and Vt is the total volume of the sorption cell; the coefficient of compressibility “Z” for CO2 is obtained via Span-Wagner equations of state [16,17].
2.5. Nanocellulose Aerogels Adsorption/Desorption Cycles Study (TGA)
Adsorption/desorption cycles analysis was performed on a STA 6000 apparatus from Perkin Elmer, it used a flow of 50 mL min-1 of N2 (99.999% purity) for 24 hours to sample degassing. At that moment, a 20 mL min-1 of CO2 flow (99.999% purity) was added, which is maintained for 30 minutes. Then N2 conditions were resumed for 30 minutes. The analysis was carried out at room temperature 298 K for 20 times.
3. Results
This section may be divided by subheadings. It should provide a concise and precise description of the experimental results, their interpretation, as well as the experimental conclusions that can be drawn.
3.1. Characterization
Infrared spectroscopy analysis (FTIR)
The FTIR spectra of both nanocellulose aerogel unmodified and modified with di-aminosilane are shown in Figure 2. The spectrum of aerogel unmodified (A0) exhibited typical bands for cellulose, such as O-H stretching at 3200 cm-1, C-H stretching at 2900 cm-1, CH2 symmetric bending at 1400 cm-1, O-H and C-H bending as well as C—C and C—O stretching at 1380, 1310, and 1250 cm-1 respectively.
The spectrum of aerogel modified (A1; spectrum identical to the sample A2 and A3, not presented) showed successful grafting of di-amino silane on nanocellulose. The band at 2900 cm-1 was assigned to C-H stretching, the O-H stretching at 3200 cm-1 was replaced for the band at 3300 cm-1 assigned to N-H stretching. Also, the appearance of signals associated with vibrations from silicon-based linkages were observed at 1240 cm-1, and between 1180 and 700 cm-1 (Si—OH, Si—O—C) [8,9,13,14].
Nanocellulose aerogels Thermo-gravimetric analysis (TGA)
The functionalized aerogels (A1; thermogram identical to A2 and A3, not shown) were compared to unmodified (A0). Weight loss and derivative of weight loss versus temperature plots (Figure 3) for A0 show multiple degradation events. The onset of thermal degradation is practically the same for A0 and A1 aerogels.
The samples A0 and A1 thermogram presents two weight loss events preceding the main decomposition step as clear from Figure 3. The first degradation (between 90 and 100°C) may be attributed to loss of some bound volatile material, probably residual water. Similarly, the peak around 240 °C in all aerogel’s samples, correspond to hemicelluloses that were not removed during the pulping process. Finally, the peak around 320 ° in all samples corresponds to the degradation temperatures of the cellulose [7,8,9,14]. The developed nanomaterials (biodegradable materials) exhibited adequate thermal stability up to 240°C, which is one of the pre-requisitions of the CO2 capture materials in the industrial scale.
Scanning Electron Microscopy (VP-SEM)
SEM images of nanocellulose aerogels modified with DAMO A0 and A1 (A1; like A2 and A3 images) are shown in Figure 4. The unmodified aerogel exhibited a random pore structure and disorderly cross-linked CNFs were observed. After amino groups grafting, many planar structures with individual CNFs irregularly attached to the cellulose sheet were observed (Figure 4b). These results are in accordance with the provisory reported studies in the literature [9,13].
X- Ray Photoelectron Spectroscopy (XPS)
XPS measurements were next performed to further analyze the chemical composition and surface electronic state of the CNFs aerogel samples (Figure 5). In Figure 5a, the wide scan spectra of unmodified CNFs sample (A0) did not display any signals in the N1s region, but binding energy (BE) peaks from the N1s at 398–402 eV appeared in the A1, A2 and A3 samples. The N 1s spectrum of modified CNFs aerogels (Figure 5b–d) can be fitted to three peaks with the BE at 400 (R2NH and RNH2) and 402.0(R3N) eV, demonstrating that the DAMO anchored to the surface of CNFs aerogels [7,8,13].
The N 1s deconvolution spectrum reveals that as the amino group loading in the aerogels increases (Figure 5b–d), the signal intensity for the R3N and R2NH groups decreases, while the intensity of the RNH2 group increases. Consequently, aerogel A3 exhibits the highest percentage of NH2 groups grafted onto the nanocellulosic matrix, making them available for CO2 capture.
CO2 adsorption isotherms at 273 K
CO2 adsorption isotherms were carried out at 273 K for all samples studied and were classified as type 1 isotherms in the BDDT classification, corresponding to microporous solids. To calculate the CO2 adsorption capacity, the experimental data were adjusted to Langmuir, BET, Freundlich and Temkin models.
Table 3 shows some parameters derived from the adsorption isotherms for nanocellulose aerogels at 273 K. The adsorption isotherms at 273 K are conducted at low temperatures to measure the amount of CO2 that can be adsorbed by a material at different relative’s pressures. At this temperature, the adsorption is physical, allowing for the evaluation of the material’s maximum adsorption capacity without the effects of chemical reactions at higher temperatures. This technique is very useful for characterizing porous materials and comparing their adsorption capacity under controlled conditions. However, the results obtained at this temperature may not represent the materials behavior at temperatures more relevant to practical applications, such as CO2 capture under environmental or industrial conditions.
For being physical adsorption in multilayers, the BET model was used to calculate the amount of CO2 adsorbed. Nanocellulose aerogels modified with different amino-silane loads, i.e., 4.62, 9.24 and 13.87 mmol, showed CO2 adsorption of 0.21, 0.25 and 0.22 mmol CO2 g-1. at 273 K, this adsorption was due to physisorption. No significant differences were observed in the adsorption of the 3 aerogels studied. Aerogel A2 showed slightly higher CO2 adsorption, due to having a slightly larger surface area than the others as can be noticed from Table 4.
Baraka et al., 2024, indicate that most cellulose nanofiber aerogels reported in the literature have a BET surface area reaching from 7.1 to 335 m2 g-1. Therefore, our results are in close agreement (154 m2 g-1) under the same drying method (Freeze-drying) and functionalization method (Liquid-phase) [18].
3.1.1. CO2 Adsorption Capacity Through Pressure-Decay Technique at 298 K and 4 bar
Figure 6 shows CO2 adsorption capacities of each aerogel (A1, A2, A3). The values obtained for the DAMO-modified nanocellulose aerogels reached from 3.17 to 7.86 mmol CO2 g-1 at 25 °C, proving a significant increase in CO2 adsorption with the increase in amino group content in the nanocellulose aerogel. These results are promising. The literature reports CO2 adsorption capacities of amine-modified cellulose nanofiber aerogels (CNFs) ranging from 1.39 to 2.4 mmol g-1. These values are lower than those achieved in the present work at the same adsorption temperature. Sepahvand et al., (2020) obtained 5.2 mmol g-1 of CO2 adsorption from CNFs modified with phthalimide (1.5% phthalimide content) under the same Freeze-drying and Liquid-phase functionalization method, though using a non-linear amine (phthalimide). However, this value is lower than the adsorption capacities achieved by the sample A2 and A3, attaining a CO2 capture value of 5.98 and 7.86 mmol g-1 respectively [13].
Moreover, it is observed that the obtained results are higher than the adsorption capacities of other typical adsorbents used in CO2 capture. For example, APTS-modified MCM-41, reached 1.33 mmol CO2 g-1 [19]. Furthermore, MCM-41 exhibit higher BET surface area (1602 m2 g−1) than the nanocellulose aerogels studied in the present work.
The high adsorption values obtained are mainly explained by the chemisorption mechanisms between the amino groups and CO2 molecules. The reaction of CO2 with DAMO involves a direct reaction between the carbon atom of CO2 and the nitrogen atom of the amine, forming a covalent bond [20,21]. Therefore, chemical modification of nanocellulose with amine moieties enhances the adsorption capacity by providing many active binding sites that promote interactions between the aerogel and CO2 molecules [20,21]. The molar ratio of amine introduced could also significantly influence the CO2 adsorption efficiency of modified nanocellulose aerogels. A high concentration of amine promotes a high adsorption capacity [22].
This trend is consistent with the results obtained from the XPS analysis proving the higher %NH2 where a linear tendency was observed. With a higher amino group loading, there was an increased nitrogen content (amino group according to the supported amine reaction mechanism, via carbamate ion) that was grafted onto the nanocellulosic matrix. Additionally, there was also greater CO2 adsorption capacity measured at room temperature. Regarding our results, a significant increase in CO2 adsorption is observed with a slight increase in DAMO loading (A1: 11.25wt %, A2: 11.30 wt %, and A3: 11.35 wt%). The Pressure Decay Technique can be used at different temperatures and pressures, allowing for a simulation closer to real operating conditions. It is useful for studying the kinetics of adsorption and desorption and the adsorption capacity [18].
Unlike most studies reported in the literature, this research uses the Pressure Decay Technique to determine the amino-functionalized CNFs aerogel maximum reversible adsorption CO2 capacity. This method allows for pressures above atmospheric levels, making it possible to evaluate how increased pressure affects the adsorbent capacity at room temperature. This approach more accurately simulates the higher-pressure conditions typical of industrial carbon capture and utilization processes. The high CO₂ adsorption capacity of sample A3 (with the biggest amino group load) compared to review literature studies, is largely attributed to raising the pressure from around 1 bar to 4 bar [23]. The higher CO₂ pressure enhanced CO₂ density and its interaction with amino groups on the aerogel surface, promoting efficient carbamate ion formation and enabling greater CO₂ capture.
3.1.2. Nanocellulose Aerogels Lifespan
The study of CO2 adsorption/desorption cycles was conducted using the aerogel that exhibited the highest CO2 adsorption, specifically sample A3. Figure 7 shows that the CO2 desorption was fast and completed after 30 min. 95 wt %. of the absorbed CO2 was desorbed during 20 adsorption/desorption cycles (reversible adsorption) measured at room temperature (298 K) in the thermobalance (TGA). It can be concluded that this number of cycles is likely higher since after 20 cycles, the aerogel continued to exhibit the same behavior as in the first cycle. Gebald et al.,2011 and Zhu et al.,2011, reported for a similar substrate, the CO2 desorption was fast and completed after 30 min. More than 85% of the CO2 was desorbed within 19 min at a packed bed temperature below 80°C [7,13,14].
Figure 8 shows the sorption/desorption test (Pressure Decay Technique) using the same sample (A3) up to 7 cycles. The sample was regenerated by heating up to 70°C at the end of each sorption test. The results prove that the sample retains the CO2 sorption capacity up to 7 cycles which can be likely higher as the sample retained to exhibit the same sorption capacity as the 1st cycle, demonstrating the recyclability of the synthesized material. These results agree with results obtained from the adsorption/desorption cycles determination at 298 K by thermogravimetric analysis. Both techniques showed the stability and reusability of the synthesized materials, which is one of the pre-requisitions of the CO2 capture materials in the industrial scale.
4. Discussion
This study highlights the potential of DAMO-modified nanocellulose aerogels for scalable CO₂ capture and storage applications. The predominant chemisorption mechanism, characterized by the interaction between CO₂ molecules and amino groups to form covalent bonds, was found to be highly effective for CO₂ adsorption. A significant increase in CO2 adsorption was observed with a slight increase in DAMO loading (A1: 11.25 wt %, A2: 11.30 wt%, and A3: 11.35 wt%) ranged from 3.17 to 7.86 mmol CO2 g-1 at 298 K (25 °C) and 4 bar. The use of the Decay Pressure Technique allowed the study to examine the effect of pressure on CO₂ adsorption at pressures higher than atmospheric, simulating real industrial conditions more closely.
The nanocellulose aerogels demonstrated excellent thermal stability up to 240°C and consistent performance across adsorption/desorption cycles, desorbing 95% of the adsorbed CO₂ over 20 cycles at room temperature. This stability and reusability underscore their practicality for repeated use in industrial CO₂ capture processes. These results support the feasibility of utilizing these biodegradable materials in scalable CO₂ capture technologies, making them promising candidates for sustainable and efficient carbon capture alternatives.
Author Contributions
For research articles with several authors, a short paragraph specifying their individual contributions must be provided. The following statements should be used “Conceptualization, F. Valdebenito and L AzocarY.; methodology, E.Elgueta and M. Nisar.; software, F Sandoval..; validation, O.Valerio., C.Albornoz. and V.Rivera.; formal analysis, F.Valdebenito.; investigation, F.Valdebenito.; resources, F.Valdebenito.; data curation, C-P Quezada.; writing—original draft preparation, F.Valdebenito, S Lira ; writing—review and editing, L.Azocar, M Nisar.; visualization, A. Narvaez.; supervision, R. Muñoz.; project administration, F.Valdebenito.; funding acquisition, F.Valdebenito. All authors have read and agreed to the published version of the manuscript.” Please turn to the CRediT taxonomy for the term explanation. Authorship must be limited to those who have contributed substantially to the work reported.
Funding
Please add: “This research is funded by ANID Subvención a la Instalación en la Academia año 2021 SA77210113”.
Data Availability Statement
We encourage all authors of articles published in MDPI journals to share their research data. In this section, please provide details regarding where data supporting reported results can be found, including links to publicly archived datasets analyzed or generated during the study. Where no new data were created, or where data is unavailable due to privacy or ethical restrictions, a statement is still required. Suggested Data Availability Statements are available in section “MDPI Research Data Policies” at https://www.mdpi.com/ethics.
Acknowledgments
The authors thanks to the Proyect Subvención a la Instalación en la Academia año 2021 SA77210108 and Project FAA2024 of the Universidad Católica de la santísima Concepción.
Conflicts of Interest
The authors declare no conflicts of interest.
References
- Climate change (2023). Synthesis report, IPCC. (Accessed 26 October 2024).
- IEA (2020). IEA Energy Technology Perspectives 2020. https://www.iea.org/reports/energy-technology-perspectives-2020. (Accessed 26 October 2024).
- Jiang; et al., (2024). Emerging Technologies Review: Carbon Capture and Conversion to Methane and Methanol. United States: N. p. [CrossRef]
- Patel; et al. (2017). Carbon Dioxide Capture Adsorbents: Chemistry and Methods. ChemSusChem, 10(7), 1864-5631. [CrossRef]
- Pardakhti; et al. (2019). Trends in Solid Adsorbent Materials Development for CO2 Capture. ACS Applied Materials & Interfaces, 11(38), 34533-34559. [CrossRef]
- Dao Ho; et al., (2021). A review on the emerging applications of cellulose, cellulose derivatives, and nanocellulose in carbon capture. Environmental Research, 197, 111100. [CrossRef]
- Zhu; et al. (2024). Amino-functionalized nanocellulose aerogels for the superior adsorption of CO2 and separation of CO2/CH4 mixture gas. Carbohydr Polym., 323, 121393. [CrossRef]
- Valdebenito; et al., (2018). CO2 adsorption of surface-modified cellulose nanofibril films derived from agricultural wastes. ACS Sustain. Chem. Eng., 6, 12603–12612. [CrossRef]
- Wu; et al., (2018). Effects of amine loading on the properties of cellulose nanofibrils aerogel and its CO2 capturing performance. Carbohydr. Polym., 194, 252–259. [CrossRef]
- Li; et al., (2020). The aminosilane functionalization of cellulose nanofibrils and the mechanical and CO2 adsorption characteristics of their aerogel. Ind. Eng. Chem. Res., 59, 2874–2882. [CrossRef]
- Zhang; et al., (2019). Aminosilane-grafted spherical cellulose nanocrystal aerogel with high CO2 adsorption capacity. Environ Sci Pollut Res, 26, 16716–16726. [CrossRef]
- Zhang; et al., (2020). Gas phase synthesis of aminated nanocellulose aerogel for carbon dioxide adsorption. Cellulose, 27, 2953–2958. [CrossRef]
- Sepahvand; et al., (2020). A promising process to modify cellulose nanofibers for carbon dioxide (CO2) adsorption. Carbohydr. Polym., 230. [CrossRef]
- Gebald; et al., (2011). Amine-Based Nanofibrillated Cellulose as Adsorbent for CO2 Capture from Air. Environ Sci Technol, 45(20), 9101-9108. [CrossRef]
- Saito et al., (2005). Ion-exchange behavior of carboxylate groups in fibrous cellulose oxidized by the TEMPO-mediated system. Carbohydr Polym, 61(2), 183-190. [CrossRef]
- Koros; et al., (1976). Design considerations for measurement of gas sorption in polymers by pressure decay. J Polym Sci, Part B: Polym Phys Edition, 14. [CrossRef]
- Hannon; et al., (2020). Fast and accurate core analysis by the full-immersion pressure-pulse decay: Part 1—Theory. SPE Res Eval & Eng, 23, 1190–1202. [CrossRef]
- Baraka; et al., (2024). The emergence of nanocellulose aerogels in CO2 adsorption. Sci Total Environ, 912, 169093. [CrossRef]
- Aquino et al. (2023). Alternative Synthesis of MCM-41 Using Inexpensive Precursors for CO2 Capture Inorganics 11, no. 12: 480. [CrossRef]
- Wilcox, J. (2012). Carbon Capture. Springer, New York, NY. Published: 16 April 2014. https://link.springer.com/book/10.1007/978-1-4614-2215-0.
- Xu et al., (2022). Comparison of characteristics of the cellulose nanocrystal aerogels aminosilane-functionalized through gas-phase reaction. J Porous Mater, 29, 745–758. [CrossRef]
- Salam; et al., (2014). Chemically Modified Solid Adsorbents for CO2 Capture. Energy Procedia, 63, 8153-8160. [CrossRef]
- Anas et al., (2017). Thermodynamics of Adsorption of Carbon Dioxide on Various Aerogels, Journal of CO2 Utilization,21,82-88. [CrossRef]
Figure 1.
N-3(trimethoxy silyl) propyl] ethylenediamine (DAMO).
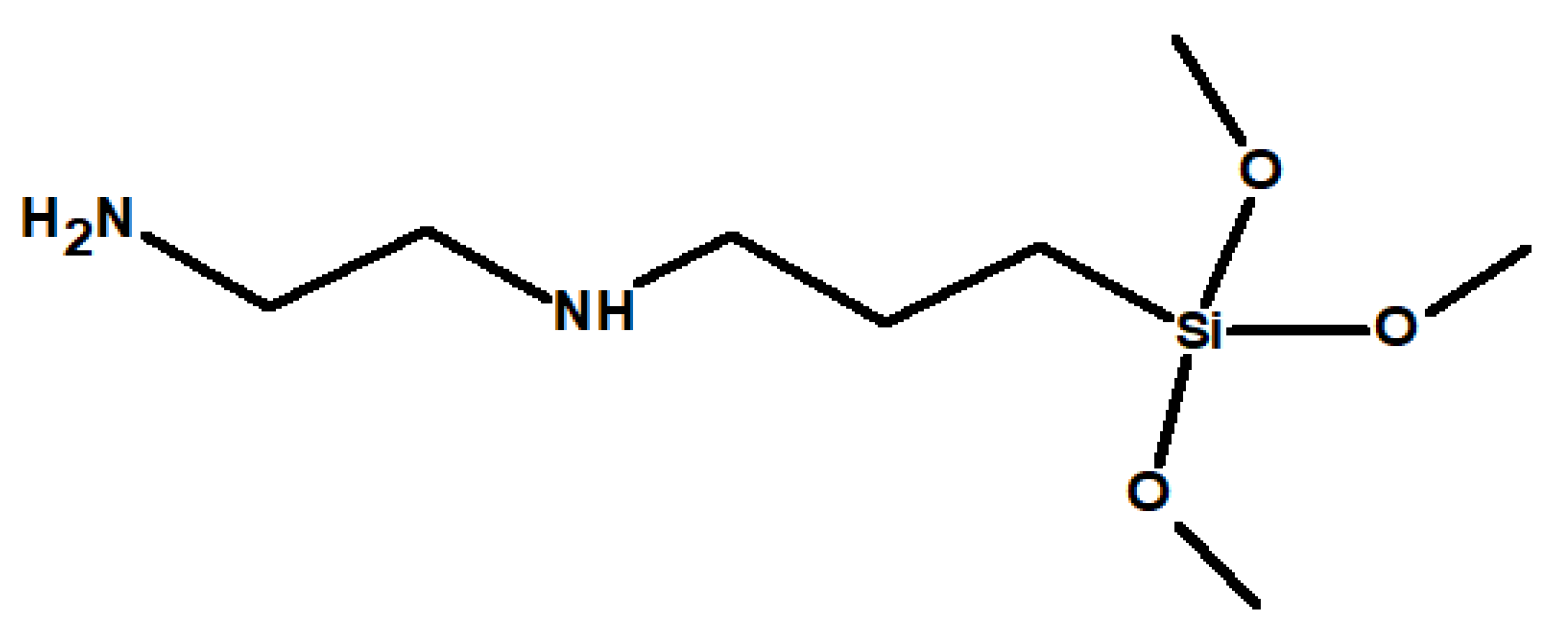
Figure 2.
Nanocellulose aerogels FTIR spectrum. A0: unmodified nanocellulose aerogel, A1: DAMO grafted nanocellulose aerogel.
Figure 2.
Nanocellulose aerogels FTIR spectrum. A0: unmodified nanocellulose aerogel, A1: DAMO grafted nanocellulose aerogel.
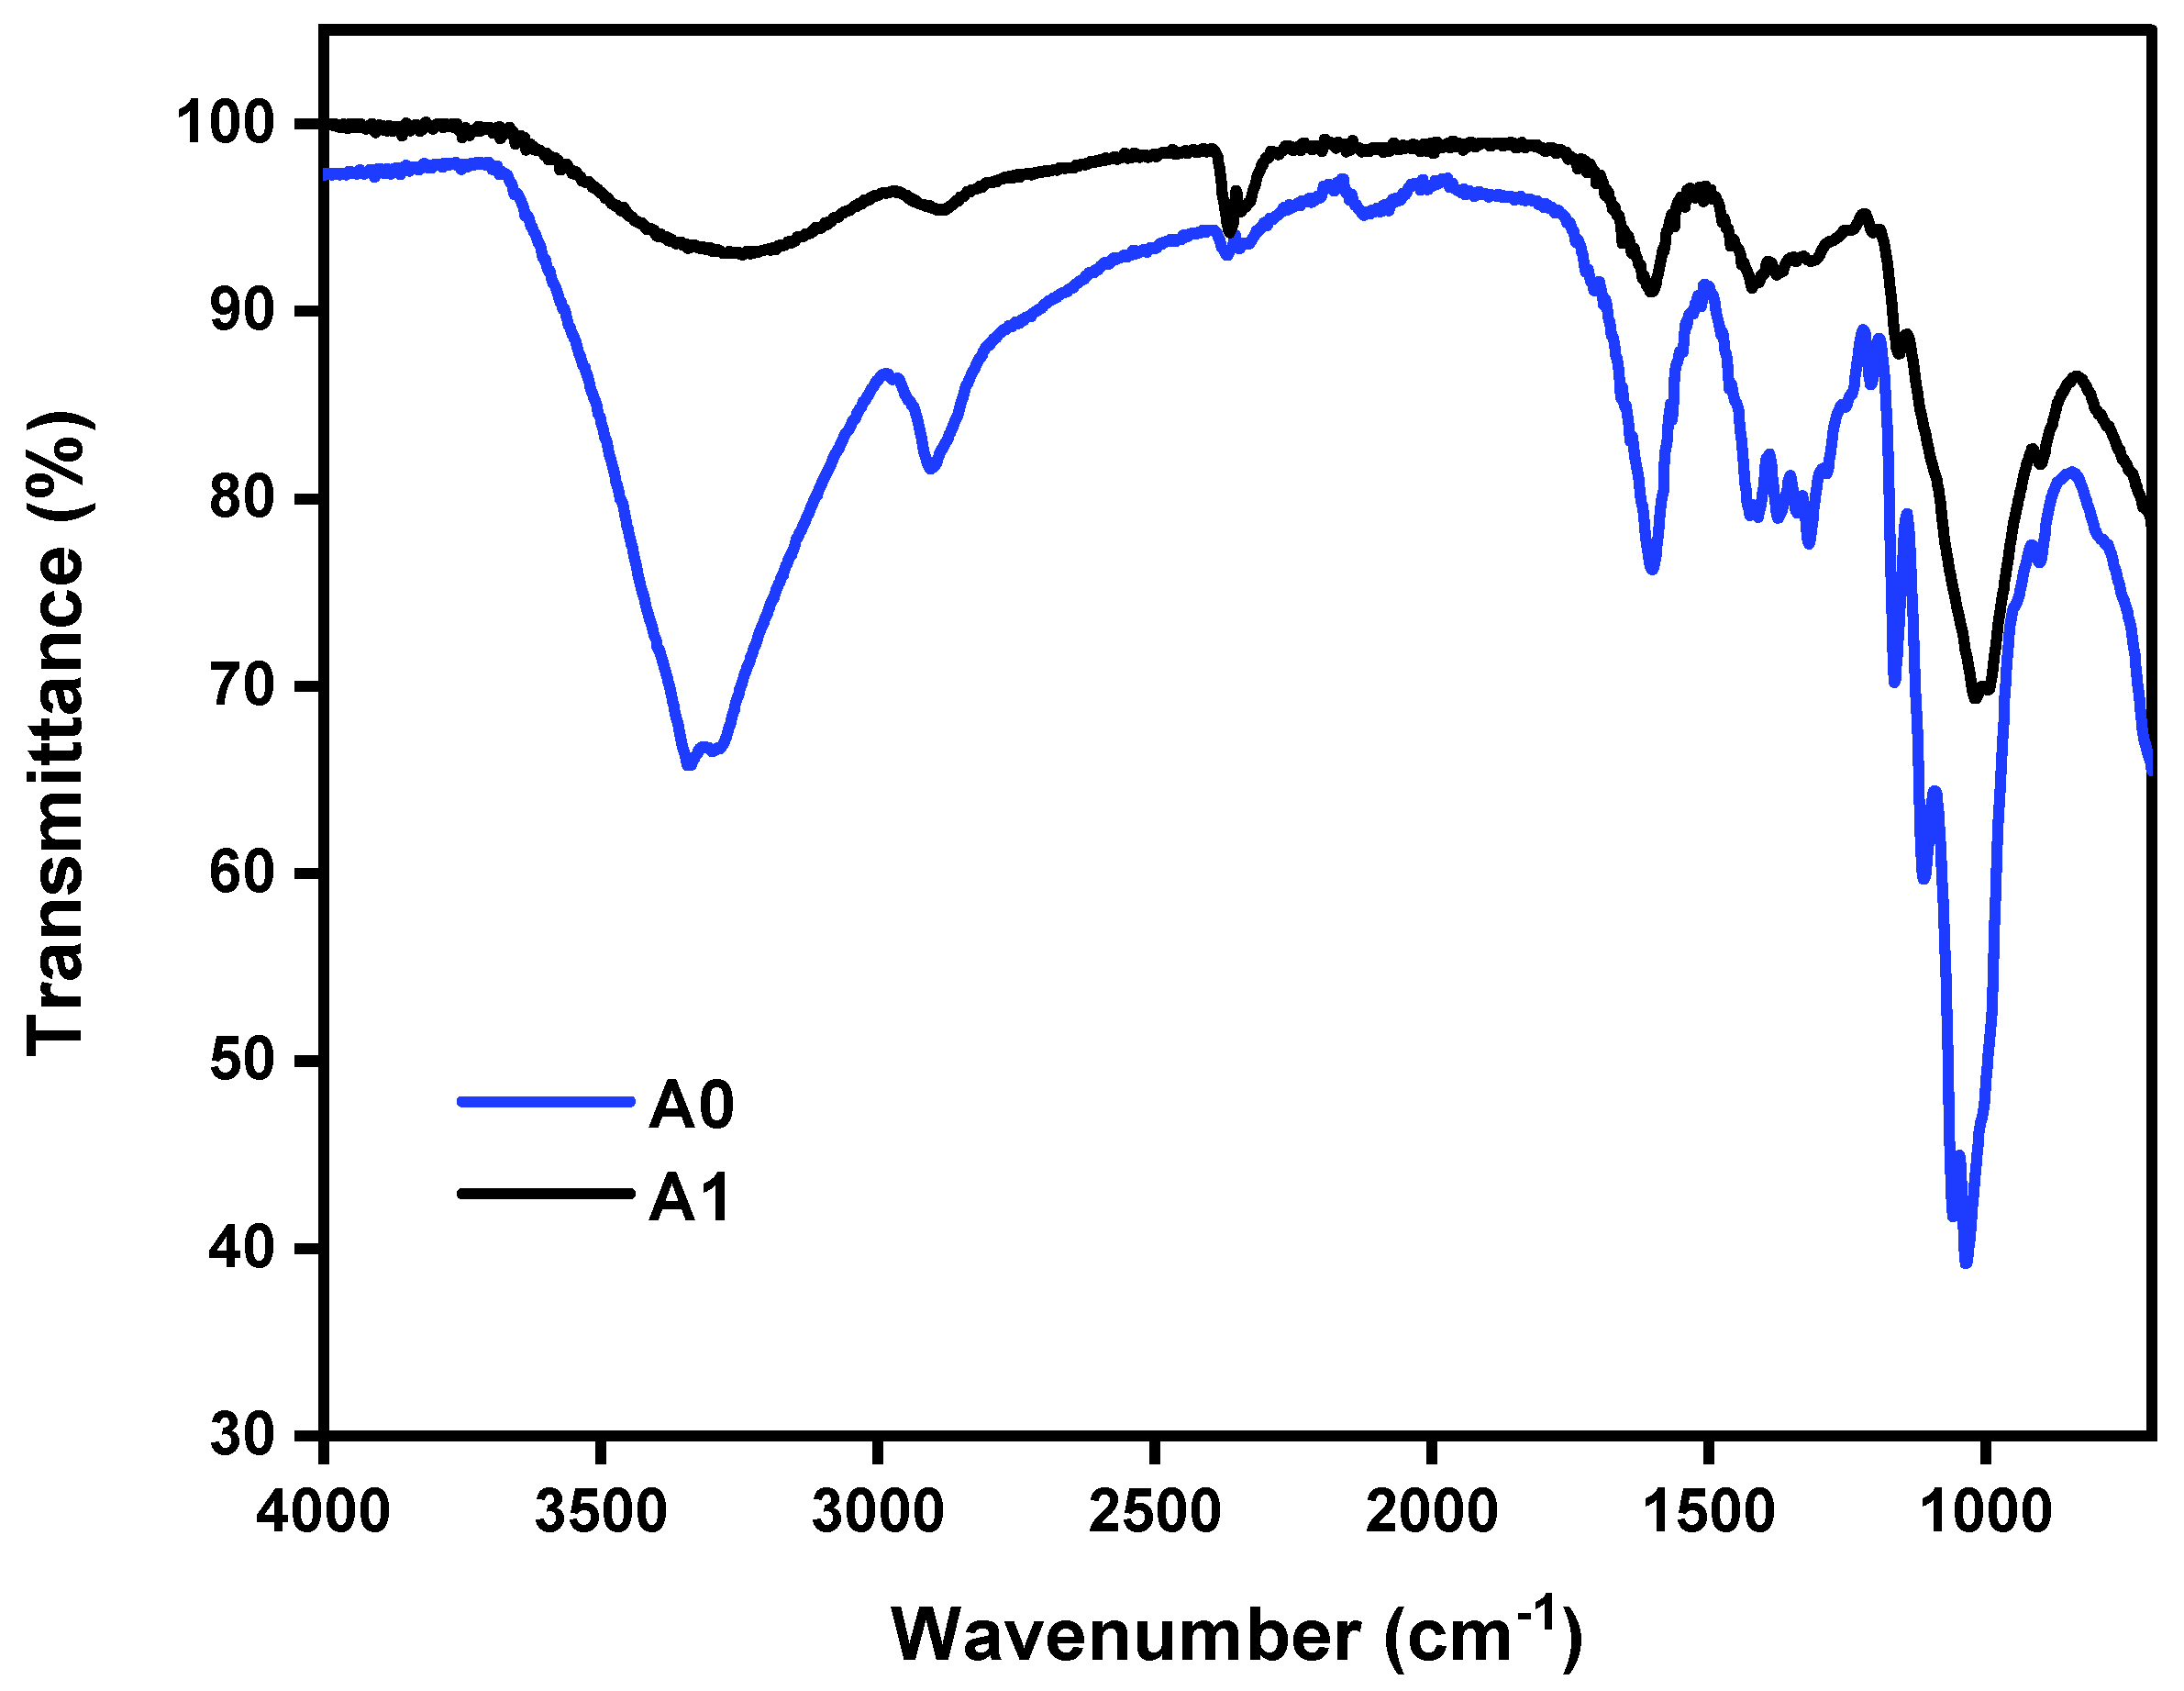
Figure 3.
DTG/ TGA curves of nanocellolose aerogels. A0: unmodified nanocellulose aerogel, A1: DAMO grafted nanocellulose aerogel.
Figure 3.
DTG/ TGA curves of nanocellolose aerogels. A0: unmodified nanocellulose aerogel, A1: DAMO grafted nanocellulose aerogel.
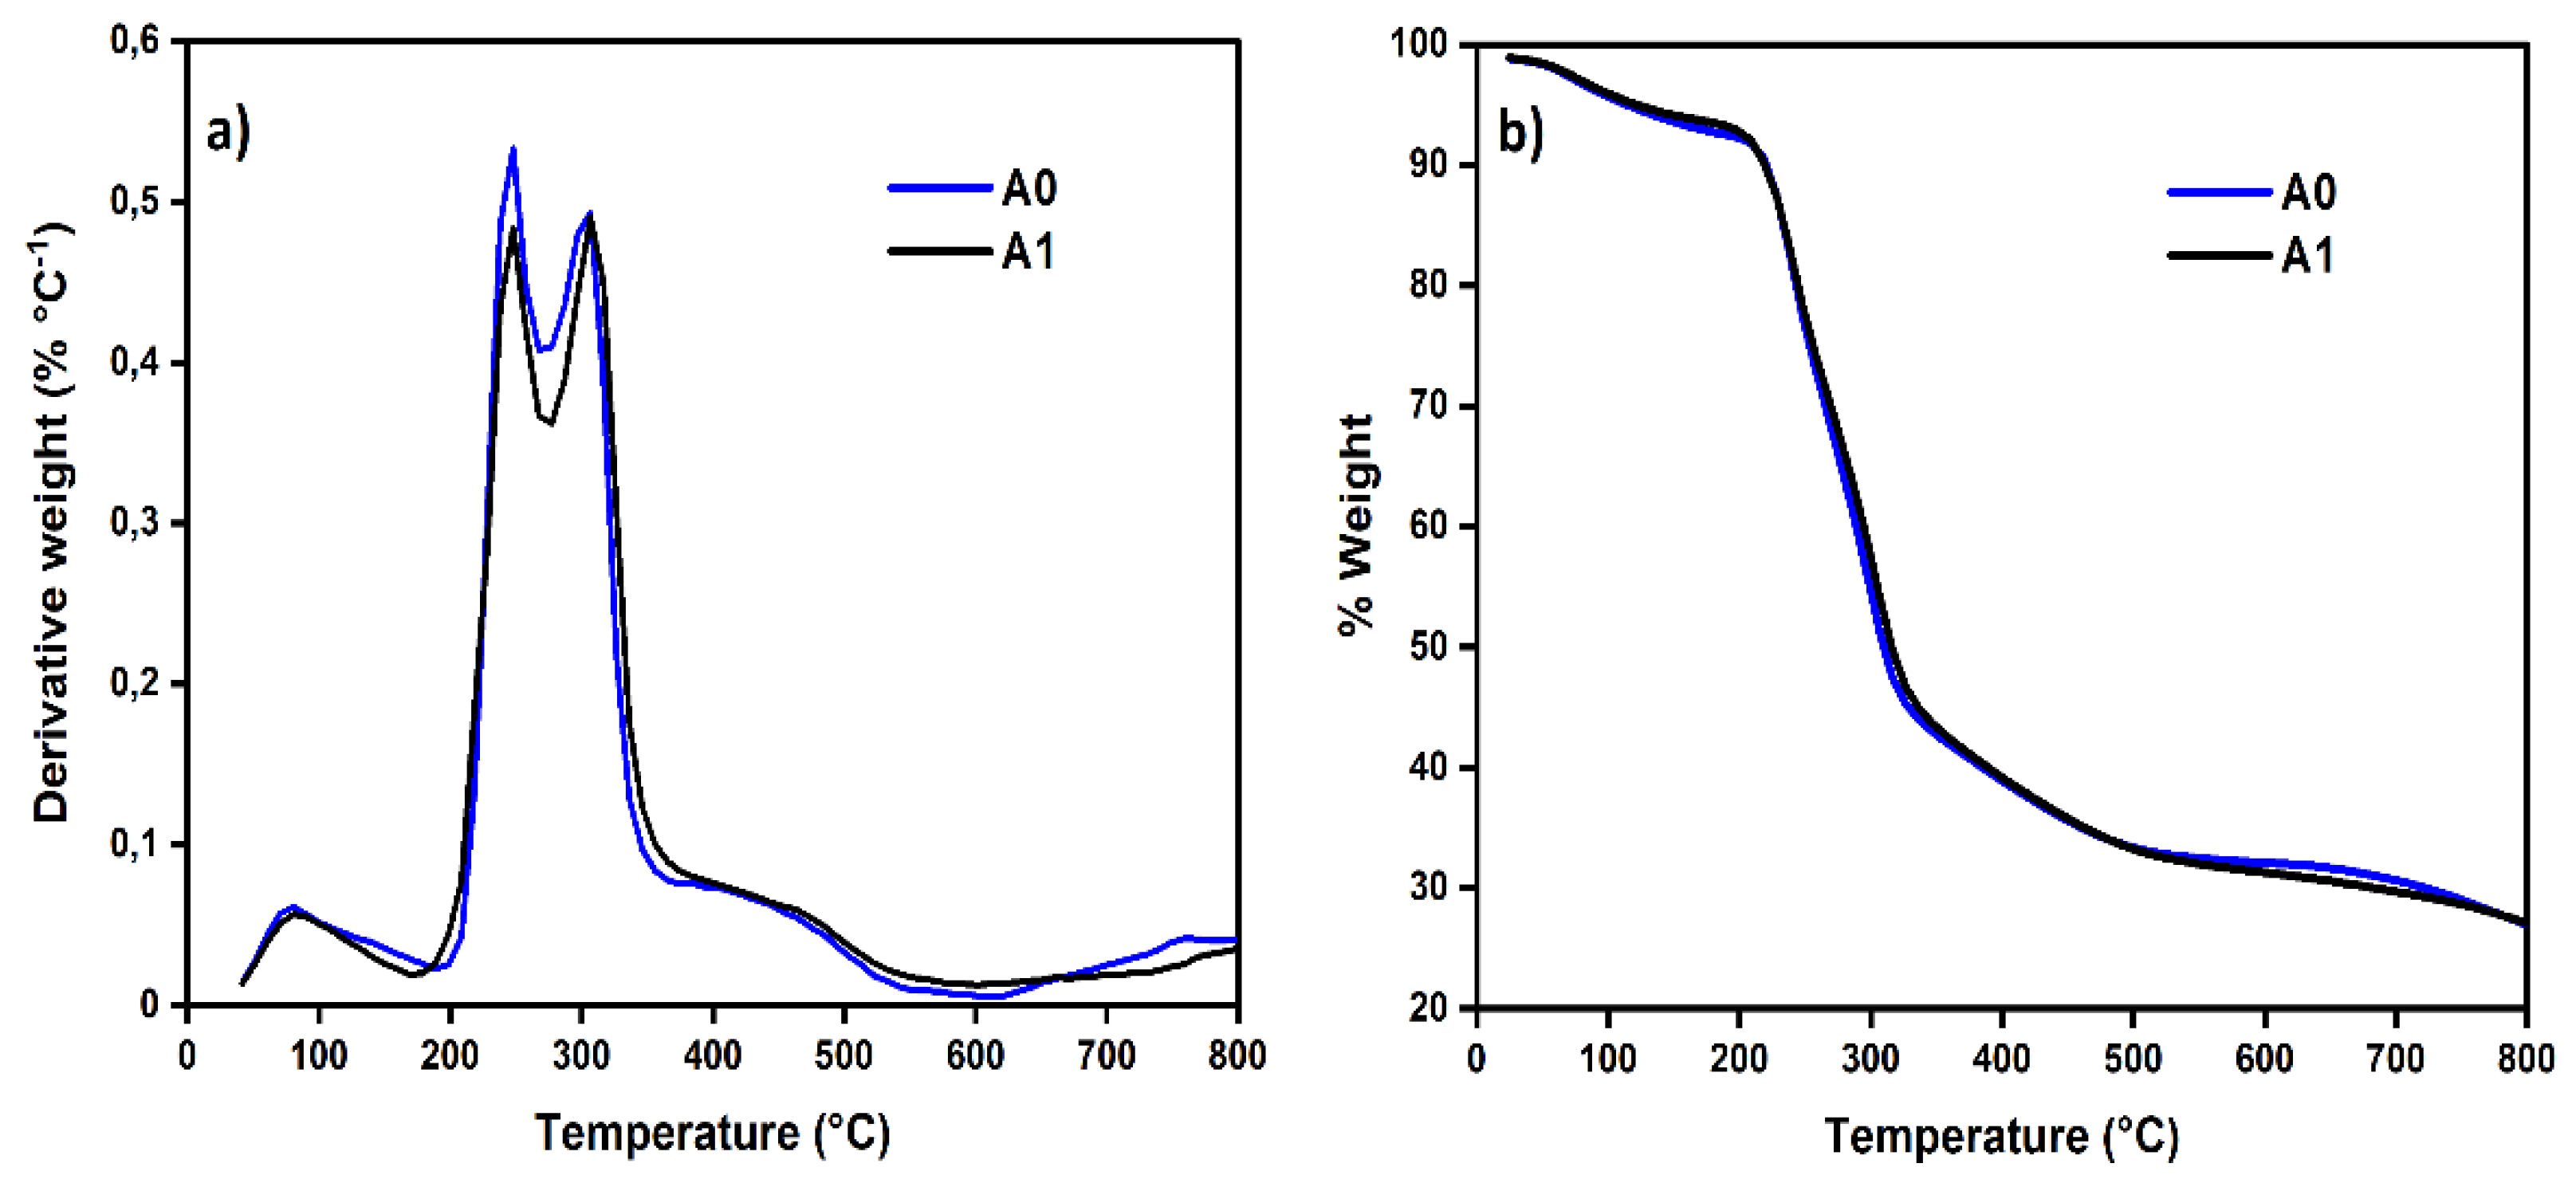
Figure 4.
SEM images of nanocellulose aerogels (a) A0 unmodified nanocellulose aerogel and (b) A1 DAMO grafted nanocellulose aerogel.
Figure 4.
SEM images of nanocellulose aerogels (a) A0 unmodified nanocellulose aerogel and (b) A1 DAMO grafted nanocellulose aerogel.
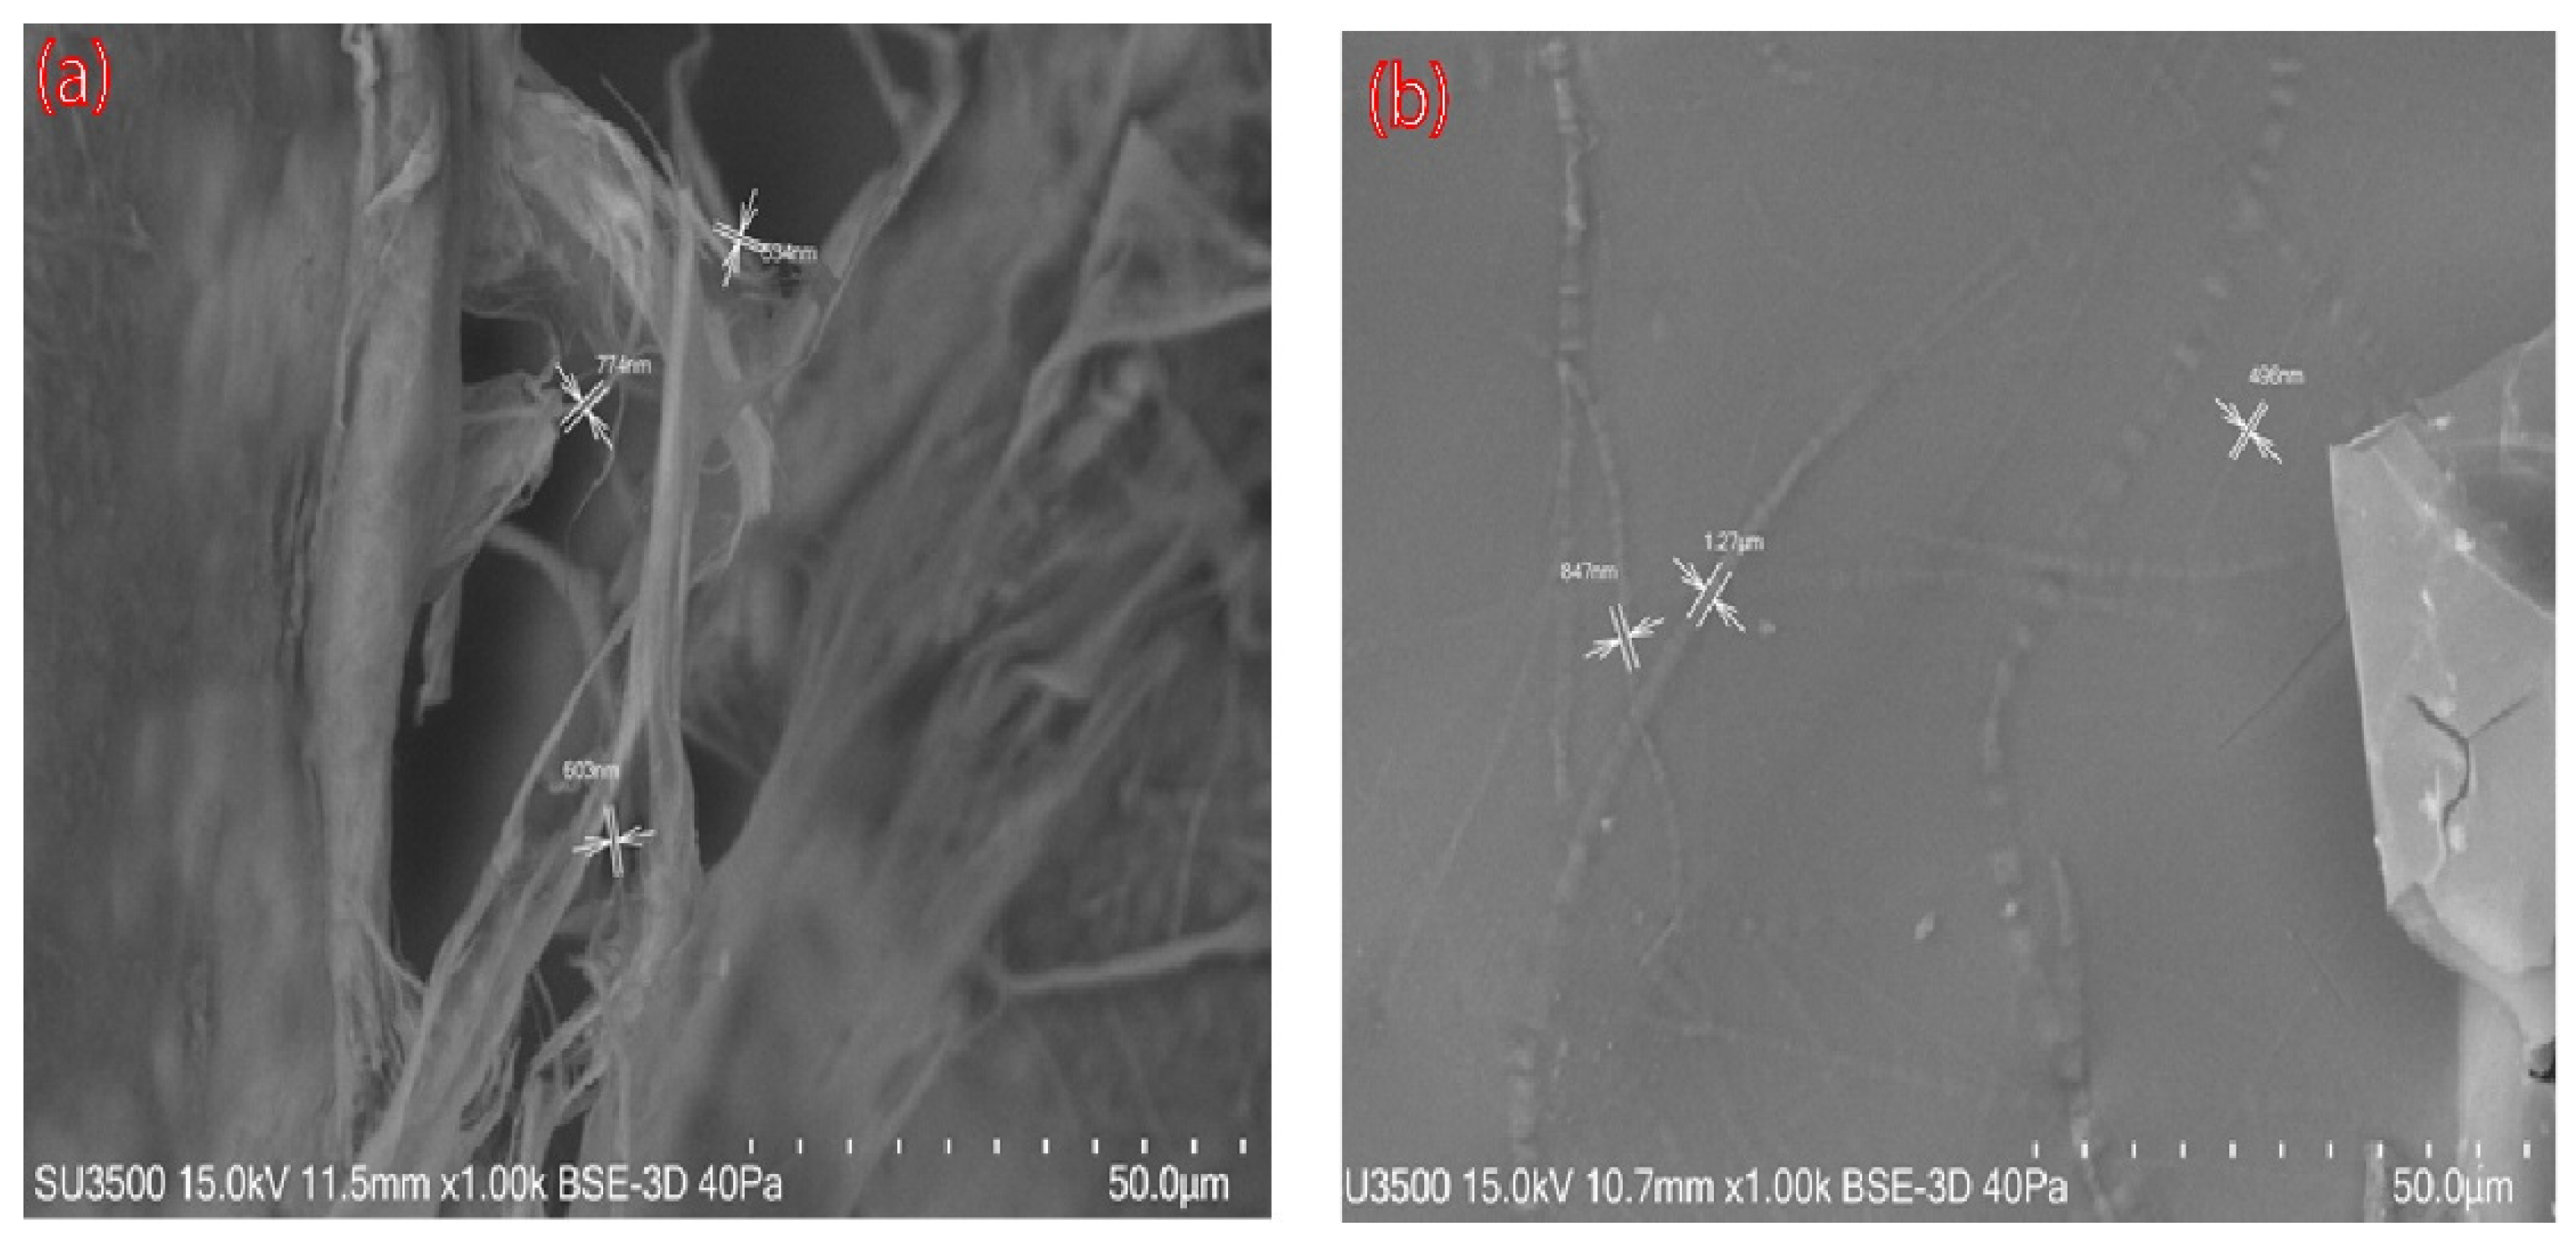
Figure 5.
Aerogels samples N 1s deconvolution XPS curves, A0 (a), A1(b), A2(c) and A3(d).
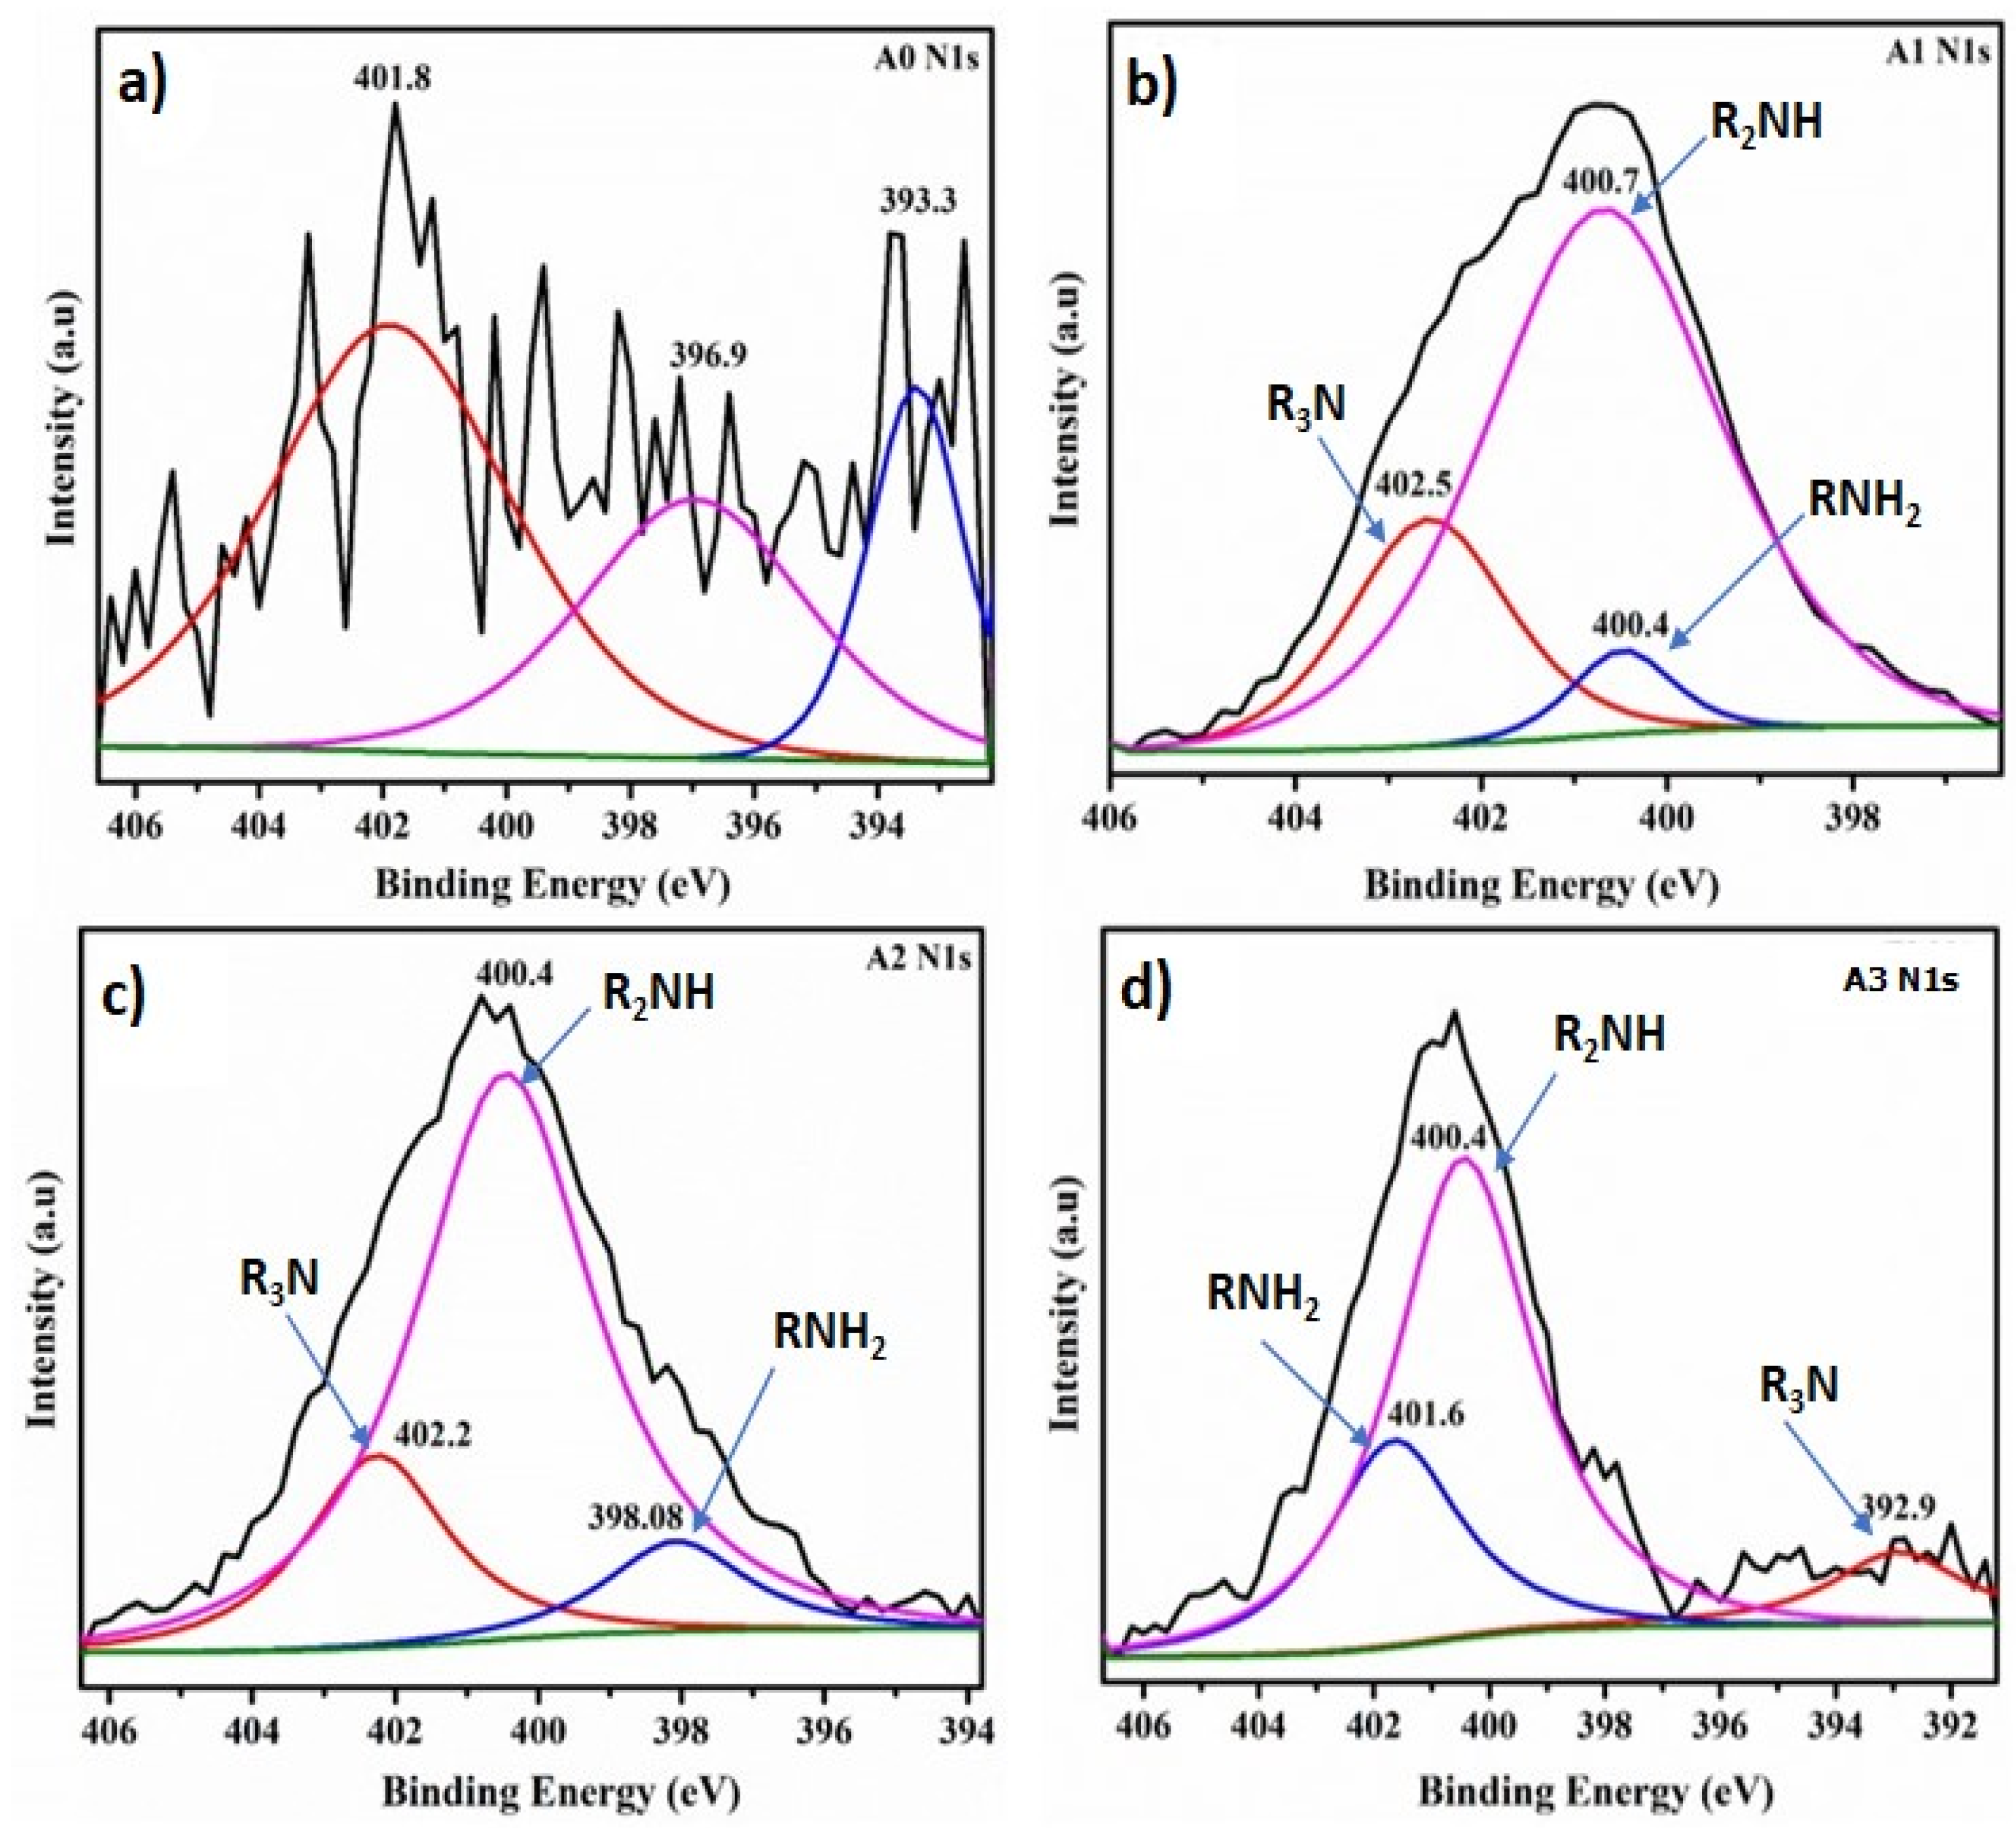
Figure 6.
Amino group load effect on the CO2 adsorption capacity of nanocellulose aerogels calculated by pressure decay technique.
Figure 6.
Amino group load effect on the CO2 adsorption capacity of nanocellulose aerogels calculated by pressure decay technique.
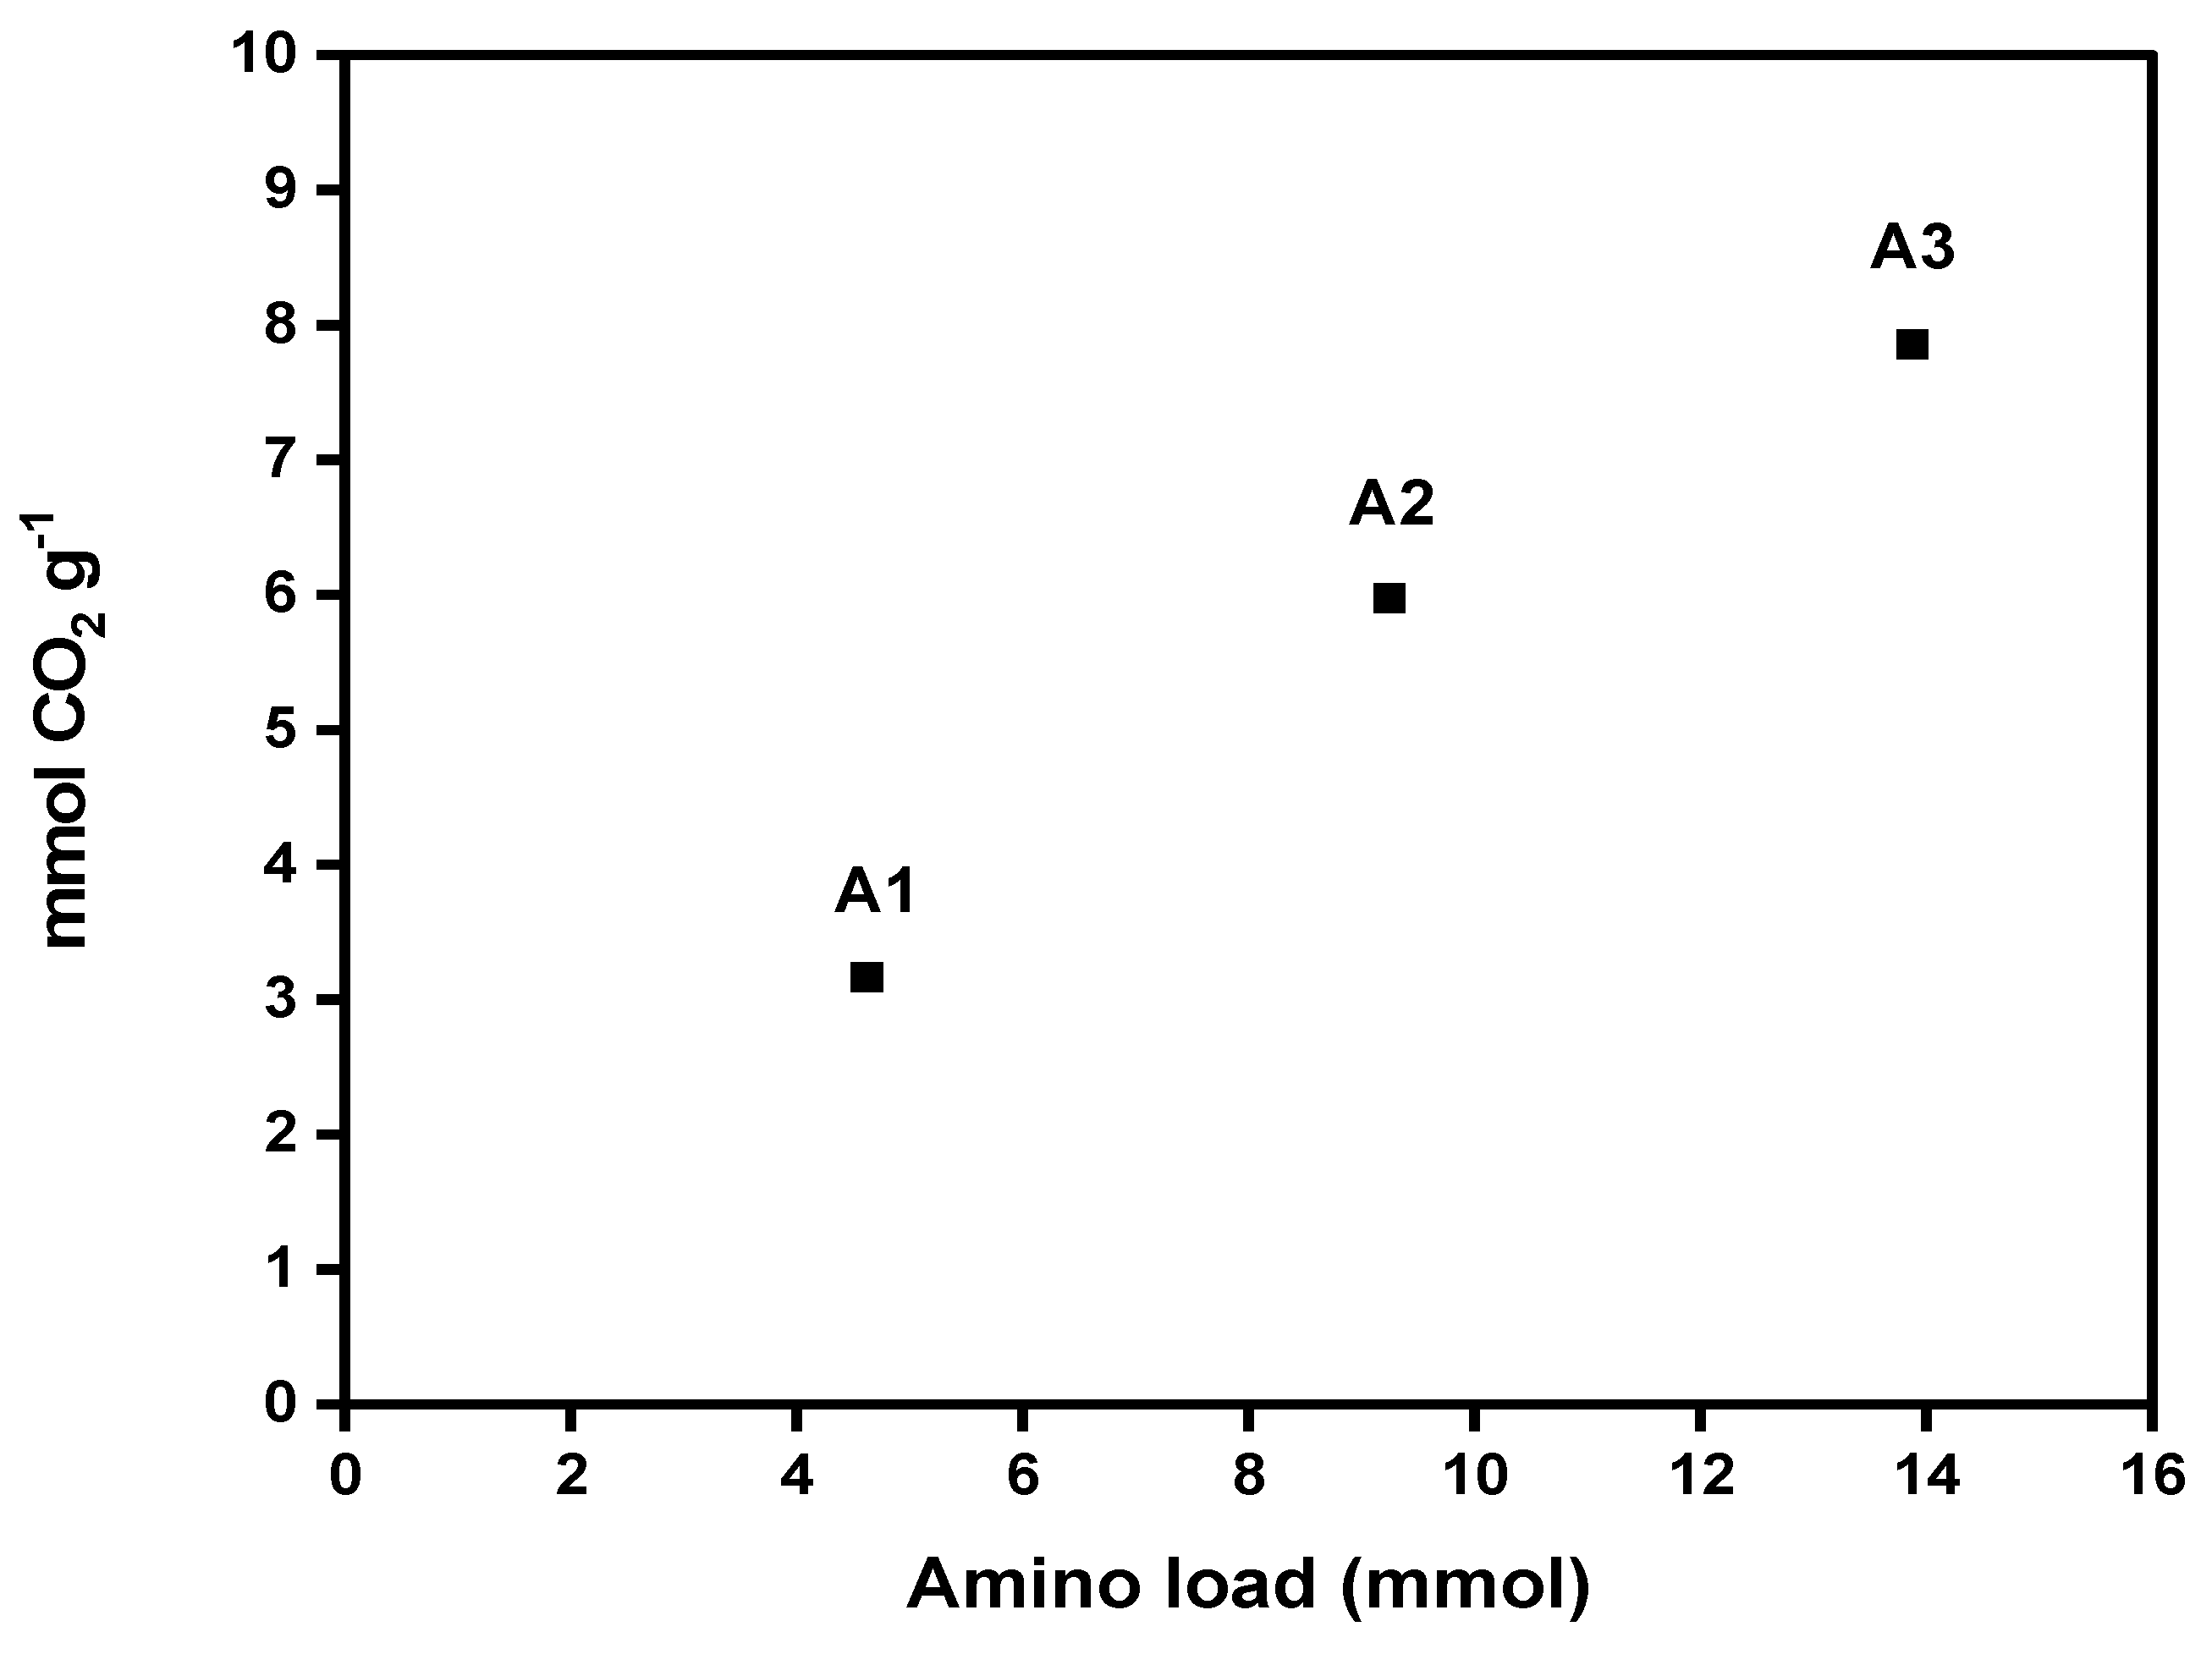
Figure 7.
Nanocellulose aerogel (A3) adsorption/desorption cycles determination at 298 K and 1 bar by thermogravimetric analysis.
Figure 7.
Nanocellulose aerogel (A3) adsorption/desorption cycles determination at 298 K and 1 bar by thermogravimetric analysis.
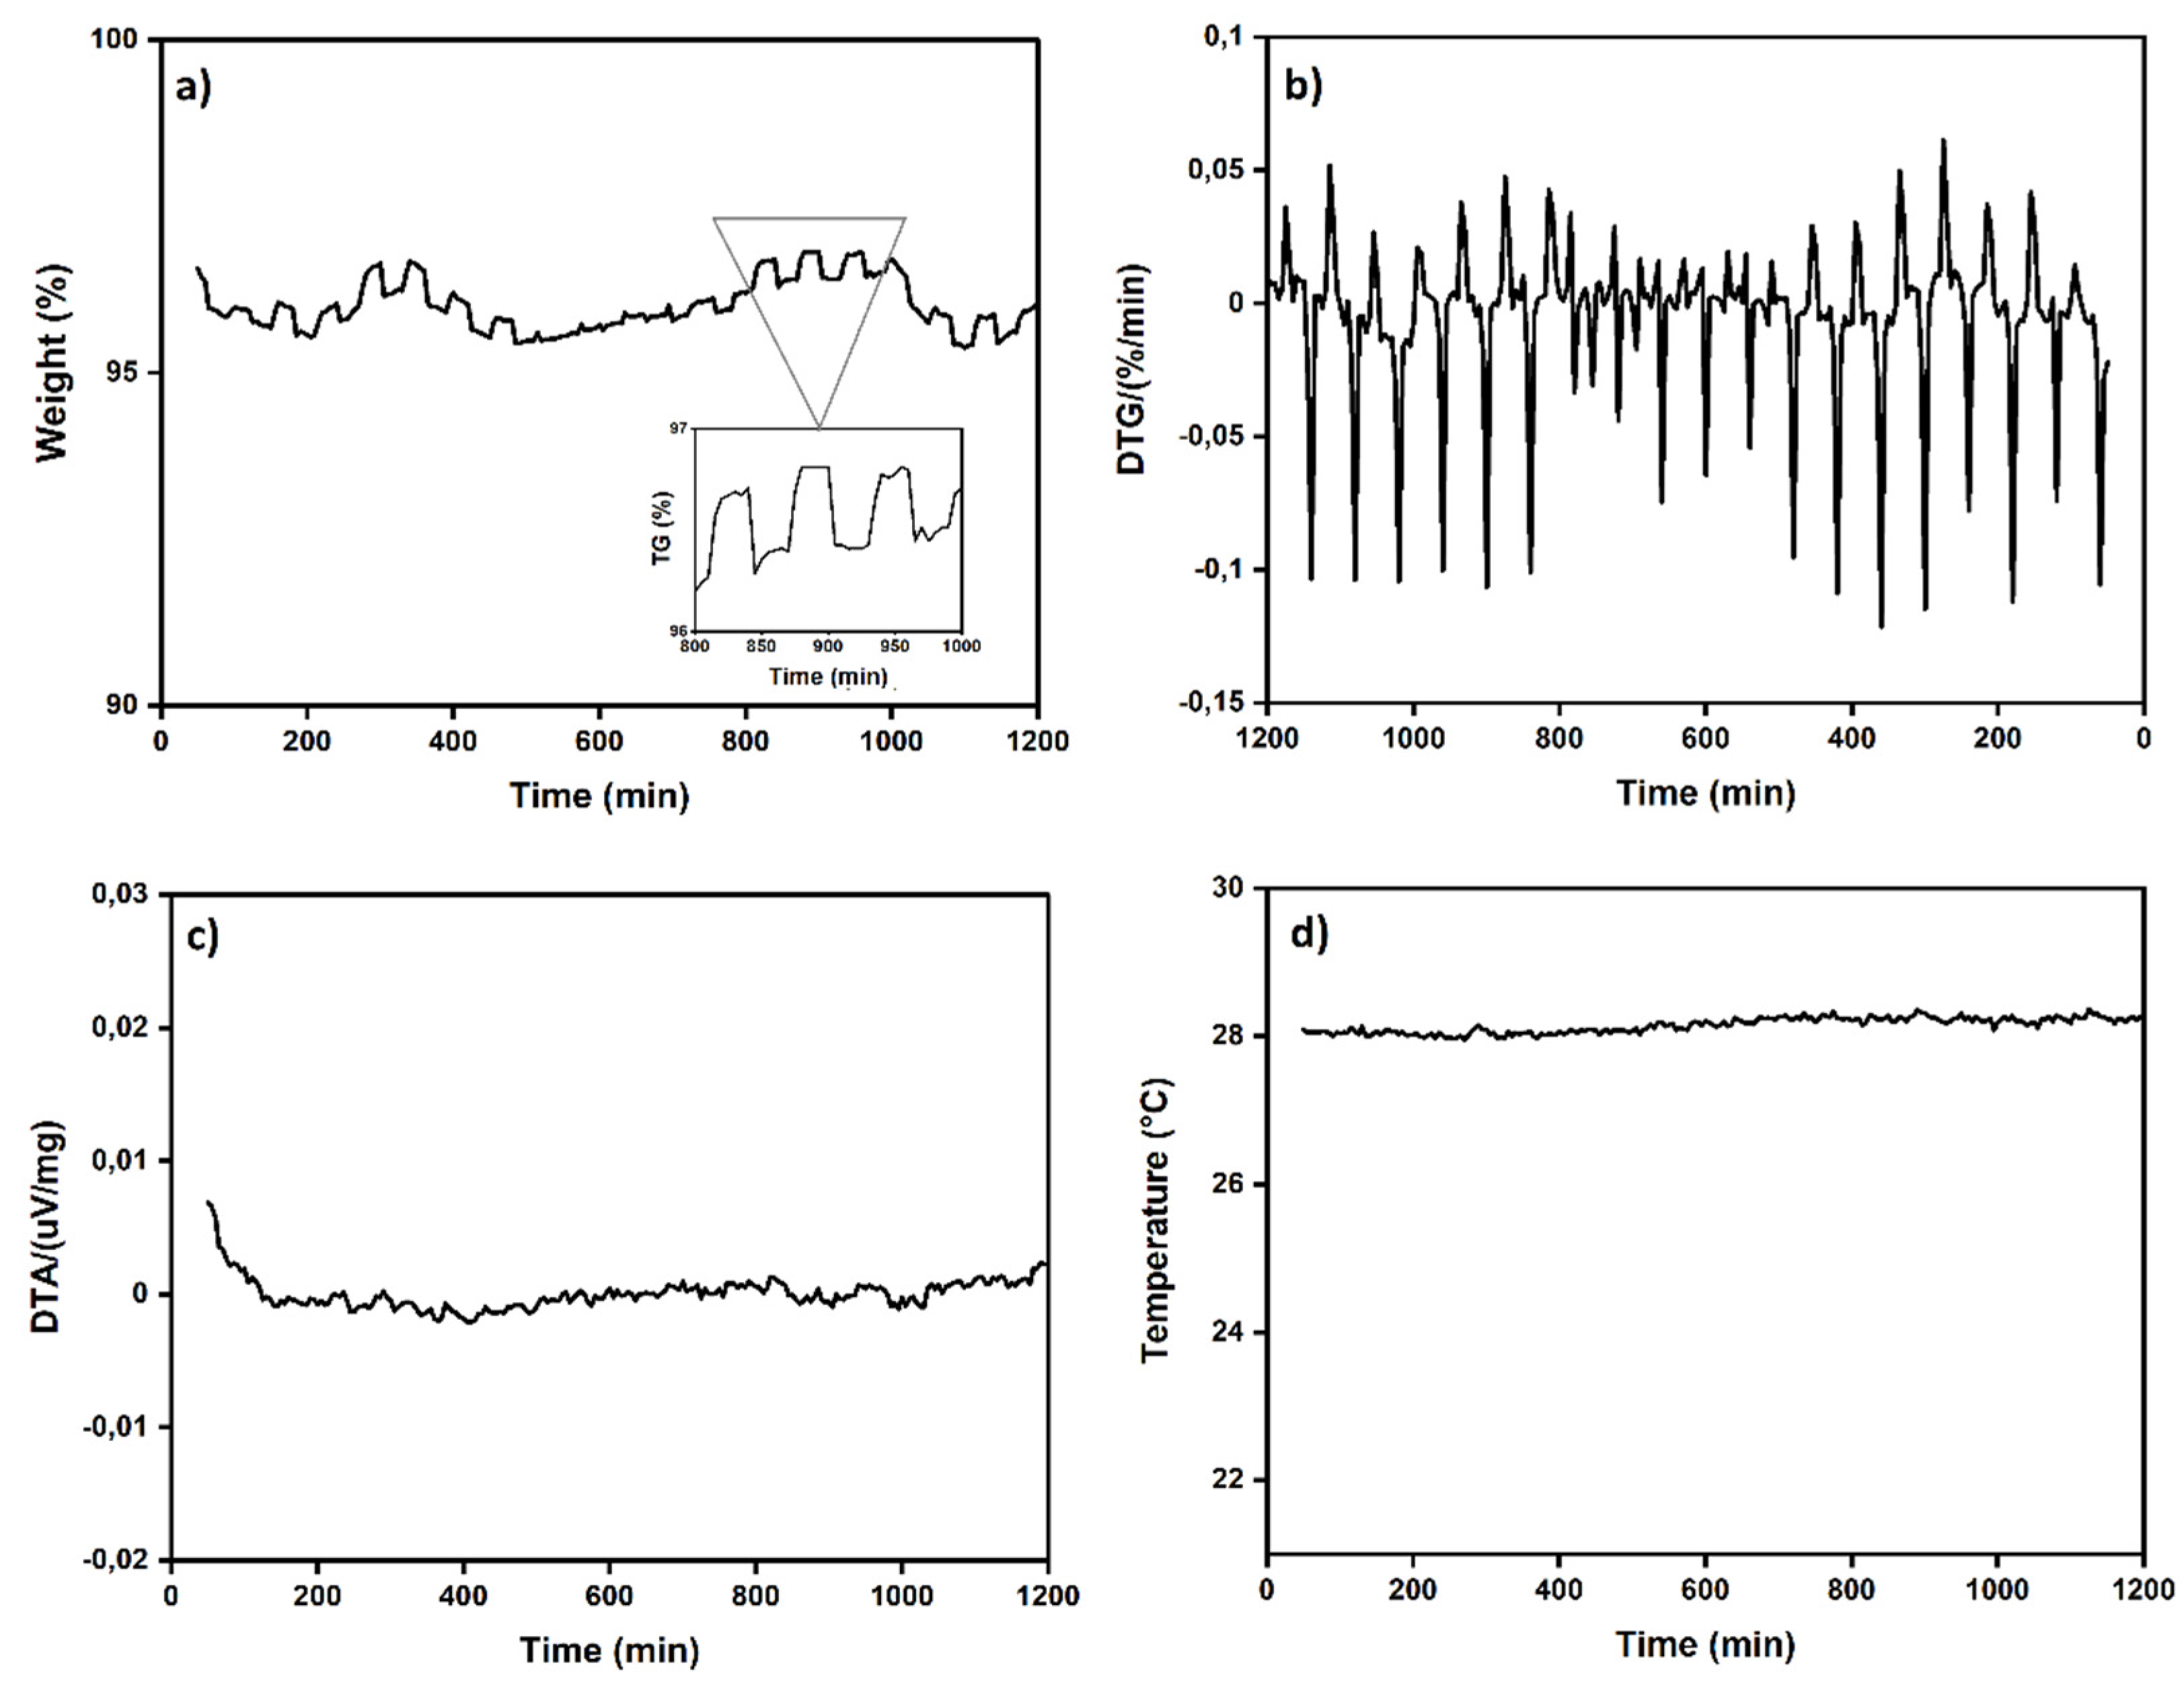
Figure 8.
CO2 captures cycle of aerogel A3 at 318.15 K and 4 bar by pressure decay technique.
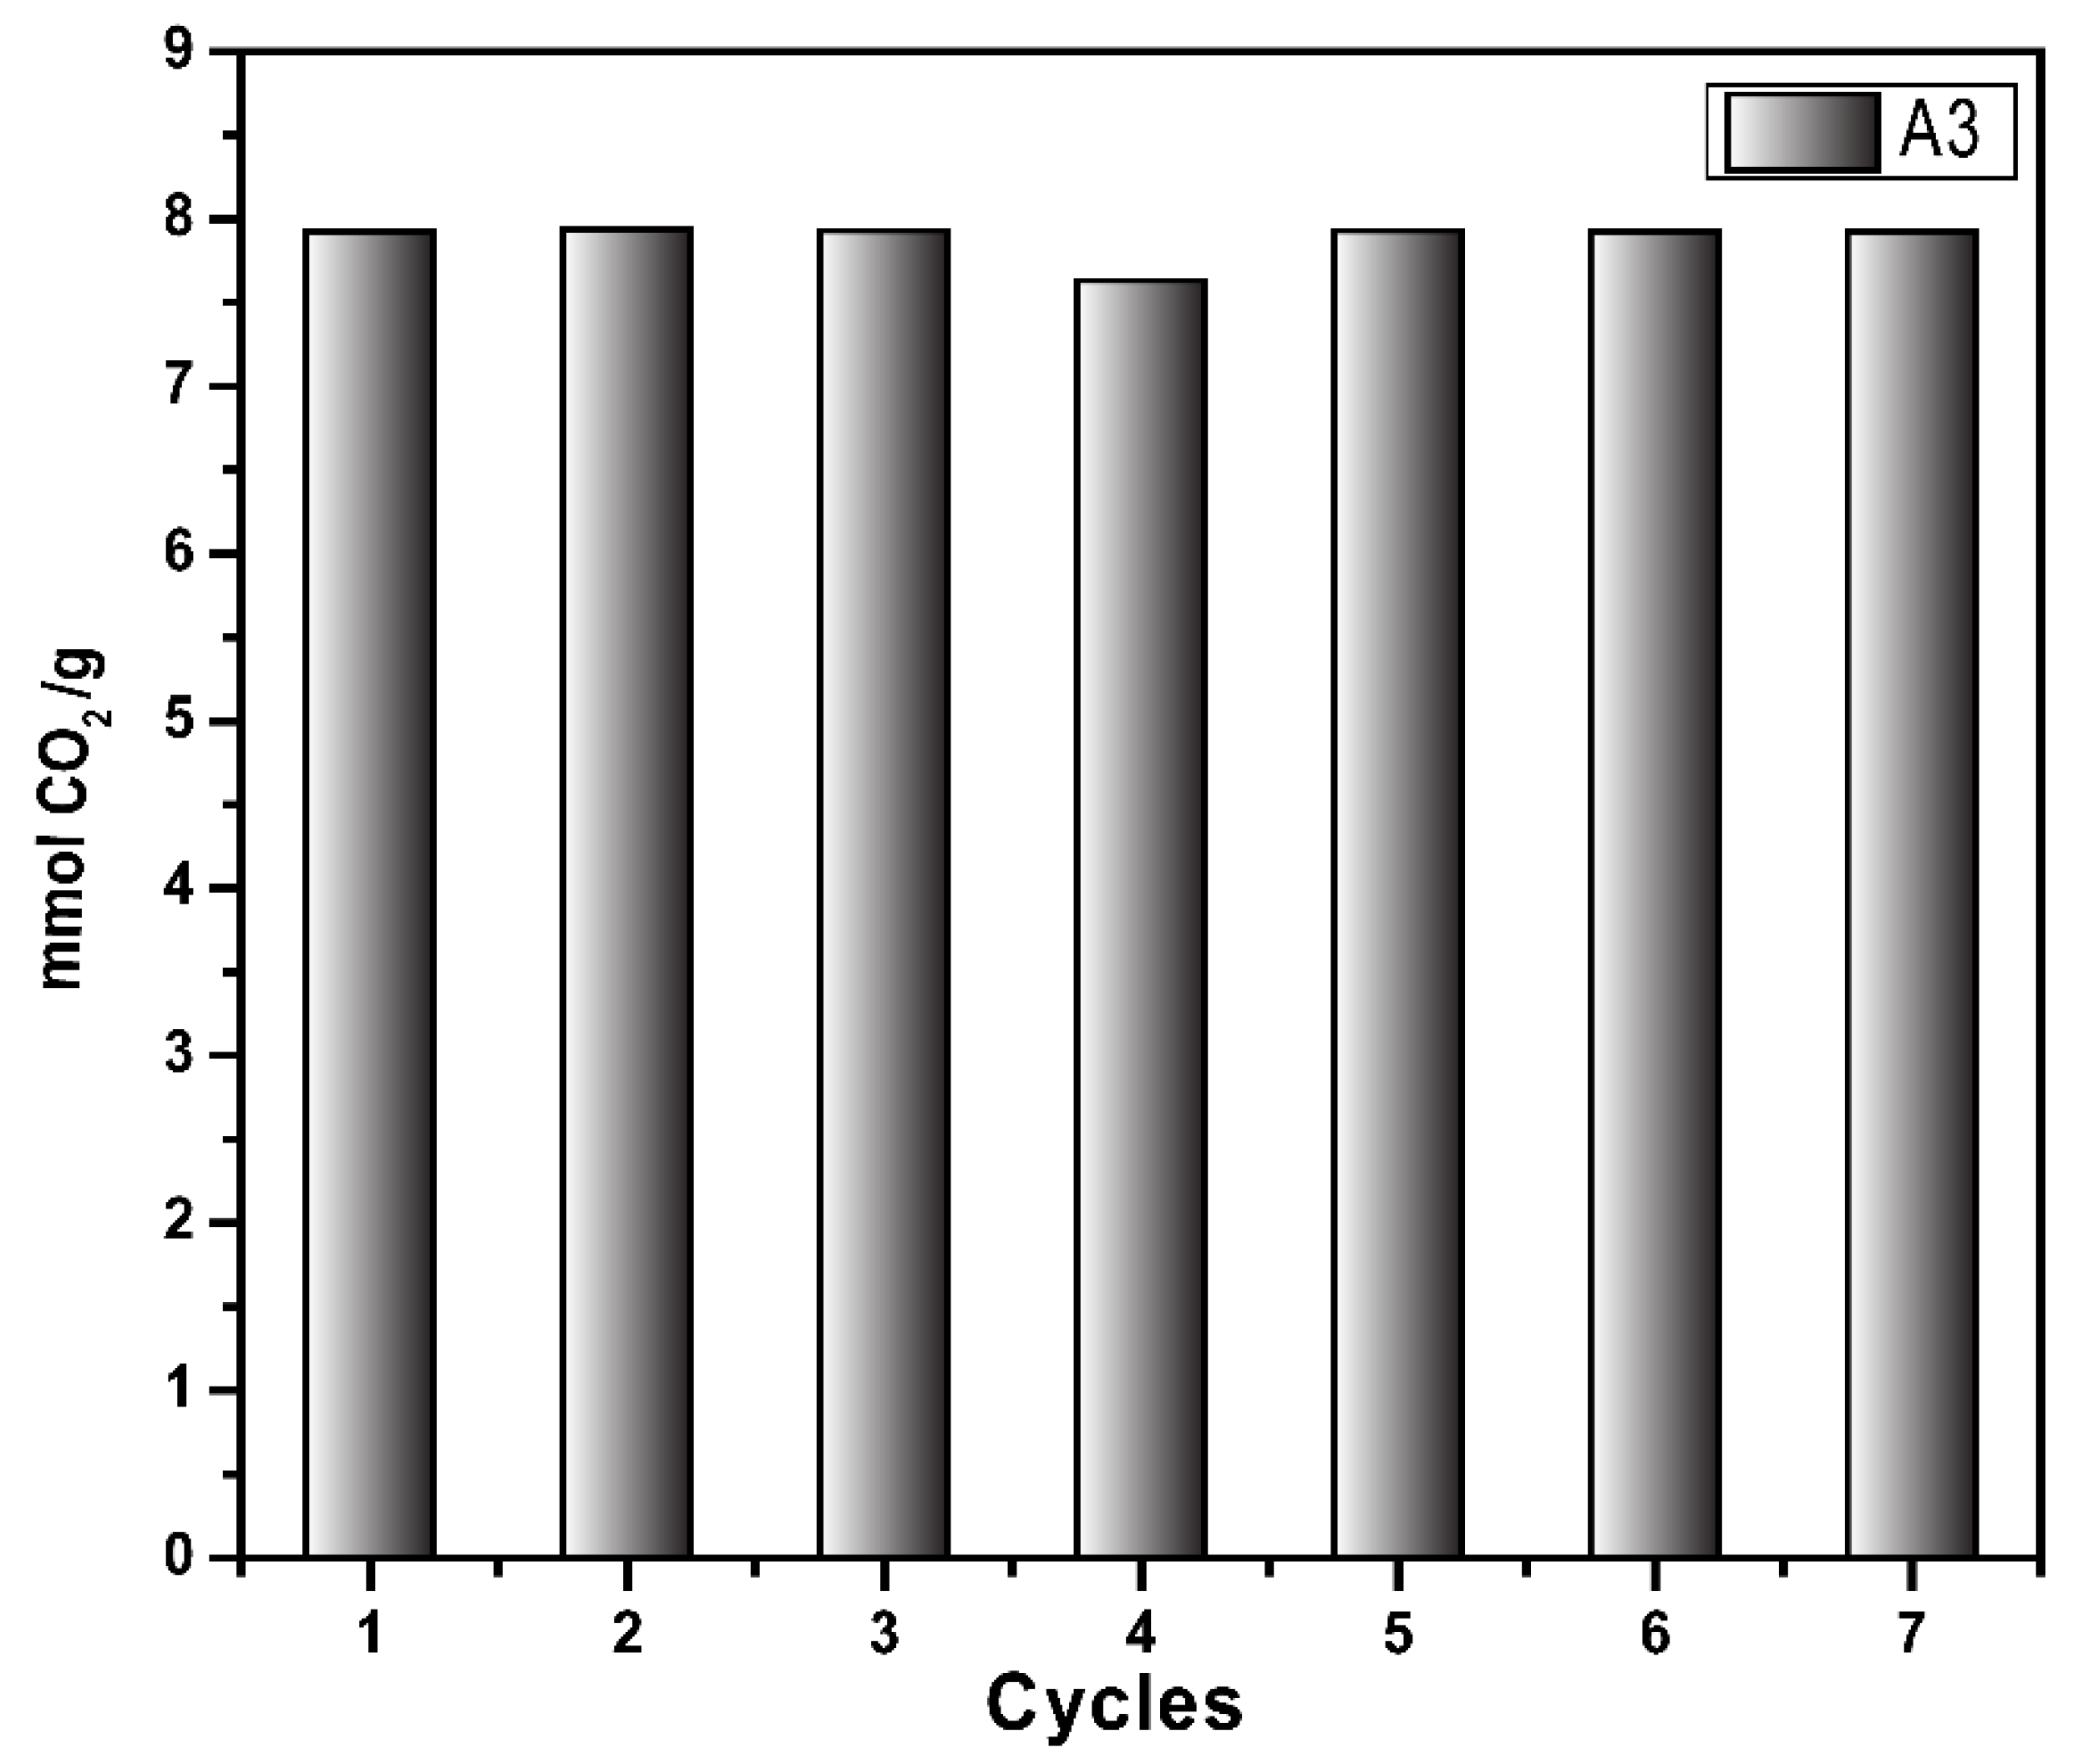

Table 3.
Isotherms parameters.
| Isotherms | Parameters | A1 | A2 | A3 |
| BET | S (g/cm³ STP) | 0.2216 | 0.1843 | 0.2037 |
| Y (g/cm³ STP) | -0.0044 | -0.0034 | -0.0036 | |
| R | 0.9980 | 0.9982 | 0.9981 | |
| Qm (cm³/g STP) | 4.6032 | 5.5292 | 4.9976 | |
|
Langmuir |
S (g/cm³ STP) |
0.1695 |
0.1341 |
0.1576 |
| Y (g/cm³ STP) | -1.2550 | -0.3500 | -1.0360 | |
| R | 0.9988 | 0.9997 | 0.9987 | |
| Qm (cm³/g STP) | 5.8963 | 7.4543 | 6.3445 | |
| Freundlich |
S | 6.8946 | 6.5043 | 7.4617 |
| R | 0.7788 | 0.8586 | 0.7864 | |
| Qm (cm³/g STP) | 2.7227 | 3.2204 | 3.1092 | |
| Temkin | S (mmHg-1) | 268.6050 | 94.1404 | 441.948 |
| R | 0.7887 | 0.8860 | 0.8080 | |
| Qm kJ mol-1 (cm³g-1 STP) | 1.2021 | 0.8736 | 1.1657 |
Table 4.
DAMO loading effect on the nanocellulose aerogels BET area, Qma and X0b.
| Sample |
DAMO (mmol) | BET area (m2g-1) | Qm (cm3g-1) | X0 (mmol g-1) |
| A0 | 0.00 | 94.00 | -- | -- |
| A1 | 4.62 | 154.00 | 4.60 | 0.21 |
| A2 | 9.24 | 154.80 | 5.52 | 0.25 |
| A3 | 13.87 | 154.30 | 4.99 | 0.22 |
aCO2 amount adsorbed under standard conditions of temperature and pressure (cm3g-1); bCO2 amount adsorbed under standard conditions of temperature and pressure (mmol g-1).
Disclaimer/Publisher’s Note: The statements, opinions and data contained in all publications are solely those of the individual author(s) and contributor(s) and not of MDPI and/or the editor(s). MDPI and/or the editor(s) disclaim responsibility for any injury to people or property resulting from any ideas, methods, instructions or products referred to in the content. |
© 2024 by the authors. Licensee MDPI, Basel, Switzerland. This article is an open access article distributed under the terms and conditions of the Creative Commons Attribution (CC BY) license (http://creativecommons.org/licenses/by/4.0/).
Copyright: This open access article is published under a Creative Commons CC BY 4.0 license, which permit the free download, distribution, and reuse, provided that the author and preprint are cited in any reuse.


