
Submitted:
15 November 2024
Posted:
19 November 2024
You are already at the latest version
Abstract
Cerium oxide nanoparticles (CeO2-NPs) have suggested promising advantages in semiconductors and biomedical applications due to the provided optical, electrical, antioxidant, and antibacterial activity. However, the widely reported synthetic strategies for CeO2-NPs demand toxic precursors and intermediary pollutants that represent a severe limitation in CeO2-NPs applications. Therefore, it is required to develop greener strategies that implicate ecological precursors to reduce the negative impact on the scalability of CeO2-NPs. In this regard, we applied Lycium cooperi (L. cooperi) aqueous extracts as an unexplored potential green reducing agent for the eco-friendly synthesis of CeO2-NPs. The L. cooperi extract showed the presence of alkaloids, flavonoids, cardiac glycosides, and carbohydrate-derived families that were assessed for spherical monodispersed CeO2-NPs under a rapid chemical reduction. Moreover, the elemental composition displayed Ce and O, indicating a high pure CeO2-NPs characterized by an interplanar cubic crystalline structure. Furthermore, we detected the presence of stabilizing functional groups from L. cooperi, which after a controlled annealing process, resulted in a band gap energy of 3.9 eV, which was optimal for CeO2-NPs. Thus, the results proposed L. cooperi as an environmentally friendly synthesis method that can open a new route for CeO2-NPs in biomedical and industrial applications.
Keywords:
Green nanoparticles
; Cerium oxide
; Sustainable Chemistry
; Semiconductors
1. Introduction
Cerium oxide (CeO2) is a n-type semiconductor material with a band gap of approximately 3.3 eV [1]. Interestingly, CeO2-NPs have garnered significant attention due to the improved optical, electrical, catalytic and thermal properties, characterized with chemical stability compared to the CeO2 non-nanostructured precursor [2]. Moreover, CeO2-NPs are considered a highly promising material for various applications, including optoelectronic devices [3], energy conversion and storage [4], catalysis [5], tissue engineering [6], biotechnology [7], nanomedicine and antioxidants in biological systems [8]. In this regard, CeO2-NPs have been synthesized using different chemical strategies such as sol-gel, colloidal synthesis, hydrothermal, and precipitation methods [9,10]. These synthetic approaches allow precise control of nanoparticle size, morphology, and chemical composition. However, an important disadvantage of the chemical method often involve toxic solvents and significant pollutant substances. Thus, considering those detrimental issues it has been collectively applied green precipitation mechanisms using plants extracts as a facile, economic technique and commonly used for CeO2-NPs. On the other hand, plant extracts contain secondary metabolites (e.g. flavonoids, catechins, coumarins and more) that act as chelating, reducing, and stabilizing agents to obtain controlled metallic nanoparticles [11,12,13]. In addition, many of these secondary metabolites exhibit antioxidant, anti-inflammatory, and antimicrobial activity, with significant potential biomedical applications.
Considering a novel greener strategy, the genus Lycium, which belongs to the Solanaceae family with 80 species in different regions worldwide [14,15] can be selected as a promissory choice for the synthesis of CeO2-NPs. In recent years, several studies have explored the chemical composition and pharmacology of this genus, leading to the identification and isolation of over 200 compounds. These compounds include flavonoids, alkaloids, polysaccharides, steroids, terpenoids, carotenoids, amides, and essential oils [14]. The diversity of phytochemicals suggested the Lycium genus as a highly promising for the green synthesis of nanoparticles, which has been scarcely explored in this application. It has recently been reported that CeO2-NPs were synthesized using the green precipitation method, employing various plant extracts such as Origanum majorana L. leaf extract [16], Acorus calamus [17], Calotropis procera flower extract [18], Azadirachta indica [19], Artabotrys hexapetalus leaf extract [20], Abelmoschus esculentus [21], Moringa oleifera leaf extract [22] and Rheum turkestanicum extract [23]. Nonetheless, these methods required extended synthesis periods, the use of ammonium and sodium hydroxides as precipitants, and showed large physicochemical variations, highlighting the importance of the green precursor agent.
The main objective of this work was to synthesize controlled, well-dispersed, homogenous spherical CeO2-NPs from secondary metabolites of L. cooperi aqueous extract, taking advantage of the chelating and reducing properties [11-13]. The characterization of the morphological, optical, and structural properties were measured. To the best of our knowledge, no information about the use of this plant for the green synthesis of nanoparticles was found.
2. Experimental Details
2.1. Morphological Characteristic of L. cooperi Plant
Figure 1 (a) displays the L. cooperi plant specimen harvested under controlled conditions in a greenhouse at the Instituto de Ingeniería, Universidad Autónoma de Baja California in Mexicali, Baja California, Mexico. Figure 1 (b) shows the characteristics of the leaves and flowers. According to the voucher specimen from the databases of the University of California, Berkeley (Figure 1. (c)), the taxonomic identification is in accordance to the L. cooperi [24]. Table 1 presents the main morphological characteristics of the plant, along with information about its habitat and geographical distribution [24].
2.2. Preparation of L. cooperi Extract
The L. cooperi leaves were harvested to obtain an aqueous extract. Initially, the leaves were washed with abundant deionized water (DI) and then left to air-dry at room temperature for one day. Then, 10 g of dry leaves were pulverized and mixed with 100 mL of DI. The mixture was then heated to 60°C for 30 min with constant stirring. Finally, the L. cooperi aqueous extract was filtered using (filter paper, Whatman N°4, 55 mm) and stored at 4 °C for later use. Figure 2 shows the preparation process of the L. cooperi aqueous extract.
2.3. Phytochemical Characterization of L. cooperi Extract
Phytochemical tests were conducted to identify the secondary metabolites in the aqueous extract of L. cooperi as follows:
- Alkaloids
A few drops of Hager’s reagent (picric acid) were added to 2 mL of extract. The formation of a yellow color crystalline precipitate indicates the presence of alkaloids.
- Flavonoids
To evaluate flavonoids, we prepared two test tubes containing 2 mL of L. cooperi and 2 mL of DI. Then, for comparison of the samples, it was added 2 mL of NaOH (0.1 M). A change in the color solution to yellow indicates the presence of flavonoids.
- Saponins
Vigorously shake 5 mL of extract and kept static for 10 min. The presence of a stable froth indicates that saponins are in the extract.
- Tannins
A few drops of FeCl3 are added to 2 mL of L. cooperi extract. A green condensed formation indicates positive.
- Terpenoids
To 5 mL aqueous extract are mixed with 2 mL of chloroform and 1 mL of concentrated H2SO4. If positive, a red-brown color ring appears in the lower chloroform layer phase.
- Cardiac glycosides
The aqueous extract (5 mL) is mixed in 2 mL of ferric chloride-glacial acetic acid solution and 1 mL of H2SO4 concentrated. The appearance of a brown ring at the interface indicates the presence of glycosides.
- Carbohydrates
To the aqueous extract (5 mL) it was added 2 mL of acetic acid and 2 mL of chloroform. Consequently, three drops of concentrated H2SO4 is added to the mixture. The presence of an orange precipitate indicates positive to carbohydrates.
The functional groups of the secondary metabolites and certain chromophore groups within the aqueous extract of L. cooperi were characterized by FT-IR (PerkinElmer Frontier FT-IR; 4000 – 400 cm-1) and UV-Vis (Shimadzu 260; 200 – 800 nm) analyses.
2.4. Green Synthesis of CeO2-NPs
A precursor solution of 0.1 M Ce3+ was prepared by dissolving 2.17 g of cerium nitrate hexahydrate (Ce(NO3)3 • 6H2O) in 50 mL of L. cooperi aqueous extract. The mixture was heated to 80°C for 1 h with constant stirring to produce cerium hydroxide (Ce(OH)3) precipitates. Ce(OH)3 precipitate was centrifuged at 4000 rpm, then vacuum filtered, washed at environmental conditions with DI, absolute ethanol, and dried overnight at 60°C. Finally, Ce(OH)3 was calcined at 400 °C in a muffle furnace for two hours in the air to obtain CeO2-NPs. Figure 3 illustrates the synthesis process of CeO2-NPs using the green precipitation method.
2.5. Characterization of CeO2-NPs
The morphology, particle size, and chemical composition were determined by SEM (Tescan LYRA 3 XMH) equipped with an EDS (Quantax Bruker X-Flash 6160) and HR-TEM (JEOL 2010). The SEM micrograph was acquired using an accelerating voltage of 10 kV and a magnification of 40 kX. The mounting conditions for CeO2-NPs was dispersing 1 mg of CeO2-NPs in 5 mL of absolute ethanol through ultrasonication for 15 minutes. Subsequently, a 10 μL aliquot was extracted, and the dispersion was deposited onto a TEM grid or carbon tape (SEM) for further study. The TEM image was captured using an accelerating voltage of 200 kV. The structural and crystallographic information of CeO2-NPs were obtained by TEM and XRD (Panalytical Empyrean) with Cu Kα radiation source (λ = 0.15406 nm) and a real-time multipass detector X´Celerator, with scanned over the 2-theta range 20 – 90 at room temperature. FT-IR spectra were recorded in the 400 – 4000 cm−1 range (Frontier Perkin Elmer) in the attenuated total reflection mode. The optical properties of the CeO2-NPs were characterized by UV-Vis from 200 – 800 nm (Shimadzu 260).
3. Results and Discussion
3.1. Phytochemical Analysis of L. cooperi Aqueous Extract
In Table 2, we presented the results of the phytochemical tests. Initially, the Hager, ammonia, Keller-Kellani, and Benedict tests showed positive results, indicating the presence of alkaloids, flavonoids, cardiac glycosides, and carbohydrates, respectively. On the other hand, the analyses for saponins, tannins, and terpenoids were negative. The findings demonstrate that the aqueous extract of L. cooperi contains the metabolites flavonoids and carbohydrates, which are chemically highlighted due to the numerous hydroxyl groups (-OH). These metabolites are known for their ability to act as chelating and reducing agents in the formation of nanoparticles in aqueous solutions [25], eliminating the need to add acids or bases. These metabolites can reduce Ce3+ ions to Ce0, initiating the nucleation process for Ce(OH)3 formation, which is then calcined to obtain oxidized CeO2-NPs.
Figure 4 (a) illustrates the FT-IR spectrum of L. cooperi extract. The 3340 cm-1 and 1420 cm-1 peaks correspond to the O-H bond stretching and bending, and 2928 cm-1 and 2850 cm-1 peaks correspond to –CH2 bond stretching [26]. Moreover, the peak at 1564 cm-1 shows the stretching behavior of the aromatic rings C-C bond, the band at 1090 cm-1 is attributed to the C-O stretching, and a shoulder band at 1626 cm-1 for stretching vibration of the carbon-oxygen double bond [27]. Finally, a peak is observed at 598 cm-1 suggesting the presence of halide groups in the extract. The families of secondary metabolites identified by the phytochemical reactions in the L. cooperi extract correspond to the functional groups reported in the molecular structure by FT-IR.
The absorption band observed at 225 nm in the UV-Vis spectrum of the L. cooperi extract (Figure 4. (b)) is attributed to the electronic transitions of π → π* orbitals, which occur in the structure of the chromophore groups present in the sample.
FT-IR and UV-Vis analysis confirm the presence of green-derived metabolites corresponding to a mixture of flavonoids, cardiac carbohydrates, alkaloids, and polymeric carbohydrates identified through phytochemical tests.
3.2. Physicochemical Analysis of CeO2-NPs
The SEM micrographs show the agglomeration of CeO2-NPs, highlighting a homogenous spherical morphology and showing an average size of 86±10 nm (Figure 5. (a)). On the other hand, the chemical composition of the CeO2-NPs by means of EDS illustrated the presence of Ce and O, suggesting the formation of high-pure CeO2-NPs (Figure 5. (b)).
Figure 6 (a) displays the TEM micrographs of the CeO2-NPs showing a spherical morphology and size distribution of 6.9 ± 1.5 nm (inset Fig. 6. (a)). Compared to the results obtained by SEM (Fig. 5. (a)), this size reduction is attributed to the process of dispersion and sample preparation by ultrasound. Furthermore, the high-resolution image (Fig. 6. (b)) confirms the crystalline structure of CeO2. We detected an interplanar distance of 0.31 nm on the (111) plane, which is in accordance with previous works [28]. Additionally, the electron diffraction image confirmed the presence of the cubic phase structure of the CeO2, as expected.
In Figure 7 the XRD patterns of CeO2-NPs exhibit peaks values (2θ) of 28.35°, 32.85°, 47.39°, 56.09°, 58.79°, 69.09°, 76.37°, 78.96°, and 88.15°, corresponding to (111), (200), (220), (311), (222), (400), (331), (420) and (422) planes, respectively. These peaks are agree with the typical signals of CeO2-NPs showing a cubic crystalline structure (ICSD 98-006-1595) as demonstrated in previous studies [17,18,19,20,21,22]. The crystallite size (D) was calculated by the Scherrer's equation:
Where λ is the wavelength, β is the full width at half maximum (FWHM), and θ is the Bragg's angle expressed in radians. The calculated crystal size was ~6.5 nm.
Additionally, the interplanar distance () for the plane (111) was determined by Bragg's equation:
Where n is the order of diffraction. The results indicated that the interplanar distance was 0.31 nm for the plane (111), consistent with the HR-TEM findings, and supported by previous works of green-strategies and thermal CeO2-NPs works [28].
The FT-IR spectrum (Figure 8) exhibited a peak at 405 cm−1, which corresponds to the Ce–O stretching vibrational mode [19]. Low intensity peaks are displayed at 1315, 1502 and 1630 cm-1 respectively, which are attributed to traces of organic matter from the phytocompounds of the extract. The peak at 3350 cm-1 indicated the presence of O–H groups; nonetheless, it was a low intense formed peak [17,22].
The optical bandgap of the CeO2-NPs was determined by the Tauc plot method (Figure 9) from the UV-Vis absorption spectrum (inset Figure 9). The Tauc expression relates the optical band gap, Eg, and absorption coefficient, α, by the following expression:
αhν = B [(hν − Eg)]n
Where hν is the photon energy, B is the proportionality constant, and n is a number that depends on the nature of the electronic transitions responsible for the absorption. Eg was determined by fitting the linear zone of (αhν)2 vs hν dependence, and extrapolating to the energy. The optical band gap obtained for CeO2-NPs was ~3.29 eV. This value corresponds to the band gap energy reported in the literature for CeO2-NPs [1,18].
Table 3 compares the results reported in the literature with our work findings regarding the size and optical properties, as well as the reaction time of the CeO2-NPs obtained through green synthesis using various plant extracts. Our method results in shorter synthesis times compared to those reported in the literature [16,17,18,19,20,21,22,23].
4. Conclusions
CeO2 nanoparticles were synthesized by the green precipitation method from an aqueous extract of Lycium cooperi. The SEM and EDS results indicate the formation of spherical CeO2-NPs, with average size of ~85 nm and an elemental composition of Ce and O atoms. However, the TEM results indicate a ~7 nm average size; this reduction in the CeO2-NPs size is attributed to the ultrasonic dispersion process. Thus far, this extract has shown great potential as a green precursor for controlling the synthesis of spherical-shaped CeO2-NPs.
The XRD and HR-TEM analyses revealed the formation of cubic structured CeO2-NPs crystal, and the FT-IR spectrum confirms the presence of the stretching Ce-O bond. Moreover, the calculated CeO2-NPs bandgap was ~3.29 eV, expressed from the UV-Vis absorbance spectra and Tauc plot method.
This study has demonstrated an affordable and eco-friendly method for obtaining CeO2-NPs. Notably, it is reported for the first time the application of L. cooperi extract as a green-derived strategy for controlling the size, morphology, and distribution of cerium oxide nanoparticles. The environmentally friendly synthesis method and the characteristics of the resulting CeO2-NPs can open a new route for extensive biomedical and industrial applications.
Author Contributions
Conceptualization, J.C.-S; methodology, J.C.-S., J.S.-C, B.V.-S., and E.B.-P.; formal analysis, J.C-S., J.S.-C., B.V.-S. and E.B.-P; investigation, J.C-S., J.S.-C., B.V.-S. and E.B.-P; data curation, J.C-S. and J.S.-C; writing—original draft preparation, J.C-S., J.S.-C., B.V.-S. and E.B.-P; writing—review and editing, J.C-S., B.V.-S. and E.B.-P; visualization, J.C-S., B.V.-S. and E.B.-P; supervision, B.V.-S. and E.B.-P; project administration, B.V.-S. and E.B.-P; funding acquisition, B.V.-S. and E.B.-P.
Funding
This research was funded by SEP-CONACYT “Proyecto Apoyado por el Fondo Sectorial de Investigación para la Educación” CB2017–2018, grant number A1-S-38368, and Program No. 317330 FOP02 CONACYT, for financial support.
Data Availability Statement
The data of the current study are available in this paper.
Acknowledgments
We thank the Instituto de Ingeniería of Universidad Autónoma de Baja California.
Conflicts of Interest
The authors declare no conflicts of interest.
References
- Yan, Y. Q.; Wu, Y. Z.; Wu, Y. H.; Weng, Z. L.; Liu, S. J.; Liu, Z. G.; Han, B. Recent Advances of CeO2-Based Composite Materials for Photocatalytic Applications. ChemSusChem. 2024, e202301778. [Google Scholar] [CrossRef] [PubMed]
- Othman, A.; Gowda, A.; Andreescu, D.; Hassan, M. H.; Babu, S. V.; Seo, J.; Andreescu, S. Two decades of ceria nanoparticles research: structure, properties and emerging applications. Materials Horizons. 2024. [CrossRef] [PubMed]
- Bakr, A. M.; Darwish, A.; Azab, A. A.; El Awady, M. E.; Hamed, A. A.; Elzwawy, A. Structural, dielectric, and antimicrobial evaluation of PMMA/CeO2 for optoelectronic devices. Scientific Reports. 2024, 14, 2548. [Google Scholar] [CrossRef] [PubMed]
- Motazedian, M.; Hosseinabadi, N.; Khosravifard, A. The ceria–Germania solid oxide hydrogen storage hollow porous nanoparticles. Materials Chemistry and Physics. 2023, 307, 128100. [Google Scholar] [CrossRef]
- Kalaycıoğlu, Z.; Özuğur Uysal, B.; Pekcan, O.; Erim, F. B. Efficient photocatalytic degradation of methylene blue dye from aqueous solution with cerium oxide nanoparticles and graphene oxide-doped polyacrylamide. ACS omega. 2023, 8, 13004–13015. [Google Scholar] [CrossRef]
- Bhushan, S.; Singh, S.; Maiti, T. K.; Das, A.; Barui, A.; Chaudhari, L. R.; Meghnad, G.; Dutt, D. Cerium oxide nanoparticles disseminated chitosan gelatin scaffold for bone tissue engineering applications. International Journal of Biological Macromolecules. 2023, 236, 123813. [Google Scholar] [CrossRef]
- Vijayan, A.; Ramadoss, S.; Sisubalan, N.; Gnanaraj, M.; Chandrasekaran, K.; Kokkarachedu, V. Cerium Oxide Nanoparticles for Biomedical Applications. In Nanoparticles in Modern Antimicrobial and Antiviral Applications; Springer International Publishing: Cham, 2024; pp. 175–200. [Google Scholar]
- Kim, Y. G.; Lee, Y.; Lee, N.; Soh, M.; Kim, D.; Hyeon, T. Ceria-based therapeutic antioxidants for biomedical applications. Advanced Materials. 2024, 36, 2210819. [Google Scholar] [CrossRef]
- Sonawane, L. D.; Mandawade, A. S.; Ahemad, H. I.; Aher, Y. B.; Gite, A. B.; Nikam, L. K.; Shinde, S.D.; Jain, G.H.; Patil, G.E.; Shinde, M. S. Sol-gel and hydrothermal synthesis of CeO2 NPs: Their physiochemical properties and applications for gas sensor with photocatalytic activities. Inorganic Chemistry Communications. 2024, 112313. [Google Scholar] [CrossRef]
- Nyoka, M.; Choonara, Y. E.; Kumar, P.; Kondiah, P. P.; Pillay, V. Synthesis of cerium oxide nanoparticles using various methods: implications for biomedical applications. Nanomaterials, 2020, 10, 242. [Google Scholar] [CrossRef]
- Miu, B. A.; Dinischiotu, A. New green approaches in nanoparticles synthesis: An overview. Molecules. 2022, 27(19), 6472. [Google Scholar] [CrossRef]
- Nobahar, A.; Carlier, J. D.; Miguel, M. G.; Costa, M. C. A review of plant metabolites with metal interaction capacity: a green approach for industrial applications. BioMetals. 2021, 34, 761–793. [Google Scholar] [CrossRef] [PubMed]
- Ahmed, S. F.; Mofijur, M.; Rafa, N.; Chowdhury, A. T.; Chowdhury, S.; Nahrin, M.; Saiful Islam, A.B.M.; Ong, H.C. Green approaches in synthesizing nanomaterials for environmental nanobioremediation: Technological advancements, applications, benefits, and challenges. Environmental Research. 2022, 204, 111967. [Google Scholar] [CrossRef] [PubMed]
- Yao, X.; Peng, Y.; Xu, L. J.; Li, L.; Wu, Q. L.; Xiao, P. G. Phytochemical and biological studies of Lycium medicinal plants. Chemistry & biodiversity. 2011, 8, 976–1010. [Google Scholar]
- Yao, R.; Heinrich, M.; Weckerle, C. The genus Lycium as food and medicine: A botanical, ethnobotanical and historical review. Journal of Ethnopharmacology. 2018, 212, 50–66. [Google Scholar] [CrossRef] [PubMed]
- Aseyd Nezhad, S.; Es-haghi, A.; Tabrizi, M. H. Green synthesis of cerium oxide nanoparticle using Origanum majorana L. leaf extract, its characterization and biological activities. Applied Organometallic Chemistry. 2020, 34, e5314. [Google Scholar] [CrossRef]
- Altaf, M.; Manoharadas, S.; Zeyad, M. T. Green synthesis of cerium oxide nanoparticles using Acorus calamus extract and their antibiofilm activity against bacterial pathogens. Microscopy Research and Technique. 2021, 84, 1638–1648. [Google Scholar] [CrossRef]
- Muthuvel, A.; Jothibas, M.; Mohana, V.; Manoharan, C. J. I. C. C. Green synthesis of cerium oxide nanoparticles using Calotropis procera flower extract and their photocatalytic degradation and antibacterial activity. Inorganic Chemistry Communications. 2020, 119, 108086. [Google Scholar] [CrossRef]
- Manimaran, R. Optimization of Azadirachta indica leaf extract mediated cerium oxide nanoparticles synthesis, characterization, and its applications. Industrial Crops and Products. 2023, 204, 117304. [Google Scholar] [CrossRef]
- Parvathy, S.; Manjula, G.; Balachandar, R.; Subbaiya, R. Green synthesis and characterization of cerium oxide nanoparticles from Artabotrys hexapetalus leaf extract and its antibacterial and anticancer properties. Materials Letters. 2022, 314, 131811. [Google Scholar] [CrossRef]
- Ahmed, H. E.; Iqbal, Y.; Aziz, M. H.; Atif, M.; Batool, Z.; Hanif, A.; Yaqub, N.; Farooq, W. A.; Ahmad, S.; Fatehmulla, A.; Ahmad, H. Green synthesis of CeO2 nanoparticles from the Abelmoschus esculentus extract: evaluation of antioxidant, anticancer, antibacterial, and wound-healing activities. Molecules. 2021, 26, 4659. [Google Scholar] [CrossRef]
- Putri, G. E.; Rilda, Y.; Syukri, S.; Labanni, A.; Arief, S. Highly antimicrobial activity of cerium oxide nanoparticles synthesized using Moringa oleifera leaf extract by a rapid green precipitation method. Journal of Materials Research and Technology. 2021, 15, 2355–2364. [Google Scholar] [CrossRef]
- Sabouri, Z. , Sabouri, M., Amiri, M. S., Khatami, M., & Darroudi, M. (2022). Plant-based synthesis of cerium oxide nanoparticles using Rheum turkestanicum extract and evaluation of their cytotoxicity and photocatalytic properties. Materials Technology. 2022, 37, 555–568. [Google Scholar]
- Michael, H. Nee. Lycium cooperi, in Jepson Flora Project (eds.) Jepson eFlora. 2021. Available online: https://ucjeps.berkeley.edu/eflora/eflora_display.php?tid=32210.
- El-Lateef, H. M. A.; El-Dabea, T.; Khalaf, M. M.; Abu-Dief, A. M. Recent overview of potent antioxidant activity of coordination compounds. Antioxidants. 2023, 12, 213. [Google Scholar] [CrossRef] [PubMed]
- Dai, F.; Zhuang, Q.; Huang, G.; Deng, H.; Zhang, X. Infrared spectrum characteristics and quantification of OH groups in coal. ACS omega. 2023, 8, 17064–17076. [Google Scholar] [CrossRef] [PubMed]
- Wongsa, P.; Phatikulrungsun, P.; Prathumthong, S. FT-IR characteristics, phenolic profiles and inhibitory potential against digestive enzymes of 25 herbal infusions. Scientific Reports. 2022, 12, 6631. [Google Scholar] [CrossRef]
- Bi, H.; Zhang, L. X.; Xing, Y.; Zhang, P.; Chen, J. J.; Yin, J.; Bie, L. J. Morphology-controlled synthesis of CeO2 nanocrystals and their facet-dependent gas sensing properties. Sensors and Actuators B: Chemical. 2021, 330, 129374. [Google Scholar] [CrossRef]
Figure 1.
(a) L. cooperi plant (b) morphological characteristics of the leaf and flower and (c) botanical illustration of the voucher specimen by regents of the University of California [24].
Figure 1.
(a) L. cooperi plant (b) morphological characteristics of the leaf and flower and (c) botanical illustration of the voucher specimen by regents of the University of California [24].
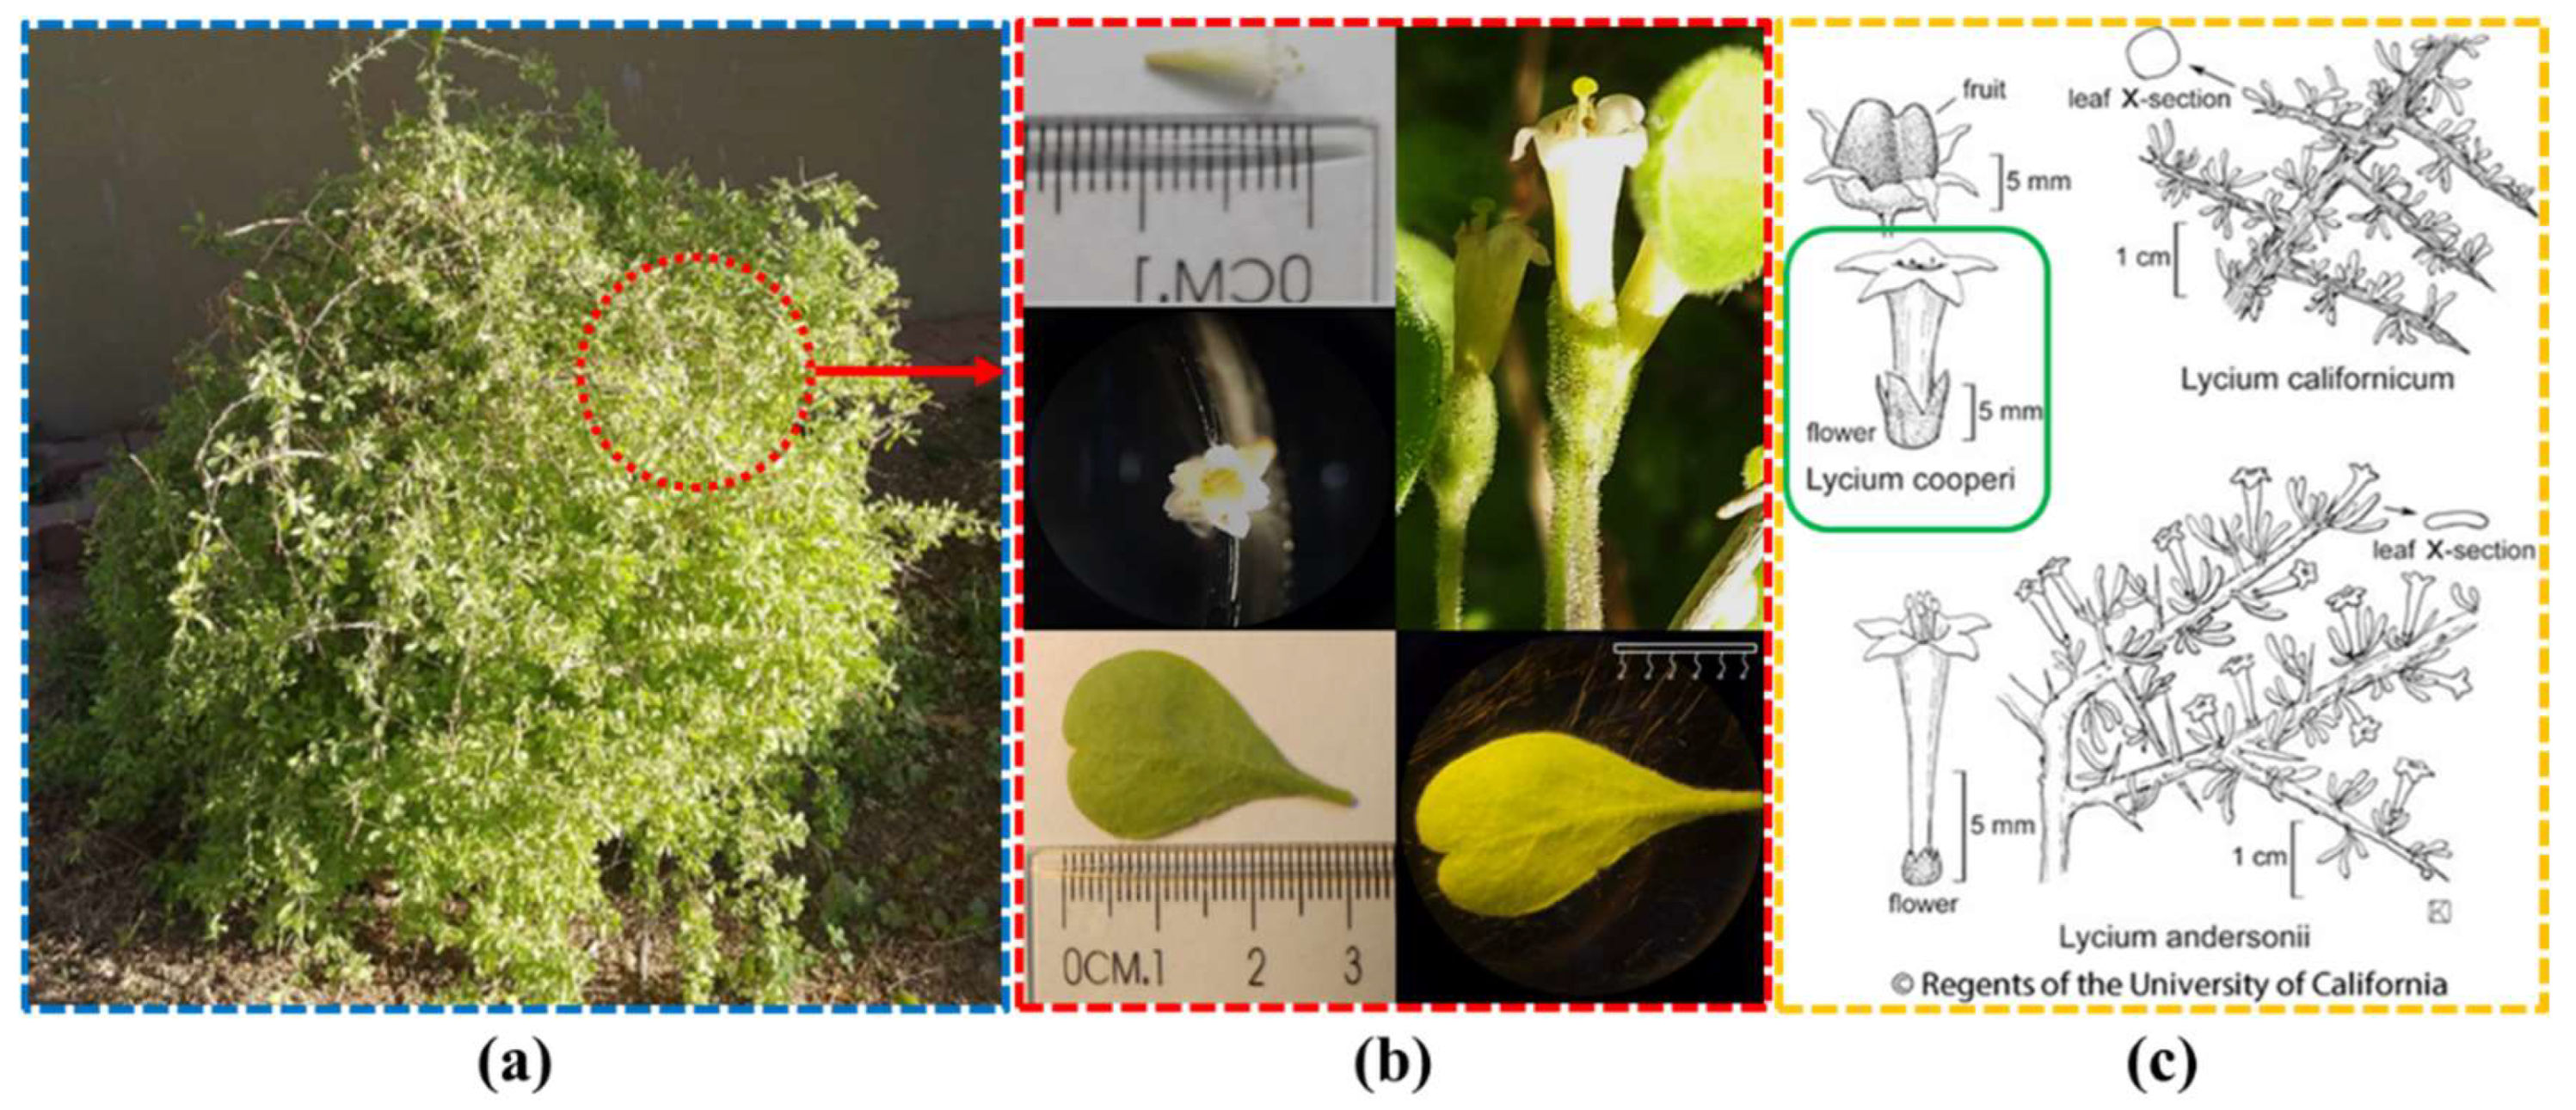
Figure 2.
Schematic Diagram of L. cooperi aqueous extract preparation process.
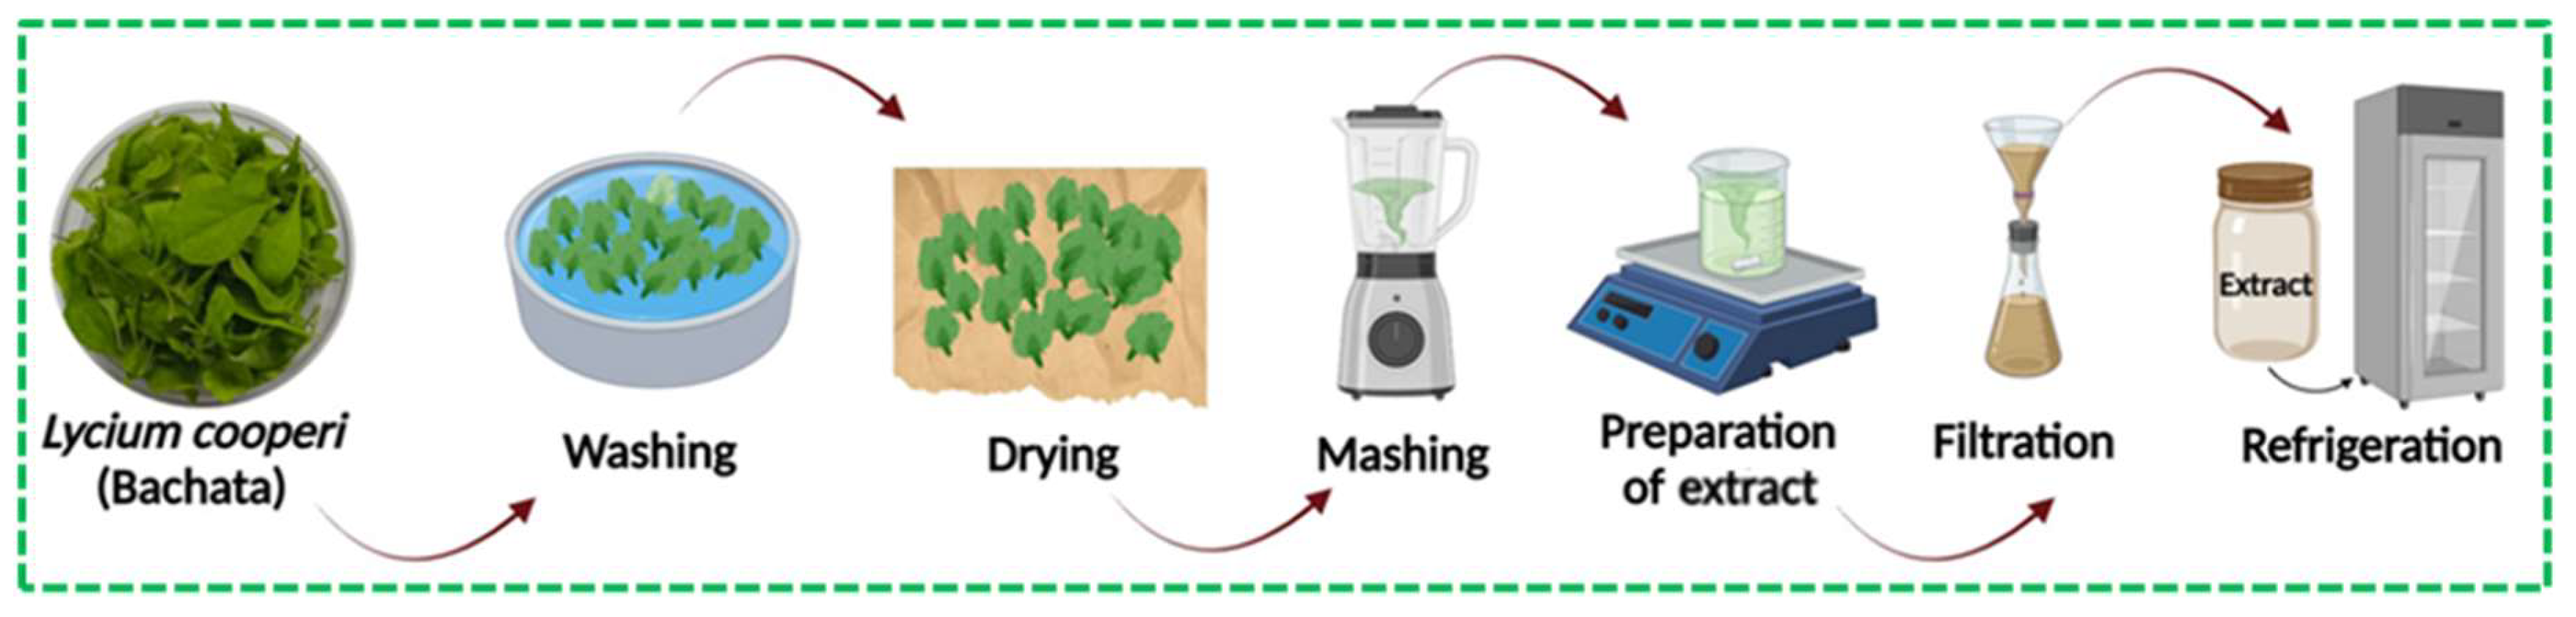
Figure 3.
Schematic diagram of CeO2-NPs synthesis process.
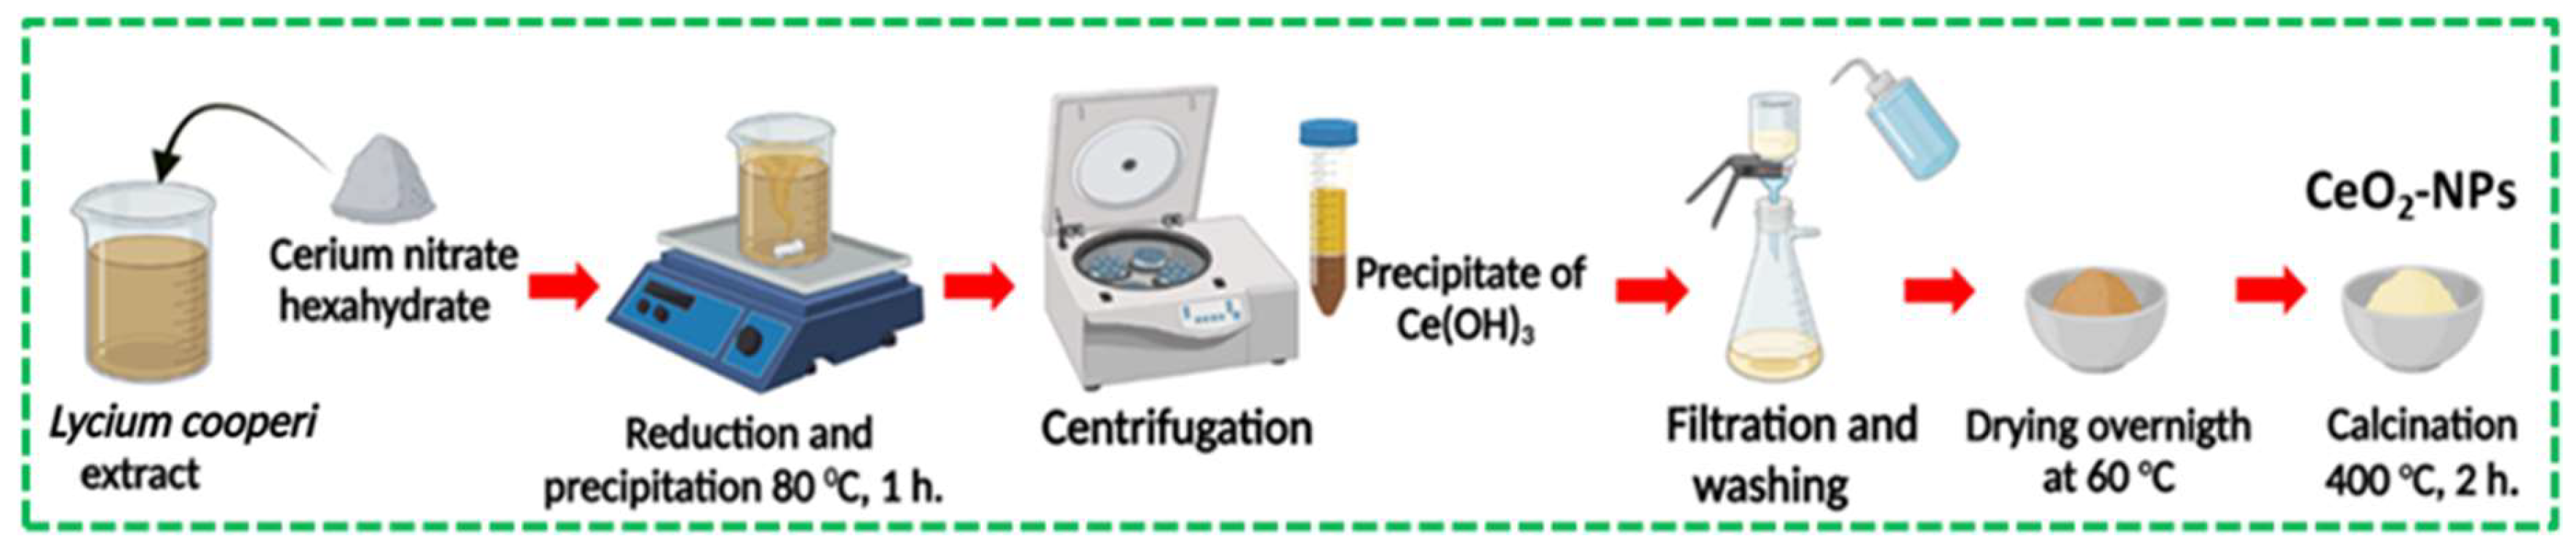
Figure 4.
FT-IR (a) and UV-Vis (b) spectra of the L. cooperi aqueous extract.
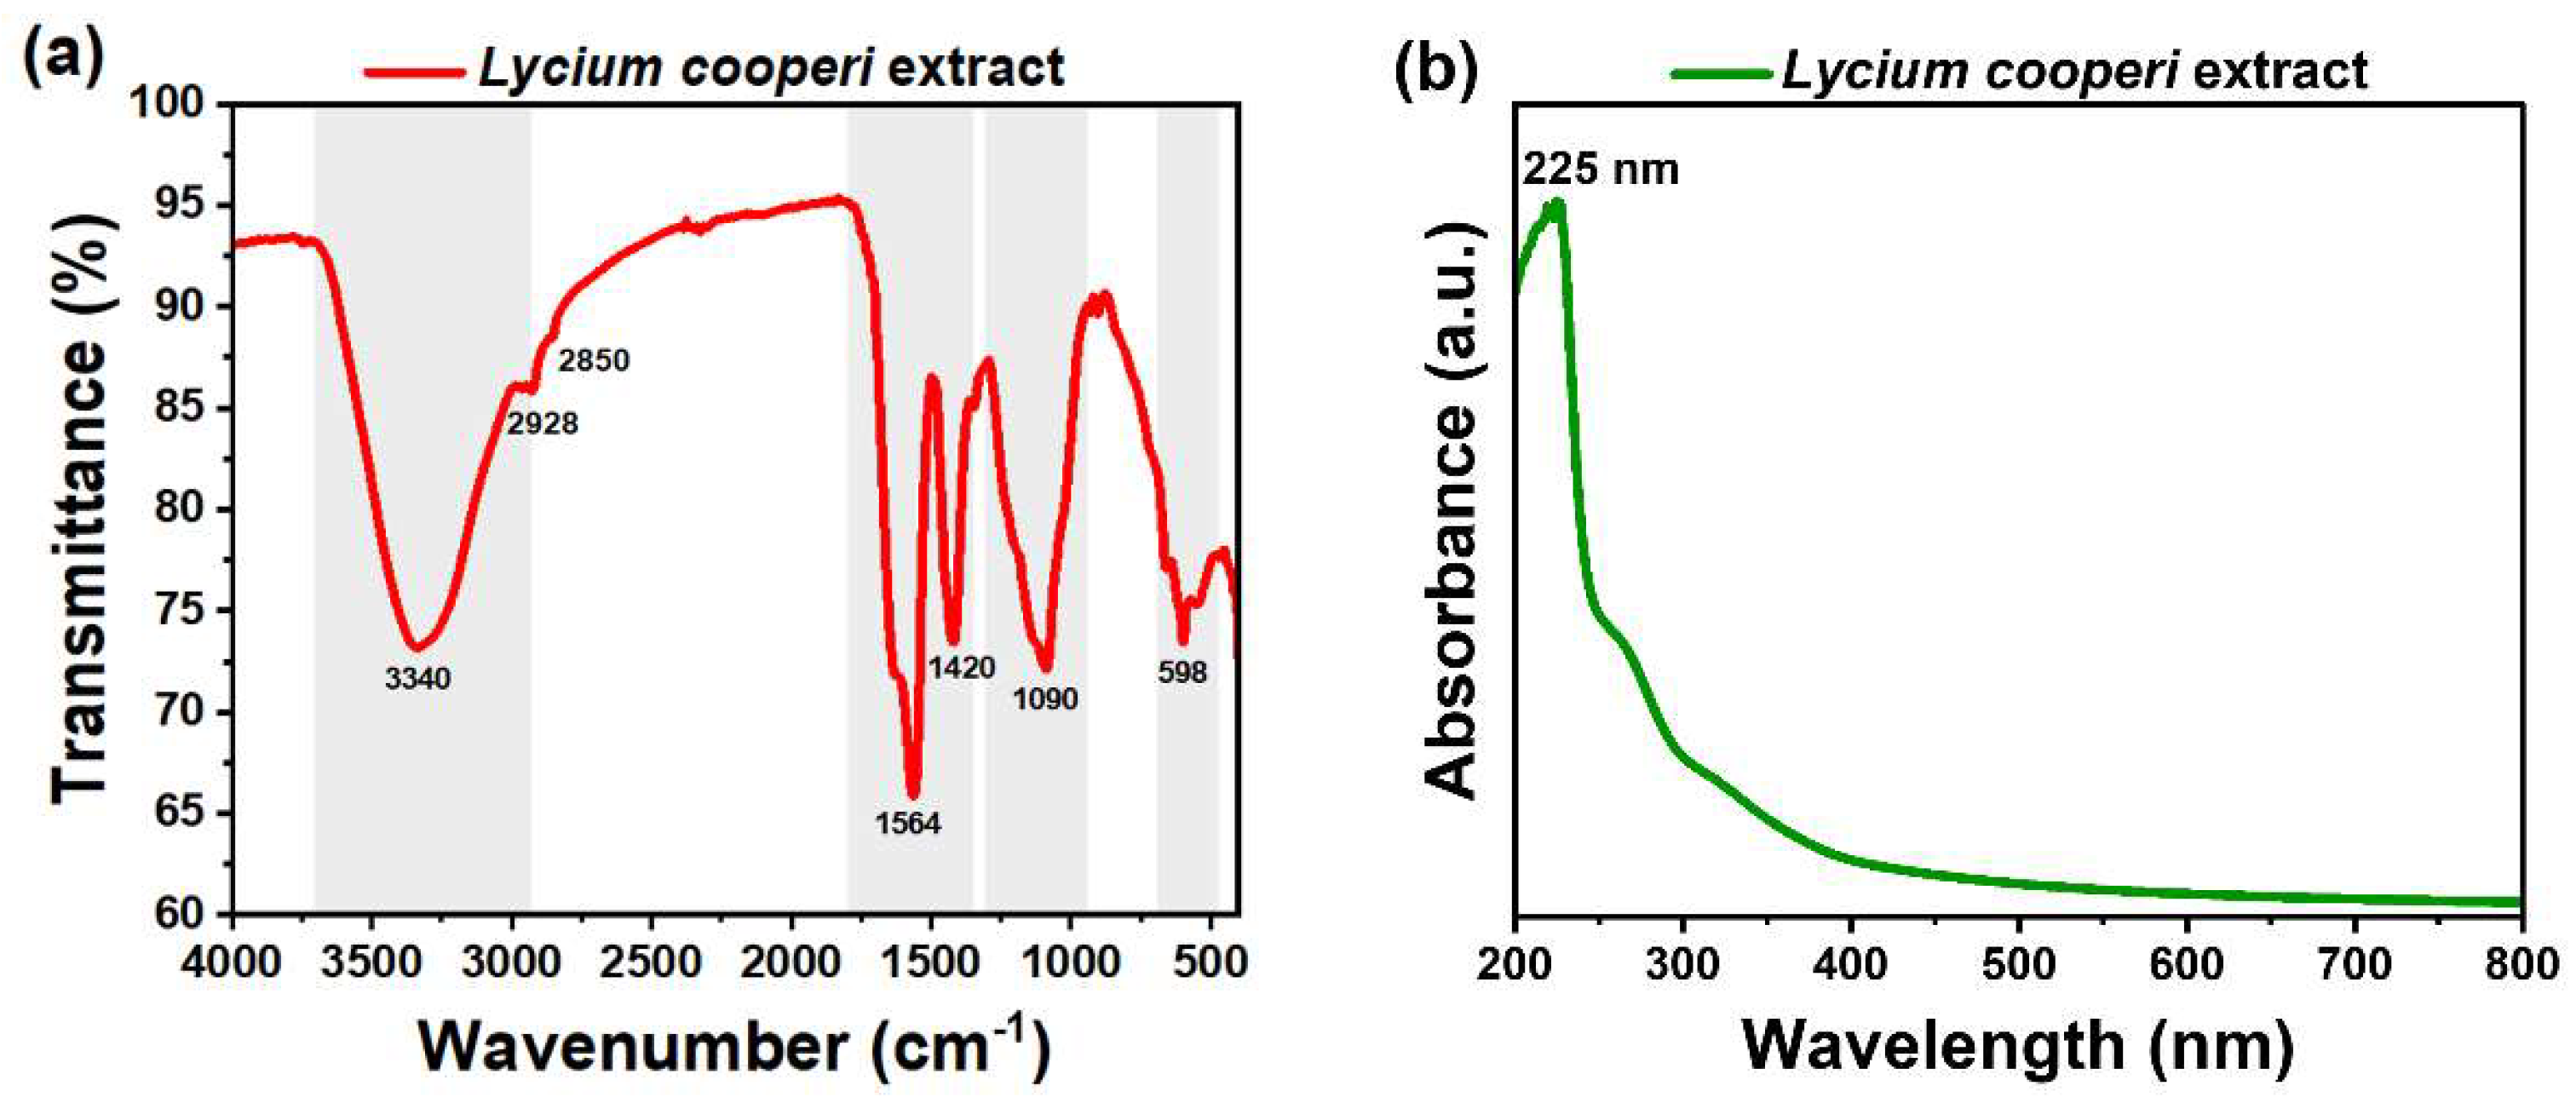
Figure 5.
SEM (a) and (b) EDS of CeO2-NPs.
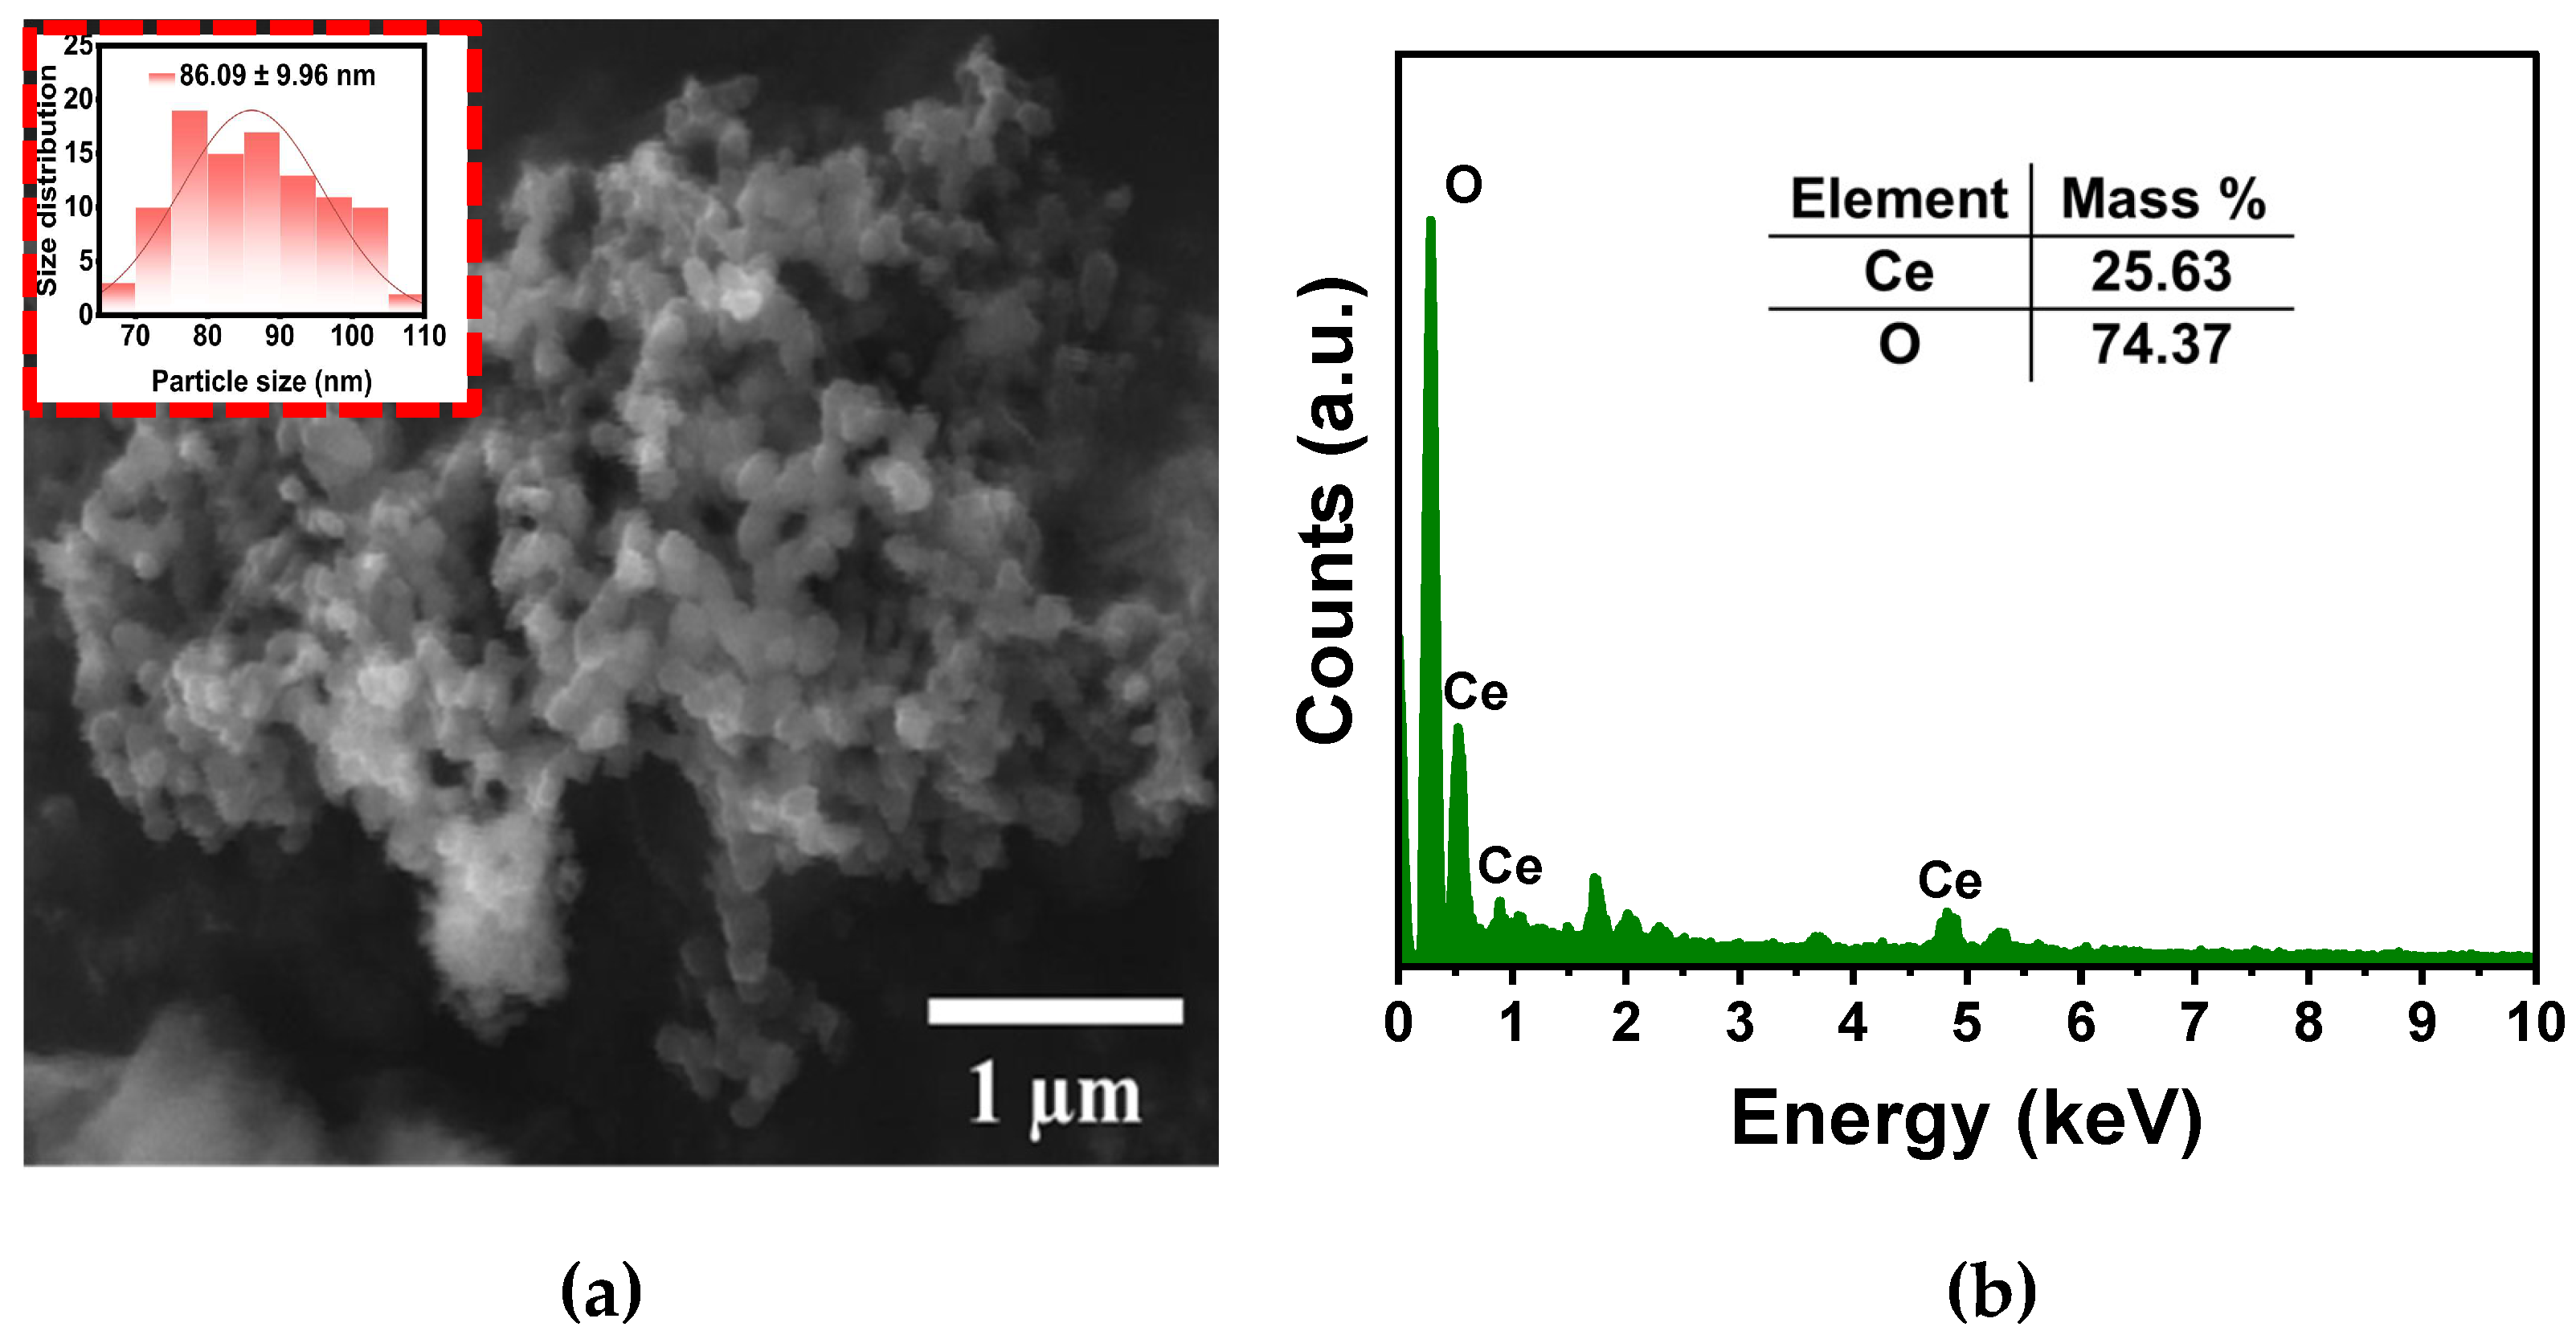
Figure 6.
TEM micrographs of CeO2-NPs and size distribution (a), highlighting the crystal structure (b) and interplanar distance (inset).
Figure 6.
TEM micrographs of CeO2-NPs and size distribution (a), highlighting the crystal structure (b) and interplanar distance (inset).
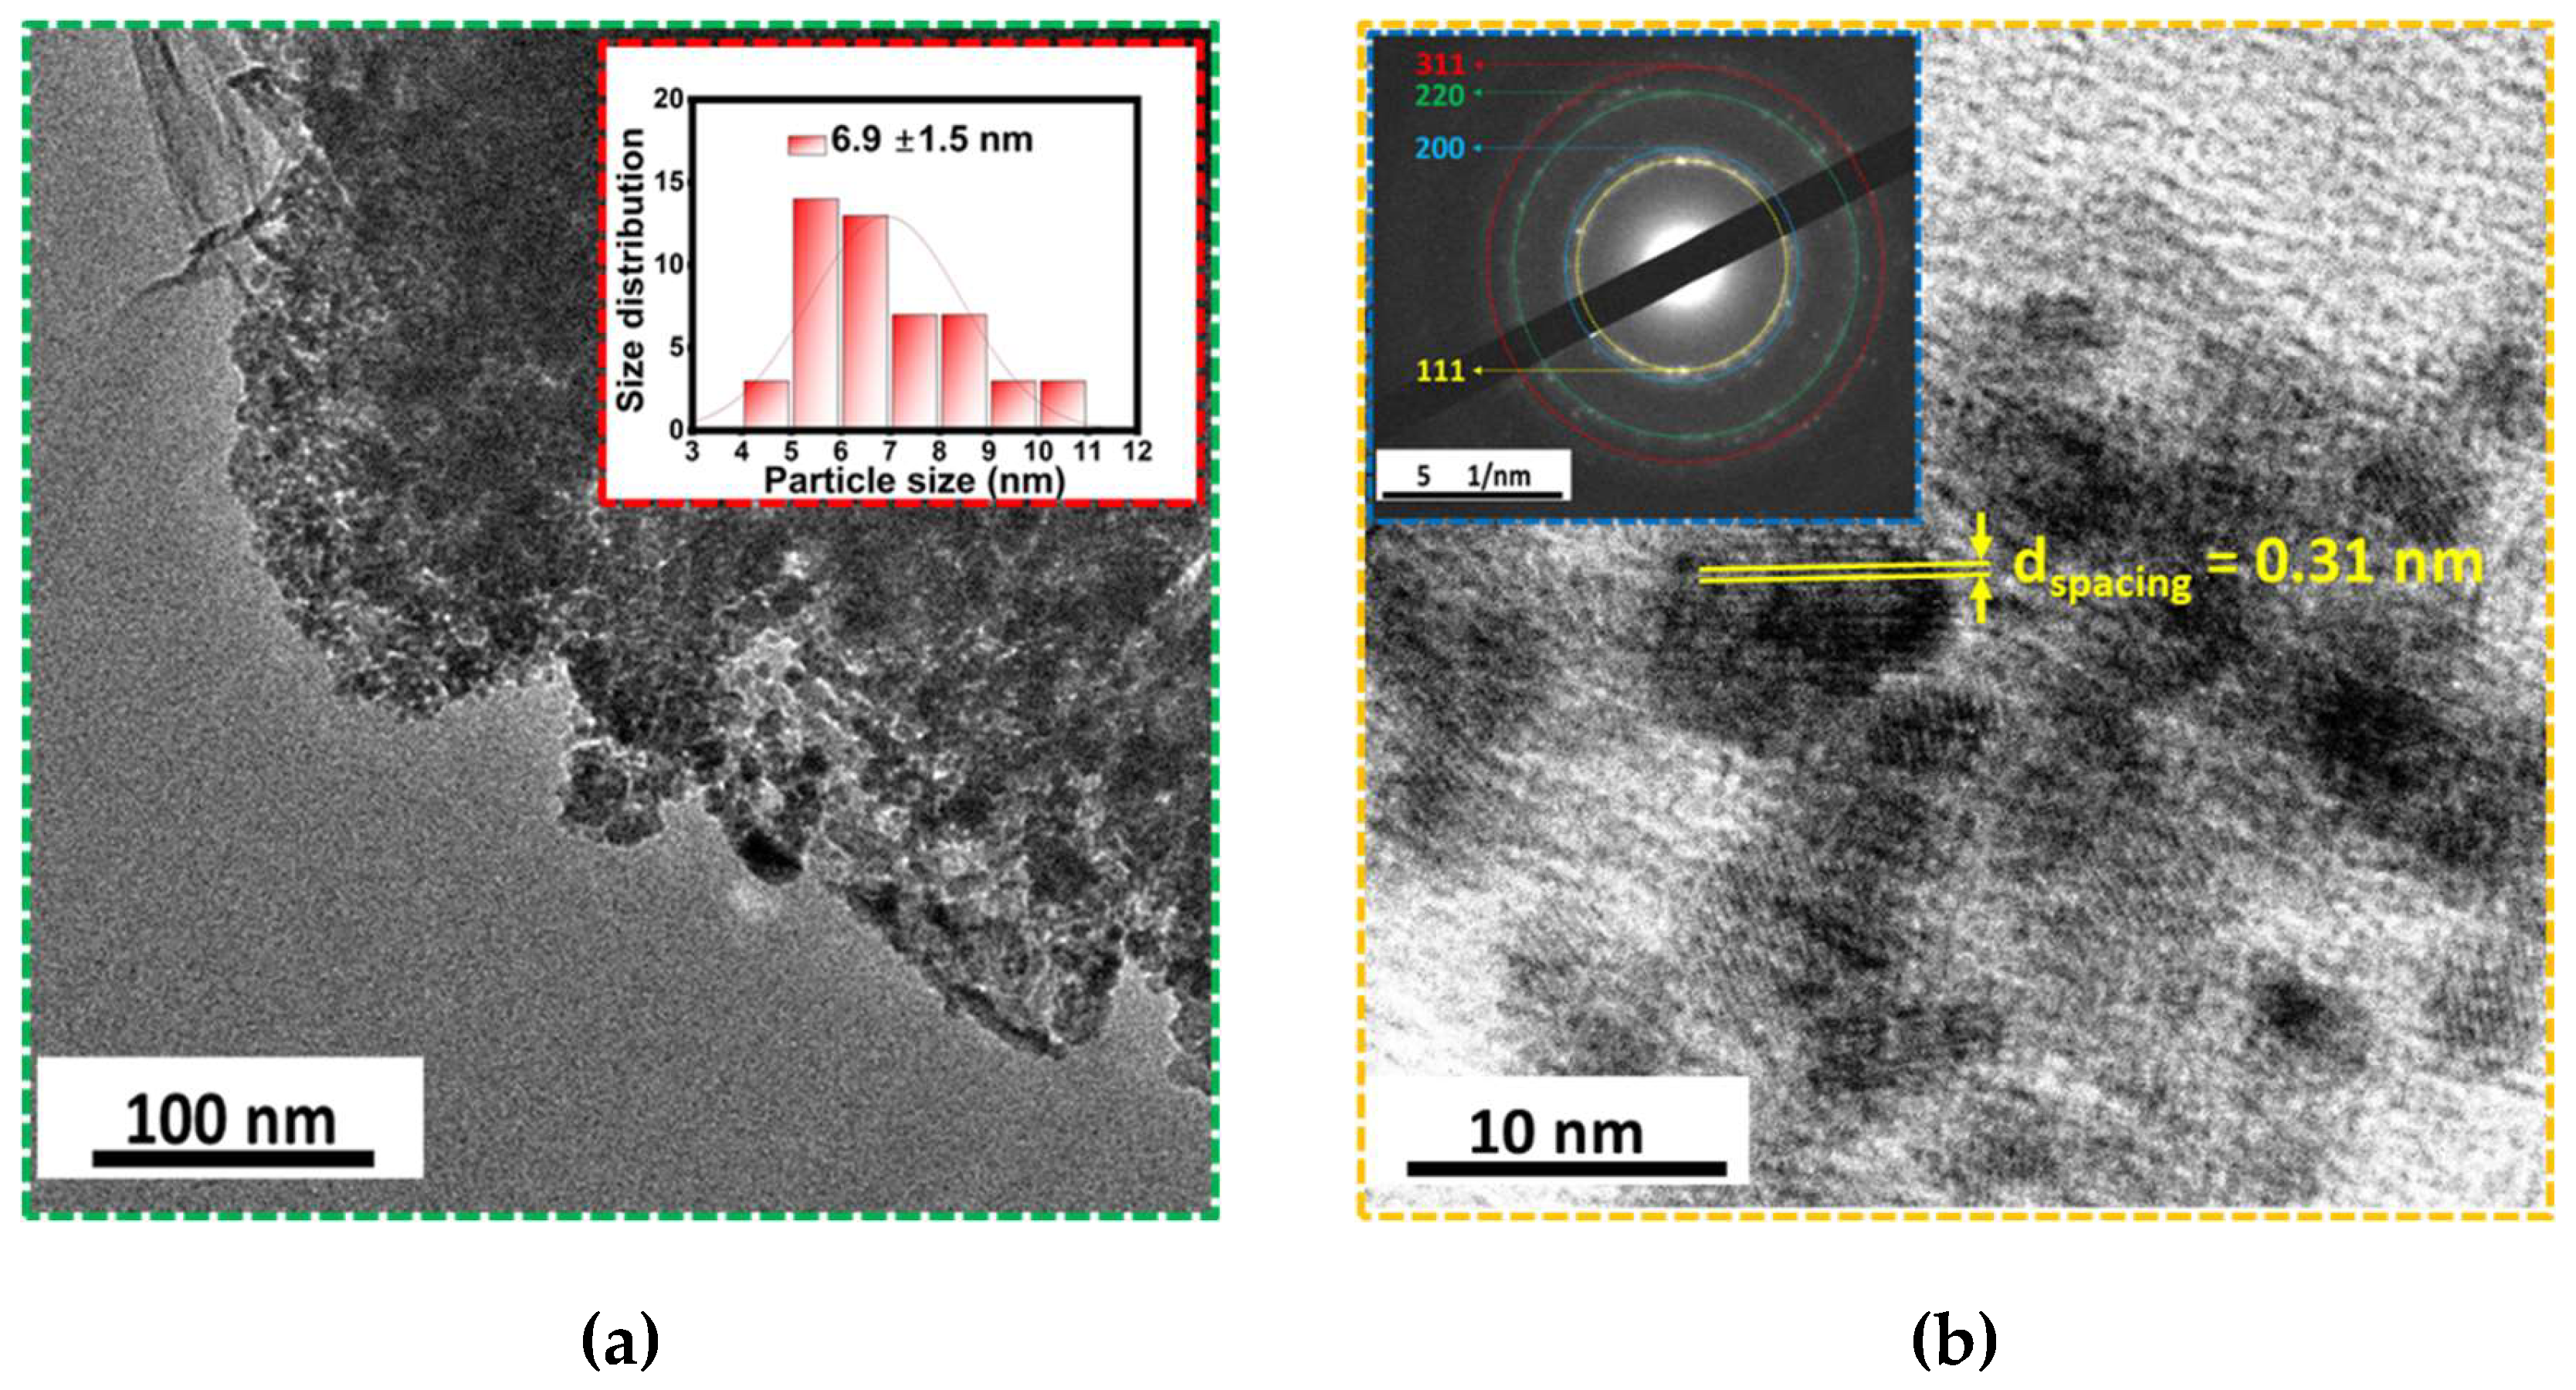
Figure 7.
XRD patterns of CeO2-NPs.
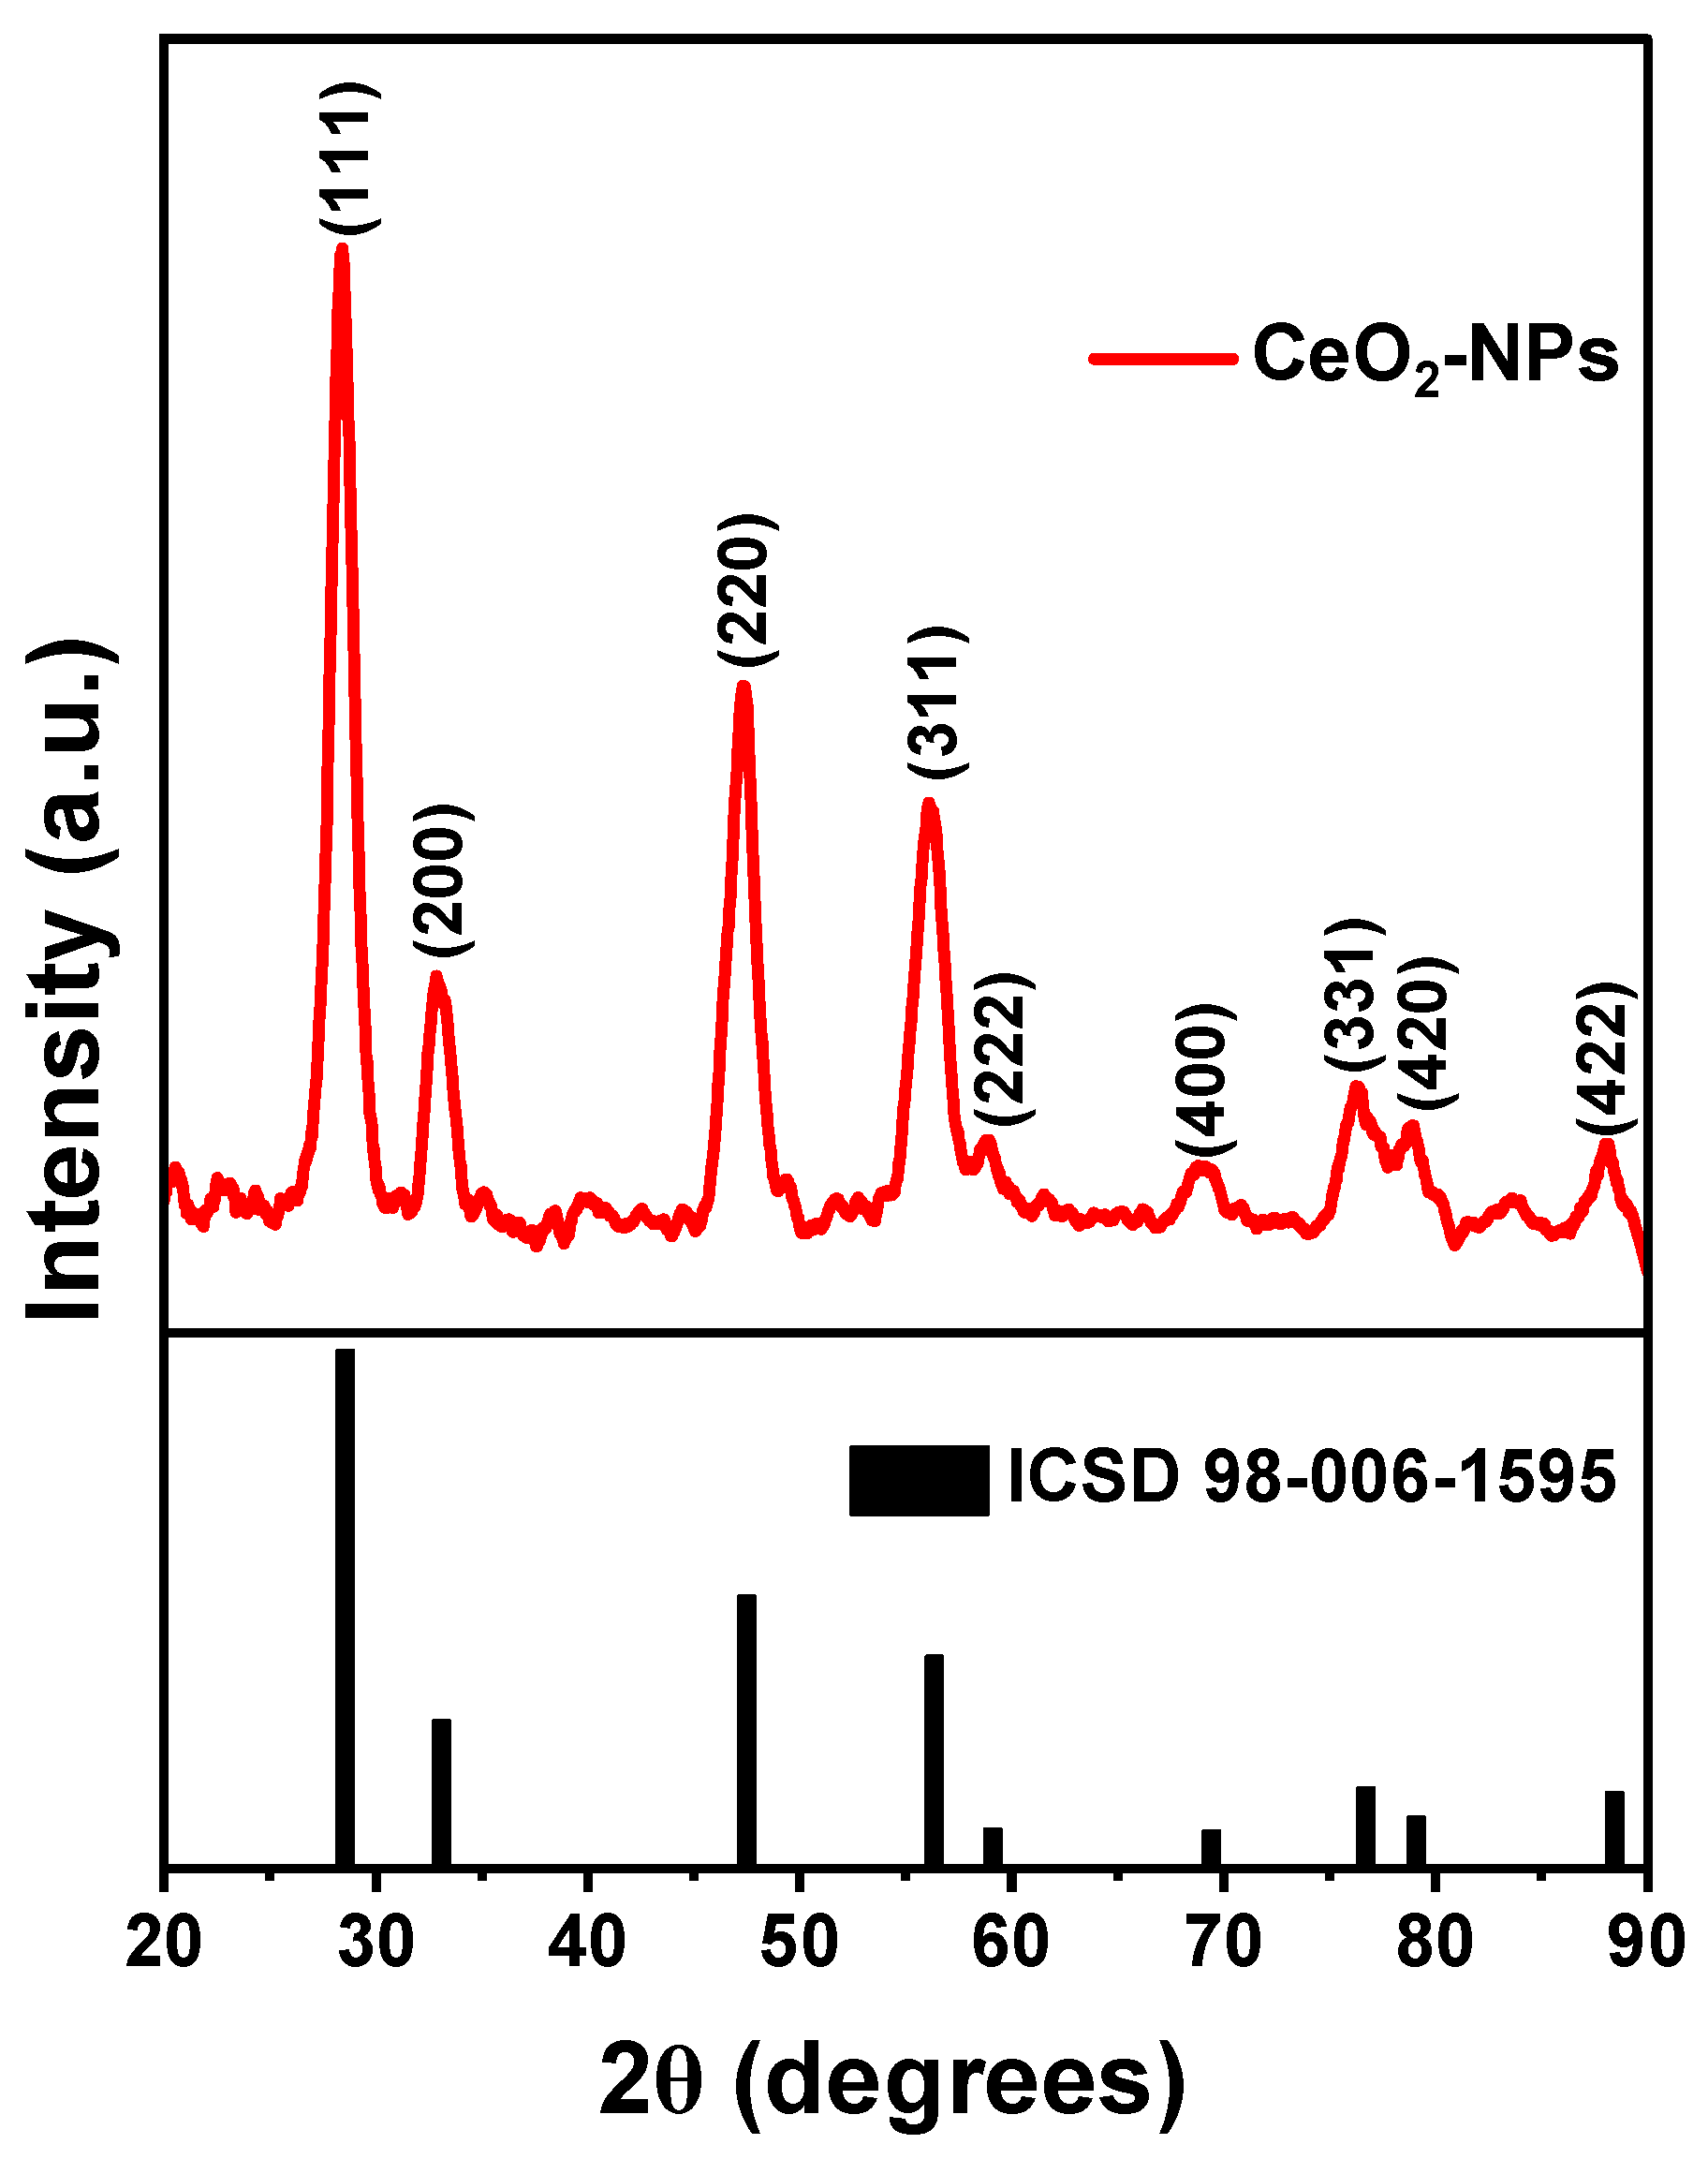
Figure 8.
FT-IR spectrum of CeO2-NPs.
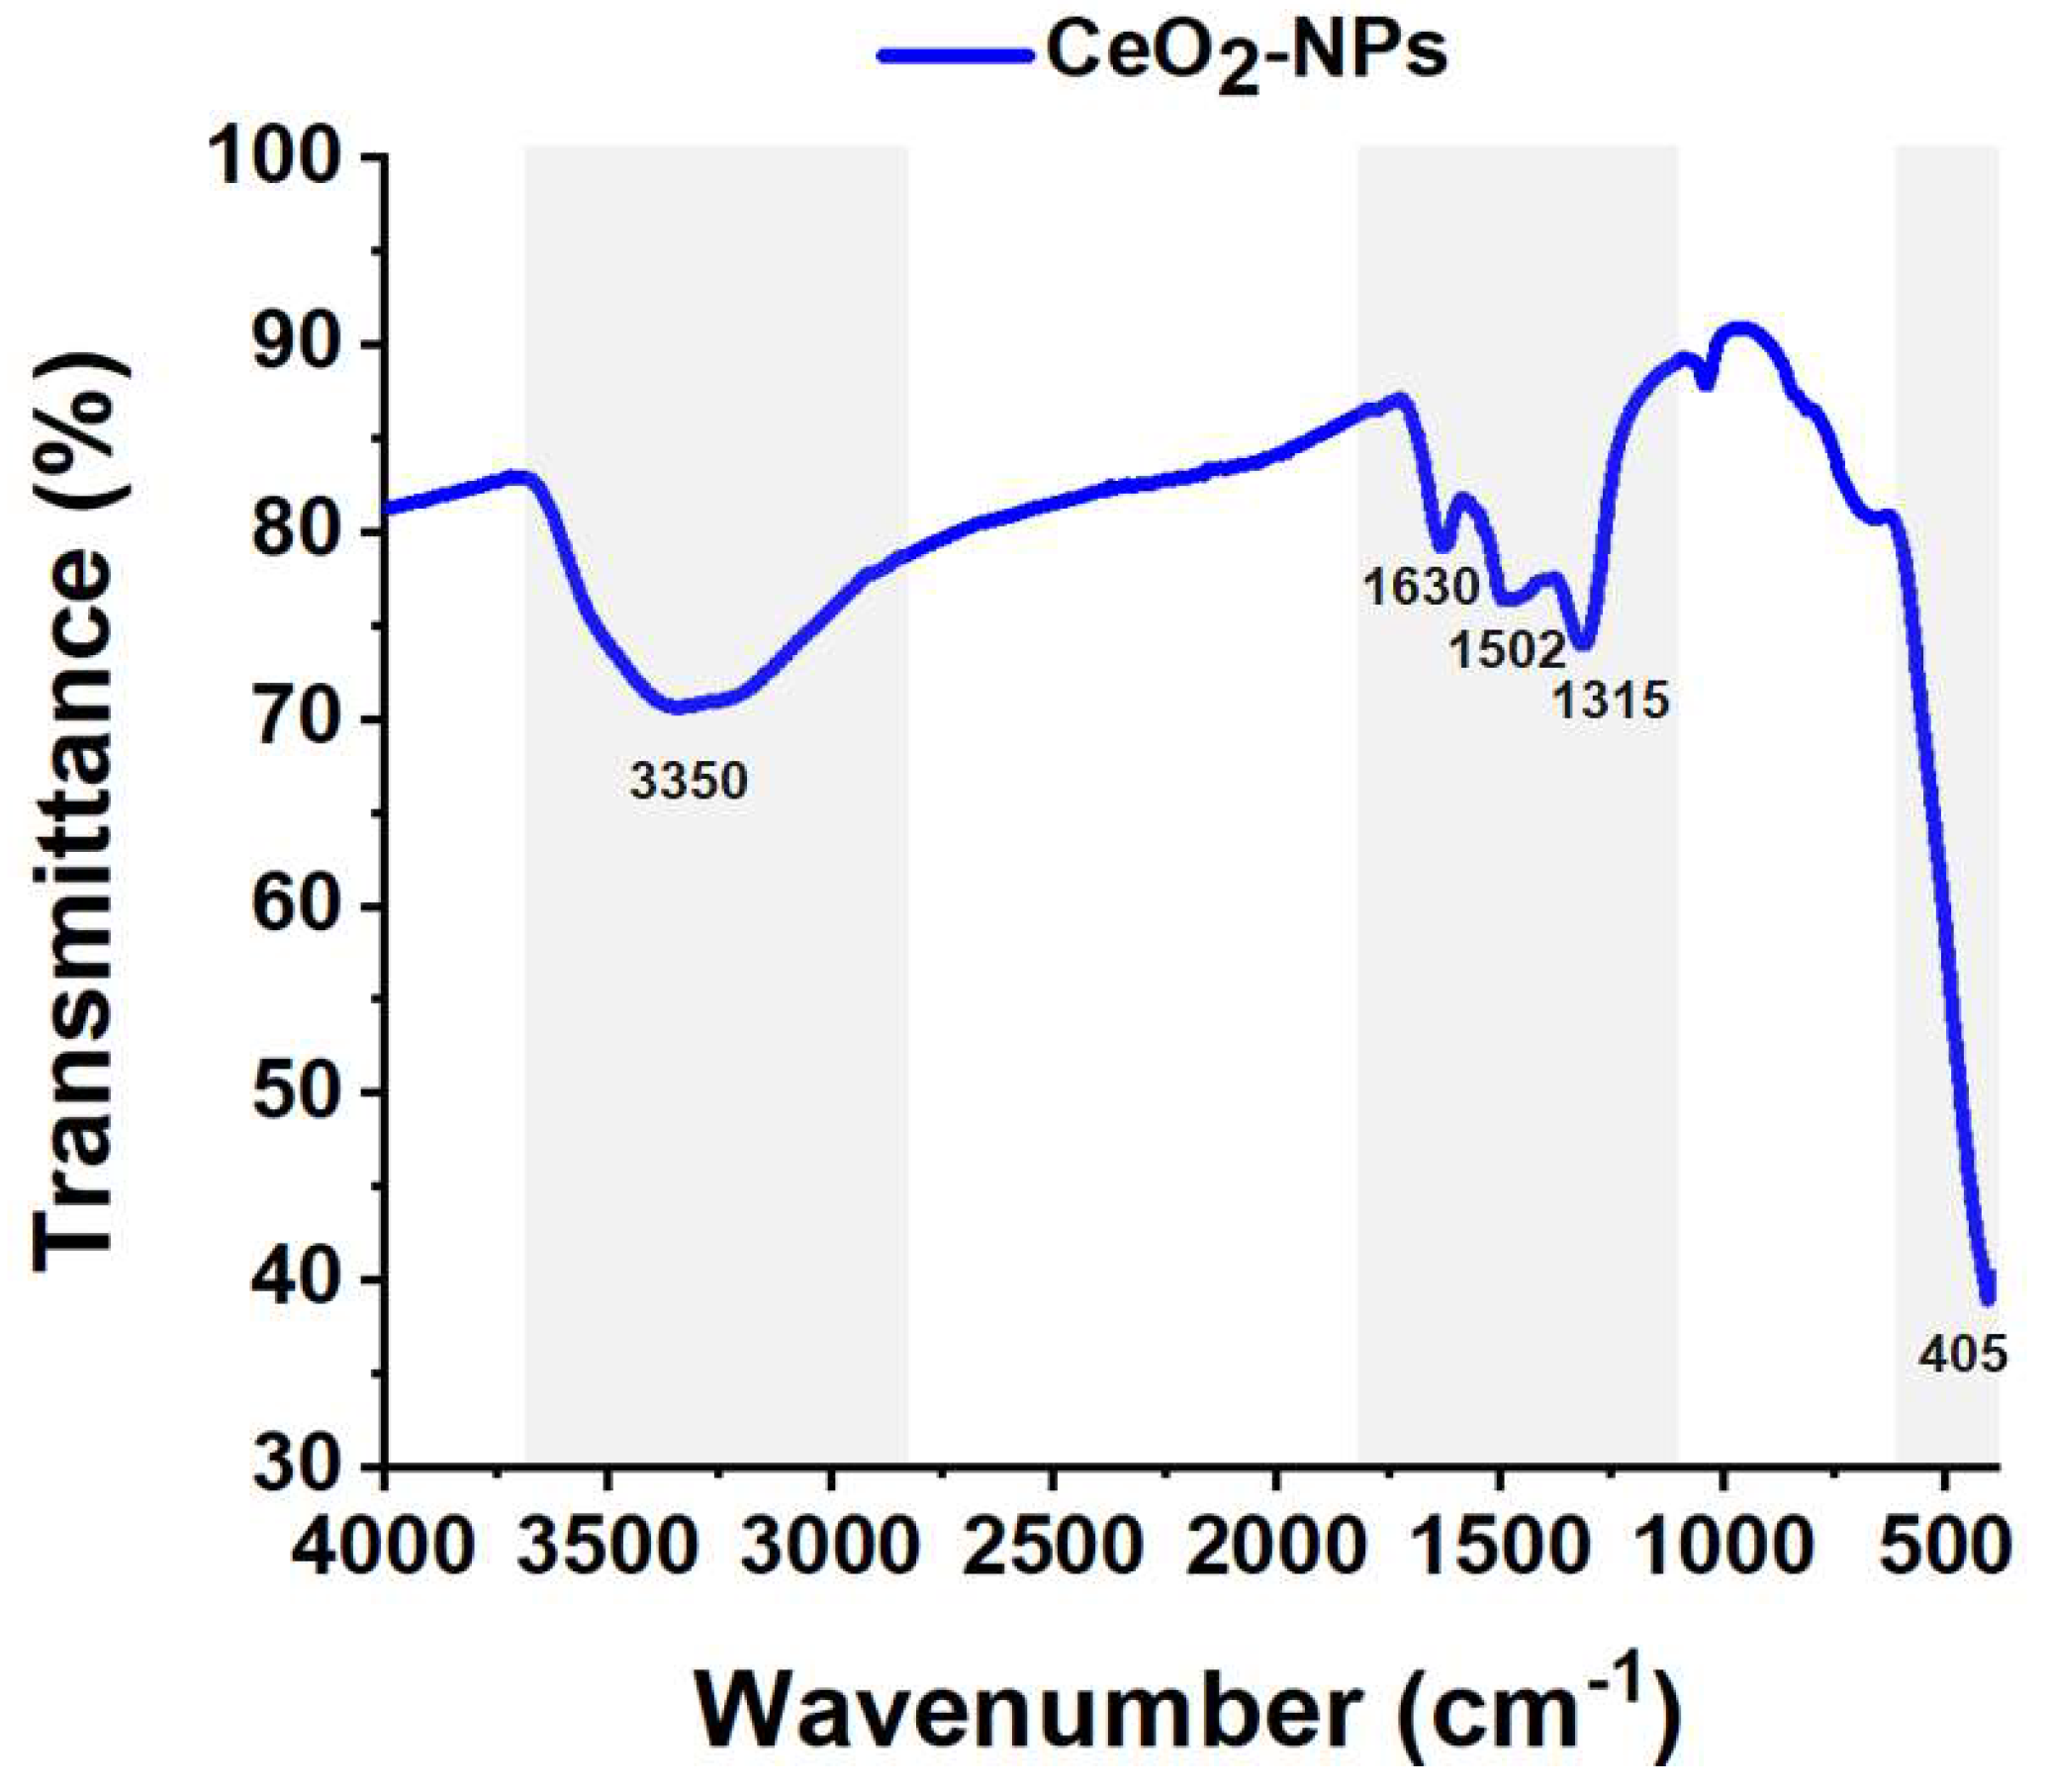
Figure 9.
Optical bandgap for CeO2-NPs was determined using the Tauc model and UV-Vis spectrum of CeO2-NPs (inset).
Figure 9.
Optical bandgap for CeO2-NPs was determined using the Tauc model and UV-Vis spectrum of CeO2-NPs (inset).
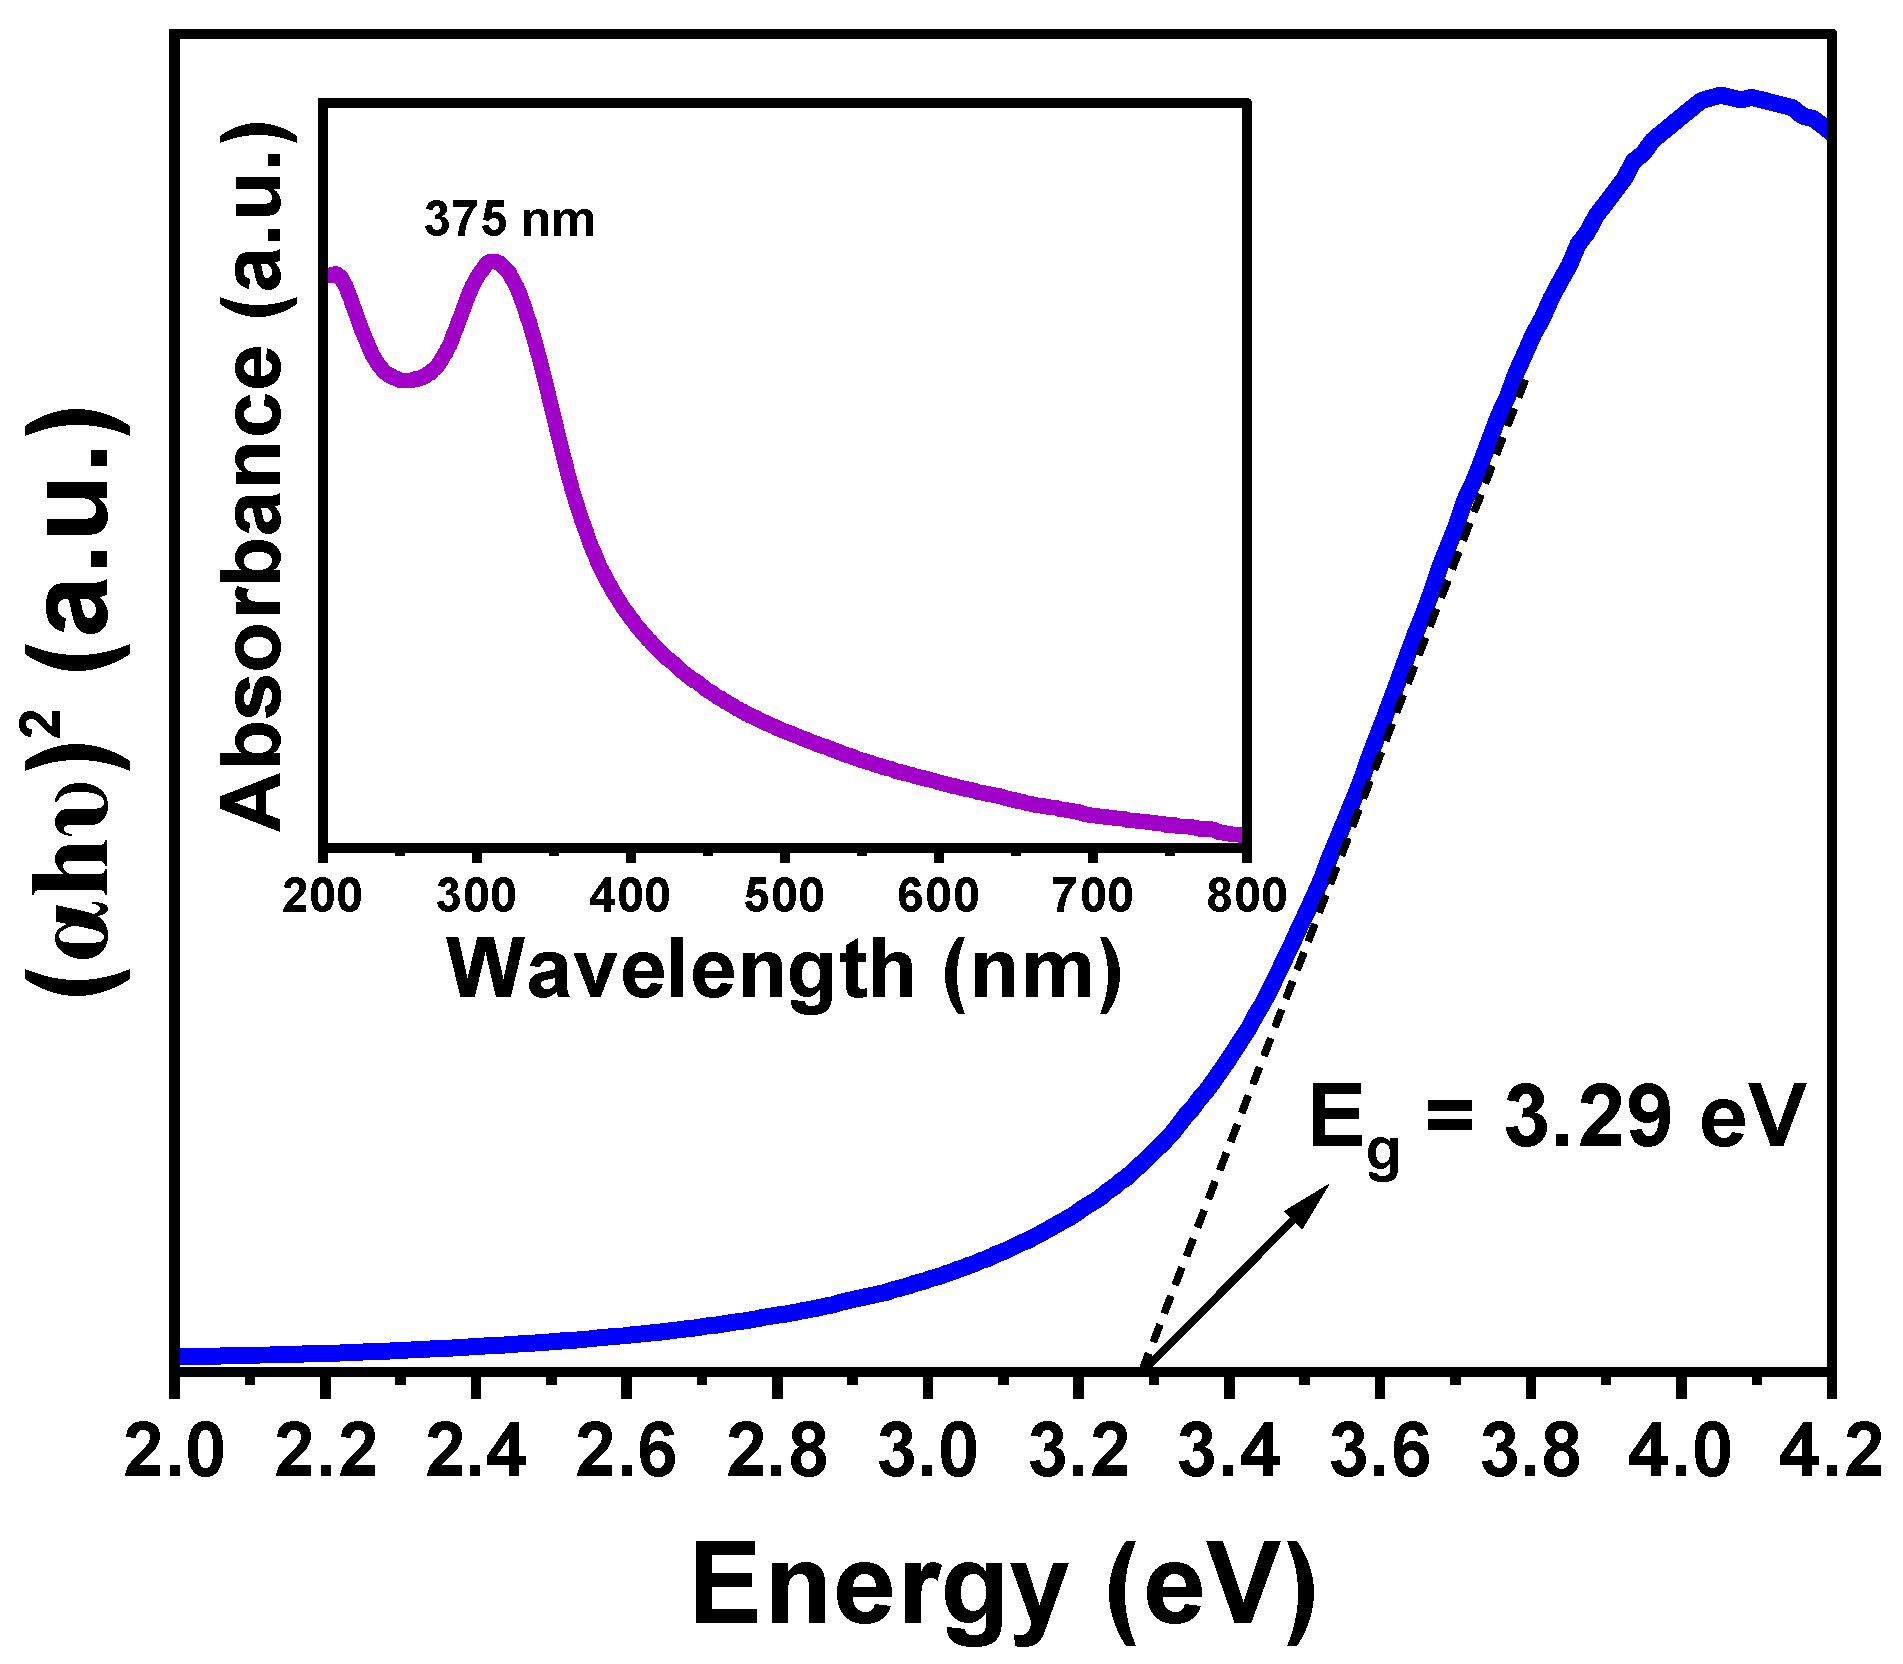

Table 1.
Characteristic of L. cooperi plant [24].
Table 1.
Characteristic of L. cooperi plant [24].
| L. cooperi plant | |
| Habit: | Glandular-puberulent; branches rigidly ascending to erect, shrub, leafy. |
| Leaf: | Size: 1-3cm, Shape: Oblanceolate to obovate. |
| Flower: | Calyx size: 8-15 mm, Calyx shape: Narrowly bell, Lobe number: 4-5 mm, Lobe shape: Tube, Lobe size: 1.5-3 mm, Corolla shape: Narrowly funnel, Corolla color: White, Corolla size: 9-12mm. |
| Fruit: | Size: 5-9 mm, Color: Yellow to orange. |
| Seed: | Several |
| Distribution: | California, Arizona and Utah. |
Table 2.
Phytochemical test results of L. cooperi aqueous extract. .
| Metabolite | Test | Result |
| Alkaloids | Hager and tannic acid | (+) |
| Flavonoids | Ammonia | (+) |
| Saponins | Froth’s | (–) |
| Tannins | FeCl3 | (–) |
| Terpenoids | Terpenoid | (–) |
| Cardiac glycosides | Keller-Kellani’s | (+) |
| Carbohydrates | Benedict’s | (+) |
Table 3.
A comparison of the green precipitation method for the synthesis of CeO2-NPs was reported in the literature with the results obtained in this work.
Table 3.
A comparison of the green precipitation method for the synthesis of CeO2-NPs was reported in the literature with the results obtained in this work.
| Plant extract | Size of NPs | Band gap | Synthesis time and temperature | Calcination temperature and time | Ref. |
| Origanum majorana L | ~20 nm | - | 48 h at 100 °C | 450 °C for 4 h | [16] |
| Acorus calamus | ~22 nm | - | 4 h at RT | 400 °C for 2 h | [17] |
| Calotropis procera | ~21 nm | ~3.3 eV | 3 h at 85 °C | 400 °C for 2 h | [18] |
| Azadirachta indica | ~28 nm | - | - | - | [19] |
| Artabotrys hexapetalus | - | ~3.2 eV | 6 h at 80 °C | - | [20] |
| Abelmoschus esculentus | ~36 nm | - | 6 h at 120 °C | 600 °C for 4 h | [21] |
| Moringa oleifera | ~17 nm | ~2.6 eV | 2 h at 80 °C | 600 °C for 2 h | [22] |
| Rheum turkestanicum | ~30 nm | ~3.3 eV | 24 h at 80 °C | 400 – 600 °C for 2 h | [23] |
| Lycium cooperi | ~7 nm | ~3.3 eV | 1 h at 80 °C | 400 °C for 2 h | This work |
Disclaimer/Publisher’s Note: The statements, opinions and data contained in all publications are solely those of the individual author(s) and contributor(s) and not of MDPI and/or the editor(s). MDPI and/or the editor(s) disclaim responsibility for any injury to people or property resulting from any ideas, methods, instructions or products referred to in the content. |
© 2024 by the authors. Licensee MDPI, Basel, Switzerland. This article is an open access article distributed under the terms and conditions of the Creative Commons Attribution (CC BY) license (http://creativecommons.org/licenses/by/4.0/).
Copyright: This open access article is published under a Creative Commons CC BY 4.0 license, which permit the free download, distribution, and reuse, provided that the author and preprint are cited in any reuse.


