
Submitted:
18 November 2024
Posted:
19 November 2024
You are already at the latest version
Abstract
Background: Oncogene-driven NSCLC are usually treated with targeted therapies using tyrosine kinase inhibitors (TKIs) to inhibit oncogene downstream signaling pathways thus affecting tumor survival and proliferation. EGFR and KRAS mutant NSCLC are the most represented subtypes and they are treated in clinical practice with oncogene-targeting drugs in first and second line, respectively. Unfortunately, the development of oncogene-independent resistant clones limits TKIs efficacy. Here, we used non-oncogene addiction (NOA) as an innovative therapeutic strategy to target other essential proteins that support changes in tumor phenotype. Specifically, we tested for the first time a combination of ATR, involved in DNA damage response, and pyruvate dehydrogenase kinases (PDKs), involved in energy metabolism, inhibitors. Methods: Sensitive PC9 and the corresponding EGFR-TKI-resistant PC9/OR, EGFR mutant H1975 and KRAS mutant A549 NSCLC cells were treated with TKIs (osimertinib and selumetinib, respectively). In parallel, cells were exposed to two combination regimens: one using the TKI with ATR inhibitor and the other one combining the two selected NOA inhibitors (ATR inhibitor, M4344 and PDK inhibitor, DCA). Results: The effect of these two combined approaches, compared to TKI alone, produced similar results in terms of cell proliferation, cell death and migration. Thus, depending on tumor biology, the selection among these proposed therapeutic strategies will be different to maximize tumor response. Conclusions: The major translational relevance of this study is to exploit new targets for innovative and improved therapeutic strategies with NOA drugs, over combinations including target genes within oncogenes pathway, to overcome resistance to TKI therapies in oncogene-addicted NSCLC patients.
Keywords:
DDR
; energetic metabolism
; NOA therapy
; NSCLC
1. Introduction
Cancer is a multitude of distinct genetic diseases with common hallmarks [1,2] that, unlike normal cells, is subjected to hyperactivation of oncogenic pathways responsible for altered proliferation programs and cell death resistance to drug stimuli. The strong dependence on the oncogenic signaling of several tumors, a phenomenon called oncogene addiction (OA) [3], led to the development of targeted therapies to inhibit the oncogenes [4]. Unfortunately, despite the initial therapeutic response, in most patients, tumor regrowth will occur due to survival of drug-resistant clones [5]. In particular, EGFR mutant NSCLC represents the major example of oncogene addiction and KRAS mutant NSCLC represents the most common oncogene-driven detectable in NSCLC [6,7]. In this scenario, we approach the conceptual framework of non-oncogene addiction (NOA) inhibition [8] alone or in combination with oncogene-driver inhibitors and how this can be exploited to develop new innovative therapeutic approaches in NSCLC to prevent the occurrence of resistance. To face up intracellular stress due to selective drug pressure, tumors become dependent on a plethora of essential genes (not mutated or aberrantly expressed) that are necessary to support the transformed phenotype, even though not directly involved in tumor initiation. In particular, NOA targets are involved in DNA damage and replication, mitotic, proteotoxic, metabolic and oxidative stress which are clearly interconnected with each other. The majority of cancer cells present a genomic instability that causes an enhanced sensitivity to agents that interfere with this stress response pathway; inhibitors of the DDR kinases exhibit selective toxicity toward cancer cells. Moreover, the tumor-altered metabolism, called the Warburg effect, diverts resources toward biosynthetic pathways, reduces ROS production through mitochondrial oxidative phosphorylation and copes with oxygen availability in the tumor microenvironment. Exploiting the DDR and the Warburg effect as potential therapeutic opportunities can limit toxicity of these therapies on normal proliferating cells. Our group has previously demonstrated that EMT-related (epithelial-to-mesenchymal transition) pathways can be actively explored as targets for combination approaches in EGFR mutant NSCLC [9,10]. EMT is a process by which epithelial cells gradually lose their cell–cell adhesion ability and gain migratory and invasive properties to become mesenchymal cells. More recently, we also demonstrated the relevance of DNA damage response (DDR) targeting along with ITGB1 (a marker of EMT) to prevent and avoid the resistance to oncogene driver targeting drugs, such as osimertinib and selumetinib that act on EGFR/RAS/MEK pathways [11,12]. Among DDR proteins, ataxia telangiectasia and Rad3-related (ATR) has been shown as a key mediator of EMT-guided resistance through activation of BIM-induced apoptosis in EGFR-resistance [13,14].
In addition, we already explored the potential role of the selected NOA inhibitors as an innovative treatment strategy to increase tumor response and avoid resistance [15]. In particular, we firstly demonstrated a non-canonical role of PDK1 as a negative regulator of apoptosis; its silencing, indeed, is associated with an increase of BAX and a concomitant decrease of Bcl-2/Bcl-xL at mitochondria interface in NSCLC. This pro-apoptotic status was confirmed in ex vivo shPDK1 tumors associated with an increase of BIM and cleaved lamin A/C and a decrease of HIF-1α, Bcl-2/Bcl-xL and mutant p53 [16].
In this scenario and for the present study, we selected PDKs and ATR as novel NOA targets to be combined to efficiently target apoptosis pathways and to test the effect of NOA inhibitors alone or in combination in comparison with single oncogene-targeted inhibitors. In parallel, we also investigated the combination effect of the oncogene inhibitor with the NOA inhibitor to determine whether targeting the downstream oncogene pathways is essential in combination regimens.
The aim of this study was to demonstrate that co-targeting of PDKs and ATR may induce a concurrent inhibition of multiple pathways involved in cell proliferation, metabolism and EMT, thus preventing drug resistance, caused by a selective drug pressure of a targeted single agent. Furthermore, in cell models where the oncogene driver is not efficiently inhibited, we tested the effect of NOA inhibitors used in combination as a potential strategy to overcome drug resistance.
In summary, we propose that better understanding of the non-canonical role of NOA targets could represent a novel cancer’s Achille’s heel opening a new clinical approach for EGFR/KRAS mutant lung cancer patients.
2. Materials and Methods
2.1. Cell Lines and Treatment
The PC9, H1975 and A549 cell lines were purchased and authenticated by the American Type Culture Collection (ATCC). In particular, PC9 cells are characterized by the deletion delE746_A750 of the kinase domain of EGFR conferring sensitivity to erlotinib. H1975 cells, on the other hand, hold an activating point mutation in exon 21 (L858R) of the kinase domain of EGFR which also harbors the T790M mutation, conferring resistance to erlotinib. A549 cells bear KRAS mutation (G12S) and wild type EGFR. In addition, to obtain osimertinib-resistant (OR) cell lines, PC9 cells were continuously exposed to osimertinib as previously described [17]. PC9, PC9/OR and H1975 cells were cultured in RPMI 1640 (S.I.A.L. Srl, Italy) medium and A549 cells in DMEM (Aurogene Srl, Italy) medium both supplemented with 10% fetal bovine serum (FBS), 100 IU/ml penicillin and 50 mg/ml streptomycin at 37°C in the presence of 5% CO2.
2.2. Treatment and Cell Viability
Cells were treated with oncogene inhibitors of double mutant EGFRL858R/T790M such as osimertinib (Selleck Chemicals, Selleckchem) and MEK inhibitor selumetinib (Selleck Chemicals, Selleckchem) to target KRAS downstream signaling and vehicle for 48 h at the indicated doses. Concerning NOA targets, cells were treated with dichloroacetate (DCA, Sigma Aldrich) as inhibitor of PDKs, M4344 (Selleck Chemicals, Selleckchem) as inhibitor of ATR at the indicated time and doses alone or in combination among them. In particular, cells were treated with 1 μM osimertinib, 5 μM selumetinib, 500 μM DCA and M4344 2 μM alone. Combined treatments were obtained with 0.5 μM osimertinib plus 1 μM M4344 for PC9, H1975 and PC9/OR cells, 2.5 μM selumetinib plus 1 μM M4344 for A549 cells and 250 μM DCA plus 1 μM M4344 for all cell lines for 48 hours. In all the combined treatments, inhibitor concentration is always the half of the single treatment.
An automatic cell counter (LUNA-II™ Automated Cell Counter, Logos Biosystems) was used for cell number evaluation that, after cell count with trypan blue, gave us back the total amount, living and dead cells and also cell viability.
2.3. MTT Assay
The viability of NSCLC cell lines following a 96 h treatment period was evaluated using MTT assay, as previously described [11]. Briefly, a total of 3.000 cells were seeded in each well of a 96-plate for 96 h with TKIs, DCA and M4344, either alone or in combination. The dose of each treatment as already mentioned. The number of viable cells was determined by measuring the absorbance at 490 nm using a spectrophotometer. The data are expressed as a percentage of viable cells, with the viability of CTRL cells set at 100%.
2.4. Immunoblotting Analysis
Whole cell lysates were prepared in accordance with the previously described method [15]. Briefly, untreated and treated cells were lysed on ice in RIPA lysis buffer (R0278, Sigma-Aldrich) with protease (P8340, Sigma-Aldrich) and phosphatase inhibitors (P0044, Sigma-Aldrich). The suspension was kept on ice for 30 min and then centrifuged at 13,000 x g at 4°C for 20 min. Western blot analysis of proteins from different lysates was performed. The following antibodies were used for western blotting: α-tubulin (T9026, Sigma-Aldrich), p-EGFRTyr1068 (2236, Cell Signaling Technology), EGFR (sc-03, SantaCruz Biotechnology), p-ERK1/2 (9106, Cell Signaling Technology), ERK1/2 (9102, Cell Signaling Technology), p-ATRSer428 (2853, Cell Signaling Technology), ATR (2790, Cell Signaling Technology), p-p53Ser15 (9284, Cell Signaling Technology) p53 (sc-126, SantaCruz Biotechnology), p-PDHSer293 (ab92696, Abcam), PDH-E1α (D-6) (sc-377092, SantaCruz Biotechnology), GAPDH (2118, Cell Signaling Technology), p-H2AXSer139 (9718, Cell Signaling Technology), H2AX (7631, Cell Signaling Technology), pChk1Ser317 (12302, Cell Signaling Technology), Chk1 (2360, Cell Signaling Technology), p-cyclin D1 (Thr286) (D29B3) (3300, Cell Signaling Technology), cyclin D1 (92G2) (2978, Cell Signaling Technology), BID (7A3) (2006, Cell Signaling Technology), Bcl-2 (D55G8) (4223, Cell Signaling Technology). A commercially available ECL kit (Biorad, cat. n. 170-5061) was used to reveal the reaction.
2.5. Glycolytic and Mitochondrial ATP Rates
ATP production through glycolysis and electron transport chain (ETC) was determined using the Seahorse XFp Analyzer (Agilent Technologies, Santa Clara, Ca, USA) and the real-time ATP rate assay kit (Agilent technologies) following manufacturer’s instructions. Briefly, all cell lines were seeded on XF 96-well microplates to attach overnight and the next day treated, as described before, for 48 h. Data were collected (at least 5 independent measurements), normalized for cell number and represented as an energetic map by reporting mitochondrial and glycolytic ATP contribution.
2.6. Cytofluorimetric Analysis of Cell Cycle Profile and Cell Death
For cell cycle analysis, cells were treated as described before for 48 h, collected, washed with PBS and fixed in 70% ice-cold ethanol. Incubation with with 50 μg/mL propidium iodide (PI; cat# P4170; Sigma-Aldrich) and 1 mg/mL RNase (cat# 9001-99-4; Sigma-Aldrich) at RT was performed. The analysis was carried out with FACS CANTO II and ModFit LT. For apoptosis detection, cells were stained with Annexin V-FITC and PI (BD Pharmingen) according to the manufacturer’s instructions and analyzed using FACS with FACS CANTO II. Analysis was performed by Diva software.
2.7. Mitochondrial Membrane Potential
The mitochondrial membrane potential (MMP) is a characteristic parameter indicating mitochondrial function and when MMP is reduced, cells undergo apoptosis. The MMP can be measured using the TMRE (tetramethylrhodamine, ethyl ester) dye. Briefly, all cell lines were seeded in dark 96-well plates at density of 5.000 cells/well and treated or not with selected TKIs alone or in combination (at the half of doses) for 48 h as previously described. Firstly, as positive control (MMP loss), we incubated control cells with 50 μM CCCP (carbonyl cyanide 3-chlorophenylhydrazone) for 5 min at 37°C and 5% CO2. Then, all wells were incubated with 200 nM TMRE staining solution for 20 min at 37°C and 5% CO2 and then washed with PBS. For quantitative analysis, fluorescence intensity was measured at Ex/Em: 550/580 nm with a fluorescence microplate reader (VICTOR® Nivo™ multimode plate reader). We also captured representative images using a high-resolution fluorescence microscope (ECLIPSE Ti2, Nikon, Japan). At least three independent experiments were performed.
2.8. Wound Healing Assay
To monitor migration ability, we performed wound healing to follow the change of the cell-covered area (gap closure) over time. Cells were seeded (6 well plate) at a density of 300.000 cells/well and allowed to attach overnight. After 24 h, we created a physical gap within a cell monolayer (using a pipette tip) and we added the different treatments. Then, we monitored the process of cell migration into the gap by taking pictures at different time points (from T0h to T48h) by selecting XY plate coordinates with a high-resolution phase-contrast microscope. To analyze the gap closure rate, we manually drew the distance between the gap and we expressed the % gap remaining versus each condition at T0. At least three independent experiments were performed and pooled together.
2.9. Immunofluorescence (IF)
Cells (10.000/well) were seeded in 96-well plates and then treated for 48 h. Cells were then fixed for 20 min with a 4% paraformaldehyde (PFA) solution and permeabilized for 20 min with 0.3% Triton X-100 1% BSA in PBS buffer at RT. Three washes with PBS followed by incubation overnight at 4°C with the primary antibody anti-E-cadherin (D2P2F) (Cell Signaling, cat. n. 3195S, 1:1000) and anti-Vimentin (Santa Cruz, cat. n. sc-6260, 1:200) in antibody dilution buffer (0.1% Triton X-100 in 1% BSA PBS) followed by revelation using Alexa Fluor 488-conjugated anti-rabbit IgG antibodies and Alexa Fluor 647-conjugated anti-mouse IgG antibodies (Jackson Immunoresearch Laboratories, West Grove, PA, USA) at a dilution of 1:250 for 1 h. Nuclei were stained with DAPI (1µg/mL) (Sigma). The fluorescence was analyzed by a high-resolution fluorescence microscope equipped with a 20X lens (ECLIPSE Ti2, Nikon, Japan).
2.10. Statistical Analysis and Graphical Elaboration
All statistical analyses were conducted using the Prism 8 software (GraphPad Software, San Diego, CA, USA). ANOVA or unpaired Student t test were used as appropriate. A p-value < 0.05 was considered to indicate statistical significance. The western blotting signals were quantified by morpho densitometric analysis using ImageJ software (NIH, Bethesda, MD, USA). Briefly, the product of the area and optical density of each band were determined and normalized to the same parameter derived from the equal loading used. Data were expressed as relative protein levels (fold change) of each treated sample compared to the corresponding vehicle-treated internal control.
3. Results
3.1. Effect of Selected Drugs on Cell Viability and Energetic Status in EGFR and KRAS Mutant NSCLC Cell Lines
We selected EGFR mutant NSCLC cells with activating mutations (deletion of exon 19) and with acquired resistance (T790M mutation in EGFR and MEK/MAPK cascade inactivation). In addition, the EGFR wild-type NSCLC cells exhibited mutant KRAS (G12S). PC9 and H1975 are sensitive to selective TKIs, in particular osimertinib for the EGFR mutant cells and selumetinib for the MEK/MAPK hyperactive cells. We primarily analyzed the expression of the oncogene and other key onco-proteins involved in NSCLC progression in our cells (Figure 1A). In particular, PC9 exhibited significantly higher levels of p-p53 while A549 showed higher total p53 protein expression. PC9/OR cells showed reduced phospho- and total EGFR compared to the other NSCLC cells. Finally, H1975 and PC9/OR showed higher p-ERK1/2 compared to the other selected cells. After, the sensitivity of the PC9, H1975, A549 and PC9/OR cell lines to 1 μM osimertinib, 5 μM selumetinib, 500 μM DCA and 2 μM M4344 was preliminarily tested and the results are shown in Figure 1B. As expected, the cell viability (%) of parental PC9, H1975 and A549 was significantly reduced after treatment with approved TKI. Whereas PC9/OR showed no sensitivity to osimertinib as previously demonstrated [11]. Interestingly, the ATR inhibitor M4344 alone significantly affected cell viability in all selected cell lines as compared to each control, with the highest effect towards PC9/OR. This could be due to the intrinsic phenotypic characteristics acquired during the occurrence of the resistance to osimertinib. Importantly, the combined treatment of TKI and M4344 induced a significant reduction in cell viability in PC9, H1975, PC9/OR and A549 cells. On the other hand, the DCA and M4344 combination was also able to significantly affect cell viability of PC9, PC9/OR and A549 with exception for H1975 cells. We also performed an MTT assay after 96 h treatments to assess the long term response to therapy (Supplementary Figure S1) which confirmed the 48 h results. We then performed western blot for the oncogenes pathway activation analysis after treatment with the selected TKI and NOA inhibitors (Figure 1C). As expected, we found a decrease of phosphorylated forms of direct drug targets, confirming the oncogene-addiction. In particular, we found a strong reduction of p-EGFR, after osimertinib treatment in PC9 and H1975 as well as of p-ERK after selumetinib treatment in A549 cells. In addition, treatment with DCA or M4344 did not affect oncogenes activation in the selected cell lines with the exception for the PC9/OR cells showing an increase of p-EGFR after treatment with M4344.
We next assessed the effect of the NOA inhibitors, namely M4344 and DCA, on the selective target phosphorylation ATR and PDH in our cell lines. In addition, we analyzed the effect of these treatments on p-p53Ser15 since it plays a major role in cellular response to DNA damage, and its activation can lead to either cell cycle arrest or apoptosis [18]. Treatment with TKIs increased levels of p-ATR in H1975 and A549 cells. Among the selected cell lines, PC9/OR and A549 showed the highest reduction of the phosphorylated form of ATR after treatment with M4344. Treatment with DCA increased p-ATR in A549 while it did not affect ATR levels in the other cell lines. Interestingly, treatment with M4344 caused an increase of p-p53Ser15 in all cells, thus indicating an activation of cellular response to DNA damage (Figure 2A). We then investigated the direct metabolic targets of DCA, namely phospho- and total PDH. Figure 2B shows that treatment with TKIs affect phosphorylation of PDH in PC9, H1975 and A549 cells. In addition, treatment with M4344 induced a reduction in PDH phosphorylation in all our cell lines. Next, Real Time ATP Seahorse assay was performed to assess the impact on NSCLC energy metabolism after treatment with TKIs and NOA inhibitors (Figure 2C). Interestingly, the different treatments affected the cell's energetic balance. Indeed, osimertinib induced in PC9 cells a metabolic shift towards the energetic phenotype increasing both glycolytic and mitochondrial ATP production rate, while in A549 selumetinib induced a shift towards aerobic phenotype with a reduction of the glycolytic ATP rate and an increase in mitochondrial ATP production rate. For the PC9 and H1975, osimertinib did not change the glycolytic ATP production rate but reduced the mitochondrial one. DCA treatment shifted PC9, H1975 and A549 cell lines towards a more oxidative phenotype, without affecting ATP rate in PC9/OR. Finally, M4344 increased glycolytic ATP production rate in PC9, H1975 and PC9/OR cells while shifted A549 cells towards mitochondrial ATP. Its effect on energy metabolism may be due to replication stress, occurring during inhibition of ATR, and the mutational status of p53 [19]. These findings show a rebalance of cell energy metabolism induced by our drugs.
3.2. ATR and PDH Co-Targeting Effect on Cell Cycle in EGFR and KRAS Mutant NSCLC Cell Lines
Next we aimed to investigate the effect of NOA inhibitors on cell cycle. In particular, we treated selected cells with a combination of M4344 with TKIs or with DCA at half of the concentration used for single treatments, with the aim to assess a potentiation of the effects in combination. Figure 3A shows a significant increase of G0/G1 and a decrease in S phases after treatment with osimertinib alone or in combination in PC9 cell line. A relevant data is the strong reduction of G2/M phase after all treatments except for untreated and DCA-treated conditions. In addition, osimertinib treatment alone significantly reduced S phase in H1975. Osimertinib combined with M4344 caused a significant increase of G1 phase, and reduced G2 phase in H1975 cells. Moreover, M4344 alone completely altered phase distribution determining a G1 decrease along with a S and G2 increase compared to untreated, osimertinib- and DCA-treated samples. PC9/OR, as a model of acquired resistance to osimertinib, showed that only treatment with M4344 caused a decrease of S phase and an increase of G2 compared to untreated, osimertinib- and DCA-treated cells. Selumetinib alone caused an increase of G1 and a decrease of S and G2 (also in combination with M4344) phases whereas DCA seems to not affect too much cell cycle in A549 cells. Conversely, M4344 determined an opposite effect compared to selumetinib, decreasing G1 and increasing S phases. Representative curves of cell cycle analysis were reported in Supplementary Figure S2. We also investigated whether cell cycle was modulated by an effect on checkpoint-mediated cell cycle and DNA damage pathways by western blot. Interestingly, TKI treatment caused a strong upregulation of H2A.X and its phosphorylated form in all cell lines except for PC9/OR whereas M4344 alone or in combination strongly increased phospho- and total H2A.X in all the selected cell lines thus confirming that replication stress is occurring as indirect mechanism of inhibition of cell proliferation (Figure 3B). Cell cycle checkpoints cyclin D1 and Chk1 are also modulated in response to treatments and in particular p-Chk1 is reduced in response to DCA and/or M4344 in H1975, PC9/OR and A549 cells whereas PC9 the phosphorylation of cyclin D1 is highly reduced after combination of NOA inhibitors with TKI. In addition, p-cyclin D1 levels were also affected after treatments with TKIs plus M4344 conditions in H1975 and A549 cells. Overall, these results indicate that combination of TKIs with NOA targets is able to differentially affect cell cycle in NSCLC cells.
3.3. Cell Death Induction in Response to Single and Combined ATR and PDH Co-Targeting
Once established that these treatments (single or combined) differently affect cell cycle depending on cell line type, we aimed to investigate the mechanisms regulating cell death induction. Firstly, we exploited MMP modulation to evaluate treatment effects on cell death by TMRE staining. MMP is a reliable indicator of mitochondrial health and its reduction is correlated to apoptosis induction. Representative images taken with a high resolution fluorescence microscope are reported in Figure 4A. As shown by quantitative analysis in Figure 4B, TKIs significantly reduced fluorescence intensity in PC9 (61%), H1975 (48%) and A549 (70%) cells, indicating MMP decrease. M4344 alone caused a significant decrease of fluorescence only in A549 cells (67%) and a trend in PC9/OR (67%). Combined treatment of M4344 with TKIs increase MMP reduction in H1975 cells (36%) compared to TKI alone suggesting that in a resistant cell line model a TKI-combined treatment is helpful to improve cell death. Otherwise, in a sensitive cell line model, as PC9, TKI alone is already enough to obtain the maximum effect even if TKI-combination gave the same MMP decrease by using a half dose, thus indicating that M4344 contributes to the final effect. Combined NOA treatment was less efficient in PC9 (86%) than in H1975 (47%), PC9/OR (62%) and A549 (65%) cells. These findings clearly suggest that cell lines differently respond according to their different status. In particular, the combination of TKIs + M4344 is most effective in reducing MMP in PC9 and H1975 EGFR-addicted NSCLC cells. On the other hand, the combination of M4344 + DCA is most effective in affecting MMP in PC9/OR cells and A549.
In parallel, we performed Annexin V/PI apoptosis staining by flow cytometry (Figure 5A). After 48 h of treatment, we found the highest apoptotic effect in PC9 cells after treatment with osimertinib (48.8% early and 31.2 % late apoptosis) whereas the other treatments caused an early apoptosis of 28.3% (DCA), 22.8% (M4344), 37.3% (osimertinib + M4344) and 22.9% (DCA + M4344) and late apoptosis of 9.4% (DCA), 4.8% (M4344), 4.2% (osimertinib + M4344), 12.5% (DCA + M4344). H1975 cells showed a strong induction of early apoptosis after treatment with osimertinib (41.3%) and M4344 (43.6%) whereas DCA induced only 21% of early apoptosis. Similar results were obtained after combined treatments. As expected, apoptosis was not affected by osimertinib and DCA treatment in PC9/OR cells whereas, interestingly, M4344 caused 21.3% of early and 41.7% of late apoptosis. Despite the inefficiency of osimertinib and DCA alone, both combined treatments caused a similar induction of early (~13%) and late (~34%) apoptosis in these cells. Conversely, selumetinib treatment induced 63.8% of early and 21.8% of late apoptosis whereas DCA and M4344 approximately 40% of early and 30% of late apoptosis in A549 cells. Unexpectedly, both combined treatments shifted the apoptotic balance from the early to the late apoptosis. In particular, the early apoptosis percentage is around 30% instead the late apoptosis percentage is 55.9% after treatment with selumetinib plus M4344 and 40.5% after treatment with DCA plus M4344. These results confirmed the vitality assay findings showing that the best response is dependent from the biological status of selected cell lines. Specifically, cell lines that are more sensitive to TKI (like PC9 and H1975) show early and late apoptosis under single and combination treatments, while cell lines that are less sensitive to TKI (like PC9/OR and A549) show a stronger activation of late apoptosis under combination. In addition, we evaluated the expression levels of two proteins of the Bcl2 family (Figure 5B). Pro-apoptotic BID protein was strongly increased with NOA target alone or in combination in PC9 and A549. Importantly, treatment with TKI alone did not affect BID upregulation. Anti-apoptotic Bcl2 protein was highly reduced in DCA, M4344 and osimertinib plus M4344 in H1975 cells. PC9/OR showed only a slight decrease of this protein after treatment with M4344. A strong reduction of Bcl2 was observed in selumetinib and M4344 conditions in A549 cells.
Taken together, these data clearly indicate that co-targeting of PDKs and ATR is able to increase the pro-apoptotic effect of single agents in EGFR/KRAS dependent models; specifically, selected cell lines showed a different response in terms of cell death depending on their different biological properties and phenotypes.
3.4. ATR and PDH Co-Targeting Effect on Migration Ability and EMT Features
We previously demonstrated that, even if TKI treatments increase cell death and decrease proliferation, a concomitant activation of EMT with increased cell migration ability occurs [20]. The reason for this phenomenon is the heterogeneity of tumors due to the presence of different cell subpopulations. In this context, we exploited combined treatments on cell migration through wound healing assay over-time (T0-T48). Figure 6 showed the quantitative percentage of gaps remaining after treatments. In particular, osimertinib alone or in combination with M4344 left a gap of 89% and 92% after 48 h in PC9 cells compared to untreated (38%) and DCA-treated (38%) cells. M4344 alone or in combination with DCA causes a mid gap remaining of 77% and 75%. Interestingly, the significant difference between the two combination approaches indicated that OA is better than NOA in a pure oncogene-addicted model to avoid cell spreading. In H1975 cells, the largest gap was observed with osimertinib (68%) and DCA plus M4344 (69%) whereas osimertinib plus M4344 treatment left a 56% gap after 48 h. In this acquired-resistant model it seems to be important to target multiple concomitant pathways to reduce cell migration using a NOA therapeutic approach. As expected, PC9/OR single treatments did not affect cell migration ability compared to control. Otherwise, osimertinib or DCA plus M4344 kept the gap open at 80% and 69%, respectively. Selumetinib, M4344 and both combined treatments left a gap of approximately 69% after 48 h. Representative images of initial and final time points of all cell lines and treatments visually confirmed quantitative analysis and are reported in Supplementary Figure S3. These findings confirmed that the combination reduced cell migration ability compared to single treatments.
In parallel, we evaluated the expression of two markers of epithelial and mesenchymal phenotype by immunofluorescence (IF) (Figure 7 and Supplementary Figure S4). In PC9, H1975 and PC9/OR both e-cadherin and vimentin are expressed in basal conditions while vimentin is not detectable in A549 cells probably due to their more epithelial phenotype. Osimertinib treatment significantly reduced vimentin expression in PC9 e H1975 cells (0.74 and 0.58 fold, respectively) along with M4344 (0.8 and 0.60 fold, respectively) while DCA (1.12 and 0.72 fold, respectively) caused an opposite effect of this protein compared to CTRL cells. Similarly to osimertinib, a decrease of vimentin was observed in both combination treatments in PC9 and H1975 cells (approximately 0.7 and 0.6 fold, respectively). Conversely, PC9/OR cells showed a higher mesenchymal phenotype due to the strong red staining compared to the other cell lines. In these cells, M4344 alone and even more combined conditions, where the inhibitors are at the half of the doses, caused a strong decrease of vimentin (approximately 0.6 fold) compared to CTRL, osimertinib and DCA conditions. A549 cell treatments did not significantly affect e-cadherin and vimentin. Only in H1975 cells, we observed a significant decrease of e-cadherin in all treatment conditions compared to untreated cells (approximately 0.76 fold).
4. Discussion
The present study has been developed with the aim to explore alternative therapeutic strategies for EGFR- and K-Ras/MEK/MAPK-driven NSCLC tumors. Currently, in clinical practice, the EGFR-TKI osimertinib is used as standard first line treatment for EGFR-mutant NSCLC and, recently, the KRAS-G12C inhibitor sotorasib has been approved worldwide as second-line treatment for KRAS-G12C mutant NSCLC [21,22]. On one side, EGFR targeting can be considered as the highest example of oncogene addiction in NSCLC; currently, it is clear that the majority of EGFR activating mutations can be efficiently treated with the third-generation EGFR-TKI osimertinib [23] which, however, develops as resistance mechanisms MET activation, EMT features and alterations in cell-cycle and DDR related proteins [24]. Recently, a novel strategy using combination of amivantamab (EGFR/MET antibody) and lazertinib (another third-generation EGFR-TKI) [25] is paving the way to clinical approval for EGFR mutant NSCLC, thus highlighting the need to explore NOA targets to prevent resistance to RTK-mediated inhibition. On the other side, the role of KRAS as an oncogene is different and the role of various types of KRAS mutations is still unknown in terms of response to non selective KRAS inhibitors [26]. In this respect, while various KRAS inhibitors are still under clinical evaluation, showing heterogeneous response in patients maybe due to concurrent co-mutations, novel data on KRAS resistance mechanisms are emerging [27,28]. Thus, although EGFR and KRAS mutant NSCLC represent in clinical scenario two different subtypes, EGFR and RAS pathways are biologically connected: co-targeting of EGFR receptor and downstream mediators belonging to RAS/MEK signaling has shown promising efficacy in pre-clinical and clinical studies in EGFR mutant tumors [10,29] and resistance mechanisms to EGFR/KRAS targeting may overlap.
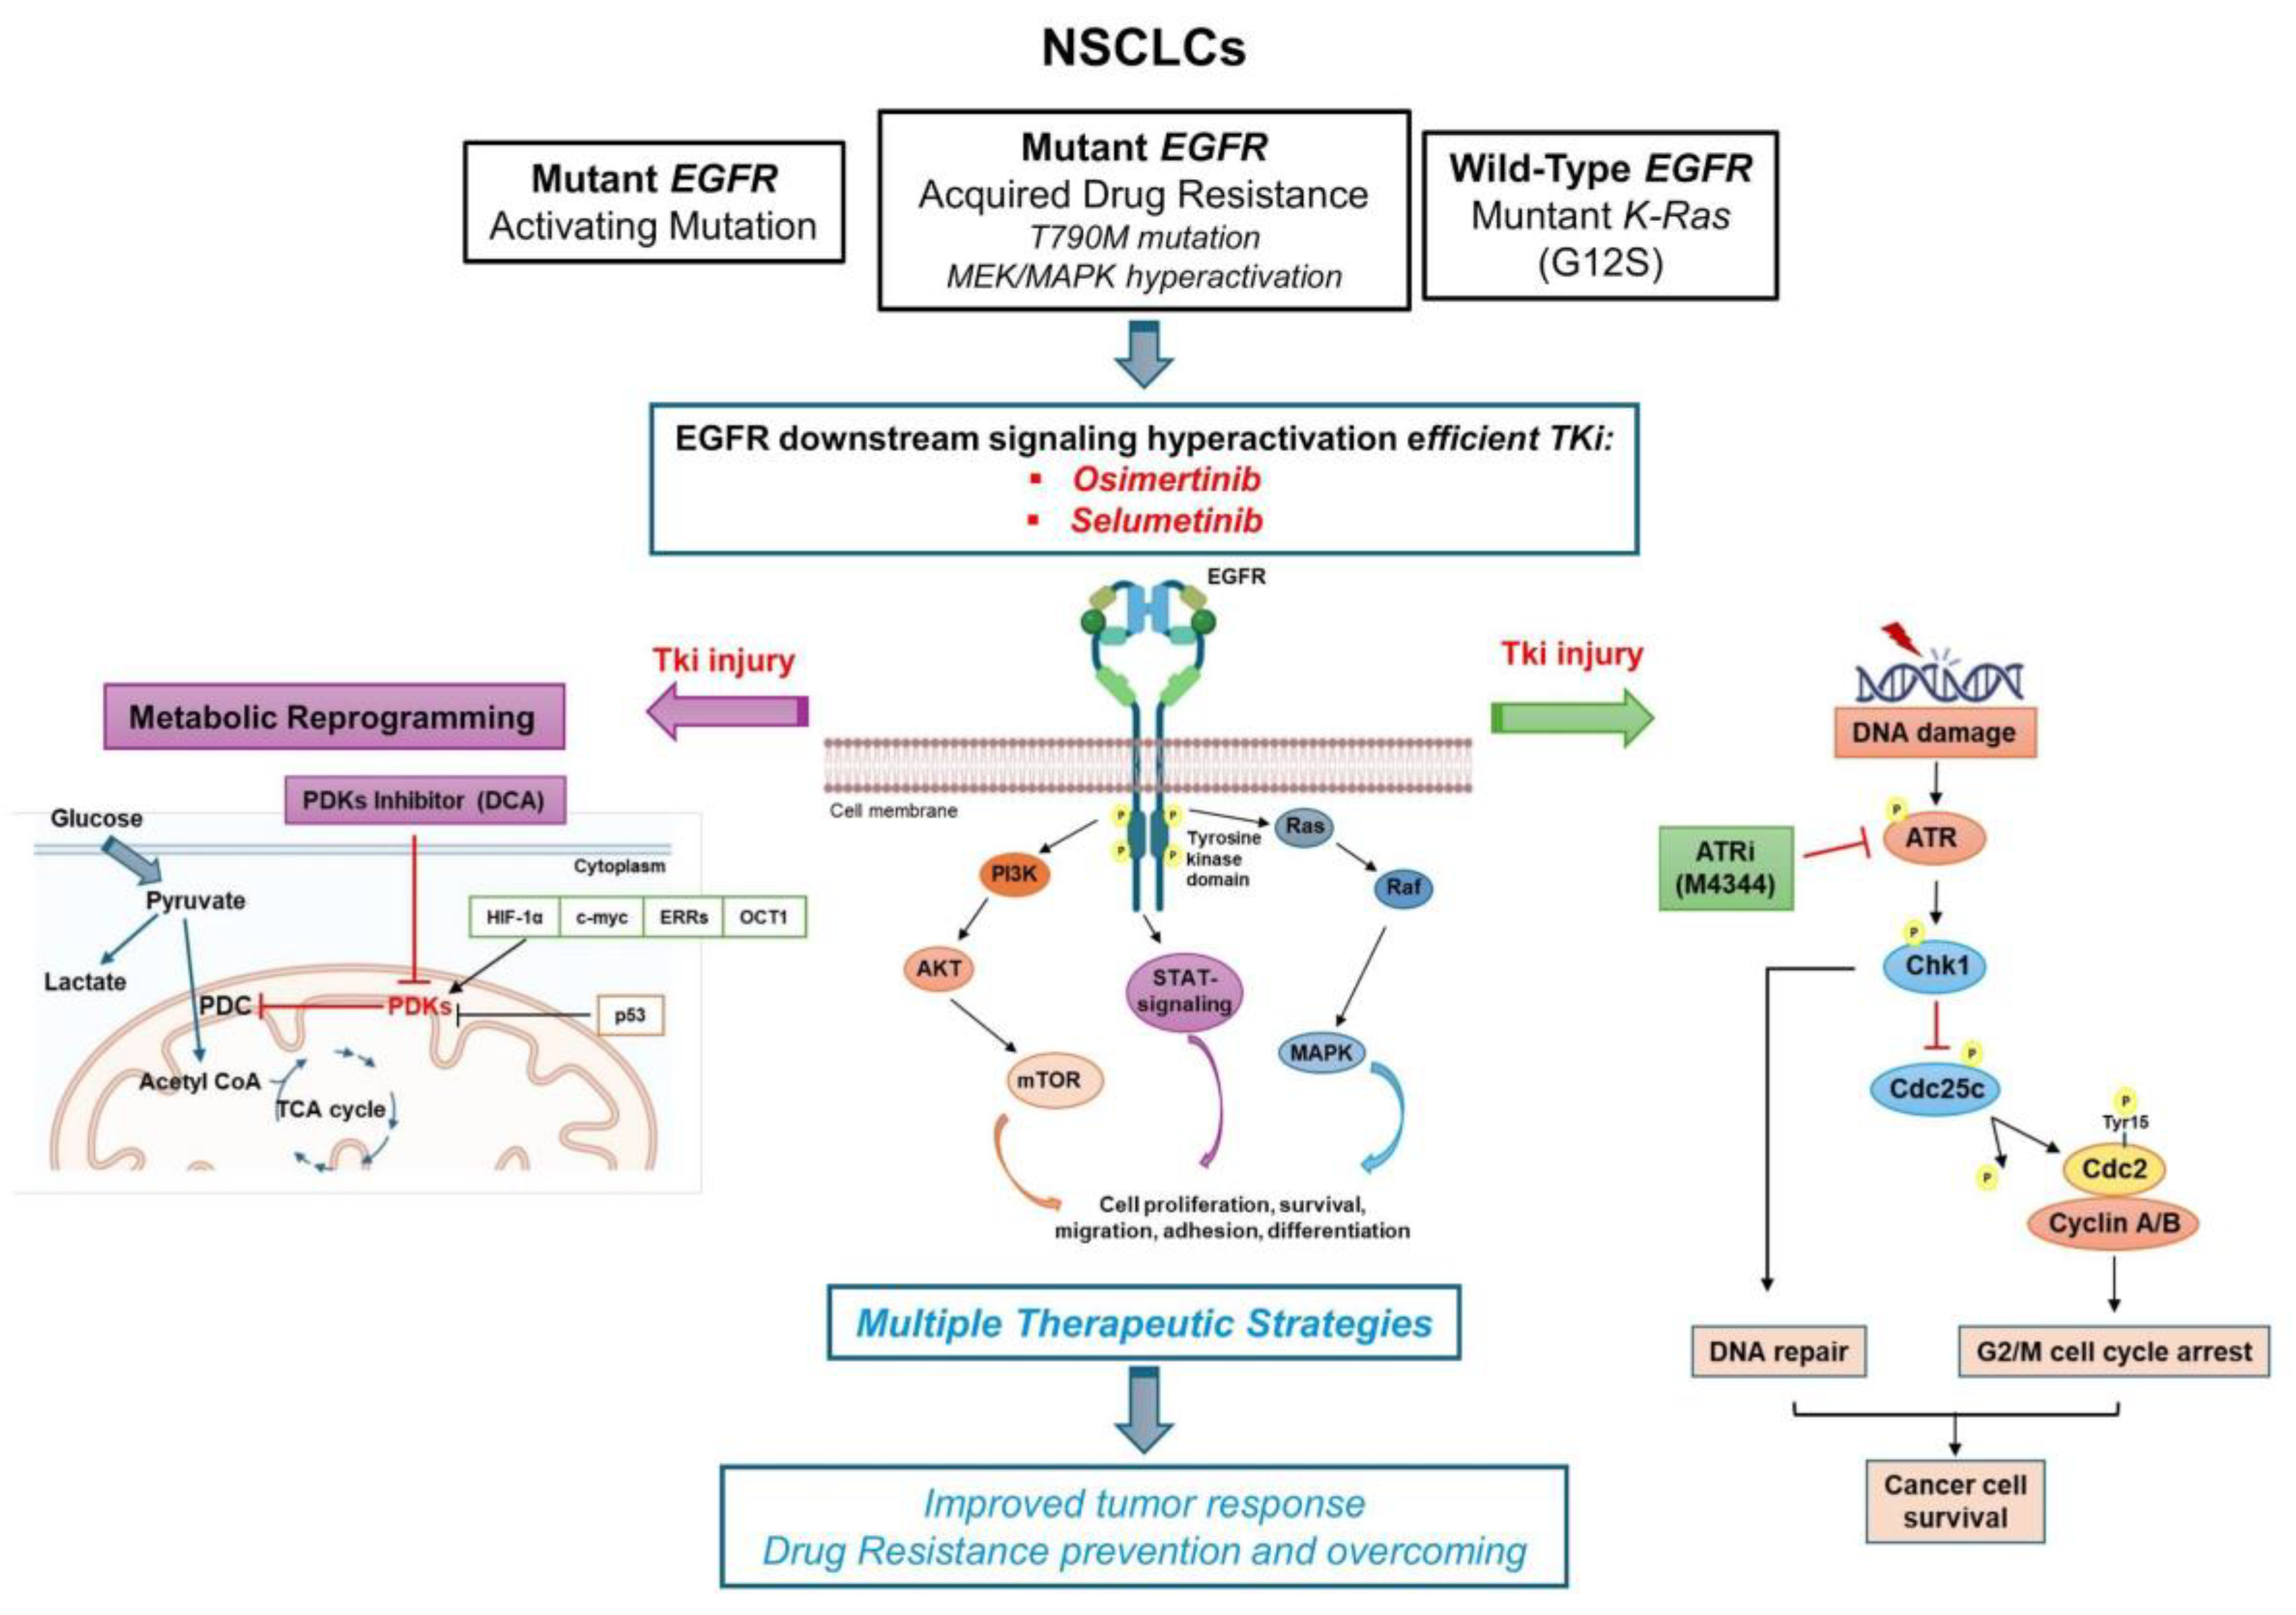
In this context, we selected cell models of EGFR and KRAS mutant NSCLC to study combinations of NOA targets as an alternative strategy to overcome and prevent TKI-resistance, exploring the differences in various models (e.g. EGFR-TKI sensitive versus EGFR-resistant model) as summarized in Figure 8. The opportunity to target multiple parallel pathways improves tumor response, not only in oncogene-driven cancer cells but especially in TKI-resistant cells and for those tumors where the oncogene is undruggable or even absent.
Specifically, based on the well known effect of the selective drug pressure of efficient TKI on favoring the occurrence of resistance due to the activation of several independent processes, we showed that both EGFR-inhibitor osimertinib and MEK-inhibitor selumetinib induced a concurrent activation of DNA damage pathways as demonstrated by p-ATR/ATR and p-H2AX/H2AX upregulation and a more oxidative metabolic phenotype. We proposed that simultaneous activation of intracellular pathways affecting cell death and proliferation programs as well as energetic balance may induce the selection of resistant clones with completely different biological properties than original tumor populations. Such clones, as reported by our previous studies [11], show a more aggressive phenotype as demonstrated by the occurrence of EMT, integrin β1 downstream signaling activation and resistance to cell death mediated by impaired DDR pathways upregulation. DDR signaling includes a variety of pathways that may be altered dynamically under selective drug pressure and this is a hot topic of actual research in various types of lung cancers [30,31,32]. In TKI’s resistant clones, an additional and relevant activated property is their altered metabolic program, that can be efficiently targeted with PDK inhibitors that are able to reverse the Warburg effect in oncogene driven cells and increase the occurrence of citric acid cycle to produce energy [15,16].
Due to these evidences, we designed innovative combinations with ATR and PDK inhibitors (M4344 and DCA, respectively) selected among all the known NOA targets [33] based on their common known activity on activating apoptosis in EGFR-resistant models. In particular, it is interesting to note that we found ATR inhibitor alone or in combination with TKI/DCA as the most efficient partner drug in all selected cells, whereas the PDK inhibitor show the highest effect in PC9/OR and A549, that show RAS/MEK/MAPK signaling upregulation. These data align with our previous paper [11] showing that MEK inhibition with selumetinib in PC9/OR is not sufficient to overcome osimertinib resistance and that addition of DDR inhibitors (AURK or ATR inhibitor) is more effective. Interestingly, Tanaka et al. demonstrated that ATR/AURKB targeting has pro-apoptotic effects in these models [14]. We supposed that the apoptotic response in each analyzed cell line is strongly dependent on the mutation types present in the EGFR kinase domain and KRAS as well as on the mechanism of acquired resistance to EGFR TKIs. In particular, it is interesting to note that cell lines A549 and PC9/OR cells showed higher percentage of early apoptotic cells upon combined treatments than PC9, H1975 cells. Probably, it could be explained considering that the hyperactivation of the RAS/MEK/MAPK signaling in such cells caused the development of cell populations that under drug pressure become more resistant to cell death. However, additional studies are needed to better understand the biochemical mechanisms of each cell line enrolled in the studies and responsible for the activation of different cell death programs upon drug injury.
In the present manuscript, we also demonstrate that co-targeting of NOA, without keeping the TKI, is able to affect the main properties of TKI resistance, inducing reduction of cell viability and migration ability, cell cycle arrest and EMT inhibition in both EGFR- and KRAS- mutant NSCLC models. In this respect, we are aware of the limit of the present study in the investigation of DDR pathways, since we focused on ATR signaling targeting. However, ATR inhibitors are advancing fast in clinical development [34] and there is a strong biological rationale supporting ATR from previous literature showing that ATR inhibition modulates apoptosis in EGFR resistant models and affects KRAS driven replication stress [35]. Future studies will clarify the appropriate single and combined regimens in animal models to confirm our in vitro results, thus identifying possible potential biomarkers to screen in NSCLC patients.
5. Conclusions
In conclusion, the findings of the present study support combinations of DDR, like ATR, with PDKs as ideal novel targets for TKI resistant cells. Future studies could better explore biomarkers for using alternative DDR, such as ATM or AURK or DNA-PK, in different models of NSCLC, exploring the evolution of co-mutations in resistant clones. Finally, we suggest that the design of future studies using novel combinations of NOA targets could optimize the sequence and personalization of treatments for EGFR- and KRAS- mutant NSCLC patients.
Supplementary Materials
The following supporting information can be downloaded at the website of this paper posted on Preprints.org. Supplementary Figure S1. MTT assay of PC9, H1975, PC9/OR and A549 NSCLC cells exposed to TKI (1 μM osimertinib for PC9, H1975 and PC9/OR; 5 μM selumetinib for A549), DCA 500 μM and M4344 2 μM for 96 h alone or in combination with half the dose (TKI plus M4344 or DCA plus M4344). Data are expressed as mean ± SD. Statistical significance *p < 0.05, **p < 0.01 and ***p < 0.001 versus CTRL; #p< 0.05, ##p < 0.01 versus TKIs; $$p < 0.01 versus DCA. At least three independent experiments were performed. Supplementary Figure S2: Representative curves of of PC9, H1975, PC9/OR and A549 cell cycle after 48 h treatments (osimertinib 1 μM, selumetinib 5 μM, DCA 500 μM or M4344 2 μM alone or in combination at half the dose). Supplementary Figure S3: Representative live images of PC9, H1975, PC9/OR and A549 cells after scratch and treatments (osimertinib 1 μM, selumetinib 5 μM, DCA 500 μM or M4344 2 μM alone or in combination at half the dose) with a high-resolution microscope. Pictures (4X magnification) are captured fixing XY coordinates in order to measure the same gap point over time (T0-T48). Supplementary Figure S4: Quantitative IF analysis of e-cadherin and vimentin in PC9, H1975, PC9/OR and A549 cells after 48 h treatments (osimertinib 1 μM, selumetinib 5 μM, DCA 500 μM or M4344 2 μM alone or in combination at half the dose). Quantitative analysis of fluorescent intensity was expressed as fold change versus CTRL cells and expressed as mean ± SE. Statistical significance *p < 0.05, **p < 0.01, ***p < 0.001 and ****p < 0.0001 versus CTRL; ##p < 0.01, ####p < 0.0001 versus TKIs, §p < 0.05, §§p < 0.01, §§§p < 0.001, §§§§p < 0.0001 versus DCA. At least three independent experiments were performed.
Author Contributions
Conceptualization: C.M.D.C and V.D.R. methodology: L.A., D.O., C.D.R., A.A., S.C., C.C.T., R.B., A.N., V.D.V., R.P. and V.D.R.; validation: L.A., D.O., C.D.R., A.A., S.C., C.C.T., V.D.V., C.T., F.I. and V.D.R.; formal analysis: L.A., D.O., C.D.R., A.A., S.C., C.C.T., R.B., V.D.V., V.T., F.I., C.M.D.C. and V.D.R.; writing—original draft preparation: L.A., D.O., C.D.R., F.I., C.M.D.C. and V.D.R.; writing—review and editing: L.A., D.O., C.D.R., R.P., F.M., F.P., V.T., F.I., C.M.D.C. and V.D.R.; supervision: C.M.D.C. and V.D.R.; funding acquisition: C.M.D.C. All authors have read and agreed to the published version of the manuscript.
Funding
This work was supported by Fondazione AIRC (MFAG Project Number: 26237 to C.M.D.C.).
Data Availability Statement
The majority of data related to presented results are included in the materials and methods section of the paper.
Acknowledgments
This work was supported by AIRC MFAG (Project Number: 26237).
Conflicts of Interest
Dr. Morgillo F. Receipt of honoraria or consultation fees for speaker, consultancy, or advisory roles: Roche, Servier, Incyte, ESMO, and MSD. Dr. Papaccio F. reported private institutional research funding from Merck, travel support from Diatech Pharmacogenetics, ESMO Translational Research Fellowship sponsored by Amgen from 2018 to 2020. The remaining authors have no conflicts of interest to declare. Dr. Della Corte C.M.: reported receiving personal fees and travel grants from Roche, MSD, Regeneron, Amgen, Lilly, Novartis, Pharmamar, Merck, and AstraZeneca outside the submitted work. The remaining authors have no conflicts of interest to declare.
References
- Hanahan, D.; Weinberg, R.A. Hallmarks of cancer: The next generation. Cell 2011, 144, 646–674. [Google Scholar] [CrossRef] [PubMed]
- Hanahan, D.; Weinberg, R.A. The hallmarks of cancer. Cell 2000, 100, 57–70. [Google Scholar] [CrossRef] [PubMed]
- Weinstein, I.B.; Joe, A. Oncogene addiction. Cancer Res 2008, 68, 3077–3080. [Google Scholar] [CrossRef]
- Bedard, P.L.; Hyman, D.M.; Davids, M.S.; Siu, L.L. Small molecules, big impact: 20 years of targeted therapy in oncology. Lancet 2020, 395, 1078–1088. [Google Scholar] [CrossRef] [PubMed]
- Sabnis, A.J.; Bivona, T.G. Principles of Resistance to Targeted Cancer Therapy: Lessons from Basic and Translational Cancer Biology. Trends Mol Med 2019, 25, 185–197. [Google Scholar] [CrossRef] [PubMed]
- Troiani, T.; Napolitano, S.; Della Corte, C.M.; Martini, G.; Martinelli, E.; Morgillo, F.; Ciardiello, F. Therapeutic value of EGFR inhibition in CRC and NSCLC: 15 years of clinical evidence. ESMO Open 2016, 1, e000088. [Google Scholar] [CrossRef]
- Morgillo, F.; Della Corte, C.M.; Fasano, M.; Ciardiello, F. Mechanisms of resistance to EGFR-targeted drugs: Lung cancer. ESMO Open 2016, 1, e000060. [Google Scholar] [CrossRef]
- Solimini, N.L.; Luo, J.; Elledge, S.J. Non-oncogene addiction and the stress phenotype of cancer cells. Cell 2007, 130, 986–988. [Google Scholar] [CrossRef]
- Della Corte, C.M.; Bellevicine, C.; Vicidomini, G.; Vitagliano, D.; Malapelle, U.; Accardo, M.; Fabozzi, A.; Fiorelli, A.; Fasano, M.; Papaccio, F.; et al. SMO Gene Amplification and Activation of the Hedgehog Pathway as Novel Mechanisms of Resistance to Anti-Epidermal Growth Factor Receptor Drugs in Human Lung Cancer. Clin Cancer Res 2015, 21, 4686–4697. [Google Scholar] [CrossRef]
- Della Corte, C.M.; Ciaramella, V.; Cardone, C.; La Monica, S.; Alfieri, R.; Petronini, P.G.; Malapelle, U.; Vigliar, E.; Pepe, F.; Troncone, G.; et al. Antitumor Efficacy of Dual Blockade of EGFR Signaling by Osimertinib in Combination With Selumetinib or Cetuximab in Activated EGFR Human NCLC Tumor Models. J Thorac Oncol 2018, 13, 810–820. [Google Scholar] [CrossRef]
- De Rosa, C.; De Rosa, V.; Tuccillo, C.; Tirino, V.; Amato, L.; Papaccio, F.; Ciardiello, D.; Napolitano, S.; Martini, G.; Ciardiello, F. ITGB1 and DDR activation as novel mediators in acquired resistance to osimertinib and MEK inhibitors in EGFR-mutant NSCLC. Scientific Reports 2024, 14, 500. [Google Scholar] [CrossRef] [PubMed]
- Terlizzi, C.; De Rosa, V.; Iommelli, F.; Pezone, A.; Altobelli, G.; Maddalena, M.; Dimitrov, J.; De Rosa, C.; Della Corte, C.; Avvedimento, V.; et al. ATM inhibition blocks glucose metabolism and amplifies the sensitivity of resistant lung cancer cell lines to oncogene driver inhibitors. Cancer & Metabolism 2023, 11. [Google Scholar] [CrossRef]
- Blaquier, J.B.; Ortiz-Cuaran, S.; Ricciuti, B.; Mezquita, L.; Cardona, A.F.; Recondo, G. Tackling Osimertinib Resistance in EGFR-Mutant Non-Small Cell Lung Cancer. Clin Cancer Res 2023, 29, 3579–3591. [Google Scholar] [CrossRef] [PubMed]
- Tanaka, K.; Yu, H.A.; Yang, S.; Han, S.; Selcuklu, S.D.; Kim, K.; Ramani, S.; Ganesan, Y.T.; Moyer, A.; Sinha, S.; et al. Targeting Aurora B kinase prevents and overcomes resistance to EGFR inhibitors in lung cancer by enhancing BIM- and PUMA-mediated apoptosis. Cancer Cell 2021, 39, 1245–1261.e1246. [Google Scholar] [CrossRef]
- De Rosa, V.; Iommelli, F.; Monti, M.; Fonti, R.; Votta, G.; Stoppelli, M.P.; Del Vecchio, S. Reversal of Warburg Effect and Reactivation of Oxidative Phosphorylation by Differential Inhibition of EGFR Signaling Pathways in Non-Small Cell Lung Cancer. Clin Cancer Res 2015, 21, 5110–5120. [Google Scholar] [CrossRef]
- De Rosa, V.; Iommelli, F.; Terlizzi, C.; Leggiero, E.; Camerlingo, R.; Altobelli, G.G.; Fonti, R.; Pastore, L.; Del Vecchio, S. Non-Canonical Role of PDK1 as a Negative Regulator of Apoptosis through Macromolecular Complexes Assembly at the ER-Mitochondria Interface in Oncogene-Driven NSCLC. Cancers (Basel) 2021, 13. [Google Scholar] [CrossRef]
- Della Corte, C.M.; Malapelle, U.; Vigliar, E.; Pepe, F.; Troncone, G.; Ciaramella, V.; Troiani, T.; Martinelli, E.; Belli, V.; Ciardiello, F.; et al. Efficacy of continuous EGFR-inhibition and role of Hedgehog in EGFR acquired resistance in human lung cancer cells with activating mutation of EGFR. Oncotarget 2017, 8, 23020–23032. [Google Scholar] [CrossRef]
- Hernández Borrero, L.J.; El-Deiry, W.S. Tumor suppressor p53: Biology, signaling pathways, and therapeutic targeting. Biochim Biophys Acta Rev Cancer 2021, 1876, 188556. [Google Scholar] [CrossRef]
- Kang, T.H. DNA Damage, Repair, and Cancer Metabolism. Int J Mol Sci 2023, 24. [Google Scholar] [CrossRef]
- Iommelli, F.; De Rosa, V.; Terlizzi, C.; Fonti, R.; Camerlingo, R.; Stoppelli, M.P.; Stewart, C.A.; Byers, L.A.; Piwnica-Worms, D.; Del Vecchio, S. A Reversible Shift of Driver Dependence from EGFR to Notch1 in Non-Small Cell Lung Cancer as a Cause of Resistance to Tyrosine Kinase Inhibitors. Cancers (Basel) 2021, 13. [Google Scholar] [CrossRef]
- Hendriks, L.E.; Kerr, K.M.; Menis, J.; Mok, T.S.; Nestle, U.; Passaro, A.; Peters, S.; Planchard, D.; Smit, E.F.; Solomon, B.J.; et al. Oncogene-addicted metastatic non-small-cell lung cancer: ESMO Clinical Practice Guideline for diagnosis, treatment and follow-up. Ann Oncol 2023, 34, 339–357. [Google Scholar] [CrossRef] [PubMed]
- de Langen, A.J.; Johnson, M.L.; Mazieres, J.; Dingemans, A.C.; Mountzios, G.; Pless, M.; Wolf, J.; Schuler, M.; Lena, H.; Skoulidis, F.; et al. Sotorasib versus docetaxel for previously treated non-small-cell lung cancer with KRAS(G12C) mutation: A randomised, open-label, phase 3 trial. Lancet 2023, 401, 733–746. [Google Scholar] [CrossRef] [PubMed]
- Eide, I.J.Z.; Stensgaard, S.; Helland, Å.; Ekman, S.; Mellemgaard, A.; Hansen, K.H.; Cicenas, S.; Koivunen, J.; Grønberg, B.H.; Sørensen, B.S.; et al. Osimertinib in non-small cell lung cancer with uncommon EGFR-mutations: A post-hoc subgroup analysis with pooled data from two phase II clinical trials. Transl Lung Cancer Res 2022, 11, 953–963. [Google Scholar] [CrossRef] [PubMed]
- Gomatou, G.; Syrigos, N.; Kotteas, E. Osimertinib Resistance: Molecular Mechanisms and Emerging Treatment Options. Cancers (Basel) 2023, 15. [Google Scholar] [CrossRef]
- Cho, B.C.; Lu, S.; Felip, E.; Spira, A.I.; Girard, N.; Lee, J.S.; Lee, S.H.; Ostapenko, Y.; Danchaivijitr, P.; Liu, B.; et al. Amivantamab plus Lazertinib in Previously Untreated EGFR-Mutated Advanced NSCLC. N Engl J Med 2024. [Google Scholar] [CrossRef]
- O'Sullivan, É.; Keogh, A.; Henderson, B.; Finn, S.P.; Gray, S.G.; Gately, K. Treatment Strategies for KRAS-Mutated Non-Small-Cell Lung Cancer. Cancers (Basel) 2023, 15. [Google Scholar] [CrossRef]
- Canon, J.; Rex, K.; Saiki, A.Y.; Mohr, C.; Cooke, K.; Bagal, D.; Gaida, K.; Holt, T.; Knutson, C.G.; Koppada, N.; et al. The clinical KRAS(G12C) inhibitor AMG 510 drives anti-tumour immunity. Nature 2019, 575, 217–223. [Google Scholar] [CrossRef]
- Nokin, M.J.; Mira, A.; Patrucco, E.; Ricciuti, B.; Cousin, S.; Soubeyran, I.; San José, S.; Peirone, S.; Caizzi, L.; Vietti Michelina, S.; et al. RAS-ON inhibition overcomes clinical resistance to KRAS G12C-OFF covalent blockade. Nat Commun 2024, 15, 7554. [Google Scholar] [CrossRef]
- Yang, J.C.; Ohe, Y.; Chiu, C.H.; Ou, X.; Cantarini, M.; Jänne, P.A.; Hartmaier, R.J.; Ahn, M.J. Osimertinib plus Selumetinib in EGFR-Mutated Non-Small Cell Lung Cancer After Progression on EGFR-TKIs: A Phase Ib, Open-Label, Multicenter Trial (TATTON Part B). Clin Cancer Res 2022, Of1–of10. [Google Scholar] [CrossRef]
- Venugopala, K.N. Targeting the DNA Damage Response Machinery for Lung Cancer Treatment. Pharmaceuticals (Basel) 2022, 15. [Google Scholar] [CrossRef]
- Ramkumar, K.; Stewart, C.A.; Cargill, K.R.; Della Corte, C.M.; Wang, Q.; Shen, L.; Diao, L.; Cardnell, R.J.; Peng, D.H.; Rodriguez, B.L.; et al. AXL Inhibition Induces DNA Damage and Replication Stress in Non-Small Cell Lung Cancer Cells and Promotes Sensitivity to ATR Inhibitors. Mol Cancer Res 2021, 19, 485–497. [Google Scholar] [CrossRef] [PubMed]
- Della Corte, C.M.; Gay, C.M.; Byers, L.A. Beyond chemotherapy: Emerging biomarkers and therapies as small cell lung cancer enters the immune checkpoint era. Cancer 2019, 125, 496–498. [Google Scholar] [CrossRef] [PubMed]
- Chang, H.R.; Jung, E.; Cho, S.; Jeon, Y.J.; Kim, Y. Targeting Non-Oncogene Addiction for Cancer Therapy. Biomolecules 2021, 11. [Google Scholar] [CrossRef] [PubMed]
- Yano, K.; Shiotani, B. Emerging strategies for cancer therapy by ATR inhibitors. Cancer Sci 2023, 114, 2709–2721. [Google Scholar] [CrossRef]
- Igarashi, T.; Mazevet, M.; Yasuhara, T.; Yano, K.; Mochizuki, A.; Nishino, M.; Yoshida, T.; Yoshida, Y.; Takamatsu, N.; Yoshimi, A.; et al. An ATR-PrimPol pathway confers tolerance to oncogenic KRAS-induced and heterochromatin-associated replication stress. Nat Commun 2023, 14, 4991. [Google Scholar] [CrossRef]
Figure 1.
(A) Western blots images of whole cell lysates showed levels of phosphorylated and total forms of EGFR, ERK1/2 and p53 in whole cell lysates selected NSCLC cell lines. (B) Cell viability assay of PC9, H1975, PC9/OR and A549 NSCLC cells exposed to TKI (1 μM osimertinib for PC9, H1975 and PC9/OR; 5 μM selumetinib for A549), DCA 500 μM and M4344 2 μM for 48 h alone or in combination with half the dose (TKI plus DCA/M4344 or DCA plus M4344). Data are expressed as mean ± SE. Statistical significance *p < 0.05, **p < 0.01 and ***p < 0.001 versus CTRL; ##p < 0.01 versus TKIs, $p < 0.05 versus DCA. At least three independent experiments were performed. (C) Western blots images of whole cell lysates showed levels of phosphorylated and total forms of EGFR and ERK1/2 of PC9, H1975, PC9/OR and A549 NSCLC cells exposed to TKI (1 μM osimertinib for PC9, H1975 and PC9/OR; 5 μM selumetinib for A549), DCA 500 μM and M4344 2 μM for 48 h. Tubulin was used to ensure equal loading.
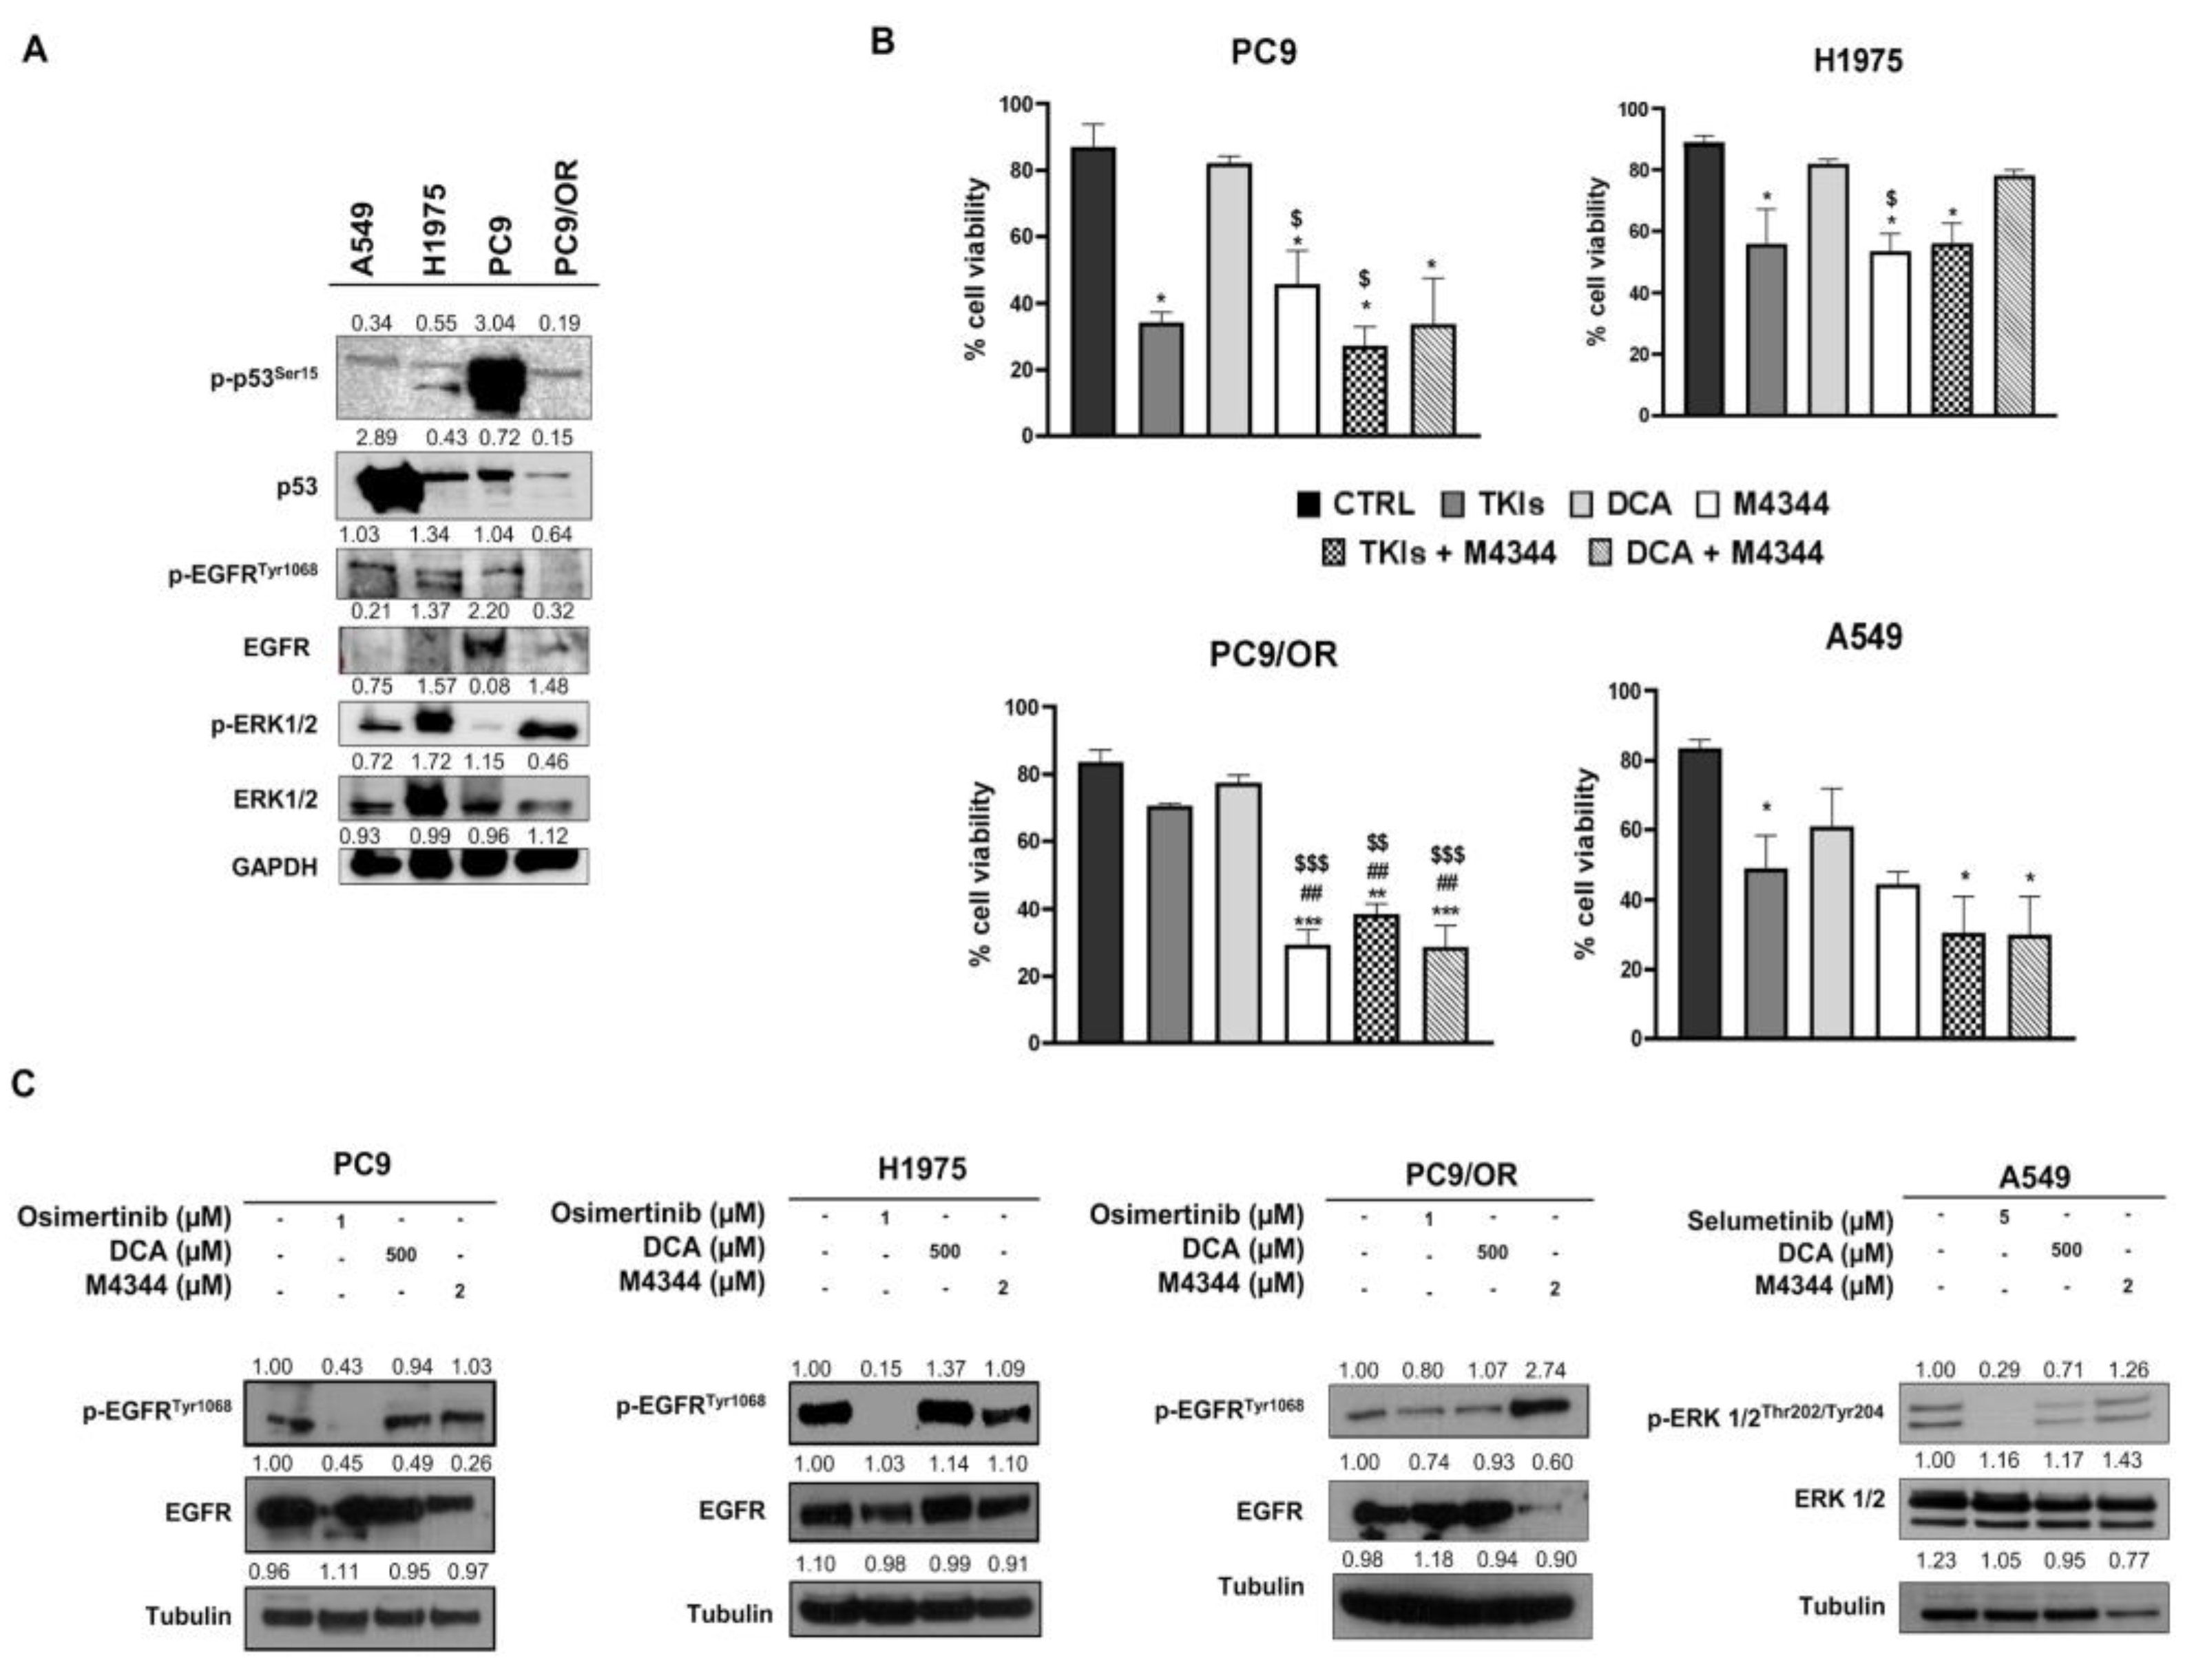
Figure 2.
(A-B) Western blots images showed levels of phosphorylated and total forms of (A) ATR and p53, (B) PDH in the selected NSCLC cell lines treated for 48 h with TKI alone or combined with DCA and/or M4344 (C) Energetic map of PC9, H1975, PC9/OR and A549 NSCLC cells exposed to TKI (1 μM osimertinib for PC9, H1975 and PC9/OR; 5 μM selumetinib for A549), DCA 500 μM and M4344 2 μM for 48 h.
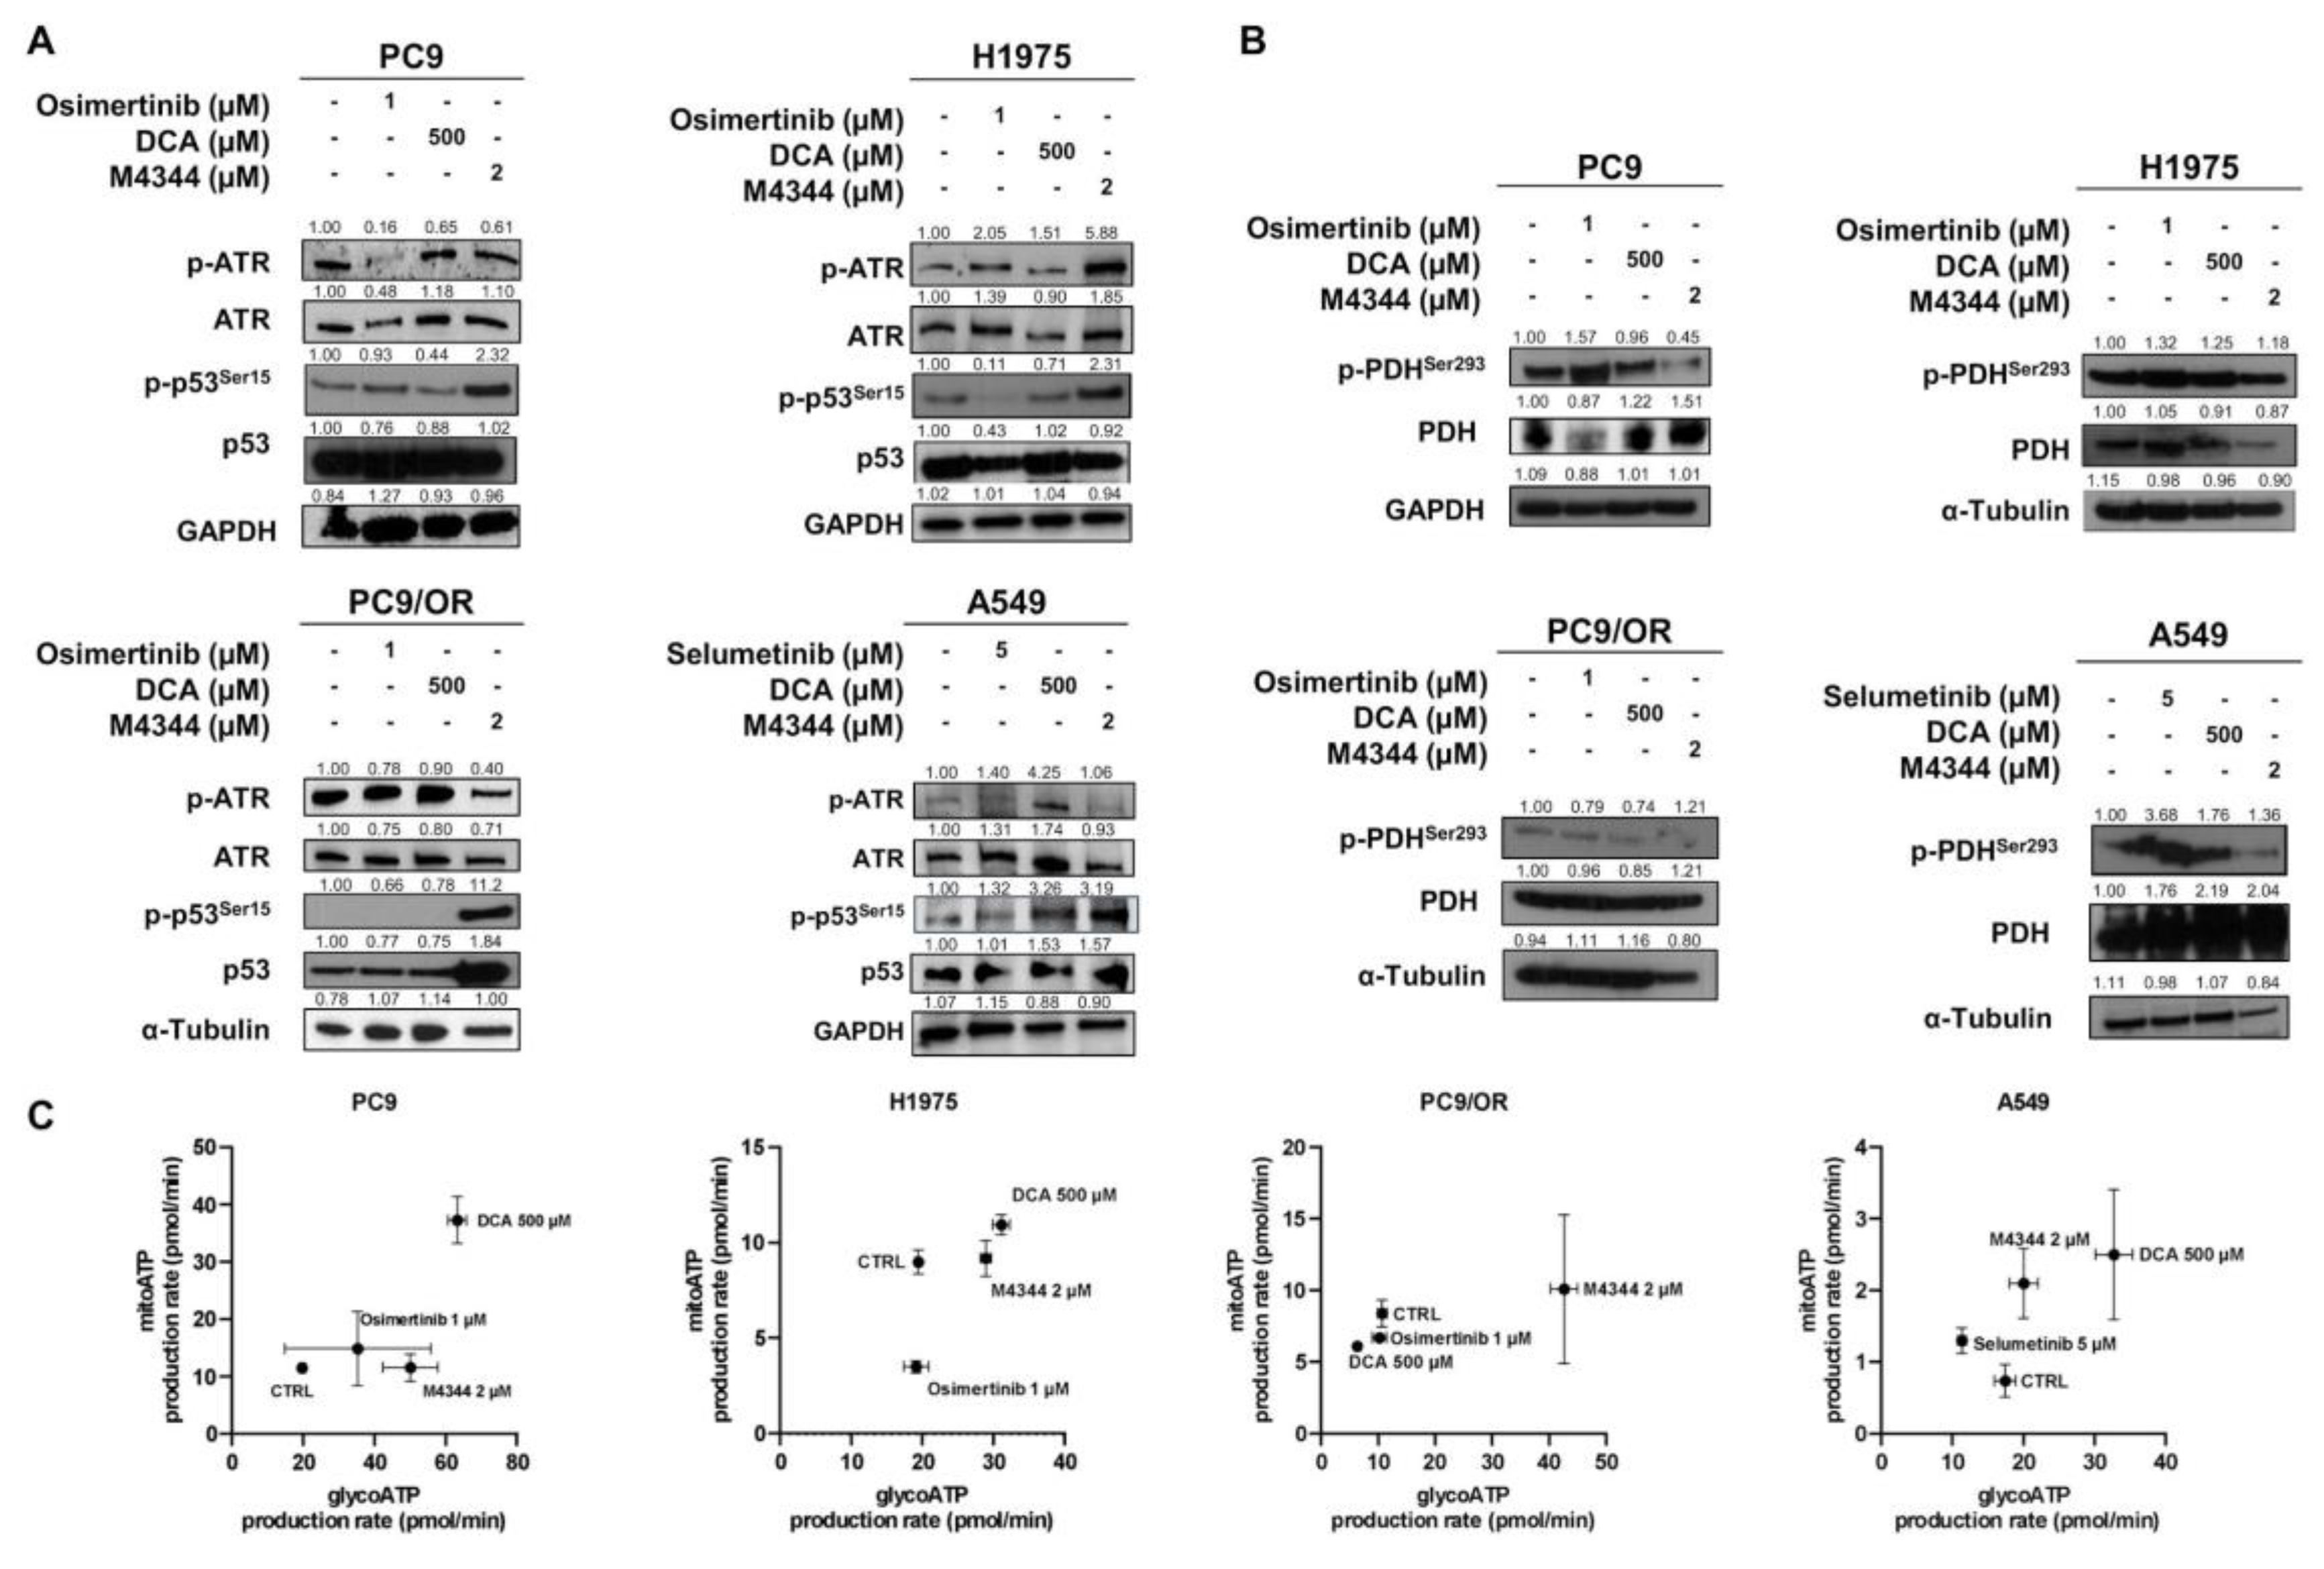
Figure 3.
(A) Cell cycle analysis of PC9, H1975, PC9/OR and A549 NSCLC cells exposed to TKI (1 μM osimertinib for PC9, H1975 and PC9/OR; 5 μM selumetinib for A549), DCA 500 μM and M4344 2 μM alone or in combination at the half the dose (osimertinib/selumetinib plus M4344 or DCA plus M4344) for 48 h. Data are expressed as mean ± SE. Statistical significance *p < 0.05 versus CTRL; #p < 0.05, ##p < 0.01 and ###p < 0.0001 versus TKIs, §p < 0.05 and §§p < 0.01 versus DCA; †p < 0.05 and ††p < 0.01 versus M4344. (B) Western blot images of whole cell lysates showed levels of phosphorylated and total forms of H2AX, Chk1 and cyclin D1 in selected NSCLC cell lines treated for 48 h with TKIs alone or combined with DCA and/or M4344. At least three independent experiments were performed.
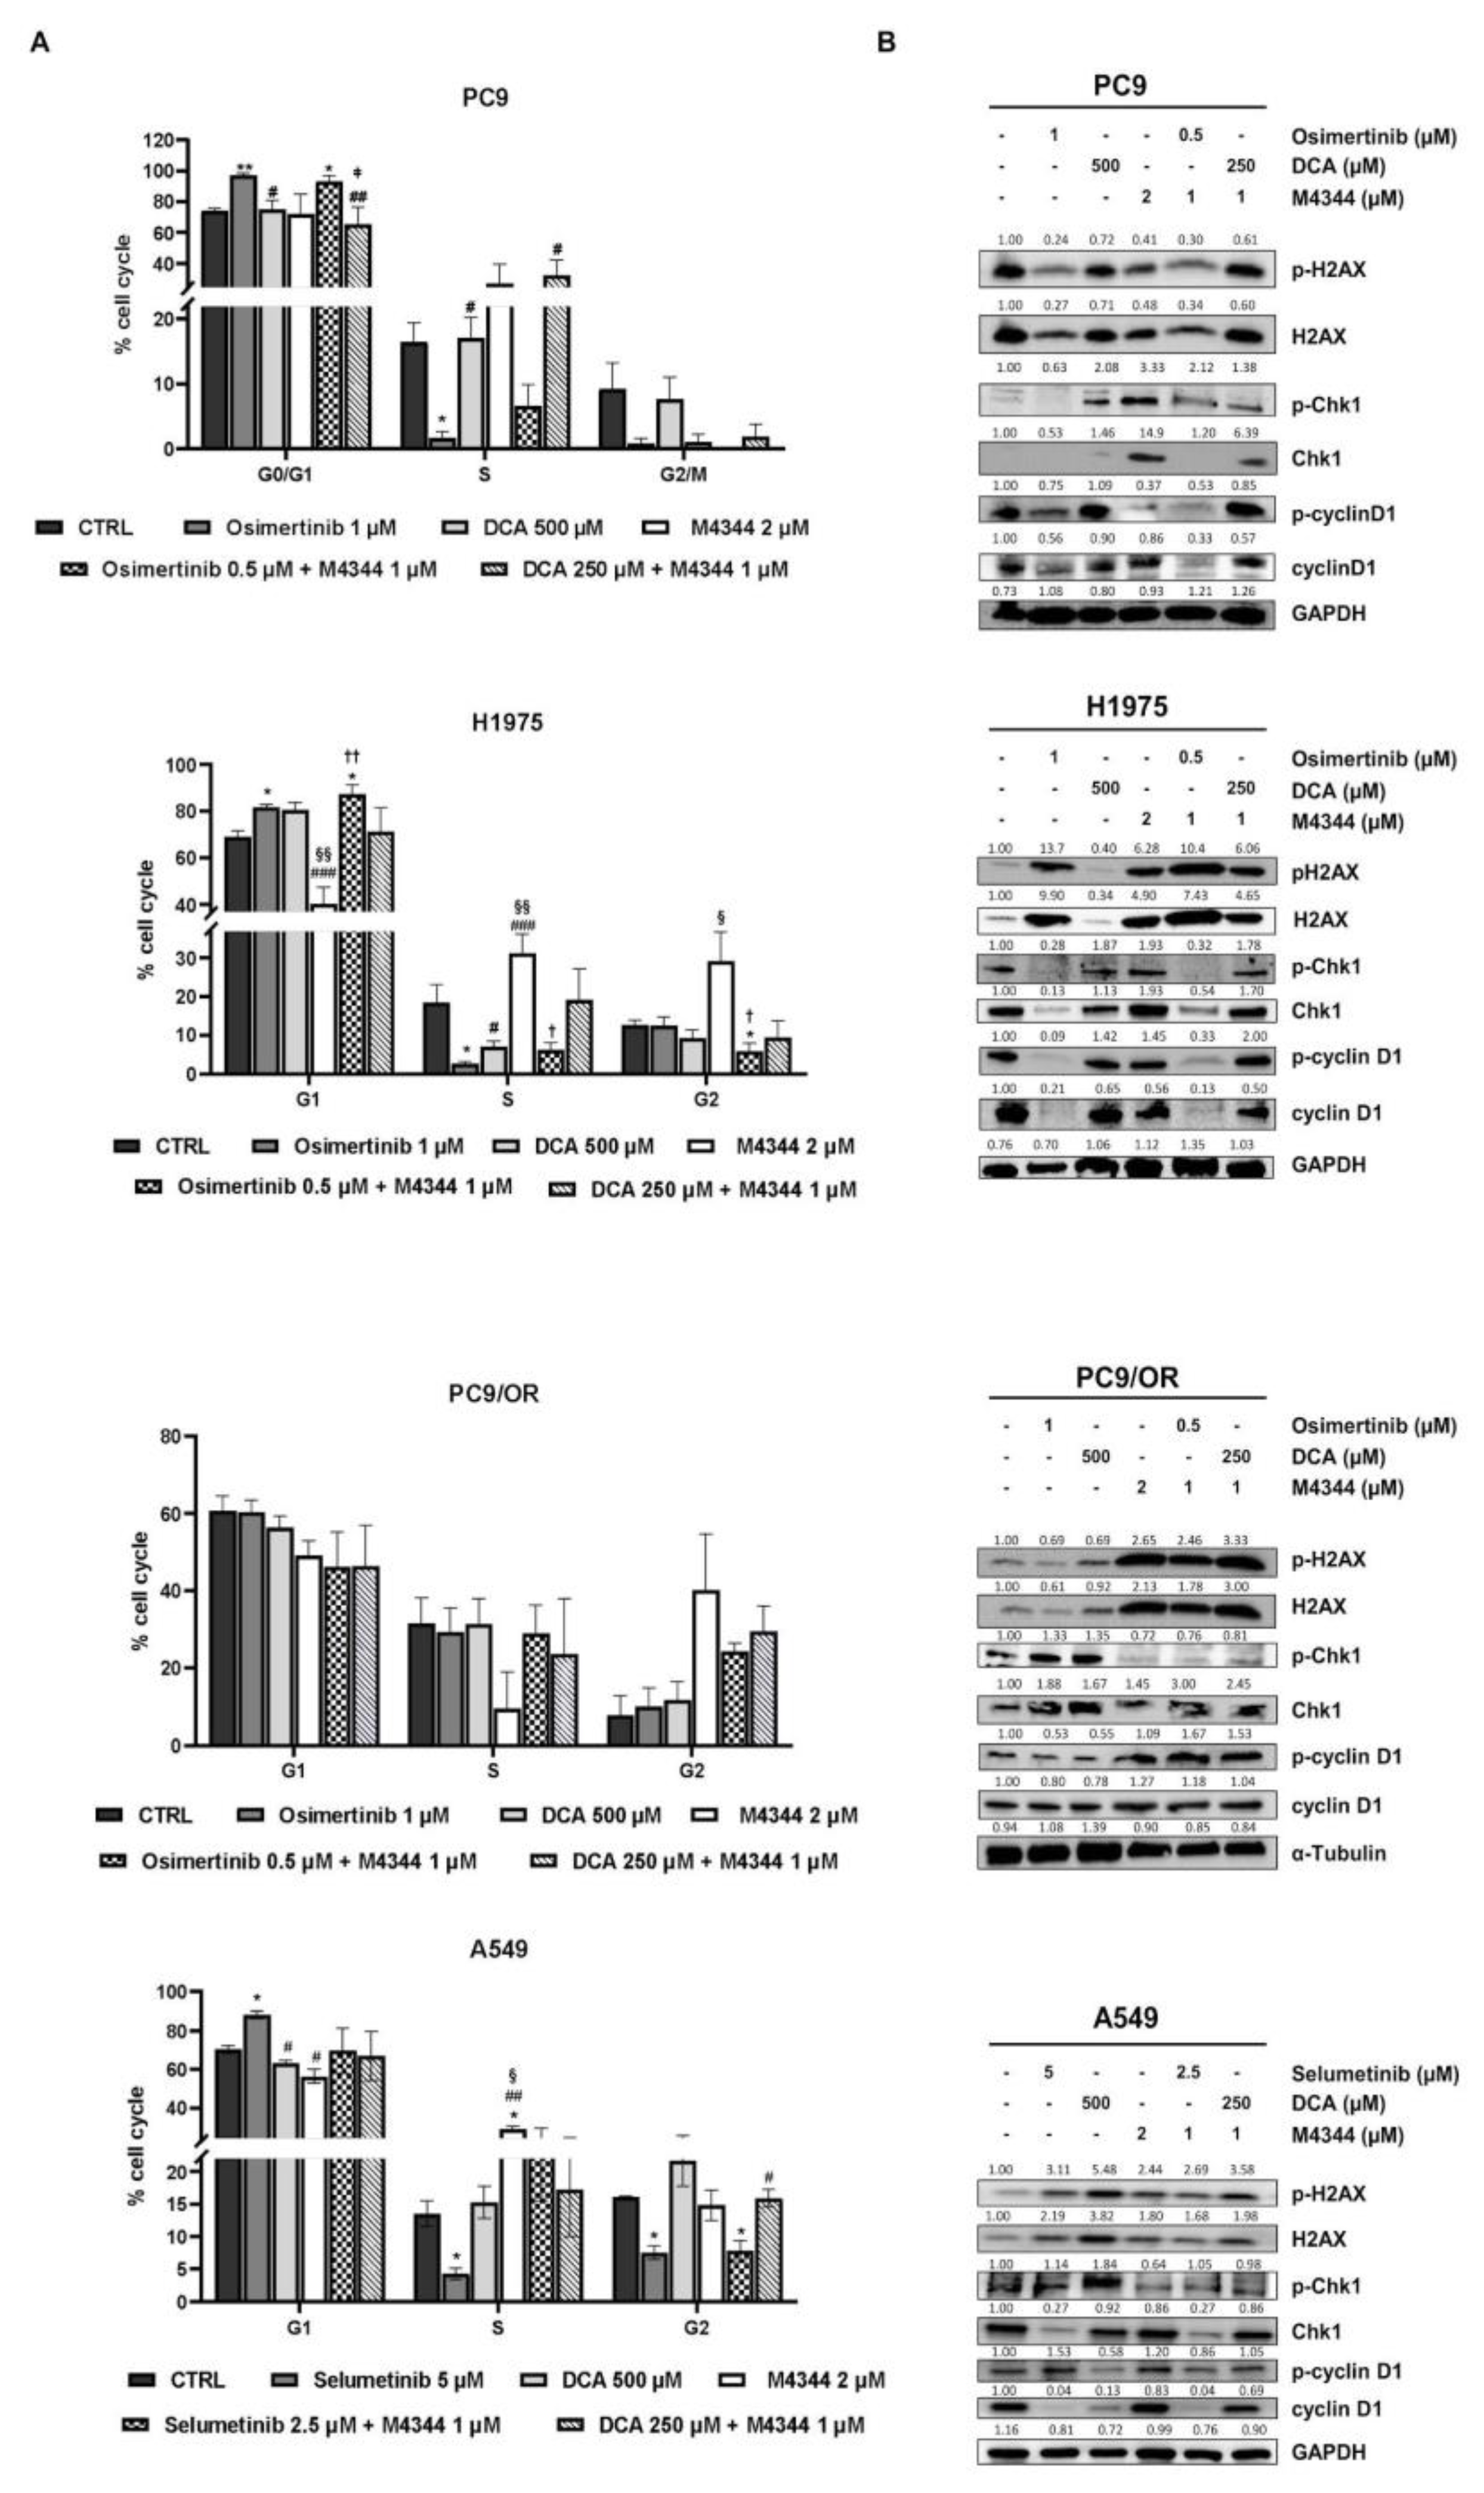
Figure 4.
(A) Live images of PC9, H1975, PC9/OR and A549 cells exposed to osimertinib (1 μM), selumetinib (5 μM), DCA (500 μM) or M4344 (2 μM) alone or in combination (at half the dose) for 48 h, or CCCP (as positive control) and stained with TMRE to visualize MMP with a high-resolution fluorescence microscope (20X magnification). (B) Quantitative analysis of fluorescent intensity was expressed as % relative to CTRL cells and expressed as mean ± SE. Statistical significance *p < 0.05, **p < 0.01, ***p < 0.001 and ****p < 0.0001 versus CTRL; #p < 0.05, ##p < 0.01, ###p < 0.001 versus TKIs, §p < 0.05, §§§p < 0.001, §§§§p < 0.0001 versus DCA; †p < 0.05, †††p < 0.001, ††††p < 0.001 versus M4344; ǂp < 0.05 versus DCA + M4344. At least three independent experiments were performed.
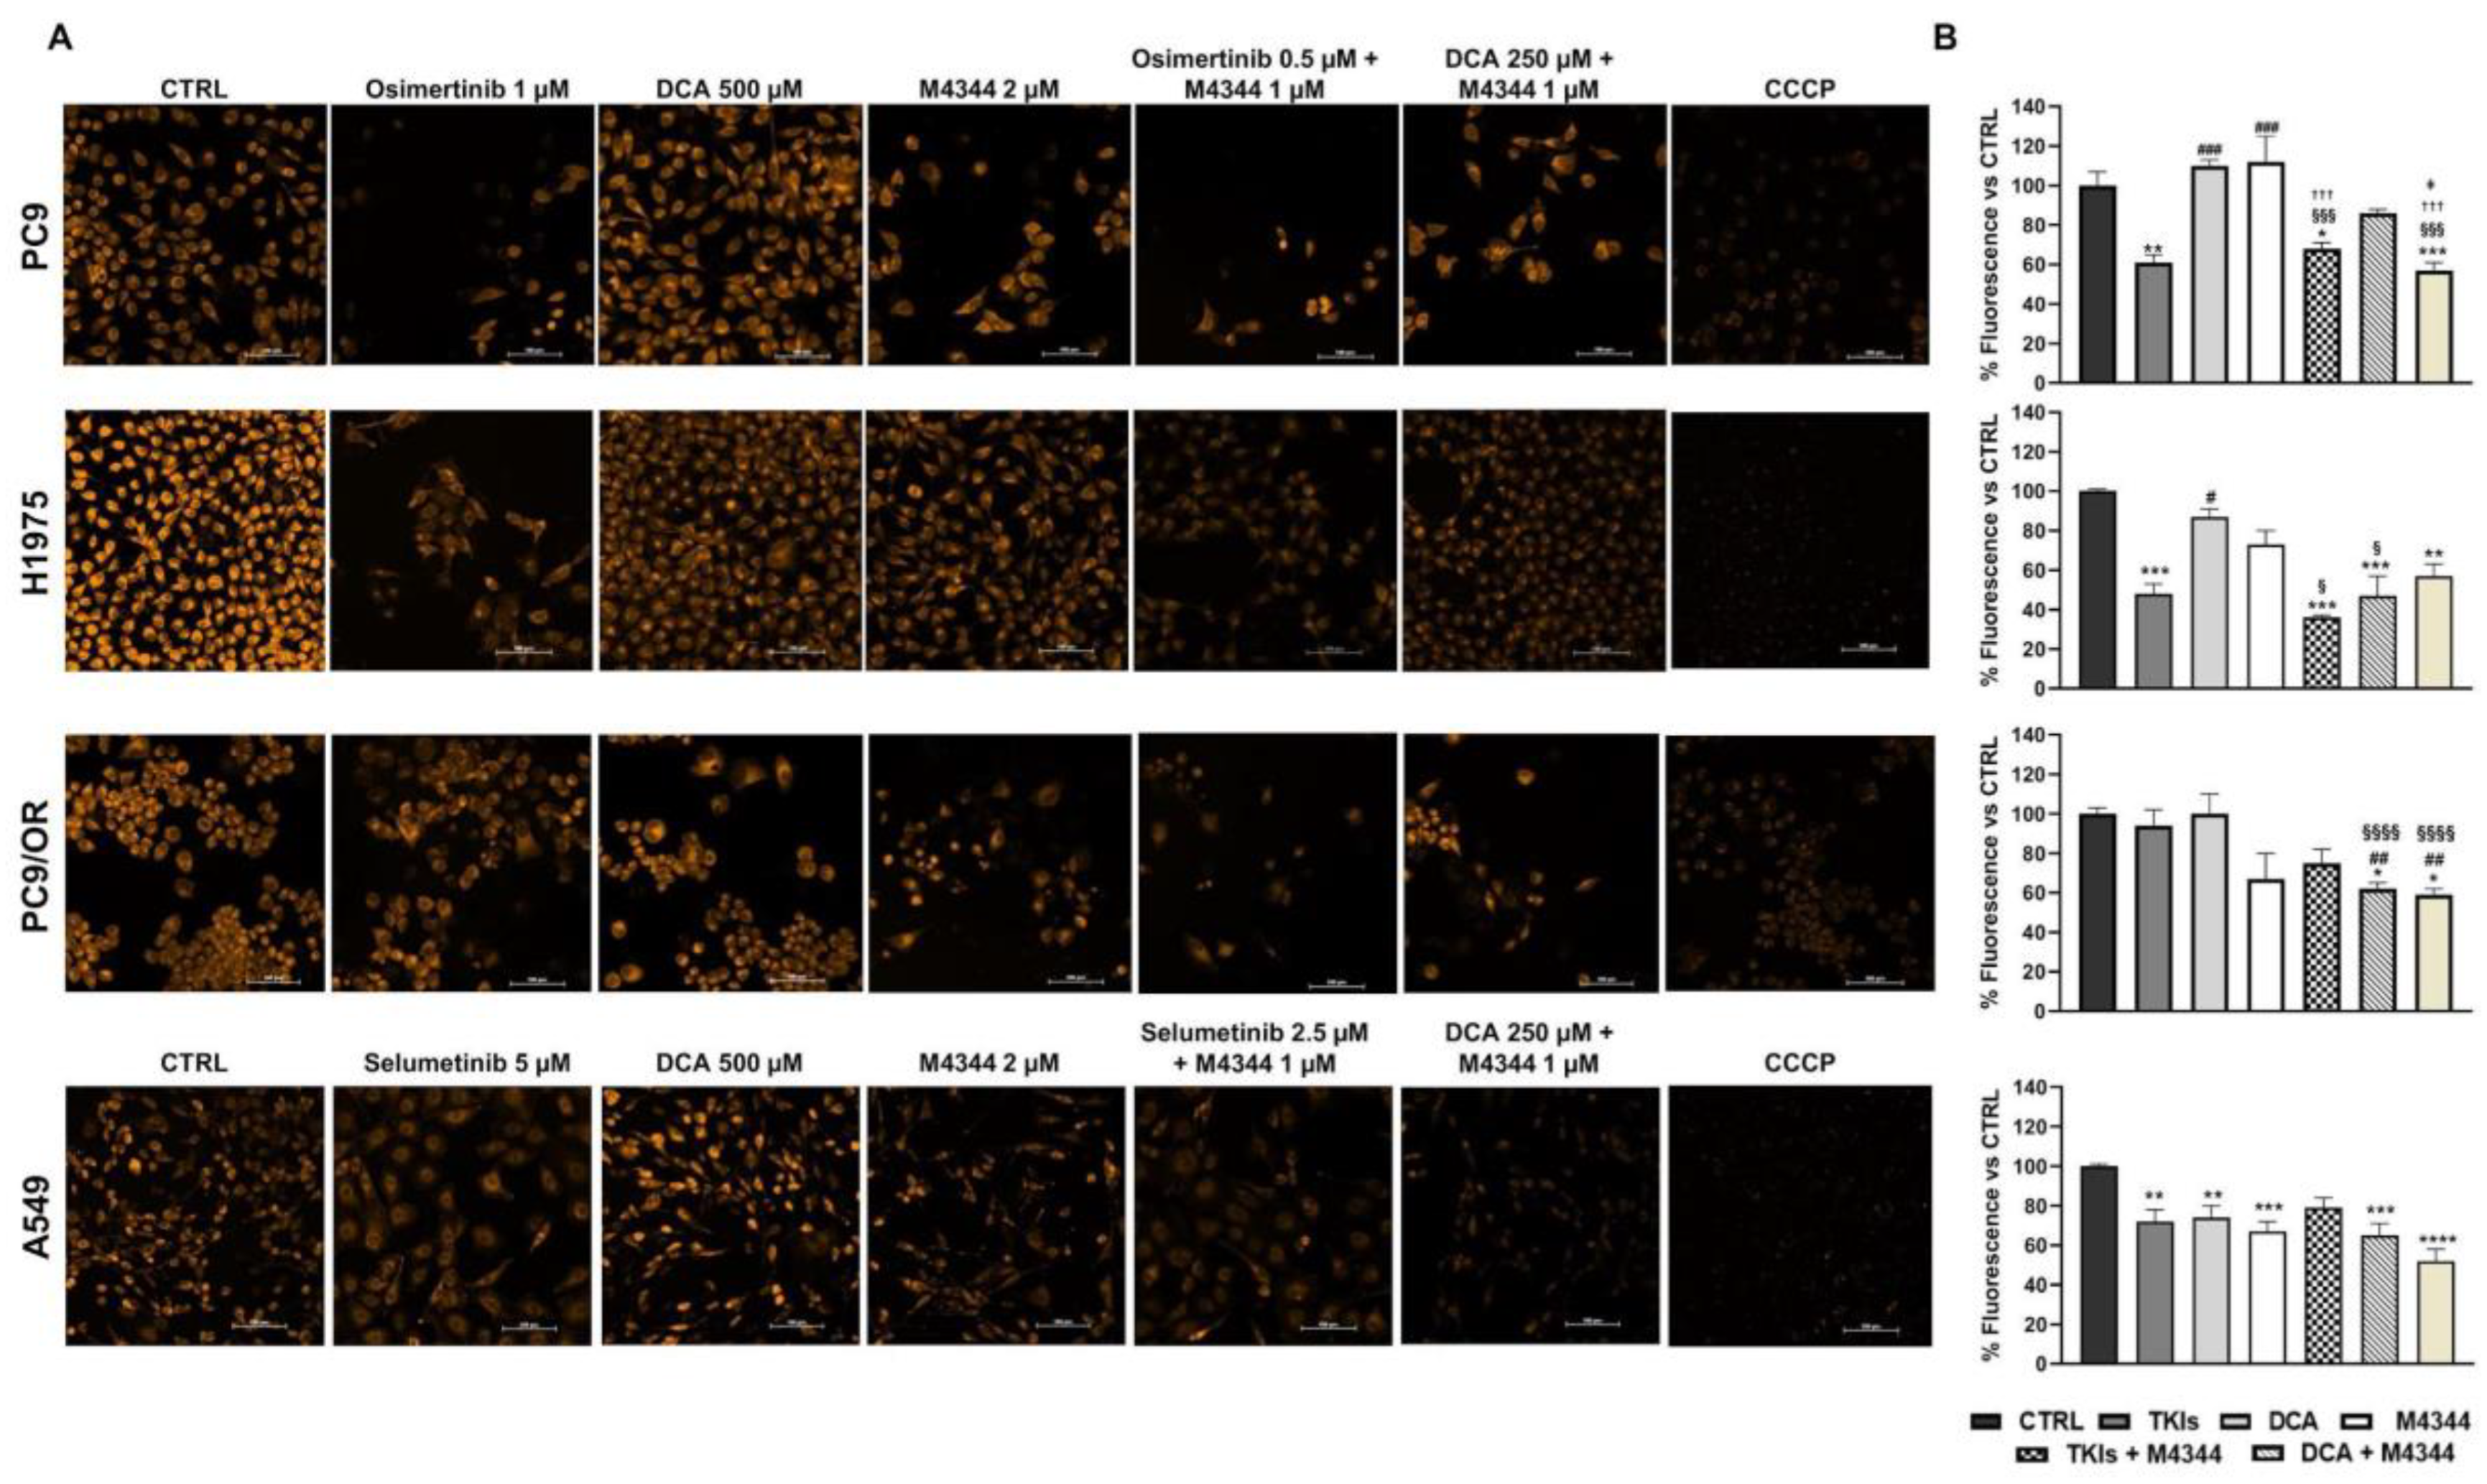
Figure 5.
(A) Flow cytometry analysis of cell death by Annexin V/PI assay after co-culture for 48 h of PC9, H1975, PC9/OR and A549 cells treated or not with TKIs (osimertinib 1 μM and selumetinib 5 μM), DCA (500 μM) and M4344 (2 μM) alone or in combination (at half the dose). (B) Representative western blotting of whole cell lysates showing levels of BID and Bcl2 in selected NSCLC cell lines treated for 48 h with TKIs alone or combined with DCA and/or M4344. GAPDH and Tubulin were used to ensure equal loading.
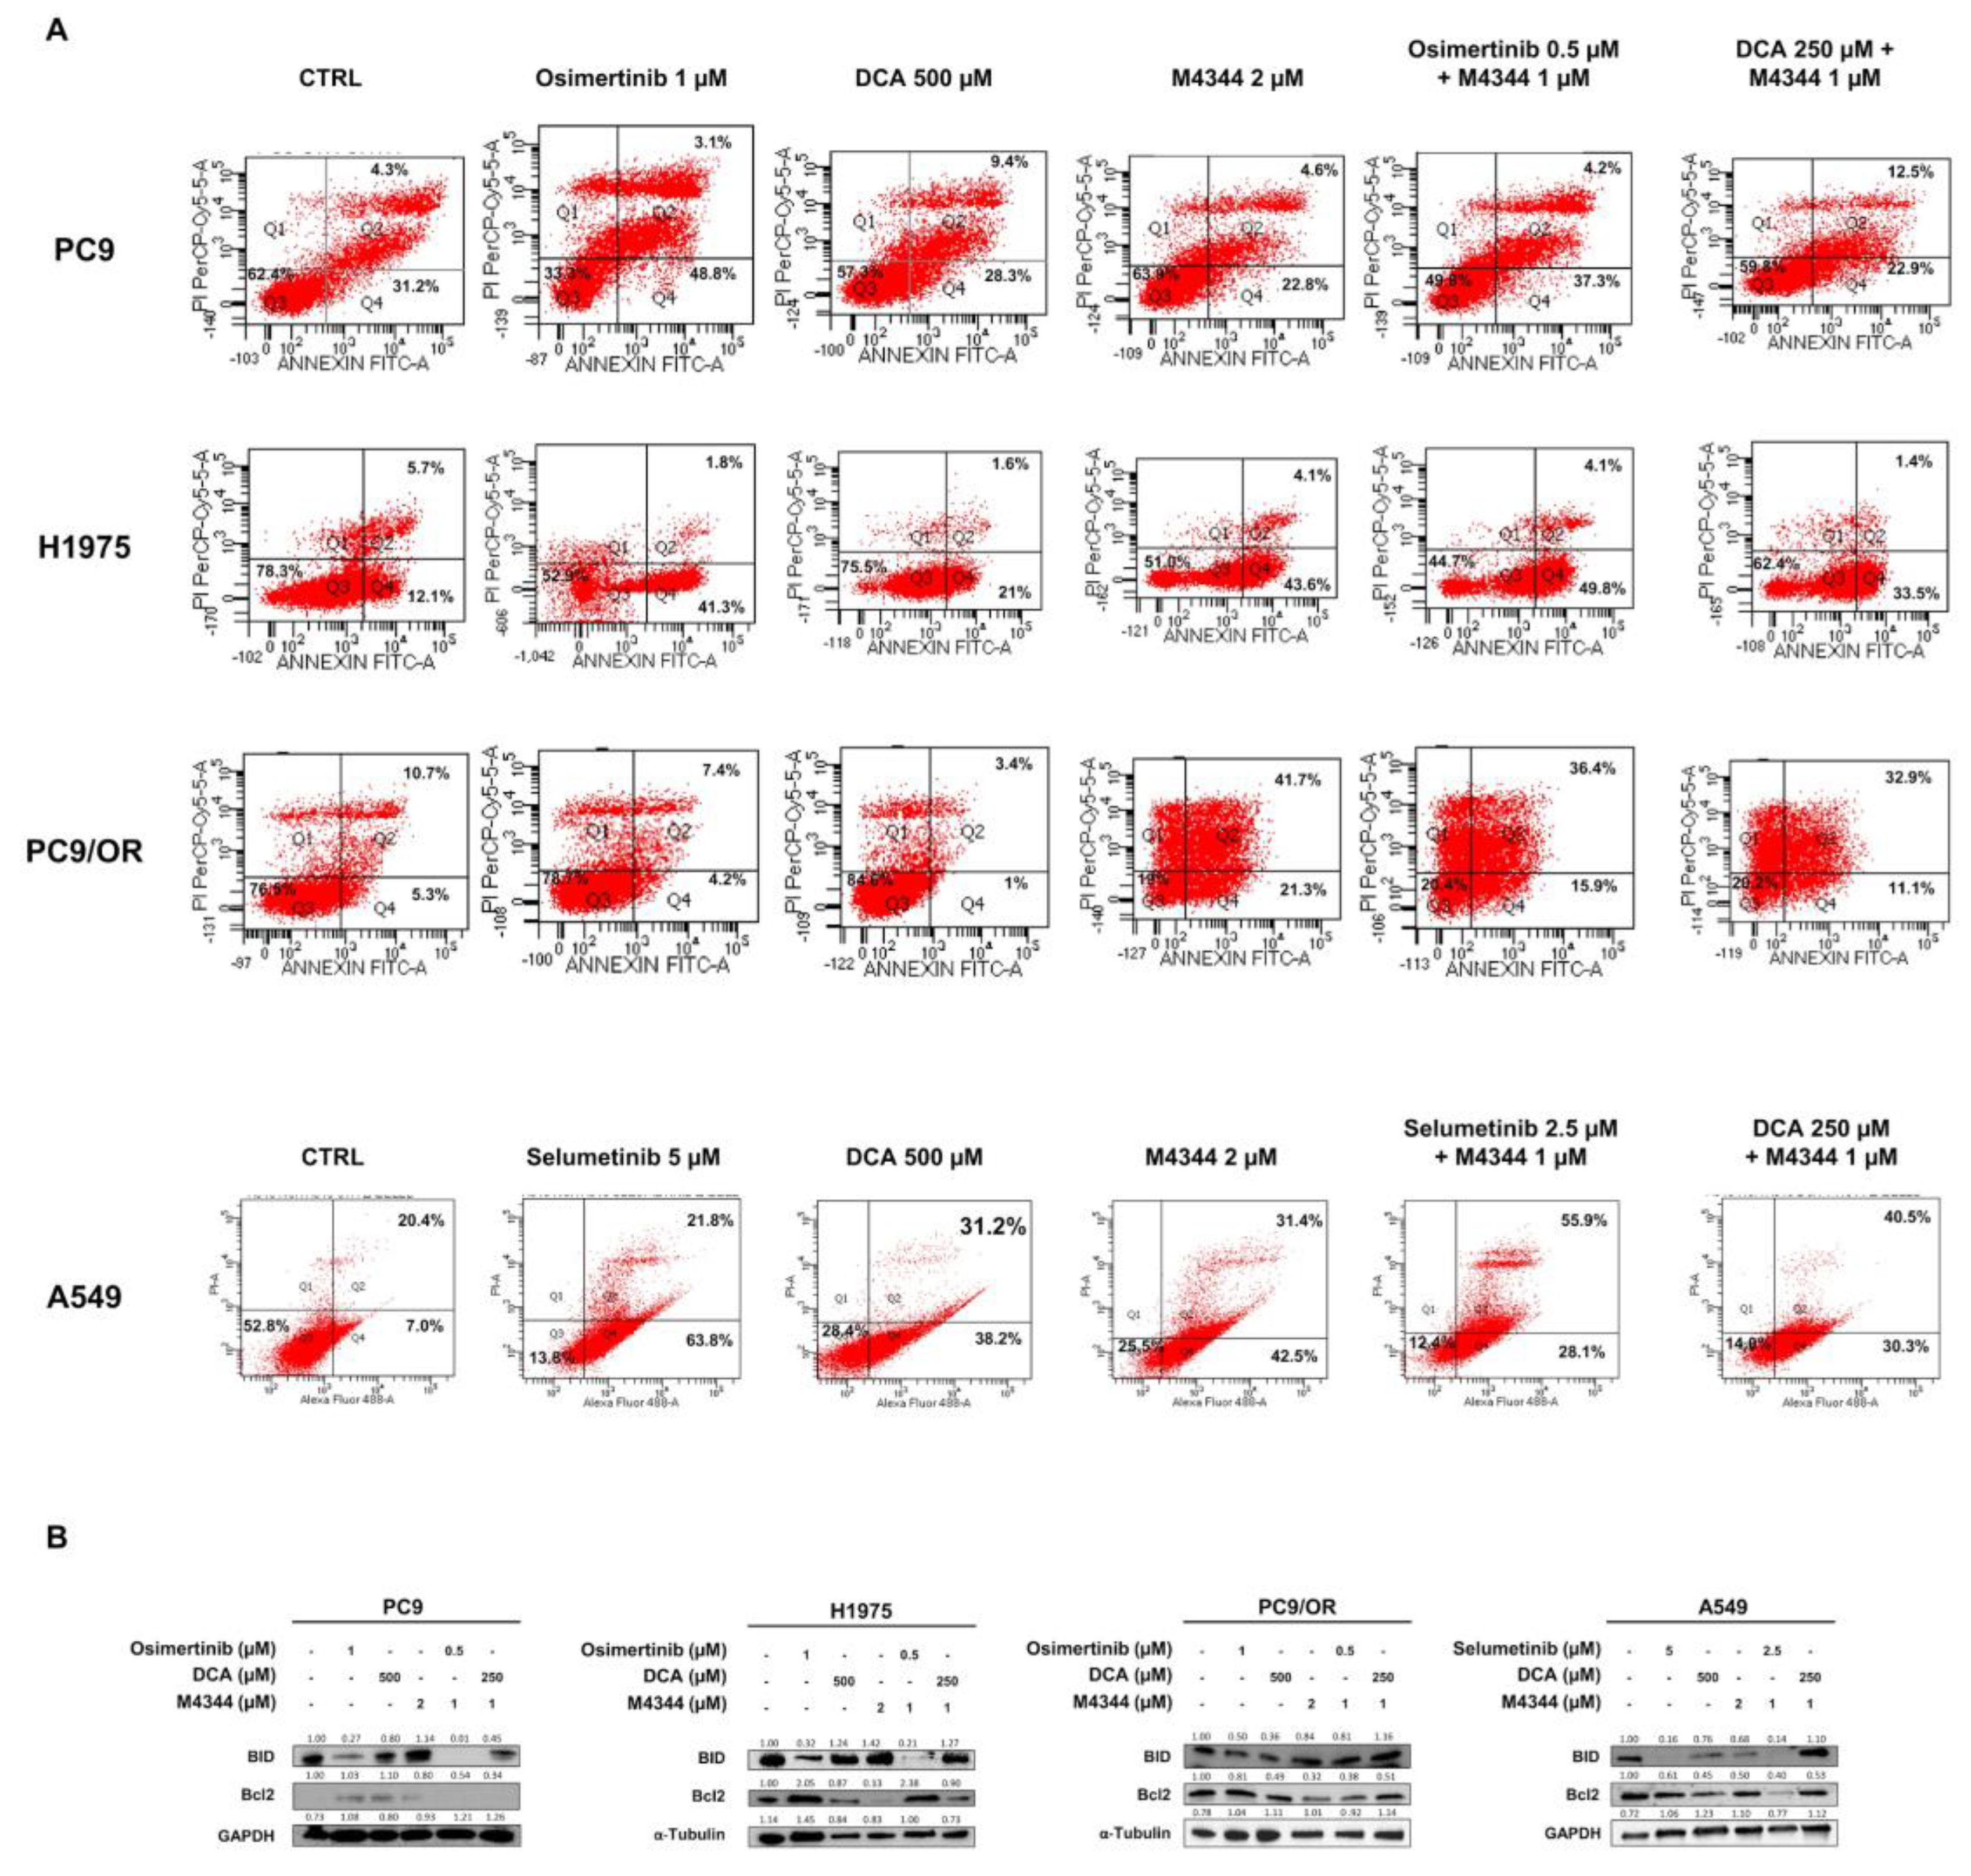
Figure 6.
Quantitative analysis of wound healing assay of PC9, H1975, PC9/OR and A549 cells treated or not with TKIs (osimertinib 1 μM and selumetinib 5 μM), DCA (500 μM) and M4344 (2 μM) alone or in combination (at half the dose) from time 0 to 48 h. Histogram bars represent the percentage of gap remaining reported versus each condition at T0 as mean ± SE. Statistical significance *p < 0.05, **p < 0.01, ***p < 0.001, **** and p < 0.0001 versus CTRL; #p < 0.05 and ##p < 0.001 and ####p < 0.0001 versus TKIs, §p < 0.05, §§p < 0.01, §§§§p < 0.0001 versus DCA; ǂp < 0.05 versus DCA + M4344. At least three independent experiments were performed.
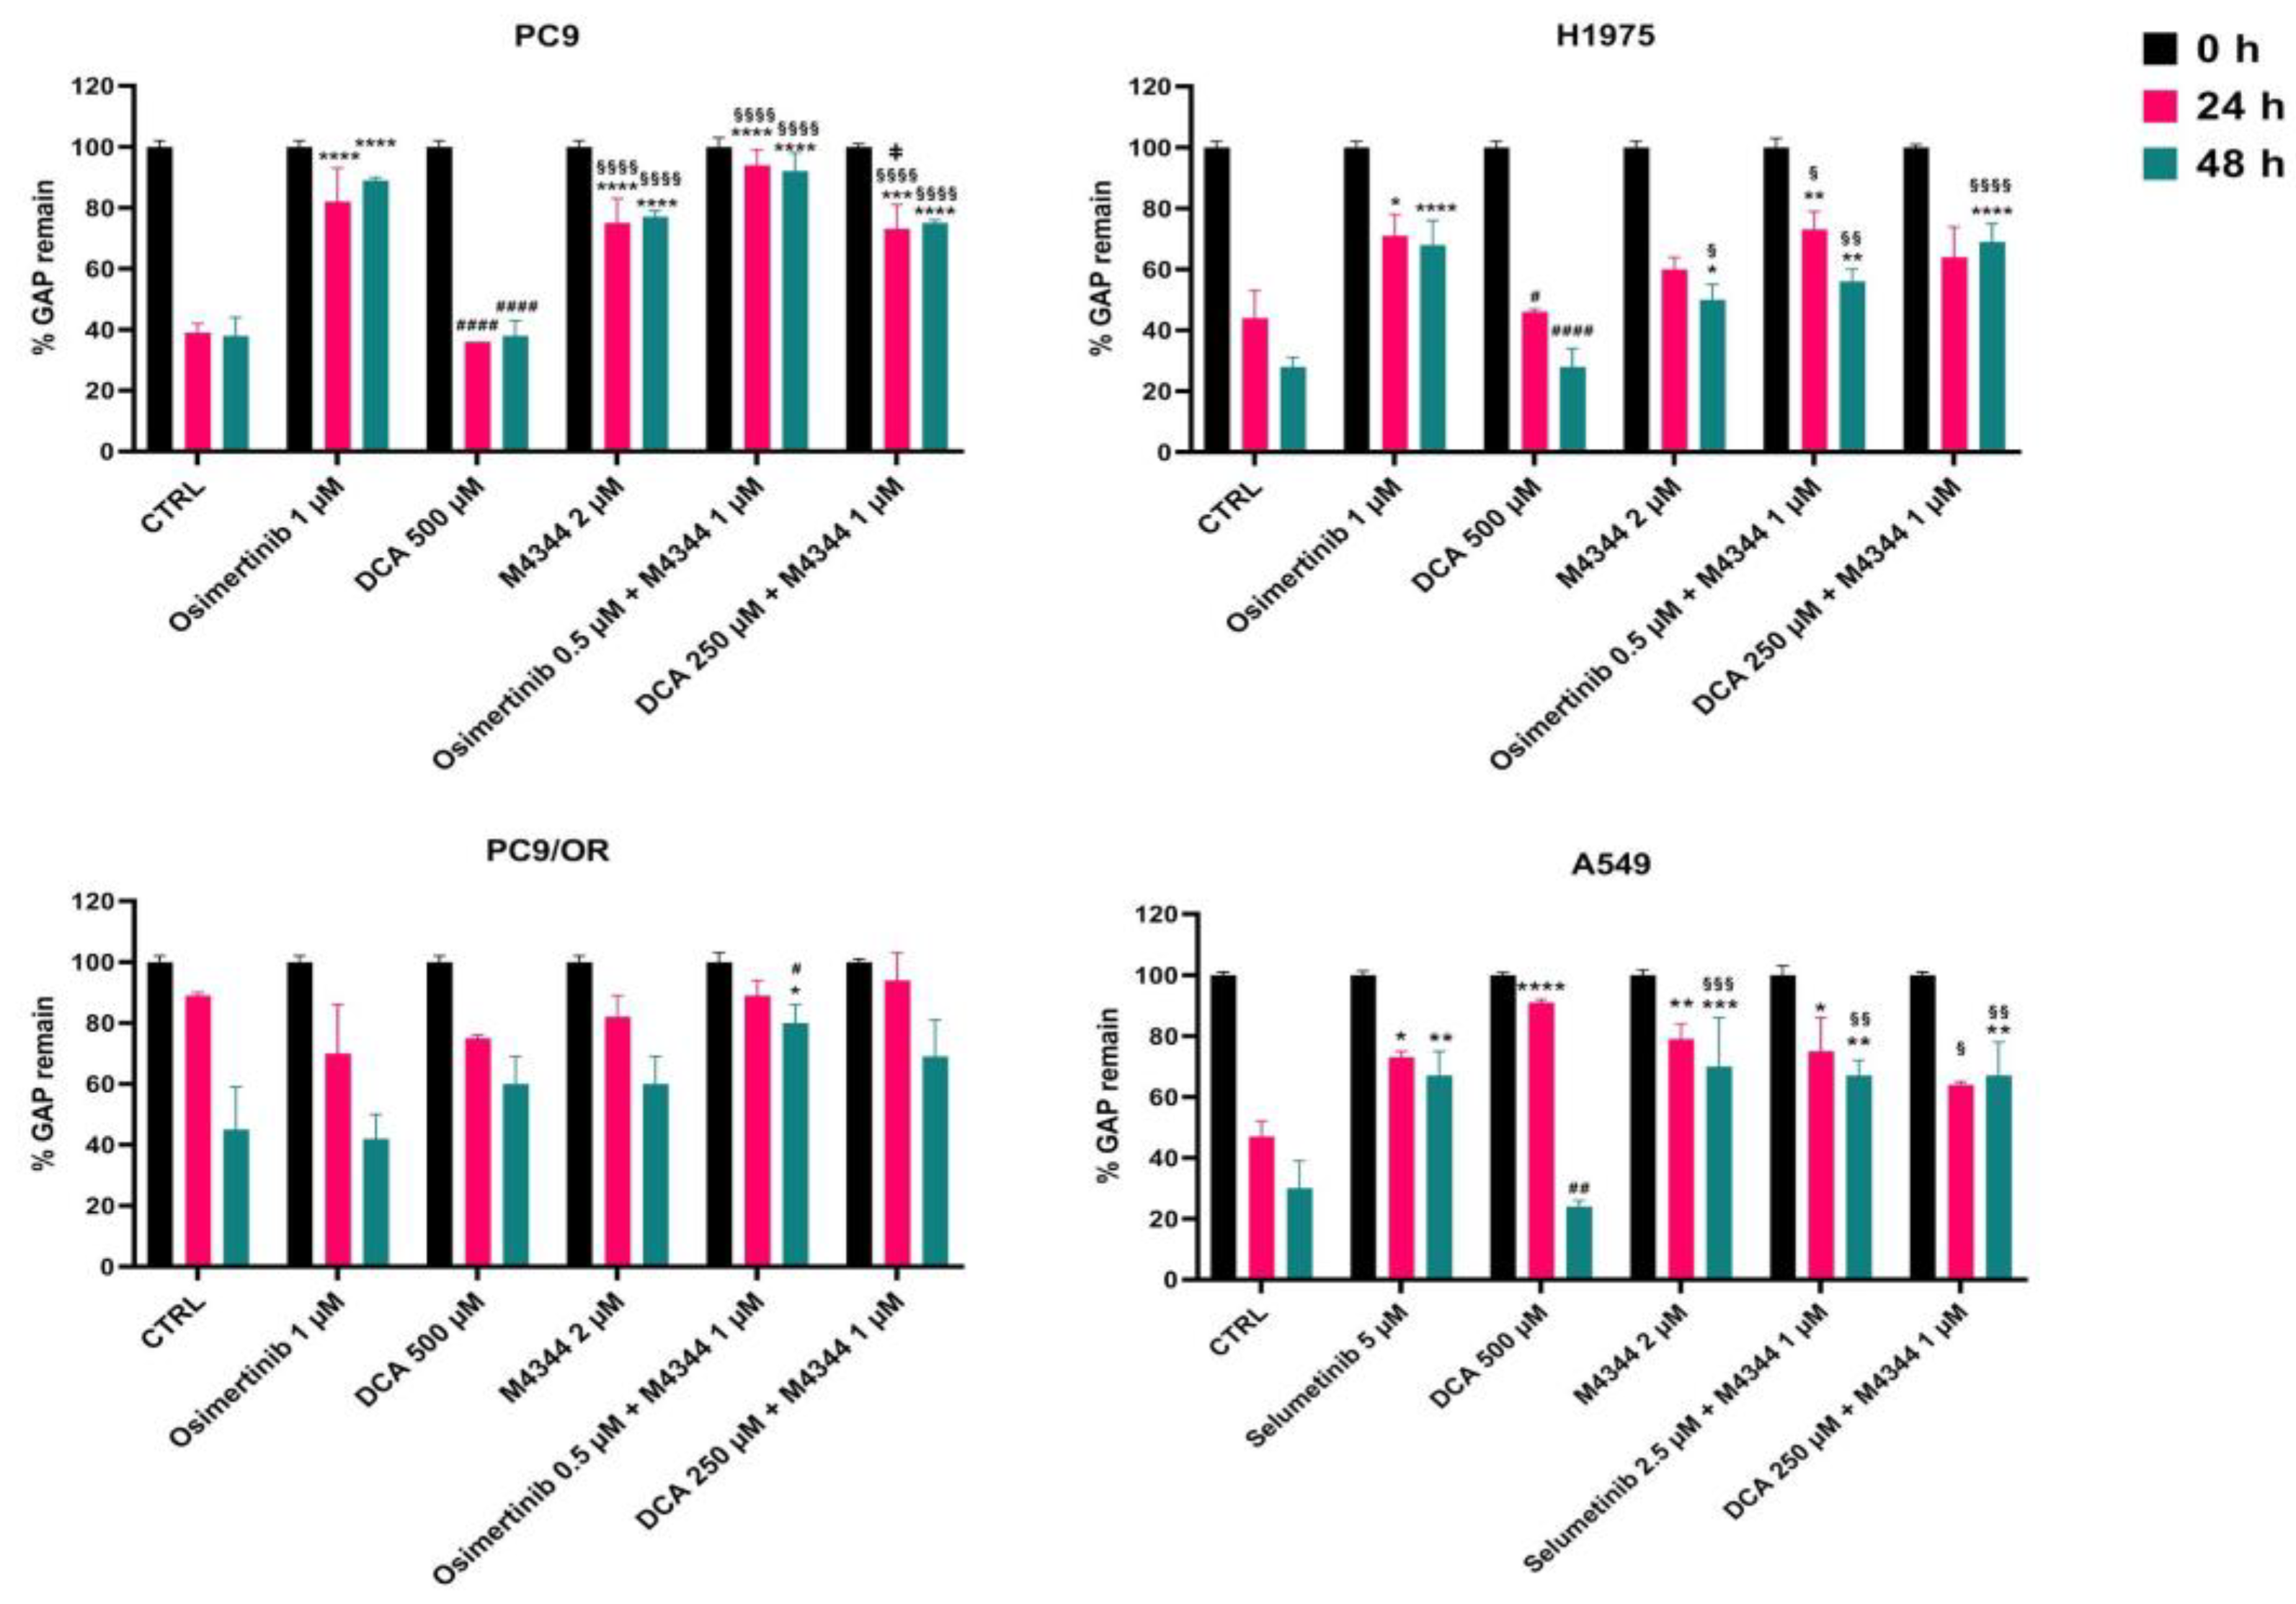
Figure 7.
Representative immunofluorescence images of PC9, H1975, PC9/OR and A549 cells exposed to osimertinib (1 μM), selumetinib (5 μM), DCA (500 μM) or M4344 (2 μM) alone or in combination (at half the dose) for 48 h. Nuclei were stained with DAPI (blue), co-localization of e-cadherin (green) and vimentin (red) was observed with a high resolution fluorescence microscope (20X magnification). Merge images were also obtained.
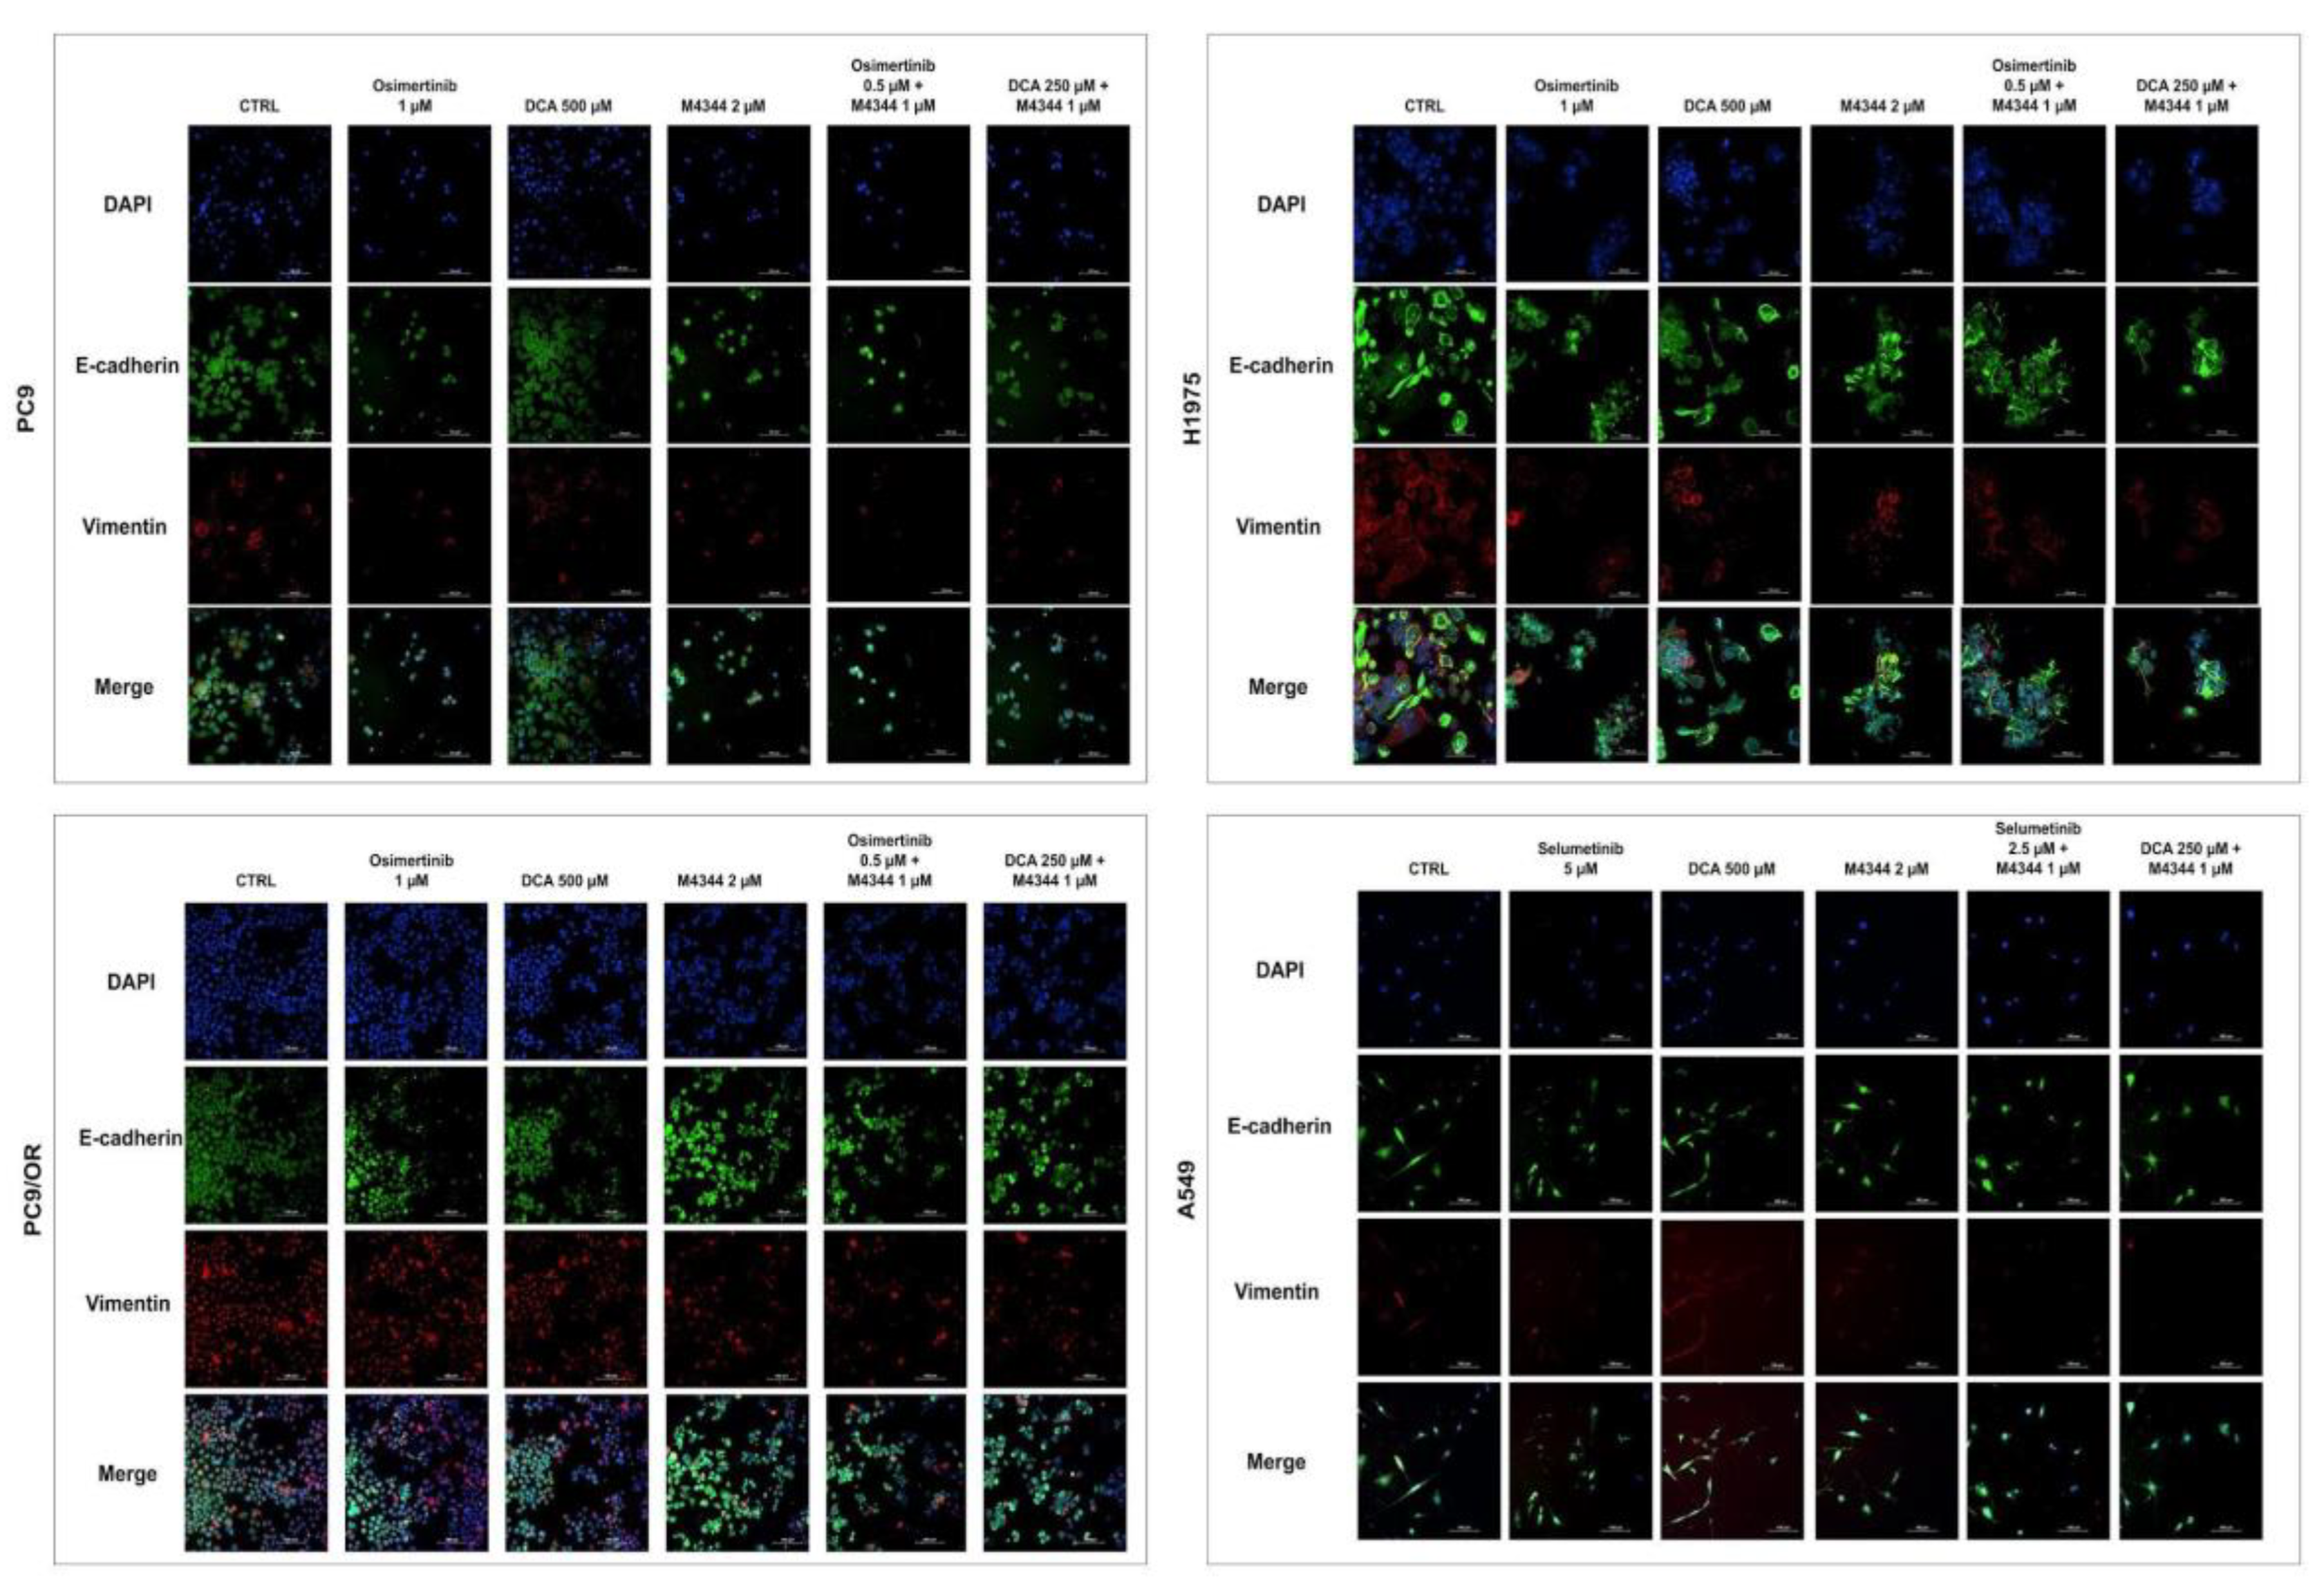
Figure 8.
Working model of NSCLC cells based on oncogene-driven mutations and non-oncogene addiction. The graphical summary was produced by the authors.
Figure 8.
Working model of NSCLC cells based on oncogene-driven mutations and non-oncogene addiction. The graphical summary was produced by the authors.
Disclaimer/Publisher’s Note: The statements, opinions and data contained in all publications are solely those of the individual author(s) and contributor(s) and not of MDPI and/or the editor(s). MDPI and/or the editor(s) disclaim responsibility for any injury to people or property resulting from any ideas, methods, instructions or products referred to in the content. |
© 2024 by the authors. Licensee MDPI, Basel, Switzerland. This article is an open access article distributed under the terms and conditions of the Creative Commons Attribution (CC BY) license (http://creativecommons.org/licenses/by/4.0/).
Copyright: This open access article is published under a Creative Commons CC BY 4.0 license, which permit the free download, distribution, and reuse, provided that the author and preprint are cited in any reuse.


