Submitted:
17 November 2024
Posted:
19 November 2024
You are already at the latest version
Abstract
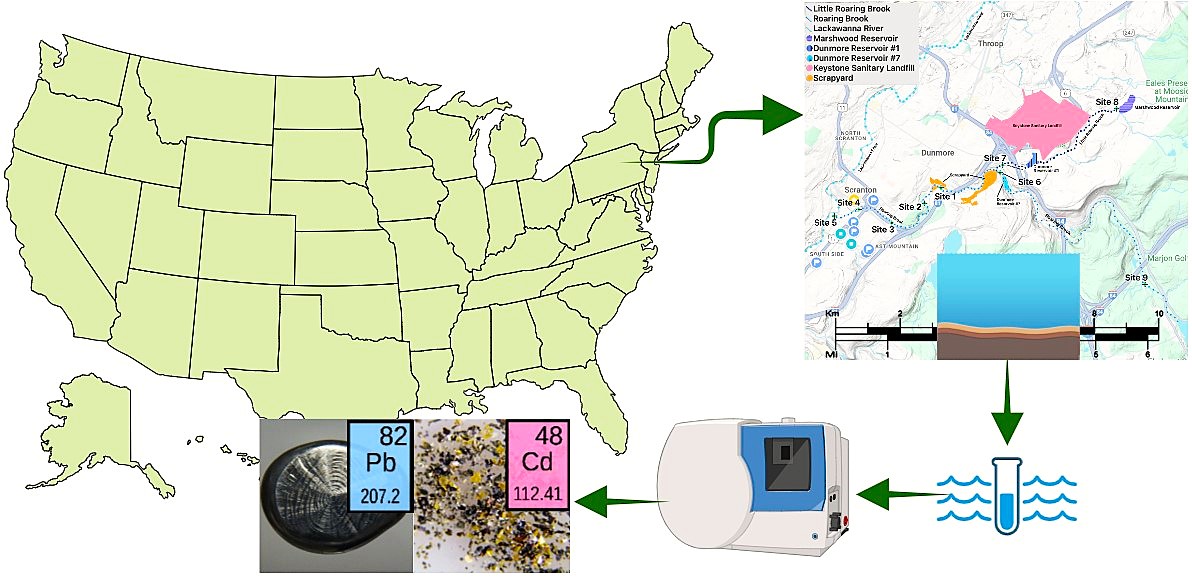
The Little Roaring Brook, a tributary of Roaring Brook in Lackawanna County, Pennsylvania, flows through densely populated towns before joining the Lackawanna River, which eventually empties into Delaware Bay—a vital hub for the U.S. seafood industry. Waterways are instrumental in transporting and dispersing chemical compounds and other pollutants worldwide, including harmful substances generated by human and industrial activities. These pollutants travel from their sources to distant areas through processes like evaporation and rainfall, reaching regions where they were never directly used. In February 2024, a malfunction during the reconstruction of a dam in Lackawanna County caused a sediment release that accumulated 2 to 3 feet deep in downstream areas, including sections of Roaring Brook and the Lackawanna River. Built in 1886, the dam had accumulated sediment in its reservoir over many years, and the surrounding watershed includes major roadways that can release toxic pollutants. Additional significant pollution sources near these streams, such as an industrial and municipal waste landfill, an automotive salvage yard, and an artillery manufacturing plant, are rarely assessed by independent parties. This study seeks to quantify heavy metal contamination in sediments near these potential pollution sources. The primary sources of pollution examined include the landfill, the salvage yard, the sediment release from the dam reconstruction, the manufacturing plant, and road-related runoff. Inductively Coupled Plasma – Optical Emission Spectroscopy (ICP-OES) was used to analyze sediment samples from Roaring Brook and Little Roaring Brook, revealing elevated levels of lead (Pb) and cadmium (Cd) at sites near these pollution sources. These levels were compared to the 2013 revision of the Australian and New Zealand Guidelines for Fresh and Marine Water Quality (ANZECC/ARMCANZ) Sediment Quality Guidelines. The sample immediately downstream from the landfill showed the highest concentration of Pb at 104.85 mg/kg, while the highest Cd concentration of 0.504 mg/kg was found just downstream of the automotive recycling center. Sediments from Roaring Brook, downstream of the sediment release, also showed elevated levels of Pb (80.34 mg/kg) and Cd (0.466 mg/kg), compared to the upstream concentrations of 64.46 mg/kg for Pb and 0.154 mg/kg for Cd. The lowest concentrations of Pb and Cd were found in the upstream samples from Little Roaring Brook, with 50.53 mg/kg of Pb and 0.146 mg/kg of Cd. According to the ANZECC/ARMCANZ Sediment Quality Guidelines, all Pb concentrations exceeded the 50 mg/kg threshold, above which further investigation is recommended. While Cd concentrations were all below the 1.5 mg/kg threshold, analysis of matrix-spiked samples indicated that the actual levels of Pb and Cd may be higher than initially determined due to the effects of sediment particle size. Roaring Brook and Little Roaring Brook are infrequently assessed for pollutants, underscoring the need for more research to establish a clearer understanding of the pollution sources in the area. This study provides an initial, independent assessment of heavy metal contamination in these streams, highlighting the need for further analysis of other potential pollutants and their ecological and public health impacts.
Keywords:
Surface water sediment
; heavy metal contamination
; ICP-OES analysis
; water pollution
; environmental monitoring of aquatic systems
; industrial pollution
; lead
; cadmium
1. Introduction
Roaring Brook is a 34-km long, freshwater stream located in Northeast PA that flows into the Lackawanna River, a tributary of the Susquehanna River, which eventually enters the Chesapeake Bay (Figure 1). Flowing into Roaring Brook is Little Roaring Brook, downstream from Dunmore Reservoir Number One. Dunmore Reservoir Number One is a backup drinking water supply within 300 m of The Keystone Sanitary Landfill (KSL) (Figure 2. The KSL is an active landfill accepting industrial waste and solid municipal waste and is one of the nation’s largest landfills. Further, it has operated for over 50 years and is now accepting solid and liquid waste from unconventional oil and gas drilling [1]. Downstream, as Roaring Brook makes its way to Lackawanna River, multiple spans of an automotive salvage yard sit between 20 to 80 m of the water’s edge (Figure 3). The salvage yard is directly adjacent to over 1200 m of Roaring Brook, situated on both sides of the stream for nearly 300 m of this span (Figure 4). Additional potential sources of pollution in Roaring Brook’s watershed are Interstate Highways 380 and 84 (Figure 2). These pollution sources release many contaminants including microplastics, heavy metals, organic compounds like per- and polyfluoroalkyl substances (PFAS), and pathogens to name a few. Among these, Pb and Cd were chosen as they are some of the more environmentally harmful contaminants prevalent in many surface water sediments.
There have been some studies of the contaminants present in the Lackawanna River, but research is scarce on Roaring Brook and Little Roaring Brook, which are both located directly adjacent to the previously mentioned potential pollution sources. In 2005, Lackawanna River’s Total Maximum Daily Load (TMDL) was calculated to quantify the impacts of acid mine drainage, specifically water acidity and iron, manganese, and aluminum content [2]. The United States Geological Survey (USGS) data shows that Lackawanna River was tested in 2019 for a range of PFAS and in 2012 for heavy metal content including arsenic, Cd, and Pb [3]. Before these surveys, the most recent comprehensive assessment found is from 1973 via USGS. The Roaring Brook’s water and sediment quality is less frequently assessed. The last USGS-reported study of Roaring Brook’s heavy metal content was in 1973, reporting 15 µg/L Cr (VI) from a filtered sample and < 50µg/L Pb (recoverable, unfiltered) [4]. Adjacent to sample site 4 is the Scranton Army Ammunition Plant, which has manufactured artillery since 1953. The manufacturer was reported in 1970 for releasing 1.5 million gallons per day of untreated industrial waste containing heavy metals and oil into Roaring Brook [5]. In 2022, it was determined that the plant was discharging waste containing multiple types of PFAS [6]. The lack of water and sediment quality information and the extent of nearby pollution sources make these Roaring Brook and Little Roaring a high priority for further research. These streams, like many others, are important resources for the local community in terms of recreation and fishing for food and sport. They are also part of the tributary network of Chesapeake Bay, which is a major contributor to regional seafood production and a crucial ecological hub [7].
Pb and Cd are both biologically nonessential metals that are toxic at low concentrations and are known to cause oxidative stress, create free radicals, are nephrotoxic, and are correlated with elevated cancer rates [8]. Cd is known to cause adverse health effects at levels as low as 0.01 to 0.05 mg Cd per kg of body weight per day [9]. Blood Pb levels as low as 5 µg/dL can cause adverse health effects [10]. In humans, Pb exposure primarily affects the nervous system, particularly in children, leading to cognitive deficits, reduced IQ, and behavioral issues [11]. Chronic exposure in adults can result in hypertension, renal impairment, and reproductive problems [12]. Pb also affects the hematopoietic system, causing anemia by inhibiting hemoglobin synthesis [13]. In wildlife, Pb poisoning can lead to neurological impairment, reduced reproductive success, and increased mortality rates [14]. Cd is also a highly toxic metal with significant health implications for humans and wildlife. For humans, long-term exposure to Cd can also cause cardiovascular diseases and impair reproductive health [15]. Cd accumulates in the kidneys and liver, where it can remain for decades, causing chronic toxicity [16]. In wildlife, Cd exposure can Pb to bioaccumulation in aquatic organisms, affecting their growth, reproduction, and survival. Fish and invertebrates exposed to Cd show signs of oxidative stress, immune dysfunction, and metabolic disturbances [17].
The overall goal of this study was to assess the Pb and Cd concentration of surface water sediment in streams whose watersheds contain the potential sources of pollution—the landfill, the automotive recycling center, a sediment release incident from a reservoir’s reconstruction, and high-traffic roadways. Surface water sediment in freshwater environments is the particulate material, including organic and inorganic matter, that accumulates at the bottom of lakes, rivers, and streams [18]. Heavy metals accumulate in surface water sediments mainly through industrial discharges, urban runoff, agricultural activities, and atmospheric deposition [19]. Heavy metals accumulate in surface water sediments through several mechanisms. One is adsorption, where metals in the water column adhere to particulate matter, such as clay minerals and organic material, which then settle to the bottom [20]. This adsorption is affected by sediment particle size, with smaller particles retaining more heavy metals and larger particles retaining less [21,22]. Metals also accumulate when they precipitate from the water as they form insoluble compounds with other elements [20]. The formation of these insoluble compounds is subject to redox conditions, pH, and levels of organic matter, which significantly influence the mobility and retention of heavy metals in sediment [23]. Additionally, aquatic organisms can uptake heavy metals, and their excrement and remains contribute to the sediment, concentrating the metals over time [20].
The first potential contribution of heavy metals to our sediment sample sites was a temporary sediment unloading due to a construction incident. For about 5 weeks, between February 4th and March 13th of 2024, restorative dam construction at the Number Seven Reservoir of Dunmore, PA released large amounts of sediment into Roaring Brook [24,25,26]. Pennsylvania American Water (PAW), operating the construction, stated that the project required draining the reservoir’s water through large-diameter release valves [24]. The exact cause of the sediment release is unclear, but PAW stated that heavy rainfall contributed to the release of previously accumulated sediment [24].
When a significant amount of sediment, such as soil and rocks, is introduced into a stream, it can significantly change the stream’s physical structure. Sediment can accumulate in downstream areas, forming gravel bars and raising the streambed level. This was the case with the sediment release event, where new deposits added over one meter of sediment accumulation to existing streambeds. These changes may widen and deepen the stream, depending on the sediment’s distribution through it. Beyond effects to the structure of the stream, sediment releases can severely impact aquatic wildlife by physically smothering habitats and organisms, increasing water turbidity, and reducing light penetration. These releases can also lower dissolved oxygen levels in the sediment layer, harming species that require high oxygen levels. Additionally, disturbed sediments may release toxic substances, increasing water toxicity and further threatening aquatic life. Together, these effects can lead to long-term ecological changes, particularly impacting sensitive species. While immediate effects can be severe, long-term impacts depend on the amount of sediment released, the stream’s capacity to recover, and the how the water flow disperses the sediment over time [27].
The sediment released during the reconstruction of the Number Seven Reservoir likely contained a multitude of contaminants given Pennsylvania’s high incidence of illegal dumping and the high traffic roads in the Roaring Brook watershed (Figure 2) [28]. Potential contaminants from the roadways alone include Cu, Fe, Ca, Na, Al, Mg, K, Si, Zn, Sb, Ba, Pb, and S [29]. Regarding heavy metals, scrapyards are known to release Pb, Cd, Mn, Cu, Fe, Ni, and Zn into nearby plants, air, and soil, eventually entering nearby water sources [30,31]. Landfills regularly produce leachate, a complex fluid mixture of compounds including but not limited to PFAS, microplastics, antibiotics, prescription medications, harmful compounds from personal care products, chlorides, sulfates, ammonia, ammonium, lead, cadmium, chromium (elemental, trivalent, and hexavalent), nickel, magnesium, copper, iron, zinc, calcium, sodium, and potassium [32,33,34,35,36]. A more comprehensive list of chemicals found in landfills was published by the United Kingdom Health Protection Agency [37]. These compounds are known to leach into surrounding water and soil, significantly more so when the landfill’s leachate is not properly contained and treated, as historically shown with KSL [38].
Landfills can expose nearby residents to contaminants through air, water, and soil [32,33,39,40,41,42]. Particulate matter, dust, odors, vapors, and gases can be released during waste transport, tipping, and decomposition, and are carried by wind and atmospheric conditions, affecting air quality for nearby residents [39]. Leachate from decomposing waste can contaminate groundwater, posing risks through drinking water, cooking, and irrigation [39]. KSL is located closer than 500m to a backup drinking water supply, Dunmore Reservoir Number 1, presenting a clear threat for water contamination. Emissions from transport vehicles and site management, as well as untreated gases and odors from waste breakdown, also contribute to potential health risks [39].
2. Materials and Methods
Sediment samples were collected at nine sites within the Lackawanna River watershed (Figure 2 and Figure 5). The sites span Roaring Brook and Little Roaring Brook upstream and downstream of various potential pollutants including KSL, the automotive recycling business, and the Dunmore Reservoir Number Seven sediment release event. Sediment was collected from the streams’ edges, at depths of approximately 1-2 feet underwater and 1-2 feet into the stream channel. These sites were chosen for their downstream proximity to activities within the immediate watershed of the two streams being assessed. The upstream sample sites were expected to be cleaner and to serve as a background as they have fewer pollution sources in their vicinity.
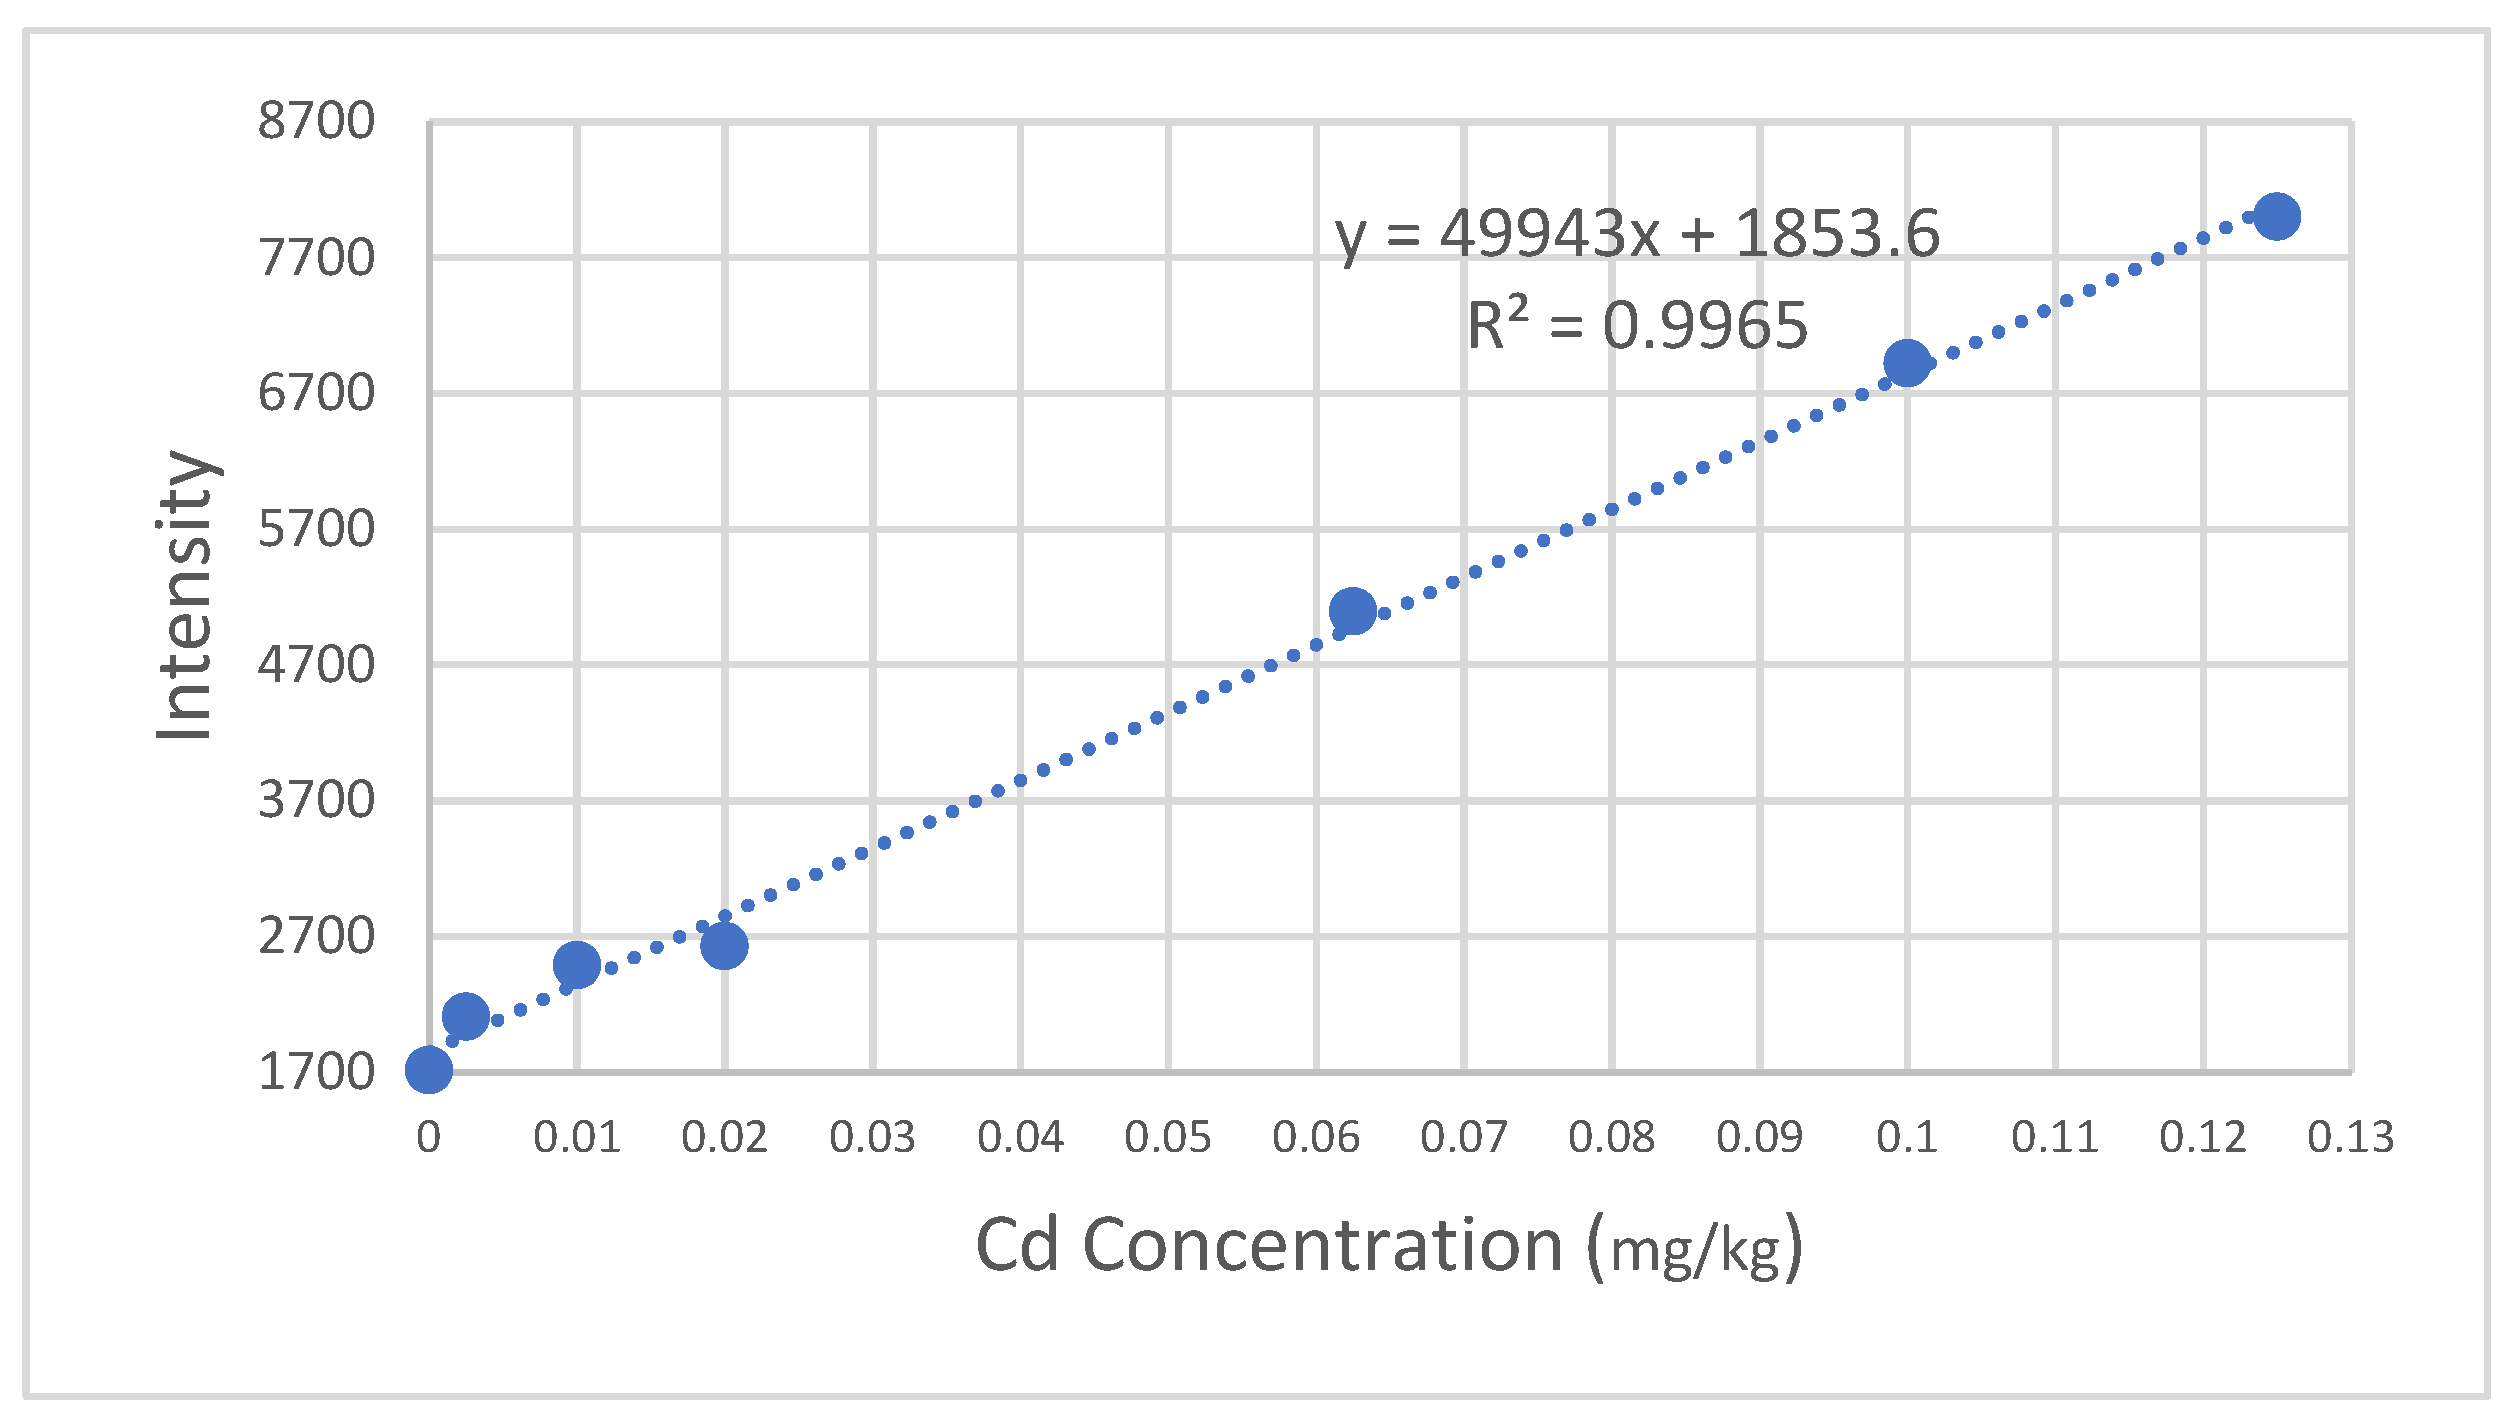
Calibration standards were created with reagent water and 2% HNO3. For the Pb and Cd standards, there were six different concentration standards made for this study. The concentrations for Pb were 0.125, 0.25, 0.5, 1, 2, and 10 mg/kg. The concentrations for Cd were 0.0025, 0.01, 0.02, 0.0625, 0.1, 0.125 mg/kg. Two Calibration curves were created to determine the unknown concentrations of Pb and Cd in surface water sediments.
Samples from Sites 7-9, those upstream of the sediment release event, had more coarse particles (Figure 2). Sediment particle size from Sites 8 and 9 were mostly below 2 mm diameter, with a minority of particles reaching 3 mm. The sample from Site 7 had the coarsest particles, including some small stones reaching 4 mm in diameter. The majority of the sample was less than 2 mm, and particles over 4 mm were removed. Samples from Sites 1-6, downstream of the sediment release event, were composed of fine particles < 2 mm. The sediment release event deposited fine, silty sediment banks upon the existing riverbed, and we obtained our samples from this newly deposited sediment for Sites 1-6.
Two additional samples were created as matrix spikes, with predetermined amounts of Pb and Cs standards added, to determine the effectiveness of our digestion and extraction procedure, and to assess the effects of sediment particle size variance among sample sites. The finest sediment sample, from Site 1, was spiked with Pb and Cd standard solutions to create Sample 10. Sample 11 was made by spiking the coarsest sediment sample, from Site 7. Samples 10 and 11 were each spiked with 3.5 µL Cd and 161 µL Pb standard solutions, both from 1000 µg/mL stock solutions. These concentrations were chosen to correspond with National Institute of Standards and Technology (NIST) certified values for total digestion of NIST standard reference material 2704, “River Sediment,” using Environmental Protection Agency (EPA)Method 3050B—the method followed for this study [43]. The concentrations of this standard reference material are meant to represent those of a heavily polluted stream containing 3.45 ± 0.22 mg/kg Cd and 161 ± 17 mg/kg Pb.
Samples were collected in cleaned plastic tubs and dried at room temperature for 72 hours. 1 gram of dry sample was then transferred to separate test tubes and treated with 10 mL of 1:1 HNO3, heated at a temperature of 95ᵒC ± 5ᵒC, and refluxed for 15 minutes. Samples were then treated with 5 mL of concentrated HNO3 and refluxed for 30 minutes. The solutions were then refluxed for two, cooled to room temperature, then 2 mL of reagent water and 3 mL of 30% H2O2 were added. After an additional two hours of refluxing then cooling the solutions, they were filtered with a Whatman No. 41 paper then diluted to 100 mL with reagent water. Each sediment sample was extracted, prepared, and analyzed in a single trial. The analysis of the samples was performed using a Perkin Elmer Avio 220 Max ICP-OES, with 8 L/min argon plasma flow, 0.2 L/min auxiliary air flow, 0.7 L/min nebulizer flow, 1500w RF power, and 1 mL/min pump flow rate. This instrument performed triplicate analysis for each sample.
3. Results
The calibration curve for the six Pb standards yielded a linear equation of y=2069.3x + 5686.8 and an R2 value of 0.9998 (Appendix A, Figure A1). The calibration curve for the six Cd standards yielded a linear equation of y=49943x + 1853.6 and an R2 value of 0.9965 (Appendix A, Figure A2). The calibration curves were used to determine the experimental concentrations of Pb and Cd in the sediment samples (Table 2).
Site 7, from Little Roaring Brook just below Dunmore Reservoir Number One showed the highest concentration of Pb with a value of 104.85 mg/kg and a Cd concentration of 0.346 (Figure 2). The lowest concentrations of Pb and Cd, 50.53 mg/kg and 0.146 mg/kg, respectively, were found at Site 8, in the Little Roaring Brook, just below the Marshwood Reservoir in Olyphant, PA (Table 2). The next lowest concentrations were both found at Site 9, with 64.46 mg/kg Pb and 0.154 mg/kg Cd. Site 2, in the Roaring Brook in Scranton, PA was the highest concentration of Cd at 0.504 mg/kg, with 77.06 mg/kg Pb. Site 5, the farthest downstream in the Roaring Brook, was 72.3 mg/kg Pb and 0.482 mg/kg Cd. Site 4, the next upstream, was 74.61 mg/kg Pb and 0.411 mg/kg Cd. Further upstream, Site 3 was 70.05 mg/kg Pb and 0.426 mg/kg Cd. After Site 2, the next upstream is Site 1, with 65.28 mg/kg Pb and 0.451 mg/kg Cd. Throughout the streams, the concentrations of sediment Cd and Pb vary, but the farthest upstream sites had the lowest concentrations of each metal, and the sites farthest downstream had higher concentrations for both metals.
Percent recovery of Lead (Pb) and Cadmium (Cd) in a spiked sample is defined as:
CSs = Experimental heavy metal concentration of the standard-spiked sample (mg/kg) (measured after procedure)
CUs = Experimental heavy metal concentration of the non-spiked sample (mg/kg) (measured after procedure)
CAs = Concentration of the standard spike (mg/kg) (measured before procedure)
Sample 10, a matrix-spike of fine particle sediment from Site 1, yielded 108.7% recovery of Pb and 118.0% recovery of Cd. Sample 11, a matrix-spike of coarse particle sediment from Site 7 yielded 73.0% Pb recovery and 97.7% Cd recovery (Table 3). The pattern shows higher recovery of heavy metal standards from finer particle sediments and lower levels of recovery from coarser particle sediments.
4. Discussion
The results of this study show that the sediment from Site 7, a segment of Little Roaring Brook immediately downstream from KSL, contained the highest concentration of Pb at 104.85mg/kg and a Cd concentration of 0.346 mg/kg—both more than double the concentration of the upstream source. It is possible that these elevated levels are due to the proximity of the KSL’s operations to this stream’s watershed (Figure 3). Heavy metals including Pb and Cd are known to travel through runoff water and groundwater [44]. The chemicals from landfill waste can leach into soil, groundwater, and nearby water sources [29,30,31,50]. This leachate can be harmful to nearby residents, wildlife, and the broader ecosystem [37]. The perimeter of the landfill is less than 150 meters from Dunmore Reservoir Number One, which flows immediately into the portion of the Little Roaring Brook that was sampled for Site 7. In 2019, KSL admitted ongoing breaches of leachate beyond the liners designed to contain it. KSL stated that they failed to fix the breach and there have been no further updates since. Site 7 sediment contained the largest sediment particles of all sample sites, with a few small stones at 3 to 4 mm, though most particles were below 2 mm. The fact that this site contained the largest sediment particles suggests that the heavy metal levels experienced by aquatic organisms in this area may be higher than the evidence suggests. This is related to larger particles having a lower tendency to bind heavy metals compared to organisms’ higher tendency to retain the metals in their tissue [24,25].
The upstream source, Site 8, from a segment of Little Roaring Brook just below the Marshwood Reservoir, had the lowest Pb and Cd concentrations at 50.53 and 0.146 mg/kg respectively. The watershed this section of the Little Roaring Brook has no known direct industrial or otherwise major pollution sources, reflected by the comparatively low heavy metal concentrations. This sample contained the second largest particles compared to other sample sites, with particles mostly below 2 mm and a minority of particles reaching 3 mm. This suggests that levels of heavy metals experienced by aquatic life at this sample site may also be higher than shown in this study. This is similar to Site 7, except the effect would likely be less at Site 8 since this sediment at this location is finer.
The Roaring Brook at Site 6, just below the sediment release from Dunmore Reservoir Number Seven reconstruction, also showed elevated Pb and Cd concentrations at 80.34 and 0.466 mg/kg respectively, compared to its upstream segment with Pb and Cd concentrations at 64.46 and 0.154 mg/kg. The sediment release event deposited sediment that added about 1 meter of depth to the streambeds. This was true for all sites downstream of the sediment release, which includes sites 1-6. The heavy metal concentrations and other contaminants at these sites are therefore more likely to reflect the contents of the sediment that was accumulated over time and released from Dunmore Reservoir Number Seven, rather than the usual sediment of these streambeds. Streambeds downstream from the sediment release should be monitored overtime to measure the movement of this newly deposited sediment and the effects it may have on aquatic organisms. For sites 1-5, on the rest of Roaring Brook, Pb concentrations were elevated compared to their clean, upstream sources, ranging from 65.28 to 77.06 mg/kg. All sample sites also showed elevated Cd levels ranging from 0.411 to 0.504 mg/kg. These elevated heavy metal concentrations may be attributable to pollution from the major roadways and other sources within the Roaring Brook and Dunmore Reservoir Number Seven watershed [29]. Pollution from roadways can be transported to the stream and reservoir by airborne dust particles, rainwater runoff and groundwater [29,44]. The highest Cd concentration was found at Site 2, located immediately downstream from the watershed of the automotive recycling center. Contaminants from the scrapyard can be transported to nearby streams through airborne dust, rainwater runoff, and groundwater [30,31,44]. Subsequent studies are needed to confidently attribute contamination to the scrapyard, since the sediment release event is the dominant source of sediment sampled from sites 1-6.
Compared with the 2013 Revision of the ANZECC/ARMCANZ Sediment Quality Guidelines, the Cd levels at the sample sites were all lower than the guideline value of 1.5 mg/kg, above which further testing is advised [22]. However, all Pb concentrations were above the guideline value of 50 mg/kg, but below the high guideline value of 220 mg/kg, above which adverse effects to wildlife are most probable. The Pb levels observed in this study call for further analysis to evaluate environmental risks. The immediate next step suggested by the Sediment Quality Guidelines would be to filter sediment samples to evaluate only < 2 mm particles. Our Pb and Cd concentration measurements are likely lower than levels from samples of < 2 mm particle fractions, as these particles have higher propensity for binding contaminants than particles with higher surface area like coarse sand and debris [22]. If this filtering step reinforces exceedance of sediment guideline values, further recommended steps involve comparing contaminant concentrations with background levels from similar reference sites. If still above background, bioavailability is assessed using dilute acid extractable metals and other factors like acid-volatile sulfides and total organic carbon to account for reduced metal bioavailability. Contaminants are classified as Contaminants of Potential Concern (COPCs) if exceedances persist. The referenced framework then recommends evaluating additional evidence, including pore water metal concentrations and toxicity testing. If toxicity is confirmed, management actions are recommended; otherwise, a weight-of-evidence approach should be carried out to assess potential risks [22].
These elevated levels of Pb and Cd confirm our suspicion that surface water sediment near short and long-term pollution sources would contain more heavy metals than their upstream sources [29,33,37,40]. These levels may also suggest that the operation of these pollution sources should be more carefully regulated and monitored to ensure safe operation and containment of potential contaminants. Consideration should also be made on the relocation of these facilities. Lackawanna County of Pennsylvania, where the samples were obtained, has elevated rates for all types of cancer and for heart disease, which further reinforces the need to address environmental pollutants [46].
The last publicly available, comprehensive analysis of Roaring Brook’s water quality including heavy metal content was in 1973 [47]. Given the limited assessment history of water and sediment of Roaring Brook and Little Roaring Brook, and the above issues, additional research is needed to better understand the extent and sources of pollution in Lackawanna County. The landfill, automotive recycling center, roadways, and the other pollution sources in the area are likely to emit many pollutants other than Pb and Cd. This contamination is also more geographically widespread than just the sites studied here. Wildlife, air, groundwater, and soil are all areas that should be further assessed and monitored, especially to assess biological risk factors. These efforts might efficiently allocate resources by targeting high-risk chemicals in media that are likely to have severe impacts on at-risk populations. Potential chemicals that fit these criteria are hexavalent chromium and radium 226/228, both of which are likely to be emitted by the landfill [1,48,49].
Chromium, particularly in its hexavalent form, Cr (VI), is highly toxic and poses significant health risks to humans and wildlife [50]. In humans, exposure to Cr (VI) can lead to severe respiratory problems, skin irritation, and an increased risk of lung cancer, as well as potential damage to the liver and kidneys [50]. For wildlife, chromium contamination can bioaccumulate and is prone to biomagnification, which can cause reproductive, developmental, and behavioral abnormalities in various species, disrupting aquatic ecosystems [50].
Trace amounts of radium, even at low levels, pose significant health risks to both humans and wildlife due to its radioactive nature [51,52,53]. In humans, radium exposure, even in small quantities, can lead to bone cancer and other forms of cancer, as radium tends to accumulate in bones and emit alpha particles, causing damage to bone marrow and surrounding tissues [51,52,53].
Measures should be taken to more strictly control these pollution sources and if this is not possible, such operations should be ceased to ensure the wellbeing of residents and the surrounding environment. The areas that have already been damaged by this pollution should be further evaluated and treated accordingly. There are many proven and emerging methods suitable to address the varying needs of each type of site, depending on the nature of the contaminants and the geochemistry of the site [54]. Missouri University researchers developed software that prioritizes contaminants for treatment based on their toxicity and prevalence at specific sites, aiding strategic remediation efforts [34]. Another study used the Leachate Pollution Index (LPI) and phytotoxicity tests to assess landfill leachate contamination, showing that active landfills had higher LPI values, and higher leachate concentrations inhibited plant growth [55]. These tools help customize pollutant prioritization and select suitable treatment methods, like biological treatments for organic-rich leachates. Remediation of landfill leachates involves a combination of physicochemical, biological, and integrated techniques. Physicochemical methods, such as coagulation/flocculation, chemical precipitation, and membrane filtration, are effective for removing recalcitrant organic substances and specific pollutants but can be costly and produce secondary pollution. Biological treatment, leveraging microorganisms, is cost-effective and widely used for young landfills with high biochemical oxygen demand (BOD)/ chemical oxygen demand (COD) ratios, though it is less efficient for mature leachates with non-biodegradable compounds. Integrated treatments, combining multiple processes, enhance efficiency, especially for complex and mature leachates, while anaerobic filter systems offer an environmentally friendly option for treating concentrated organic wastewater, despite challenges like long retention times and temperature sensitivity. Advanced membrane technologies, including nanofiltration and reverse osmosis, achieve high rejection rates for COD and heavy metals but face significant challenges such as high osmotic pressure and membrane fouling [54,56]. Small microplastics not removed by common filtration methods can be effectively removed by combining membrane filtration with suspended growth biological reactors, density separation, and advanced oxidation processes, while biotechnological techniques and constructed wetlands offer additional promising approaches for microplastic degradation and retrieval [35].
The recovery of our matrix-spiked standards varied among samples. A sample representing the site with the largest sediment particle size yielded 73.0% Pb recovery and 97.7% Cd recovery. The lower recoveries may be attributed to the larger particle size, since larger sediment particles have less surface area and lower tendency to bind heavy metals such as Pb and Cd [20]. The opposite is true for smaller sediment particle size, which is further reinforced by the increased yields for our fine sediment samples. The sample representing the site with the smallest sediment particle sizes yielded higher recoveries at 108.7% of Pb and 118.0% of Cd (Table 3). It is also possible that the observed outliers were due to natural variation, given that only one sample per site was processed and analyzed. Future studies could benefit from increased sample replication and the analysis of a broader range of potential contaminants.
5. Conclusions
ICP-OES instrumental analysis of surface water sediments downstream from potential pollution sources revealed elevated levels of heavy metals Cd and Pb compared to upstream sources. According to the ANZECC/ARMCANZ Sediment Quality Guidelines (2013), all Pb concentrations were above the 50 mg/kg minimum threshold, yet below the next threshold of 220 mg/kg, above which adverse effects to wildlife are most probable. Cd levels at all sample sites were lower than the minimum threshold value of 1.5 mg/kg, below which no further Cd testing is advised. However, as shown by analysis of the matrix-spiked standards, actual Cd and Pb levels may be higher than what was determined due to effects of sediment particle size. Cd was the highest in Site 2 with a concentration of 0.504 mg/kg, near a scrapyard. The highest concentration of Pb was found in Site 7 with a concentration of 104.85 mg/kg, just below the landfill. The cleanest sites were those upstream from major pollution sources, which had Pb and Cd concentrations of 50.53 - 64.46 and 0.146 - 0.154 mg/kg, respectively. Further evaluation is needed to address other pollution sources and additional harmful contaminants such as Cr (VI), Ra (226 & 228 isotopes), PFAS, and air pollution. The Roaring Brook and Little Roaring Brook should be continuously monitored to evaluate the changing presence of contaminants, to monitor the stream’s progress after the sediment release event, and to support enforcing tighter pollution controls.
Author Contributions
Conceptualization, S.B., T. M.; methodology, S.B. G.G.D.; software, S.B., T. M.; validation, S.B., T. M.; formal analysis, S.B., T. M, G.G.D.; investigation, S.B.; resources, S.B.; data curation, S.B., T. M; writing—original draft preparation, S.B., T. M; writing—review and editing, G.G.D.; visualization, S.B., T. M.; supervision, G.G.D.; project administration, G.G.D.; funding acquisition, G.G.D.. All authors have read and agreed to the published version of the manuscript.”
Funding
This research received no external funding
Data Availability Statement
Data can be found at the open-source link below: https://drive.google.com/drive/folders/1t-lyjusONTX3pnYU9tUhO85iiiPdzSWj?usp=sharing
Acknowledgments
We would like to acknowledge the assistance of Mr. Richard Trygar who facilitated the procurement of the chemicals needed for the project. We also acknowledge the facilities and equipment provided by the Department of Chemistry at the University of Scranton for making this work possible.
Conflicts of Interest
The authors declare no conflict of interest. The funders had no role in the design of the study; in the collection, analyses, or interpretation of data; in the writing of the manuscript, or in the decision to publish the results.
Appendix A
Figure A1.
A calibration curve of the Pb standard concentrations (parts per million) vs intensity. The linear equation is y=2069.3x+5686.8 and R2 = 0.9998.
Figure A1.
A calibration curve of the Pb standard concentrations (parts per million) vs intensity. The linear equation is y=2069.3x+5686.8 and R2 = 0.9998.
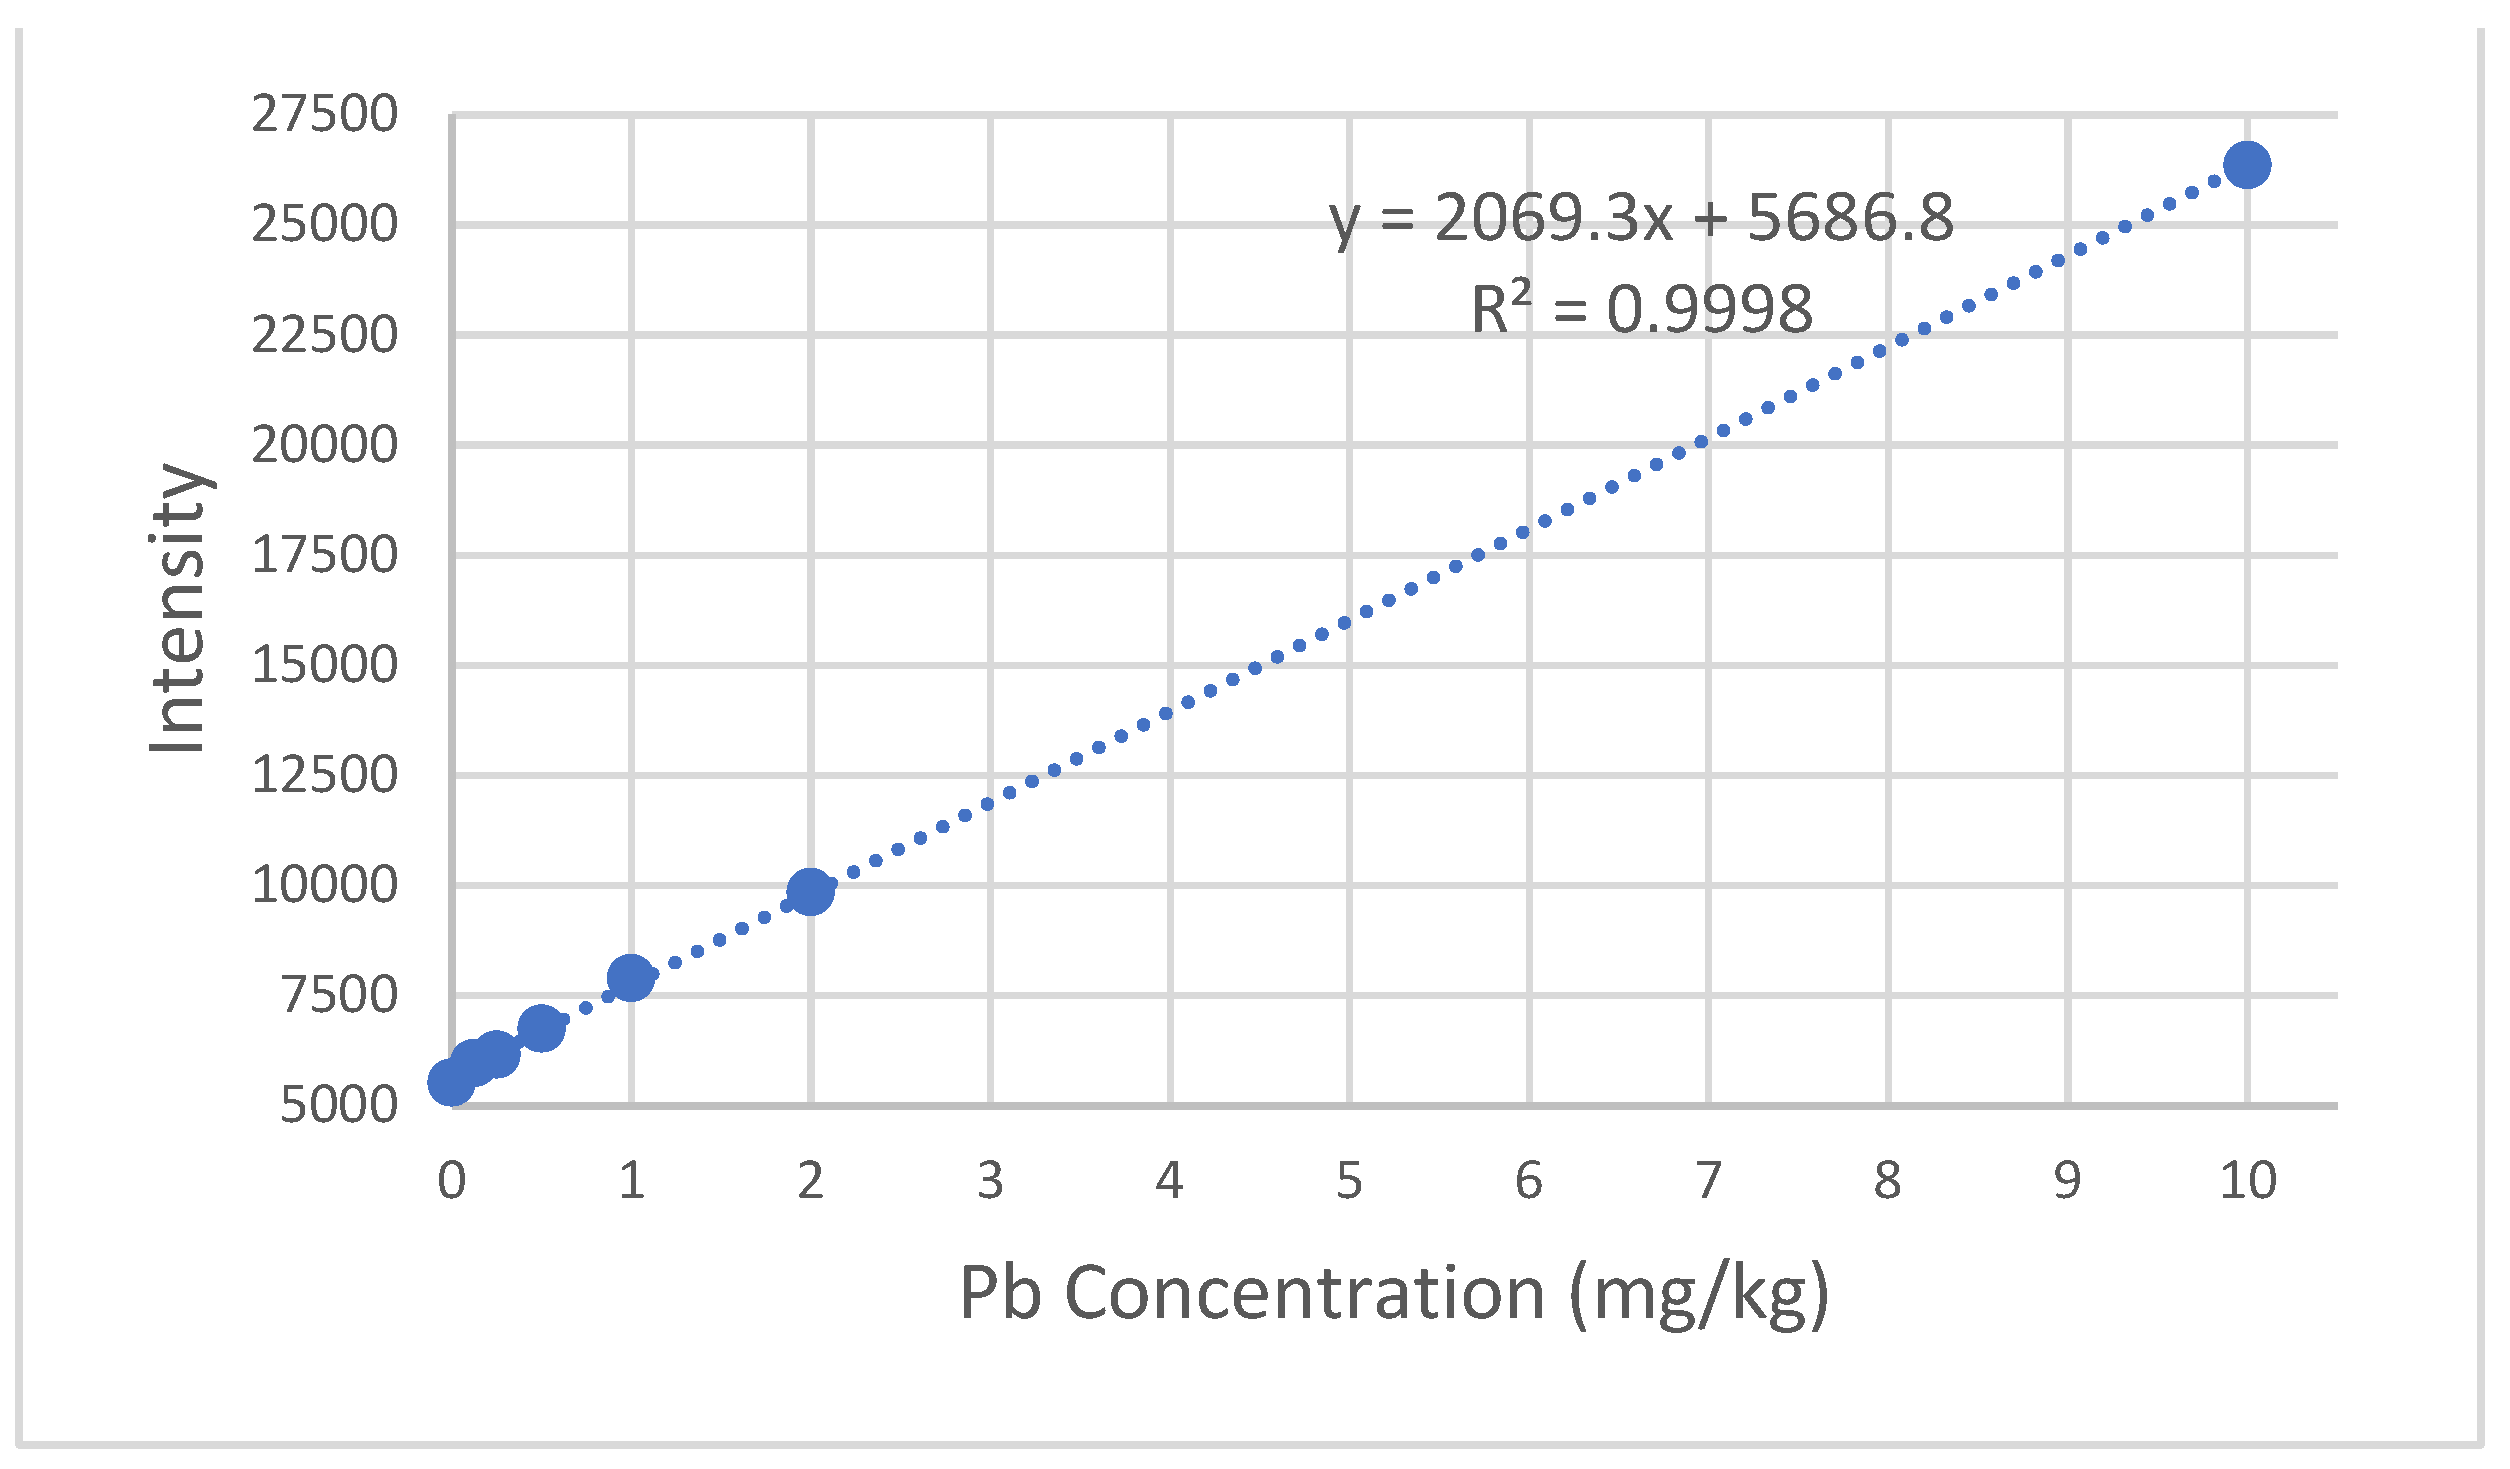
Figure A2.
A calibration curve of the Cd standard concentrations (parts per million) vs intensity. The linear equation is y=49943x+1853.6 and R2 = 0.9965.
Figure A2.
A calibration curve of the Cd standard concentrations (parts per million) vs intensity. The linear equation is y=49943x+1853.6 and R2 = 0.9965.
References
- Badertscher, L.M.; Hill, M.J.; Cantlay, T.; Stolz, J.F.; Bain, D.J. Elevated Sediment Radionuclide Concentrations Downstream of Facilities Treating Leachate from Landfills Accepting Oil and Gas Waste. Ecol. Indic. 2023, 154, 110616. [Google Scholar] [CrossRef]
- Lackawanna River Watershed TMDL Lackawanna, Luzerne, Susquehanna, and Wayne Counties; Pennsylvania Department of Environmental Protection, 2005. Available online: https://www.dep.state.pa.us/dep/deputate/watermgt/wqp/wqstandards/tmdl/LackawannaTMDL_FINAL.pdf.
- Lackawanna River at Old Forge, PA. Available online: https://waterdata.usgs.gov/monitoring-location/01536000/ (accessed on 2 November 2024).
- USGS 01535060 Roaring Brook at Scranton, PA Water Quality Data. Available online: https://nwis.waterdata.usgs.gov/pa/nwis/qwdata/?site_no=01535060&agency_cd=USGS&inventory_output=retrieval&rdb_inventory_output=value&TZoutput=0&pm_cd_compare=Greater%20than&radio_parm_cds=all_parm_cds&format=html_table&qw_attributes=0&qw_sample_wide=wide&rdb_qw_attributes=0&date_format=YYYY-MM-DD&rdb_compression=file&submitted_form=brief_list#water_quality_remark_code (accessed on 14 October 2024).
- United States v. Pennsylvania Environmental Hearing Bd., 431 F. Supp. 747 | M.D. Pa., Judgment, Law, casemine.com. Available online: https://www.casemine.com. https://www.casemine.com/judgement/us/5e771a694653d01d86c4cb11 (accessed on 15 May 2024).
- Final preliminary assessment and site inspection of per- and polyfluoroalkyl substances (Scranton Army Ammunition Plant, Pennsylvania); 30001997; Arcadis U.S., Inc., 2022. Available online: https://aec.army.mil/aec/7616/8441/4074/Scranton_AAP_PFAS_PA_SI.pdf.
- Sustainable Oyster Aquaculture, Water Quality Improvement, and Ecosystem Service Value Potential in Maryland Chesapeake Bay. Available online: https://bioone.org/journals/journal-of-shellfish-research/volume-39/issue-2/035.039.0208/Sustainable-Oyster-Aquaculture-Water-Quality-Improvement-and-Ecosystem-Service-Value/10.2983/035.039.0208.full (accessed on 2 November 2024).
- Ali, H.; Khan, E.; Ilahi, I. Environmental Chemistry and Ecotoxicology of Hazardous Heavy Metals: Environmental Persistence, Toxicity, and Bioaccumulation. J. Chem. 2019, 2019, e6730305. [Google Scholar] [CrossRef]
- Toxicological Profile for Cadmium (ATSDR); US Department of Health and Human Services Public Health Service Agency for Toxic Substances and Disease Registry, 2012.
- Toxicological Profile for Lead (ATSDR); US Department of Health and Human Services Public Health Service Agency for Toxic Substances and Disease Registry, 2020.
- Needleman, H. Lead Poisoning. Annu. Rev. Med. 2004, 55, 209–222. [Google Scholar] [CrossRef] [PubMed]
- Gidlow, D.A. Lead Toxicity. Occup. Med. 2015, 65, 348–356. [Google Scholar] [CrossRef] [PubMed]
- Bellinger, D.C. Very Low Lead Exposures and Children’s Neurodevelopment. Curr. Opin. Pediatr. 2008, 20, 172–177. [Google Scholar] [CrossRef]
- Environmental Contaminants in Biota: Interpreting Tissue Concentrations, Second Edition, 2nd ed. ; Beyer, W.N., Meador, J.P., Eds.; CRC Press: Boca Raton, 2011. [Google Scholar] [CrossRef]
- Satarug, S.; Garrett, S.H.; Sens, M.A.; Sens, D.A. Cadmium, Environmental Exposure, and Health Outcomes. Environ. Health Perspect. 2010, 118, 182–190. [Google Scholar] [CrossRef]
- Nordberg, G.F.; Nogawa, K.; Nordberg, M.; Friberg, L.T. Chapter 23 - Cadmium. In Handbook on the Toxicology of Metals (Third Edition); Nordberg, G.F., Fowler, B.A., Nordberg, M., Friberg, L.T., Eds.; Academic Press: Burlington, 2007; pp. 445–486. [CrossRef]
- Rainbow, P.S. Trace Metal Concentrations in Aquatic Invertebrates: Why and so What? Environ. Pollut. 2002, 120, 497–507. [Google Scholar] [CrossRef]
- Wetzel, R.G. 21 - Sediments and Microflora. In Limnology (Third Edition); Wetzel, R.G., Ed.; Academic Press: San Diego, 2001; pp. 631–664. [Google Scholar] [CrossRef]
- Heavy Metals in Soils: Trace Metals and Metalloids in Soils and Their Bioavailability; Alloway, B.J., Ed.; Environmental Pollution; Springer Netherlands: Dordrecht, 2013; Vol. 22. [CrossRef]
- Förstner, U.; Wittmann, G.T.W. Metal Pollution in the Aquatic Environment; Springer: Berlin, Heidelberg, 1981. [Google Scholar] [CrossRef]
- Hameed, M.; Dijoo, Z.K.; Bhat, R.A.; Qayoom, I. Concerns and Threats of Heavy Metals’ Contamination on Aquatic Ecosystem. In Bioremediation and Biotechnology, Vol 4: Techniques for Noxious Substances Remediation; Bhat, R.A., Hakeem, K.R., Eds.; Springer International Publishing: Cham, 2020. [Google Scholar] [CrossRef]
- Simpson, S.L.; Batley, G.E.; Chariton, A.A. Revision of the ANZECC/ARMCANZ Sediment Quality Guidelines; CSIRO, 2013. [CrossRef]
- Du Laing, G.; Rinklebe, J.; Vandecasteele, B.; Meers, E.; Tack, F.M.G. Trace Metal Behaviour in Estuarine and Riverine Floodplain Soils and Sediments: A Review. Sci. Total Environ. 2009, 407, 3972–3985. [Google Scholar] [CrossRef]
- DEP investigates sediment in Roaring Brook Creek. Available online: https://www.yahoo.com/news/dep-investigates-sediment-roaring-brook-204559231.html (accessed on 11 May 2024).
- Dam repairs impair local waterways. WVIA Public Media. Available online: https://www.wvia.org/news/local/2024-02-09/dam-repairs-impair-local-waterways (accessed on 11 May 2024).
- DEP study: Dam sediment pollution significantly impaired Roaring Brook | News | thetimes-tribune.com. Available online: https://www.thetimes-tribune.com/news/dep-study-dam-sediment-pollution-significantly-impaired-roaring-brook/article_36d58804-320e-5c9c-aadb-c611e678e7af.html (accessed on 23 June 2024).
- Pizzuto, J. Effects of Dam Removal on River Form and Process: Although Many Well-Established Concepts of Fluvial Geomorphology Are Relevant for Evaluating the Effects of Dam Removal, Geomorphologists Remain Unable to Forecast Stream Channel Changes Caused by the Removal of Specific Dams. BioScience 2002, 52, 683–691. [Google Scholar] [CrossRef]
- Illegal Dumping in Pennsylvania - A Decade of Discovery; Keep Pennsylvania Beautiful, 2014. Available online: https://www.keeppabeautiful.org/wp-content/uploads/2021/08/KPB-Recommendations-August-2014-USE-THIS-ONE.pdf.
- Lough, G.C.; Schauer, J.J.; Park, J.-S.; Shafer, M.M.; DeMinter, J.T.; Weinstein, J.P. Emissions of Metals Associated with Motor Vehicle Roadways. Environ. Sci. Technol. 2005, 39, 826–836. [Google Scholar] [CrossRef] [PubMed]
- Jaradat, Q.; Massadeh, A.; Zaitoun, M.; Maaitah, B. Heavy Metal Contamination of Soil, Plant and Air of Scrapyard of Discarded Vehicles at Zarqa City, Jordan. Soil Sediment Contam. 2005, 14, 449–462. [Google Scholar] [CrossRef]
- Ojekunle, O.Z.; Ojekunle, O.V.; Adeyemi, A.A.; Taiwo, A.G.; Sangowusi, O.R.; Taiwo, A.M.; Adekitan, A.A. Evaluation of Surface Water Quality Indices and Ecological Risk Assessment for Heavy Metals in Scrap Yard Neighbourhood. SpringerPlus 2016, 5, 560. [Google Scholar] [CrossRef] [PubMed]
- Christensen, T.H.; Kjeldsen, P.; Bjerg, P.L.; Jensen, D.L.; Christensen, J.B.; Baun, A.; Albrechtsen, H.-J.; Heron, G. Biogeochemistry of Landfill Leachate Plumes. Appl. Geochem. 2001, 16, 659–718. [Google Scholar] [CrossRef]
- Singh, S.; Raju, N.J.; Gossel, W.; Wycisk, P. Assessment of Pollution Potential of Leachate from the Municipal Solid Waste Disposal Site and Its Impact on Groundwater Quality, Varanasi Environs, India. Arab. J. Geosci. 2016, 9, 131. [Google Scholar] [CrossRef]
- Rogers, E.R.; Zalesny, R.S.; Lin, C.-H. A Systematic Approach for Prioritizing Landfill Pollutants Based on Toxicity: Applications and Opportunities. J. Environ. Manage. 2021, 284, 112031. [Google Scholar] [CrossRef]
- Microplastics in landfill leachates: The need for reconnaissance studies and remediation technologies - ScienceDirect. Available online: https://www.sciencedirect.com/science/article/pii/S2666016420300700?via%3Dihub (accessed on 20 June 2024).
- US Environmental Protection Agency. Our Current Understanding of the Human Health and Environmental Risks of PFAS. Available online: https://www.epa.gov/pfas/our-current-understanding-human-health-and-environmental-risks-pfas (accessed on 19 June 2024).
- Impact on Health of Emissions from Landfill Sites; Radiation, Chemical, and Environmental Hazards; Health Protection Agency (UK), 2011.
- Environmental Assessment Keystone Sanitary Landfill Major Permit Modification - Phase III Site Development, 2019. Available online: https://files.dep.state.pa.us/RegionalResources/NERO/NEROPortalFiles/CommunityInformation/Keystone/KSL%208July2019%20Final%20EA.pdf.
- Impacts on health of emissions from landfill sites. GOV.UK. Available online: https://www.gov.uk/government/publications/landfill-sites-impact-on-health-from-emissions/impacts-on-health-of-emissions-from-landfill-sites.
- Parvin, F.; Tareq, S.M. Impact of Landfill Leachate Contamination on Surface and Groundwater of Bangladesh: A Systematic Review and Possible Public Health Risks Assessment. Appl. Water Sci. 2021, 11, 100. [Google Scholar] [CrossRef] [PubMed]
- Ward, M.L.; Bitton, G.; Townsend, T.; Booth, M. Determining Toxicity of Leachates from Florida Municipal Solid Waste Landfills Using a Battery-of-Tests Approach. Environ. Toxicol. 2002, 17, 258–266. [Google Scholar] [CrossRef]
- Ogundiran, O.O.; Afolabi, T.A. Assessment of the Physicochemical Parameters and Heavy Metals Toxicity of Leachates from Municipal Solid Waste Open Dumpsite. Int. J. Environ. Sci. Technol. 2008, 5, 243–250. [Google Scholar] [CrossRef]
- Method 3050B: Acid digestion of sediments, sludges, and soils, 1996. Available online: https://www.epa.gov/sites/default/files/2015-06/documents/epa-3050b.pdf.
- Khan, J.; Shrivastava, R.; Gupta, G.; Singh, N.K. Heavy Metal Contamination in Groundwater: Environmental Concerns and Mitigation Measures. In Heavy Metal Toxicity: Environmental Concerns, Remediation and Opportunities; Singh, R.P., Singh, P., Srivastava, A., Eds.; Springer Nature: Singapore, 2023; pp. 139–165. [Google Scholar] [CrossRef]
- Ergene, D.; Aksoy, A.; Dilek Sanin, F. Comprehensive Analysis and Modeling of Landfill Leachate. Waste Manag. 2022, 145, 48–59. [Google Scholar] [CrossRef]
- Lackawanna | Pennsylvania County Health Profiles, 2022. Available online: https://www.health.pa.gov/topics/HealthStatistics/VitalStatistics/CountyHealthProfiles/Documents/current/lackawanna.aspx.
- United States Geological Survey 01535060 Roaring Brook at Scranton, PA Water Quality Data. Available online: https://nwis.waterdata.usgs.gov/pa/nwis/qwdata?site_no=01535060&agency_cd=USGS&format=inventory (accessed on 15 May 2024).
- Coetzee, J.J.; Bansal, N.; Chirwa, E.M.N. Chromium in Environment, Its Toxic Effect from Chromite-Mining and Ferrochrome Industries, and Its Possible Bioremediation. Expo. Health 2020, 12, 51–62. [Google Scholar] [CrossRef]
- Zupančič, M.; Justin, M.Z.; Bukovec, P.; Šelih, V.S. Chromium in Soil Layers and Plants on Closed Landfill Site after Landfill Leachate Application. Waste Manag. 2009, 29, 1860–1869. [Google Scholar] [CrossRef] [PubMed]
- M, C.; Cb, K. Toxicity and Carcinogenicity of Chromium Compounds in Humans. PubMed.
- US Environmental Protection Agency. Radionuclide Basics: Radium. Available online: https://www.epa.gov/radiation/radionuclide-basics-radium (accessed on 18 June 2024).
- Radium | Toxicological Profile | ATSDR. Available online: https://wwwn.cdc.gov/TSP/ToxProfiles/ToxProfiles.aspx?id=791&tid=154 (accessed on 18 June 2024).
- Radium in the environment: Exposure pathways and health effects | Request PDF. Available online: https://www.researchgate.net/publication/228111015_Radium_in_the_environment_Exposure_pathways_and_health_effects (accessed on 18 June 2024).
- Al-Balushi, F.; Ibrahim, O.; Rajamohan, N. Sustainable Treatment of Landfill Leachate: A Review on Methods. Int. J. Environ. Sci. Technol. 2024. [Google Scholar] [CrossRef]
- Wdowczyk, A.; Szymańska-Pulikowska, A. Comparison of Landfill Leachate Properties by LPI and Phytotoxicity-A Case Study. Front. Environ. Sci. 2021, 9. [Google Scholar] [CrossRef]
- Perspectives on technology for landfill leachate treatment - ScienceDirect. Available online: https://www.sciencedirect.com/science/article/pii/S1878535213003298?via%3Dihub (accessed on 20 June 2024).
Figure 1.
The junction of Roaring Brook and Lackawanna River in Scranton, PA. On the right, sediment-loaded water from Roaring Brook is distinguished from Lackawanna River's water. (3/1/2024).
Figure 1.
The junction of Roaring Brook and Lackawanna River in Scranton, PA. On the right, sediment-loaded water from Roaring Brook is distinguished from Lackawanna River's water. (3/1/2024).
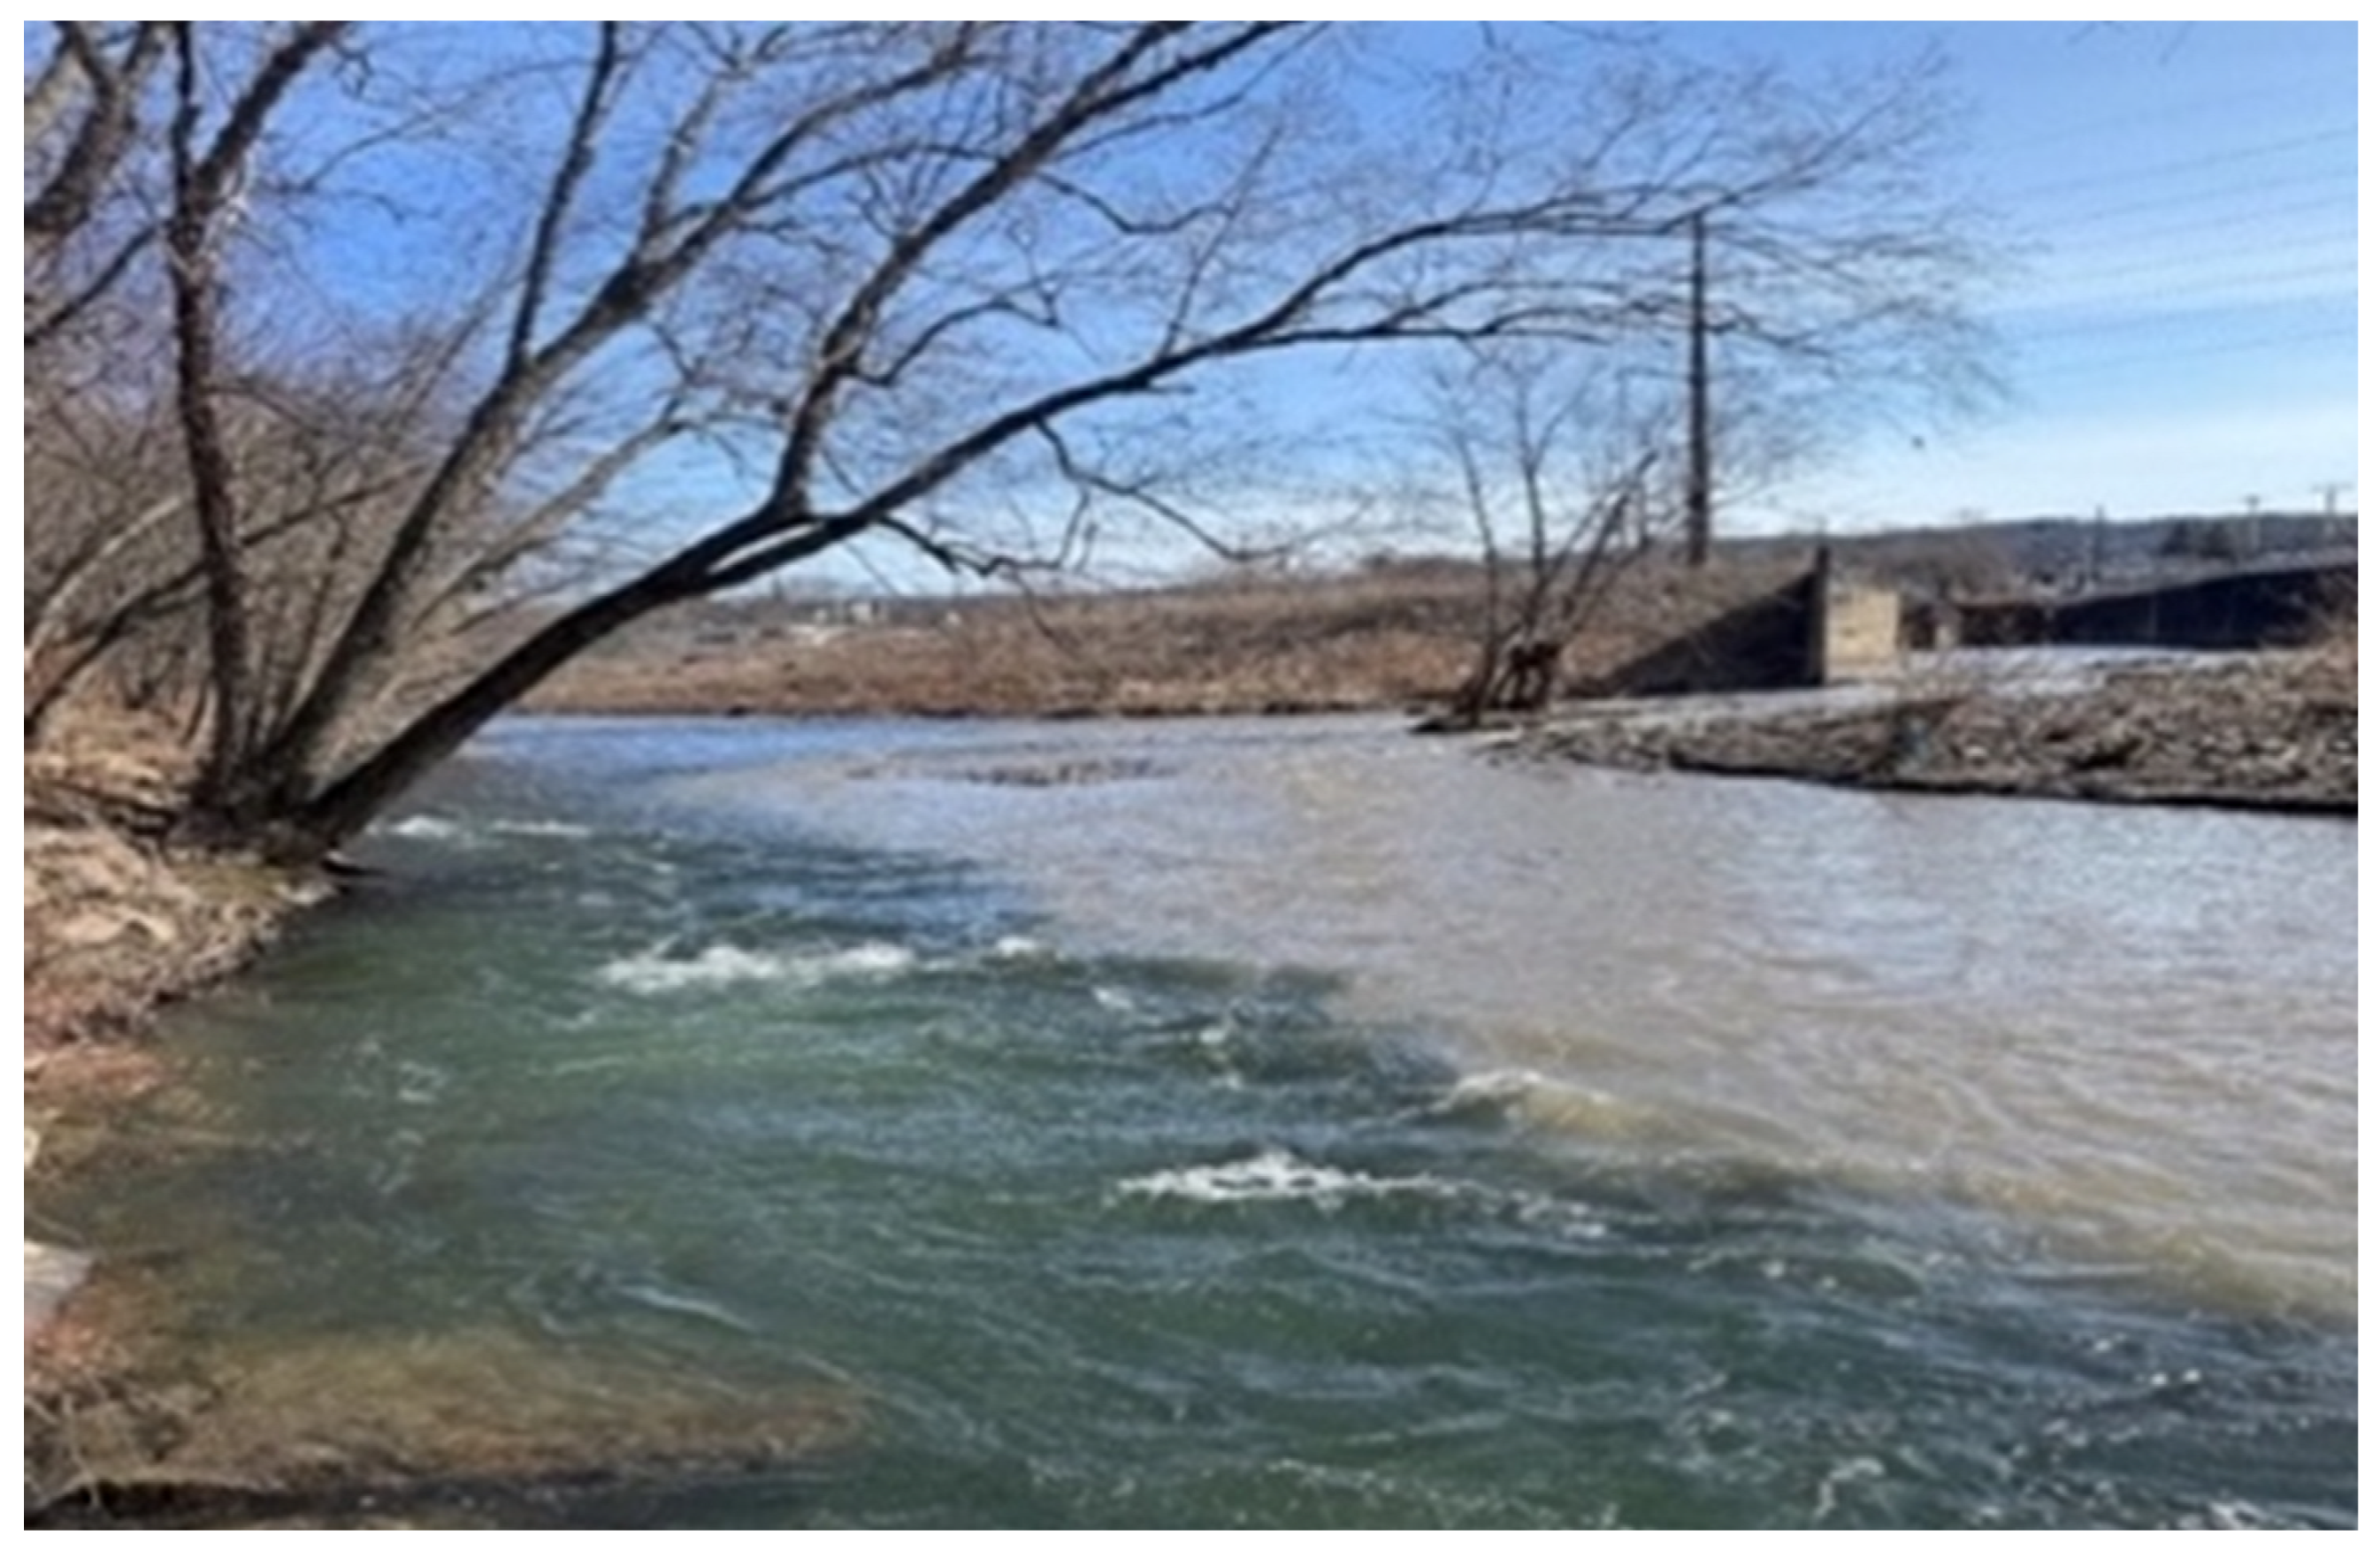
Figure 2.
Map of surface water sediment sample locations and potential sources of pollution (coordinates and detailed descriptions in Table 1).
Figure 2.
Map of surface water sediment sample locations and potential sources of pollution (coordinates and detailed descriptions in Table 1).
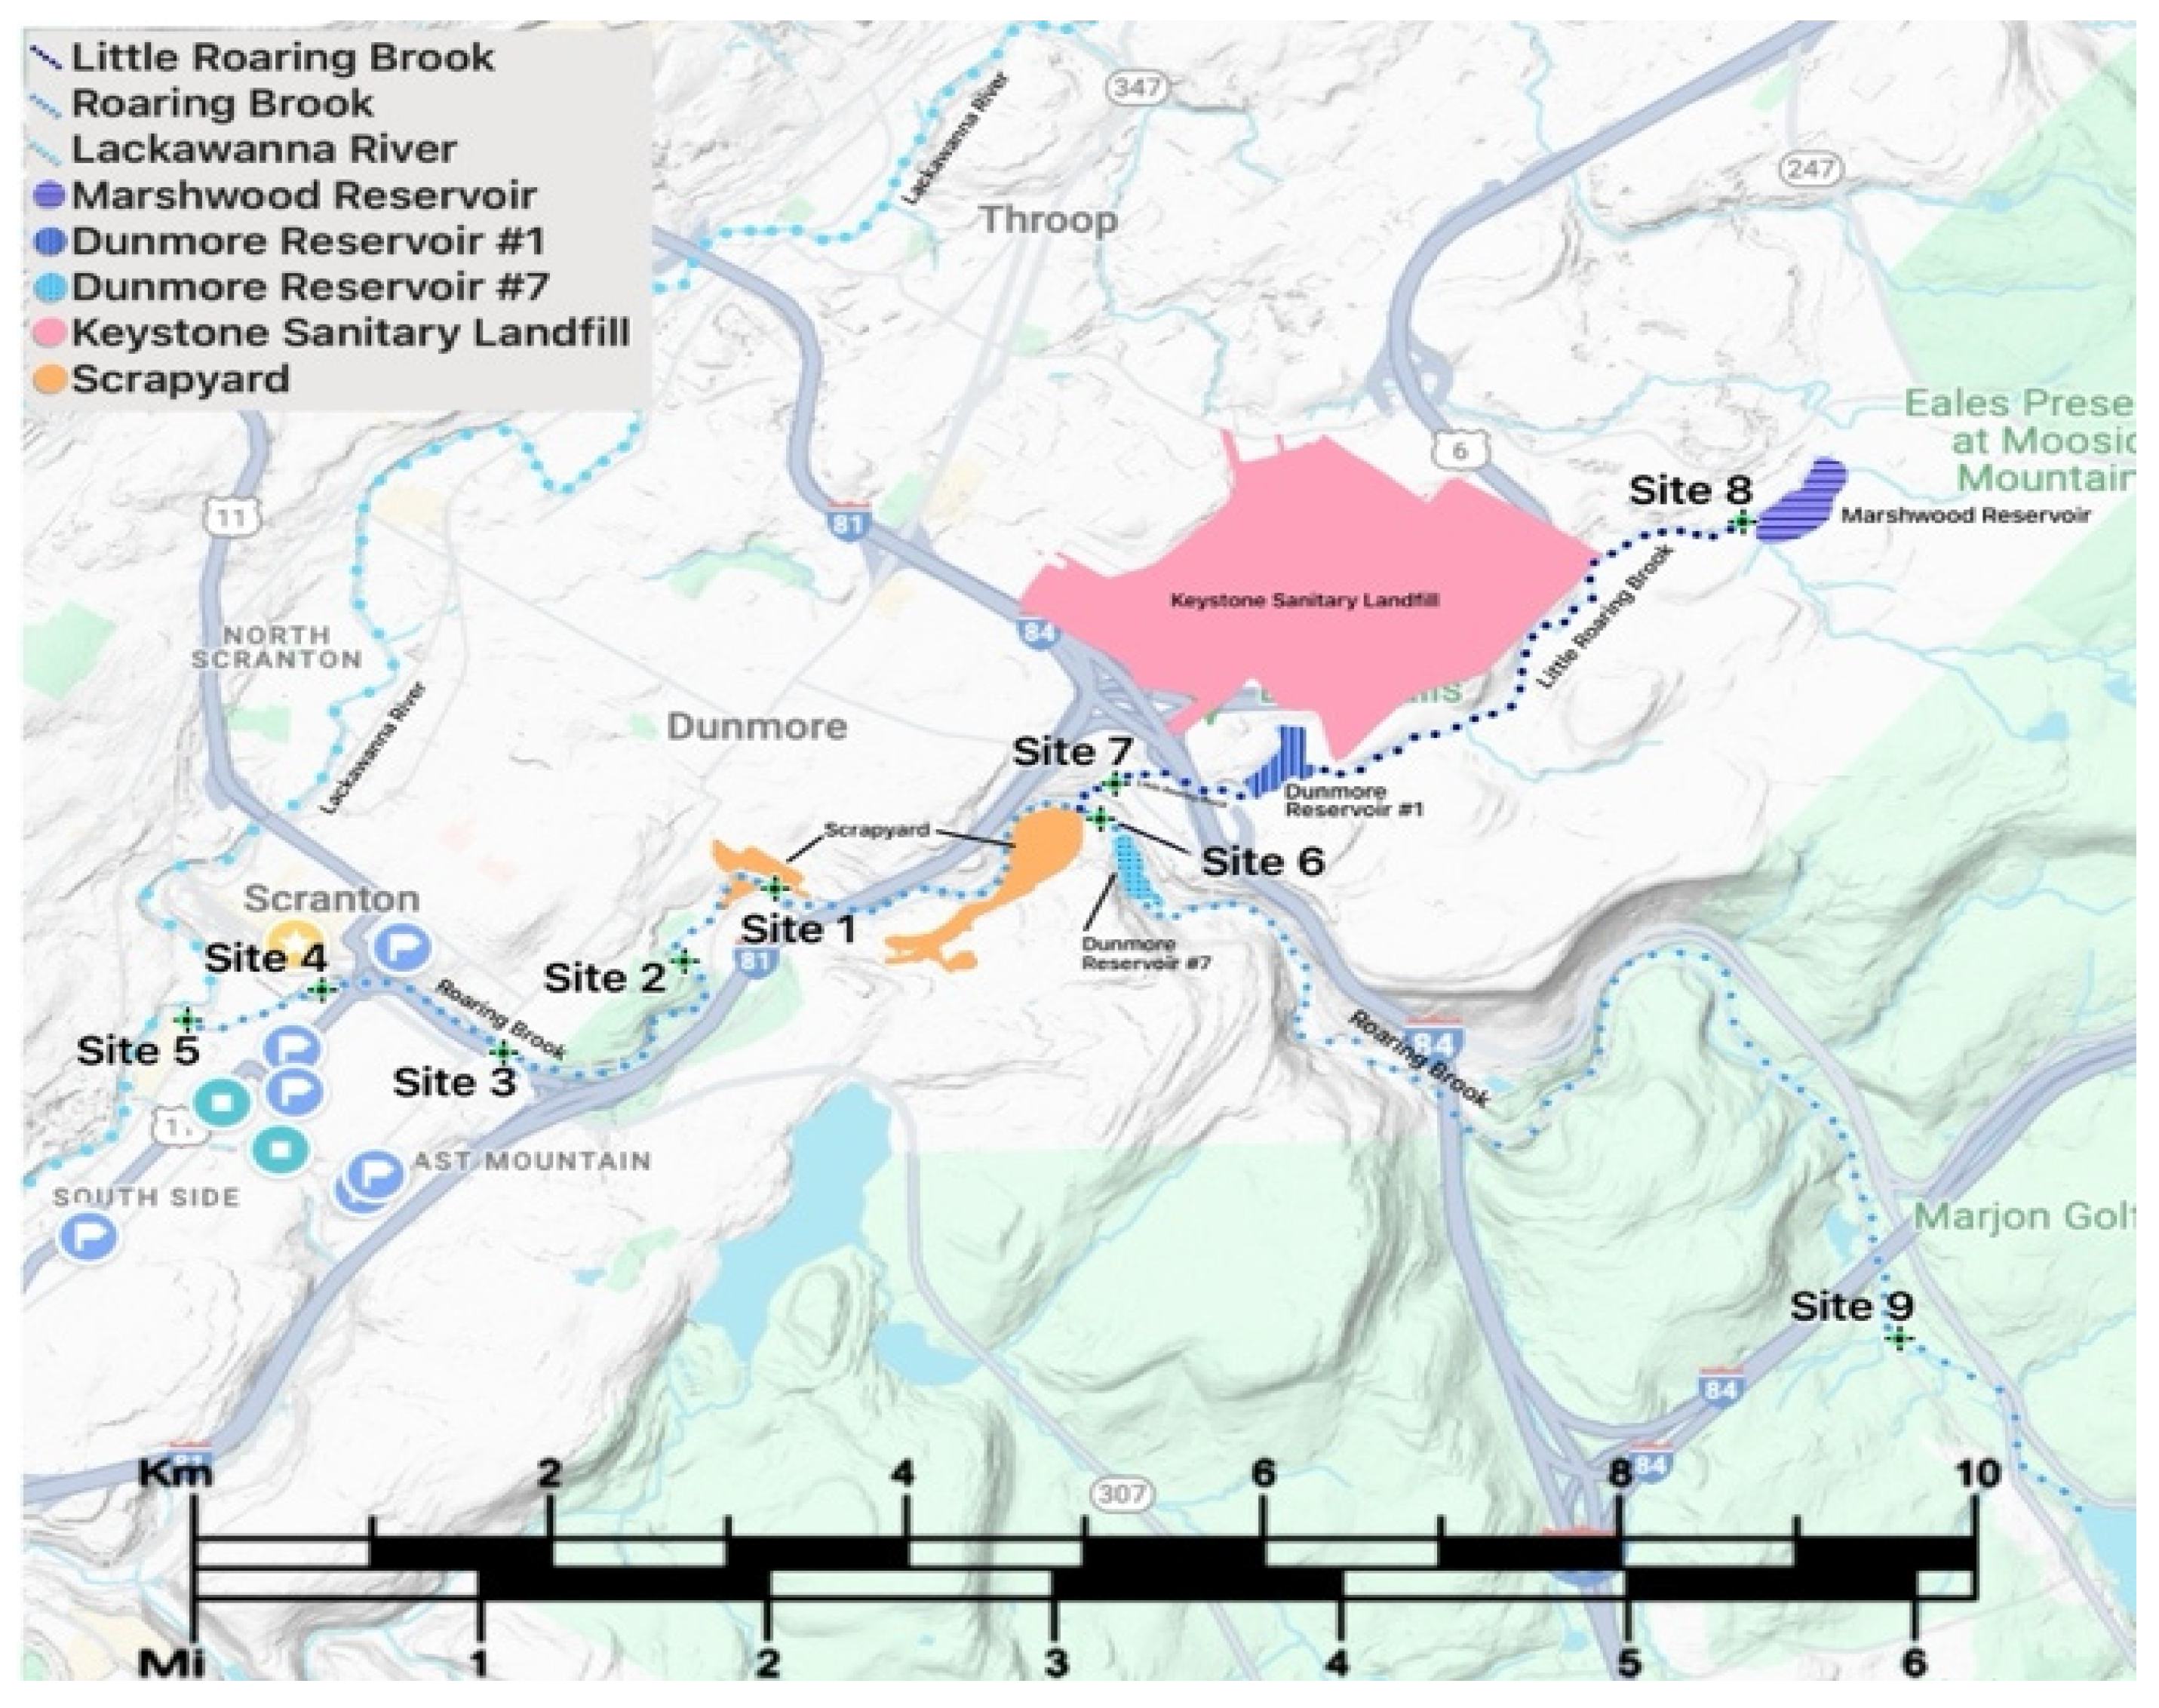
Figure 3.
Satellite image showing the proximity of KSL (Keystone Sanitary Landfill) to Dunmore Reservoir Number One. KSL’s property is outlined and shaded orange (map scale bottom right).
Figure 3.
Satellite image showing the proximity of KSL (Keystone Sanitary Landfill) to Dunmore Reservoir Number One. KSL’s property is outlined and shaded orange (map scale bottom right).
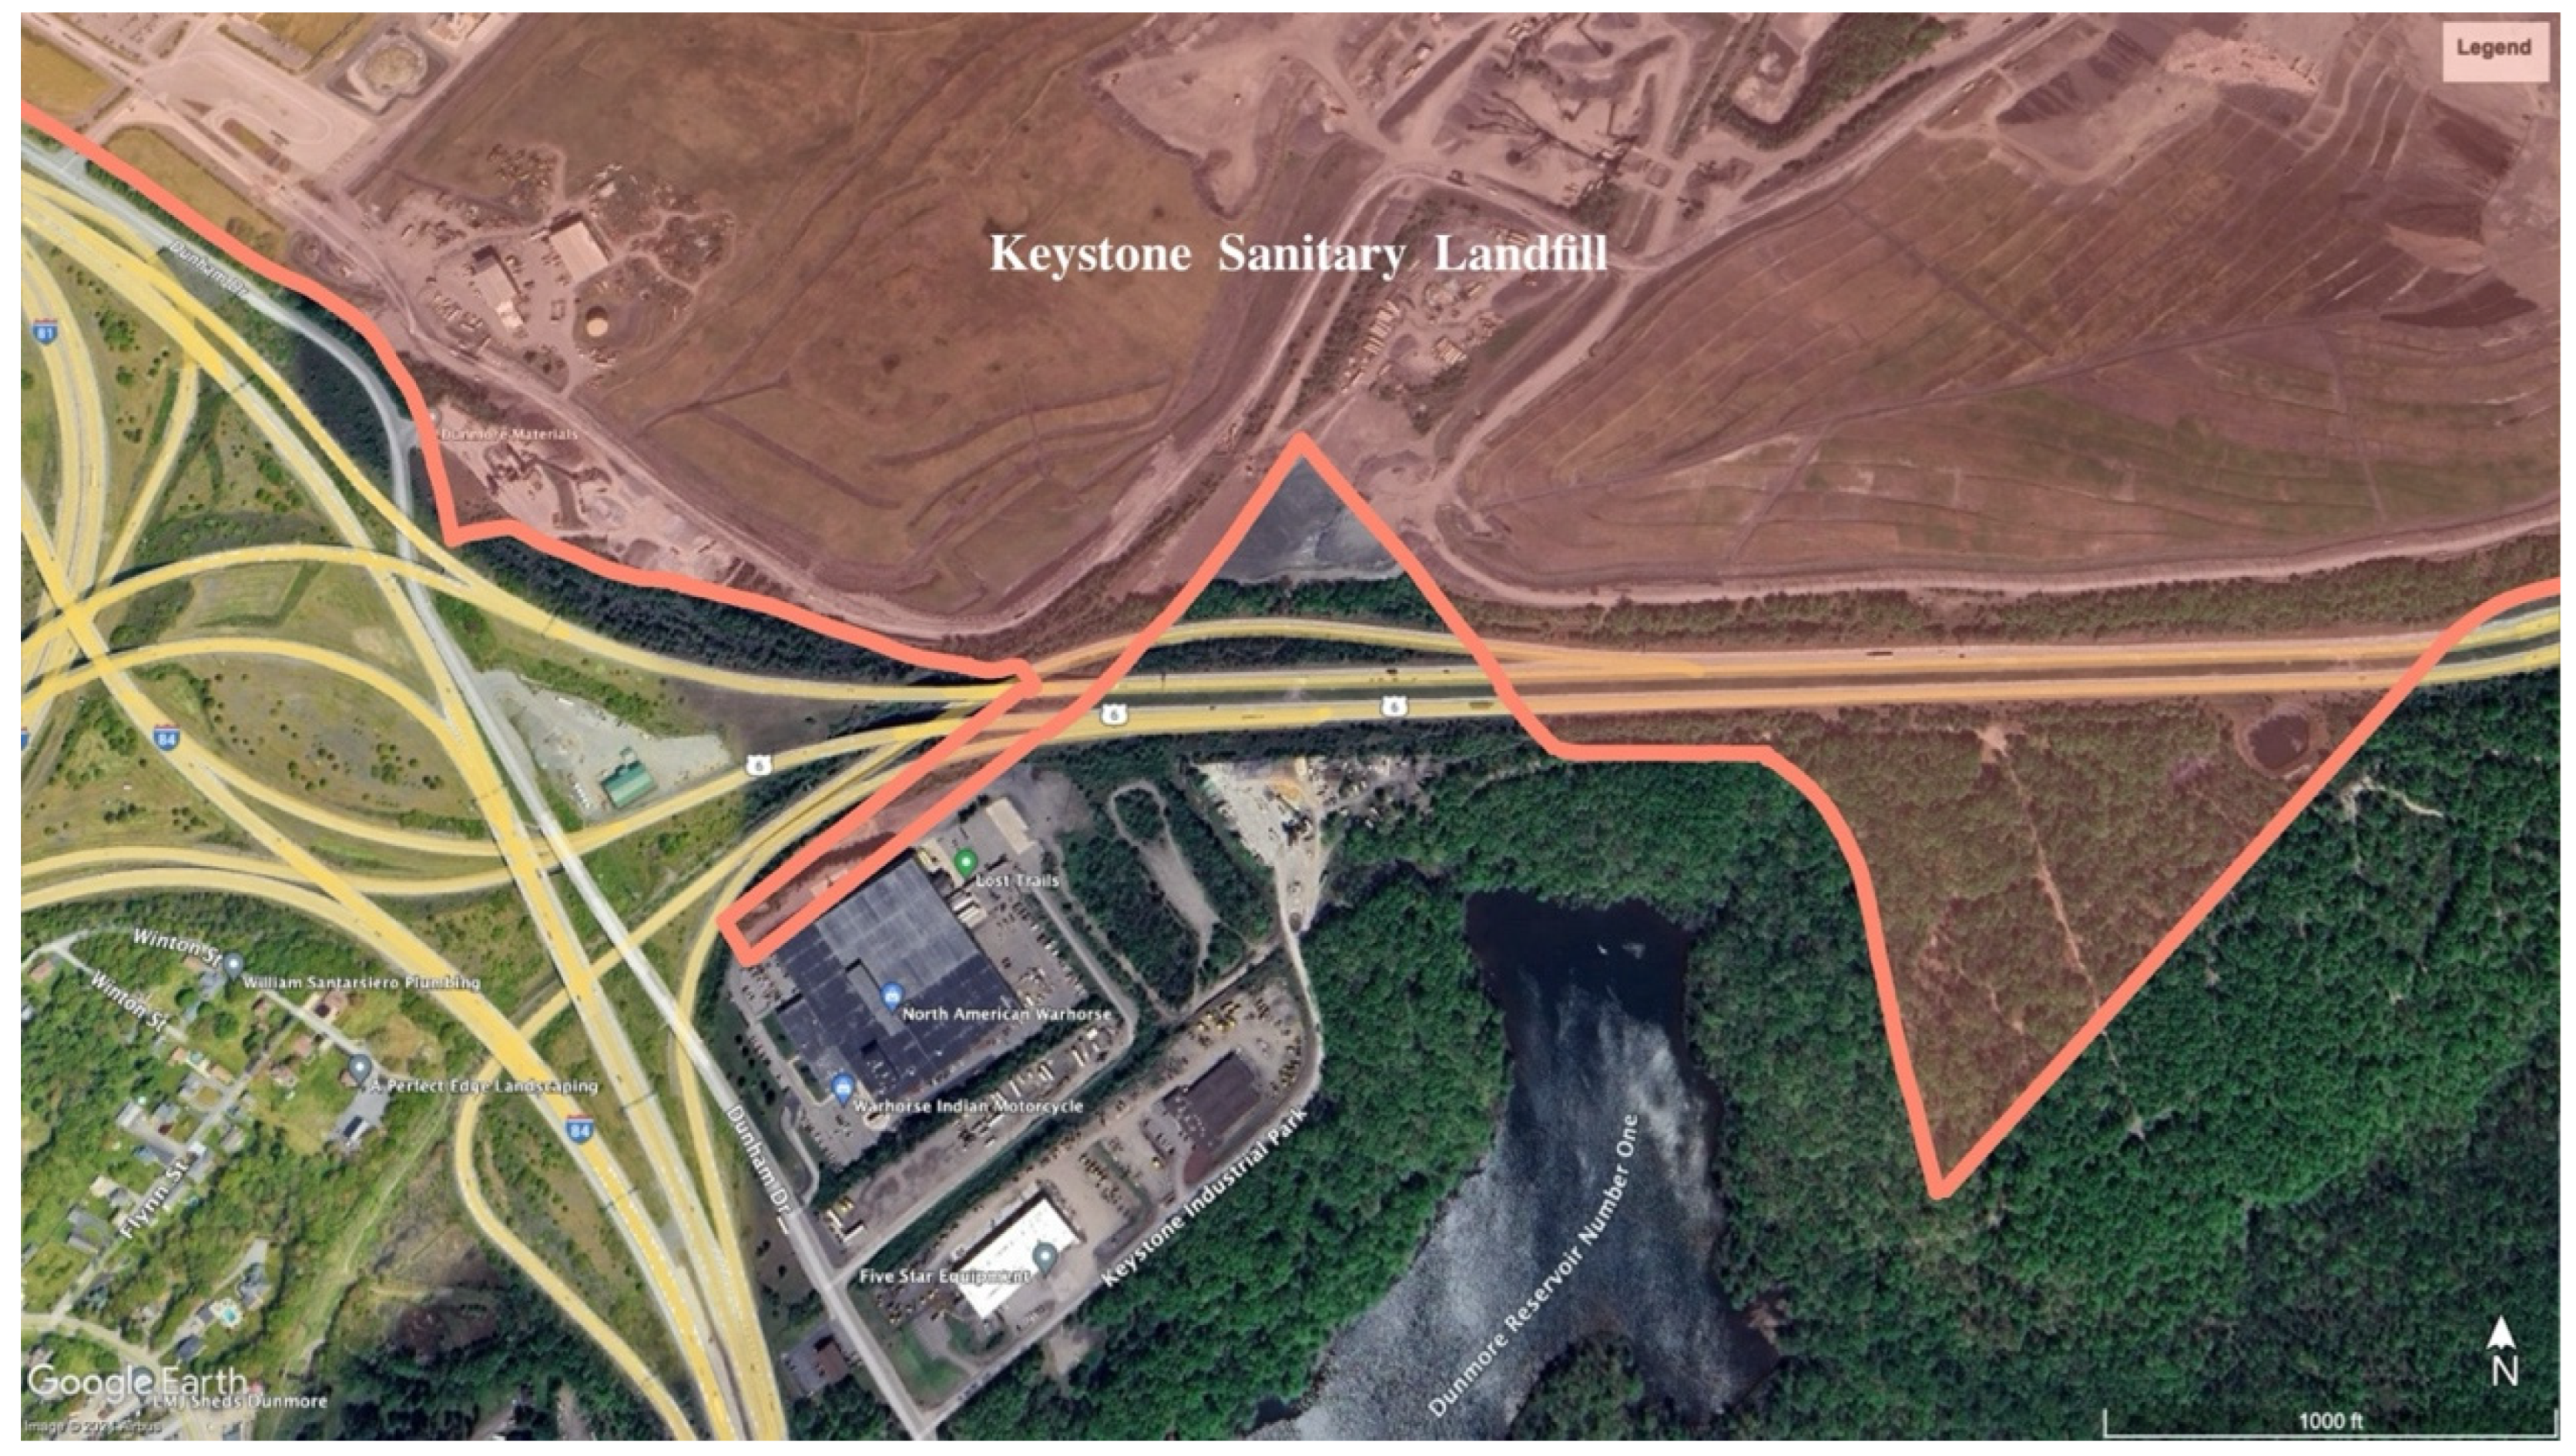
Figure 4.
Satellite image showing the proximity of the salvage yard to Roaring Brook. The salvage yard is outlined and highlighted in orange (map scale bottom right).
Figure 4.
Satellite image showing the proximity of the salvage yard to Roaring Brook. The salvage yard is outlined and highlighted in orange (map scale bottom right).
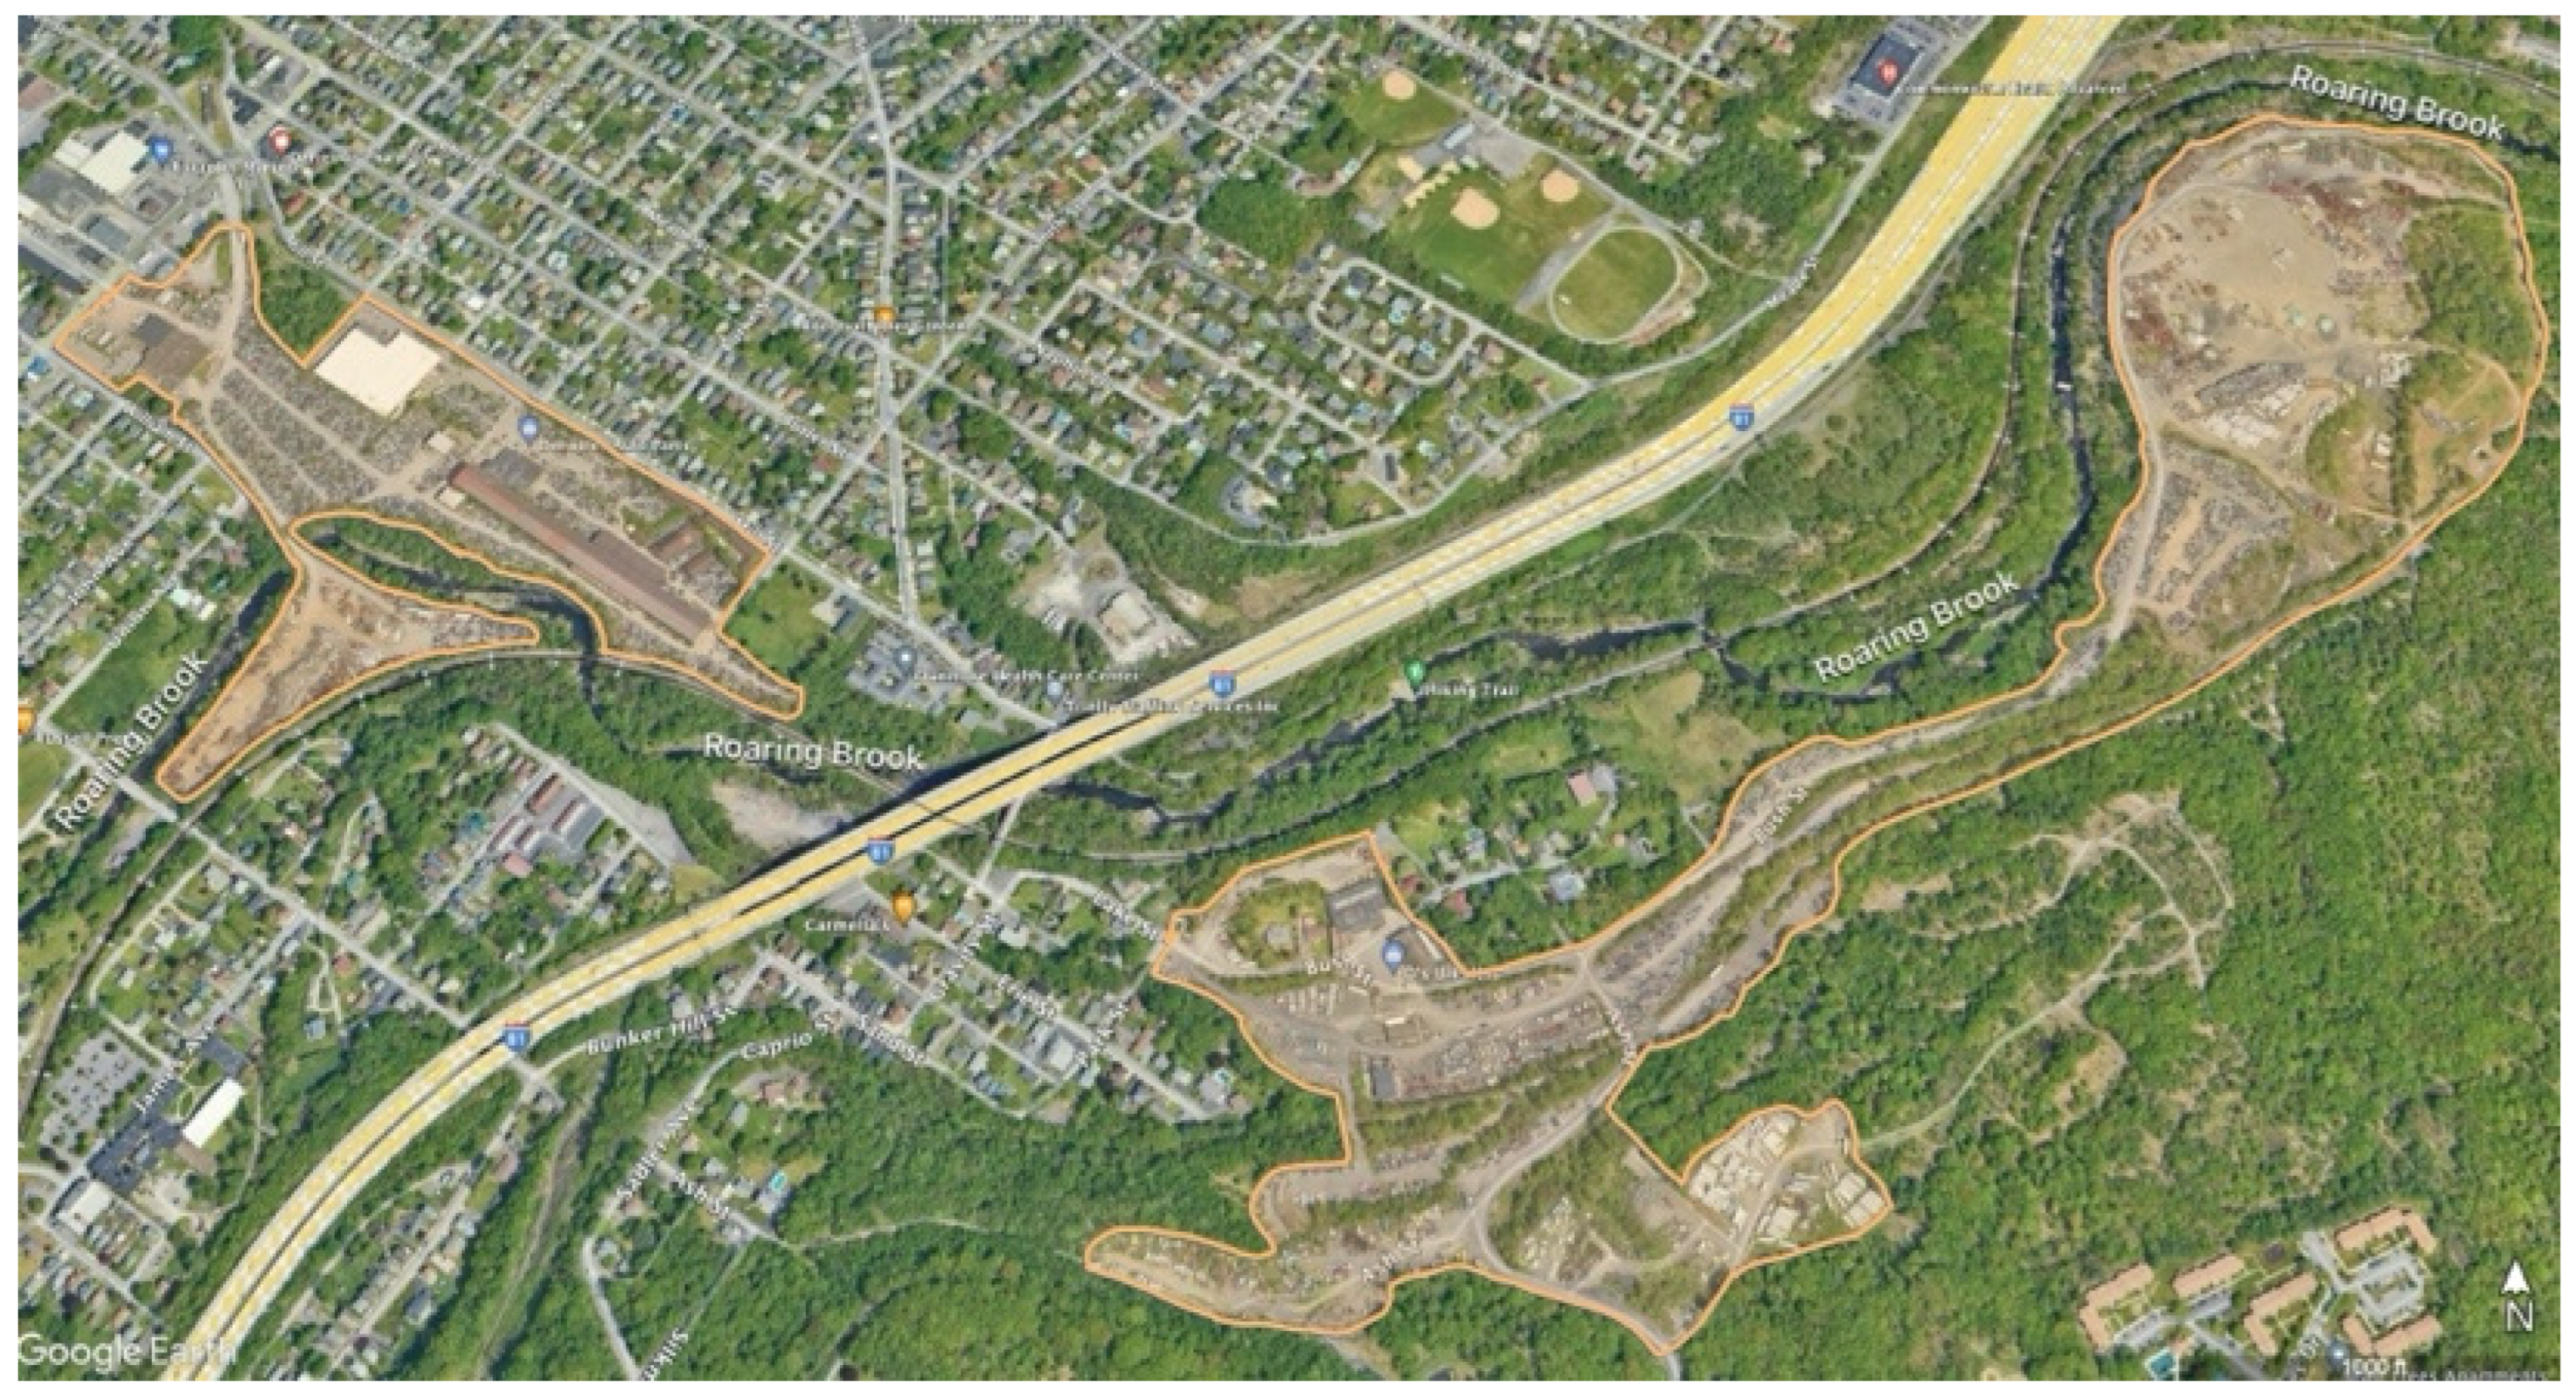
Figure 5.
The nine sample sites along Roaring Brook and Little Roaring Brook (sites 1-5: Roaring Brook, Scranton, PA; site 6: Roaring Brook, below Reservoir # 7; Dunmore, PA; site 7: Little Roaring Brook, below Reservoir #1, Dunmore, PA; site 8: Little Roaring Brook below Marshwood Reservoir, Olyphant, PA; site 9: Roaring Brook, Elmhurst, PA).
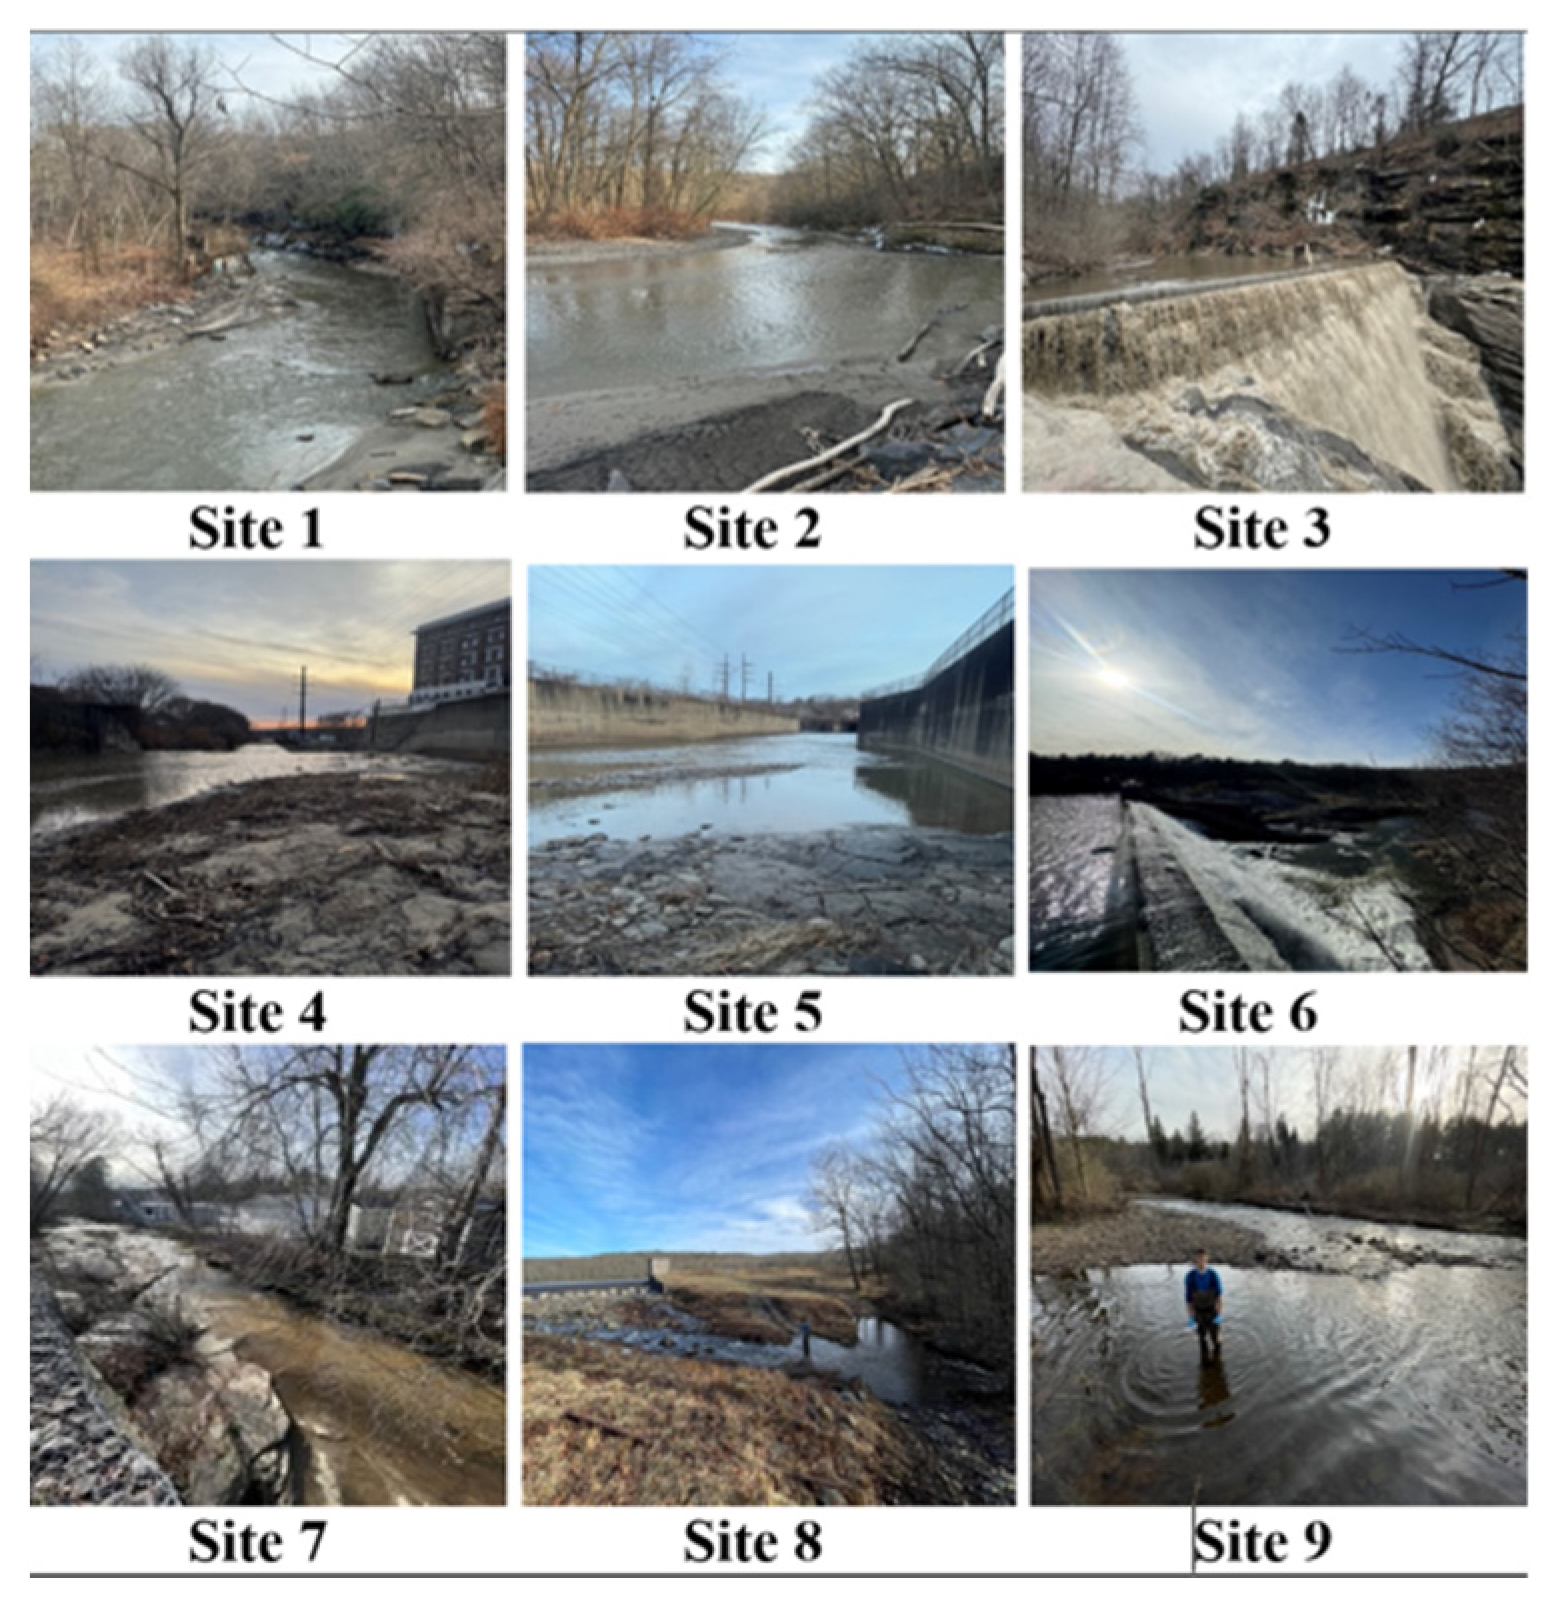

Table 1.
surface water sediment sample locations with coordinates.
| Site | Sample Site Location | Coordinates |
|---|---|---|
| 1 | Roaring Brook, Scranton, PA | 41°24'32"N, 75°37'50"W |
| 2 | Roaring Brook, Scranton, PA | 41°24'16"N, 75°38'14"W |
| 3 | Roaring Brook, Scranton, PA | 41°23'56"N, 75°38'57"W |
| 4 | Roaring Brook, Scranton, PA | 41°24'10"N, 75°39'52"W |
| 5 | Roaring Brook, Scranton, PA | 41°24'06"N, 75°40'24"W |
| 6 | Roaring Brook, below Reservoir # 7, Dunmore, PA | 41°24'48"N, 75°36'25"W |
| 7 | Little Roaring Brook, below Reservoir #1, Dunmore, PA | 41°24'57"N, 75°36'29"W |
| 8 | Little Roaring Brook below Marshwood Reservoir, Olyphant, PA | 41°25'58"N, 75°33'44"W |
| 9 | Roaring Brook, Elmhurst, PA | 41°22'45"N, 75°32'53"W |
Table 2.
The determined Lead (Pb) and Cadmium (Cd) concentrations in mg of analyte per kg of sediment for sediment samples.
Table 2.
The determined Lead (Pb) and Cadmium (Cd) concentrations in mg of analyte per kg of sediment for sediment samples.
| Sample Number | Pb Concentration (mg/kg) | Cd Concentration (mg/kg) |
|---|---|---|
| S1 | 65.28 | 0.451 |
| S2 | 77.06 | 0.504 |
| S3 | 70.05 | 0.426 |
| S4 | 74.61 | 0.411 |
| S5 | 72.37 | 0.482 |
| S6 | 80.34 | 0.466 |
| S7 | 104.85 | 0.346 |
| S8 | 50.53 | 0.146 |
| S9 | 64.46 | 0.154 |
| S10 | 240.36 | 4.575 |
| S11 | 222.36 | 3.756 |
Table 3.
Percent Recovery of Lead (Pb) and Cadmium (Cd) from matrix-spiked standards. This demonstrates the concentration of heavy metals detected compared to the amount of heavy metal standards added, minus site-specific background concentration levels.
Table 3.
Percent Recovery of Lead (Pb) and Cadmium (Cd) from matrix-spiked standards. This demonstrates the concentration of heavy metals detected compared to the amount of heavy metal standards added, minus site-specific background concentration levels.
| Sample and Site Number | Percent Pb Recovery (%) | Percent Cd Recovery (%) |
|---|---|---|
| Sample 10 (Site 1, fine sediment) | 108.7% | 118.0% |
| Sample 11 (Site 7, coarse sediment) | 73.0% | 97.7% |
Disclaimer/Publisher’s Note: The statements, opinions and data contained in all publications are solely those of the individual author(s) and contributor(s) and not of MDPI and/or the editor(s). MDPI and/or the editor(s) disclaim responsibility for any injury to people or property resulting from any ideas, methods, instructions or products referred to in the content. |
© 2024 by the authors. Licensee MDPI, Basel, Switzerland. This article is an open access article distributed under the terms and conditions of the Creative Commons Attribution (CC BY) license (http://creativecommons.org/licenses/by/4.0/).
Copyright: This open access article is published under a Creative Commons CC BY 4.0 license, which permit the free download, distribution, and reuse, provided that the author and preprint are cited in any reuse.


