1. Introduction
The environment of our planet is increasingly deteriorating, making it more challenging for life to thrive due to a multitude of human-induced activities and natural phenomena that are influencing our ecosystems. One of the significant challenges is the alteration of urban thermal environments, a phenomenon that has emerged as a major concern on a global scale (Eshetie, 2024). Recent studies suggest that global average surface temperatures in metropolitan areas will increase by 1.4 to 4.8°C around the year 2100 (Aghamolaei et al., 2023). A new United Nations report forecasts that by 2050, an additional 2.5 billion people will be living in urban areas (UN, 2018). A stable thermal state is crucial for human life and socioeconomic activities, as it directly influences thermal comfort, which is essential for overall well-being and productivity (Ren et al., 2023). The thermal conditions of a city can be influenced by various factors, including climatic conditions, the city’s spatial characteristics, land use and land cover, the topography, and other elements (Crétat et al., 2024). The global community recognizes urban thermal environment alteration issues as a current global threat (Kalogeropoulos et al., 2022). SDG-11 specifically proposes that cities need to be redesigned using sustainability concepts, requiring significant building and management practices (Kanga et al., 2022). One of the prime prerequisites for better use and management of assessment and quantification of thermal trend patterns and variations (Rendana et al., 2023). Remote sensing and geospatial methods are increasingly common for generating thermal spatial metrics (García, 2022; Kumar et al., 2021)
There are several metrics used to assess the thermal state of a city, including land surface temperature (LST), the urban heat island (UHI), and the urban thermal field variance index (UTFVI) (Pantavou et al., 2024). These metrics provide a comprehensive framework for evaluating the thermal dynamics of urban environments, enabling better planning and management strategies to address the challenges posed by rising temperatures. Among them, the important parameter in urban climate is the Land Surface Temperature (LST), which directly controls the effect of Urban Heat (Mwangi et al., 2018). Deriving the land surface temperature entails using remote sensing techniques to measure the earth’s surface temperature (Li et al., 2004). This metric provides valuable insights into how different surfaces within an urban area absorb and release heat, contributing to the overall thermal profile of the city. The urban thermal intensification effect is the most prominent aspect of the urban climate, and it is widely acknowledged as a phenomenon of heat accumulation caused by urban infrastructure and human activity (Yang et al., 2016). The effect of UHI has become one of the main problems for the urban environment and human health (Ren et al., 2023). UHI can cause major problems such as the worsening of living surroundings, increment of energy expenditure, the elevation of ground-level ozone, increase in diseases and death rates, and negative impact on the ecosystem and climate change (Kumar et al., 2021). UHI may affect the energy balance and microclimate of cities (Choudhury et al., 2023). UHI can significantly impact the sustainable development of cities and their surrounding areas (Hamed Fahmy et al., 2023). Currently, the beginning and trends of the UHI effect are receiving a lot of attention. A rapid thermal environment and experiencing significant heat island intensification. The result of UHI is extended to thermal comfort levels in both indoor and outdoor areas and has an impact on inhabitants’ quality of life (Kalogeropoulos et al., 2022). The variation in temperature across various metropolitan regions is measured by the metropolitan Thermal Field Variance Index (UTFVI) (Ullah et al., 2022). This index allows targeted actions to lessen heat stress and improve urban resilience by identifying a city’s hotspots and cooler regions. UTFVI is used to derive the thermal comfort level of a city (Moisa & Gemeda, 2022). A common way to define the idea of urban thermal comfort level is as an approach that shows comfort with the ambient temperature (Aghamolaei et al., 2023).
Fluctuations in the urban thermal environment can have a range of negative consequences across various aspects of human life and the surrounding ecosystems, including biodiversity (Moisa & Gemeda, 2022), human health (Tong et al., 2021), infrastructure (Subramanian, 2023), water resources (Briciu et al., 2020), energy consumption (Ghribi & Dahech, 2023), and more. As these thermal variations become increasingly pronounced, their effects will likely be felt more acutely in cities within Africa (Clark et al., 2001; X. Li et al., 2021), where the vulnerability of both people and infrastructure may lead to heightened fragility and challenges in adaptation. Current cities in Africa are experiencing intense, unplanned, and rapid urban expansion, which primarily results in significant alterations to the urban thermal environment. This phenomenon is largely driven by the continuous replacement of natural surfaces with heat-absorbing materials, leading to the development of UHI (Kikon et al., 2016). The urban thermal risks are particularly pronounced in Ethiopia. The least developed countries are vulnerable to frequent climatic extremes, which have had a major negative impact on the economy and society of the nation and are predicted to worsen in the future due to climate change (Tesfamariam et al., 2023; You & Ringler, 2013). Therefore, it is essential to assess and evaluate the spatiotemporal distribution and variation of urban thermal conditions to understand their potential implications for the future (Husain et al., 2023). This comprehensive analysis will help inform strategies for urban planning and climate adaptation, ensuring cities can effectively respond to the challenges posed by changing thermal environments.
The present study aims to explore the spatiotemporal urban thermal state and variation of Adama City in the Oromia regional state of Ethiopia. Adama City is one of the fastest-growing cities in Ethiopia (Bulti & Assefa, 2019). As time passes, the city becomes more expanded, gets warmer, and feels extremely hot. Thus, an up-to-date and spatially accurate study should be conducted to investigate the thermal condition of the city to identify possible implications. The present study assesses the thermal environment alterations over three years that extends over 28 years (1995–2023), visually represents, quantifies, and numerically evaluates the thermal environment variation of the city, as well as explores the future possible implications for a sustainable urban environment. The study uses remote sensing imageries and geospatial tools to assess the thermal environment of the city. For the thermal environment variation assessment, the study uses three distinct spatial thermal indices: LST, UHI, and UTFV index. Through this endeavor, the study wants to provide further insight into the temperature patterns within the analyzed area, as well as the relationship between these changes and the increasingly pressing issue of thermal state. It is anticipated that the outputs will be helpful in urban planning, and sustainable urban development.
2. Materials and Methods
2.1. Study Area Description
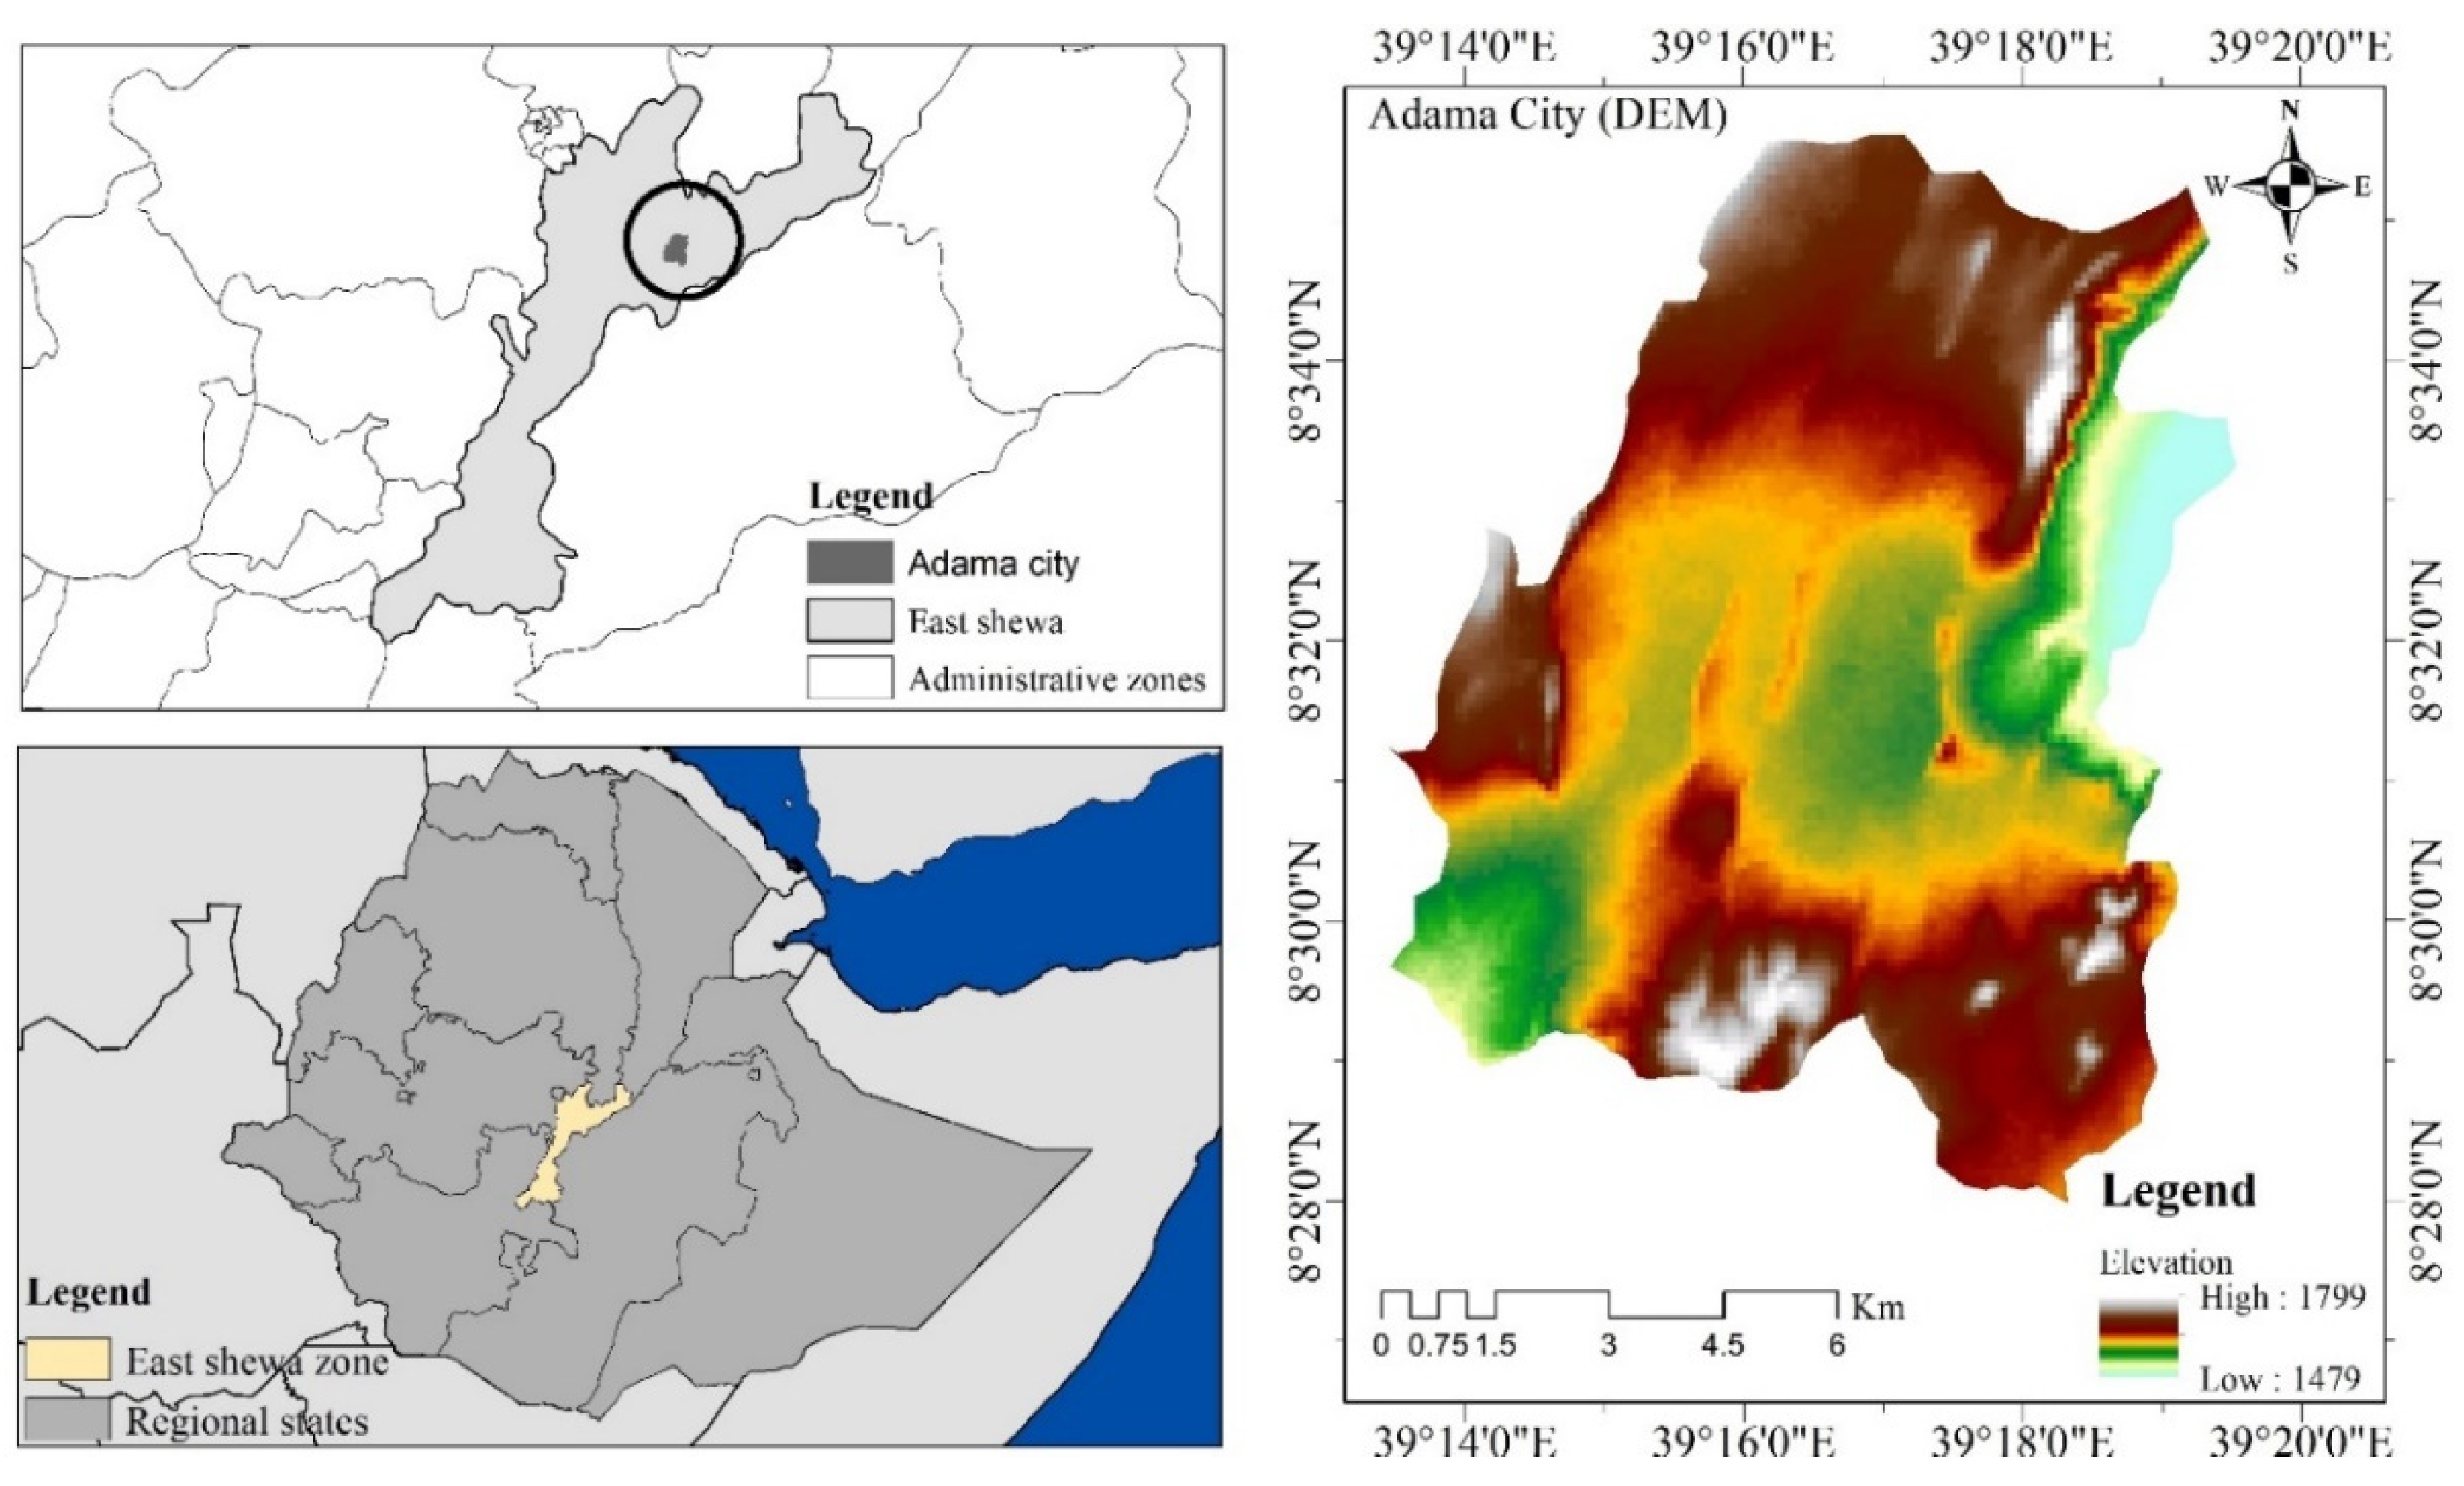
Adama is situated in the Rift Valley in a level area surrounded by mountains and hills (Gebreselassie & Rao, 2021). Its absolute location is between 8°26′15″N to 8°37′00″N latitude and 39°12′15″E to 39°19′45′′E longitude (
Figure 1). The area coverage is approximately 10,042.3 hectares. The elevation of the city runs between 1470 and 1799 m. The city receives an average annual rainfall of 727 mm, ranging from 670 mm to a maximum of 973 mm. Adama City is characterized by arid and semi-arid environments. May is the month with the highest temperature, and December is the month with the lowest. The major rainy season runs from June to September, with July and August marking the climax. The city served as a seat for the Oromia regional state of Ethiopia. The primary cause of the city’s fast development is often attributed to its administrative position (Bulti & Abebe, 2020). The city is characterized by intense and rapid urbanization.
2.2. Data Description
Satellite images are the most effective type of imagery available for providing details on land surface patterns seen on the Earth (Regassa et al., 2020). Remote sensing and geospatial modeling play a significant role in assessing surface temperature variation (Nasar-u-minallah, 2018). This study’s primary data source is multi-temporal remotely sensed Landsat data, which was acquired through the USGS and spans the years 1995, 2010, and 2023 (
Table 1). To increase the readability and accuracy of the image products and applications, QGIS was utilized for image processing and evaluation.
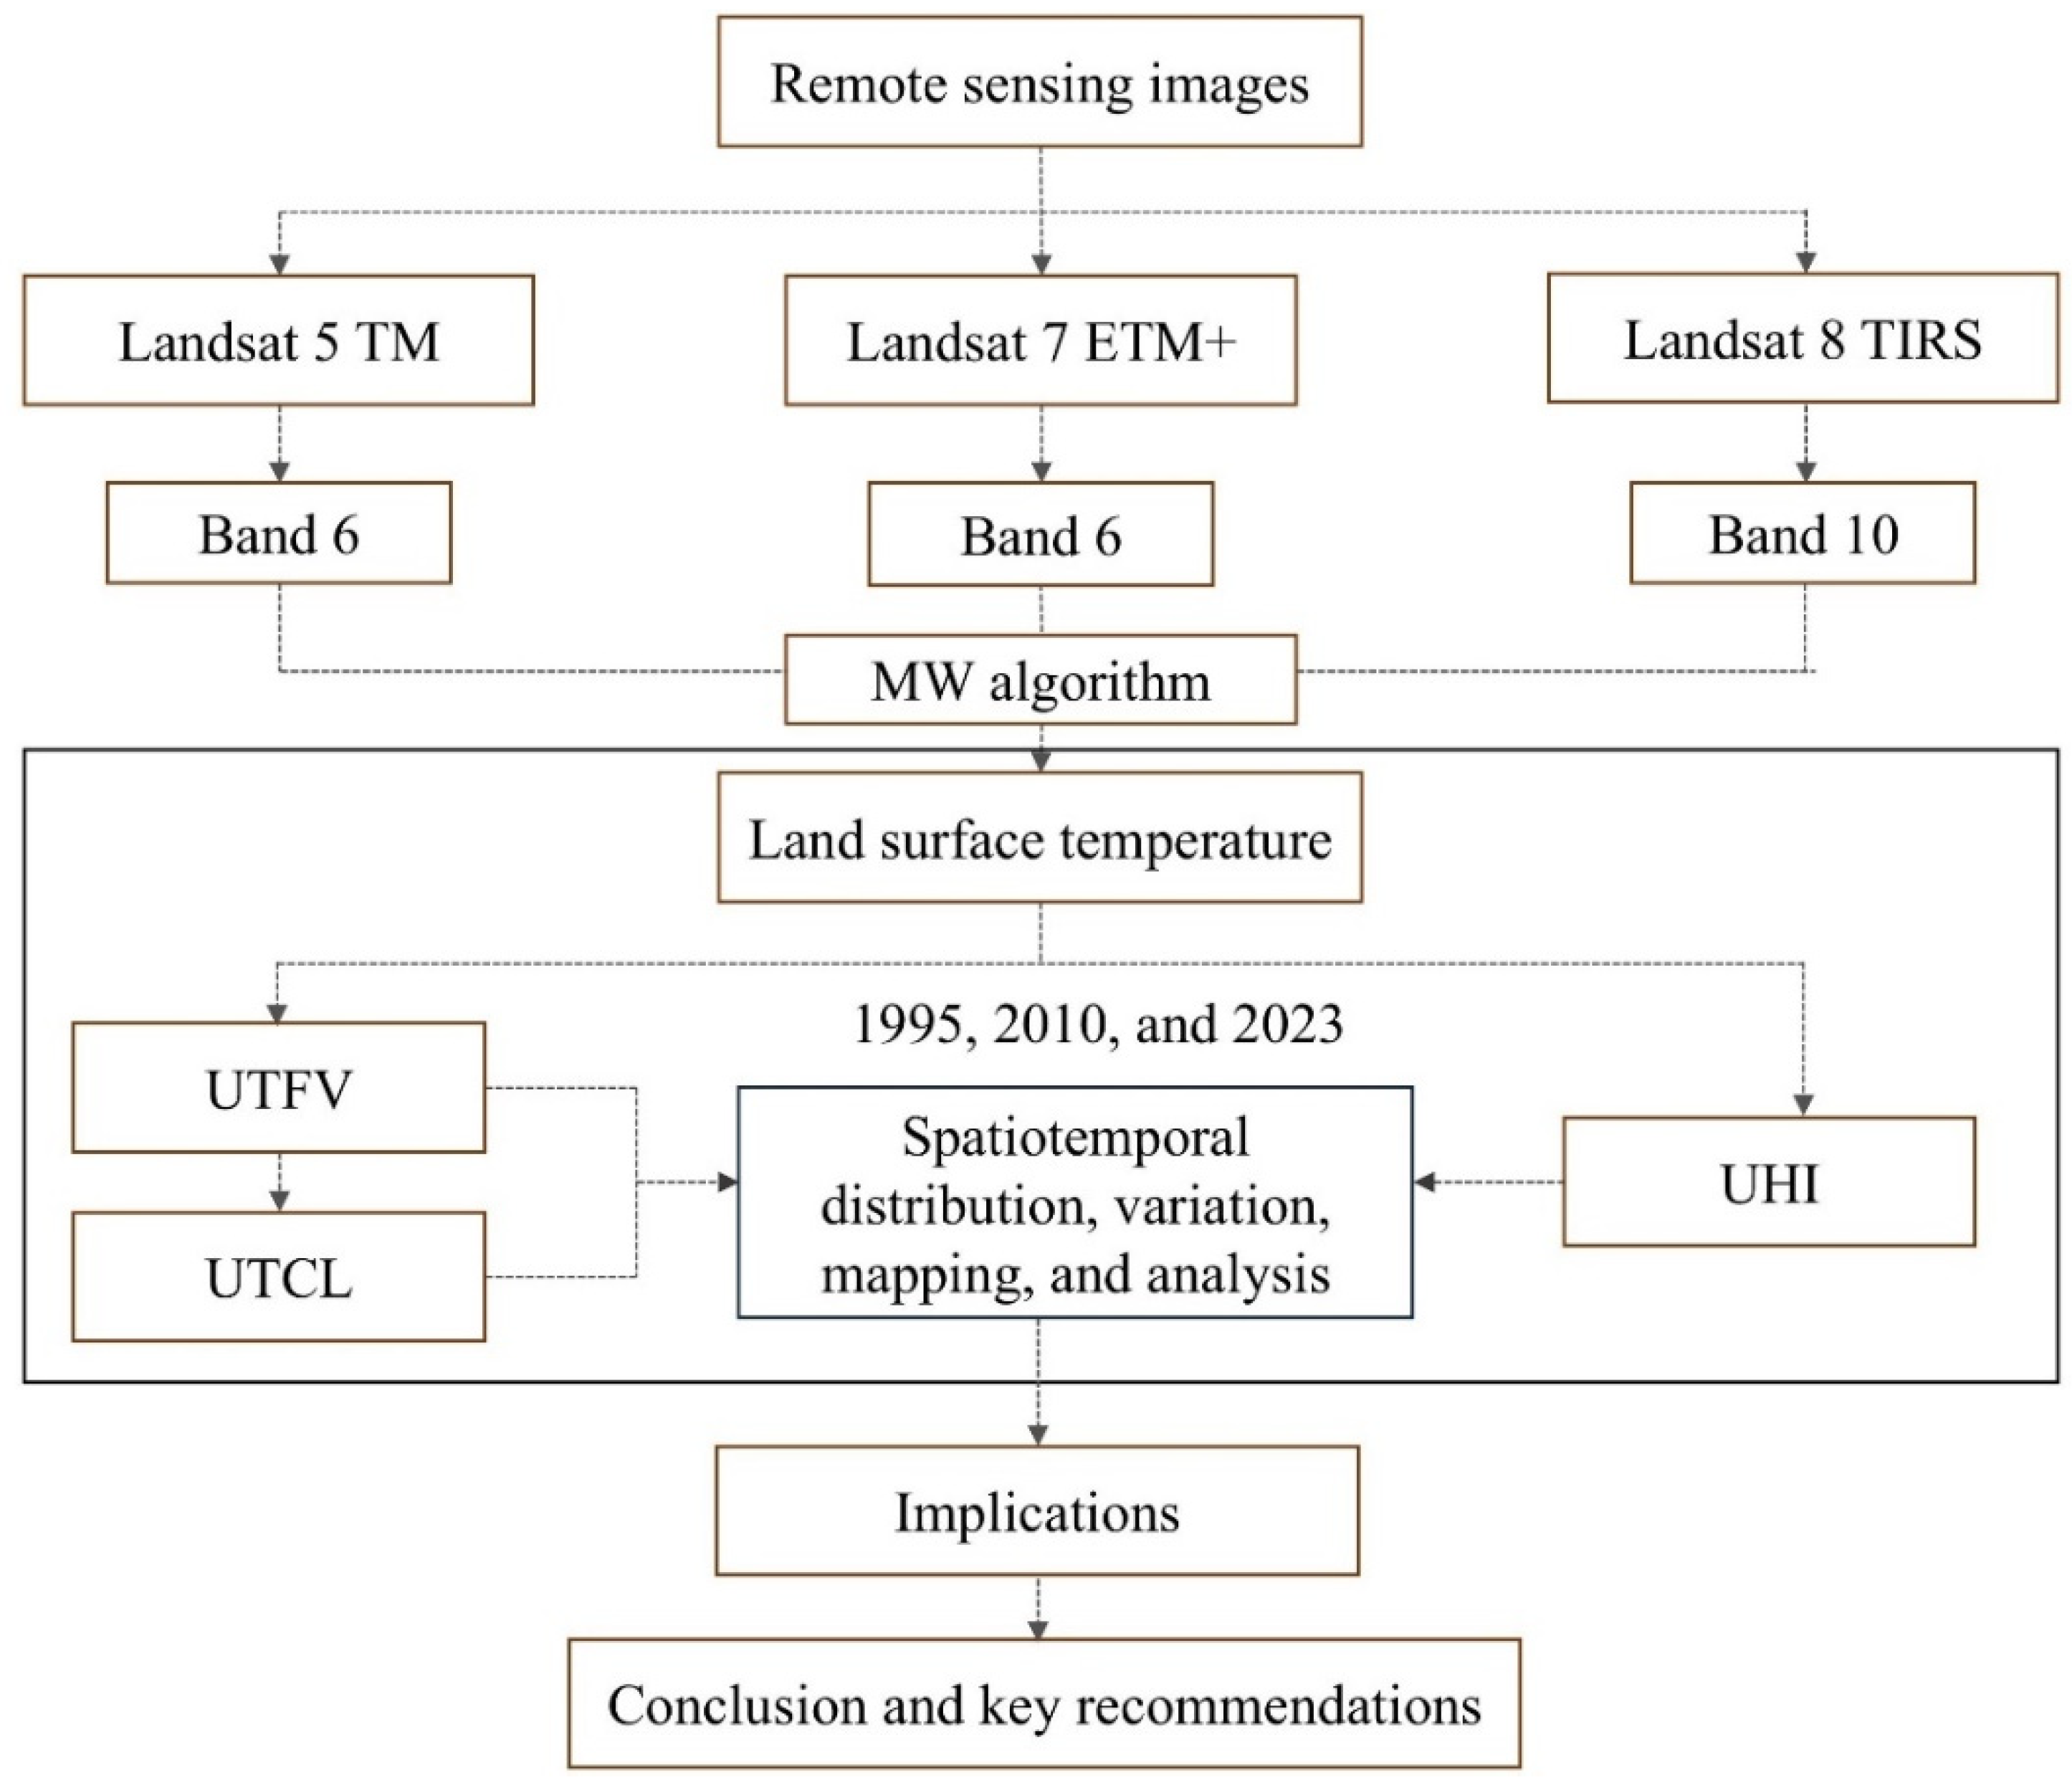
In this study, temperature fluctuations of Adama City were analyzed and quantified using QGIS 3.34 software over 28 years from 1995 to 2023. The framework
Figure 2 that follows provides a quick illustration of the methodology utilized in the present investigation and can be used as a useful tool for understanding the study as a whole.
2.3. Urban Thermal Environment Change Simulation
2.3.1. Land Surface Temperature Generation
Urban land surface temperature, which is influenced by a variety of factors such as trees and shrubs, construction materials, and socioeconomic status, is the quantity of temperature that is detected at the surface of urban areas (Degefu et al., 2023). Due to the UHI effect, which causes cities to retain greater temperatures, this temperature can range dramatically from nearby rural regions. Comprehending the climate of the urban land surface is essential for evaluating the effects on the ecosystem, controlling energy usage, and advocating for efficient urban design that aims to improve sustainability and livability in areas with high density. The Mono-Window Algorithm (MWA) was utilized in this work to produce and retrieve the Landsat satellite data. This approach makes it easier to investigate and evaluate the impacts of UHI by offering a user-friendly and efficient way to acquire LST (Hamed Fahmy et al., 2023; Lu et al., 2009). LST maps were extracted from the thermal infrared band 6 of Landsat 5 and 7 and band 10 of Landsat 8 and involved four distinct steps.
Radiance image calculation
Eq. (5) for the raw digital number (DN) values of TM and ETM+ and Equation (6) for OLI have been used to transform into luminance radiation or top-of-atmospheric (TOA) radiance (Ogunode & Akombelwa, 2017).
where Lλ is spectral radiance, L
max and L
min are the maximum and minimum spectral radiances, QCal = quantized calibrated pixel value in DN, QCal
max = maximum quantized calibrated pixel value in DN, and QCal
min = minimum quantized calibrated pixel value in DN, and ML and AL are the band-specific multiplicative and additive rescaling factors from the image metadata.
Radiant temperature calculation
At-sensor brightness temperature then be generated from TOA radiance to using Equation (3) for both TM, ETM+, and TIRS images (Das et al., 2021; Degefu et al., 2023).
where TB is the at-brightness temperature in degrees Celsius, Lλ is TOA radiance, and K2 and K1 are band-specific thermal conversion constants.
Emissivity calculation
To calculate the emissivity, utilizing Equation (4) Where, based on the following, PV: is the vegetation proportion that can be obtained from the NDVI map based on Equation (5) (Mustafa et al., 2020).
LST Calculation
The final LST map is prepared by applying Equation (6) using the satellite brightness temperature (TB) and surface emissivity (ε) (Twumasi et al., 2021).
where, λ is denoted the wavelength of the emitted radiance of satellite images, which is measured (λ = 10.8µm), α = h
(1.438 × 10⁻² m.K), c is the speed of light which is (2.998 × 10⁸ m/s), b is Stefan Boltzmann constant, which is 1.38 × 10⁻²³ J/K, and h is denoted Planck’s constant, which is 6.625 × 10⁻³⁴ J.s.
2.5.2. UHI Change Assessment
The urban heat island effect is the phenomenon wherein urban regions get greater temperatures than their rural surroundings. This phenomenon is mainly caused by human activity and the widespread use of thermal-absorbing materials such as concrete and asphalt. UHI assessments will be used to make sure that urban planning and management are done correctly, to spot changes in the thermal environment, and to maintain an eye on heat stress in urban environments. In examining the variation across the study period, the UHI of the study region was calculated using LST from 1995, 2010, and 2023. The UHI over different periods is calculated by Equation (7) (Choudhury et al., 2023):
where LSTmean displays the mean LST value and LST indicates the distribution of surface temperature.
2.5.3. Urban Thermal Field Variance and Comfort Level
The temperature variations that occur in urban landscapes are measured by the Urban Thermal Field Variance Index (UTFVI), which shows the distribution of thermal condition levels in urban locations (Shahfahad et al., 2022). The scientific community frequently uses UTFVI to evaluate the thermal quality of urban settings. (García & Díaz, 2023). Understanding this index is essential for addressing the UHI effect, where urban centers experience elevated temperatures compared to their rural counterparts, which can adversely affect residents’ comfort. Urban planners and relevant officials may identify crucial regions that require measures to improve thermal comfort and, ultimately, create healthier and more enjoyable living conditions for city people, by looking at the variances identified by the UTFVI. The present study used Equation (8) to compute UTFVI which was also adopted by (Fonseka et al., 2022; Moisa et al., 2022).
In this case, UTFVI represents the index for field variance, LST for surface temperature, and for an average value of the surface temperature. The UTFVI is one of the main indicators used to evaluate urban thermal comfort. Urban thermal comfort level refers to the degree of pleasantness or unpleasantness people experience due to the thermal environment in a city. By analyzing these factors, researchers can gain a comprehensive understanding of the thermal comfort experienced in urban environments. By examining differences in surface temperatures across various land covers, this index aids in the assessment of the thermal environment of metropolitan regions.
Table 2.
UTFVI and the corresponding value of comfort level (Fonseka et al., 2022).
Table 2.
UTFVI and the corresponding value of comfort level (Fonseka et al., 2022).
| UTFVI value |
<0 |
0-0.005 |
0.005-0.01 |
0.01-0.015 |
0.015-0.02 |
>0.020 |
| Comfort level |
None |
Low |
Middle |
High |
Very high |
sever |
| UHI threshold |
Excellent |
Good |
Normal |
Bad |
Worse |
Worst |
3.5. Limitations and Future Research Work
Understanding the limitations and shortcomings of a study is essential for driving progress and enhancing future research efforts. A major shortcoming of this research is its concentration on a single season, overlooking the seasonal fluctuations that could offer a more comprehensive understanding of the surface thermal environment. This narrow focus may fail to adequately represent the dynamic temperature variations that take place throughout the day or across the year. The present study relies exclusively on remote sensing data, which may lack sufficient ground observation to verify findings. This dependence on satellite imagery can lead to inaccuracies in the interpretation of land surface temperature and its variations, as remote data may not capture localized effects or nuances present in the urban environment. Without robust ground validation, the results may misrepresent actual conditions, limiting the study’s reliability and applicability. To achieve a more complete and insightful analysis, the study suggests that future investigations should tackle these deficiencies and include a wider array of variables.
3. Result and Discussion
3.1. LST Construction
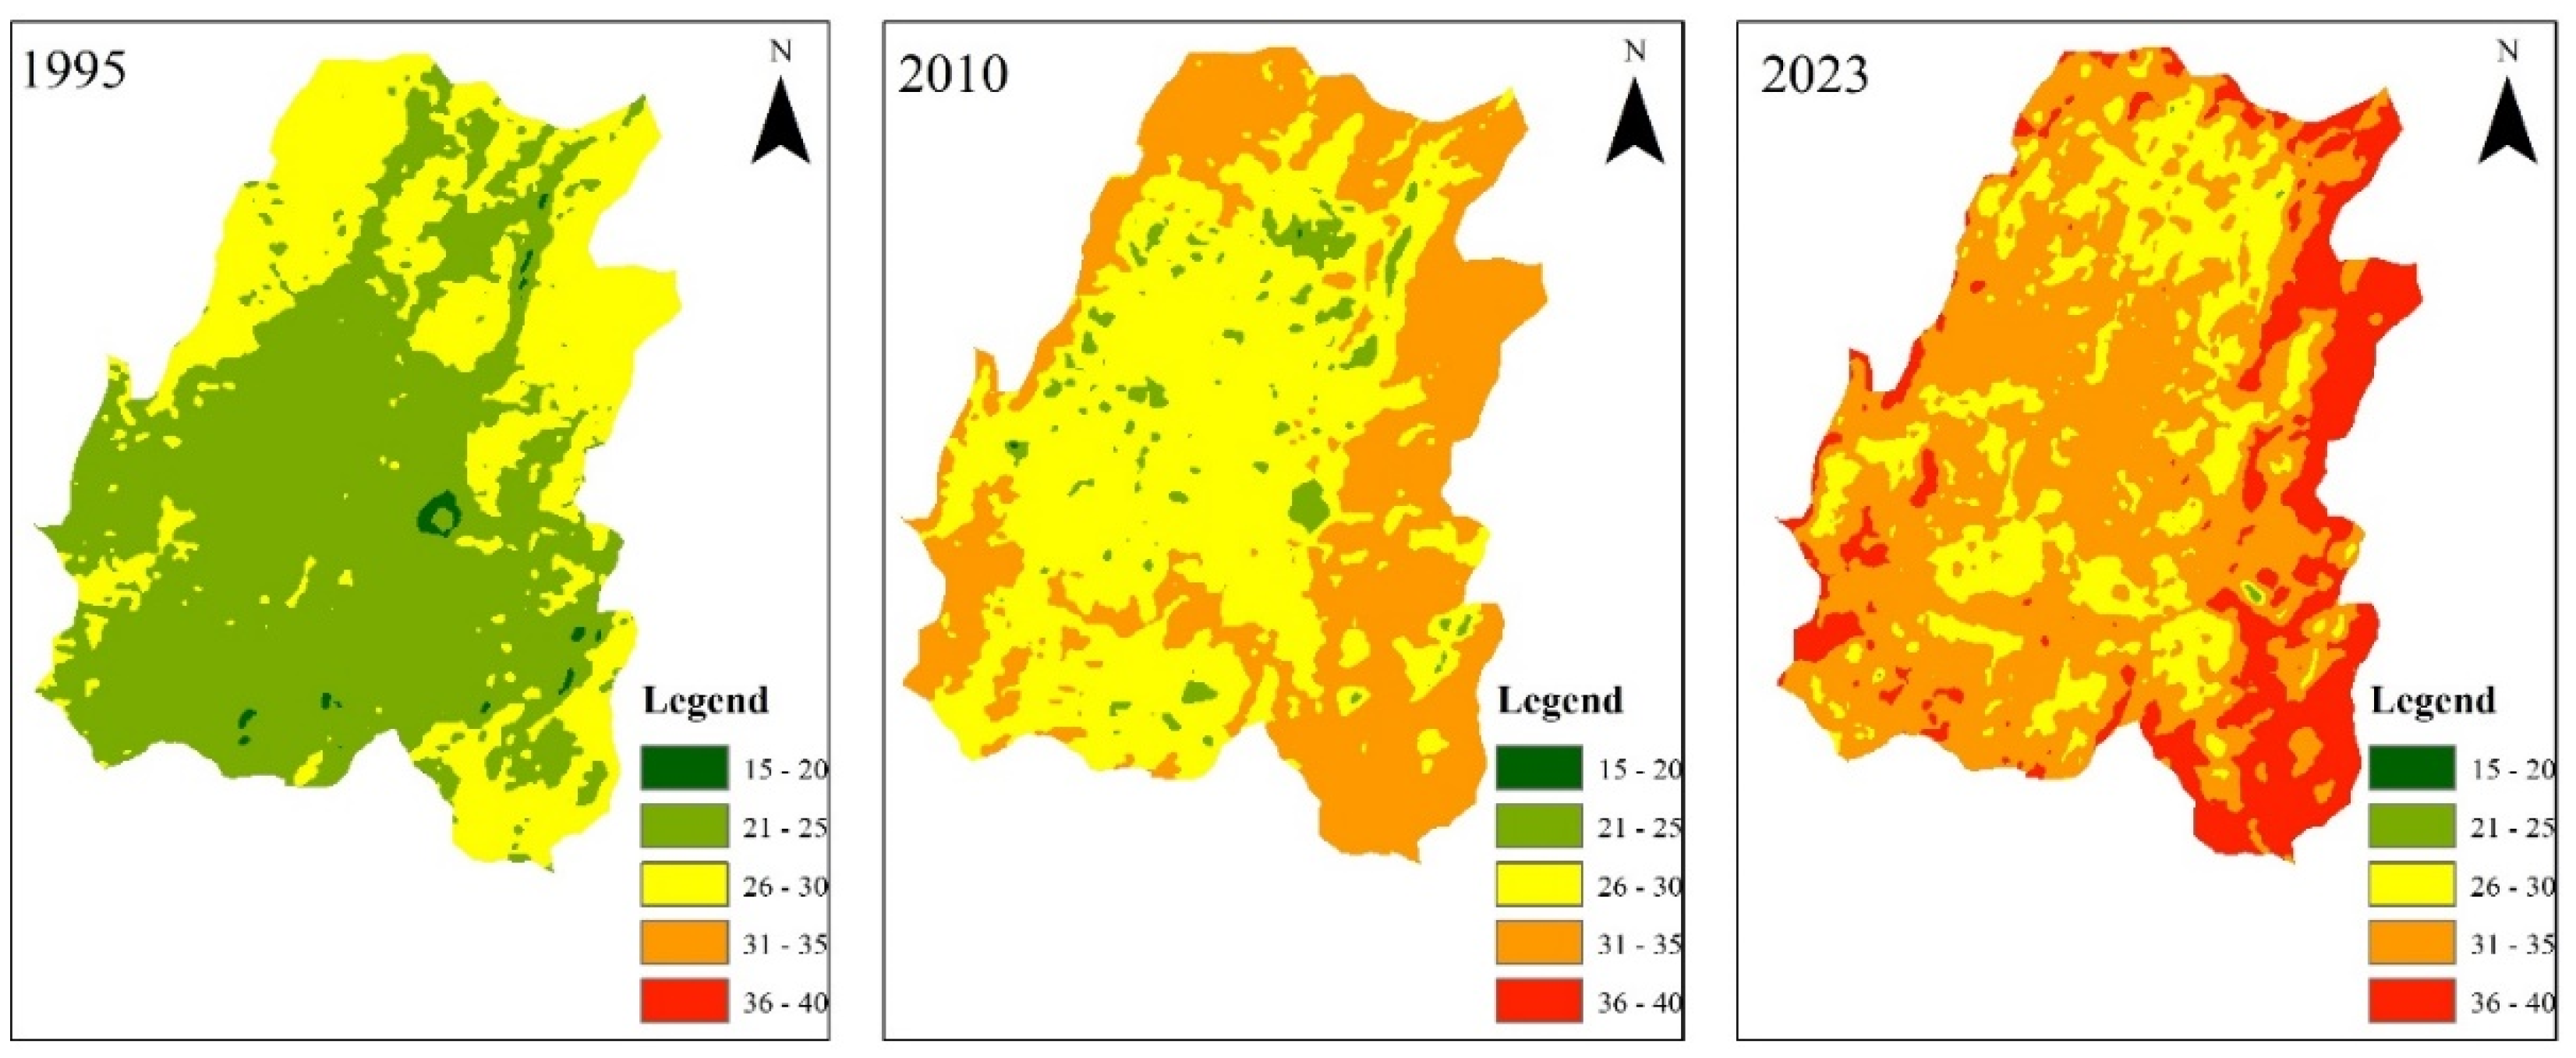
Land surface temperature (LST) is primarily derived from the thermal bands of remote sensing imagery (Gök et al., 2024; Z. Li et al., 2022). To assess the spatiotemporal trends in the city’s LST, the Mono Window Algorithm (MWA) method was employed. The resulting Land Surface Temperature (LST) maps revealed distinct patterns of heat variations and high temperatures across the three research years. To quantify these variations, the LST values were categorized into five temperature ranges: 15-20°C, 20-25°C, 25-30°C, 30-35°C, and 35-40°C. For each year, the percentage of the city’s area falling within each temperature range was calculated, providing a comprehensive picture of how the thermal landscape has evolved. This analysis offers valuable insights into the changing thermal characteristics of the city, highlighting the potential for further investigations into the drivers of these variations.
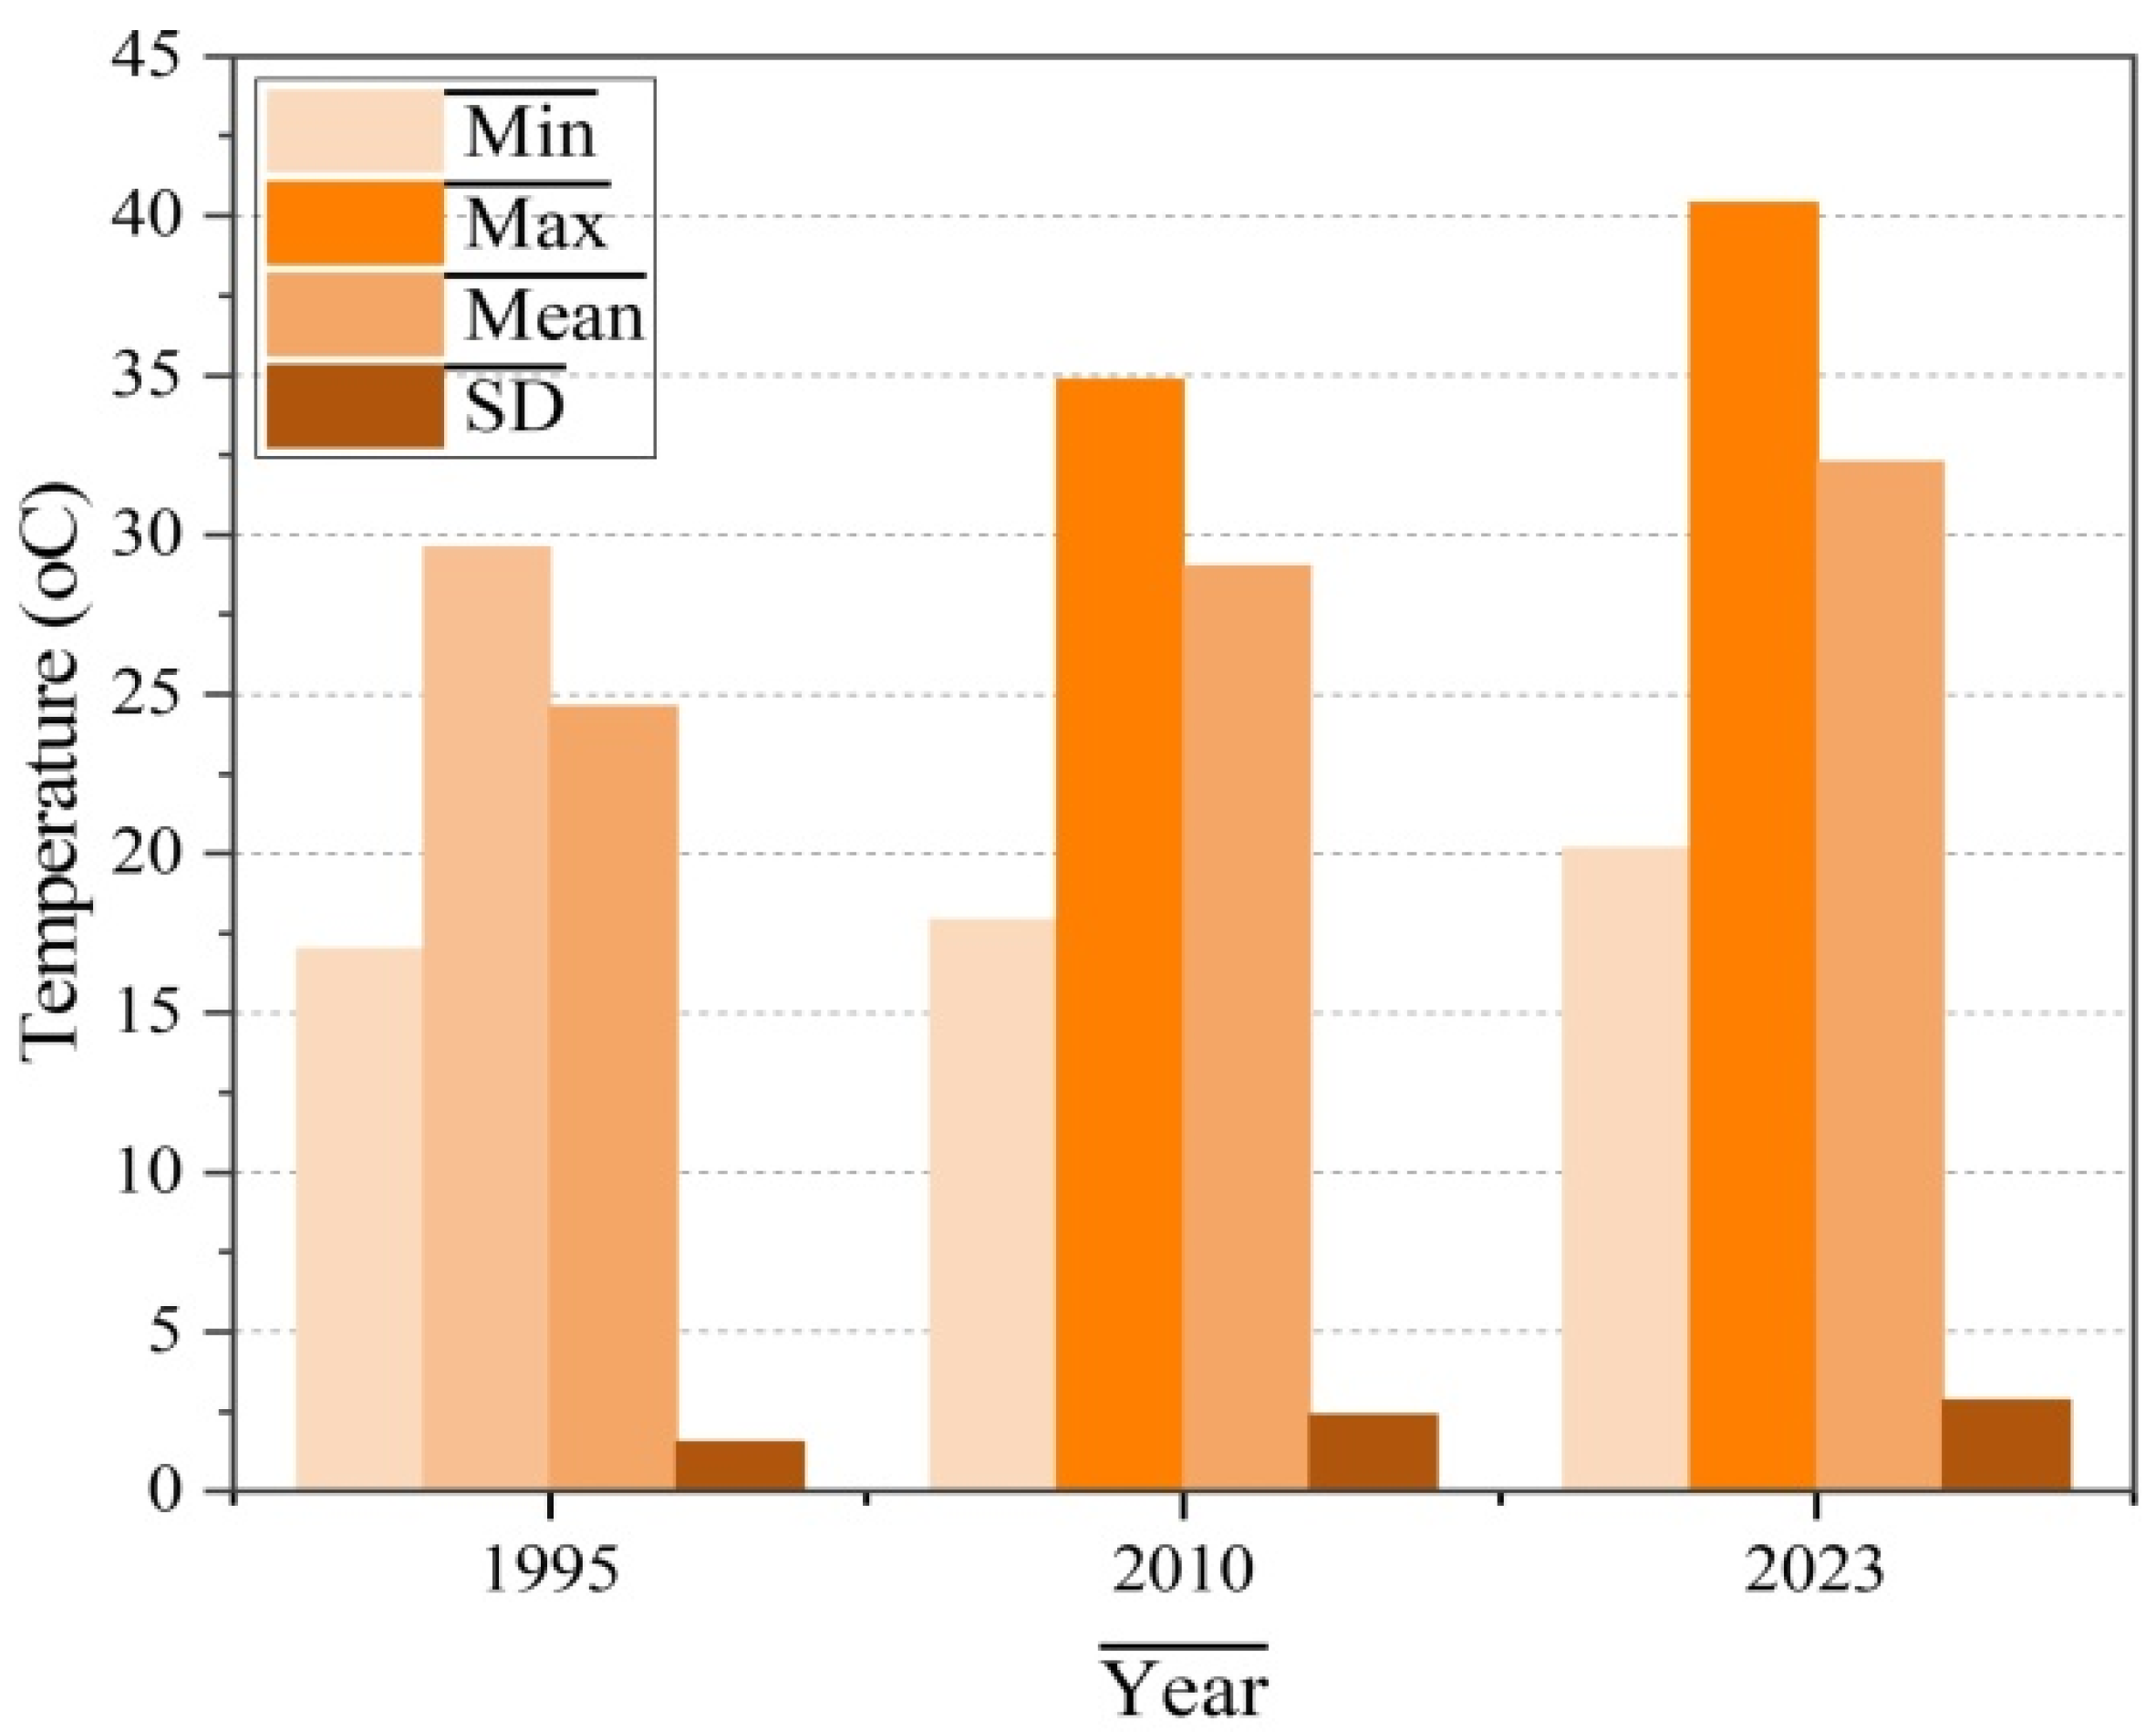
Figure 3 illustrates the progression of land surface temperature (LST) in Adama City from 1995 to 2023, highlighting significant increases in both minimum and maximum temperatures. The LST range expanded from 17.02°C to 29.59°C in 1995, to 17.93°C to 34.85°C in 2010, and further to 20.16°C to 40.39°C in 2023, demonstrating a widening temperature range and an overall increase in heat (
Figure 4). Average temperatures also reflect this trend, rising from 23.5°C in 1995 to 23.3°C in 2010, and reaching 28.9°C in 2023, indicating a significant overall warming of the city’s thermal environment over the past three decades.
The produced areal map reveals a compelling narrative of the city’s changing thermal landscape over time. In 1995, the city exhibited a predominantly cool environment, with a vast majority of its area characterized by very low, low, and moderate Land Surface Temperatures (LST). This dominance of cooler temperatures, particularly in the very low and low categories, accounted for nearly 65% of the city’s area, indicating a generally comfortable thermal environment. However, by 2010, a significant transformation in the distribution of LST zones became evident. The landscape transitioned to encompass a wider range of temperatures, with low, moderate, and high zones emerging as dominant features. While the presence of lower temperature zones persisted, their dominance was less pronounced, with a notable 53% of the area falling within the moderate temperature range. This shift indicates a gradual warming trend within the urban environment, suggesting the emergence of heat island effects. The city’s thermal profile continued to evolve in 2023, with the landscape dominated by moderate, high, and very high LST zones. The decreasing dominance of lower temperature zones, alongside the increasing prevalence of higher temperature zones, underscores the need for urban planning strategies aimed at mitigating the thermal escalation and promoting thermal comfort in the face of a warming climate and ensure a more sustainable and livable urban environment in the face of climate change. Table 3 has a great deal of it.
Table 3.
Temporal dynamics of LST sub-classes in Adama city.
Table 3.
Temporal dynamics of LST sub-classes in Adama city.
| Range |
2023 |
2010 |
1995 |
| Area(ha) |
Percentage (%) |
Area(ha) |
Percentage (%) |
Area(ha) |
Percentage (%) |
| Very low |
0 |
0 |
1.89 |
0.018820408 |
64.26 |
0.639893889 |
| Low |
6.75 |
0.067215745 |
408.87 |
4.071481704 |
6403.14 |
63.76175155 |
| Moderate |
2176.83 |
21.67662953 |
5363.1 |
53.40514962 |
3574.89 |
35.59835456 |
| High |
5876.82 |
58.52071589 |
4268.43 |
42.50454827 |
0 |
0 |
| Very high |
1981.89 |
19.73543883 |
0 |
0 |
0 |
0 |
When we see the two transitions, from 1995 to 2010 and from 2010 to 2023, the first transition demonstrated a substantial variation. The overall thermal state of the city is undergoing a dramatic transformation, characterized by a pronounced increase in temperatures. This warming trend is evident across the entire urban landscape, with both the average temperature and the frequency of extreme heat events rising noticeably. This upward trajectory signifies a significant shift in the city’s thermal profile, indicating that the UHI effect is intensifying, and the city is becoming increasingly susceptible to the consequences of rising temperatures. These changes align with the broader global trend of rising temperatures associated with urban development and the LST effect.
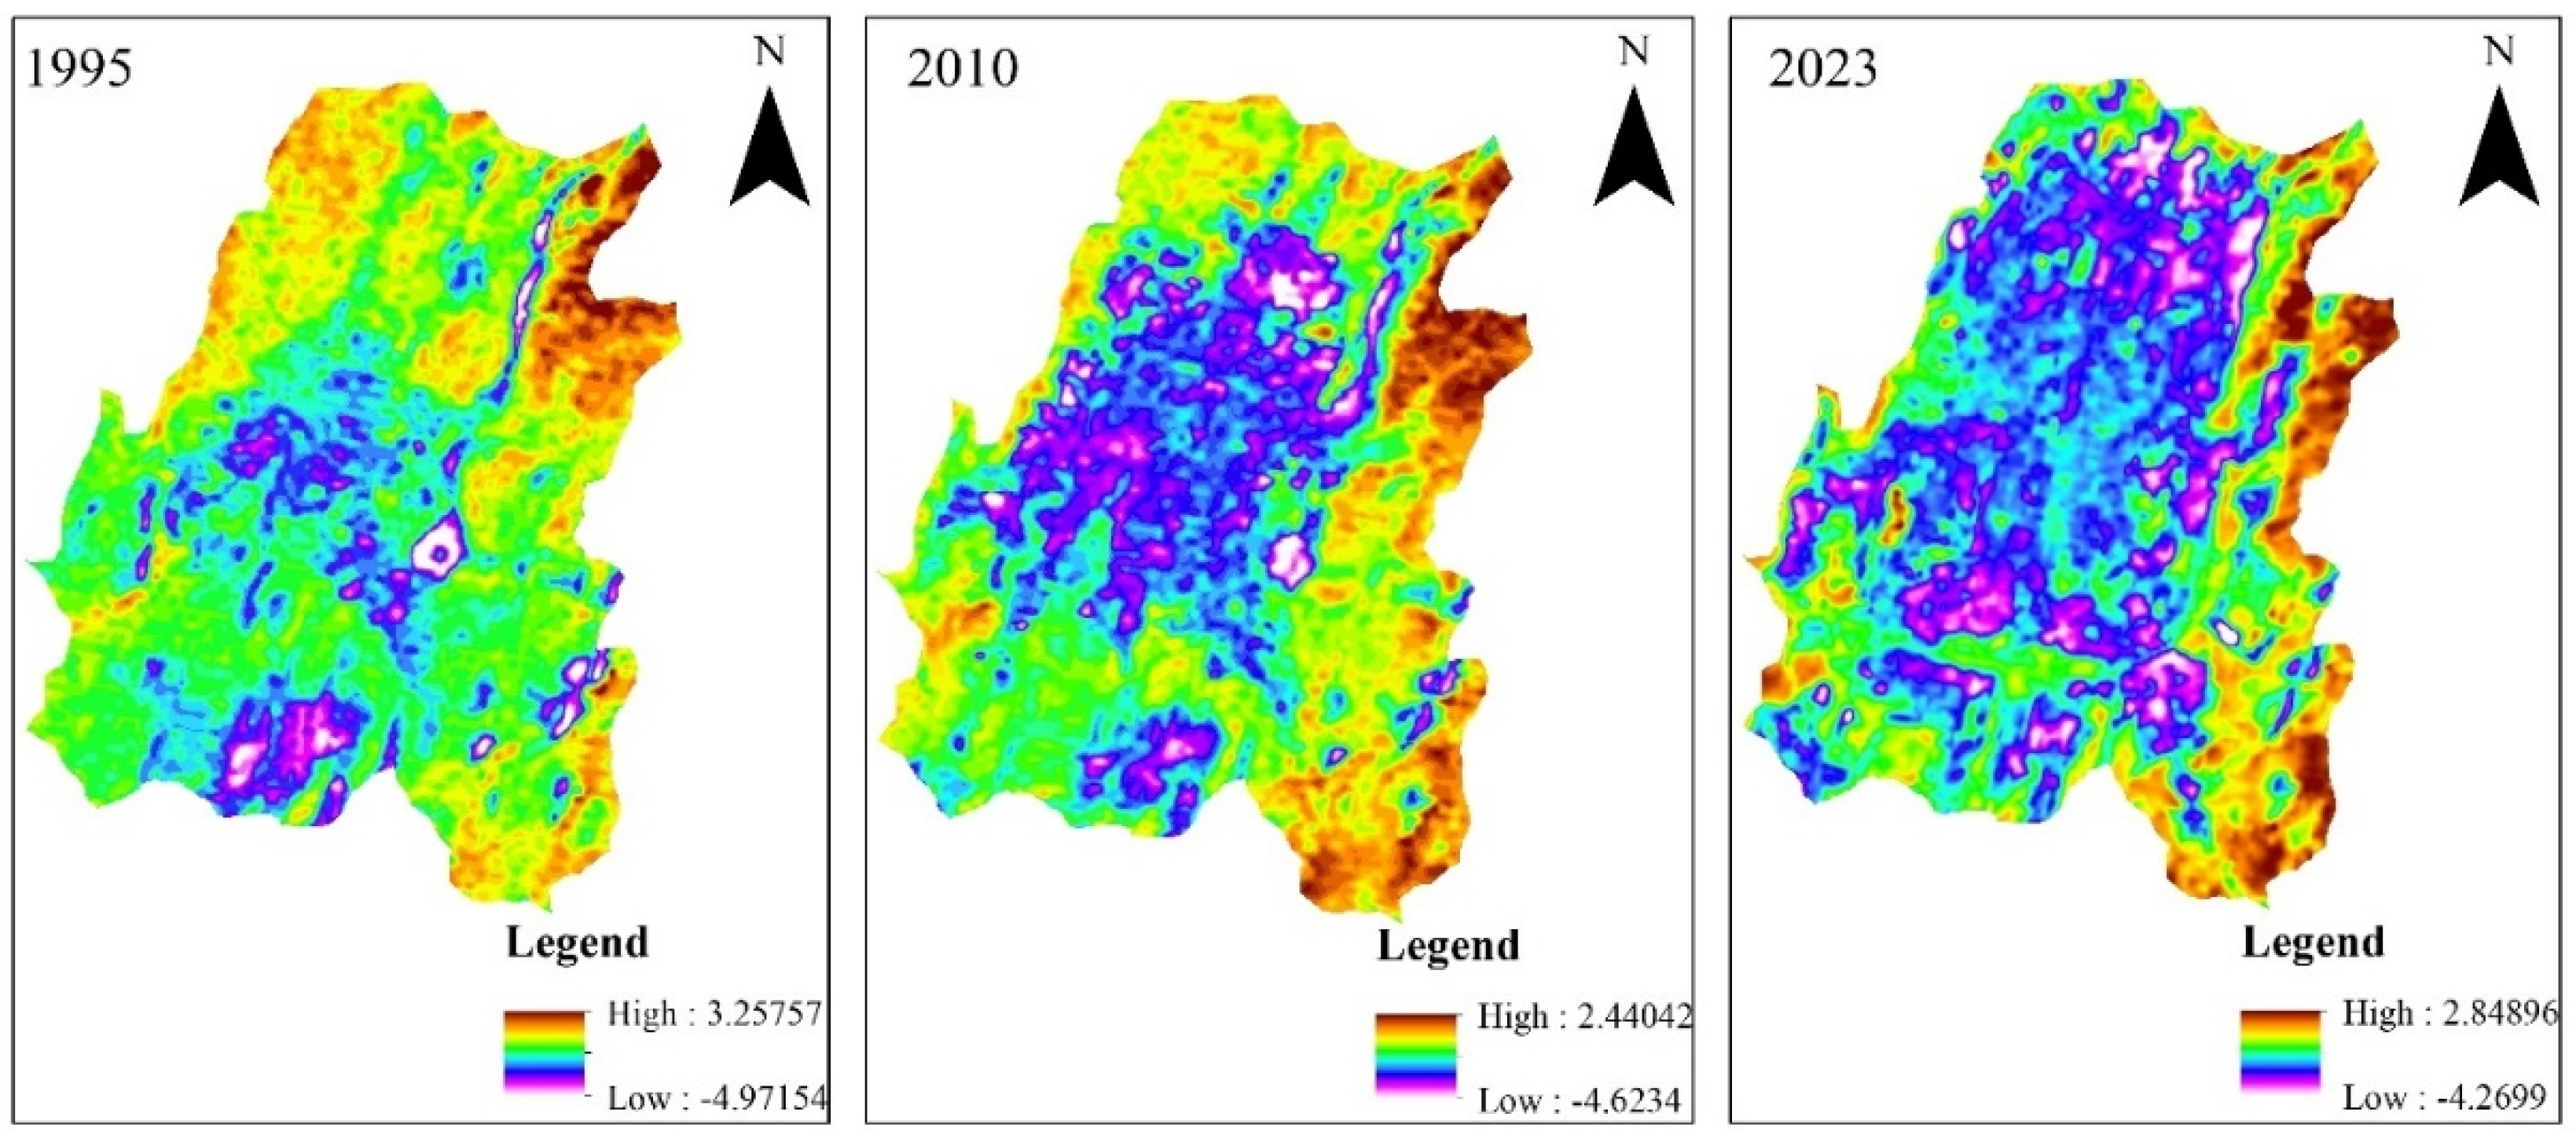
3.2. Spatiotemporal Variation of UHI
The pattern of distribution and trend of UHI are directly correlated with LST. Higher UHI has been observed in areas with higher LST values, and vice versa. The lower LST and UHI are linked to areas with a high level of green spaces. Over time, there have been significant fluctuations in estimated UHI intensity in Adama City. The highest UHI values were observed in 2023. The highest UHI value was 3.25°C in 1995; it varied to 2.44°C in 2010 and 2.84°C in 2023. Furthermore, in 1995, 2010, and 2023, the minimum UHI values were -4.9°C, -4.6°C, and -4.26°C, respectively. The spatial distribution of the UHI is presented in
Figure 5. Adama’s center metropolitan lands have lower temperatures and lower UHI levels as compared to surrounding rural areas the reason might be, that the greenest spaces are located in the settlement areas or the city center might benefit from naturally occurring favorable climatic conditions, such as prevailing winds or topographic features that promote air circulation and reduce heat accumulation.
The intensity or magnitude of the UHI is determined by the difference in temperature between the warmest urban point and the coldest surrounding area. As demonstrated in the profile the city space undergoes a highly fluctuating pattern over the specified years and most of the values are below zero for 1995 with a peak of 0.5 and a depression of around zero. The shape pattern variation of this island map typically shows some rises and depressions caused by various factors. A lower UHI index denotes the presence of specific heat sinks associated with features like parks, vegetation, and water bodies, while a higher UHI index value over the city illustrates the presence of specific heat points associated with features like parking lots, malls, and industrial facilities. A low Urban Heat Island (UHI) value indicates that the temperature difference between urban areas and their surrounding rural areas is minimal. Furthermore, the spatial shifts in UHI distribution that have been observed underscore the dynamic nature of UHI and their possible consequences for the ecology and general well-being of the city. The evidence presented provides an overview of the spatiotemporal dynamics of UHI in Adama City, emphasizing the need for ongoing investigation and preventative actions to mitigate the impacts of these hotspots. The thermal state of Adama City undergoes a dynamic transformation over time, experiencing both substantial variations and a general upward trend in temperatures. This overall spatial warming trend, however, is not uniformly distributed across the city. When examining the spatial distribution of heat within Adama, a fascinating contrast emerges. The city center, despite its dense population and infrastructure, exhibits a relatively cooler thermal state compared to the surrounding peripheral areas. This unexpected finding suggests that factors beyond population density and development contribute to the city’s thermal landscape. It may be that the presence of parks, green spaces, or specific urban planning strategies within the city center act as mitigating forces against the heat island effect, creating a cooler microclimate compared to the less-vegetated, more sprawling outskirts.
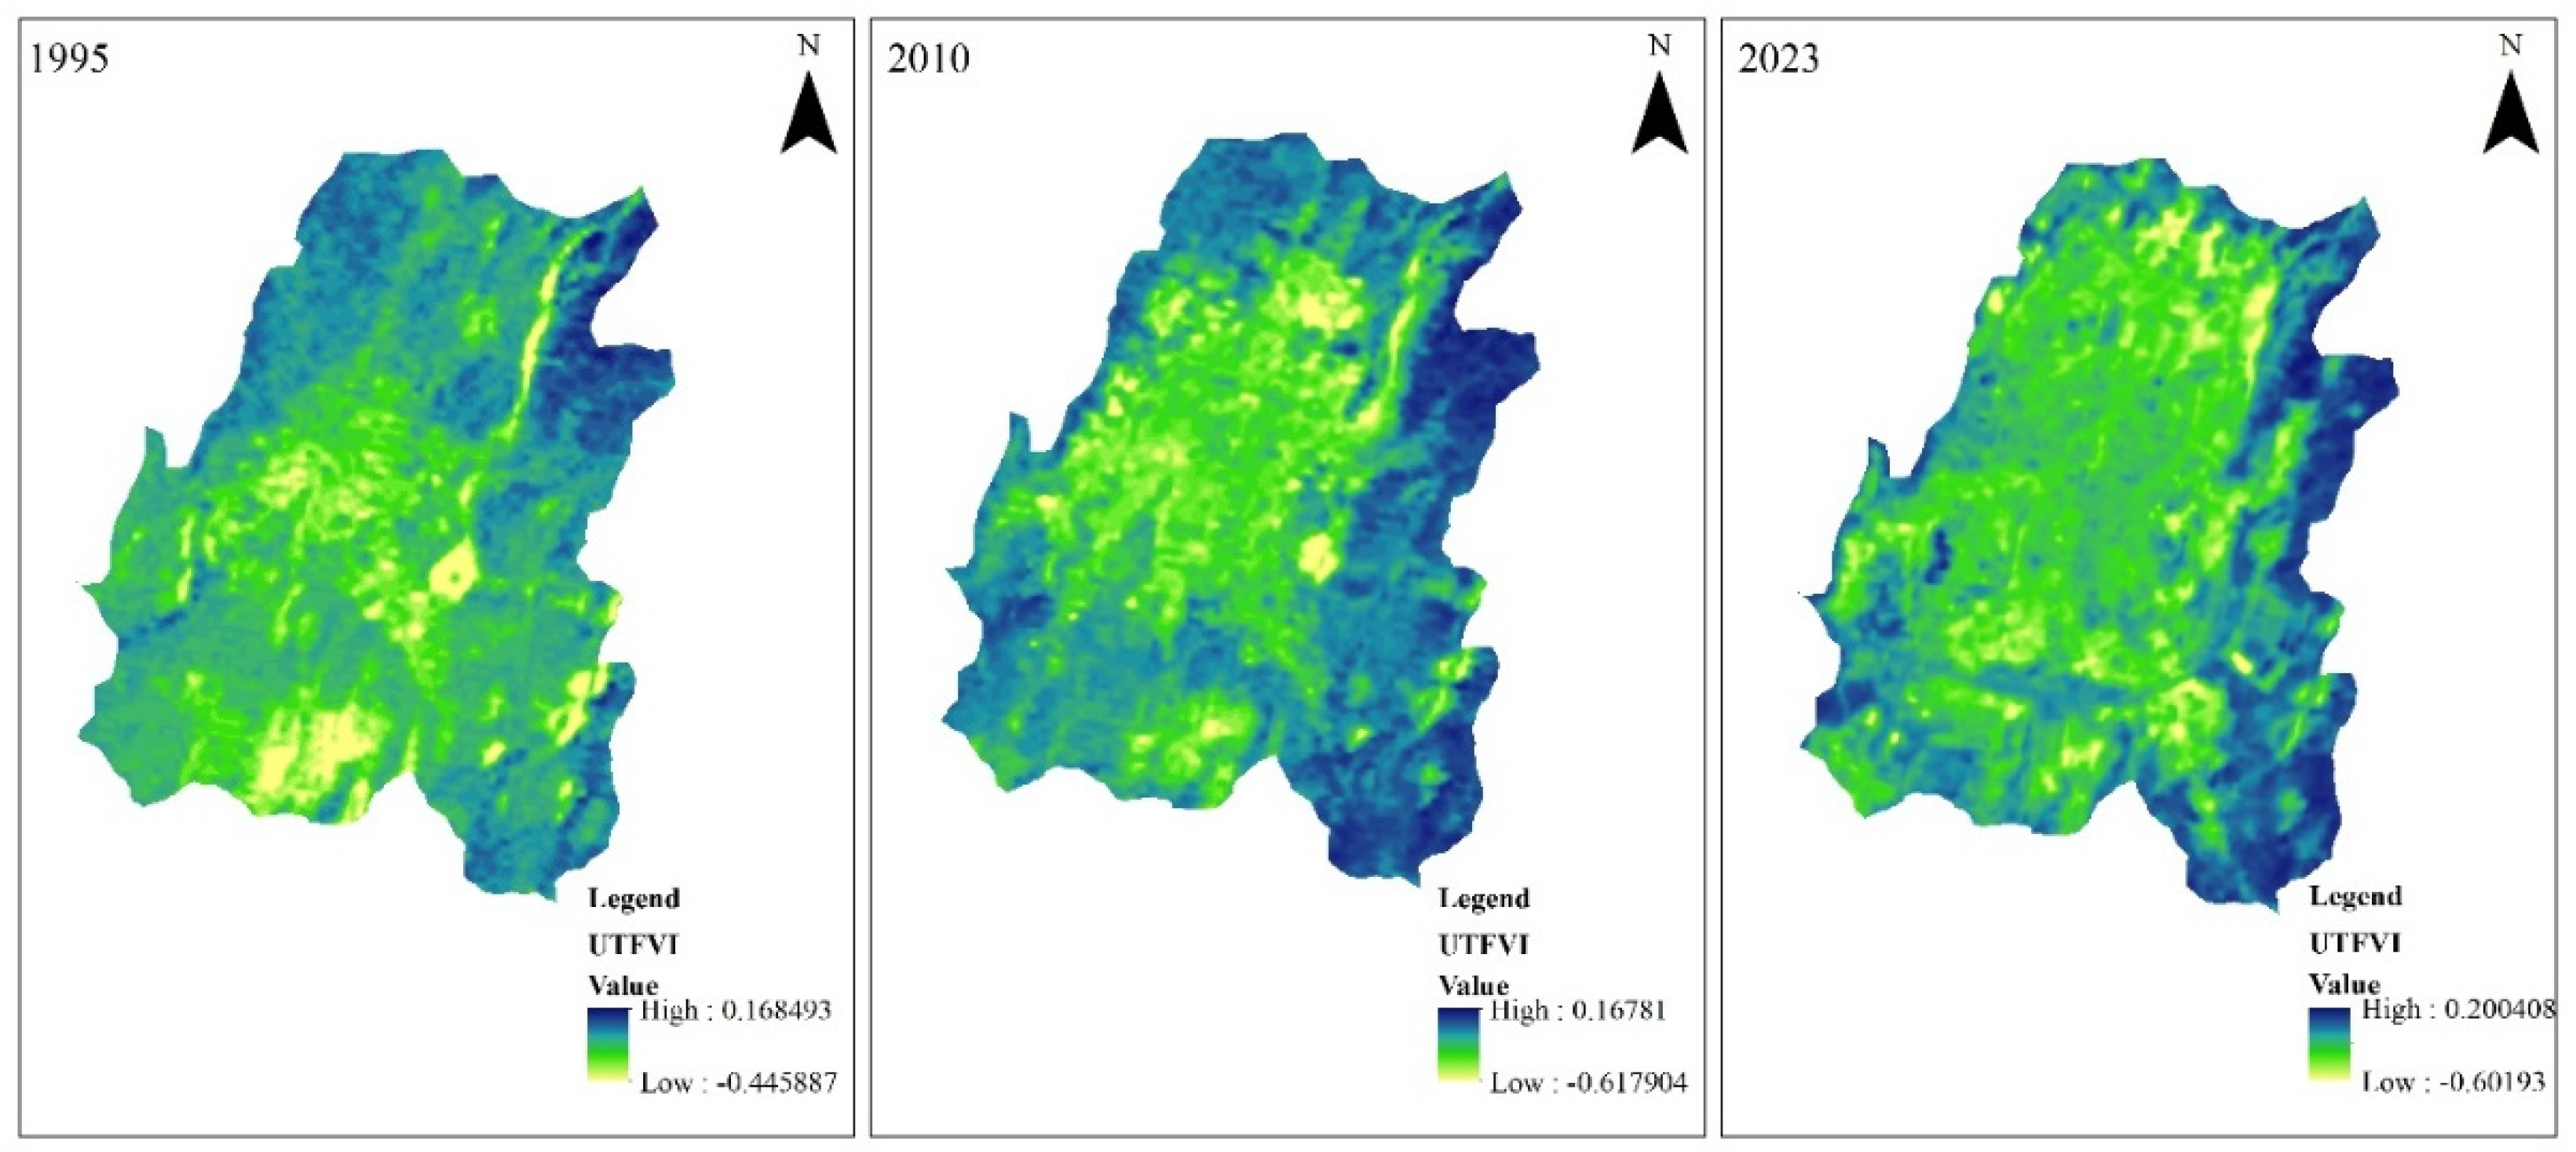
3.3. UTFV and Urban Thermal Comfort Level
The Urban Thermal Field Variance Index (UTFVI) for the city reveals notable fluctuations and heightened stress levels over time. Specifically, the maximum, minimum, and average UTFVI values recorded for the years 1995, 2010, and 2023 were as follows: for 1995, the values were 0.1685, -0.44588, and -0.00368; for 2010, they were 0.1678, -0.6179, and -0.08533; and for 2023, the index showed values of 0.20, -0.601, and -0.00765, respectively (
Figure 6). When comparing the data, the year 1995 is characterized by a significantly lower field variance index in contrast to the higher values observed in both 2010 and 2023. This analysis indicates a clear and significant increase in the UTFVI, reflecting a trend of rising stress levels associated with urban thermal conditions over the years.
Table 4.
UTFVI areal and percentage distribution.
Table 4.
UTFVI areal and percentage distribution.
| UTFVI value |
<0 |
0-0.005 |
0.005-0.01 |
0.01-0.015 |
0.015-0.02 |
>0.020 |
Total |
| Comfort level |
None |
Low |
Middle |
High |
Very high |
Severe |
|
| 1995 |
Area (ha) |
5104.26 |
0 |
0 |
1362.96 |
0 |
3574.44 |
10041.66 |
| Percentage |
50.8308387 |
0 |
0 |
13.573055 |
0 |
35.596107 |
100 |
| 2010 |
Area (ha) |
4650.93 |
0 |
551.7 |
0 |
571.77 |
4267.26 |
10041.66 |
| Percentage |
46.3163461 |
0 |
5.4941115 |
0 |
5.6939789 |
42.495563 |
100 |
| 2023 |
Area (ha) |
3731.67 |
156.24 |
153.72 |
160.74 |
160.92 |
5678.37 |
10041.66 |
| Percentage |
37.1618836 |
1.555918 |
1.5308226 |
1.6007314 |
1.6025239 |
56.548121 |
100 |
The thermal comfort levels in the city have significantly worsened over time. In 1995, 23 hectares were classified as having no thermal discomfort, while 44 hectares were considered severely uncomfortable. By 2010, the situation had deteriorated, with the area of no discomfort remaining at 23 hectares but the severely uncomfortable area expanding to 54 hectares. Finally, in 2023, the area with no thermal discomfort remained at 23 hectares, while the severely uncomfortable area had expanded to 78 hectares. This demonstrates a dramatic increase in the area experiencing severe thermal stress over the past three decades.
The analysis of the UTFVI indicates that Adama City has experienced significant variations in thermal comfort levels over time. In 1995, the majority of the city was characterized by good to very good thermal conditions, providing a relatively comfortable environment for its residents. However, by 2010, the city underwent notable changes, with a shift in classification as most areas transitioned to moderate and high thermal conditions, indicating a decline in comfort levels. This trend continued into 2023, when the city predominantly exhibited high to very high thermal conditions, reflecting an increase in thermal stress. Overall, the summary of the thermal comfort level analysis illustrates a concerning trajectory, highlighting the need for effective urban planning and mitigation strategies to address the rising thermal challenges faced by the city.
3.3. Comparison with Other Studies
It is essential to validate results and place them within the larger body of literature on a given topic to compare and test their findings against previous work. A study (Balew & Korme, 2020) analyzed the land surface temperature (LST) of a city found in northern Ethiopia with similar topographical conditions and found a significant temporal variation, which closely resembles the results of our study. Research conducted by (Dibaba, 2023) in two major cities in western Ethiopia, reached comparable conclusions, noting a significant increase in LST values, which contributes to urban heat stress. These analyses of long-term LST and UHI variations indicate a deteriorating thermal environment, consistent with our findings that the surface temperature is becoming worse year to year. The data presented concerning the estimated intensity of LST in Adama City, Ethiopia, is consistent with study (Eshetie, 2024; Moisa et al., 2022; Negesse et al., 2024; Woldesemayat & Genovese, 2021) performed Addis Ababa capital of Ethiopia, near to Adama city, reports that the maximum LST and UTFVI values increased significantly over the years, which is in line with how the urban environment is growing and how that is influencing regional temperature patterns. The findings align with similar studies conducted in Ethiopia (Balew & Korme, 2020; Tesfamariam et al., 2023), East African urban areas (X. Li et al., 2021), and other worldwide studies (Das et al., 2021). Overall, the results from our study are consistent with those of other closely related works and describe broader trends in Urban energy dynamics.
3.4. Implications for Sustainable Urban Environment
Urban thermal pattern alteration in cities can indicate several things about the environment. Thermal variation implies public health that is mainly affected by urbanization-caused heat variation and intensification. Higher temperatures in urban areas can exacerbate heat-related illnesses, particularly among vulnerable populations such as the elderly, children, and those with pre-existing health conditions. This implication is also described by (Tong et al., 2021). The intensification of heat in urban areas has implications for energy consumption and urban infrastructure. Higher temperatures result in increased demand for air conditioning and cooling systems, leading to higher energy consumption and associated greenhouse gas emissions. Additionally, the UHI effect can place stress on urban infrastructure such as roads, buildings, and utilities, leading to higher maintenance costs and reduced lifespan of infrastructure. This linkage is strongly described by (Zhan et al., 2023). Urban planning and design require an integrated approach to address these effects, emphasizing green infrastructure, sustainable land use, and the incorporation of heat-resilient design concepts. Cities may work toward constructing safer and more sustainable urban environments for present and future generations by taking into account the effects of heat intensification on different sectors of the urban environment.
4. Conclusions and Key Recommendation
This study aims to assess the long-term thermal environment variation of Adama City, Ethiopia, utilizing Landsat remote sensing data and geospatial tools. The study used the MW algorithm for surface temperature retrieval. The study analyzed the spatial and temporal changes in land surface temperature, urban heat island, and urban thermal field variance of Adama City over the past 28 years, from 1995 to 2023. Surface temperatures in the research region have gradually climbed over the last 28 years. The highest increment is shown on maximum temperature. The LSTs range from 17.02 °C to 29.59 °C in 1995, 17.93 °C to 34.85 °C in 2010, and 20.16 °C to 40.39 °C in 2023. The highest Urban Heat Island (UHI) values recorded were 3.25, 2.44, and 2.84 for the years 1995, 2010, and 2023, respectively. Moderate UHI values were observed at -3.776, -3.54, and -3.717 for the same years. In contrast, low UHI values measured -4.927, -4.62, and -4.269 in 1995, 2010, and 2023. These values indicate fluctuations in the intensity of the UHI effect over time, with a notable variation in both high and low UHI readings. Adama City’s thermal comfort levels have fluctuated significantly over time, as evidenced by analysis of the UTFVI. Specifically, the maximum, minimum, and average UTFVI values recorded for the years 1995, 2010, and 2023 were as follows: for 1995, the values were 0.1685, -0.44588, and -0.00368; for 2010, they were 0.1678, -0.6179, and -0.08533; and for 2023, the index showed values of 0.20, -0.601, and -0.00765, respectively. Adama City has experienced a significant decline in thermal comfort, transitioning from predominantly good to very good conditions in 1995, to moderate and high conditions in 2010, and finally to high and very high conditions in 2023, indicating increasing thermal stress. The research findings revealed that the city is experiencing a steady rise in temperatures over time, while also demonstrating a lower heat stress in the city center compared to the surrounding areas during the three years studied. This situation underscores the urgent need for effective urban planning and design strategies that prioritize thermal comfort and resilience in the face of ongoing climate challenges. To promote sustainable urban development in the context of urban heat stress management, the following key recommendations can be considered: increasing integrated parkland, green roofs, and street trees since these measures ameliorate both surface heat fluxes as well air temperature, using materials that are both reflective and permeable to reduce the absorption of heat by cool pavements, which will help slow down the urban heat island effect. Furthermore, making water features like pools and fountains helps with evaporative cooling to also lower ambient temperatures. Finally, sustainable urban planning strategies emphasizing mixed-use development and energy-efficient building design stand to mitigate heat retention while improving the city’s adaptive capacity in light of increasingly high temperatures, create and implement decision support systems (DSS) to guarantee sustainable land use planning, and manage the problems. The above points are essential for addressing urban thermal stress and the temporal variations, and to support sustainable urban development. Future research can investigate the relationships between surface temperature and elevation, climate change, and land use patterns to draw tangible conclusions.
Author Contributions
B. B. has undertaken all aspects of the research: conceptualization, data collection, conducting experiments, writing the manuscript, and performing reviews and revisions.
Funding
This research received no external funding.
Data Availability Statement
The data that support the findings of this study are available from the corresponding author, upon reasonable request.
Conflicts of Interest
The author declares no conflict of interest.
References
- Aghamolaei, R., Azizi, M. M., Aminzadeh, B., & O’Donnell, J. (2023). A comprehensive review of outdoor thermal comfort in urban areas: Effective parameters and approaches. Energy and Environment, 34(6), 2204–2227. [CrossRef]
- Balew, A., & Korme, T. (2020). The Egyptian Journal of Remote Sensing and Space Sciences Monitoring land surface temperature in Bahir Dar city and its surroundings using Landsat images. The Egyptian Journal of Remote Sensing and Space Sciences, 23(3), 371–386. [CrossRef]
- Briciu, A. E., Mihaila, D., Graur, A., Oprea, D. I., Prisacariu, A., & Bistricean, P. I. (2020). Changes in the water temperature of rivers impacted by the urban heat island: Case study of Suceava city. Water (Switzerland), 12(5). [CrossRef]
- Bulti, D. T., & Abebe, B. G. (2020). Analyzing the impacts of urbanization on runoff characteristics in Adama city, Ethiopia. SN Applied Sciences, 2(7), 1–13. [CrossRef]
- Bulti, D. T., & Assefa, T. (2019). Analyzing ecological footprint of residential building construction in Adama City, Ethiopia. Environmental Systems Research, 8(1). [CrossRef]
- Choudhury, U., Singh, S. K., Kumar, A., Meraj, G., Kumar, P., & Kanga, S. (2023). Assessing Land Use/Land Cover Changes and Urban Heat Island Intensification: A Case Study of Kamrup Metropolitan District, Northeast India (2000–2032). Earth (Switzerland), 4(3), 503–521. [CrossRef]
- Clark, D. B., Xue, Y., Harding, R. J., & Valdes, P. J. (2001). Modeling the impact of land surface degradation on the climate of tropical North Africa. Journal of Climate, 14(8), 1809–1822. [CrossRef]
- Crétat, J., Richard, Y., Pohl, B., Emery, J., Dudek, J., Roy, D., Pergaud, J., Rega, M., Poupelin, M., Joly, D., Thévenin, T., Marquès, E., & Masson, V. (2024). Impact of topography and land cover on air temperature space-time variability in an urban environment with contrasted topography (Dijon, France, 2014–2021). Theoretical and Applied Climatology, 155(3), 1941–1958. [CrossRef]
- Das, N., Mondal, P., Sutradhar, S., & Ghosh, R. (2021). Assessment of variation of land use/land cover and its impact on land surface temperature of Asansol subdivision. Egyptian Journal of Remote Sensing and Space Science, 24(1), 131–149. [CrossRef]
- Degefu, M. A., Argaw, M., Feyisa, G. L., & Degefa, S. (2023). Dynamics of green spaces- Land surface temperature intensity nexus in cities of Ethiopia. Heliyon, 9(2), e13274. [CrossRef]
- Dibaba, W. T. (2023). Urbanization-induced land use/land cover change and its impact on surface temperature and heat fluxes over two major cities in Western Ethiopia. Environmental Monitoring and Assessment, 195(9), 1–20. [CrossRef]
- Eshetie, S. M. (2024). Exploring urban land surface temperature using spatial modeling techniques: a case study of Addis Ababa city, Ethiopia. Scientific Reports, 1–16. [CrossRef]
- Fonseka, P., Marasinghe, S., & Rila, M. (2022). Impact of urban induced heat on the lightning activity of Srilanka: Colombo and suburbs. 43rd Asian Conference on Remote Sensing, ACRS 2022, 10–12.
- García, D. H. (2022). Analysis of Urban Heat Island and Heat Waves Using Sentinel-3 Images: a Study of Andalusian Cities in Spain. Earth Systems and Environment, 6(1), 199–219. [CrossRef]
- García, D. H., & Díaz, J. A. (2023). Space-time analysis of the earth’s surface temperature, surface urban heat island and urban hotspot: relationships with a variation of the thermal field in Andalusia (Spain). Urban Ecosystems, 26(2), 525–546. [CrossRef]
- Gebreselassie, T. A., & Rao, P. P. J. (2021). Geospatial Location Based Study for Establishment of New Public Health Centers: A Case of Adama City, Oromia, Ethiopia. International Journal of Recent Technology and Engineering (IJRTE), 10(3), 221–230. [CrossRef]
- Ghribi, M., & Dahech, S. (2023). The Impact of the Urban Heat Island on the Sensation of Thermal Comfort and Electricity Consumption in Sfax in Central-Eastern Tunisia during the Hot Season. Energies, 16(2). [CrossRef]
- Gök, D. T., Scherler, D., & Wulf, H. (2024). Land surface temperature trends derived from Landsat imagery in the Swiss Alps. May, 1–29.
- Hamed Fahmy, A., Amin Abdelfatah, M., & El-Fiky, G. (2023). Investigating land use land cover changes and their effects on land surface temperature and urban heat islands in Sharqiyah Governorate, Egypt. Egyptian Journal of Remote Sensing and Space Science, 26(2), 293–306. [CrossRef]
- Husain, A., Kumar, P., & Gonencgil, B. (2023). Assessment of Spatio-Temporal Land Use/Cover Change and Its Effect on Land Surface Temperature in Lahaul and Spiti, India. 1–20.
- Kalogeropoulos, G., Dimoudi, A., Toumboulidis, P., & Zoras, S. (2022). Urban Heat Island and Thermal Comfort Assessment in a Medium-Sized Mediterranean City. Atmosphere, 13(7). [CrossRef]
- Kanga, S., Meraj, G., Johnson, B. A., Singh, S. K., PV, M. N., Farooq, M., Kumar, P., Marazi, A., & Sahu, N. (2022). Understanding the Linkage between Urban Growth and Land Surface Temperature—A Case Study of Bangalore City, India. Remote Sensing, 14(17). [CrossRef]
- Kikon, N., Singh, P., Singh, S. K., & Vyas, A. (2016). Assessment of urban heat islands (UHI) of Noida City, India using multi-temporal satellite data. Sustainable Cities and Society, 22, 19–28. [CrossRef]
- Kumar, A., Agarwal, V., Pal, L., Chandniha, S. K., & Mishra, V. (2021). Effect of Land Surface Temperature on Urban Heat Island in Varanasi City, India. J, 4(3), 420–429. [CrossRef]
- Li, Jackson, T. J., Kustas, W. P., Schmugge, T. J., French, A. N., Cosh, M. H., & Bindlish, R. (2004). Deriving land surface temperature from Landsat 5 and 7 during SMEX02/SMACEX. Remote Sensing of Environment, 92(4), 521–534. [CrossRef]
- Li, X., Stringer, L. C., & Dallimer, M. (2021). The spatial and temporal characteristics of urban heat island intensity: Implications for East Africa’s urban development. Climate, 9(4). [CrossRef]
- Li, Z., Wu, H., Duan, S., Zhao, W., Ren, H., & Liu, X. (2022). Satellite Remote Sensing of Global Land Surface Temperature: Definition, Methods, Products, and Applications Reviews of Geophysics. [CrossRef]
- Lu, Y., Feng, X., Xiao, P., Shen, C., & Sun, J. (2009). Urban heat island in the summer of Nanjing based on TM data. 2009 Joint Urban Remote Sensing Event, June 2009. [CrossRef]
- Moisa, M. B., Dejene, I. N., Roba, Z. R., & Gemeda, D. O. (2022). Impact of urban land use and land cover change on urban heat island and urban thermal comfort level: a case study of Addis Ababa City, Ethiopia. Environmental Monitoring and Assessment, 194(10). [CrossRef]
- Moisa, M. B., & Gemeda, D. O. (2022). Assessment of urban thermal field variance index and thermal comfort level of Addis Ababa metropolitan city, Ethiopia. Heliyon, 8(8), e10185. [CrossRef]
- Mustafa, E. K., Co, Y., Liu, G., Kaloop, M. R., Beshr, A. A., Zarzoura, F., & Sadek, M. (2020). Study for Predicting Land Surface Temperature ( LST ) Using Landsat Data: A Comparison of Four Algorithms. 2020.
- Mwangi, P. W., Karanja, F. N., & Kamau, P. K. (2018). Analysis of the Relationship between Land Surface Temperature and Vegetation and Built-Up Indices in Upper-Hill, Nairobi. Journal of Geoscience and Environment Protection, 06(01), 1–16. [CrossRef]
- Nasar-u-minallah, M. (2018). Spatial and Temporal Change Assessment in Land Surface Temperature of Lahore using GIS and Remote Sensing Techniques. 55(April), 67–76.
- Negesse, M. D., Hishe, S., & Getahun, K. (2024). Urban land use, land cover change, and urban microclimate dynamics. Discover Environment. [CrossRef]
- Ogunode, A., & Akombelwa, M. (2017). An algorithm to retrieve Land Surface Temperature using Landsat-8 Dataset. 6(2), 262–276.
- Pantavou, K., Kotroni, V., & Lagouvardos, K. (2024). Thermal environment and indices: an analysis for effectiveness in operational weather applications in a Mediterranean city (Athens, Greece). International Journal of Biometeorology, 68(1), 79–87. [CrossRef]
- Regassa, B., Kassaw, M., & Bagyaraj, M. (2020). Analysis of Urban Expansion and Modeling of LULC Changes Using Geospatial Techniques: The Case of Adama City. Remote Sensing of Land, 4(1–2), 40–58. [CrossRef]
- Ren, J., Shi, K., Li, Z., Kong, X., & Zhou, H. (2023). A Review on the Impacts of Urban Heat Islands on Outdoor Thermal Comfort. Buildings, 13(6). [CrossRef]
- Rendana, M., Idris, W. M. R., Rahim, S. A., Abdo, H. G., Almohamad, H., Al Dughairi, A. A., & Al-Mutiry, M. (2023). Relationships between land use types and urban heat island intensity in Hulu Langat district, Selangor, Malaysia. Ecological Processes, 12(1). [CrossRef]
- Shahfahad, Talukdar, S., Rihan, M., Hang, H. T., Bhaskaran, S., & Rahman, A. (2022). Modeling urban heat island (UHI) and thermal field variation and their relationship with land use indices over Delhi and Mumbai metro cities. Environment, Development and Sustainability, 24(3), 3762–3790. [CrossRef]
- Subramanian, D. (2023). Quantifying thermal variation around gray infrastructure in urban India. Frontiers in Water, 5. [CrossRef]
- Tesfamariam, S., Govindu, V., & Uncha, A. (2023). Spatio-temporal analysis of urban heat island (UHI) and its effect on urban ecology: The case of Mekelle city, Northern Ethiopia. Heliyon, 9(2), e13098. [CrossRef]
- Tong, S., Prior, J., McGregor, G., Shi, X., & Kinney, P. (2021). Urban heat: An increasing threat to global health. The BMJ, 375, 1–5. [CrossRef]
- Twumasi, Y. A., Merem, E. C., Namwamba, J. B., Mwakimi, O. S., Ayala-silva, T., Frimpong, D. B., Ning, Z. H., Asare-ansah, A. B., Annan, J. B., Oppong, J., Loh, P. M., Owusu, F., Jeruto, V., Petja, B. M., Okwemba, R., Mcclendon-peralta, J., Akinrinwoye, C. O., & Mosby, H. J. (2021). Estimation of Land Surface Temperature from Landsat-8 OLI Thermal Infrared Satellite Data. A Comparative Analysis of Two Cities in Ghana. 131–149. [CrossRef]
- Ullah, N., Siddique, M. A., Ding, M., Grigoryan, S., Zhang, T., & Hu, Y. (2022). Spatiotemporal Impact of Urbanization on Urban Heat Island and Urban Thermal Field Variance Index of Tianjin City, China. Buildings, 12(4), 21–23. [CrossRef]
- UN. (2018). Around 2.5 billion more people will be living in cities by 2050, projects a new UN report. United Nations. Available online: https://www.Un.Org/En/Desa/around-25-Billionmore-People-Will-Be-Living-Cities-2050-Projects-New-Un-Report.
- Woldesemayat, E. M., & Genovese, P. V. (2021). Monitoring urban expansion and urban green spaces change in Addis Ababa: Directional and zonal analysis integrated with landscape expansion index. Forests, 12(4), 1–19. [CrossRef]
- Yang, L., Qian, F., Song, D. X., & Zheng, K. J. (2016). Research on Urban Heat-Island Effect. Procedia Engineering, 169, 11–18. [CrossRef]
- You, G. J., & Ringler, C. (2013). Hydro-economic modeling of climate change impacts in Ethiopia IFPRI Discussion Paper 00960 Hydro-Economic Modeling of Climate Change Impacts in Ethiopia Gene Jiing-Yun You Environment and Production Technology Division. January 2010.
- Zhan, D., Sezer, N., Hou, D., Wang, L., & Hassan, I. G. (2023). Integrating Urban Heat Island Impact into Building Energy Assessment in a Hot-Arid City. Buildings, 13(7). [CrossRef]
|
Disclaimer/Publisher’s Note: The statements, opinions and data contained in all publications are solely those of the individual author(s) and contributor(s) and not of MDPI and/or the editor(s). MDPI and/or the editor(s) disclaim responsibility for any injury to people or property resulting from any ideas, methods, instructions or products referred to in the content. |
© 2024 by the author. Licensee MDPI, Basel, Switzerland. This article is an open access article distributed under the terms and conditions of the Creative Commons Attribution (CC BY) license (https://creativecommons.org/licenses/by/4.0/).