
Submitted:
15 November 2024
Posted:
18 November 2024
You are already at the latest version
Abstract
Oil refining industry have as a challenge the high-octane gasoline production and its reformulation with low benzene content. This work reports a mass balance of benzene emissions from gasoline vessel transfers and transport operations in Mexico, with an estimated total maximum flowrate of 1.48 KBPD, considering evaporative losses. The aim of this work is to provide an operative proposal for minimizing benzene emissions by developing an ASPEN HYSYS ® simulation study of the Naphtha Catalytic Reforming (NCR) process in its Continuous Catalyst Regeneration (CCR) mode at different operative conditions, in order to estimating transitional operative routes (TOR) that can improve reformate quality at the time benzene content is reduced. Operative conditions comprise a Hydrogen/ Hydrocarbon (H2/HC) ratio from 2.0 to 6.0 and a reaction temperature from 450 to 525 °C as the framework to find the best TOR by applying the Surface Response Method (SRM) Objective variables were assessed by a multi-objective optimization analysis, focusing on 1.48% (v/V), of benzene content, and 89.87 for Research Octane Number (RON) of produced gasoline. Finally, simulation results were compared with experimental data from a NCR pilot plant, in semi-regenerative (SR) mode, as well as with industrial scale data, observing significant similitudes.
Keywords:
benzene emissions
; naphtha reformation
; operative transition
; octane index
; fuels quality
1. Introduction
Global demand of oil derived fuels is one of the causes of climate change, becoming a world problem due to the atmospheric emissions generated either from the refining processes or during the use of fossil fuels as an energy source for transportation [1] triggering negative environmental and public health impacts, especially within metropolitan areas, in which there is a high vehicles concentration.
Volatile emissions from: gasoline stations, fugitive vapors from vehicles, and industrial releases associated to refineries; are considered as the main benzene exposition sources; including its air transportation from loading/ unloading gasoline bay installations. People living nearby: refineries, petrochemical plants, hazardous waste disposal sites, or gasoline stations; may be exposed to high concentration levels of benzene, through food, beverages and drinking water, which may not be as high as the exposition levels from atmospheric sources [2].
A previous study [3] versed about influencing factors on emissions with Volatile Organic Compounds (VOCs) by using a sample of 15 vehicles in China, assuming aspects such as fuel type and driving conditions. It was found that ethanol-based gasoline helped to reduce VOCs by a 16.8%, concluding that future government policies should pay more attention to atmospheric emissions from specific VOCs, and should formulate more specific strategies for reducing air pollution.
On the other hand, a preceding report [4] established that benzene emissions have significant contributions to the total amount of atmospheric pollutants, and are difficult to be punctually quantified, therefore an analysis of 120 scenarios was performed by using simulation results from a Computational Fluid Dynamics (CFD) model for comparing measurements of atmospheric dispersion of pollutants emitted from 14 refining installations in Texas.
VOCs emissions generated from industrial complexes depend on the type of industry and processed materials, producing gas mixtures that contain highly toxic compounds, hence some research projects are focused on characterizing this type of emissions and assessing both, toxicity and carcinogenicity levels, by using an equivalence factor between carcinogenicity and benzene atmospheric levels, at a petrochemical industrial park in Taiwan, concluding about the need of setting efficient control strategies for carcinogenic VOCs emissions, such like benzene, since exposure risks to these pollutants mainly arise from the generating sources [5].
1.1. NCR and Low Benzene Content Gasoline Production
The growing demand for reducing emissions generated by vehicles has led to controlling the content of aromatic compounds in gasoline. It has been estimated that emissions of Greenhouse Gases (GG) produced by the energy sector will rise between 20 to 30% by the year 2040, with this are emerging new regulations specifying properties and characteristics of oil derived products [6].
VOCs such as Benzene, Toluene and Xylene (BTX) have been considered as an environmental and public health problem because of their exposition risks, and for that reason international organizations have established standard non-hazardous limits, observing that within or even below these limits constant exposition to these toxic chemical products may also have negative consequences [7].
Since 85% of total benzene emissions are attributed to fuel use in Mexico, arises the necessity to improve gasolines quality, fulfilling what commands the Mexican standard, emphasizing about the maximum concentration of benzene at 1% (v/V) for metropolitan zones of Mexico City, Monterrey and Guadalajara, and 2% (v/V) for the rest of the country; considering the high volatility of benzene, which evaporates to the atmosphere affecting population’s health [8].
In order to complying national normativity, Mexican refineries need to improve their existing processes for increasing fuels quality [9], being the production of reformulated low benzene gasolines with a high-octane number the main challenge for this industry [10].
Gasoline production with high-octane number, along with high concentration of aromatic compounds, such as BTX, are just two of the main objectives of the NCR process [11], in which there occur complex chemical reactions in presence of a bimetallic catalyst of Pt-Re/Al2O3, one example of these reactions is the dehydrogenation of alkyl-cyclohexane that precedes aromatic compounds formation, such like benzene and its derived compounds and isomers, this is an endothermic reaction that takes place on Pt catalytic sites, being promoted at high temperature [12].
Analysis of the NCR process, focusing benzene reduction of reformed naphtha may represent an alternative for finding better operative conditions that would conduct to decreasing environmental and public health impacts through better quality gasoline production with lower benzene content and high-octane number.
Other works on oriented research to modeling, simulation and optimization of the NCR process [13,14,15,16,17]; are focused on the operative improvement from a technical point of view, leaving behind environmental aspects, being Iran, China and the USA the countries accumulating most of the recent publications about the NCR process.
A multiple regression model has been reported for estimating the content of aromatic compounds from high quality gasoline with Research Octane Number (RON) between 94.4 up to 98.5, and of standard gasoline with RON between 84.7 up to 94.4 [18], this model was only based on two physical properties of gasoline, Relative Density (RD) and Final Boiling Point (FBP), finding that contents of aromatic compounds, estimated by the model, were between 17.6 and 36.4% (v/V). This method may also be applied for calculating benzene, toluene, and xylene concentrations of gasoline.
A decrease on the generation of pollutant emissions caused by logistic transport/ handling, and fuels combustion; may be achieved through the implementation of new operative optimization techniques, focused on increasing gasoline quality. All operative improvements that could be reached, may be applied towards a more sustainable operative performance of the NCR process.
In this work it has been developed an alternative method for assessing the reduction of GG emissions, especially VOCs, by focusing on the study and implementation of new technological and operative options for controlling selectivity of NCR reactions. Finally, it has also been possible to establish a relationship between a process technical analysis and operative excellence, in order to improving industrial operations that would allow a cut of pollutant emissions after setting methods that can be assessed at pilot plant scale and by simulation.
1.2. NCR Process Description
This is a fundamental process for high-octane gasoline production, in which a complex low sulfur hydrocarbons mixture (hydro-desulfurized naphtha) is fed to the system. Main components of this mixture are n-paraffins, naphthenes, and aromatic compounds [19], which are molecularly restructured, in presence of a bimetallic catalyst of Pt-Re/γ-Al2O3, prior forming a reformate product with a higher content of aromatic compounds finding among them benzene, in order to increasing gasoline octane number [20]. This process involves chemical reactions such as isomerization, cyclation, and aromatization, forming compounds that increase RON values, along with other undesired reactions of coke formation that cause catalyst deactivation du to coke deposition on active catalytic sites [21].
NCR units are classified according to the procedure being followed for catalyst regeneration, these can be semi-regenerative (SR), continuous catalyst regeneration (CCR), and cyclic regeneration (CR) [22]. Figure 1 represents a general scheme of the CCR process, which is considered the most recent of the NCR process, it comprises 3 to 4 extended bed reactors, connected one on top of each other, and followed by a continuous catalyst regeneration system. One of the main advantages of this type of process is related to the quality of the reformate product, since its configuration allows processing low quality naphtha for obtaining reformate naphtha with high-octane number, between 95 to 108 [23].
2. Materials and Methods
2.1. Mass Balance of Benzene Emissions and Scenarios Analysis
For estimating the mass balance of benzene emissions, it was assumed in Mexico, and during 2023, a refining capacity of 2,040 KBPD of crude oil, and an annual average gasoline production of 252.4 KBPD. Additionally, for imported gasoline it was accounted an annual average of 419.5 KBPD [25], with a benzene content of 0.75% (v/V) approx. [26]. A conceptual diagram of the mass balance is shown in Figure 2, in which there are 10 identified benzene emission sources (Ei…n) associated to: refining process, fuels storage and transportation, public sales and dispatch at gasoline stations, and those generated from vehicles.
Additional data [27], have set that gasoline logistic transportation in Mexico is carried out by means of ducts (65%), tank cars (26%), tankers (6%), and rail trains (3%). In this sense, there also are reported factor values associated to evaporative fuel losses during gasoline storage and distribution (see Table 1).
Mass balance equations were established for quantifying total benzene emissions, which may be described as follows: “F” referring to the total gasoline produced flowrate in KBPD, “XB,i“ defined as benzene content, and “Ei “ corresponding to a benzene fugitive emission flowrate in KBPD. Additionally, it has been assumed a benzene gasoline content between 0.75 to 2% (v/V) for processed gasoline in Mexico, this based upon a national standard NOM-016-CRE-2016 [32]. Hence, for evaporative losses during refining processes mass balance equations (1) and (2) are as follows:
where “L” represents the volumetric percent of evaporative losses.
For evaporative losses at storing terminals, equation (3) is the following:
For evaporative losses during distribution, equation (4) is:
A general expression for estimating benzene fugitive emissions is described by equation (5):
Equation (6) was used for estimating total emissions flowrate of evaporative losses.
where “n” is the total number of emission sources.
Figure 2 shows a schematic conceptual mass balance of gasoline storage and transportation for estimating the total flowrate of evaporative losses with the consequent atmospheric emissions of benzene.
Based on the conceptual mass balance shown in Figure 2 (see Appendix A for a full description of nomenclature), it was calculated that for a 2% (v/V) benzene content in gasoline, a total associated benzene production of 6.94 KBPD and 1.48 KBPD of benzene emissions. Results for each source, along with flowrate distribution from the gasoline production and logistic chains, across the mass balance network are reported in Appendix A.
A summarized scenarios analysis about benzene content in gasoline estimates that by reducing benzene content down to 0.75% (v/V), as the imported gasoline, benzene emissions may be reduced by 39.9% as reported in Table 2, such reduction may be achieved by optimizing the NCR process.
2.2. Simulation Design
Aiming to select the most influential independent variables of the NCR process, a sensitivity analysis was performed by comparing their effects on each depending variable. Independent variables such as: reaction temperature (T); Hydrogen/ Hydrocarbons molar feedstock ratio (H2/HC); total feedstock flowrate (F), and operative pressure (P); were assessed analyzing their influence on response variables like: Research Octane Number (RON) of the reformed naphtha; aromatic compounds content [A %(v/V)], and benzene content [B %(v/V)], in Figure 3 are shown results from the sensitivity analysis, observing that for simulation design and optimization of independent variables, the most influential on response variables are reaction temperature (T), and Hydrogen/ Hydrocarbons molar feedstock ratio (H2/HC).
In this work, simulation applied operative conditions were taken from industrial scale data, being a total feedstock flowrate (F) of 120,075 kg h-1, a reaction temperature (T) between 457 and 503 °C, an initial RON value of 75.25 from fed naphtha, with a volumetric composition (% v/V) of 24.78% of naphthenes; 39.7% of iso-paraffins; 22.28% of n-paraffins, and 12.91% of aromatic compounds. Furtherly, an experimental design for in-silico experiments was carried out using the REFSYS ® simulation module from ASPEN HYSYS ® V8 with license number (34.0.0.8909), considering all independent variables. Simulation design was based on scenarios reported in Table 3.
2.3. Surface Response Method (SRM)
SRM is a statistical method for experimental design and optimization analysis about the effect from operative process variables on objective response variables, depending upon the number of variables involved during the analysis, complexity of statistical models may increase, however, multi-objective optimization requires complex mathematical models that allow generating multiple responses, for example, an application of these type of models has been reported with the aim of optimizing yield from fuel engines, while minimizing atmospheric emissions, some examples of available software are Design-Expert (State-Ease Inc.) and Minitab (Minitab Inc.) [33].
Moreover, SRM can be combined with an experimental strategy and statistical modeling that help to finding optimum operative process conditions. Generally, SRM follows an initial experimental stage, in order to estimate operativity regions for established objectives from response variables [34].
Analyses based on the SRM require a multiple regression study that allows to determine a relationship between process variables (i.e. T and H2/HC) and response variables [35]. Process simulation results have been used for building multivariate statistical models for each of the identified response variables (see Table 4).
Statistical models used for the SRM are polynomic equations helping to predict a response as a function of entry factors [33] such that when having a “k” number of factors, a first order model has a general form like equation (7) [34].
A second order model has the general form of equation (8).
where “Y” is the response variable; “xi” are the independent variables, is the average of response values, and are the regression coefficients of the generated model.
Statistical models for each response variable are useful for predicting results at different operative conditions, which then are used for generating response surfaces, where response objective states are identified, in order to calculating an optimal Transitional Operative Route (TOR) that will drive operative changes towards achieving optimum values that were previously defined.
2.4. Procedure for Identifying an Optimal TOR
A feasible method for estimating useful models that allow defining and assessing TORs, consists of setting operative conditions for simulating the CCR type of the NCR process, and then proceed to generate results that can be used when calculating multivariate models of the response surface, once the latest are obtained it is possible to identify TORs from an Initial Operative State (IOS) to an Objective Operative State (OOS), bearing in mind quality improvement of the NCR products. Operative zones are also analyzed on surface response by performing an impact assessment within process operation, remarking that benzene content minimization may help for reducing VOCs atmospheric emissions due to use of gasoline.
2.5. Multi-Objective Optimization
A simple method for multi-objective optimization is mainly based on description of the optimization problem, for establishing multi-objective functions, and identification of minimizing and maximizing objectives, in order to select the best optimization algorithm [36].
Using surface graphs generated by the SRM, and contour plots for each response variable, as a function of operative conditions; it was carried out a contours superposition for finding a region where response variables simultaneously have feasible values.
2.6. Pilot Plant Experiments
Pilot plant tests were performed using a semi-regenerative (SR) NCR system with a 3-reactors serially connected (see Figure 4), which can operate between the following conditions: 10 to 190 bar of pressure; 350 to 550 °C of temperature, and 0.5 to 8 h-1 of space velocity. The procedure for carrying out a pilot plant operative experimental run comprises the following steps:
- Preliminary conditioning: this stage includes catalytic reactors packing, filters cleansing, and tanks filling.
- Leaking tests with nitrogen and hydrogen.
- Catalyst conditioning.
- Pilot plant stabilization at selected operative conditions for starting an experimental run.
- System feed with hydro-desulfurized naphtha.
- Mass balance confirmation.
- Heating up of the reaction section.
- Operation, monitoring, and on/off-line sampling of reformation products.
Since pilot plant operation is carried out under isothermal conditions, it is recommended to pack the catalyst at the middle of each reactor and packing top and bottom with silicon carbide (SiC), as an inert material, and glass wool at reactor inlet and outlet for promoting diffusion. The load of each reactor is done by placing the catalyst in between the inert material, and the later helps for preheating and naphtha vaporization. The middle of the reactor is then filled with a volumetric load of the reformation catalyst to be tested. Total working volume capacities of reactors 1, 2, and 3 are: 196 cm3, 302 cm3, and 391 cm3, respectively. This volumetric distribution of the reactors can improve flow patterns through an increment of fluids retention and a better residence time distribution. Finally, inert material also helps to achieve isothermal conditions.
2.7. Analytical Methods of NCR Products and Byproducts
For analytical quantification of products and byproducts from the NCR process, the pilot plant has two on-line gas chromatographers (GC), the first one for hydrogen analysis (HiSpeed) and a second one for a detailed hydrocarbon analysis (DHA).
2.7.1. GC for Detailed Hydrocarbon Analysis (DHA)
Aiming to analyze quality and composition of intermediate products, generated from each reactor, an on-line DHA-GC GC7890 DHA model of the brands Petroleum Analytical Company ® / Analytical Controls ® / Agilent Technologies ®, with automatic liquid sampler and a 5 μL syringe, with a capillary column filled with dimethyl-silicone, and a Flame Ionization Detector (FID), was used for determining individual components from a hydrocarbons sample, following D6729, D5134, D6730, and D6733 ASTM methods. The DHA-GC also includes an on-line gas injection system connected to intermediate sampling ports in between reactors and at the outlet of the third reactor.
DHA-GC methods are generally used for investigating individual hydrocarbon components from fuels and fuel mixtures (of boiling point range up to 225 °C), with oxygenated compounds, used in spark ignition engines. This method is also comparable with more selective methods, including those looking for olefins, and other analytes from different chemical groups of hydrocarbons. Although, DHA-GC methods can analyze benzene, toluene, and several oxygenated compounds, it is feasible to obtain a confirmatory analysis by using more specific testing methods. As a reference, it has been reported that ASTM D6729 method has also been applied for analyzing virgin naphtha samples using Argon (Ar) as a carrier [37].
2.7.2. Multidimensional GC
A GC system called Reformulyzer M4 model of the brands Petroleum Analytical Company ® / Analytical Controls ® / Agilent Technologies ®, multidimensionally configurated with several coupled GC columns as described in the D6839 ASTM method [38], was used for analyzing liquid naphtha samples (at the inlet of the pilot plant) and condensed reformate (produced from the pilot plant), this method reports aromatics content, benzene composition and a full PIANO (Paraffins, Iso-paraffins, Aromatics, Naphthenes, and Olefins) analysis, with an estimated RON value for each sample.
2.8. GC Measurement and Estimation of RON Values
RON values were measured by indirect analytical methods like DHA-GC (for on-line samples) and multidimensional GC (for off-line samples), and estimated using chromatographic results and dividing these into 31 chemical contribution groups, assigning to each group a RON value as reported in [39], so obtaining an average RON value from equation (9):
where “Wi” is the mass fraction of group “i” and “(RONgroup)i” is the octane number assigned to each hydrocarbon contribution group.
During process operation it is important a quality assessment of hydrotreated naphtha being fed to the reformer. DHA-GC and multidimensional GC are currently the mainly applied techniques for indirect RON measurement, and estimation.
3. Results
Data obtained from simulation were used for estimating multivariate quadratic models as the following equation (10):
where “yi” is the dependent variable, “x1” is the temperature (T) in °C and “x2” is the Hydrogen/ Hydrocarbon molar ratio of the feedstock (H2/HC), then a set of statistical coefficients was obtained by multivariate regression analysis, so generating an equation for each dependent variable [RON, A% (v/V) and B% (v/V)] (see Table 5) and response surface plots shown in Figure 5.
3.1. Operative Zones and Transitional Operative Routes (TOR)
By using the statistical models and data generated from their analysis, it was possible to identifying operative zones for each dependent variable, hence boundary values were selected establishing the following constraints aiming to keep a productive quality:
- RON values between 87 and 93.
- Aromatic compounds content between 30 and 40% (v/V).
- Benzene content between 0.75 and 1.5 %(v/V).
Therefore, assuming these criteria operative zones were searched for each dependent variable, observing from a response surface superposition, some areas of acceptable productive quality, as a function of each stablished constraint. The intersective zone arising from the operative zone for each dependent variable was names as the “searching zone “ for improved operative conditions that could simultaneously satisfy productive quality criteria as defined (see Figure 6).
Figure 6 shows a superposition of operative zones for each dependent variable, giving as a result the “searching zone” that can approximately be found between 482 and 491 °C, and between 2.0 and 3.8 mol/mol for the “H2/HC” feedstock ratio. Therefore, in this work it is proposed the temperature of 491 °C and a “H2/HC” feedstock ratio of 2.0 as the Objective Operative State (OOS) to be reached from an Initial Operative State (IOS) with a temperature of 457 °C and a “H2/HC” feedstock ratio of 6.0, in order to analyze the Transitional Operative Routes (TOR) to be followed when attempting to improve operative conditions for optimizing the produced reformate. Figure 7 shows 6 TOR analyzed for finding the optimum transition between the IOS and the OOS.
Aiming for the Objective Operative State (OOS) for an operative improvement based on a quality increment of produced gasoline, along with a minimization of benzene content, there have been identified and selected Transitional Operative Routes (TOR) shown in Figure 7. TOR 1 begins with a temperature increment from 457 to 491 °C, then followed by a reduction of the “H2/HC” feedstock molar ratio from 6.0 to 2.0. TOR 2 initiates with a reduction of the “H2/HC” feedstock molar ratio from 6.0 to 2.0, followed by a temperature increment from 457 to 491 °C. TOR 3 starts with a simultaneous rising slope change of temperature from 457 to 491 °C with a decrease of the “H2/HC” feedstock molar ratio from 6.0 to 2.6, for finally reducing the later from 2.6 to 2.0. TOR 4 comprises 3 steps, firstly maintaining a temperature of 457 °C only the “H2/HC” feedstock molar ratio is reduced from 6.0 to 4.0; secondly temperature is elevated from 457 to 491°C, and concludes with a reduction of the “H2/HC” feedstock molar ratio from 4.0 to 2.0. TOR 5 is a direct rising slope change from the IOS to the OOS, which comprises a simultaneous rise of temperature from 457 to 491 °C and a reduction of the “H2/HC” feedstock molar ratio from 6.0 to 2.0. Finally, TOR 6 starts with a temperature increment from 457 to 477 °C, followed by a rising slope change with a simultaneous temperature elevation from 477 to 491 °C, with a reduction of the “H2/HC” feedstock molar ratio from 6.0 to 3.7, to conclude with a decrease of the “H2/HC” feedstock molar ratio from 3.7 to 2.0.
An analysis of the behavior of operative transitions was performed by comparing the average values that each dependent variable [RON, A% (v/V) and B% (v/V)] took across the TOR that was followed, along with the maximum achievable value for each dependent variable, estimated from the simultaneous changing of the 3 dependent variables, so obtaining reported data of Table 6.
For the final assessment of TORs and selection of the one that could achieve the best conditions during operative transitions, it was performed an analysis over the average results from each response variable, considering that routes with higher average values for RON and A% (v/V), whereas the lower values for benzene content B% (v/V) for each response variable, across the operative transition, allowed keeping the best productive quality during the operational change from the IOS until the OOS. A pros and cons analysis for each route was carried out and selection of routes, searching for the best transition, was as follows: Route 1 produced the best average values for RON and A% (v/V), however, benzene content [B% (v/V)] was the highest with 1.410% (v/V), nevertheless this was considered as the best TOR of all; Route 2 generated the lowest values of RON, A% (v/V) and B% (v/V), being the last one the most convenient average benzene content with 0.929% (v/V); whereas Route 3 produced a %B (v/V) value of 1.227% (v/V), being the third best assessed TOR; whilst Route 4 had nearly the same benzene content as Route 3, with 1.226% (v/V) and similar results as Route 3 for RON and A% (v/V) values; Route 5 was the second best for an average value of benzene content [B% (v/V)], but has the fifth place for RON and A% (v/V) values. Finally, Route 6 was assessed as the 2nd best of all with the 2nd best RON and A% (v/V) values with a benzene content of 1.036% (v/V), which is lower than the limit established in the Mexican standard NOM-016-CRE-2016 [32].
3.2. Operative Improvement
A search for optimum values of operative variables was performed by using Minitab ® software. Results from numerical optimization were obtained for Improved Operative Conditions (IOC) with the following conditions for independent variables: T=482.52 °C and H2/HC=2.0; hence the IOS generated the following results for the dependent objective variables: RON=87.42; A% (v/V), = 34.99%, and B% (v/V)= 1.27%
3.3. Pilot Plant Experiments
An experimental Pt-Re/Al2O3 catalyst was used for testing on a naphtha catalytic reforming semi-regenerative pilot plant with a hydrogen flowrate of 83 Nl/h, under 7000 kPa of pressure, with 6000 kPa of pressure for recycled hydrogen and naphtha flowrate of 40 ml/min for 43 min, in order to set and stabilize the mass balance of naphtha flowing from the feed tank to the product tank, then naphtha flowrate was established to 30 ml/min, with a hydrogen flowrate of 500 Nl/h, under a pressure of 7000 kPa and changing temperatures from 400 °C, at day 1, 450 °C, at day 2, until 500 °C, at day 3.
3.3.1. Characterization of Naphtha Feedstock and Reformate Products
Hydrotreated naphtha was fed to the pilot plant, this naphtha was previously analyzed by Multidimensional Chromatography, results were as follows, RON=75.25, Density=0.7518 g/ml and % (v/V) composition of: 47.78% of naphthenes, 39.67% of iso-paraffins, 22.28% of n-paraffins, 0.34% of olefins, and 12.91% of aromatic compounds.
For analyzing reformate products, 10 mL samples were taken from inlet and outlet of the pilot plant streamlines, these samples were analyzed by Multidimensional-GC and DHA-GC. Liquid samples from the pilot plant were taken at the beginning of the run (feedstock sample) and at the end of day 1 (reformate 1), and so on for day 2 (reformate 2) and day 3 (reformate 3). RON values obtained were 77.54, at the end of day 1, 84.03, at the end of day 2, and 92.25, at the end of day 3. It can also be observed on Table 7, that volumetric fractions of n-paraffins and naphthenes were decreasing during operational time, whereas the volumetric fraction of aromatic compounds was increased, which corresponds to the increments measured in RON values.
3.4. Comparative Analysis of Simulations, Pilot Plant Results and Industrial Data
Data reported in Table 7 were compared with operative data at industrial scale and with results obtained by simulation, in order to determining an improved operative zone for the NCR process (see Table 8)
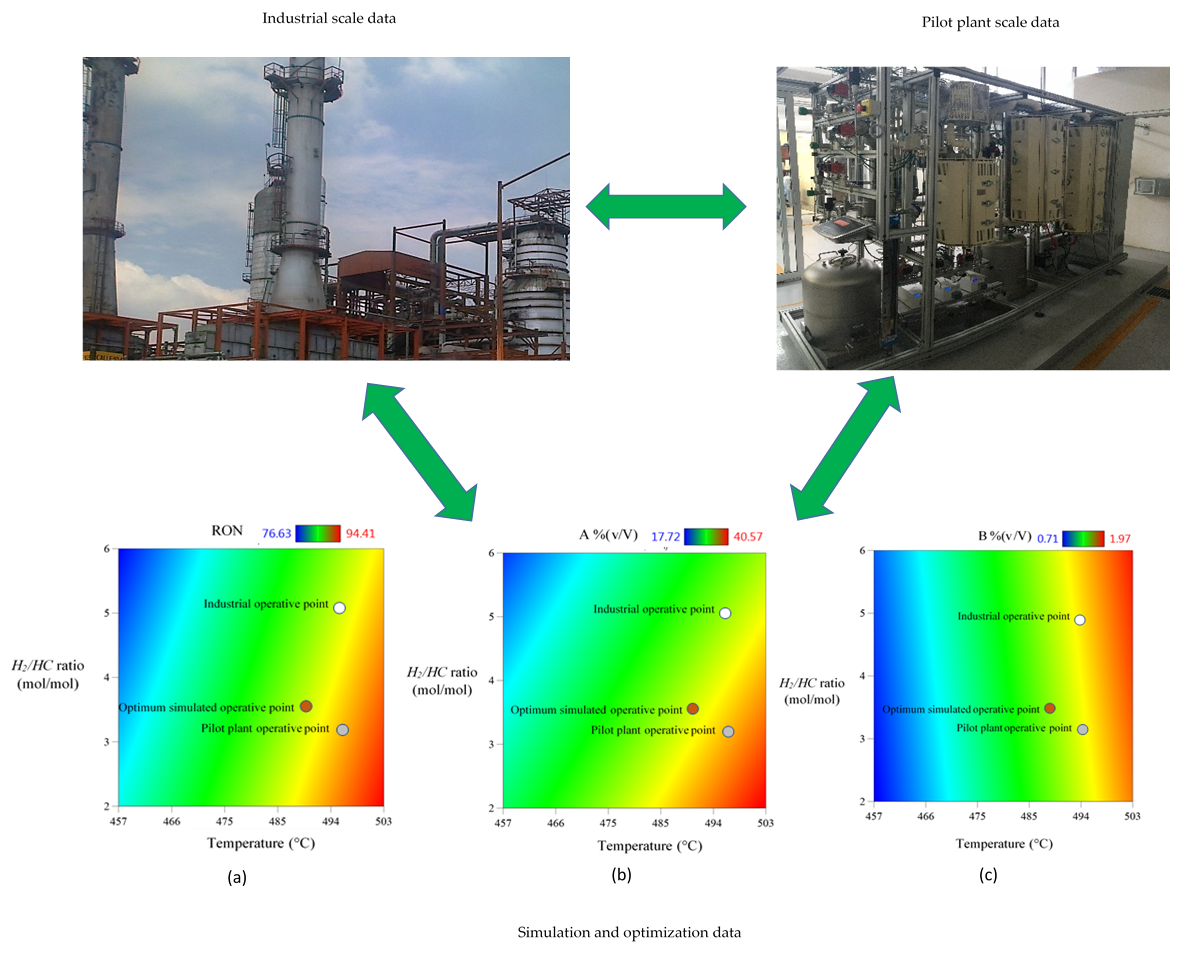
Using operative conditions shown in Table 8, there were operative zones identified for industrial and pilot plant scale, which were represented on Figure 8, along with the optimum operative zone calculated by simulation. Thus, by identifying different operative points for each response variable it could be observed that industrial and pilot plant data are coincident in a temperature value close to 480 °C, as the optimum reaction temperature of the process.
Figure 8 shows a limit temperature value of 500 °C and a lower limit value of the H2/HC ratio in 2.0, these values are considered as operative constraints for both independent variables, since there are effects on the catalyst, such like: coke formation, chemical deactivation, zeolite phase change, catalyst sintering and/or attrition. Temperature above 510 °C may cause an excess of coke formation and catalyst poisoning, hence best operative temperatures go around 498-503 °C, below this range catalytic reaction may occur with low efficiency and above the range catalyst poisoning will predominate. On the other hand, H2/HC ratio below 2.0 would decrease isomerization, cyclization and hydrocracking reactions, with higher coke formation rates resulting in a less efficient NCR process and a lower lifetime of the catalyst. H2/HC values above 6 would generate an excess of hydrogen displacing chemical equilibrium of aromatization and dehydrogenation reactions, which would reduce RON values. Therefore, any optimum operative point to be considered must be within constrained ranges of these two independent variables, in order to avoiding catalyst operative severity and a lower process profit.
Figure 9 shows a set of 3 color gradient plots of Temperature vs. H2/HC molar ratio, and against either RON values (Figure 8a), volumetric fraction of aromatic compounds A% (v/V) (Figure 8b), or volumetric fraction of benzene B% (v/V) (Figure 8c); on which three different operative points are identified, being: the Industrial Operative Point (IOP), the Pilot Plant Operative Point (PPOP), and the Optimum Simulated Operative Point (OSOP) These plots show the existing gaps between IOP and PPOP regarding the OSOP for all objective response variables. This demonstrates opportunity areas to be solved through an operative transition, in search for optimal conditions for maximizing both, RON and aromatics composition [A% (v/V)], whilst minimizing benzene content [B% (v/V)]. By applying TORs analysis, it is feasible to optimize, not only the NCR process, but also the pathway to follow for an optimal transition minimizing any loss in productivity.
4. Discussion
Content reduction of short chain aromatic compounds (C8/C8-) has been studied for increasing fuel engine efficiency of vehicles and reducing atmospheric emissions, including nitrogen oxides (NOX) associated to Ethylbenzene and Ortho-xylene combustion, when vehicles are driven at high speed [40], which agrees with this work that analyzes aromatic compounds reduction in gasoline. Particularly, focusing on benzene emissions that are considered as a constant concern for human health, when related to gasoline dispatch at gas stations, due to its high volatility and toxicity levels, arising interest of the government [41], therefore results from this work have been extended to estimating mass balance scenarios, in order to calculate benzene emissions from gasoline stations , and how these emissions may be reduced by optimizing operations from the beginning at refining processes for producing high quality gasoline.
Production of high quality gasoline has also been focused on benzene reduction; however, some solutions have been addressed towards incremental capital investments in refining processes through addition of new reaction units and significant reconfigurations of NCR plants [42], whereas in this work it is proposed an operative improvement over existing processes for achieving benzene reduction, without significant RON decrease that affect reformate quality, which may be reached avoiding high capital investments and substantial modifications of the industrial process.
Previous studies about the NCR process have focused the use of mathematical modeling, simulation and optimization tools, either for model parametrization, and/or evaluation of complex kinetic models [43], also proposing strategies for selective gasoline production by applying statistic quadratic surface response models for optimizing operative conditions such as: pressure, temperature, and space velocity; keeping the objective of RON increase [44], whilst in this work operative improvements were searched considering also TORs under multivariate conditions using surface response methods, taking temperature (T) and H2/HC feedstock ratio as the most important independent variables, and accomplishing with a multi-objective optimization analysis for RON increase and benzene reduction. Additionally, clean and high quality fuels production, helping to decrease atmospheric emissions and their associated environmental impact, has been studied as in this work [45]. In this sense, multi-criterion NCR optimization has been studied by using genetic algorithm methods, assessing temperature as the single independent variable, and searching for aromatic compounds decrease, benzene reduction, and a consequent RON cut [46], accordingly a reactor section model has been proposed for studying a countercurrent CCR reactor, optimizing aromatics, C7+ aromatics, and RON yields [47]; whereas in this work a simultaneous multivariate analysis of temperature and H2/HC feedstock ratio was performed for finding both, the optimal operative zone, by surface superposition, and TORs while reducing benzene and aromatic compounds contents (see Table 9).
Multiobjective optimization studies of the CCR process have been focused on increasing aromatics composition while reducing benzene content of the reformate, finding that increasing temperature from 520 to 530 °C it is increased the aromatics composition by 0.15% (v/V) while lowering benzene content down to 1.52 %(v/V) [24]. Conversely, other studies focus on analyzing catalyst life cycles with changing temperatures from 460 to 540 °C, obtaining RON values between 89.7 and 108.4 [29], disregarding aromatics and benzene contents. This encourages more research about quantification and reduction of benzene emissions from gasoline by using multi-objective optimization tools, considering technical and environmental issues for identifying operative states of the NCR process, that may lead to benzene reduction with no lack of fuels quality.
Comparing with pilot plant studies, a data-based model has been proposed for predicting RON, %(v/V) of benzene and Reid vapor pressure of gasoline [48], in this report a pilot plant scale reactor was used with a commercial Pt/Al2O3 catalyst packing, and by controlling pressure, temperature, space velocity, and H2/HC ratio, it was obtained data for a kinetic model about isomerization reactions for achieving a 1.58 %(v/V) of benzene content. In this work, simulation results were compared with pilot plant experimental results and industrial scale data, as complementary ways of validating data, upscaling results and generating improvement proposals.
Benzene emissions reduction has become a challenge due to carcinogenic effects due to exposition [49]. Results from this work aim to contribute to operational improvements of the NCR through relating a large scope mass balance scenarios analysis of benzene emissions with operative and transitional optimization during the refining processes, producing high quality and clean gasoline with lower environmental impact. Additionally, results of this research show that operating close to 500°C allows lowering benzene content due to the endothermic nature of dehydrogenation and dehydrocycling reactions that are promoted at high temperature [50].
Future research directions may include: TORs assessment for minimizing benzene content in fuels of maximizing aromatics for petrochemical refineries; benzene reduction with coke formation for optimizing catalyst lifetime; TORs analysis for isomerization and further separation processes of the NCR, and extended environmental impact assessments of benzene emissions on diverse scenarios of fugitive releases.
5. Conclusions
A general mass balance for benzene fugitive emissions from refineries and the whole logistic process until gasoline stations has been analyzed under different composition scenarios, finding that by lowering benzene content of gasoline, it is feasible to reduce the environmental impact from fuel production and transportation. In this sense, the NCR process optimization plays a key role for producing high quality fuels, and the analysis of transitional operations will help not only improving the process but also leading to operative excellence.
Author Contributions
Conceptualization, F.V.-A. and C.A.G.-R.; methodology, F.V.-A. and C.A.G.-R.; software, F.V.-A.; validation, F.V.-A., C.A.G.-R. and L.O.A.-V.; formal analysis, F.V.-A., C.A.G.-R., F.P.-V. and J.R.V.-I.; investigation, F.V.-A. and C.A.G.-R.; resources, C.A.G.-R. and J.R.V.-I.; data curation, F.V.-A. and L.O.A.-V.; writing—original draft preparation, F.V.-A.; writing—review and editing, C.A.G.-R.; visualization, F.P.-V., A.C.-A., C.C.-L.; supervision, C.A.G.-R., J.R.V.-I., E.M.O.-S., M.H.-J., F.P.-V. and A.C.-A.; project administration, C.A.G.-R. and C.R.-G.; funding acquisition, C.A.G.-R. and C.R.-G. All authors have read and agreed to the published version of the manuscript.
Funding
This research was funded by the Consejo Nacional de Humanidades, Ciencias y Tecnología (CONAHCyT) of the Government of Mexico, through the project grant number 166571 and the scholarship of the first author with the grant number 790337.
Data Availability Statement
The original contributions presented in this study are included in the article. Further inquiries can be directed to the corresponding authors.
Conflicts of Interest
The authors declare no conflicts of interest, and the funders had no role in the design of the study; in the collection, analyses, or interpretation of data; in the writing of the manuscript; or in the decision to publish the results.
Appendix A

Table A1.
Hydrocarbons mass balance flowrates (KBPD) related to Figure 2, and scenarios analysis of benzene fugitive emissions.
Table A1.
Hydrocarbons mass balance flowrates (KBPD) related to Figure 2, and scenarios analysis of benzene fugitive emissions.
| Variable Symbol | Description | Benzene content scenarios %(v/V) | |||
|---|---|---|---|---|---|
| 2.0 | 1.5 | 1.0 | 0.75 | ||
| F | Total gasoline production from refineries (installed capacity in Mexico) |
252.4 | 252.4 | 252.4 | 252.4 |
| XB,F | Total benzene content of gasoline produced | 5.048 | 3.786 | 2.524 | 1.893 |
| E1 | Fugitive benzene emissions from the NCR process (2%) | 0.101 | 0.076 | 0.050 | 0.038 |
| S1 | Gasoline production internally sent to storage terminals | 252.29 | 252.32 | 252.35 | 252.36 |
| XB,S1 | Benzene content of produced gasoline | 5.046 | 3.785 | 2.524 | 1.893 |
| I | Imported gasoline | 419.50 | 419.50 | 419.50 | 419.50 |
| XB,I | Benzene content of imported gasoline (0.75 % v/V) | 3.146 | 3.146 | 3.146 | 3.146 |
| E2 | Fugitive benzene emissions from storage of imported and nationally produced gasoline (6.7%) | 0.548 | 0.464 | 0.379 | 0.337 |
| S2 | Total gasoline stock for distribution | 671.24 | 671.35 | 671.47 | 671.52 |
| XB,S2 | Total benzene content in gasoline for distribution | 7.644 | 6.467 | 5.291 | 4.702 |
| TD | Gasoline transported by duct (inlet) (65%) | 436.31 | 436.37 | 436.46 | 436.49 |
| XB,TD | Benzene content of gasoline transported by duct | 4.969 | 4.204 | 3.439 | 3.056 |
| TC | Gasoline transported by tank car (inlet) (26%) | 174.52 | 174.55 | 174.58 | 174.59 |
| XB,TC | Benzene content of gasoline transported by tank car | 1.987 | 1.681 | 1.375 | 1.222 |
| TB | Gasoline transported by tanker (inlet) (6%) | 40.274 | 40.281 | 40.288 | 40.291 |
| XB,TB | Benzene content of gasoline transported by tanker | 0.459 | 0.388 | 0.317 | 0.282 |
| TT | Gasoline transported by train (inlet) (3%) | 20.137 | 20.141 | 20.144 | 20.145 |
| XB,TT | Benzene content of gasoline transported by train | 0.229 | 0.197 | 0.158 | 0.141 |
| E3 | Fugitive benzene emissions from duct transport (2.5%) | 0.124 | 0.105 | 0.086 | 0.076 |
| E4 | Fugitive benzene emissions from tank car transport (0.4%) | 0.0079 | 0.0067 | 0.0055 | 0.0049 |
| E5 | Fugitive benzene emissions from tanker transport (0.4%) | 0.0018 | 0.0015 | 0.0012 | 0.0011 |
| E6 | Fugitive benzene emissions from train transport (0.4%) | 0.00092 | 0.00078 | 0.00063 | 0.00056 |
| TDs | Gasoline transported by duct (outlet) | 436.19 | 436.26 | 436.37 | 436.41 |
| TCs | Gasoline transported by tank car (outlet) | 174.51 | 174.54 | 174.58 | 174.59 |
| TBs | Gasoline transported by tanker (outlet) | 40.272 | 40.279 | 40.286 | 40.289 |
| TTs | Gasoline transported by train (outlet) | 20.136 | 20.140 | 20.143 | 20.144 |
| XB,TDs | Benzene content of gasoline transported by duct (outlet) | 4.845 | 4.099 | 3.353 | 2.980 |
| XB,TCs | Benzene content of gasoline transported by tank car (outlet) | 1.979 | 1.674 | 1.369 | 1.217 |
| XB,TBs | Benzene content of gasoline transported by tanker (outlet) | 0.457 | 0.386 | 0.315 | 0.280 |
| XB,TTs | Benzene content of gasoline transported by train (outlet) | 0.228 | 0.196 | 0.157 | 0.140 |
| S3 | Total gasoline to final storage terminals | 671.10 | 671.22 | 671.37 | 671.43 |
| XB,S3 | Benzene content of gasoline to final storage terminals | 7.509 | 6.356 | 5.196 | 4.618 |
| E7 | Fugitive benzene emissions from final storage terminals (6.7%) | 0.503 | 0.426 | 0.348 | 0.309 |
| S4 | Total gasoline to be distributed at gasoline stations | 670.60 | 670.80 | 671.03 | 671.12 |
| XB,S4 | Benzene content of gasoline to be distributed at gasoline stations | 7.006 | 5.930 | 4.847 | 4.309 |
| E8 | Fugitive benzene emissions from gasoline transported by tank car to gasoline stations (0.4%) | 0.028 | 0.023 | 0.019 | 0.017 |
| S5 | Total gasoline dispensed at gasoline stations | 670.57 | 670.77 | 671.01 | 671.11 |
| XB,S5 | Benzene content of gasoline stored at gasoline stations | 6.980 | 5.906 | 4.828 | 4.292 |
| E9 | Benzene fugitive emissions from gasoline stored and dispensed at gasoline stations (0.5%) | 0.035 | 0.029 | 0.024 | 0.021 |
| S6 | Total gasoline dispensed from gasoline stations | 670.54 | 670.74 | 670.98 | 671.08 |
| XB,S6 | Benzene content of gasoline dispensed to vehicles | 6.943 | 5.877 | 4.804 | 4.270 |
| E10 | Fugitive benzene emissions from vehicles (2%) | 0.139 | 0.117 | 0.096 | 0.085 |
References
- Liu, Y.; Lu, S.; Yan, X.; Gao, S.; Cui, X.; Cui, Z. Life cycle assessment of petroleum refining process: A case study in China. J. of Clean. Prod. 2020, 256, ID 120422. [Google Scholar] [CrossRef]
- Barton, C. C. Benzene. In Encyclopedia of Toxicology, 4th ed.; Wexler, P., Ed.; Elsevier: Washington DC, United States of America, 2024; Volume 1, pp. 961–966. [Google Scholar] [CrossRef]
- Liu, P.; Wu, Y.; Li, Z.; Lv, Z.; Zhang, J.; Song, A.; Wang, T.; Wu, L.; Mao, H.; Peng, J. Tailpipe volatile organic compounds (VOCs) emissions from Chinese gasoline vehicles under different vehicles standards, fuel types, and driving conditions. Atmos. Env. 2024, 323, ID 120348. [Google Scholar] [CrossRef]
- Li, Q.; Padilla, L.; Thompson, T.; Xiao, S.; Mohr, E. J.; Zhou, X.; Kacharava, N.; Cui, Y.; Wang, C. A modeling framework to assess fenceline monitoring and self-reported upset emissions of benzene from multiple oil refineries in Texas. Atmos. Env.: X. 2024, 23, ID 100281. [Google Scholar] [CrossRef]
- Chen, W. -H.; Chang, C. -F.; Lai, C. -H.; Peng, Y. -P.; Su, Y. -J.; Chen, G. -F. Multivariate analysis of carcinogenic equivalence (CEQ) to characterize carcinogenic VOC emissions in a typical petrochemical industrial park in Taiwan. Env. Int. 2024, 186, ID 108548. [Google Scholar] [CrossRef]
- Hienuki, S. Environmental and socio-economic analysis of naphtha reforming hydrogen energy using input-output tables: A case study from Japan. Sustainab. 2017, 9, ID 1376. [Google Scholar] [CrossRef]
- Zahed, M. A.; Salehi, S.; Khoei, M. A.; Esmaeili, P.; Mohajeri, L. Risk assessment of Benzene, Toluene, Ethyl benzene, and Xylene (BTEX) in the atmospheric air around the world: A review. Toxic. In Vitro. 2024, 98, ID 105825. [Google Scholar] [CrossRef]
- Alcántar González, F. S.; Elizalde Segovia, R.; Olvera Santos, M. G.; López Herrera, D.; Cruz Gómez, M. J. Análisis del contenido de benceno en las gasolinas y estimación de emisiones de este compuesto al ambiente. Rev. Int. de Cont. Amb. 2020, 36, 321–331. [Google Scholar] [CrossRef]
- Romo, D. Refinación del petróleo en México y perspectiva de la reforma energética. Problem. del Des. 2016, 47, 139–164. [Google Scholar] [CrossRef]
- Li, Z.; Ying, Y.; Yang, M.; Zhao, L.; Zhao, L.; Du, W. Monitoring and path optimization of catalytic reformer in a refinery: Principal component analysis and A* algorithm application. Exp. Syst. with App. 2022, 209, ID 118358. [Google Scholar] [CrossRef]
- Akhtar, M. N.; Aitani, A. M.; Ummer, A. C.; Alasiri, H. S. Review of the catalytic conversion of naphtha to aromatics: Advances and outlook. Ener. & Fuel. 2023, 37, 2586–2607. [Google Scholar] [CrossRef]
- Aznárez, A.; Korilli, S. A.; Gil, A. Progress and recent novelties in naphtha reforming catalysts. J. of Env. Chem. Eng. 2024, 12, ID 113066. [Google Scholar] [CrossRef]
- Atarianshandiz, M.; McAuley, K. B.; Shahsavand, A. Modeling and parameter tuning for continuous catalytic reforming of naphtha in an industrial reactor system. Process. 2023, 11, ID 2838. [Google Scholar] [CrossRef]
- Zapf, F.; Wallek, T. Case-study of a flowsheet simulation using deep-learning process models for multi-objective optimization of petrochemical production plants. Comp. & Chem. Eng. 2022, 162, ID 107823. [Google Scholar] [CrossRef]
- Pishnamazi, M.; Nakhjiri, A. T.; Rezakazemi, M.; Marjani, A.; Shirazian, S. Mechanistic model and numerical simulation of axial flow catalytic reactor for naphtha reforming unit. PLoS One. 2020, 15, ID e0242343. [Google Scholar] [CrossRef]
- Boukezoula, T. F.; Bencheikh, L.; Belkhiat, D. E. C. A heterogeneous model for a cylindrical fixed bed axial flow reactors applied to a naphtha reforming process with a non-uniform catalyst distribution in the pellet. React. Kin. Mech. & Cat. 2020, 131, 335–351. [Google Scholar] [CrossRef]
- Yusuf, A. Z.; John, Y. M.; Aderemi, B. O.; Patel, R.; Mujtaba, I. M. Modelling simulation and sensitivity analysis of naphtha catalytic reforming reactions. Comp. & Chem. Eng. 2019, 130, ID 106531. [Google Scholar] [CrossRef]
- Issa, H. M. Streamlining aromatic content detection in automotive gasoline for environmental protection: Utilizing a rapid and simplified prediction model based on some physical characteristics and regression analysis. Resul. in Eng. 2024, 21, ID 101771. [Google Scholar] [CrossRef]
- Martínez, J.; Zúñiga-Hinojosa, M. A.; Ruiz- Martínez, R. S. A thermodynamic analysis of naphtha catalytic reforming reactions to produce high octane gasoline. Process. 2022, 10, ID 313. [Google Scholar] [CrossRef]
- Petrova, D. A.; Gushchin, P. A.; Ivanov, E. V.; Lyubimenko, V. A.; Kolesnikov, I. M. Modelling industrial catalytic reforming of low octane gasoline. Chem. & Tech. of F. & O. 2021, 57, 143–159. [Google Scholar] [CrossRef]
- Ivanchina, E.; Chernyakova, E.; Pchelintseva, I.; Poluboyartsev, D. Mathematical modelling and optimization of semi-regenerative catalytic reforming of naphtha. Oil & Gas Sci. & Technol. – Rev. du IFP Ener. Nouv. 2021, 76, 64–75. [Google Scholar] [CrossRef]
- Rahimpour, M. R.; Jafari, M.; Iranshahi, D. Progress in catalytic naphtha reforming: A review. J. of App. Ener. 2013, 109, 79–93. [Google Scholar] [CrossRef]
- Jafari, M.; Rafiei, R.; Amiri, S.; Karimi, M.; Iranshahi, D.; Rahimpour, M. R.; Mahdiyar, H. Combining continuous catalytic regenerative naphtha reformer with thermally coupled concept for improving the process yield. Int. J. of Hydrog. Ener. 2013, 38, 10327–10344. [Google Scholar] [CrossRef]
- Hou, W. F. , Su, H. Y.; Mu, S. J.; Chu, J. Multiobjective optimization of the industrial catalytic naphtha reforming process. Chin. J. of Chem. Eng. 2007, 15, 75–80. [Google Scholar] [CrossRef]
- Secretaría de Energía, México. Estadísticas de petrolíferos (Gasolina). Available on line: https://estadisticashidrocarburos.energia.gob.mx/gas.aspx (accessed on 1st October 2024).
- Velázquez-Alonso, F. (TECNM campus Pachuca, Pachuca, Hidalgo, México). Personal communication, 2024.
- González-Ramírez, C. A. (Universidad Autónoma del Estado de Hidalgo, Mineral de la Reforma, Hidalgo, México). Personal communication, 2024.
- EPA. Emission factor documentation for AP-42 Section 7.1 Organic liquid storage tanks Final Report, September 2006. Available online: https://nepis.epa.gov/Exe/ZyPURL.cgi?Dockey=P100NVV2.txt (accessed on 22nd October 2024).
- Mata, T. M.; Smith, R. L.; Young, D. M.; Costa, C. A. V. Life cycle assessment of gasoline blending options. Env. Sci. & Technol. 2003, 37, 3724–3732. [Google Scholar]
- Sheartson, J. A.; Hilpert, M. Gasoline vapor emissions during vehicle refueling events in a vehicle fleet saturated with onboard refueling vapor recovery systems: Need for an exposure assessment. Front. in Publ. Health. 2020, 8, ID 18. [Google Scholar] [CrossRef]
- Hilpert, M.; Mora, B. A.; Ni, J.; Rule, A. M.; Nachman, K. E. Hydrocarbon release during fuel storage and transfer at gas stations: Environmental and health effects. Curr. Env. Health Rpt. 2015, 2, 412–422. [Google Scholar] [CrossRef] [PubMed]
- Diario Oficial de la Federación. Available on line: https://www.dof.gob.mx/nota_detalle.php?codigo=5450011&fecha=29/08/2016#gsc.tab=0, (accessed on 22nd October 2024).
- Veza, I.; Spraggon, M.; Fattah, I. M. R.; Idris, M. Response surface methodology (RSM) for optimizing engine performance and emissions fueled with biofuel: Review of RSM for sustainability energy transition. Resul. in Eng. 2023, 18, ID 101213. [Google Scholar] [CrossRef]
- Gutiérrez Pulido, H.; De la Vara Salazar, R. Análisis y diseño de experimentos, 2nd ed.; McGraw-Hill/ Interamericana Eds.: Mexico City, Mexico, 2008; pp. 384–420. [Google Scholar]
- Yusup, S.; Khan, Z.; Ahmad, M. M.; Rashidi, N. A. Optimization of hydrogen production in in-situ catalytic adsorption (ICA) steam gasification based on Response Surface Methodology. Biom. & Bioener. 2014, 60, 98–107. [Google Scholar] [CrossRef]
- Al-Jamimi, H. A.; BinMakhashen, G. M.; Deb, K.; Saleh, T. A. Multiobjective optimization and analysis of petroleum catalytic processes: A review. Fuel. 2021, 288, ID 119678. [Google Scholar] [CrossRef]
- ASTM, A. N. S. ASTM, A. N. S. Standard test method for determination of individual components in spark ignition engine fuels by 100 meter capillary high resolution gas chromatography. ASTM Std. Meth., 2020, D 6729, pp. 51.
- ASTM, A. N. S. Standard test method for hydrocarbon types, oxygenated compounds and benzene in spark ignition engine fuels by gas chromatography. ASTM Std. Meth., 2021, D 6839, pp. 17.
- Cherepitsa, S. V.; Bychkov, S. M.; Gatsikha, S. V.; Kovalenko, A. N.; Mazanik, A. L.; Kuzmenkov, D. E.; Luchinina, Y. L.; Gremyako, N. N. Gas chromatographic analysis of automobile gasolines. Chem. & Technol. of F. & O. 2001, 37, 283–290. [Google Scholar] [CrossRef]
- He, Z.; Zao, W.; Liu, G.; Qian, Y.; Lu, X. Effects of short chain aromatics in gasoline on GDI engine combustion and emissions. Fuel. 2021, 297, ID 120725. [Google Scholar] [CrossRef]
- Health Canada. Benzene releases from gasoline stations: implications for human health, 1st ed., Government of Canada: Ottawa, Canada, 2023; pp. 1-40. Available online: https://www.canada.ca/en/health-canada/services/publications/healthy-living/benzene-releases-gasoline-stations-implications-human-health.html.
- El-Malky, E.; Umansky, B.; Moy, E.; Donahoe, G.; Thom, T. Gasoline benzene reduction. Dig. Refin. 2013, Q4, ID 1000839, https://www.digitalrefining.com/article/1000839/gasoline-benzene-reduction. [Google Scholar]
- Ma, X. C.; He, C.; Chen, Q. L.; Zhang, B. J. Modeling and optimization for the continuous catalytic reforming process based on the hybrid surrogate optimization model. Comp. & Chem. Eng. 2024, 191, ID 108841. [Google Scholar] [CrossRef]
- Elfghi, F. M. Catalytic naphtha reforming; challenges for selective gasoline; an overview and optimization case study. J. of Adv. Cat. Sci. & Tech. 2016, 3, pp. 27-42. [CrossRef]
- Abdellatief, T. M. M.; Ershov, M. A.; Kapustin, V. M.; Ali-Abdelkareem, M.; Kamil, M.; Olabi, A. G. Recent trends for introducing promising fuel components to enhance the anti-knock quality of gasoline: A systematic review. Fuel. 2021, 291, ID 120112. [Google Scholar] [CrossRef]
- Zainullin, R. Z.; Zagoruiko, A. N.; Koledina, K. F.; Gubaidullin, I. M.; Faskhutdinova, R. I. Multi-criterion optimization of a catalytic reforming unit using a genetic algorithm. Catal. Ind. 2020, 12, 133–140. [Google Scholar] [CrossRef]
- Jiang, H.; Li, Z.; Sun, Y.; Jiang, S.; Tian, J. Optimization of the countercurrent continuous reforming process based on equation oriented modeling and the SQP algorithm. ACS Omeg. 2020, 7, 1757–1771. [Google Scholar] [CrossRef] [PubMed]
- Abdoulkarimi, V.; Sari, A.; Shokri, S. Robust prediction and optimization of gasoline quality using data-driven adaptive modeling for a light naphtha isomerization reactor. Fuel. 2022, 328, ID 125304. [Google Scholar] [CrossRef]
- Laredo, G. C.; Castillo, J.; Cano, J. L. Benzene reduction in gasoline range streams by adsorption process using a PVDC-PVC carbon molecular sieve. Fuel, 2014, 135, 459–467. [Google Scholar] [CrossRef]
- Otaraku, I. J.; Egun, I. L. Optimization of hydrogen production from Nigerian crude oil samples through continuous catalyst regeneration (CCR) reforming process using Aspen Hysys. Am. J. of App. Chem. 2017, 5, 69–72. [Google Scholar] [CrossRef]
Figure 1.
CCR process diagram of the NCR process (redrawn from [24]).
Figure 1.
CCR process diagram of the NCR process (redrawn from [24]).
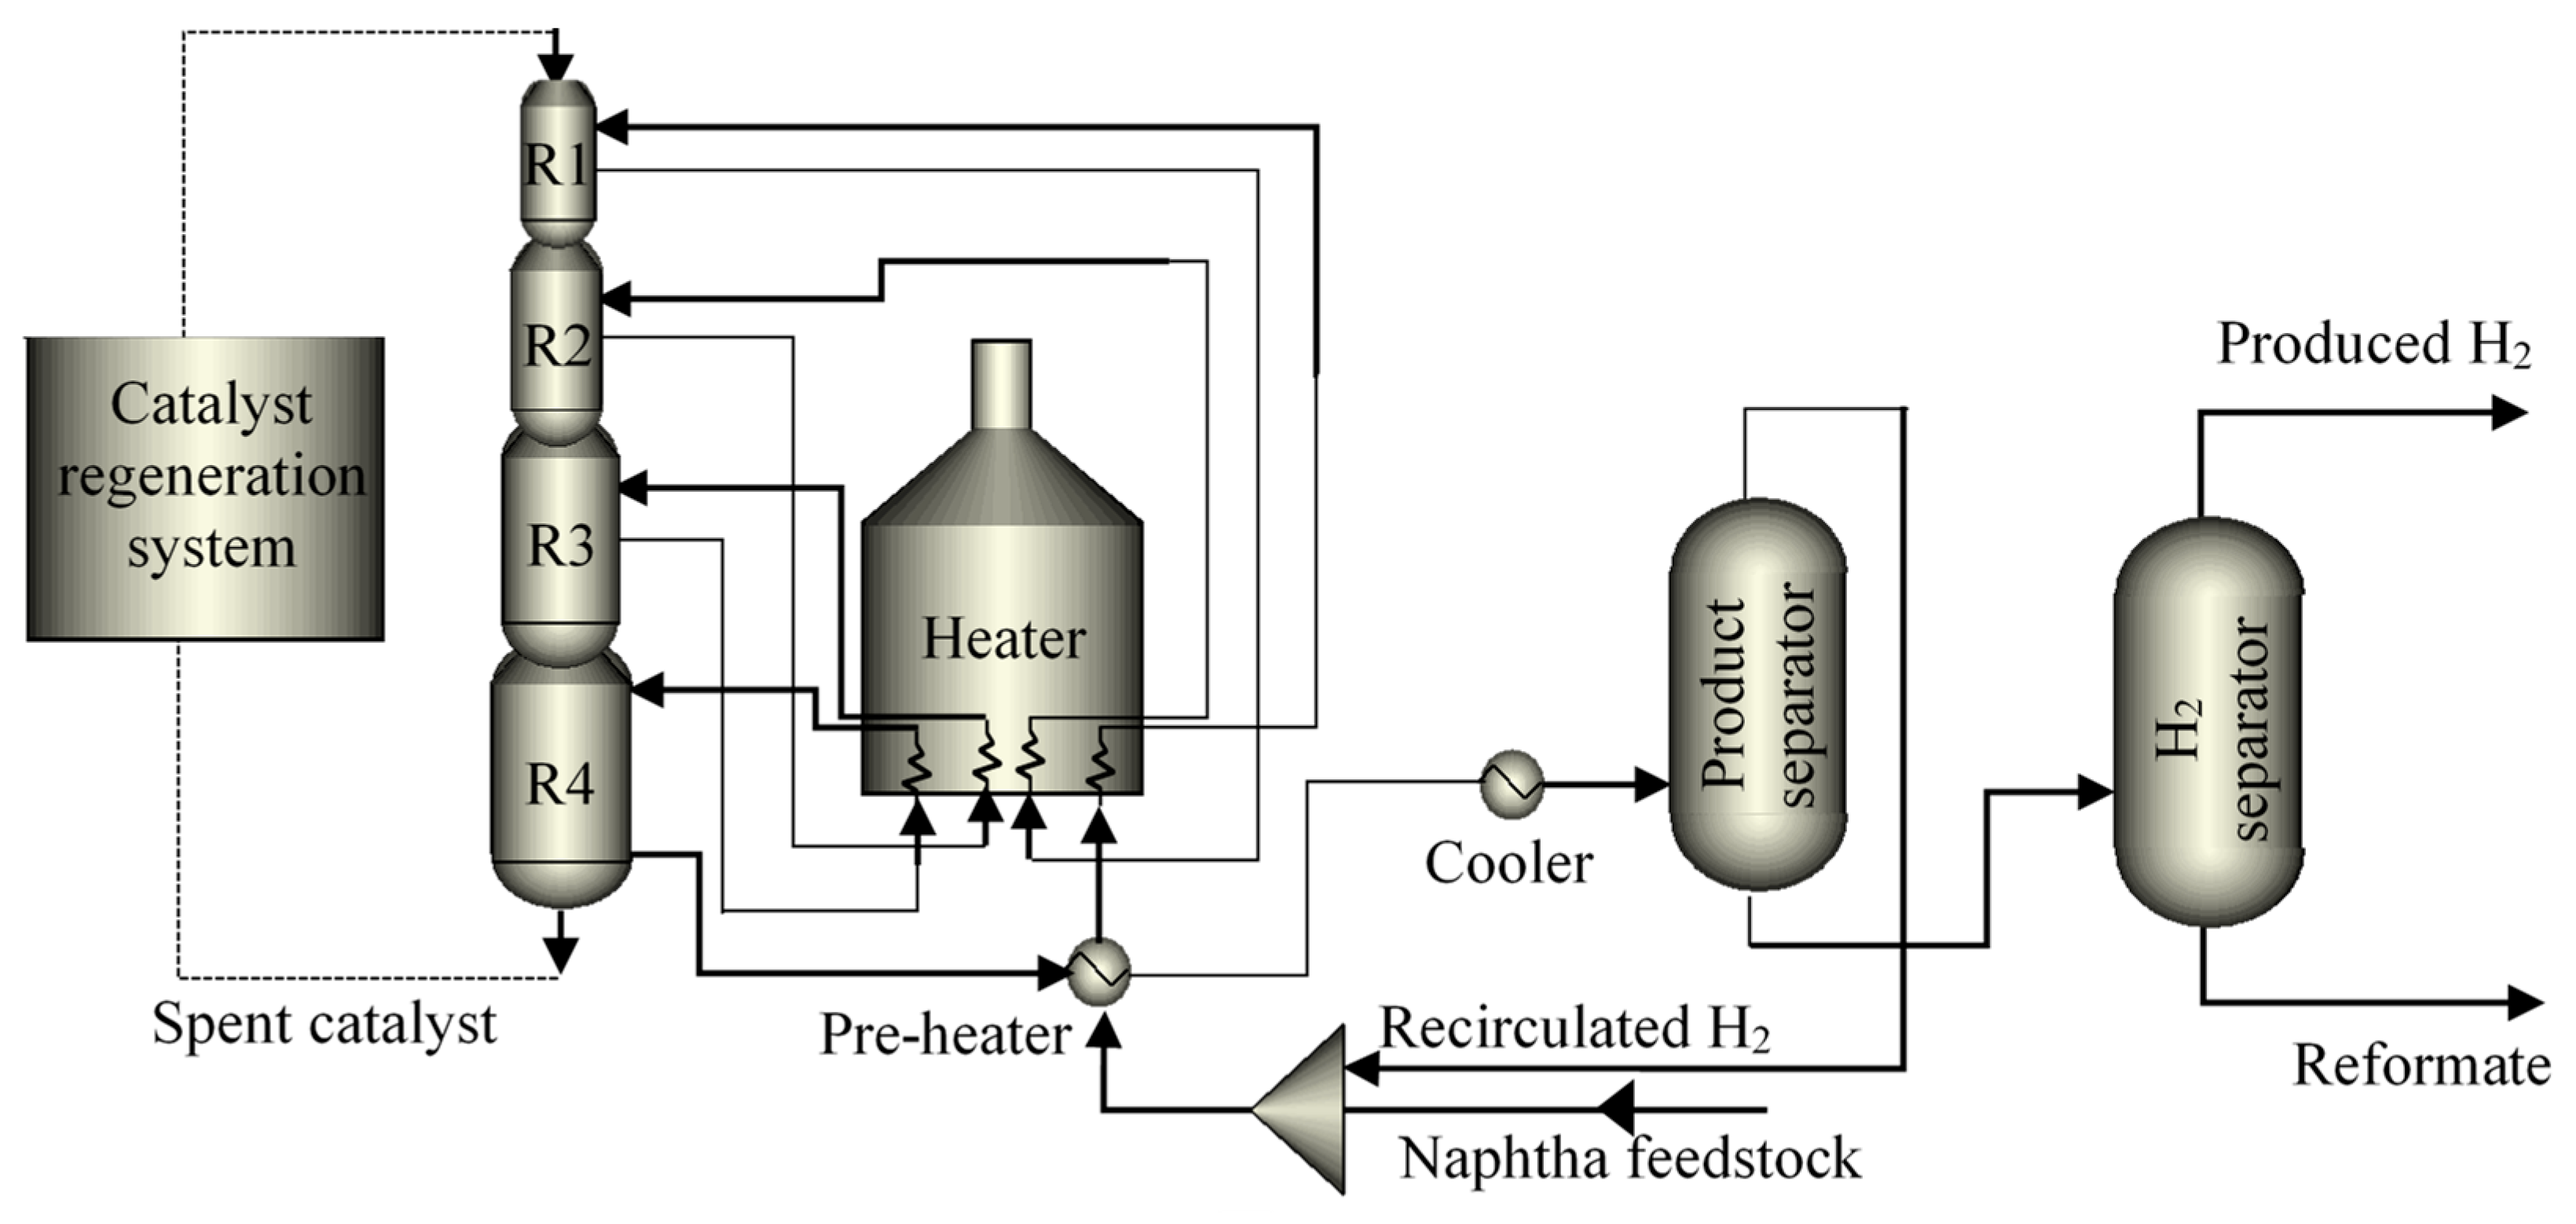
Figure 2.
Schematic diagram describing a mass balance of benzene emissions.
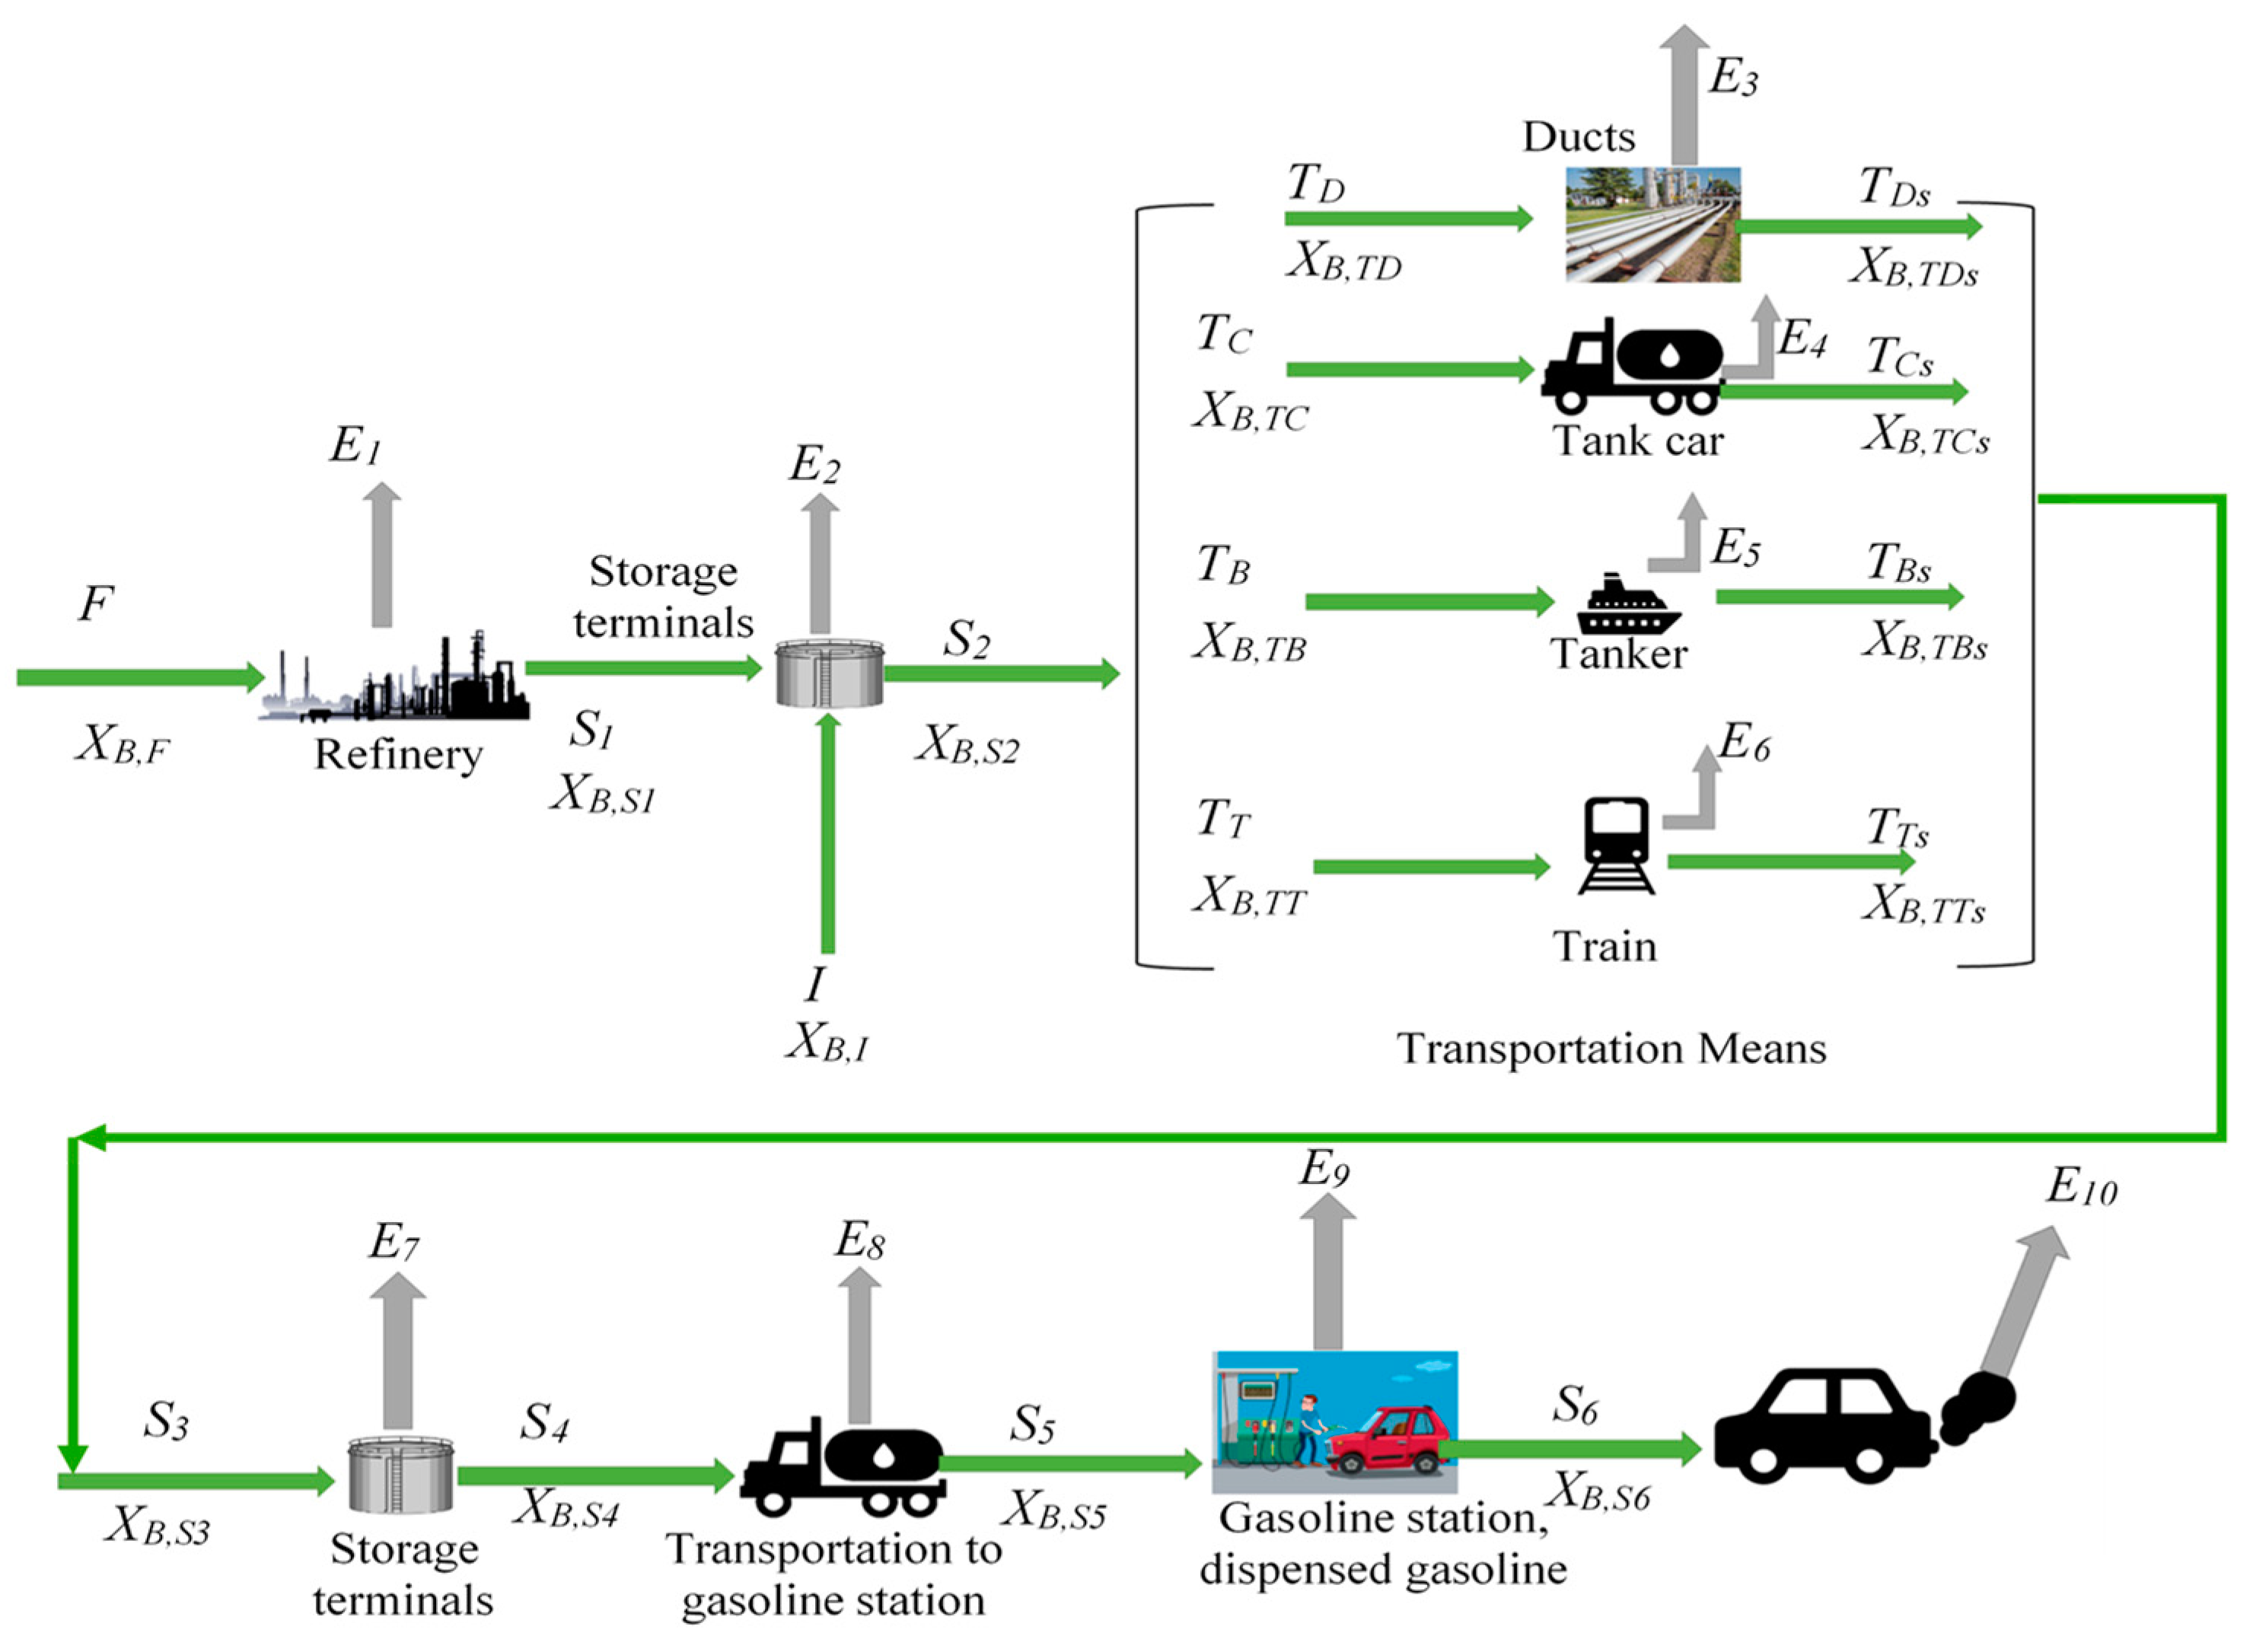
Figure 3.
Main effects plots from independent variables (T, H2/HC, F, and P) on response variables of reformed naphtha: (a) aromatic compounds content [A %(v/V)]; (b) benzene content [B %(v/V)], and (c) Research Octane Number (RON).
Figure 3.
Main effects plots from independent variables (T, H2/HC, F, and P) on response variables of reformed naphtha: (a) aromatic compounds content [A %(v/V)]; (b) benzene content [B %(v/V)], and (c) Research Octane Number (RON).
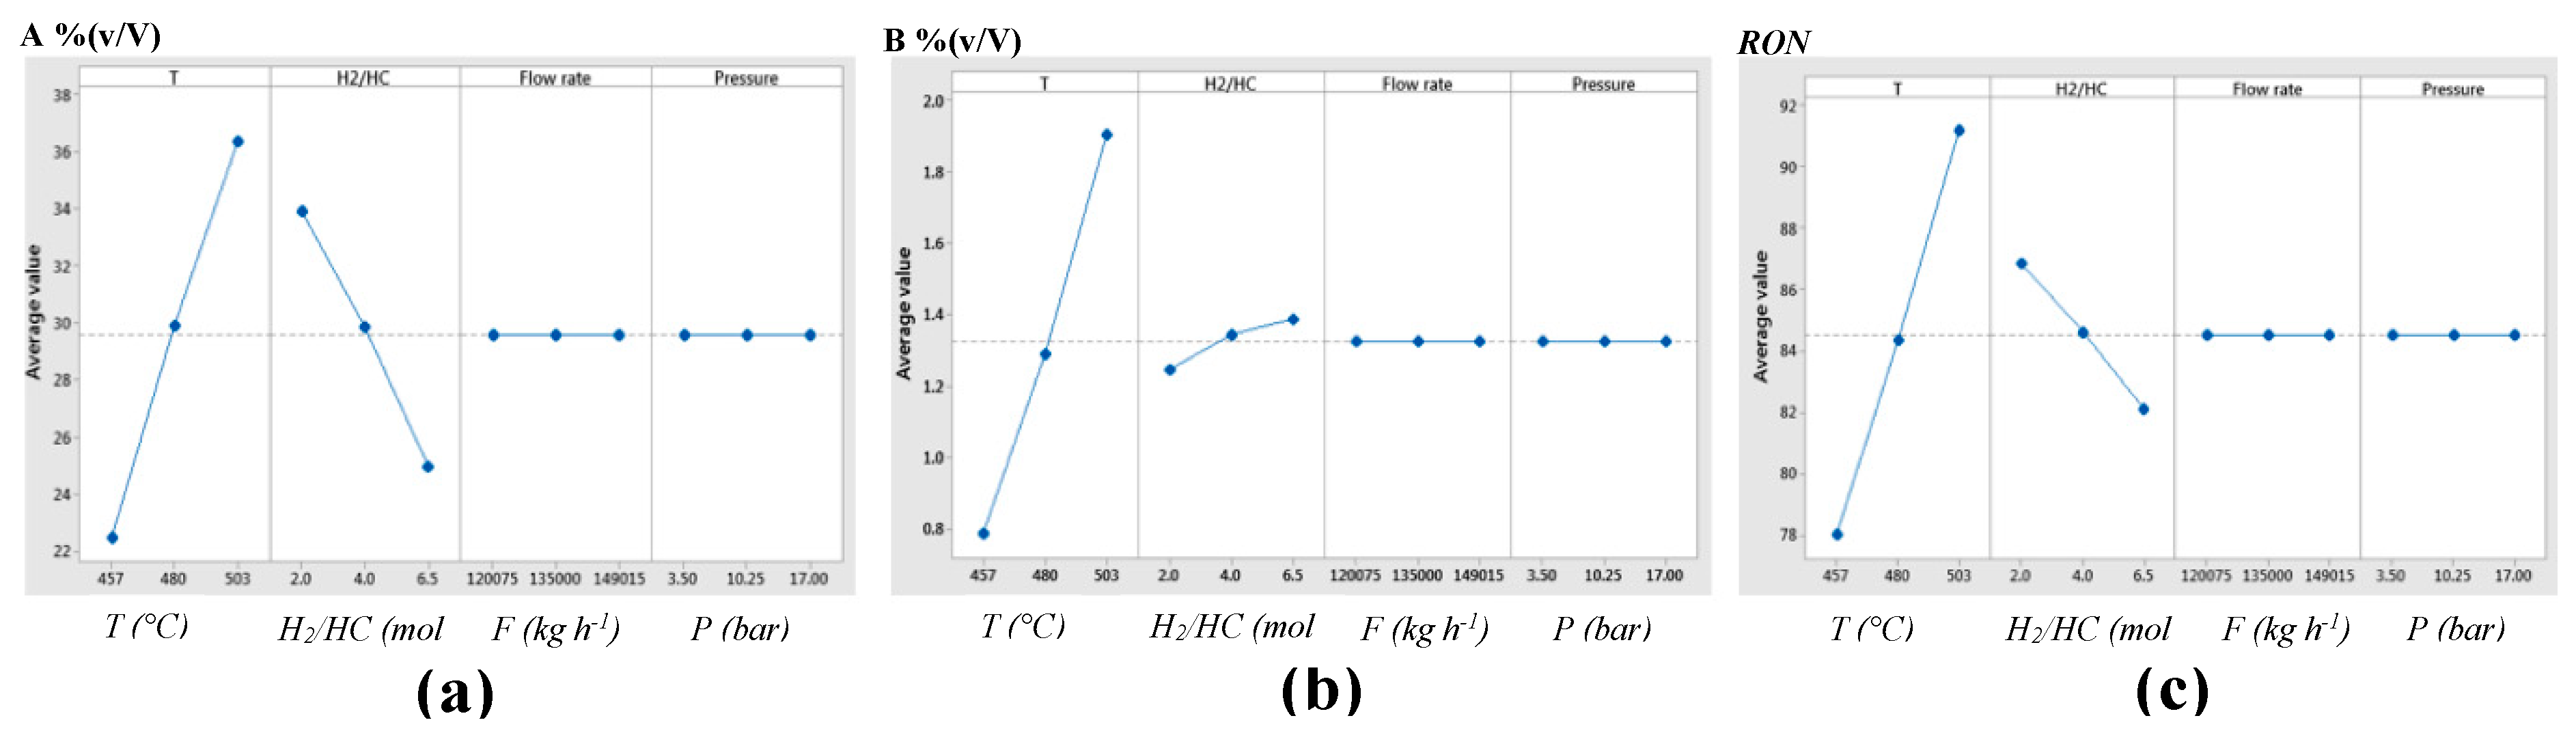
Figure 4.
Semi regenerative pilot plant of the NCR process.
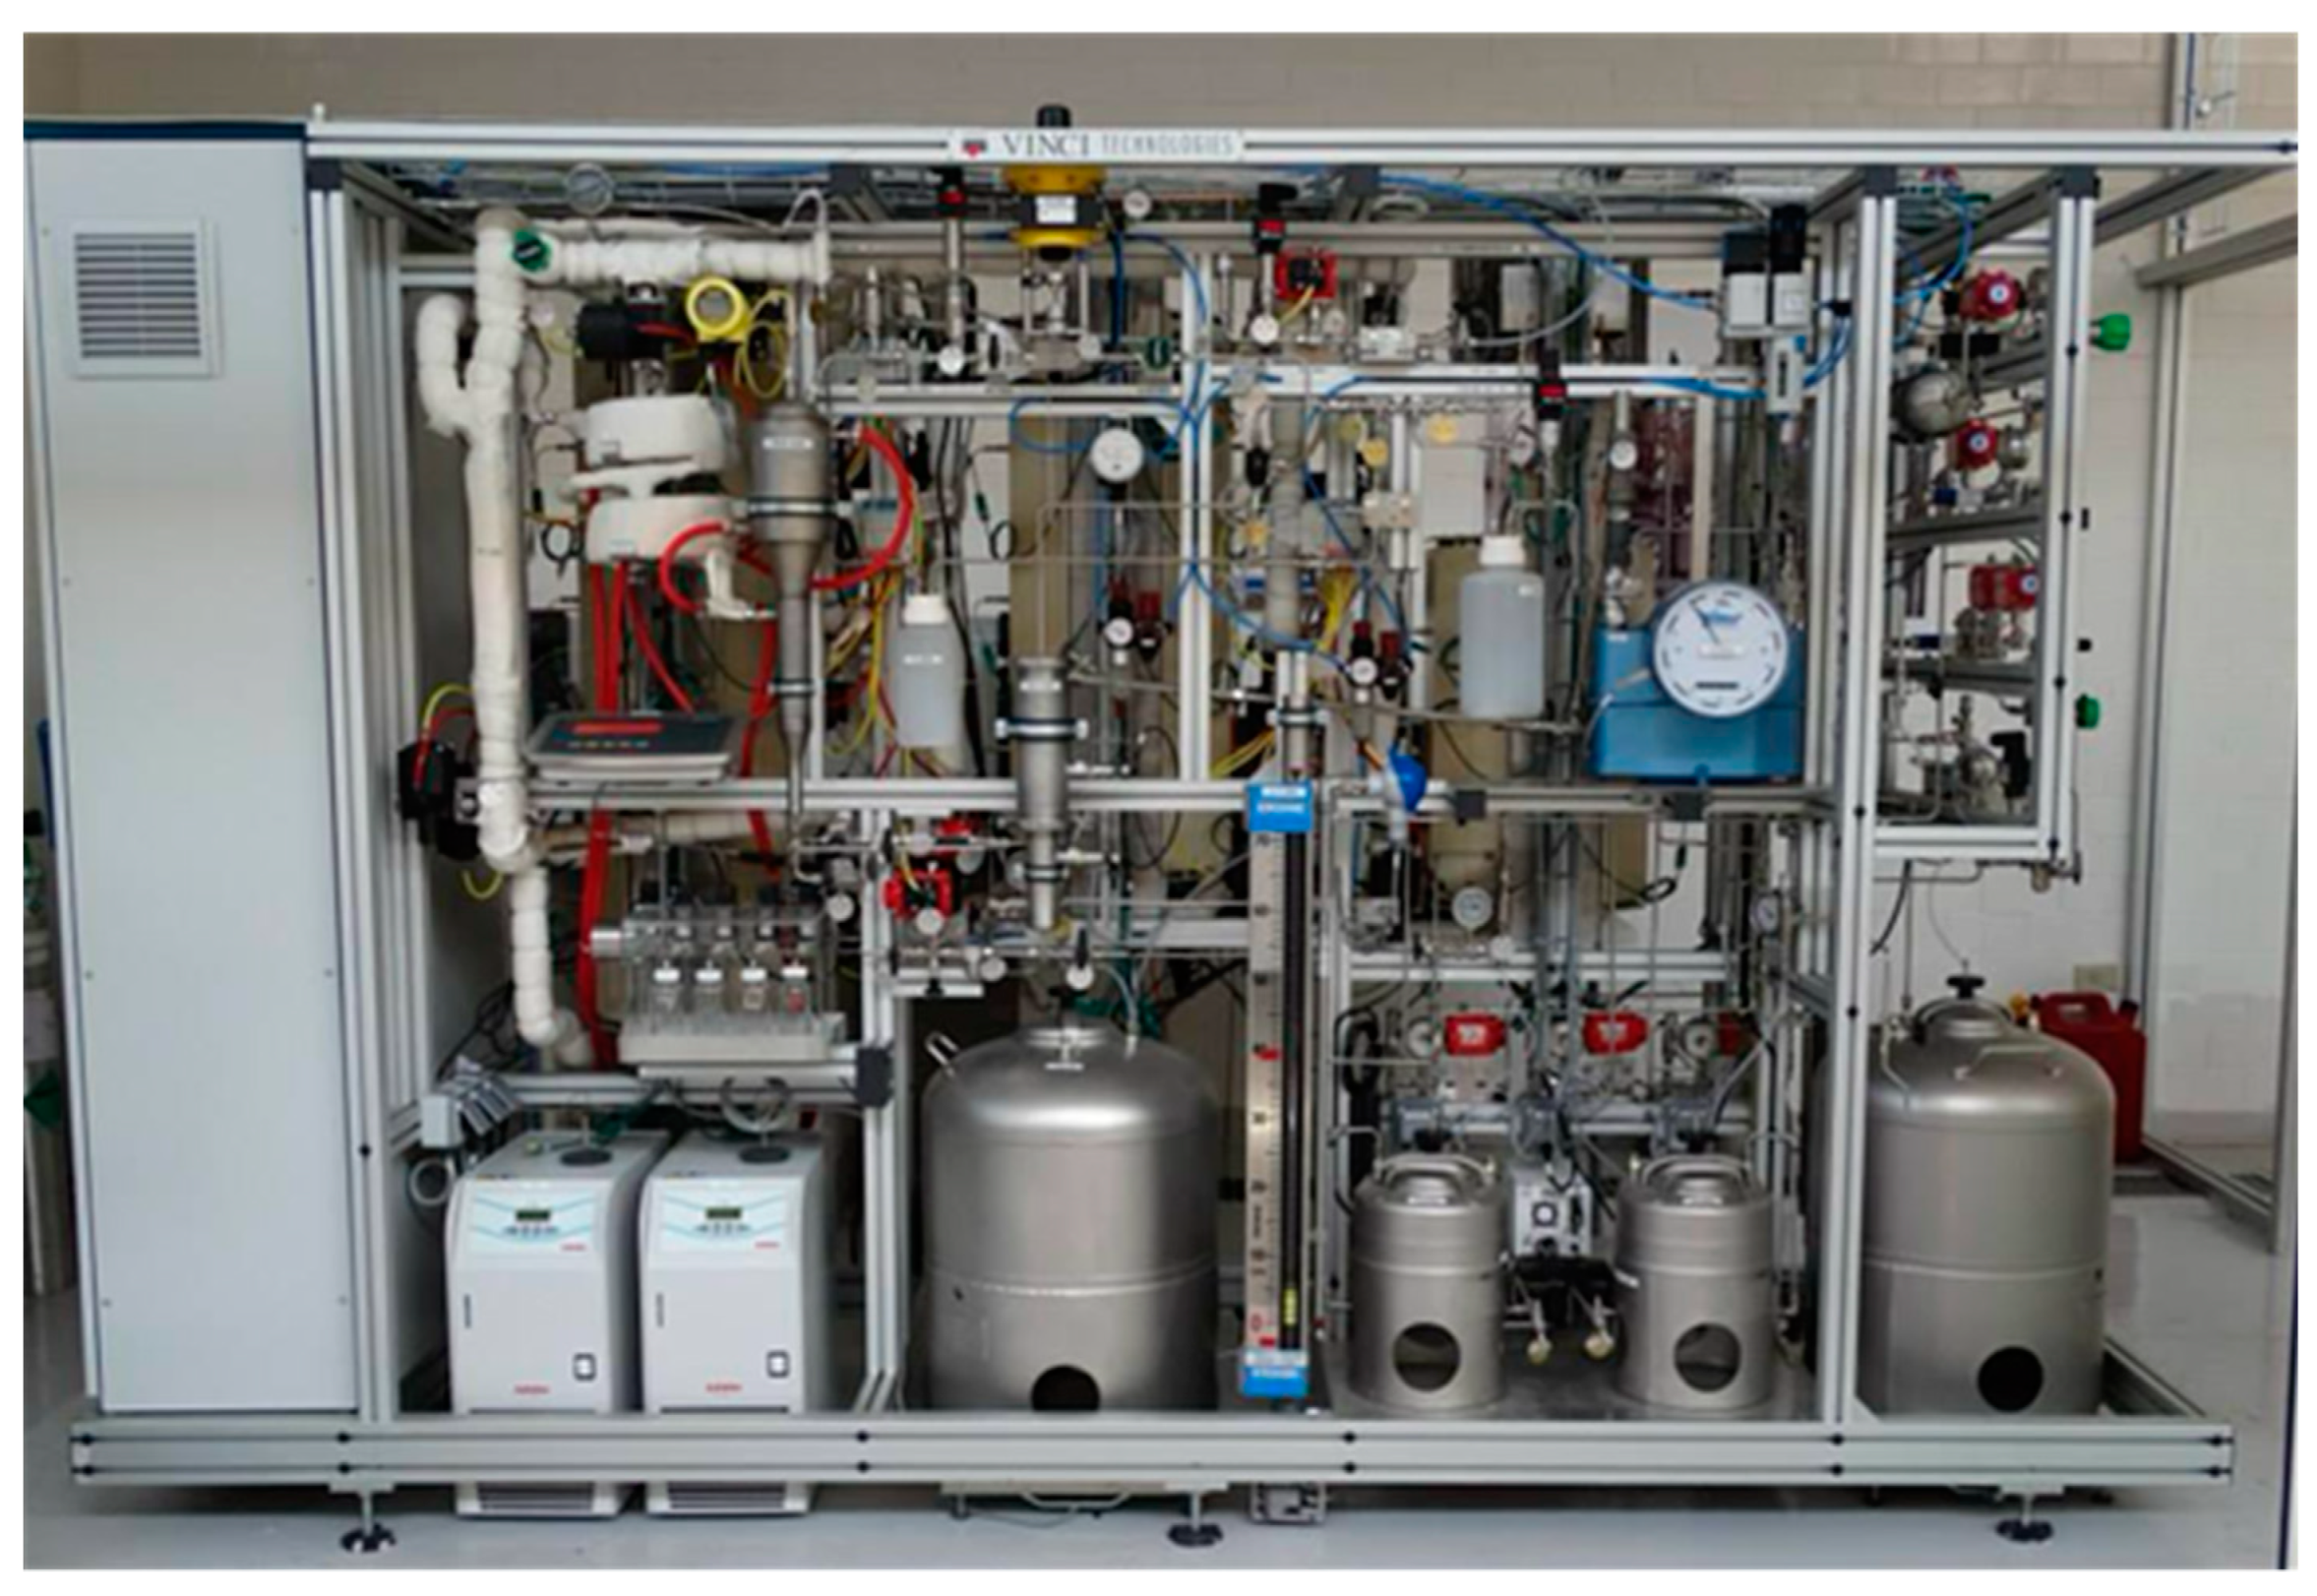
Figure 5.
Response surface plots of: (a) Research Octane Number (RON); (b) volumetric percentage of aromatic compounds [A% (v/V)], and (c) volumetric percentage of benzene [B% (v/V)].
Figure 5.
Response surface plots of: (a) Research Octane Number (RON); (b) volumetric percentage of aromatic compounds [A% (v/V)], and (c) volumetric percentage of benzene [B% (v/V)].
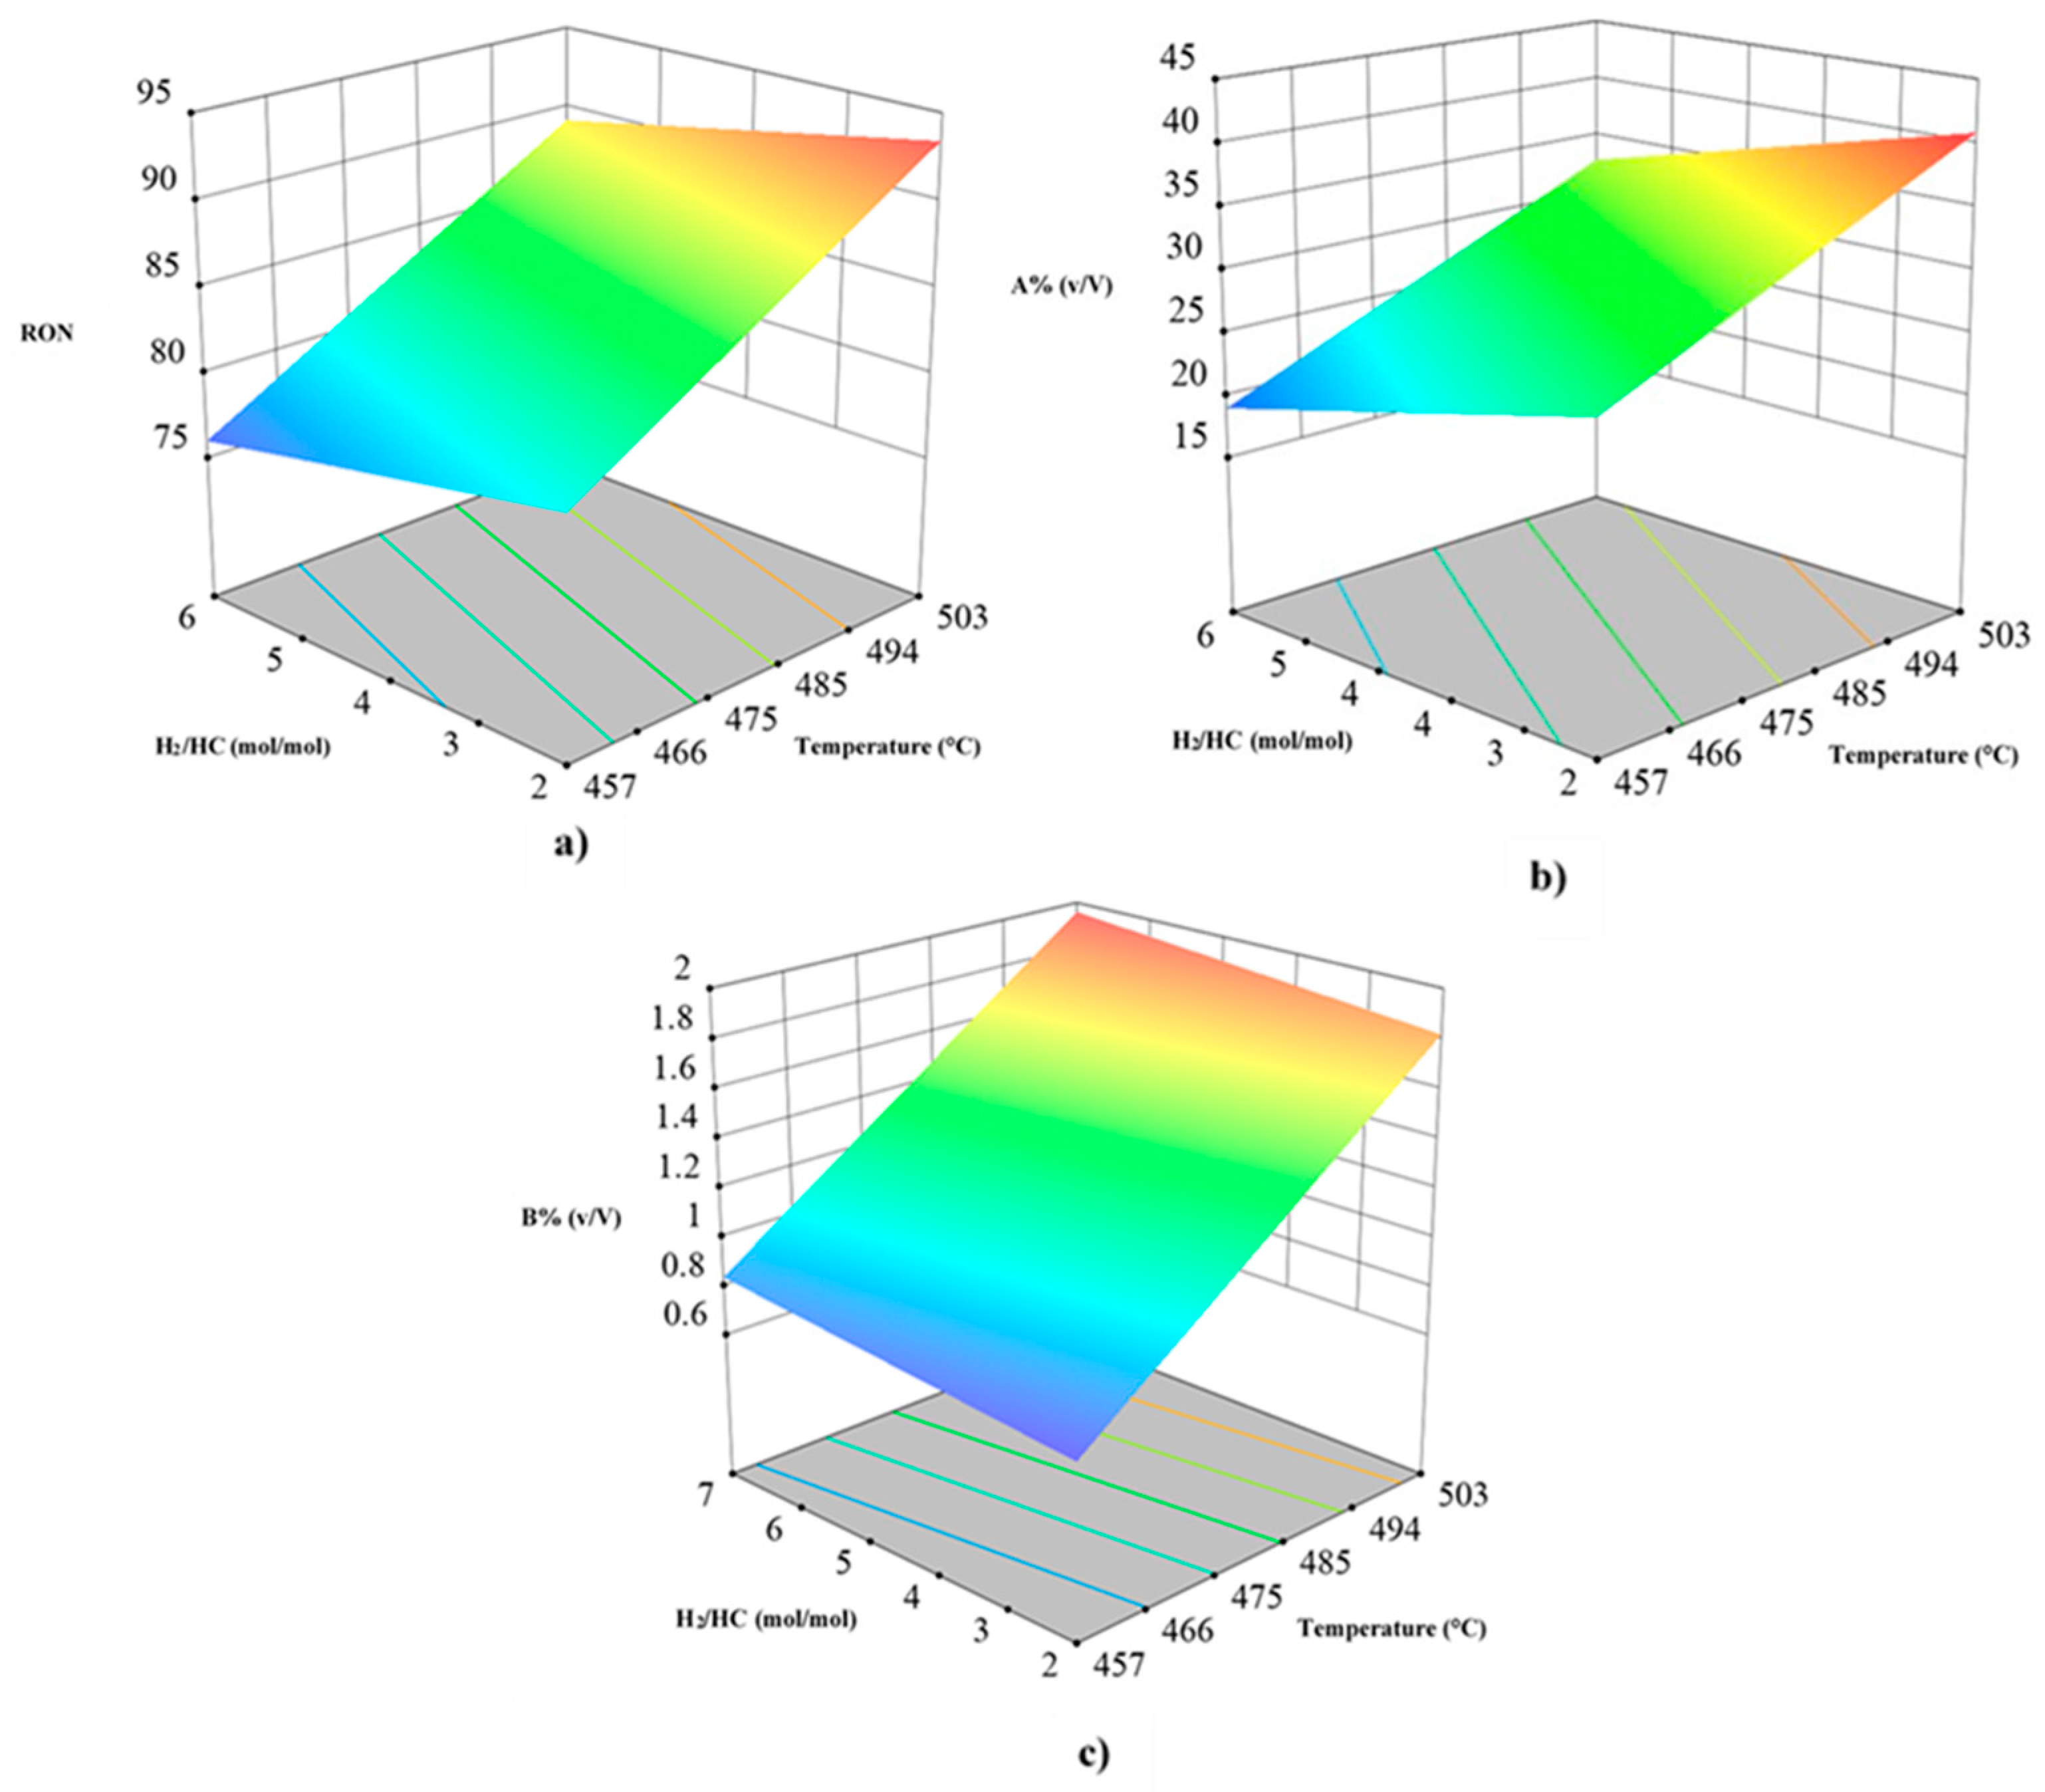
Figure 6.
Diagram of operative zones for each dependent variable, remarking the “searching zone” in white color.
Figure 6.
Diagram of operative zones for each dependent variable, remarking the “searching zone” in white color.
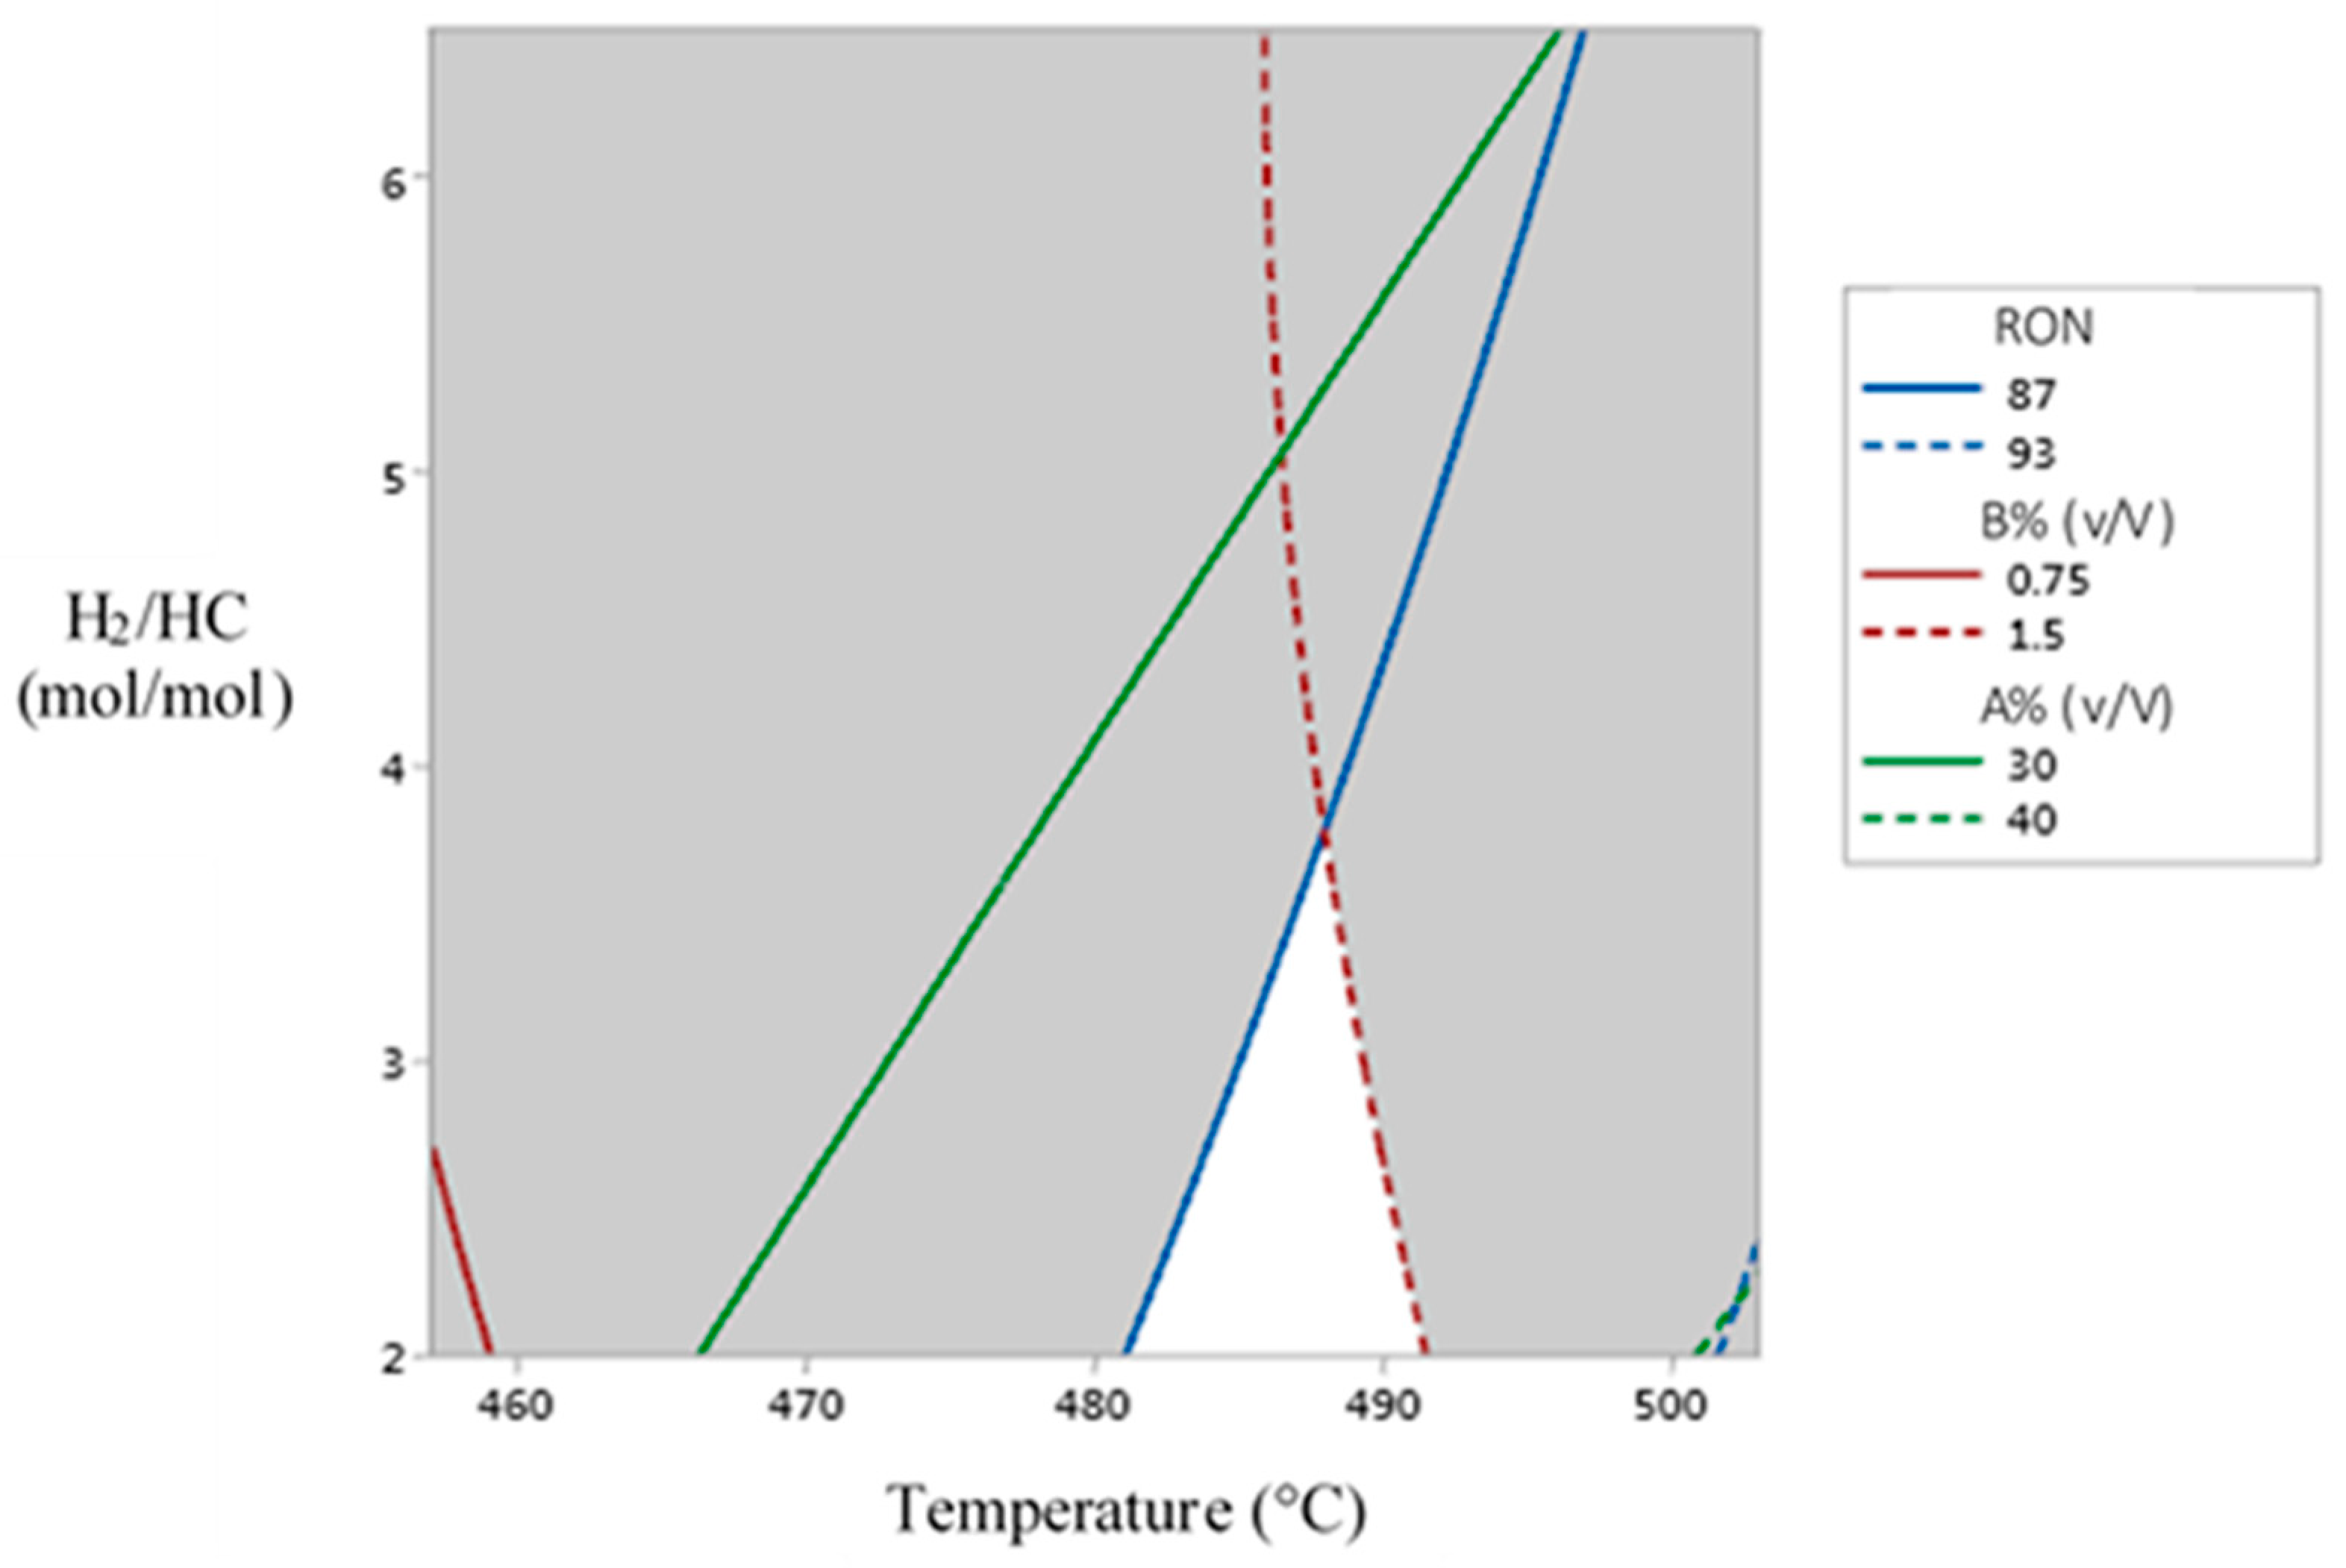
Figure 7.
Transitional Operative Routes (TOR) for minimizing benzene content and maximizing RON value of the produced reformate from the NCR process. (a) Route 1; (b) Route 2; (c) Route 3; (d) Route 4; (e) Route 5, and (f) Route 6.
Figure 7.
Transitional Operative Routes (TOR) for minimizing benzene content and maximizing RON value of the produced reformate from the NCR process. (a) Route 1; (b) Route 2; (c) Route 3; (d) Route 4; (e) Route 5, and (f) Route 6.
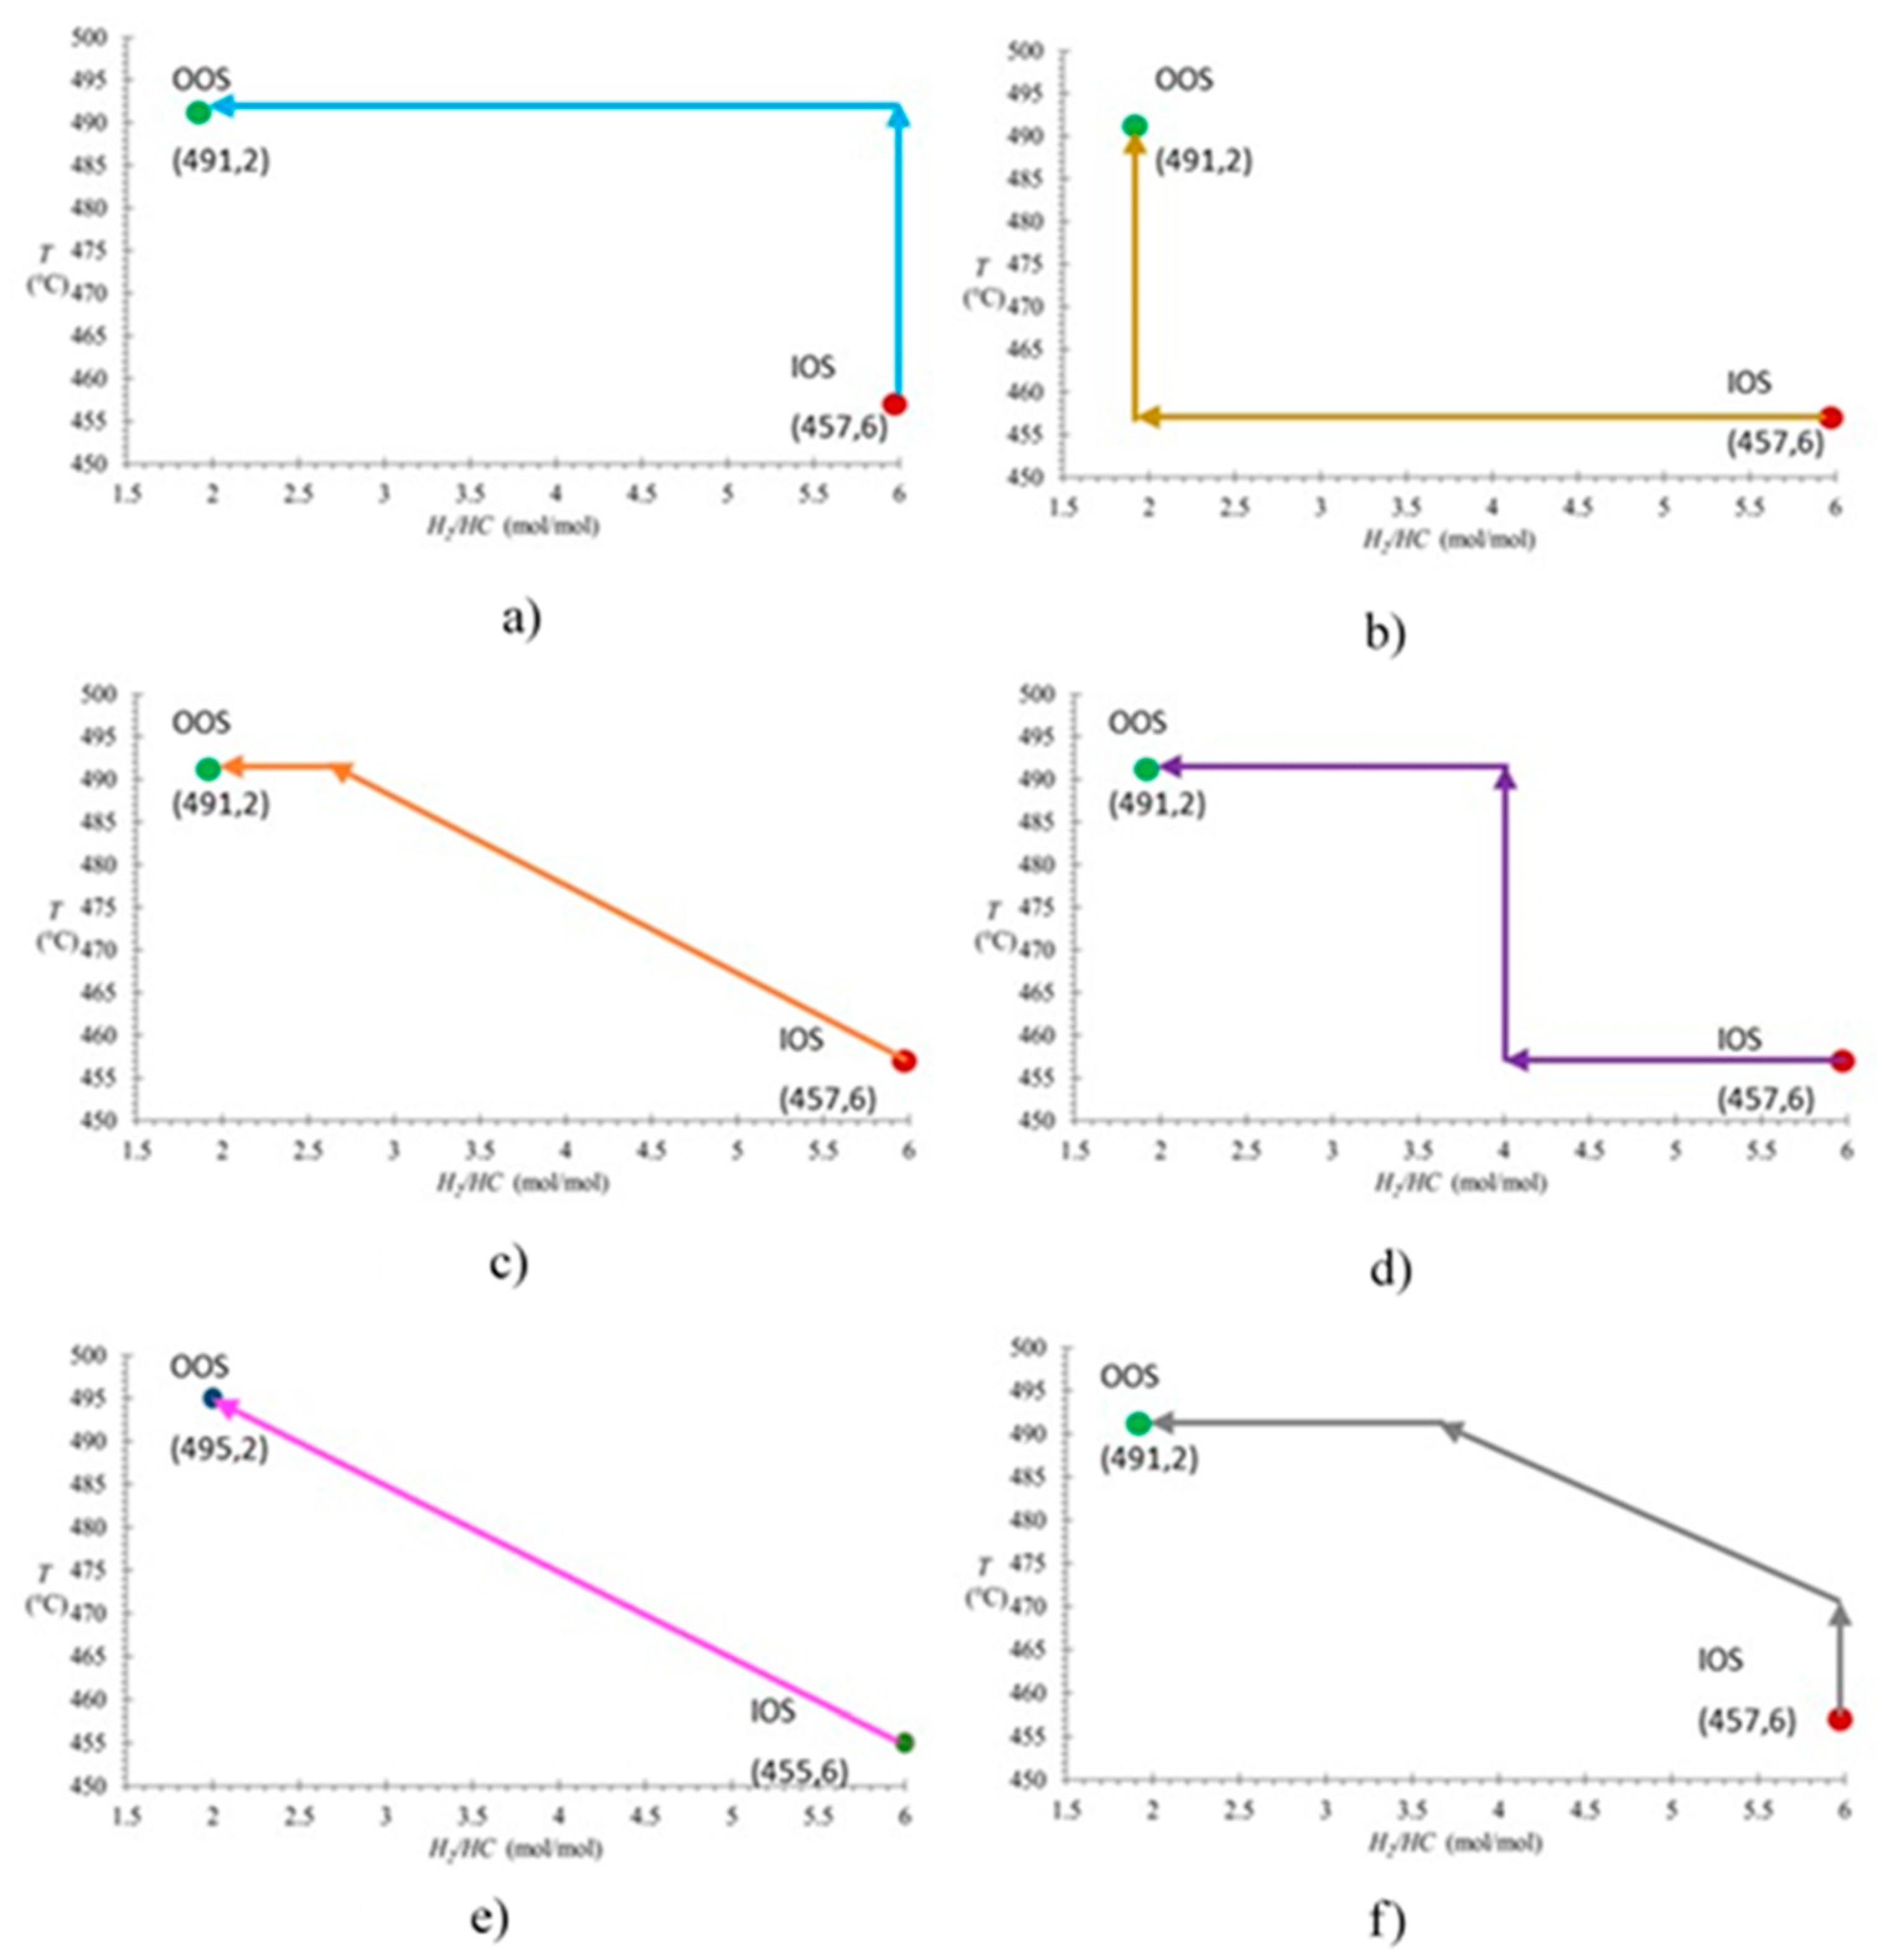
Figure 8.
Diagram for identifying and intersecting operational zones: a) industrial scale; b) experimental pilot plant scale, and c) optimal zone calculated by simulation.
Figure 8.
Diagram for identifying and intersecting operational zones: a) industrial scale; b) experimental pilot plant scale, and c) optimal zone calculated by simulation.
Figure 9.
Multivariate surface response plots for industrial, pilot plant, and simulated operative points for: (a) RON values; (b) composition of aromatic compounds [A% (v/V)], and (c) benzene content [B% (v/V)].
Figure 9.
Multivariate surface response plots for industrial, pilot plant, and simulated operative points for: (a) RON values; (b) composition of aromatic compounds [A% (v/V)], and (c) benzene content [B% (v/V)].
Table 1.
Evaporative factor values related to gasoline releases during logistic operations.
| Evaporation during | Evaporative Loss (% v/V) | Reference |
|---|---|---|
| Tank storage | 6.7 | [28] |
| Ducts transportation | 2.5 | [29] |
| Other transportation means | 0.4 | [30] |
| Dispensing at gasoline stations | 0.5 | [31] |
Table 2.
Scenarios analysis of generated benzene emissions.
| Gasoline benzene content % (v/V) |
Total gasoline production to be sold (KBPD) |
Total benzene emissions (KBPD) |
Total benzene content of dispensed gasoline (KBPD) |
|---|---|---|---|
| 0.75 | 671.08 | 0.89 | 4.27 |
| 1.00 | 670.98 | 1.01 | 4.80 |
| 1.50 | 670.74 | 1.25 | 5.87 |
| 2.00 | 670.54 | 1.48 | 6.94 |
Table 3.
Value levels of independent variables for process simulation design.
| Independent variable | Units | Value levels | ||
|---|---|---|---|---|
| Low | Medium | High | ||
| Temperature (T) | °C | 457 | 480 | 503 |
| H2/HC ratio (H) | mol mol-1 | 2 | 4 | 6 |
Table 4.
Response variables of the NCR process.
| Dependent variables | Symbol | Units |
|---|---|---|
| Octane index | RON | Dimensionless |
| Volumetric fraction of aromatic compounds | A% | % (v/V) |
| Volumetric fraction of benzene | B% | % (v/V) |
Table 5.
Regression coefficients of quadratic surface response models and correlation coefficients for each equation.
Table 5.
Regression coefficients of quadratic surface response models and correlation coefficients for each equation.
| yi | a0 | a1 | a2 | a3 | a4 | a5 | r2 |
|---|---|---|---|---|---|---|---|
| RON | 59.906 | -0.1559 | -2.2783 | 4.52 E-4 | 0.0234 | 0.0021 | 0.9758 |
| A% (v/V) | -315.4 | 1.184 | -3.422 | -9.30 E-4 | 0.0154 | 0.0028 | 0.9614 |
| B% (v/V) | 13.10 | -0.0741 | 0.04235 | 1.02 E-4 | -0.00711 | 0.0001 | 0.9948 |
Table 6.
TOR assessment regarding each response variable.
| TOR No. | Average estimated values across each TOR | |||
|
RON (Position) |
A% (v/V) (Position) |
B% (v/V) (Position) |
Average position |
|
| 1 | 84.491 | 29.211 | 1.410 | |
| (1) | (1) | (6) | 2.666 | |
| 2 | 81.365 | 27.198 | 0.929 | |
| (6) | (6) | (1) | 4.333 | |
| 3 | 83.540 | 28.997 | 1.227 | |
| (3) | (3) | (4) | 3.333 | |
| 4 | 83.526 | 28.981 | 1.226 | |
| (4) | (4) | (3) | 3.666 | |
| 5 | 82.871 | 28.297 | 1.170 | |
| (5) | (5) | (2) | 4.000 | |
| 6 | 83.941 | 29.077 | 1.306 | |
| (2) | (2) | (5) | 3.000 | |
| OOS values | 89.871 | 37.395 | 1.488 | |
Table 7.
Comparisons between experimental data, obtained from the pilot plant, with simulated data of RON, concentrations of: paraffins, aromatics, naphthenes and benzene; using operative conditions of a three days experimental run.
Table 7.
Comparisons between experimental data, obtained from the pilot plant, with simulated data of RON, concentrations of: paraffins, aromatics, naphthenes and benzene; using operative conditions of a three days experimental run.
| Day | Type of data | RON | Concentration [% (v/V)] | |||
|---|---|---|---|---|---|---|
| n-Paraffins | Aromatics | Naphthenes | Benzene | |||
| 1 | Simulated | 77.54 | 65.31 | 13.54 | 19.61 | 0.28 |
| Experimental | 79.50 | 68.95 | 12.90 | 18.12 | 0.31 | |
| 2 | Simulated | 84.03 | 56.20 | 24.30 | 15.92 | 0.83 |
| Experimental | 85.93 | 60.48 | 21.03 | 17.54 | 0.77 | |
| 3 | Simulated | 92.25 | 50.91 | 36.54 | 7.49 | 1.98 |
| Experimental | 90.33 | 54.56 | 33.01 | 8.38 | 1.87 | |
| Correlation Coefficient (r2) |
0.9844 | 0.9987 | 0.9996 | 0.9693 | 0.9995 | |
Table 8.
Comparison of operative conditions at industrial scale, pilot plant and simulation.
| Type of variables | Industrial scale |
Pilot plant scale |
Optimum operative zone by simulation |
|---|---|---|---|
| Operative | |||
| Temperature (°C) | 442.99 – 498.74 | 430 – 500 | 482 – 491 |
| H2/HC ratio (mol/mol) | 2.00 – 5.16 | 2.00 – 4.00 | 2.00 – 3.50 |
| Response | |||
| Aromatics [A% (v/V)] | 38.47-58.4 | 12-36 | 30-40 |
| Benzene [B% (v/V)] | 2.58 | 0.28-1.98 | 0.75-1.5 |
| RON | 83.2 – 92.8 | 77.0 – 92.0 | 87.0 – 94.0 |
Table 9.
Optimization results comparison with previous studies.
| Variable | Units | Reported data | Reference | This work | ||
|---|---|---|---|---|---|---|
| Operative state | Optimal result |
Operative state | Optimal result |
|||
| Temperature | °C | 510 | 514.67 | [47] | 482 - 491 | 482.57 |
| 400 | 479.6 (R1) 478.5 (R2) 500.0 (R3) |
[46] | ||||
| H2/HC molar ratio | mol / mol |
2.12 | 2.05 | [47] | 2.00 – 3.50 | 2.00 |
| NR | NR | [46] | ||||
| A | %(v/V) | 53.02 | 53.86 | [47] | 30 – 40 %(v/V) |
34.99 %(v/V) |
| %(wt) | 56.00 | 45.00 | [46] | |||
| B | --- | NR | NR | [47] | 0.75 – 1.50 %(v/V) |
1.27 %(v/V) |
| %(wt) | 4.00 | 3.08 | [46] | |||
| RON | --- | 99.30 | 99.70 | [47] | 87 - 94 | 87.42 |
| 92.70 | 91.80 | [46] | ||||
(R1), (R2), (R3) reactors 1, 2, and 3. NR: Not Reported.
Disclaimer/Publisher’s Note: The statements, opinions and data contained in all publications are solely those of the individual author(s) and contributor(s) and not of MDPI and/or the editor(s). MDPI and/or the editor(s) disclaim responsibility for any injury to people or property resulting from any ideas, methods, instructions or products referred to in the content. |
© 2024 by the authors. Licensee MDPI, Basel, Switzerland. This article is an open access article distributed under the terms and conditions of the Creative Commons Attribution (CC BY) license (http://creativecommons.org/licenses/by/4.0/).
Copyright: This open access article is published under a Creative Commons CC BY 4.0 license, which permit the free download, distribution, and reuse, provided that the author and preprint are cited in any reuse.


