
Submitted:
15 November 2024
Posted:
17 November 2024
You are already at the latest version
Abstract
Background: Tumor metastasis and poor drug efficacy are two of the prominent causes of therapeutic failure in tumor patients. The underlying molecular mechanism requires further exploration and novel effective curative strategies are urgently needed. Nature is a rich source for novel drug discovery and Lycorine hydrochloride (Lyc.HCL) is a natural alkaloid with tremendous therapeutic potential. However, the molecular mechanisms of anti-tumor are still elusive. In the current study, we investigated the effects and mechanisms of Lyc.HCL against esophageal squamous cell carcinomas (ESCC) that seriously endangers human life. Methods: We detected the expression of tripartite motif containing 22(TRIM22) through immunohistochemistry and western blot. The MTS assay and clone formation assay were used to assess the viability of ESCC cell lines after Lyc.HCL treatment in vitro. Apoptosis and cell cycle regulation was analyzed by flow cytometry. Wound healing and Transwell assays were used to analyze cell migration. Invasion was analyzed by the Matrigel transwell assay. The expressions of janus kinase-2(JAK2)/signal transducer and activator of transcription 3(STAT3), phosphoinositide 3-kinase (PI3K)/protein kinase B(AKT), mitogen-activated protein kinases (MAPK)/extracellular signal-regulated kinase (ERK) pathways were detected through Western blotting. Rescue experiment was performed to underscore the potential target role of TRIM22. In addition, we also explored the vivo anti-ESCC role and mechanism of Lyc.HCL by treating tumor-bearing mice. Results: We found that the TRIM22 protein was highly expressed in ESCC tissues and ESCC cell lines but not in normal esophageal tissue. Lyc.HCL treatment was found to inhibit esophageal squamous cell carcinoma cell proliferation both in vitro and in vivo by blocking the cell cycle to G2 phase, inhibiting cell migration and invasion. Furthermore, Lyc.HCL decreased the expression of TRIM22 and JAK2/STAT3, PI3K/AKT, MAPK/ERK signaling pathways both in vitro and in vivo. Rescue assays showed that overexpressed TRIM22 would promote proliferation, metastasis and invasion, while knocking out TRIM22 significantly reverses these effects. Lyc.HCL suppresses proliferation, metastasis and invasion induced by TRIM22. Observing in animal experiments, depletion TRIM22 delays tumor growth and the effect is significantly reversed by TRIM22 overexpression. Conclusions: Taken together, these findings demonstrate that Lyc.HCL effectively suppresses ESCC both in vitro and in vivo by targeting TRIM22, which is regulated by the JAK2/STAT3, PI3K/AKT and MAPK/ERK pathways, indicating that Lyc.HCL may be the potential novel drug for ESCC and TRIM22 is a considerable target for therapy.
Keywords:
Lycorine hydrochloride
; esophageal squamous cell carcinomas
; TRIM22
; Therapy drug
; Chinese medicine
1. Introduction
Esophageal squamous cell carcinoma (ESCC) is one of the most common and fatal cancers, ranking as the sixth leading cause of cancer-associated deaths globally. ESCC is the predominant histological subtype of esophageal cancer, constituting 90% of esophageal cancer worldwide[1]. ESCC is a severe malignancy owing to its aggressive nature and very poor survival rate, with a 5-year survival rate of less than 30%[2]. Although the screening and curative treatment techniques such as surgical resection, chemoradiotherapy and immune therapy have witnessed remarkable progress, the treatment for ESCC is still challenging, and the prognosis of patients with ESCC remains limited. There is an urgent need to identify promising biomarkers with higher prognostic accuracy and new drugs for ESCC therapies.
Traditional Chinese medicine (TCM) is a valuable resource for researching anti-tumor drug as it can effectively eliminate tumor cells from the body without causing side effects on normal organ function. Lycorine is a pharmacologically active alkaloid extracted from the traditional Chinese medicinal herb, Lycoris radiata, and has significant therapeutic potential. Recent evidence suggests that Lycorine and its derivatives have anticancer activities[3], including significant inhibitory effects on various types of cancers such as leukemia, lymphoma, melanoma, breast cancer, ovarian cancer and prostate cancer etc.[4]. Lycorine hydrochloride (Lyc. HCL), a derivative of Lycorine, is an isoquinoline alkaloid extracted from Lycoris. It shares similar properties with Lycorine, including anti-tumor effects and low toxicity to normal cells[5], making it a promising candidate for an anticancer agent. Interestingly, Lyc. HCL exhibits a stronger therapeutic effect on tumor cells compared to Lycorine[5]. However, the effects of Lyc. HCL on esophageal squamous cell carcinoma, including its mechanisms and targets, are still unclear. To deeper explore how Lyc. HCL works on ESCC, we focused on Tripartite motif-containing (TRIM) family, one of the critical regulators in human cellular function and their pathways, which could be the potential target of Lyc. HCL. Someone involved that TRIM family proteins are widely expressed and over 80 TRIM proteins were discovered in human[6]. Many TRIM family proteins serve as critical regulators in gene regulation, post-transcriptional regulation, cell proliferation, cell signaling pathway, apoptosis, and tumorigenesis[7]. It is important to note that different members of the TRIM family have diverse function in various cancers, including the regulation proliferation, migration and invasion. Several TRIM family genes have been found to be significantly under- or over-expressed, influencing cancer proliferation, metastases and invasion[8,9]. This suggests that the expression levels of TRIMs could serves as biomarkers and prognostic factors of cancer. Additionally, TRIM gene may play different roles in different types of cancers. For example, TRIM22, a member of the TRIM family, is expressed at low levels in melanoma, which is associated with cancer progression and poor prognosis[10]. Knockout of TRIM22 effectively inhibited tumor proliferation and increased the sensitivity of glioblastoma cells to temozolomide in both in vivo and in vitro[11]. Over-expression of TRIM22 inhibits osteosarcoma progression by destabilizing NRF2 and activating the ROS/AMPK/mTOR/autophagy signaling pathway[12]. TRIM22 also acts as a negative regulator of MHCII expression, making it a potential target for checkpoint blockade immunotherapy in cancers treatment[13]. However, the role of TRIM22 in esophageal squamous cell carcinoma has not been studied to date.
Our study revealed a high expression of TRIM22 in both ESCC patients and ESCC cell lines, such as YES2, KYSE70, KYSE140, KYSE150, KYSE180, KYSE410 and KYSE450. Furthermore, we confirmed that Lyc.HCL effectively suppressed the expression of TRIM22 in ESCC cell lines. Therefore, we propose the hypothesis that Lyc.HCL might exert an anti-esophageal squamous cell carcinoma effect by through its targeting of TRIM22.
2. Materials and Methods
2.1. Cell Culture, Reagents and Treatments
The human esophageal squamous cell carcinoma cell lines (YES2, KYSE30, KYSE70, KYSE140, KYSE150, KYSE180, KYSE410 and KYSE450) were generously provided by Dr. Y. Shimada (Kyoto University). All cells were cultured in RPMI 1640 medium (Gibco, USA), supplemented with 10% fetal bovine serum (Gibco, USA) and 1% penicillin/streptomycin (Gibco, USA). Both types of ESCC cells were cultured in a humidified incubator at 37 °C with 5% CO2. Lycorine hydrochloride (CAS No. 2188-68-3) was purchased from MedchemExpress. We dissolved Ly.HCL in DMSO and diluted it with RPMI 1640 medium (Gibo, USA).
2.2. Normal Esophageal Epithelial Tissue Samples, Patients and Esophageal Squamous Cancer Samples
The study received approval from the Pathology Department of Peking University Shenzhen Hospital (2021-111). From 2018 to 2021, we collected 35 cases of normal esophageal epithelial tissue, 35 cases of peritumoral side tissues and 35 cases of esophageal squamous cancer tissue from the Pathology Department of Peking University Shenzhen Hospital. All procedures conducted in studies involving human participants adhered to the ethical standards of the institution. Informed consent was obtained from all participants. All patients were initially diagnosed with untreated esophageal squamous cancer. To detect the protein expression level of TRIM22, we collected and stored all samples at -80 ℃ for immunohistochemistry assays.
2.3. Immunohistochemistry
The cancer tissue and normal tissue samples from patients were treated with xylene, followed by graded alcohol, Antigen retrieval was then performed in a 0.01 M citrate buffer. Hydrogen peroxide was used for blocking. Tissue sections were incubated with goat serum for 20 minutes. The slides were then incubated overnight at 4 ℃ with the TRIM22 antibody (1:300, Proteintech, USA). Immunostaining of TRIM22 was performed using the EliVision Super Kit from Maixin (Fuzhou, China). Two independent pathologists randomly examined all tumor slides. TRIM22 staining was observed in both the cytoplasmic and nuclear compartments of tumor cells. Nuclear staining was considered positive.
2.4. Cell Proliferation and Apoptosis Assay
Cells were seeded in 96-well plates and treated with Lyc.HCL at various concentrations. Cell proliferation was evaluated at 24h, 48h, and 72h after treatment using the MTS assay (Promega) following the manufacturer’s instructions. Apoptosis was measured after 48h of treatment using an Annexin V-FITC apoptosis detection kit (Beyotime, China) following the manufacturer’s instructions.
2.5. Colony Formation Assay
ESCC cells were seeded at a density of 5000 cells per well in 6-well plates. The cells were cultured in RPMI 1640 medium supplemented with 10% fetal bovine serum,1% penicillin/streptomycin, and specify concentrations of Lyc.HCL. After a 2-week incubation period, the cultures were washed with pre-cooled PBS, fixed with methanol, and stained with a 0.1% crystal violet solution for 30 minutes. The colonies were automatically examined and quantified using Image-Pro Plus.
2.6. Cell Cycle Assay
After treatment with different concentrations of Lyc.HCL for 48h, 1×10⁶ cells were collected, trypsinized, and fixed in 70% ethanol overnight. Then the cells were washed 3 times with pre-cooled PBS and incubated with a PI-staining solution with RNase A (BD Biosciences, USA) for at least 15 minutes at room temperature before analysis. The cells were run on a FACS cytometer (BD Biosciences, USA) in accordance with the manufacturer’s guidelines.
2.7. Cell Migration Assays
The wound healing assay is one of the earliest methods developed to investigate directional cell migration in vitro. Cells were seeded in a 6-well plate and allowed to attach overnight until reaching 80% confluence. Subsequently, cell monolayers were wounded using 200 µL pipette tips and washed with 1× PBS 3 times to remove floating cells. Cells treated with different concentrations of Lyc.HCL were then incubated in RPMI 1640 medium. Cells migrated into the wound surface and the number of migrating cells was observed under an inverted microscope at 0, 12, and 24 hours. Three randomly chosen fields were observed for each well. The percentage of migration was calculated relative to untreated wells as 100%. All the independent experiments were conducted in triplicate. the results were analyzed using ImageJ and GraphPad prism 5.0.
2.8. Transwell Migration Assays
Migration of cells was evaluated in Transwell cell culture chambers with 6.5 mm diameter polycarbonate membrane filters containing 8 μm pore size (Neuro Probe, Gaithersburg, MD, United States). In total, the upper chamber was filled with 200 μL of serum-free medium with specify concentrations of Lyc.HCL and added 5×10⁵ YES2 or KYSE150 cells, and the lower chamber was filled with 500 μL medium containing 20% FBS. After 24 hours of incubation at 37 °C, the non-migrated cells were removed from the upper surface of the membrane with a cotton swab. The filters were then fixed in methanol for 10 minutes, stained with crystal violet solution for 1 hour and counted. Five random microscopic fields (100×) were counted per well and analyzed with the mean value.
2.9. Cell Invasion Assay
A Matrigel invasion assay was conducted to examine tumor cell invasion. Initially, Transwell upper chambers were filled with 0.1 mL Matrigel (Becton Dickinson, Bedford, MA) and incubated at 37 °C for 1 hour. Subsequently, cells were treated with varying concentrations of Lyc.HCL medium for 24 hours. The cells were then trypsinized and suspended in serum free RPMI 1640 medium at a final concentration of 5 × 10⁵ cells/mL. The. cell suspensions were then placed in the upper chamber, and medium with 20% fetal bovine serum was added to the lower chamber. After incubating at 37 °C with 5% CO2 for 24 hours, non-invading cells on the upper surface were removed using a cotton swab. All cells were stained with crystal violet and counted under an inverted microscope. Ten random views were selected for cell counting, and each independent experiments were repeated three times.
2.10. Lentiviral Infection, Transient Transfection and Cas9/sgRNA KO
The plasmids and siRNAs were transfected into cells using Lipofectamine 3000 reagent (Invitrogen, USA). The experimental operation was conducted strictly following the instructions provided by the transfection reagent manufacturer. The Leti-Cas9-puro and single-guide RNA (sgRNAs) lentiviruses were designed and constructed by Genechem (Shanghai, China). Lentivirus carrying Cas9 and sgRNAs infected YES2 and KYSE150 cells. After 48 hours of infection, the cells were cultured in fresh medium containing Puro for 15 days to screen cells with stable expression. All plasmids were designed and constructed by Hanbio (Shanghai, China).
2.11. Western Blotting
Protein extraction and western blotting were conducted as described previously[14]. Briefly, proteins were isolated using RIPA lysis buffer (Beyotime, China). Then 24 μg protein was loaded and separated by 12% SDS-polyacrylamide gel electrophoresis and transferred onto a polyvinylidene difluoride membrane and incubated with following antibodies: JAK2 (#3230T), PI3K (#17366), mTOR (#2983), AKT (#4691), p-AKT (#4060T), p-MEK (#9127S), Erk (#4370), p-Erk (#4370T), and GAPDH (#51332), all of these antibodies were purchased from Cell Signaling Technology, and were diluted at a ratio of 1:1000 using a diluent purchased from Beyotime Biotechnology. Additionally, TRIM22 (#13744-1-AP) was purchased from Proteintech company and were diluted at a ratio of 1:500 using the same diluent. And STAT3 (#ab68153), p-STAT3 (#ab267373), p-p27 (#ab32034), p-p27 (#ab32034), p-Raf (#ab112053) were purchased from Abcam company and were diluted at a ratio of 1:1000 using the same diluent. The chemiluminescence signals were detected using the Amersham Imager 600 (GE, USA).
2.12. Rescue Assays
YES2 and KYSE150 cells were seeded at 20000 cells/well in 6-well plates and incubated overnight. Transient transfection of TRIM22siRNA and plasmid expressing TRIM22 into YES2 and KYSE150 cells for 24 hours, Add Lyc.HCL (4 μmol/mL) treated cells (YES2shTRIM22, YES2TRIM22, KYSE150shTRIM22, KYSE150TRIM22) for 48 hours. Then cells were collected and measured by colony formation assay, cell cycle assay, cell migration assay, cell invasion assay and western blotting assay as previously described.
2.13. Tumor Xenograft Experiments
Six-week-old female BALB/c nude mice were randomly divided into nine groups, with six mice in each. The groups were named as follows: KYSE150-NC, KYSE150-NC-Lyc.HCL (5 mg/kg), KYSE150-NC-Lyc.HCL (10 mg/kg), KYSE150-shTRIM22, KYSE150-shTRIM22-LycHCL (5 mg/kg), KYSE150-shTRIM22-Lyc.HCL (10 mg/kg), KYSE150-TRIM22, KYSE150-TRIM22-Lyc.HCL (5 mg/kg), KYSE150-TRIM22-Lyc.HCL (10 mg/kg). Every group received a subcutaneous injection of 5×10⁶ cells on the right rear of the mice. After seven days of subcutaneous tumorigenesis, the mice in the groups KYSE150-NC-Lyc.HCL (5 mg/kg), KYSE150-NC-Lyc.HCL (10 mg/kg), KYSE150-shTRIM22-Lyc.HCL (5 mg/kg), KYSE150-shTRIM22-Lyc.HCL (10 mg/kg), KYSE150-TRIM22-Lyc.HCL (5 mg/kg), KYSE150-TRIM22-Lyc.HCL (10 mg/kg) were treated with intraperitoneal injection of Lyc.HCL (5 mg/kg/twice a day per mouse) and Lyc.HCL (10 mg/kg/twice a day per mouse) for 14 days respectively, while the other two groups mice were injected with DMSO. Tumor volumes (mm3) and mice weight were measured twice a day using a vernier caliper and calculated using the formula, tumor volume = L × W× 0.5 (L: the longest diameter of the tumor, W: the shortest diameter of the tumor).
Subsequently, mice were euthanized by intraperitoneal injection of 150 mg/kg sodium pentobarbital to halt their breathing, and cardiac arrest was confirmed. The tumor tissue was then dissected and photographed. Tumor tissue was embedded, cut into 4 µm thick slices, fixed in 4% paraformaldehyde for 15 min at room temperature, and then stained with hematoxylin for 10 min and eosin for 2 min at room temperature. The tissue was observed under an Olympus BX40 light microscope (Olympus Corporation). An immunohistochemistry assay was performed to analyze the expression of TIRM22, JAK2 and p-AKT. Western blot analysis was used to test the expression of TRIM22 and JAK2/STAT3/PI3K/AKT signaling pathways in tumor tissue.
2.14. Statistical Analysis
Each the experiments were conducted in duplicate and repeated three times. Statistical analysis of the in vitro data was performed using the student’s t-test and 1-way ANOVA. The student’s t-test was used to compare the different groups. *p < 0.05, **p < 0.01, and ***p < 0.001. A p-value of less than 0.05 was considered statistically significant for all data.
3. Results
3.1. TRIM22 Is Upregulated in ESCC Patients and Human ESCC Cell Lines YES2, KYSE30, KYSE70, KYSE140, KYSE180, KYSE410 and KYSE450 Cells
TRIM22 protein was examined in 35 cases of normal esophageal tissue specimens, 35 cases of peritumoral side tissues and 35 cases of ESCC cancer specimens using immunohistochemistry. The cells that expressed TRIM22 are counted in Table 1. ESCC cases were collected were diagnosed initially and without prior treatment or intervention. In normal lung tissues and peritumoral side tissues, negative TRIM22 staining was observed in normal esophageal epithelial cells. Meanwhile, TRIM22 staining can be observed in both nuclear and cytoplasmic compartments of esophageal tumor tissue cells (Figure 1A), consistent with the previous findings and labeled as positive[15]. In our esophageal cancer tissues, high TRIM22 expression was observed in all cases in both nuclear and cytoplasmic compartments. Furthermore, we validated TRIM22 status in human esophageal squamous cell carcinoma cell lines. Western blot analysis showed significantly TRIM22 protein expression in YES2, KYSE30, KYSE70, KYSE140, KYSE150, KYSE180, KYSE410, KYSE450 cells, with particularly high expression in YES2 and KYSE150 cells (Figure 1B and C).
3.2. Lyc.HCL Inhibits the Proliferation of ESCC Cells
Eight ESCC cell lines (YES2, KYSE30, KYSE70, KYSE140, KYSE150, KYSE180, KYSE410 and KYSE450) were treated with Lyc.HCL at concentrations ranging from 0 to 9 μmol/mL for 24h, 48h, and 72 h, respectively. Cell viability was validated using the MTS assay. The effectiveness of the inhibitor was assessed by the inhibitory concentration of 50% of cells (IC50). All the tested cell lines exhibited high sensitivity to Lyc.HCL treatment; and the inhibitory effect was dose- and time-dependent (Figure 2). Interestingly, all tested cell lines exhibited varying sensitivities and effectiveness to Lyc.HCL. Among the tested cell lines, KYSE150 and KYSE180 demonstrated higher sensitivity to Lyc.HCL treatment. At 72 hours, the inhibitory concentration of 50% of cells (IC50) was 1.55 µmol/mL in KYSE150 cells and 1.254 µmol/mL in KYSE180 cells, respectively (Figure 2),which matched the reported studies suggesting the IC50 value usually not exceeded 7.5 μmol/mL [3]. Combined with the expression of TRIM22 in ESCC cell lines (Figure 1B), we selected YES2 and KYSE150 cells with higher expression of TRIM22 for further experiments.
Next, we conducted a cell colony formation assay using YES2 and KYSE150 cells to evaluate the dependence of cell population and proliferation capacity. Following seeding in 6-well plates and incubation for 2 weeks, ESCC cells exhibited a reduction in colony numbers with increasing Lyc.HCL concentration. The result of each colony formation assay is presented in Figure 3A and B. In conclusion, the results of the MTS and cell colony formation assays indicate that Lyc.HCL treatment significantly inhibits ESCC cell proliferation and colony formation in a dose-dependent manner.
3.3. Lyc.HCL Induces Cell Cycle Arrest and Apoptosis in ESCC Cells
After confirming the positive response in proliferation of YES2 and KYSE150 cell lines to Lyc.HCL treatment, we investigated the molecular mechanism underlying the inhibitory effect of Lyc.HCL on the proliferation of ESCC cells, i.e., YES2 and KYSE150. Therefore, we examined the effects of Lyc.HCL treatment on cell cycle and apoptosis. Lyc.HCL treatment resulted in cell cycle arrest in the G2/M phase in YES2 and KYSE150 (Figure 3C), and the data were analyzed using Mod Fit 5.0 (Figure 3D and E). Furthermore, the apoptosis rate showed a slight increase with higher doses of Lyc.HCL (Figure 3F and G).
3.4. Lyc.HCL Inhibits the Metastasis and Invasion of YES2 and KYSE150 Cells
After confirming the crucial role of Lyc.HCL treatment in regulating cell cycle arrest and apoptosis in ESCC cells, we investigated its inhibitory effect on the migration of YES2 and KYSE150 cells. To assess the migration rate, a scratch wound with an area and width of 200 μm was created on a confluent monolayer. The migration into the denuded zone was observed, and the closure area of the wound was analyzed after 0h, 12h, and 24h of incubation with Lyc.HCL treatment. Figure 4A-D demonstrate that Lyc.HCL treatment significantly reduced the migration of YES2 and KYSE150 cells to the denuded zone in a concentration-dependent manner, indicating its effective inhibition of cell the motility. Additionally, the inhibitory effect of Lyc.HCL on cell migration was also assessed using the Transwell assay (Figure 4E). The result showed that Lyc.HCL treatment inhibited the migration of YES2 and KYSE150 in a dose-dependent manner. Image J and GraphPad Prism 5.0 were used for the result analysis (Figure 4F). Furthermore, we conducted the Matrigel invasion assay to investigate the relationship between the inhibitory effects of Lyc.HCL on cell migration and invasion of YES2 and KYSE150. The results were consistent with those obtained from the the wound closure assay and Transwell assay, indicating that Lyc.HCL effectively suppressed the invasion of YES2 and KYSE150 cells in dose-dependent manner (Figure 4G-H).
3.5. The Expression of TRIM22 Is Decreased by Lyc.HCL in YES2 and KYSE150 Cells
Previous studies have reported that TRIM22 plays a role in promoting tumorigenesis and cancer development[16,17]. Our study revealed that TRIM22 is highly expressed in both ESCC patients and ESCC cell lines. Hence, we hypothesized that TRIM22 may play a crucial role in the tumorigenesis, development and prognosis of ESCC. Based on these two findings, we hypothesized that the Lyc.HCL affect ESCC through TRIM22. To investigate the impact of Lyc.HCL on the expression of TRIM22, western blotting analysis was performed in ESCC cells. Figure 5A demonstrates that Lyc.HCL treatment markedly suppressed the expression of TRIM22 in both YES2 and KYSE150 cell lines, and this suppression effect was dose dependent. The quantification of relative expression of TRIM22 in YES2 and KYSE150 cell were described in Figure 5C. Further confirmation was obtained by constructing stable cell lines (YES2 and KYSE150) that overexpressed TRIM22. Figure 5B illustrates that. Lyc.HCL treatment decreased the expression of TRIM22 in both YES2TRIM22 and KYSE150 TRIM22 cell, the quantification of relative expression of TRIM22 were described in Figure 5D.
3.6. Lyc.HCL Exerts Its Anticancer Effect in ESCC Cells by Targeting TRIM22
Additionally, to investigate the potential anticancer effect of Lyc.HCL in ESCC cells via TRIM22 targeting. We generated overexpressed TRIM22 stable cell lines and TRIM22 knockout stable cell lines through Lentiviral infection and Cas9/sgRNA KO, following by treatment with Lyc.HCL. The results are described below:
Over-expression of TRIM22 alleviates the inhibition of cell growth induced by Lyc.HCL, while knockout of TRIM22 promotes the inhibition of cell proliferation mediated by Lyc.HCL
The capability of cell proliferation was measured using a colony formation assay. Deletion of TRIM22 decreased cell growth, while over-expression of TRIM22 promoted the cell growth. Lyc.HCL further decreased the cell growth in YES2shTRIM22 and KYSE150shTRIM22 cell, Lyc.HCL also decreased the cell growth in YES2TRIM22 and KYSE150TRIM22 cell (Figure 6A, B, C, and D). A cell cycle assay was performed to assess the underlying molecular mechanism of Lyc.HCL inhibition on the proliferation of ESCC cells YES2 and KYSE150. Cells over-expressing TRIM22 in YES2 and KYSE150 alleviated cell cycle arrest, while cells that were knockout of TRIM22 arrested cell cycle at the G2/M phase. However, Lyc.HCl arrested the cell cycle to G2/M phase even though in YES2TRIM22 and KYSE150TRIM22 cell, and Lyc.HCL promoted the cell cycle arrest at the G2/M phase in YES2shTRIM22 and KYSE150shTRIM22 (Figure 6 E, F, G and H). The above results demonstrated that by regulating cell cycle, TRIM22 expression is against the inhibition of cell growth induced by Lyc.HCL.
Overexpression of TRIM22 alleviates the inhibition of cell motility induced by Lyc.HCL, while knockout of TRIM22 promotes the suppression of cell migration mediated by Lyc.HCL.
To investigate the role of TRIM22 in cell migration and invasion, we conducted cell wound healing, Transwell and cell invasion assay. As shown in Figure 7, overexpression of TRIM22 significantly increased the numbers of migratory and invasive cells, while knockout of TRIM22 decreased the abilities of migratory and invasion. Furthermore, overexpression of TRIM22 attenuates the inhibition of cell motility induced by Lyc.HCL, while knockout of TRIM22 enhances Lyc.HCL-mediated cell metastasis and invasion. These results demonstrate that TRIM22 plays a protective role in the suppression of Lyc.HCL-mediated cell metastasis and invasion.
3.7. Lyc.HCL Targets TRIM22 and Potentially Has an Anti-Esophageal Cancer Role Through JAK2/STAT3, PI3K/AKT and MAPK/ERK Signaling Pathways
To investigate the mechanism by whether Lyc.HCL targets TRIM22 and exerts an anti-esophageal cancer role through JAK2/STAT3, PI3K/AKT and MAPK/ERK signaling pathways that are crucial in cancers[18,19], we initially examined the effect of Lyc.HCL on these pathways. In ESCC cells, we observed that Lyc.HCL dose-dependently reduced the expression of proteins associated with the JAK2/STAT3, PI3K/AKT and MAPK/ERK signaling pathways (Figure 8A), the quantification of relative expression of proteins in YES2 and KYSE150 cells by Image J, the analysis data is attached on supplementary material (Figure 1S).
Next, to gain a better understanding of the molecular mechanism, we conducted western blotting analysis to investigate the expression level of related proteins in JAK2/STAT3, PI3K/AKT and MAPK/ERK signaling pathways, this analysis was conducted on both YES2TRIM22, YES2shTRIM22, KYSE150TRIM22 and KYSE150shTRIM22 cells, as well as being treated by Lyc.HCL. As anticipated (Figure 8B and C), Lyc.HCL suppressed the expression of proteins in JAK2/STAT3, PI3K/AKT and MAPK/ERK signaling pathways induced by TRIM22 overexpression. Conversely, Lyc.HCL promoted the inhibition of JAK2/STAT3, PI3K/AKT and MAPK/ERK signaling pathways mediated by TRIM22 knockout. Furthermore, when compared to Lyc.HCL treatment alone or TRIM22 knockout alone, the combination of Lyc.HCL treatment and TRIM22 knockout exhibited a greater degree of inhibition on the expression of proteins in the JAK2/STAT3, PI3K/AKT and MAPK/ERK signaling pathways. The quantification of relative expression of proteins in Figure 8B,C by Image J are attached on supplementary material (Figures 2S and 3S). These results indicate that Lyc.HCL exerts anti-esophageal squamous cancer effects by regulating TRIM22 expression and JAK2/STAT3, PI3K/AKT and MAPK/ERK signaling pathways (Figure 9).
3.8. Lyc.HCL Alleviated Tumor Growth Induced by TRIM22 Overexpression In Vivo
Previous studies have demonstrated that Lyc.HCL suppressed tumorigenesis bladder cancer in vivo[20]. To further investigate the effect of Lyc.HCL on esophageal squamous cancer growth induced by TRIM22 overexpression in vivo and its potential to promote TRIM22 knockout-mediated inhibition of esophageal squamous cancer, we established a subcutaneous tumor xenograft model. The results present in Figure 10A-C demonstrate that Lyc.HCL significantly inhibited tumor growth. In addition, up-regulation of TRIM22 promoted tumor growth and counteracted the inhibitory effects of Lyc.HCL. Deletion of TRIM22 restrained tumor growth, which was further suppressed following being treated by Lyc.HCL.
Subsequent western blot analysis of tumor tissues revealed that Lyc.HCL inhibited the expression of TRIM22 and its corresponding proteins in JAK2/STAT3, PI3K/AKT and MAPK/ERK signaling pathways. Additionally, Lyc.HCL alleviated the overexpression of corresponding proteins in JAK2/SATA3, PI3K/AKT and MAPK/ERK pathways induced by overexpression TRIM22 and enhanced the inhibition mediated by TRIM22 knockout (Figure 10D). Figure 10E-K are quantification of relative expression of proteins in Figure10D. H&E staining revealed the cellular morphology of tumor tissues in different groups (Figure 11A). Immunohistochemical staining showed that Lyc.HCL treatment suppressed the expression of TRIM22, JAK2 and p-AKT that are in JAK2/STAT3, PI3K/AKT and MAPK/ERK signaling pathways. In Comparison to TRIM22 overexpression, TRIM22 knockout also reduced the expression of JAK2 and p-AKT, which were further reduced after Lyc.HCL treatment (Figure 11B–D).
4. Discussion
Despite significant advancements in the treatment of ESCC, it continues to be a highly lethal cancer, with a survival rate of less than 30% at 5 years[21]. Therefore, it is imperative to identify more effective therapeutic targets and develop new drugs to enhance the treatment efficiency of ESCC. Emerging evidence suggests that Lyc.HCL holds significant potential in the treatment of various human cancers[22]. Our study revealed that Lyc.HCL effectively suppressed the proliferation of ESCC cell lines in a dose- and time-dependent manner (Figure 2 and Figure 3A, B).
TRIM22 is a versatile protein that plays multiple roles in cellular differentiation and proliferation, inhibits viral replication, activates immune cells and regulates ubiquitination in vivo[23,24,25,26]. In addition, TRIM22 is involved in the regulation of cellular differentiation and proliferation[27], which may have a crucial impact on various cancers. It is worth nothing that TRIM22 is downregulated in melanoma patients, who exhibit shorter survival compared to those with high expression of TRIM22[10]. Conversely, TRIM22 is upregulated in non-small cell lung cancer, and the overexpression is associated with poor survival in lung cancer patients[16]. Consequently, the functional role and status of TRIM22 in human cancers remain ambiguous, and its specific role in the progression of ESCC has yet to be elucidated. To determine the status of TRIM22 in ESCC, immunohistochemistry was performed to assess its protein expression in 35 cases of ESCC tissues, 35 cases of paracancerous tissues, and 35 cases of normal tissues. Our results demonstrate a significant upregulation of TRIM22 protein expression in ESCC patient specimens while it is not expressed in paracancerous tissues and normal esophagus tissues. The western blot data demonstrated that the level of TRIM22 was overexpressed in ESCC cell lines. It is noteworthy that Lyc.HCL significantly inhibited the expression of TRIM22 in vitro ESCC cell lines and in vivo xenograft tumors in a dose-dependent manner. Our results also showed that Lyc.HCL inhibited TRIM22 expression and inactivated JAK2/STAT3, PI3K/AKT, MAPK/ERK and FOXO pathways both in vitro and in vivo. Rescue assays demonstrated that overexpression of TRIM22 activated JAK2/STAT3, PI3K/AKT, MAPK/ERK and PI3K/AKT/FOXO pathways in vitro and in vivo. Conversely, TRIM22 knockout inactivated the same pathways both in vitro and in vivo. Lyc.HCL suppressed the expression of TIRM22 and the activation of pathways. These data suggest that TRIM22 could serve as a potential oncoprotein in ESCC and may be an excellent target for Lyc.HCL in the treatment of ESCC due to its control of muti-pathway expression in tumors. TRIM family genes are induced by IFN-γ stimulation and TRIM22 is one of the most strongly induced TRIM proteins by IFN-γ[13]. IFN-γ induced activation of the JAK2/STAT and PI3K/AKT pathways[28], both of which are responsible for cell growth and proliferation. The PI3K/AKT/mTOR pathway is hyperactivated or altered in many cancer types and regulates a broad range of cellular processes, including survival, proliferation, growth, metabolism, angiogenesis and metastasis[29]. The PI3K/AKT pathway is regulated by a diverse array of upstream signaling proteins and collaborates with multiple compensatory signaling pathways, primarily the MAPK/ERK pathway, to regulate numerous downstream effectors[29]. PI3K/AKT and MAPK/ERK signaling pathways are well-established oncogenic signaling pathways that play a crucial role in regulating tumorigenesis and development[30]. Among all MAPK signal transduction pathways, the MAPK/ERK pathway stands out as the most vital signaling cascade, playing a pivotal role in the survival and development of tumor cells. The role of ERK in tumor proliferation, invasion and metastasis is prominently emphasized[31]. FOXO1 is among the downstream targets of PI3K/AKT pathway[32]. Therefore, we propose that Lyc.HCL has the potential to suppress ESCC cell proliferation, metastasis and invasion by targeting TRIM22 and modulating JAK2/STAT3, PI3K/AKT, MAPK and PI3K/AKT/FOXO signaling pathways. Nevertheless, the interplay among the JAK2/STAT, PI3K/AKT, MAPK and PI3K/AKT/FOXO signaling pathways, which holds promise for the advancement of novel therapeutic strategies for cancer, requires further investigation.
We conducted a colony formation assay to investigate the mechanism by which Ly.HCL mediates its anti-ESCC effect, the assay showed that Lyc.HCL suppressed cell growth in vitro. Additionally, we showed that Lyc.HCL treatment resulted in delaying tumor growth and reduced tumor cachexia in vivo. Both in vitro and in vivo rescue assays revealed that TRIM22 overexpression significantly promoted proliferation while silencing of TRIM22 reversed this effect. The ability of Lyc.HCL to reduce TRIM22-induced proliferation suggests that Lyc.HCL exerts its anti-proliferation effects by targeting TRIM22. Uncontrolled tumor growth has been primarily linked to aberrant cell cycle regulation[33]. Cell cycle analysis revealed that Lyc. HCL can induce cell cycle arrest at the G2/M phase in YES2 and KYSE150 cells. Rescue assays showed that TRIM22 overexpression the significantly promoted cell cycle progression, while TRIM22 silencing reversed this effect. Lyc.HCL can induce cell cycle arrest at G2/M phase, which is triggered by TRIM22. Furthermore, we observed a significant inhibition of p-p27 in YES2 and KYSE150 cells treated with Lyc.HCL during cell cycle. p-p27 plays a crucial role in the activation of cyclin D/ CDKs complex or the cyclin E/ CDK2 complex, which promotes the cell cycle when cyclins bind to CDKs[34].The phosphorylation of p27 at Thr157 is referred to as p-p27. Inhibition of p-p27 can hinder the formation of the cyclin D/ CDKs complex, leading to cell cycle arrest. p-p27 is downstream molecules of PI3K/AKT signaling pathway[35]. Phosphorylation of AKT can upregulate cyclin D1 and downregulate the cyclin D kinase (CDK) inhibitors p21 and p27, promoting cell cycle progression[36]. The present study indicated that inactivation of the PI3K/AKT pathway by Lyc.HCL in YES2 and KYSE150 cells led to the suppression of p-AKT and p-p27 ultimately causing cell cycle arrest. In addition, Fork head Box O (FOXO) is a subfamily of the fork-head transcription factor family that plays a crucial role in determining cell fate. This subfamily is also believed to function as a pivotal tumor suppressor in various cancers[37]. FOXO proteins are translocated to the cytosol and subsequently degraded through the ubiquitin-proteasome pathway. In the absence of growth factors’ survival signals, FOXO proteins translocate to the nucleus and upregulate multiple target genes, promoting cell cycle arrest, stress resistance, and apoptosis[38]. However, it is still not well understood whether the target genes of different transcription factors are distinct or similar. FOXO transcription factors may have different roles, and exhibit opposite functions under different conditions[38]. Considering that FOXO1 is one of the gene associated with cell cycle transition[39,40]. In our study, we observed that Lyc.HCL suppressed the expression of p-FOXO1 in YES2 and KYSE150 cells, which may be linked to cell cycle arrest. Importantly, the PI3K/AKT pathway is the key pathway that interacts with FOXO in various types of cancers[37]. FOXO is also a downstream molecular in the PI3K/AKT pathway[41]. The PI3K/AKT pathway is strongly associated with tumor growth and metastasis[42]. Our findings revealed that Lyc.HCL led to the downregulation of PI3K/AKT pathway, p-FOXO and p-p27. These data suggest that Lyc.HCL may inhibit the PI3K/AKT/FOXO pathway and Thr157 phosphorylation of p27 in a dose-dependent manner, ultimately leading to cell cycle arrest in the G2/M phase and inhibition of cell growth.
Previous studies have suggested that the reduction in tumor growth and cell viability can be attributed to the induction of cell cycle arrest and apoptosis[43]. However, the cell apoptosis assay confirmed that Lyc.HCL induced apoptosis in YES2 and KYSE150 cells to some extent, although the effect was not obvious. Further investigation is required to explore alternative mechanism of cell death, including ferroptosis and autophagy.
Tumor metastasis and invasion are closely associated to prognosis and play a crucial role in tumor treatment[44]. This study utilized the wood healing assay and Transwell assay to demonstrate that Lyc.HCL inhibited the metastatic ability of YES2 and KYSE150 cells. The Matrigel invasion assay confirmed that Lyc.HCL suppressed the invasive ability of YES2 and KYSE150 cells. This study is the first to demonstrate, at the cellular level, that Lyc.HCL inhibits the metastasis and invasion of ESCC YES2 and KYSE150 cells in a dose-dependent manner. Additionally, rescue assays demonstrated that TRIM22 overexpression significantly enhanced migration and invasion, whereas the results were significantly reversed upon TRIM22 depletion. Lyc.HCL inhibited migration and invasion induced by TRIM22, indicating its role in suppressing anti-ESCC metastasis and invasion by targeting TRIM22. Mechanically, previous studies have reported that TRIM22 knockout significantly inhibited the proliferation, migration and invasion of fibroblast-like synoviocytes in rheumatoid arthritis[25]. Consistent with the afore mentioned studies, our study elucidated the role of TRIM22 in the ESCC cell lines and the effectiveness of Lyc.HCL in inhibiting ESCC metastasis and invasion. The results of the current study demonstrated that TRIM22 was expressed at significantly higher levels in ESCC cell lines and tumor tissues from ESCC patients. Lyc.HCL downregulated the expression of TRIM22 and significantly inhibited the proliferation, migration and invasion of YES2 and KYSE150 cell lines. The fork head family of transcription factors is associated with various biological processes, including proliferation, metastasis and invasion[45]. It was reported that FOXC1 transcription factor has a binding site on the TRIM22 promoter. Overexpression of FOXC1 significantly increased the mRNA expression and protein expression of TRIM22[25]. The current study suggested that p-FOXO1, a member of the fork head family of transcription factors, was reduced in YES2 and KYSE150 cells after the treatment with Lyc.HCL. This reduction may explain the mechanism of inhibition of migration and invasion in YES2 and KYSE150. In addition, rescue assays indicated a close relationship between the expression of p-FOXO1 and TRIM22, and Lyc.HCL suppressed p-FOXO1 by targeting TRIM22. However, further studies are needed to explore about the role of p-FOXO1 in reduction of migration and invasion by Lyc.HCL. The PI3K/AKT/mTOR pathway overtly regulates migration and invasion in various tumors[46,47,48]. Additionally, it has been highlighted that activation of MAPK pathway promotes metastasis and invasion[49,50,51,52,53,54]. Recently, JAK2/STAT3 signaling axis was also reported to play a crucial role in metastasis and invasion of tumor cells[55,56], this indicates that potential drugs targeting the JAK2/STAT3 pathway may be developed for tumor therapy. The present study certificated that Lyc.HCL exerts its anti-migration and anti-invasion effects by targeting TRIM22 and simultaneously affecting the JAK/STAT3, PI3K/AKT, MAPK/ERK and FOXO pathways. This suggested that Lyc.HCL may be capable of controlling additional pathways and have one more effective function in inhibiting tumor metastasis and invasion, which is noteworthy. However, the role of downstream classical molecules in metastasis and invasion such as ECM and EMT, which are two critical steps[57], needs to be further explored.
Meanwhile, it is important to critically consider the of our study. Firstly, our focus was solely on the expression of TRIM22 in ESCC patients without any treatment or drug interference. It is crucial to consider more detailed clinical information about ESCC patients, including tumor stages, metastasis, ages and gender. This will provide a more comprehensive understanding of potential effectiveness of TRIM22 as molecular marker for evaluating the prognosis of ESCC. Secondly, we findings indicated that Lyc.HCL inhibited proliferation, metastasis and invasion by targeting TRIM22 through JAK2/STAT3, PI3K/AKT, MAPK/ERK pathways. However, our in vivo experiments only involved the construction of a subcutaneous xenograft model to explore the inhibition of proliferation by Lyc.HCL. Additionally, we studied the role of TRIM22 in vivo. Although Lyc.HCL demonstrates significant anti-metastasis and anti-invasion effect in ESCC in vitro, we did not conduct further in vivo experiments to confirm these findings. Furthermore, our study utilized human ESCC cell line-derived xenograft models for in vivo research, rather than more diverse preclinical models such as ESCC patient-derived xenograft models or transgenic mice. These alternative models are necessary to fully unveil the anti-ESCC functions of Lyc.HCL and the role of TRIM22. Lastly, the crosstalk between different pathways that Lyc.HCL acted on to inhibit ESCC proliferation, metastasis and invasion has not been elucidated.
5. Conclusions
To sum up, Lyc.HCl, monomer of traditional Chinese medicine has demonstrated, strong anti-ESCC effects. Lyc.HCL shows promise as a potential drug, due to its targeting of TRIM22, an important molecule, that regulates JAK2/STAT3, PI3K/AKT, MAPK/ERK pathways. Additionally, TRIM22 expression levels in ESCC tissues and cell lines are upregulated. TRIM22 plays a significant role in ESCC cell proliferation, metastasis and invasion. The JAK2/STAT3, PI3K/AKT and MAPK/ERK pathways likely play a crucial role in TRIM22-induced ESCC cell proliferation, metastasis and invasion. These findings support the hypothesis that TRIM22 could serve as both a diagnostic biomarker and therapeutic target for ESCC.
Supplementary Materials
The following supporting information can be downloaded at the website of this paper posted on Preprints.org.
Author Contributions
JY had role in conceptualization, investigation, experiments completion, data collection and analysis, manuscript preparation and revision. LX and JL participated the collection of patient’s samples and pathological experiments. TZ reviewed and revised the manuscript. All authors read and approved the final manuscript.
Funding
This research was funded by the Start-up Fund for High-level Talents in Affiliated Hospital of Guangdong Medical University (grant No. 51301Z20200007) and Discipline construction project of Guangdong Medical University (grant No. 4SG21266P and 4SG21276P).
Institutional Review Board Statement
Ethical approval was given by the medical ethics committee of Peking University Shenzhen hospital (2021-111).
Informed Consent Statement
Not applicable.
Data Availability Statement
The data used to support the findings of this study are available from the corresponding author upon request.
Acknowledgments
This project was supported by the funds: the Start-up Fund for High-level Talents in Affiliated Hospital of Guangdong Medical University (grant No. 51301Z20200007) and Discipline construction project of Guangdong Medical University (grant No. 4SG21266P and 4SG21276P).
Conflicts of Interest
The authors declare that they have no competing interests.
List of Abbreviations
| ESCC: | Esophageal squamous cell carcinoma |
| Lyc.HCL: | Lycorine hydrochloride |
| TRIM: | Tripartite motif-containing |
| TCM: | Traditional Chinese medicine |
| JAK2: | janus kinase-2 |
| STAT3: | signal transducer and activator of transcription 3 |
| PI3K: | phosphoinositide 3-kinase |
| AKT: | protein kinase B |
| MAPK: | mitogen-activated protein kinases |
| ERK: | extracellular signal-regulated kinase |
References
- Sung, H.; et al. Global Cancer Statistics 2020: GLOBOCAN Estimates of Incidence and Mortality Worldwide for 36 Cancers in 185 Countries. CA Cancer J Clin 2021, 71, 209–249. [Google Scholar] [CrossRef] [PubMed]
- Chen, Y.; et al. Survivin Regulates Bad Gene Expression by Binding to Its Promoter and Modulates Cell Cycle and Apoptosis in Esophageal Carcinoma Cell. J Oncol 2021, 2021, 1384289. [Google Scholar] [CrossRef] [PubMed]
- Roy, M.; et al. Lycorine: A prospective natural lead for anticancer drug discovery. Biomed Pharmacother 2018, 107, 615–624. [Google Scholar] [CrossRef]
- Souers, A.J.; et al. ABT-199, a potent and selective BCL-2 inhibitor, achieves antitumor activity while sparing platelets. Nat Med 2013, 19, 202–208. [Google Scholar] [CrossRef] [PubMed]
- Cao, Z.; et al. Lycorine hydrochloride selectively inhibits human ovarian cancer cell proliferation and tumor neovascularization with very low toxicity. Toxicol Lett 2013, 218, 174–185. [Google Scholar] [CrossRef] [PubMed]
- Ozato, K.; et al. TRIM family proteins and their emerging roles in innate immunity. Nat Rev Immunol 2008, 8, 849–860. [Google Scholar] [CrossRef]
- Huang, N.; et al. TRIM family contribute to tumorigenesis, cancer development, and drug resistance. Exp Hematol Oncol 2022, 11, 75. [Google Scholar] [CrossRef]
- Offermann, A.; et al. Analysis of tripartite motif (TRIM) family gene expression in prostate cancer bone metastases. Carcinogenesis 2021, 42, 1475–1484. [Google Scholar] [CrossRef]
- Yanagi, T.; et al. Loss of TRIM29 Alters Keratin Distribution to Promote Cell Invasion in Squamous Cell Carcinoma. Cancer Res 2018, 78, 6795–6806. [Google Scholar] [CrossRef]
- Gu, X.; et al. Aberrant KAT2A accumulations render TRIM22-low melanoma sensitive to Notch1 inhibitors via epigenetic reprogramming. J Transl Med 2023, 21, 443. [Google Scholar] [CrossRef]
- Fei, X.; et al. TRIM22 orchestrates the proliferation of GBMs and the benefits of TMZ by coordinating the modification and degradation of RIG-I. Mol Ther Oncolytics 2022, 26, 413–428. [Google Scholar] [CrossRef] [PubMed]
- Liu, W.; et al. TRIM22 inhibits osteosarcoma progression through destabilizing NRF2 and thus activation of ROS/AMPK/mTOR/autophagy signaling. Redox Biol 2022, 53, 102344. [Google Scholar] [CrossRef] [PubMed]
- Inoue, A.; et al. TRIM22 negatively regulates MHC-II expression. Biochim Biophys Acta Mol Cell Res 2022, 1869, 119318. [Google Scholar] [CrossRef] [PubMed]
- Liu, G. and T. Zeng, Sporoderm-Removed Ganoderma lucidum Spore Powder May Suppress the Proliferation, Migration, and Invasion of Esophageal Squamous Cell Carcinoma Cells Through PI3K/AKT/mTOR and Erk Pathway. Integr Cancer Ther 2021, 20, 15347354211062157. [Google Scholar] [CrossRef] [PubMed]
- Kelly, J.N.; et al. Ancient and recent adaptive evolution in the antiviral TRIM22 gene: identification of a single-nucleotide polymorphism that impacts TRIM22 function. Hum Mutat 2014, 35, 1072–1081. [Google Scholar] [CrossRef]
- Liu, L.; et al. TRIM22 confers poor prognosis and promotes epithelial-mesenchymal transition through regulation of AKT/GSK3β/β-catenin signaling in non-small cell lung cancer. Oncotarget 2017, 8, 62069–62080. [Google Scholar] [CrossRef]
- Li, L.; et al. TRIM22 knockdown suppresses chronic myeloid leukemia via inhibiting PI3K/Akt/mTOR signaling pathway. Cell Biol Int 2018, 42, 1192–1199. [Google Scholar] [CrossRef]
- Wu, F.; et al. Signaling pathways in cancer-associated fibroblasts and targeted therapy for cancer. Signal Transduct Target Ther 2021, 6, 218. [Google Scholar] [CrossRef]
- Jiang, N.; et al. Role of PI3K/AKT pathway in cancer: the framework of malignant behavior. Mol Biol Rep 2020, 47, 4587–4629. [Google Scholar] [CrossRef]
- Wang, C.; et al. Lycorine induces apoptosis of bladder cancer T24 cells by inhibiting phospho-Akt and activating the intrinsic apoptotic cascade. Biochem Biophys Res Commun 2017, 483, 197–202. [Google Scholar] [CrossRef]
- Morgan, E.; et al. The Global Landscape of Esophageal Squamous Cell Carcinoma and Esophageal Adenocarcinoma Incidence and Mortality in 2020 and Projections to 2040: New Estimates From GLOBOCAN 2020. Gastroenterology 2022, 163, 649–658.e2. [Google Scholar] [CrossRef] [PubMed]
- Cao, Z.; Yang, P.; Zhou, Q. Multiple biological functions and pharmacological effects of lycorine. Sci China Chem 2013, 56, 1382–1391. [Google Scholar] [CrossRef] [PubMed]
- Forlani, G.; Accolla, R.S. Tripartite Motif 22 and Class II Transactivator Restriction Factors: Unveiling Their Concerted Action against Retroviruses. Front Immunol 2017, 8, 1362. [Google Scholar] [CrossRef] [PubMed]
- Pagani, I.; Poli, G.; Vicenzi, E. TRIM22. A Multitasking Antiviral Factor. Cells 2021, 10. [Google Scholar] [CrossRef]
- Wei, Y.; et al. FOXC1-mediated TRIM22 regulates the excessive proliferation and inflammation of fibroblast-like synoviocytes in rheumatoid arthritis via NF-κB signaling pathway. Mol Med Rep 2022, 26. [Google Scholar] [CrossRef] [PubMed]
- Fei, X.; et al. TRIM22 promotes the proliferation of glioblastoma cells by activating MAPK signaling and accelerating the degradation of Raf-1. Exp Mol Med 2023, 55, 1203–1217. [Google Scholar] [CrossRef]
- Hattlmann, C.J.; Kelly, J.N.; Barr, S.D. TRIM22: A Diverse and Dynamic Antiviral Protein. Mol Biol Int 2012, 153415. [Google Scholar] [CrossRef]
- Gao, Y.; et al. IFN-γ-mediated inhibition of lung cancer correlates with PD-L1 expression and is regulated by PI3K-AKT signaling. Int J Cancer 2018, 143, 931–943. [Google Scholar] [CrossRef]
- Ersahin, T.; Tuncbag, N.; Cetin-Atalay, R. The PI3K/AKT/mTOR interactive pathway. Mol Biosyst 2015, 11, 1946–1954. [Google Scholar] [CrossRef]
- Shorning, B.Y.; et al. The PI3K-AKT-mTOR Pathway and Prostate Cancer: At the Crossroads of AR, MAPK, and WNT Signaling. Int J Mol Sci 2020, 21. [Google Scholar] [CrossRef]
- Sugiura, R.; Satoh, R.; Takasaki, T. ERK: A Double-Edged Sword in Cancer. ERK-Dependent Apoptosis as a Potential Therapeutic Strategy for Cancer. Cells 2021, 10. [Google Scholar] [CrossRef] [PubMed]
- Chang, L.; et al. PI3K/Akt/mTOR pathway inhibitors enhance radiosensitivity in radioresistant prostate cancer cells through inducing apoptosis, reducing autophagy, suppressing NHEJ and HR repair pathways. Cell Death Dis 2014, 5, e1437. [Google Scholar] [CrossRef] [PubMed]
- Liu, J.; Peng, Y.; Wei, W. Cell cycle on the crossroad of tumorigenesis and cancer therapy. Trends Cell Biol 2022, 32, 30–44. [Google Scholar] [CrossRef] [PubMed]
- Singh, S.K.; et al. Resveratrol induces cell cycle arrest and apoptosis with docetaxel in prostate cancer cells via a p53/ p21WAF1/CIP1 and p27KIP1 pathway. Oncotarget 2017, 8, 17216–17228. [Google Scholar] [CrossRef]
- Jafari, M.; et al. PI3k/AKT signaling pathway: Erythropoiesis and beyond. J Cell Physiol 2019, 234, 2373–2385. [Google Scholar] [CrossRef]
- Song, G.; et al. TIMP1 is a prognostic marker for the progression and metastasis of colon cancer through FAK-PI3K/AKT and MAPK pathway. J Exp Clin Cancer Res 2016, 35, 148. [Google Scholar] [CrossRef]
- Farhan, M.; et al. FOXO Signaling Pathways as Therapeutic Targets in Cancer. Int J Biol Sci 2017, 13, 815–827. [Google Scholar] [CrossRef]
- Greer, E.L. and A. Brunet, FOXO transcription factors at the interface between longevity and tumor suppression. Oncogene 2005, 24, 7410–7425. [Google Scholar] [CrossRef]
- Zhao, M.; et al. miR-3188 regulates nasopharyngeal carcinoma proliferation and chemosensitivity through a FOXO1-modulated positive feedback loop with mTOR-p-PI3K/AKT-c-JUN. Nat Commun 2016, 7, 11309. [Google Scholar] [CrossRef]
- Wu, Y.; et al. Expression of FOXO1 is associated with GATA3 and Annexin-1 and predicts disease-free survival in breast cancer. Am J Cancer Res 2012, 2, 104–115. [Google Scholar] [CrossRef]
- Ding, J.; et al. Membrane metalloendopeptidase (MME) is positively correlated with systemic lupus erythematosus and may inhibit the occurrence of breast cancer. PLoS One 2023, 18, e0289960. [Google Scholar] [CrossRef] [PubMed]
- Noorolyai, S.; et al. The relation between PI3K/AKT signalling pathway and cancer. Gene 2019, 698, 120–128. [Google Scholar] [CrossRef] [PubMed]
- Evan, G.I. and K.H. Vousden, Proliferation, cell cycle and apoptosis in cancer. Nature 2001, 411, 342–348. [Google Scholar] [CrossRef] [PubMed]
- Ma, S.; et al. Comprehensive evaluation of serum circHAS2 as a novel diagnostic and prognostic biomarker for gastric cancer. Mol Carcinog 2023. [CrossRef] [PubMed]
- Golson, M.L. and K.H. Kaestner, Fox transcription factors: from development to disease. Development 2016, 143, 4558–4570. [Google Scholar] [CrossRef]
- Zhang, F.; et al. TRIM28 recruits E2F1 to regulate CBX8-mediated cell proliferation and tumor metastasis of ovarian cancer. Hum Cell 2023. [CrossRef]
- Wen, Z.; et al. THBS1-Mediated Degradation of Collagen via the PI3K/AKT Pathway Facilitates the Metastasis and Poor Prognosis of OSCC. Int J Mol Sci 2023, 24. [Google Scholar] [CrossRef]
- Xin, H.; et al. Knockdown of LMNA inhibits Akt/β-catenin-mediated cell invasion and migration in clear cell renal cell carcinoma cells. Cell Adh Migr 2023, 17, 1–14. [Google Scholar] [CrossRef]
- Wen, S.; et al. Cancer-associated fibroblast (CAF)-derived IL32 promotes breast cancer cell invasion and metastasis via integrin β3-p38 MAPK signalling. Cancer Lett 2019, 442, 320–332. [Google Scholar] [CrossRef]
- Wei, C.H.; et al. MicroRNA-330-3p promotes cell invasion and metastasis in non-small cell lung cancer through GRIA3 by activating MAPK/ERK signaling pathway. J Hematol Oncol 2017, 10, 125. [Google Scholar] [CrossRef]
- Li, Q.T.; et al. KCNN4 promotes invasion and metastasis through the MAPK/ERK pathway in hepatocellular carcinoma. J Investig Med 2020, 68, 68–74. [Google Scholar] [CrossRef] [PubMed]
- Wu, S.; et al. ORAI2 Promotes Gastric Cancer Tumorigenicity and Metastasis through PI3K/Akt Signaling and MAPK-Dependent Focal Adhesion Disassembly. Cancer Res 2021, 81, 986–1000. [Google Scholar] [CrossRef] [PubMed]
- Shi, Y.; et al. Circular RNA LPAR3 sponges microRNA-198 to facilitate esophageal cancer migration, invasion, and metastasis. Cancer Sci 2020, 111, 2824–2836. [Google Scholar] [CrossRef] [PubMed]
- Chen, L.; et al. HCC-derived exosomes elicit HCC progression and recurrence by epithelial-mesenchymal transition through MAPK/ERK signalling pathway. Cell Death Dis 2018, 9, 513. [Google Scholar] [CrossRef] [PubMed]
- Prajapati, K.S. and S. Kumar, Loss of miR-6844 alters stemness/self-renewal and cancer hallmark(s) markers through CD44-JAK2-STAT3 signaling axis in breast cancer stem-like cells. J Cell Biochem 2023, 124, 1186–1202. [Google Scholar] [CrossRef] [PubMed]
- Limbu, K.R.; et al. Mebendazole Impedes the Proliferation and Migration of Pancreatic Cancer Cells through SK1 Inhibition Dependent Pathway. Molecules 2022, 27. [Google Scholar] [CrossRef]
- Pastushenko, I.; et al. Identification of the tumour transition states occurring during EMT. Nature 2018, 556, 463–468. [Google Scholar] [CrossRef]
Figure 1.
High expression of TRIM22 in esophageal squamous cell carcinoma patients and human esophageal squamous cell carcinoma cell lines. (A) Immunohistochemistry assay shows the expression of TRIM22 in esophageal tissue, peritumoral side tissue and esophageal cancer tissue. (B) Western blot analysis of TRIM22 expression were performed on human esophageal squamous cell carcinoma cell lines. (C) The quantification of relative expression of TRIM22 in different cell lines by Image J.
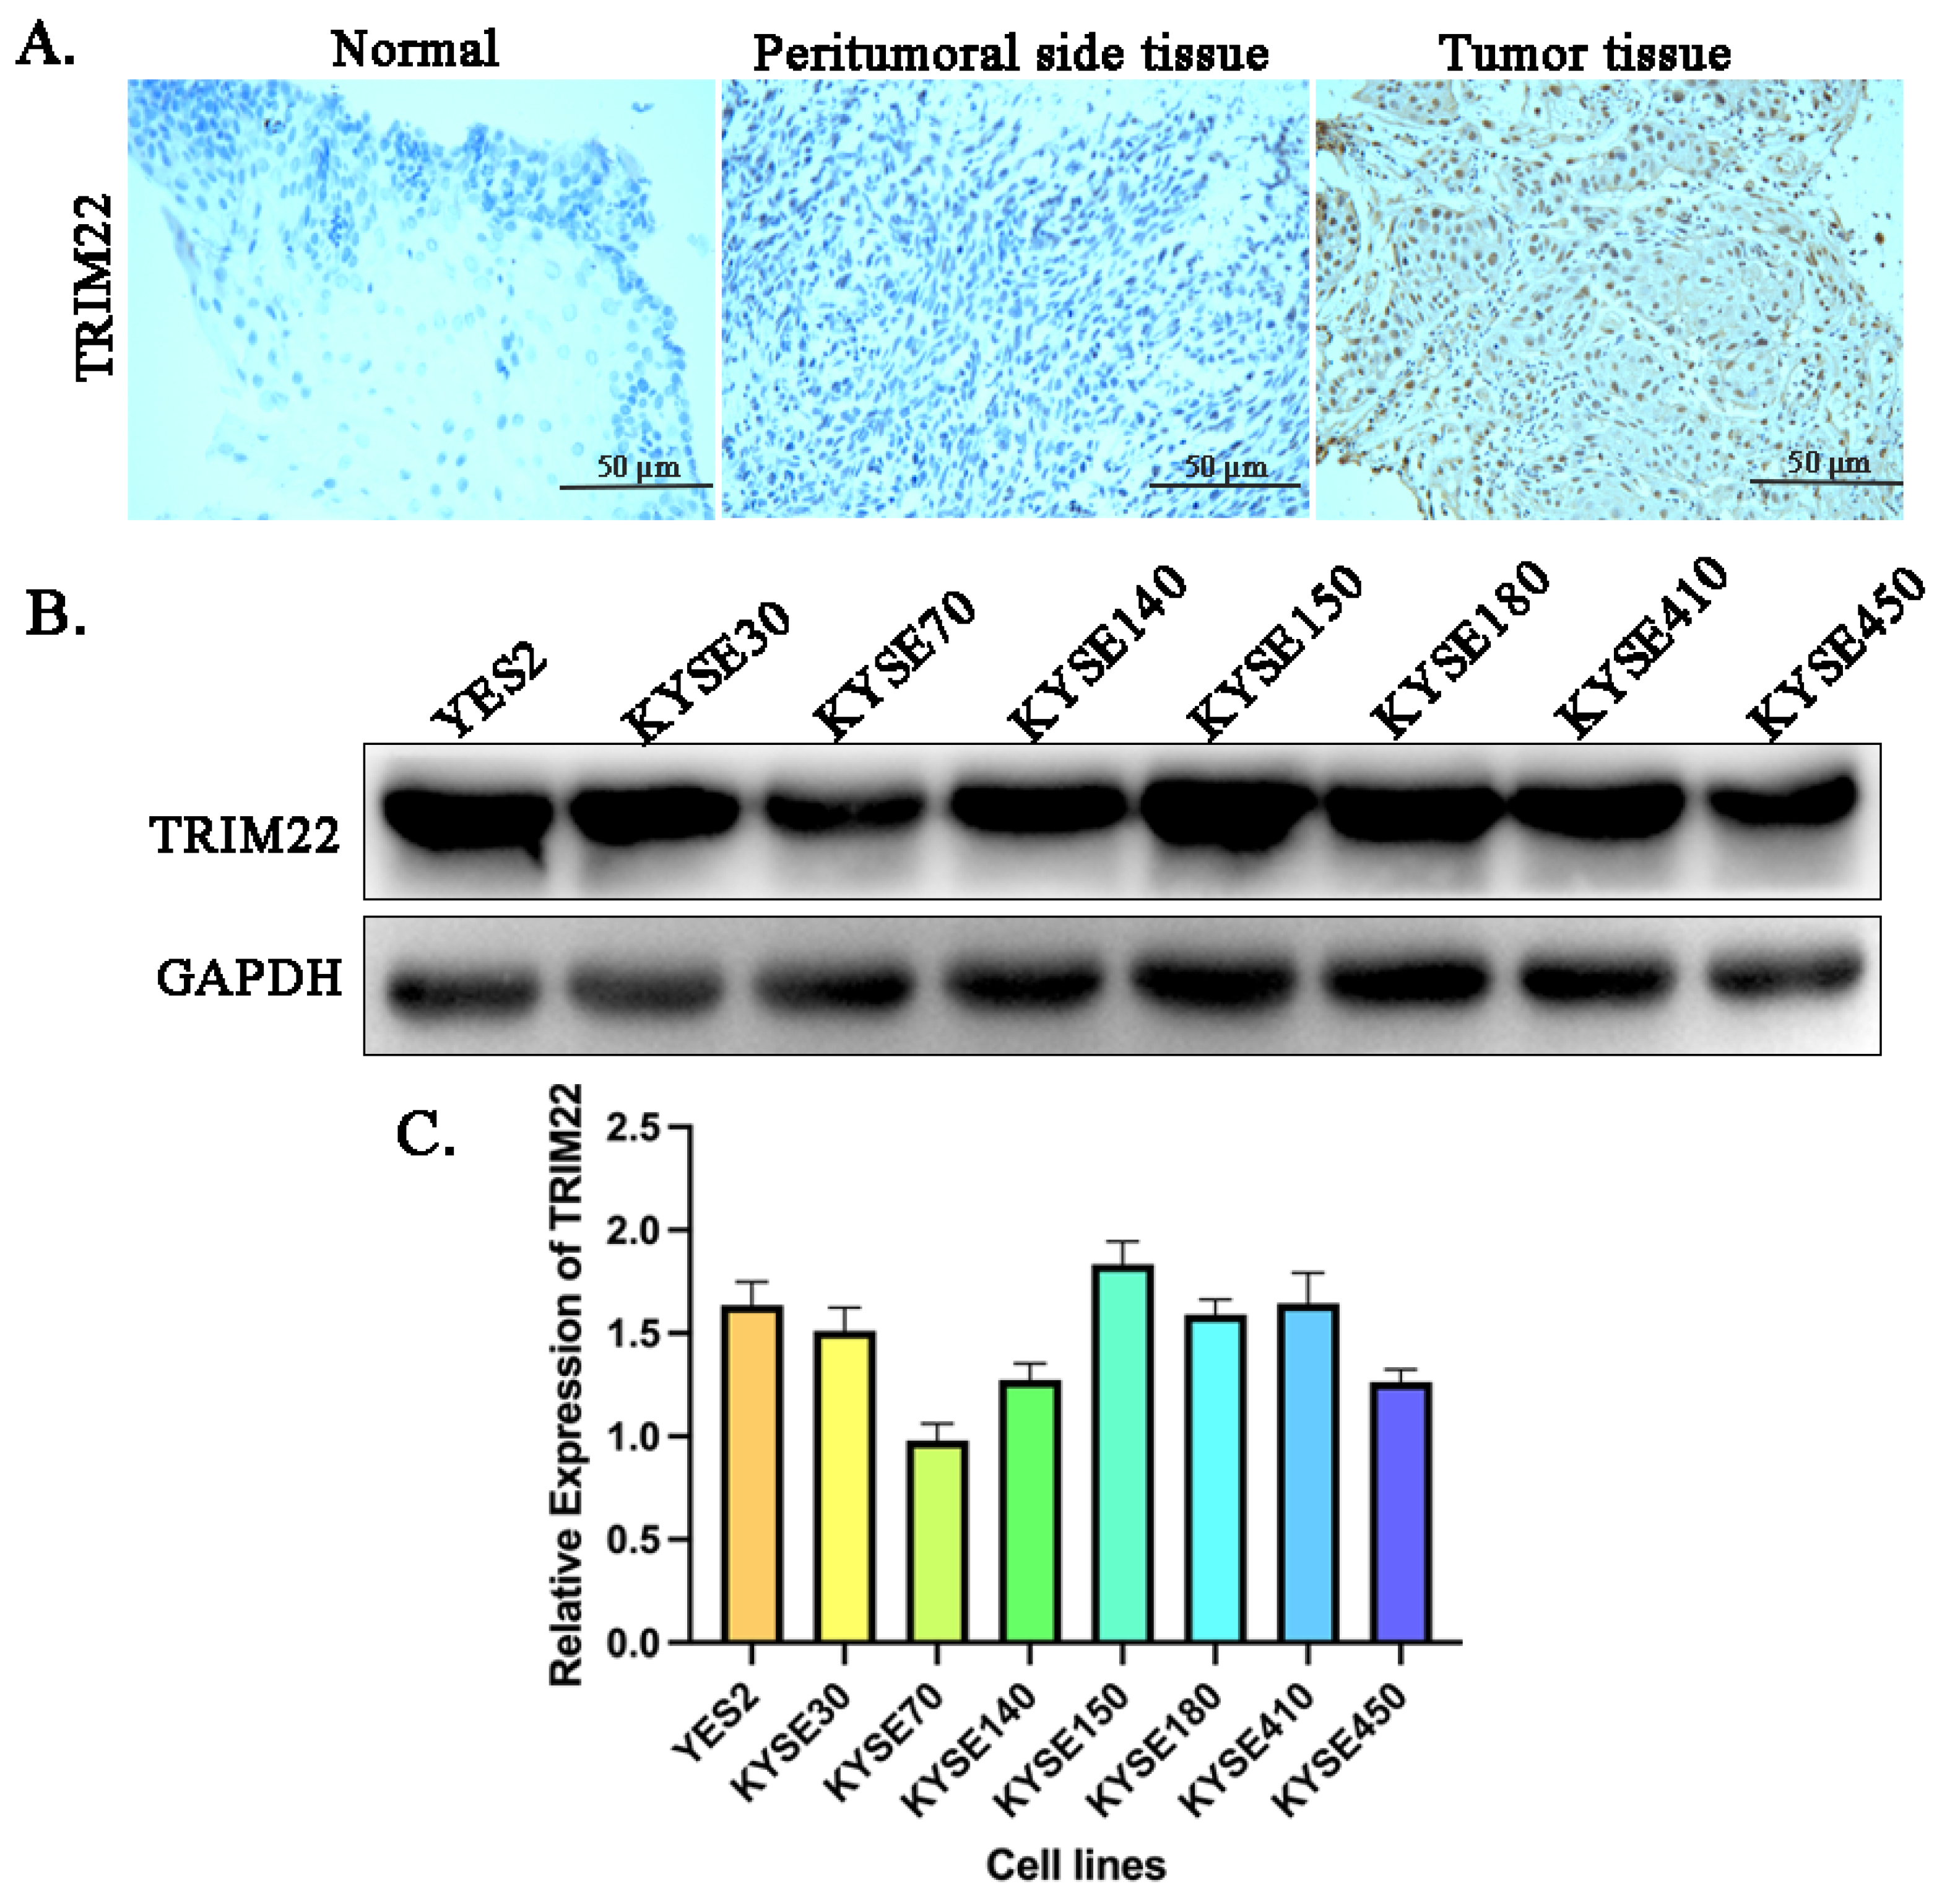
Figure 2.
Effect of Lyc.HCL on proliferation of human esophageal squamous cell carcinoma cell lines (ESCC). YES2, KYSE30, KYSE70, KYSE140, KYSE150, KYSE180, KYSE410 and KYSE450 cells were treated with the indicated concentrations of Lyc.HCL for 24h, 48h and 72 h, cell viability was assessed using MTS assay. IC50 values were calculated using the GraphPad Prism 5.0 software. Data are presented as mean±SD.
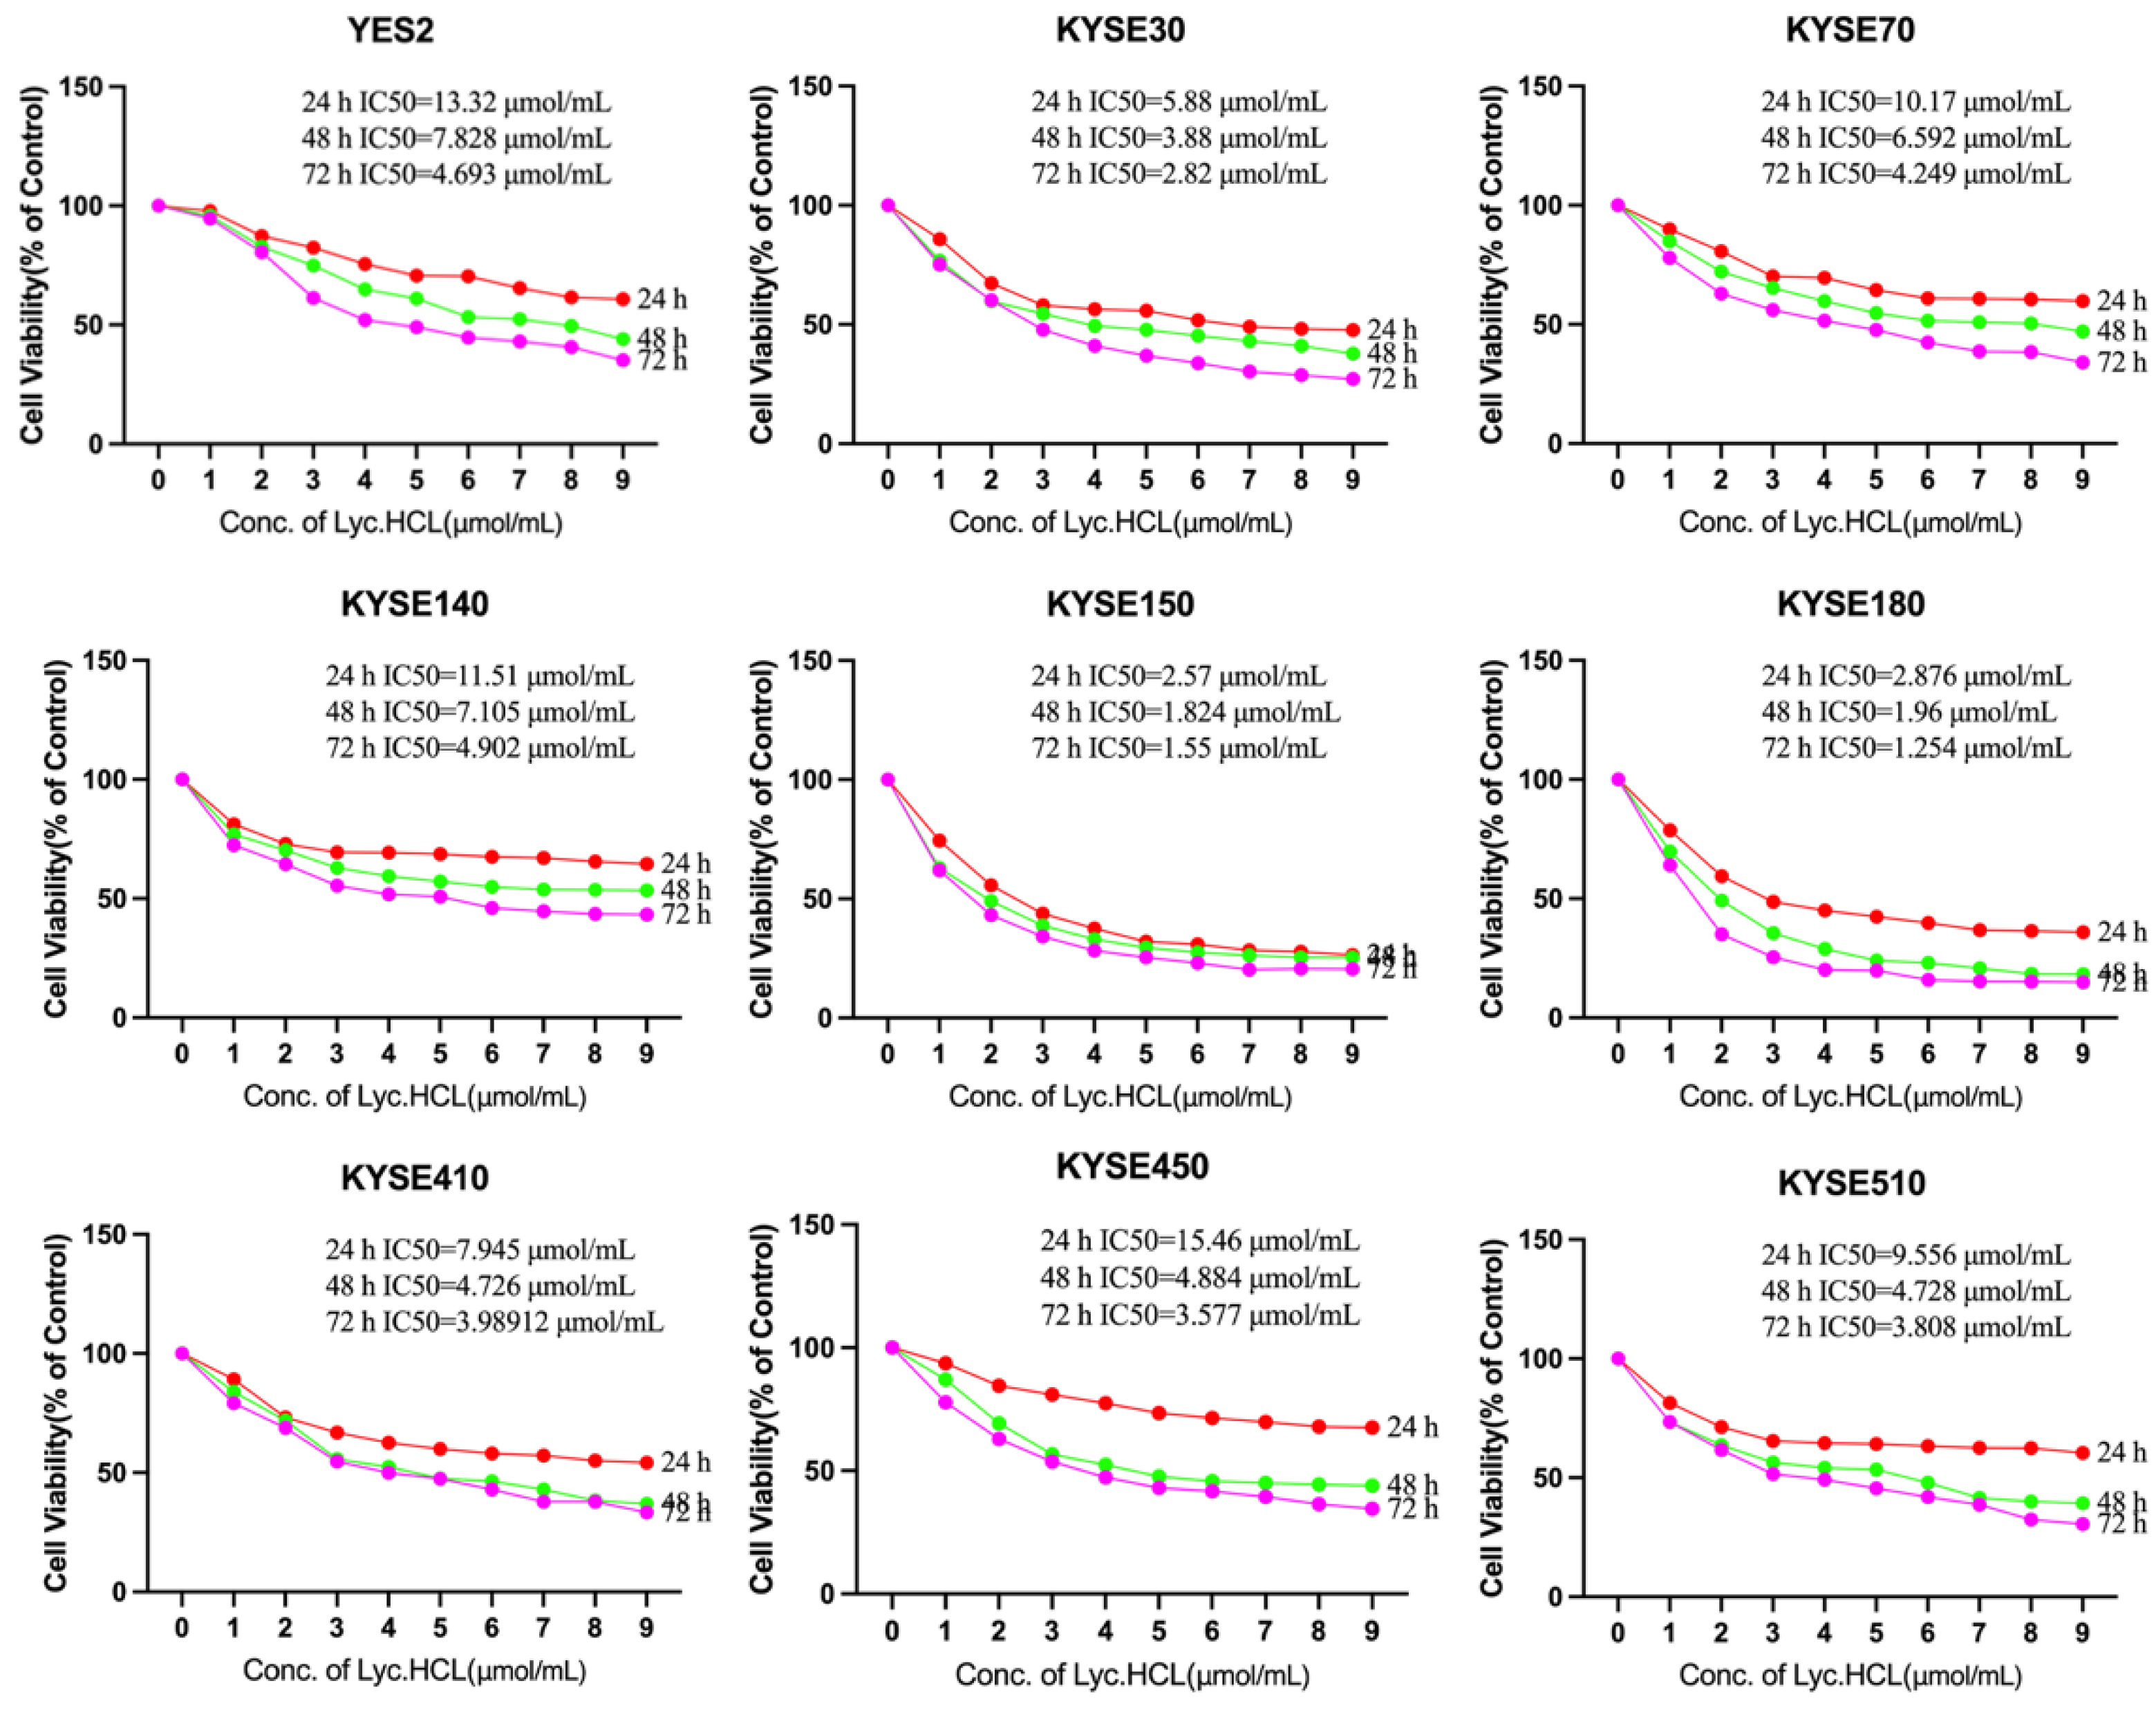
Figure 3.
Effect of Lyc.HCL on cell colony formation, cell cycle and apoptosis of ESCC cells. (A) Results of colony formation assays for YES2 and KYSE150 cells. ESCC cells were treated with the indicated concentrations of Lyc.HCL for 14 days. (B) The quantification of the cell colonies in (A) is presented as the mean percentage of viable cells (mean±SD), averaged from 3 independent experiments, each with 3 replicates per condition.(C) YES2 and KYSE150 cells were treated with vehicle, 2, 4, and 6µmol/mL of Lyc.HCL for 48 h, and then stained with PI and subjected by FACS. (D and E) cell cycle was analyzed by Mod Fit 5.0. All data are presented as the mean±SD. A 1-way analysis of variance, followed by a Tukey’s post-hoc test, was used to compare the different groups. *P<.05, **P<.01, ***P<.001 versus vehicle. (F) YES2 and KYSE150 cells were treated with vehicle, 2, 4, and 6 µmol/mL of Lyc.HCL for 48 h. Flow cytometry analyzed apoptotic cells stained by Annexin V and PI. (G) data are presented as the mean±SD. A 1-way analysis of variance, followed by a Tukey’s post-hoc test, was used to compare the different groups. *P<.05, **P<.01, ***P<.001 versus vehicle.
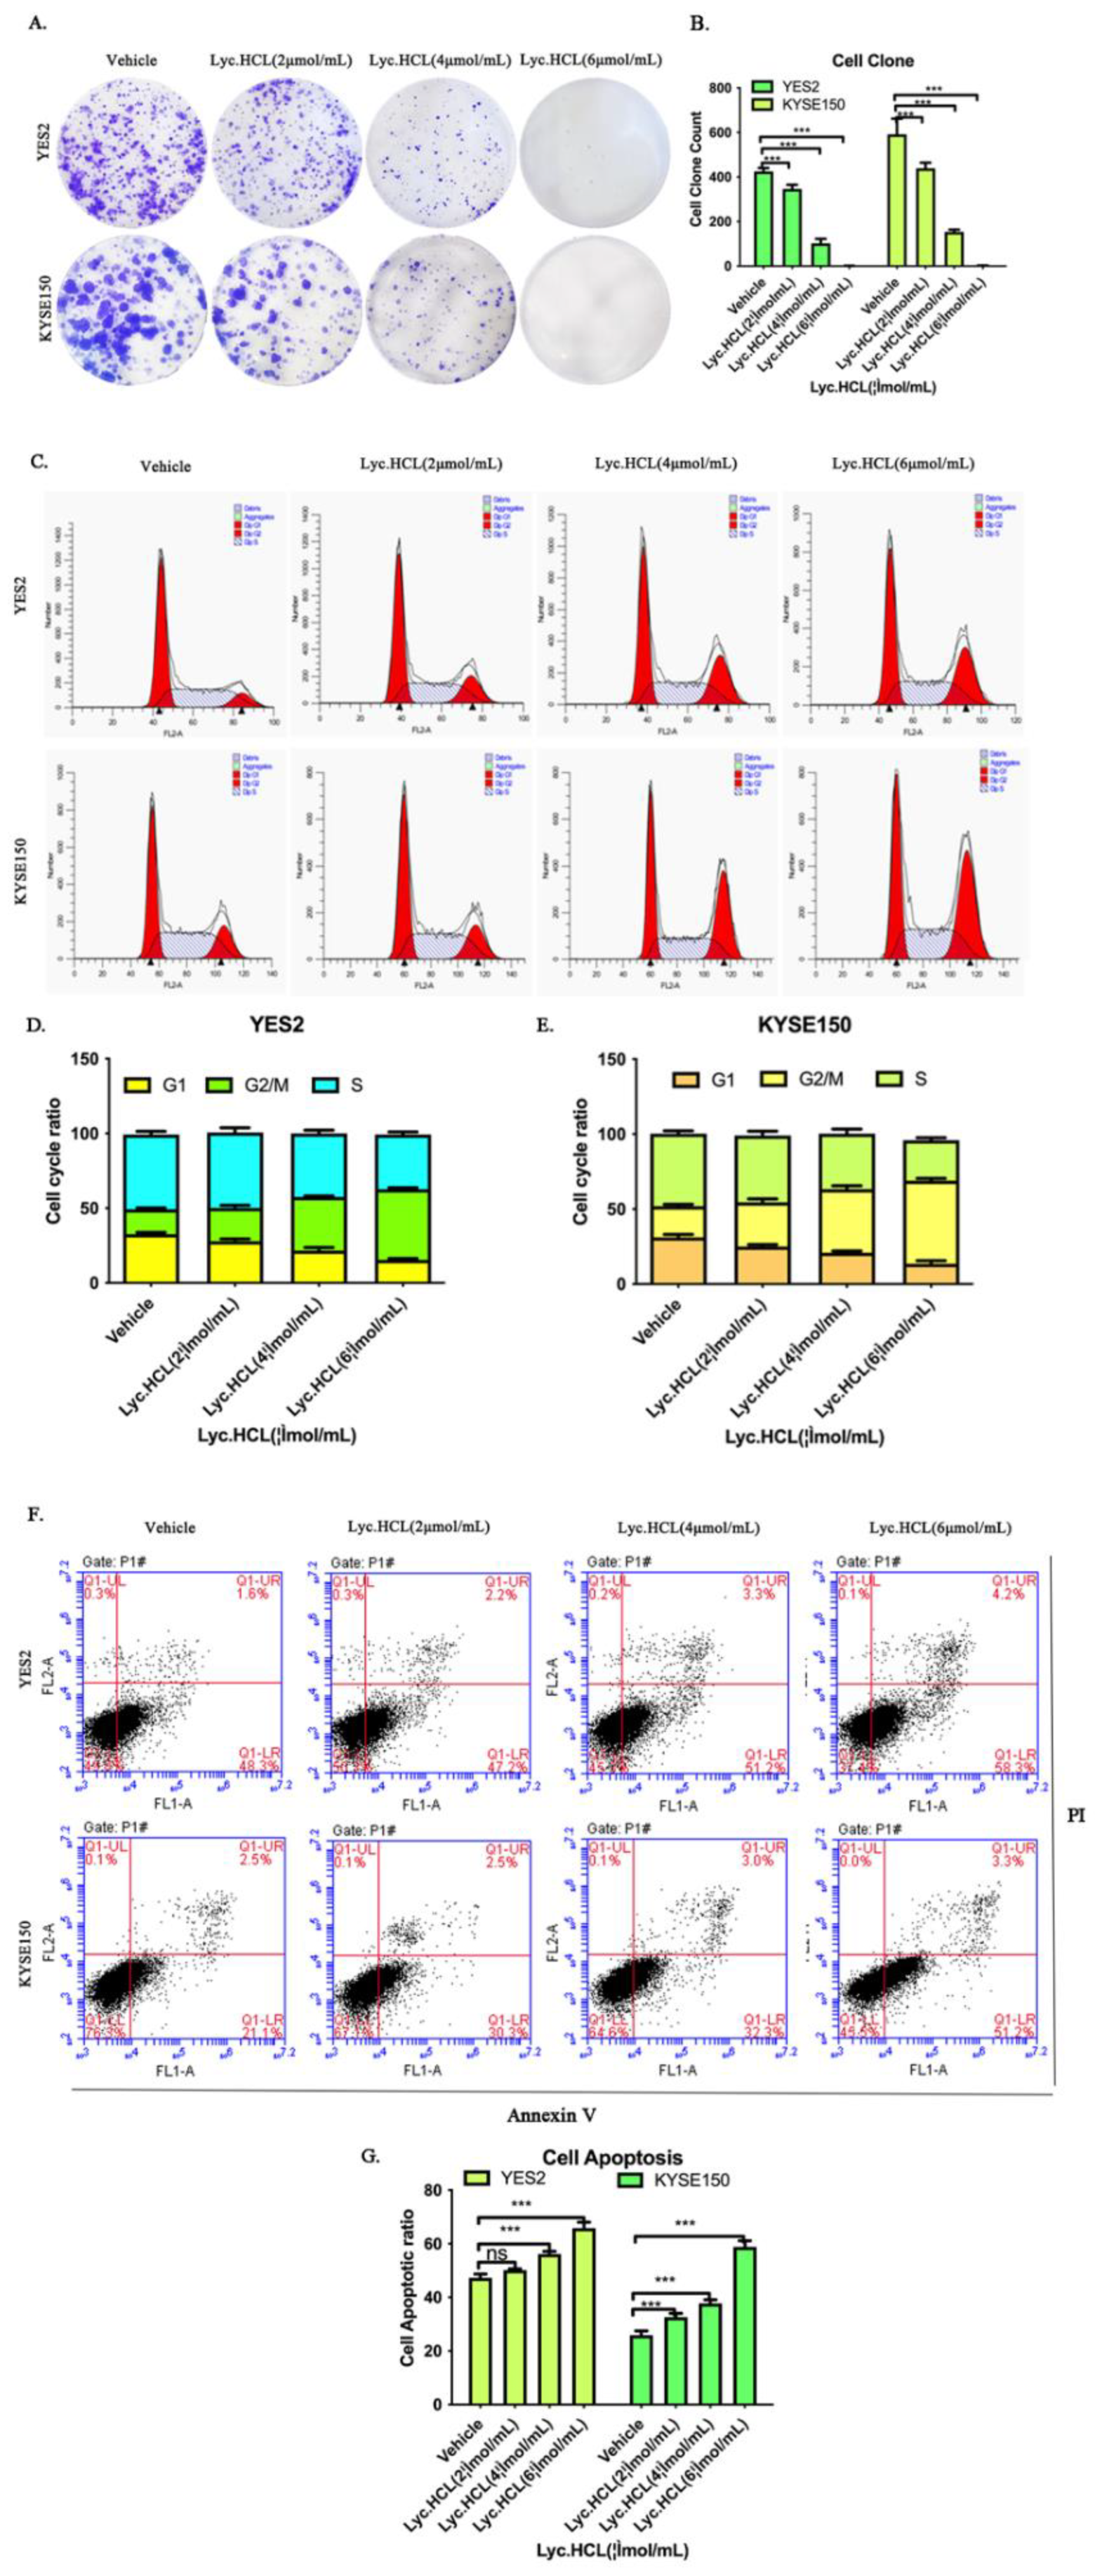
Figure 4.
Lyc.HCL inhibited migration and invasion in YES2 and KYSE150 cells. (A and C) YES2 and KYSE150 cells were treated with vehicle, 2, 4, and 6 µmol/mL of Lyc.HCL for 48 h. Cell migration was evaluated by the wound healing assay. Scale bar, 200µm. (B and D) Gap Width data were presented as the mean±SD. A 1-way analysis of variance, followed by a Tukey’s post-hoc test, was used to compare the different groups. *P<.05, **P<.01, ***P<.001 versus vehicle. (E) YES2 and KYSE150 cells, pretreated with vehicle, 2, 4, and 6µmol/mL of Lyc.HCL for 12 h, were plated onto the apical side of filters in serum free medium containing either vehicle or Lyc.HCL, medium containing 20% FBS was placed in the basolateral chamber to act as a chemoattractant for 24h. Cells on the bottom of the filter were stained by 0.5% crystal violet and then counted. (F) Quantification of the migrated cells in (E) was displayed on the right. The results were displayed as the mean±SD. A 1-way analysis of variance, followed by a Tukey’s post-hoc test, was used to compare the different groups. *P<.05, **P<.01, ***P<.001 versus vehicle. (G) Before experiment, transwell chamber was covered with matrix glue. YES2 and KYSE150 cells, pretreated with vehicle, 2, 4, and 6µmol/mL of Lyc.HCL for 12h, were plated onto the apical side of filters in serum free medium containing either vehicle or Lyc.HCL, medium containing 20% FBS was placed in the basolateral chamber to act as a chemoattractant for 24hours. Cells on the bottom of the filter were stained by 0.5% crystal violet and then counted. (H) Quantification of the invasive cells in (G) was displayed on the right. The results were displayed as the mean±SD. A 1-way analysis of variance, followed by a Tukey’s post-hoc test, was used to compare the different groups. *P<.05, **P<.01, ***P<.001 versus vehicle.
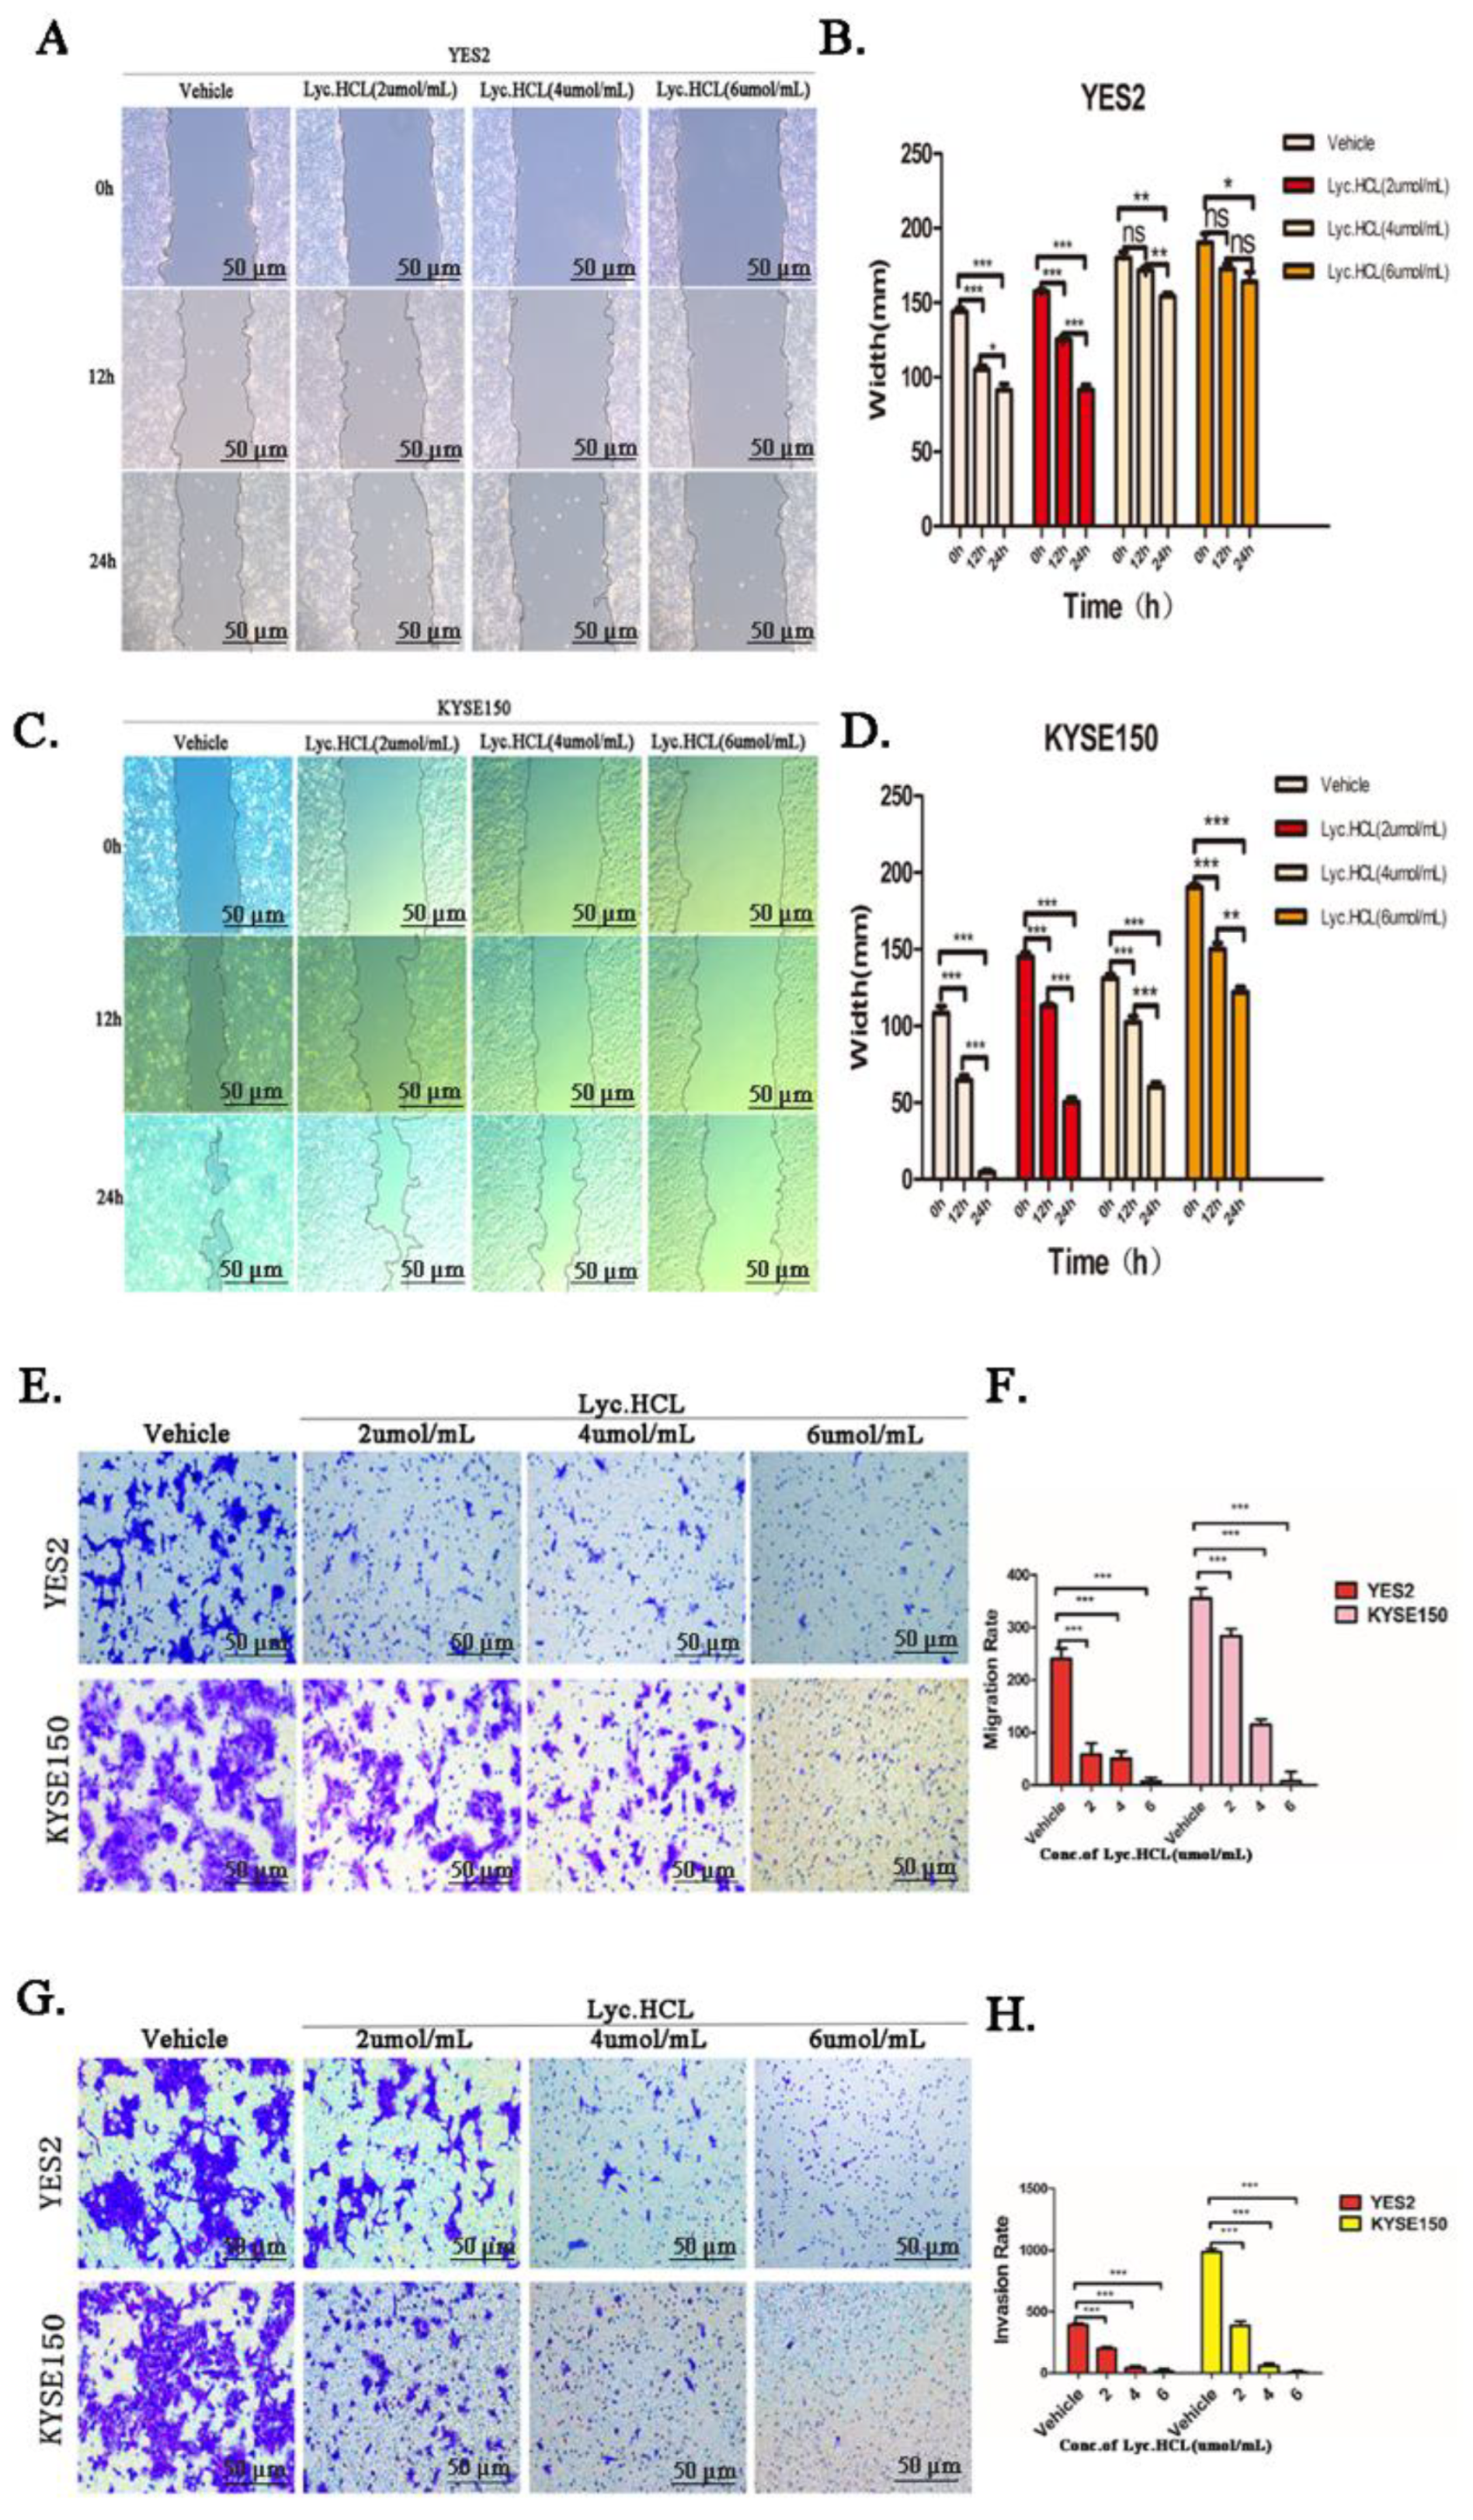
Figure 5.
TRIM22 was inhibited in YES2 and KYSE150 treated by Lyc.HCL. (A)Western blotting analysis of TRIM22 was performed when YES2 and KYSE150 were treated with vehicle, 2, 4, and 6µmol/mL of Lyc.HCL for 48h. (B) Both YES2 and KYSE150 cells were transfected with TRIM22, constructing over-expressing TRIM22 YES2 and KYSE150 cells. Treatment with Lyc.HCL reduced both the over-expression levels of TRIM22 in YES2TRIM22 and KYSE150TRIM22 cells. (C) The quantification of relative expression of TRIM22 in YES2 and KYSE150 cell by Image J. (D) The quantification of relative expression of TRIM22 in YES2TRIM22 and KYSE150TRIM22 by Image J.
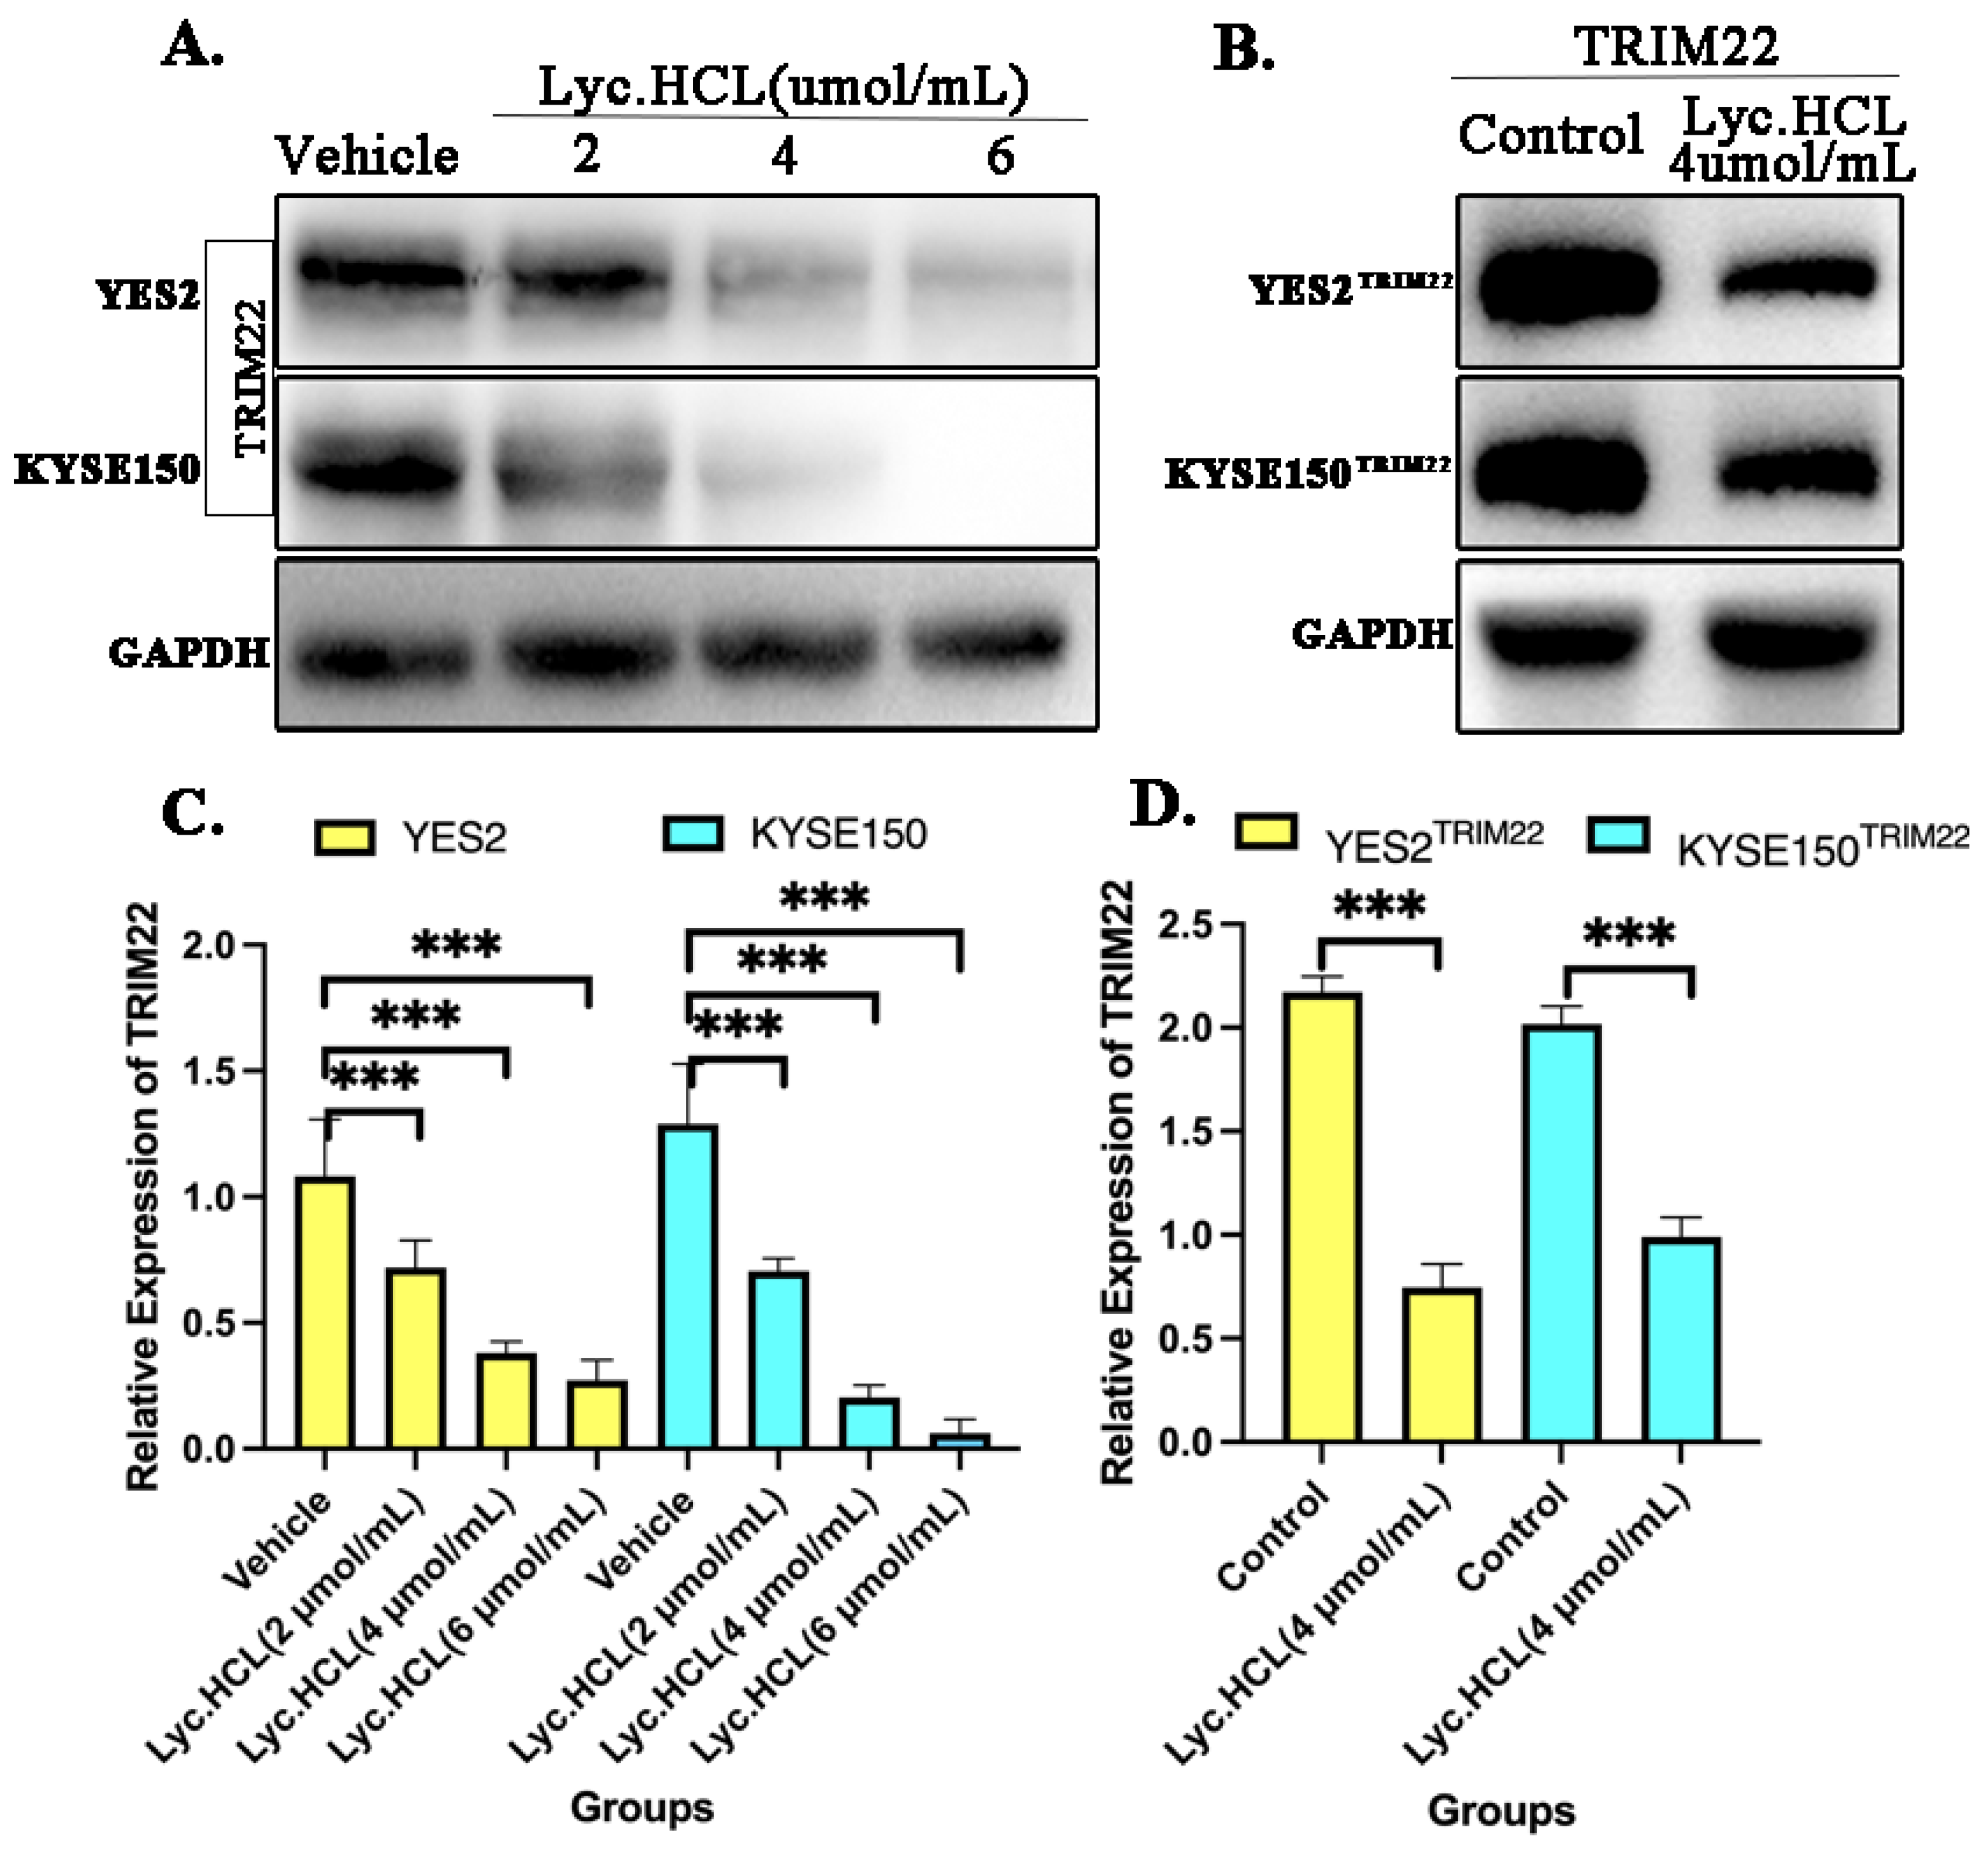
Figure 6.
By regulating cell cycle, over-expression of TRIM22 alleviates the inhibition of cell growth induced by Lyc.HCL, while knockout of TRIM22 promotes the inhibition of cell proliferation mediated by Lyc.HCL. (A and C) Representative images showed that TRIM22 alleviates Lyc.HCL-induced cell colony formation inhibition; shTRIM22 promoted Lyc.HCL-induced cell colony formation inhibition. (B and D) The quantification of the cell colonies in (A and C) is presented as the mean percentage of viable cells (mean±SD), averaged from 3 independent experiments, each with 3 replicates per condition. (E and F) Cell cycle assay showed that TRIM22 reduces Lyc.HCL-induced cell cycle arrest while shTRIM22 increased Lyc.HCL-induced cell cycle arrest. (G and H) cell cycle was analyzed by FlowJo 10.9.0. All data are presented as the mean±SD. A 1-way analysis of variance, followed by a Tukey’s post-hoc test, was used to compare the different groups. *P<.05, **P<.01, ***P<.001 versus vehicle.
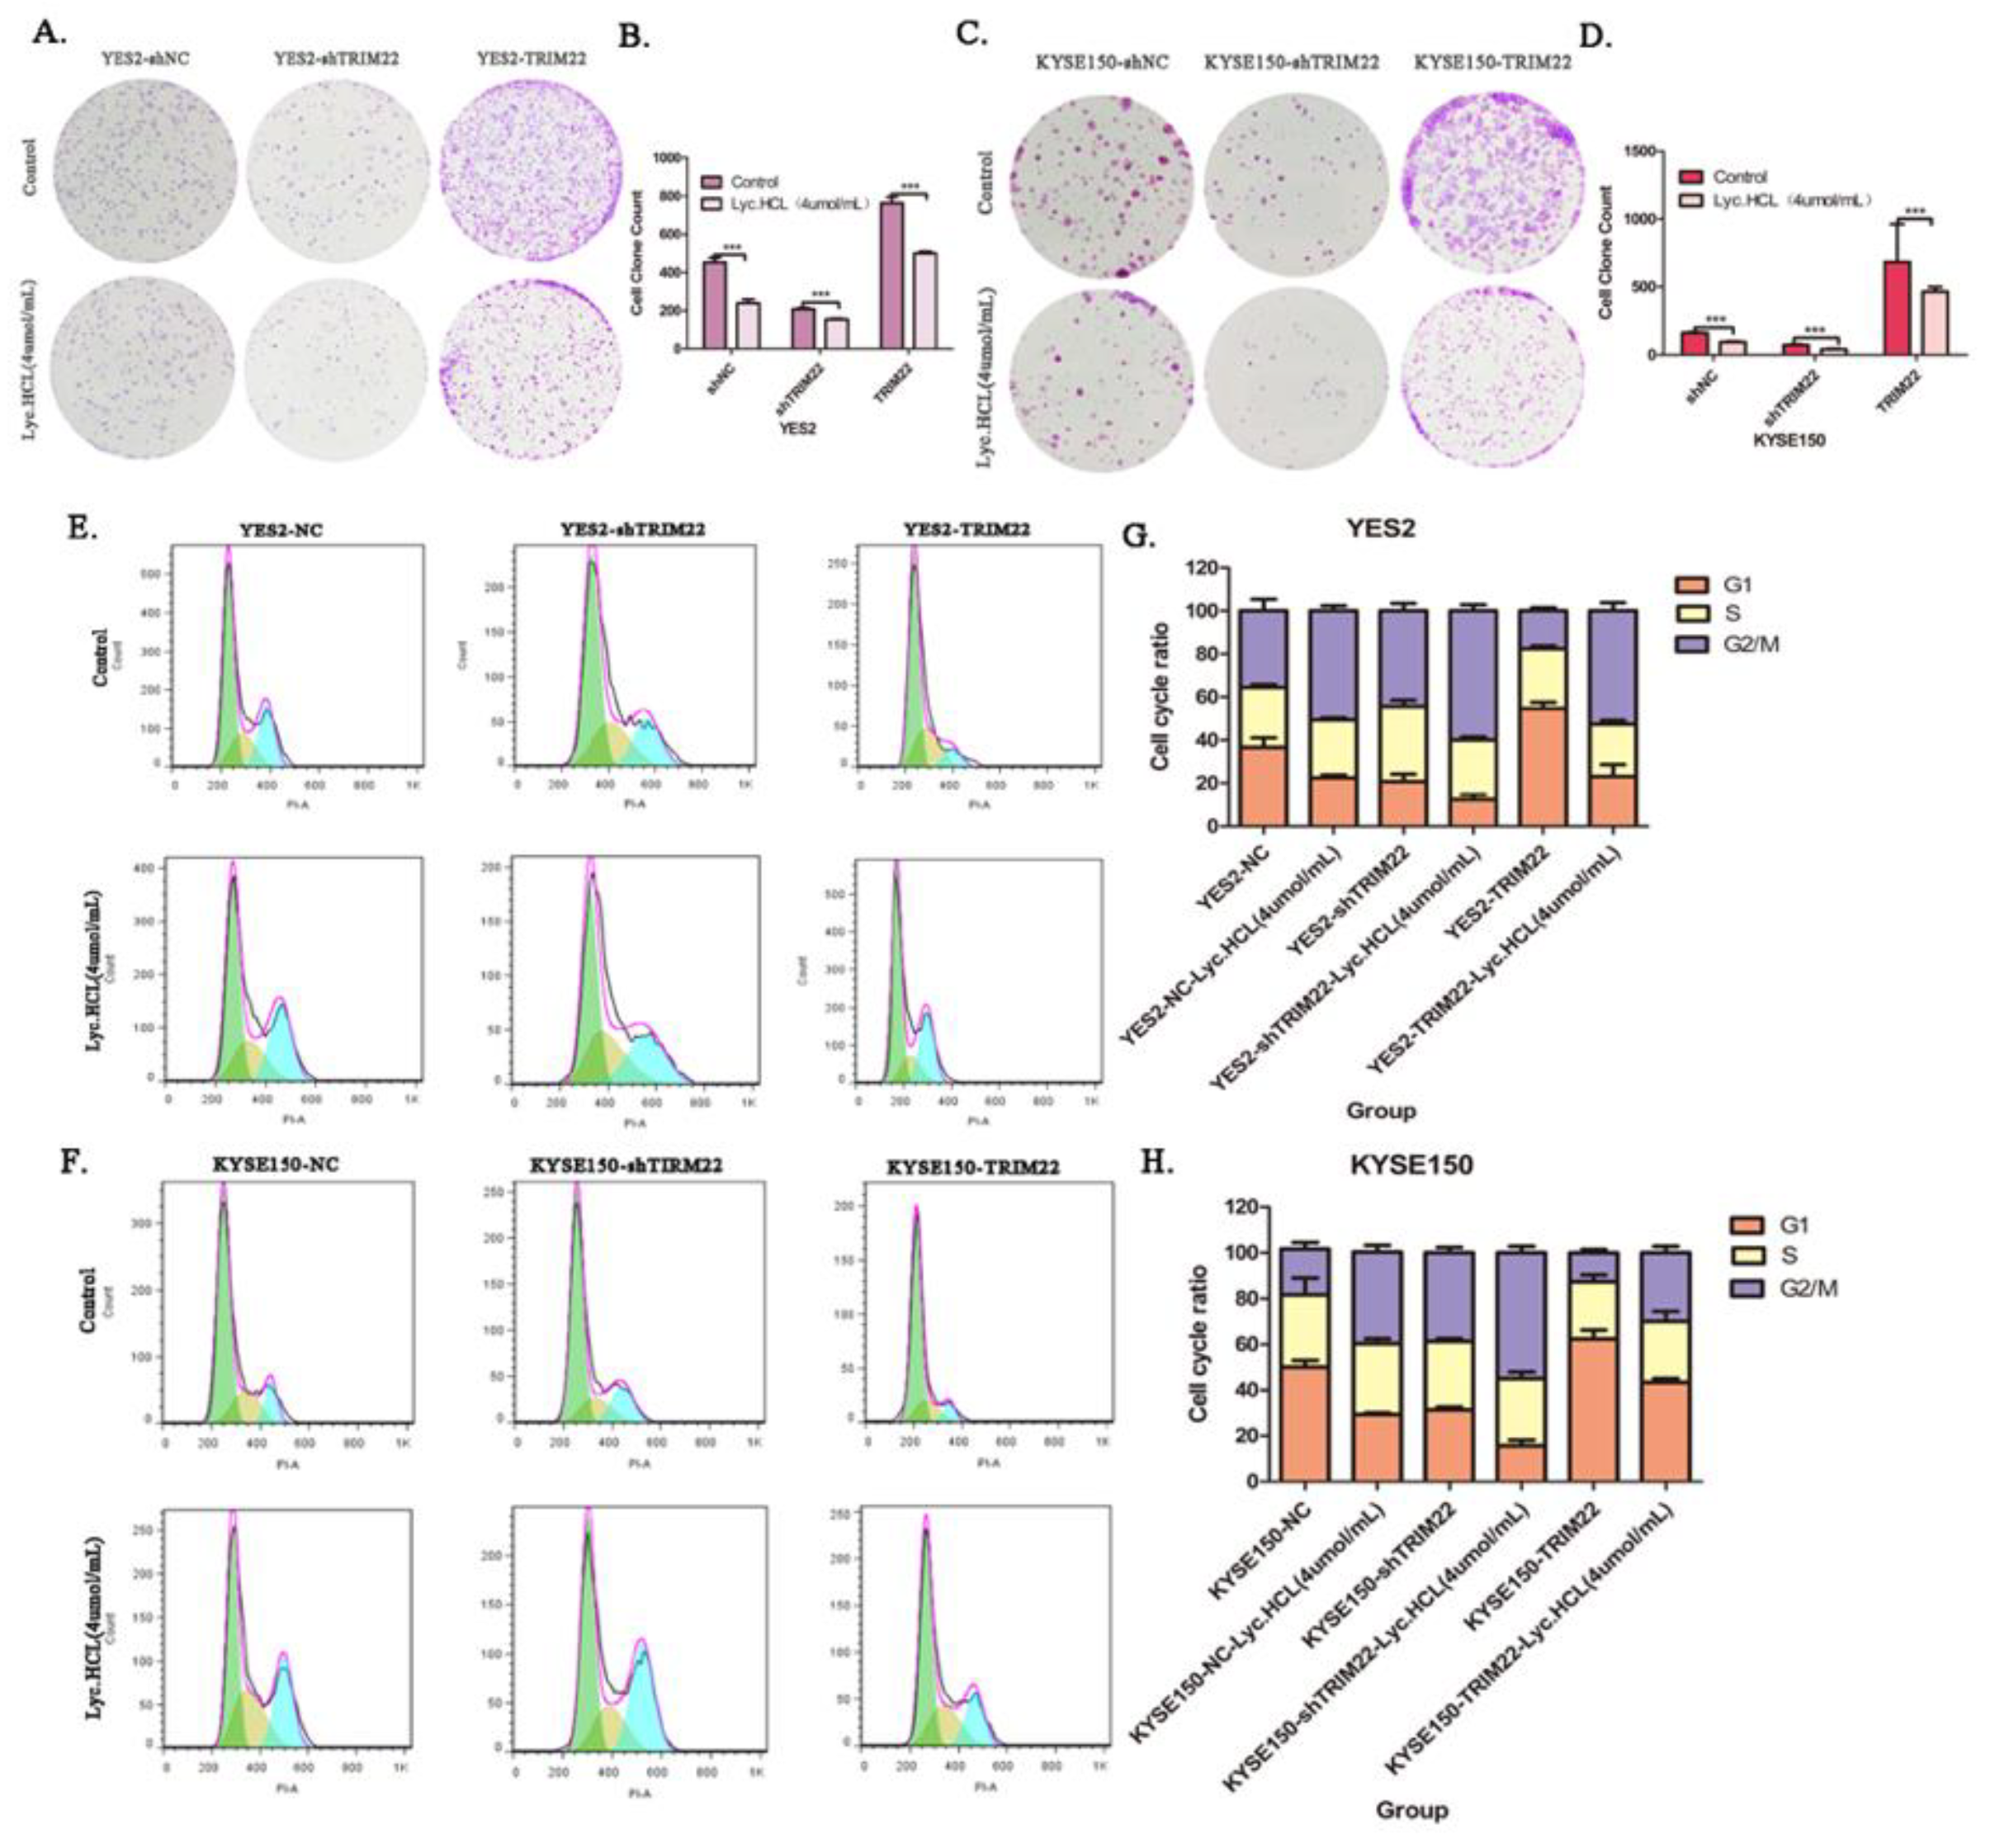
Figure 7.
Over-expression of TRIM22 promotes cell migration and invasion while shTRIM22 reduces cell migration and invasion. (A and C) Wound healing assay was performed to detected cell migration in ESCCTRIM22 cells or ESCCshTRIM22 cells treated with Lyc.HCL. ( B and D) Gap Width data were presented as the mean±SD. A 1-way analysis of variance, followed by a Tukey’s post-hoc test, was used to compare the different groups. *P<.05, **P<.01, ***P<.001 versus vehicle. (E and G) Transwell assay was performed to measure cell migration ability in ESCCTRIM22 and ESCCshTRIM22 cells, the migration ability changes of these cells after being treated with Lyc.HCL. (F and H) Quantification of the migrated cells in (E and G) was displayed on the right. The results were displayed as the mean ± SD. A 1-way analysis of variance, followed by a Tukey’s post-hoc test, was used to compare the different groups. *P<.05, **P<.01, ***P<.001 versus vehicle. (I and K) Before experiment, transwell chamber was covered with matrix glue. Transwell assay was performed to measure the cell invasive ability in ESCCTRIM22 cells, ESCCshTRIM22 cells and the invasion ability changes of these cells after being treated with Lyc.HCL. Cells on the bottom of the filter were stained by 0.5% crystal violet and then counted. (J and L) Quantification of the invasive cells in (I and K) was displayed on the right. The results were displayed as the mean±SD. A 1-way analysis of variance, followed by a Tukey’s post-hoc test, was used to compare the different groups. *P<.05, **P<.01, ***P<.001 versus vehicle.
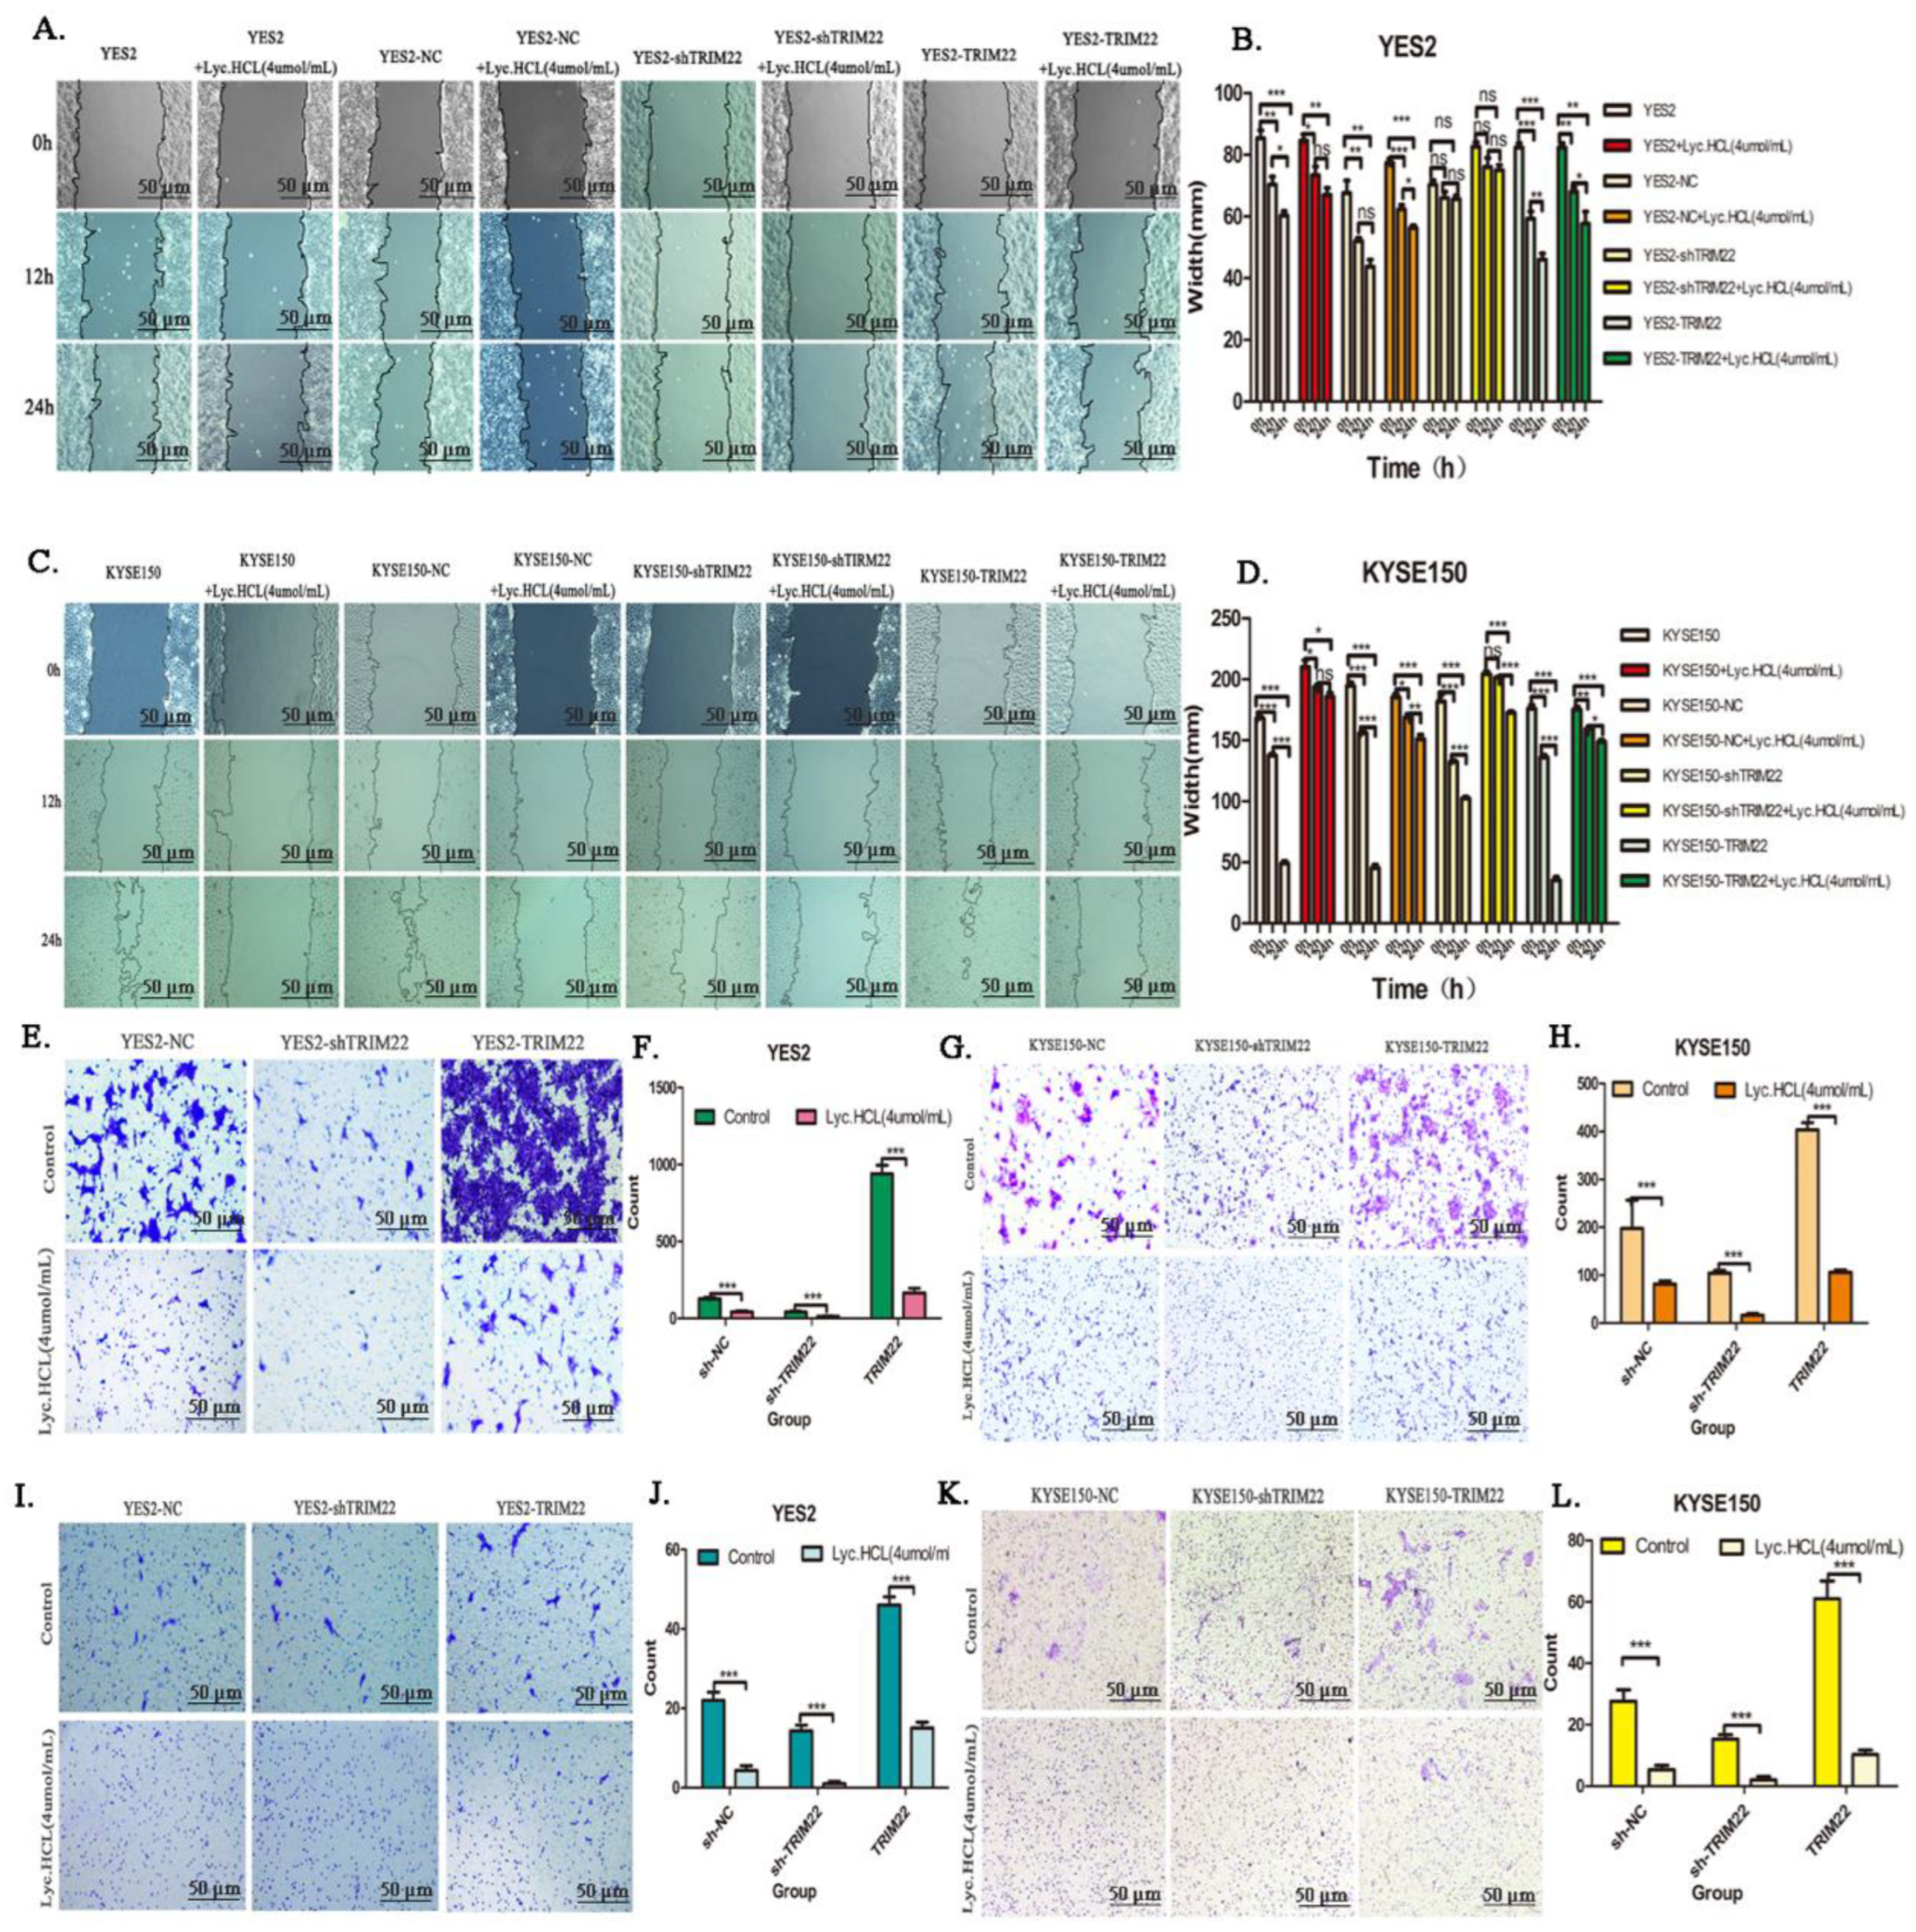
Figure 8.
Lyc.HCL suppressed JAK2/STAT3, PI3K/AKT and MAPK/ERK signaling pathway via down-regulation of TRIM22 in esophageal squamous cell carcinoma cells. The expression of JAK2, STAT3, p-STAT3, PI3K, AKT, p-AKT, Erk, p-Erk, p-MEK were assessed using the corresponding antibodies via Western blotting. The results were repeated with at least three independent experiments. (A) YES2 and KYSE150 were treated with indicated concentrations of Lyc.HCL for 48h, proteins in signal pathway were assessed using western blot. (B and C) Western blotting results showed the expression changes of TRIM22, JAK2, p-STAT3, PI3K, p-AKT, p-MEK in YES2, KYSE150, YES2TRIM22, YES2shTRIM22, KYSE150TRIM22, KYSE150shTRIM22 cells and these cells were treated with Lyc.HCL. Figure 8D, 8E and 8F are quantification of relative expression of proteins in Figure 8A, Figure 8B and Figure 8C by Image J, respectively. .
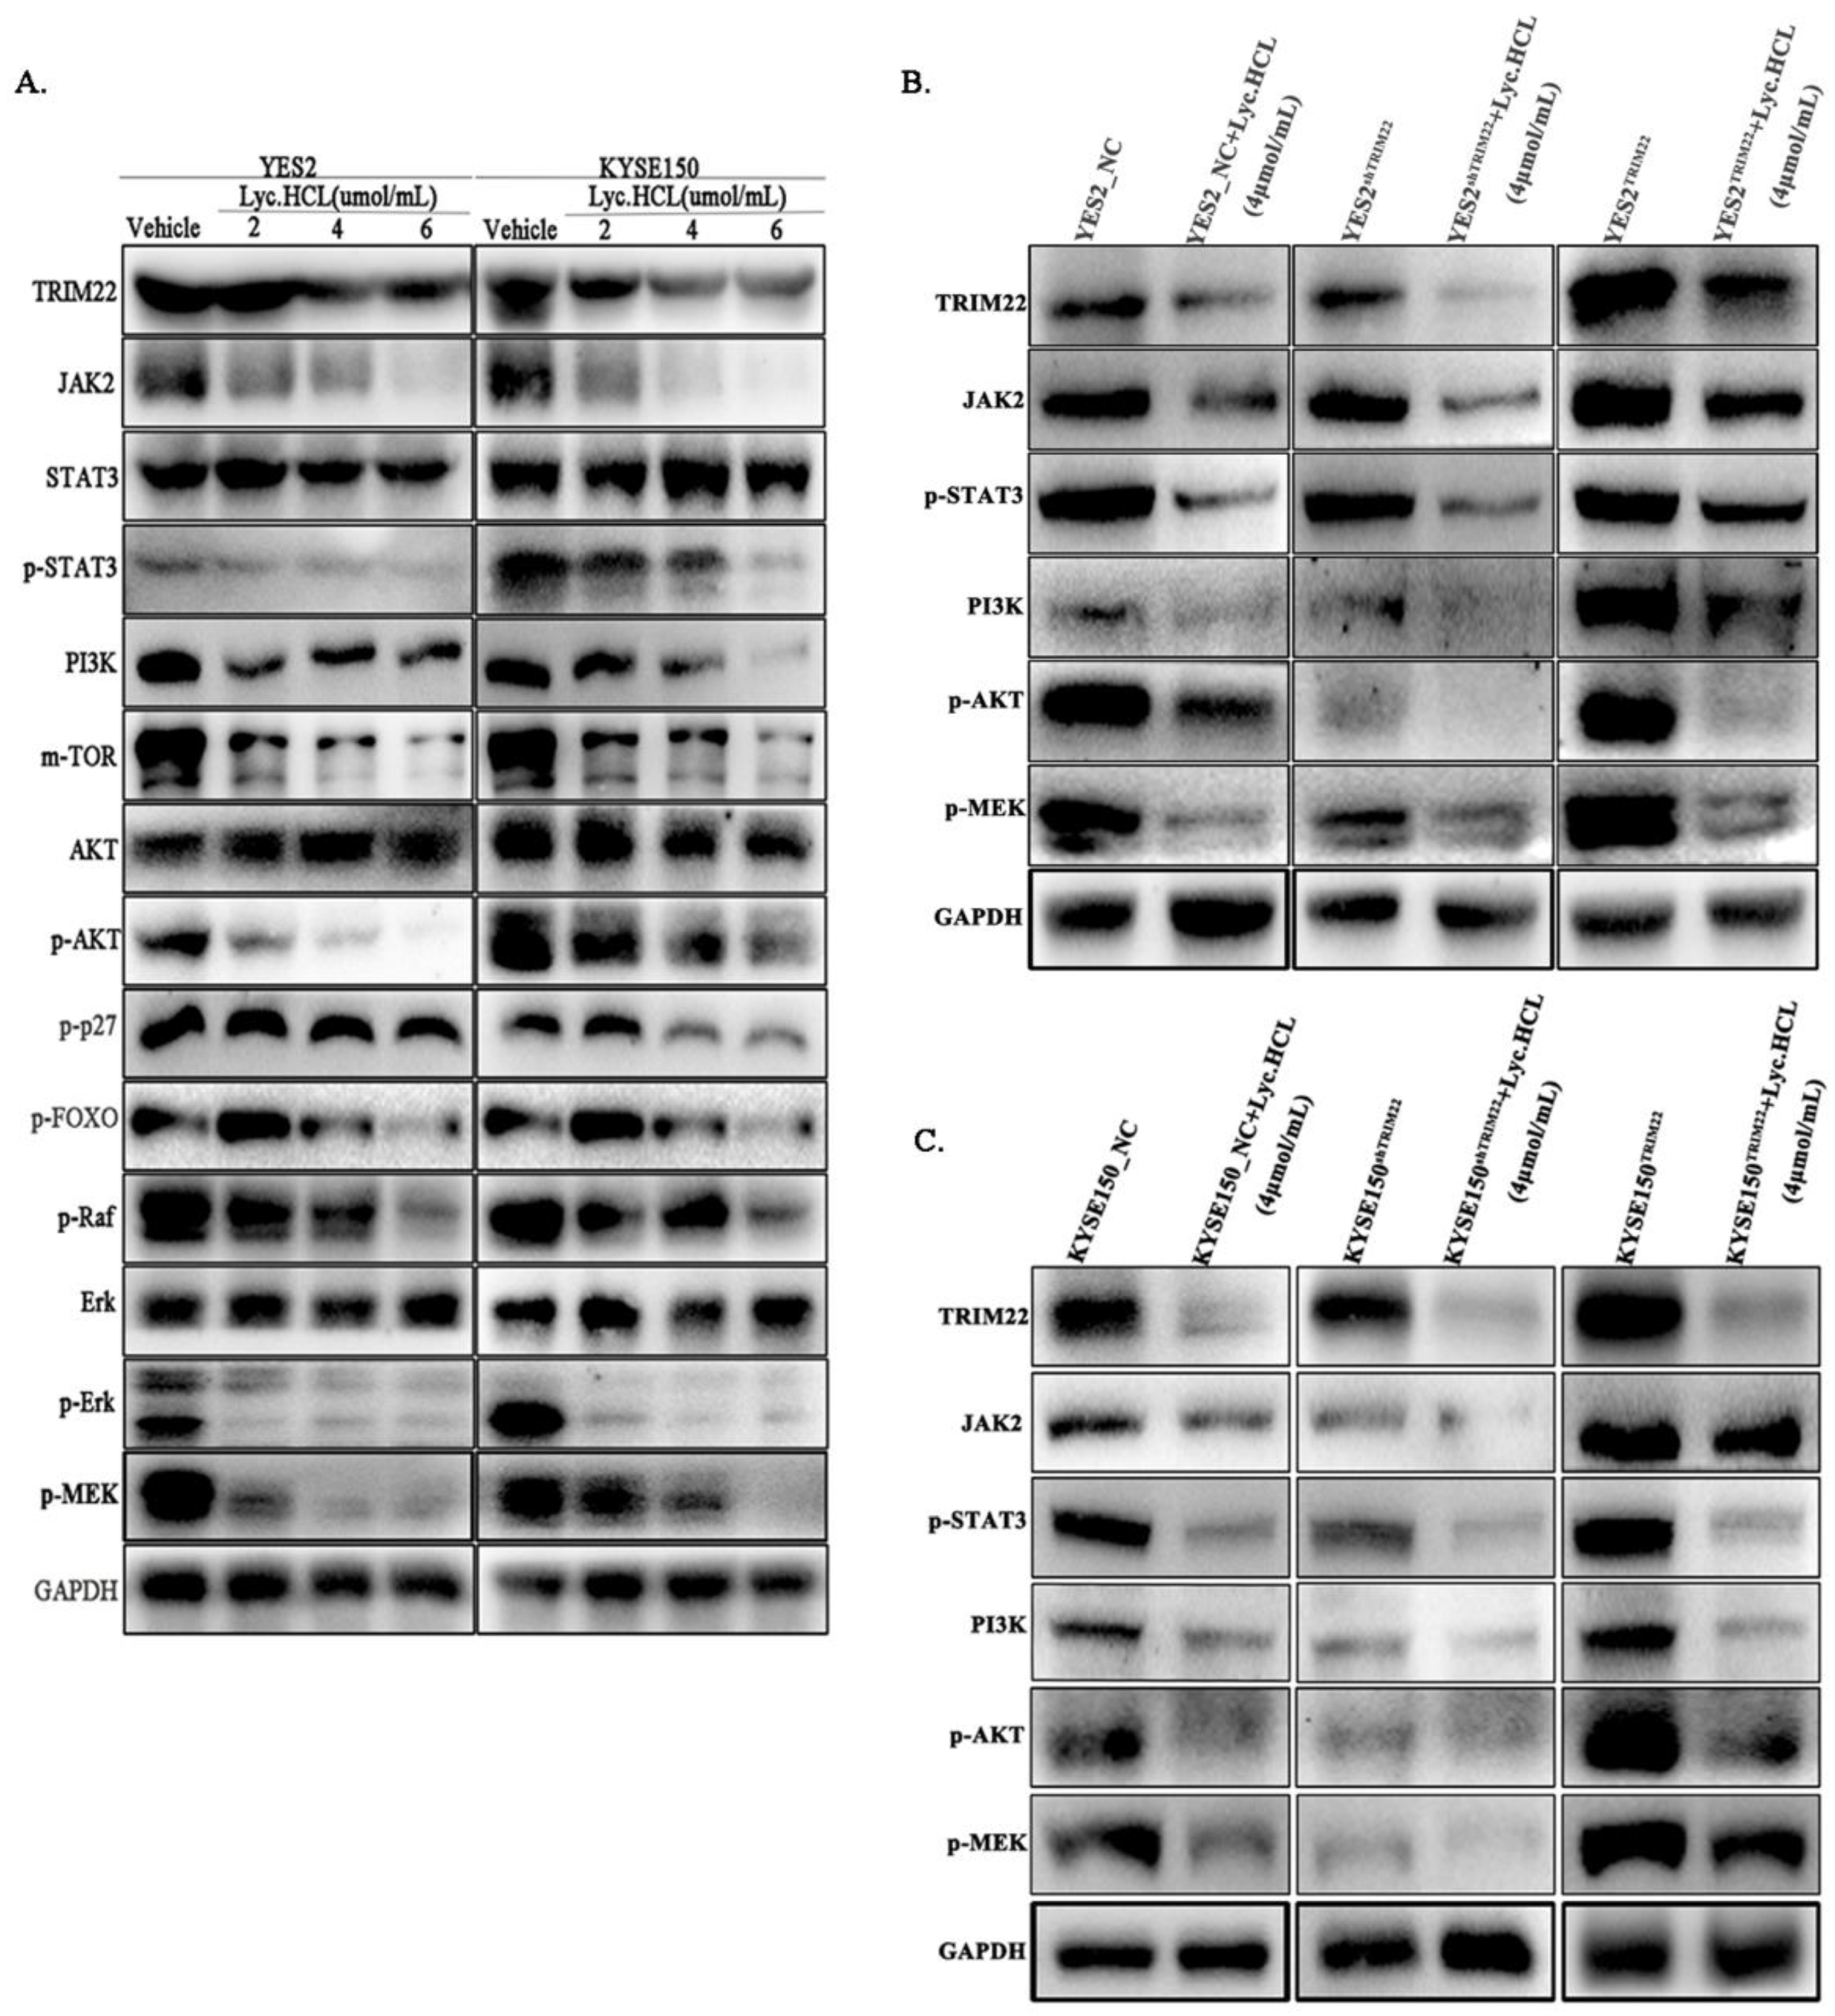
Figure 9.
Schematic diagram of the TRIM22-JAK2/STAT3-PI3K/AKT-MAPK/ERK signal pathway axis.
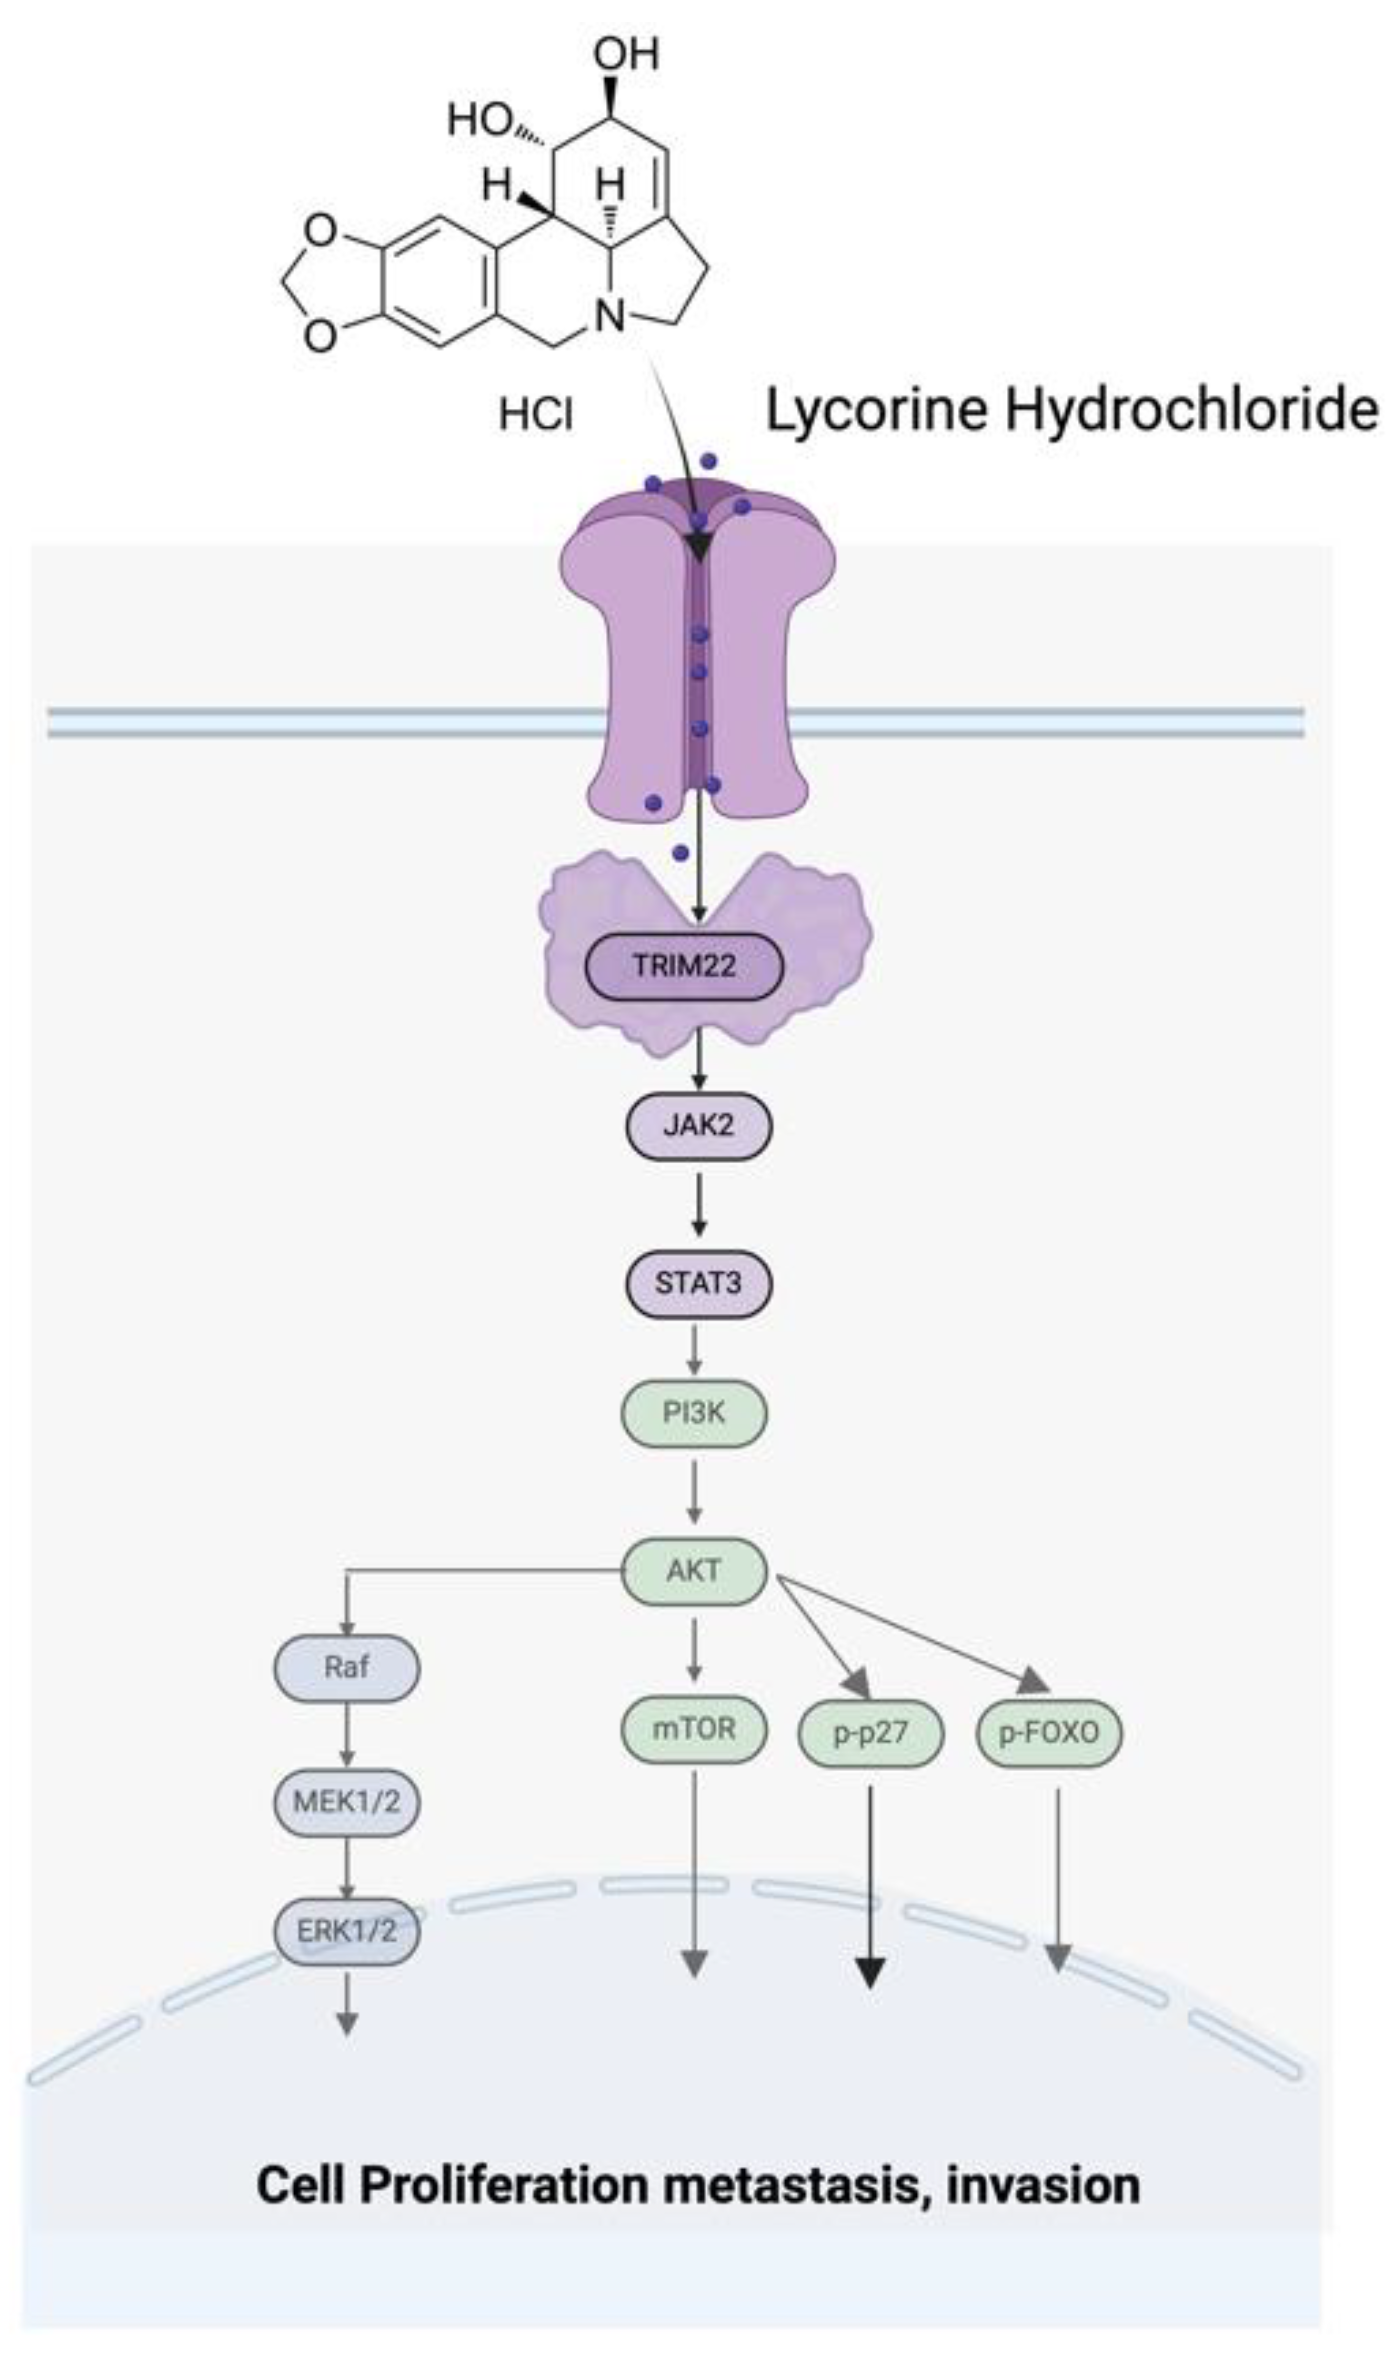
Figure 10.
Over-expression TRIM22 rescues Lyc.HCL-induced tumor inhibition in vivo and knockout TRIM22 promotes Lyc.HCL-induced tumor inhibition in vivo. (A) KYSE150-Control, KYSE150-shTRIM22 and KYSE150-TRIM22 cells were injected subcutaneously into the nude mice. When the average tumor volume achieved a volume of about 100 mm3, the mice were constructed by intra-peritoneal injections of either DMSO or Lyc.HCL (5 mg/kg/twice a day per mouse) or Lyc.HCL (10mg/kg/twice a day per mouse) from day7 to day23. (B)The body weights of the nude mice over the indicated time. (C) In vivo tumor growth was measured by Vernier caliper over the indicated time. (D)Western blot analysis of the TRIM22, JAK2, pSTAT3, PI3K, p-AKT, p-MEK expression levels in the dissected tumor tissues from different groups. (E-K) Quantification of relative expression of proteins in Figure10D.
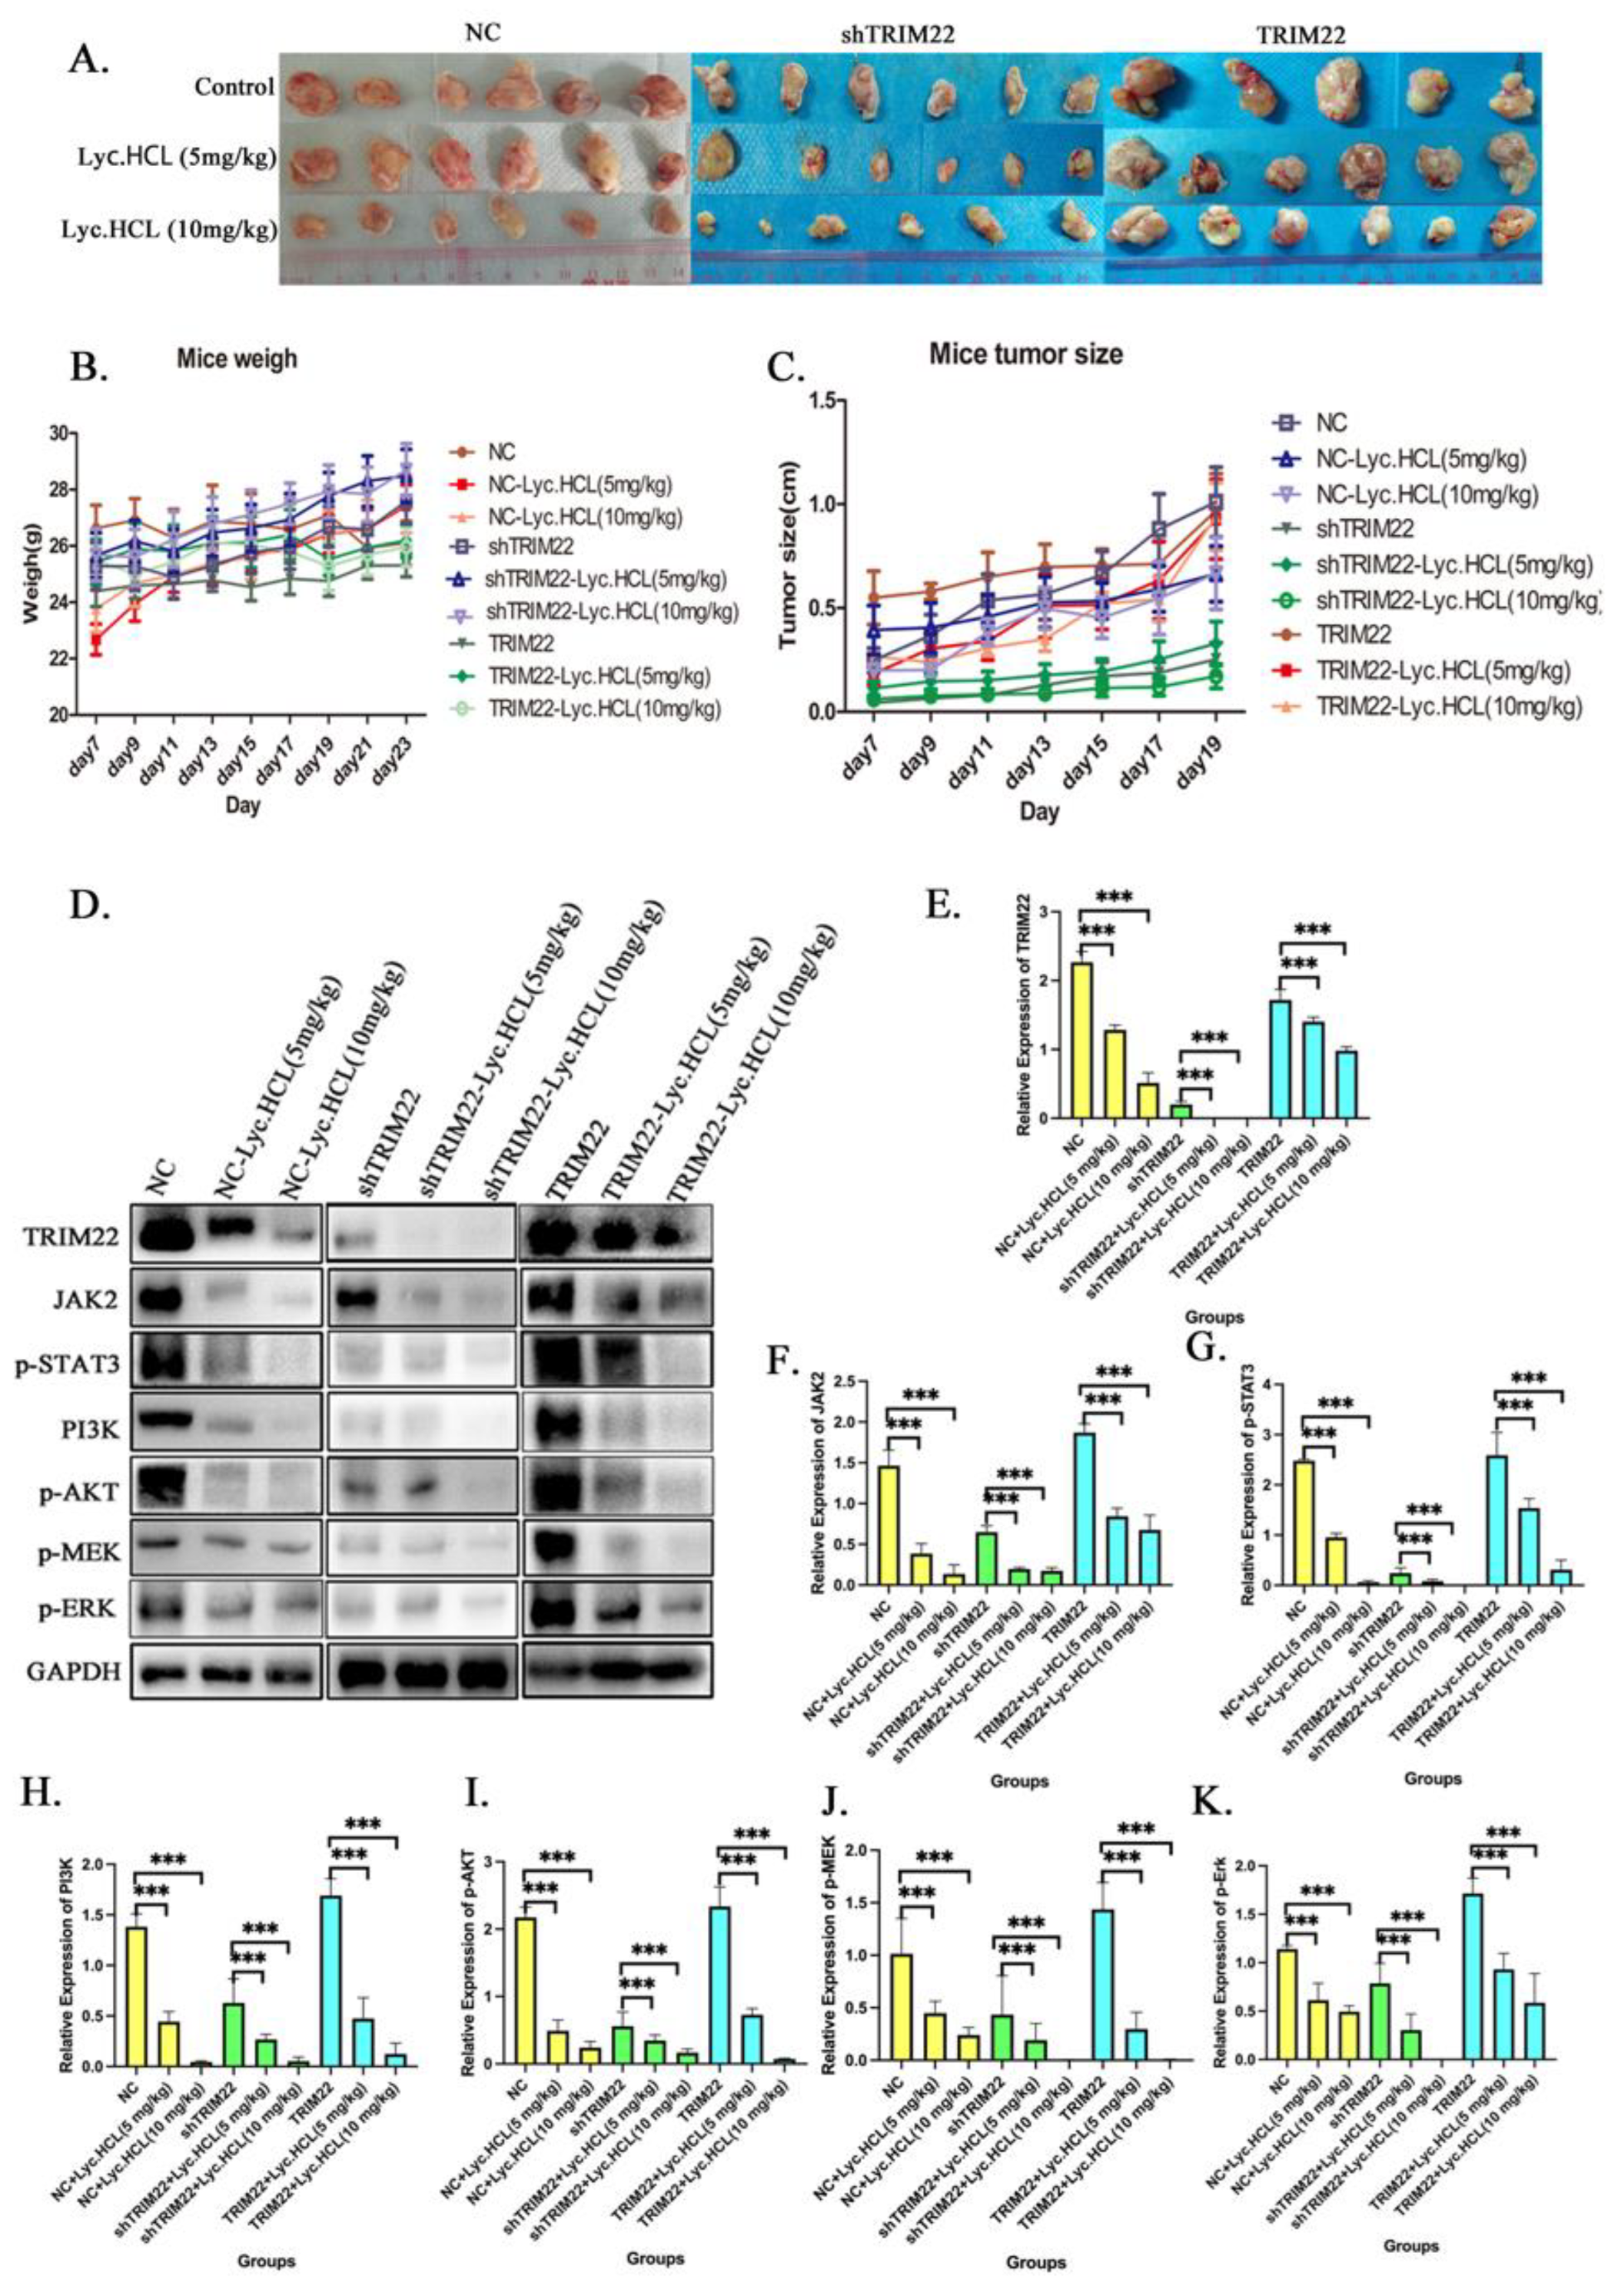
Figure 11.
HE and IHC of tumor tissues from different groups. (A) Representative HE stained of dissected tumor tissues from different groups. Scale bar 50μm. (B) IHC analyzed the expression of TRIM22 of tumors tissues from different groups; Scale bar 50μm. (C) IHC analyzed the expression of JAK2 of tumors tissues from different groups; Scale bar 50μm. (D) IHC analyzed the expression of p-AKT of tumors tissues from different groups; Scale bar 50μm.
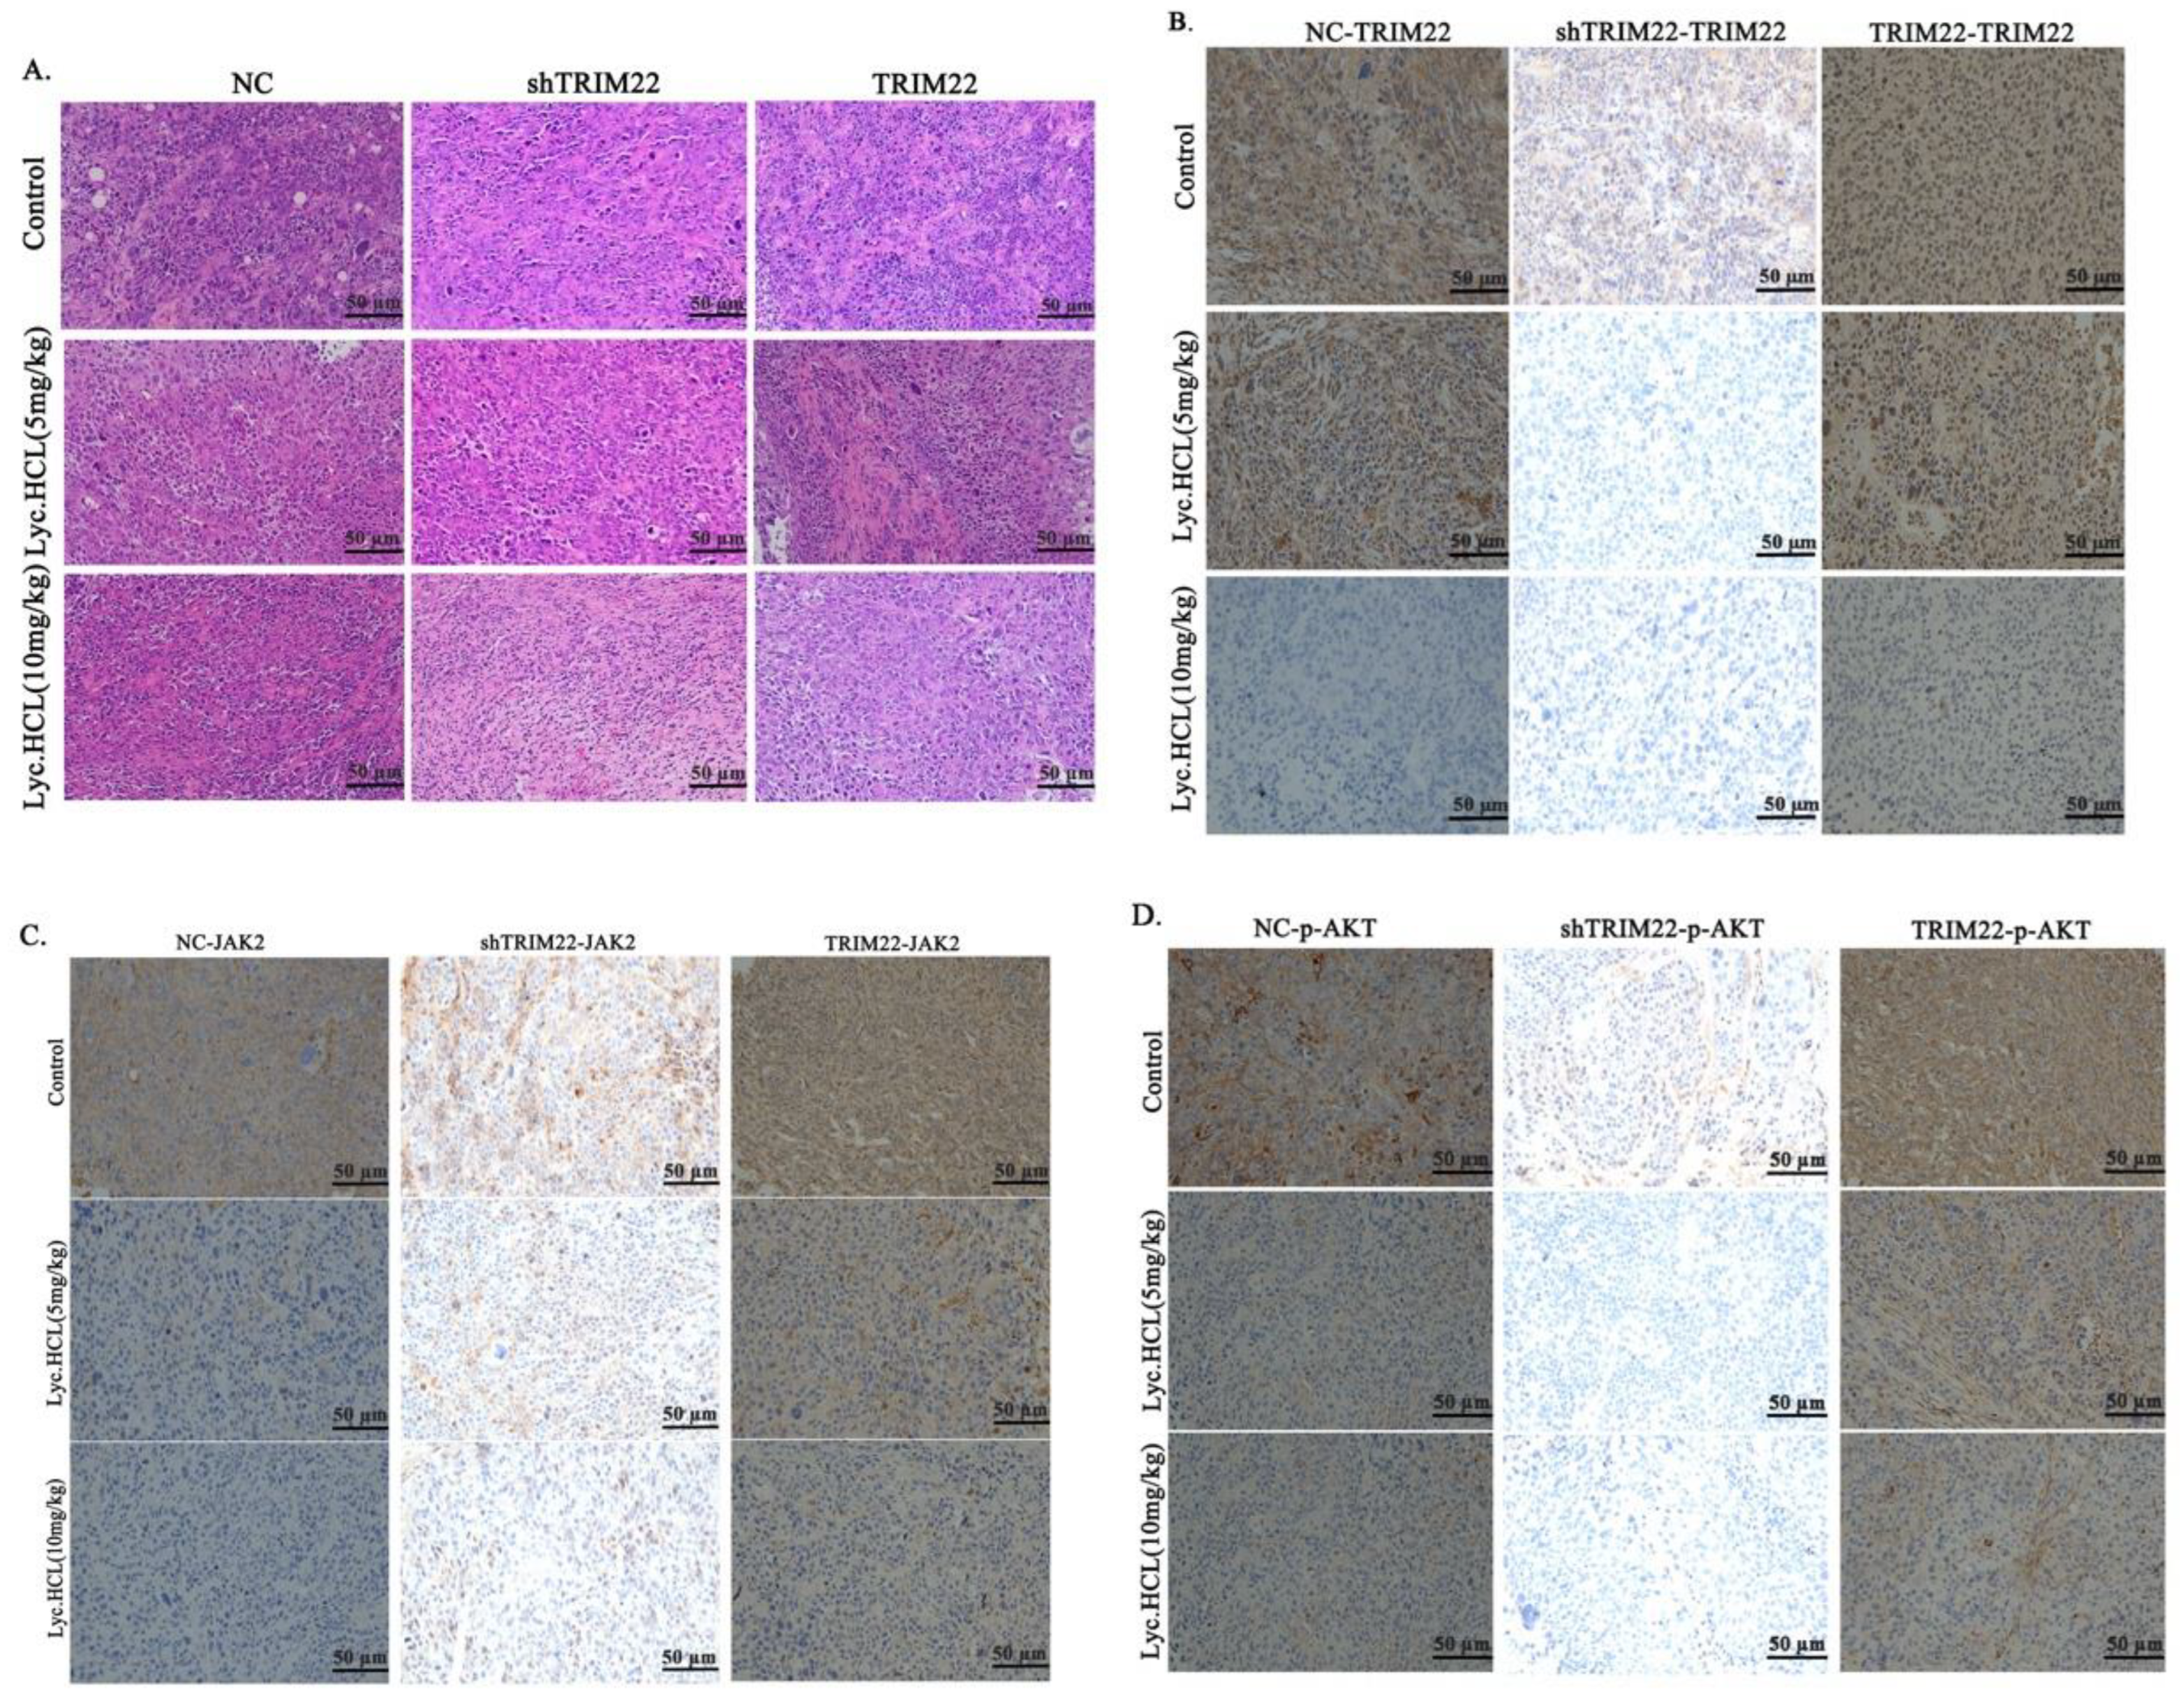

Table 1.
The cells count that expressed TRIM22 in tissues.
| Tissue No. | Normal Tissue | Peritumoral Tissue | ESCC Tissue |
|---|---|---|---|
| 1 | 0 | 0 | 1556 |
| 2 | 0 | 0 | 1507 |
| 3 | 0 | 0 | 1687 |
| 4 | 0 | 0 | 3657 |
| 5 | 0 | 0 | 3676 |
| 6 | 0 | 0 | 2031 |
| 7 | 0 | 0 | 2240 |
| 8 | 0 | 0 | 1786 |
| 9 | 0 | 0 | 1099 |
| 10 | 0 | 0 | 2345 |
| 11 | 0 | 0 | 1455 |
| 12 | 0 | 0 | 2345 |
| 13 | 0 | 0 | 1596 |
| 14 | 0 | 0 | 2329 |
| 15 | 0 | 0 | 2020 |
| 16 | 0 | 0 | 1945 |
| 17 | 0 | 0 | 1425 |
| 18 | 0 | 0 | 1709 |
| 19 | 0 | 0 | 2063 |
| 20 | 0 | 0 | 1113 |
| 21 | 0 | 0 | 1162 |
| 22 | 0 | 0 | 1092 |
| 23 | 0 | 0 | 1927 |
| 24 | 0 | 0 | 1634 |
| 25 | 0 | 0 | 1552 |
| 26 | 0 | 0 | 3374 |
| 27 | 0 | 0 | 3068 |
| 28 | 0 | 0 | 2813 |
| 29 | 0 | 0 | 1552 |
| 30 | 0 | 0 | 1142 |
| 31 | 0 | 0 | 1750 |
| 32 | 0 | 0 | 1414 |
| 33 | 0 | 9 | 1213 |
| 34 | 0 | 0 | 1709 |
| 35 | 0 | 0 | 1786 |
Disclaimer/Publisher’s Note: The statements, opinions and data contained in all publications are solely those of the individual author(s) and contributor(s) and not of MDPI and/or the editor(s). MDPI and/or the editor(s) disclaim responsibility for any injury to people or property resulting from any ideas, methods, instructions or products referred to in the content. |
© 2024 by the authors. Licensee MDPI, Basel, Switzerland. This article is an open access article distributed under the terms and conditions of the Creative Commons Attribution (CC BY) license (http://creativecommons.org/licenses/by/4.0/).
Copyright: This open access article is published under a Creative Commons CC BY 4.0 license, which permit the free download, distribution, and reuse, provided that the author and preprint are cited in any reuse.


