
Submitted:
15 November 2024
Posted:
15 November 2024
You are already at the latest version
Abstract
Assessment of cellular composition and viability of stem cell-derived organoid models is a complex but essential approach to understanding the mechanisms of human development and disease. Aim: Our study was motivated by the need for an image-analysis workflow, including high-content, high-throughput methods, to measure the architectural features of developing organoids. We assessed stem cell-derived cortical organoids at 4 and 6-months post-induction using immunohistochemistry-labelled sections as the analysis testbed. The workflow leveraged fluorescence-imaging tailored to classify cells as viable and dying or non-viable and assign neuronal and astrocytic perinuclear-markers to count cells. Results/Outcomes: Image acquisition was accelerated by capturing the organoid slice in 3D using widefield-fluorescence microscopy. This method used computational clearing to resolve nuclear and perinuclear markers and retain their spatial information within the organoid's heterogeneous structure. The customized workflow analysed over 1.5 million cells using DAPI-stained nuclei, filtering and quantifying viable and non-viable cells and the necrotic-core regions. Temporal analyses of neuronal cell number derived from perinuclear labelling, were consistent with organoid maturation from 4 to 6-months of in vitro differentiation. Overall: We have provided a comprehensive and enhanced image analysis workflow for organoid structural evaluation, and the ability to gather cellular level statistics in control and disease models.
Keywords:
brainoids
; developmental disorders
; genetic disease
; Image analysis
1. Introduction
The advent of research using human induced-pluripotent stem cells (hiPSCs) has seen personalised models of neurodevelopmental disorders made possible for the first time [1,2].
HiPSCs multiply continuously in monolayer cultures while retaining the ability to differentiate into nearly any human cell type [1,2]. They originate as mature somatic cells, commonly fibroblasts obtained from skin samples, and are converted into pluripotent stem cells using reprogramming factors [1,2,3]. Several different approaches are available for differentiation, including dual-SMAD inhibition or the overexpression of transcription factors such as Neurogenin-2 [4].
Derived from hiPSCs, three-dimensional (3D) brain or cerebral organoids have emerged as a ground-breaking technology with the potential to combine traditional laboratory findings with personalised clinical treatments [5,6]. These self-organising 3D structures closely mirror the neuronal organisation and functional activity of the developing human brain [2,5,6]. Depending on the protocol applied, they may represent cells from all brain regions, like cerebral organoids or the patterning of specific regions, such as the cortex, yielding so called corticoids. The ability to produce cortical-specific organoids is crucial for investigating disease mechanisms of severe developmental disorders like developmental and epileptic encephalopathies (DEE) [7,8], Autism spectrum [9,10] and Angelman syndrome [11]. In addition to pathophysiology of neurodevelopmental disorders, these models can be used for therapeutic screening in a tissue-relevant context.
Despite the promise of organoid technology, small changes made by individual laboratories when implementing differentiation protocols contribute to structural heterogeneity in organoid models. Previous efforts to standardize organoid differentiation have aimed to reduce variability [12], but any adopted protocol still requires minor adjustments based on specific cell lines and procedures. Notably, the size, shape and viability of cortical organoids can vary significantly both within and between batches. To address this heterogeneity, we sought to create an image analysis workflow specifically designed to examine large datasets and benchmark the selected protocol. This imaging workflow would serve as an important exercise in standardization.
Evidence of cellular diversity in organoid models has primarily been drawn from measures of cell function, gene expression and protein abundance; however, these give little insight into architectural patterns of cell growth [13,14]. Recently many groups have focused on high-throughput imaging methods to assess organoid morphology [15,16,17,18]. However, at the cellular level, high-resolution imaging techniques are still needed to measure the integrity of maturing organoids, which is challenging when applied to cortical organoids [13,14]. Additionally, the need for large sample datasets to obtain statistically valid comparisons creates a bottleneck in the imaging process. High-content imaging of organoid models offers a promising solution to accelerate tissue analysis, especially as these models become more structurally complex as they mature.
Brain organoid maturation facilitates synaptic and network development, necessitating extended culturing periods, which ultimately results in larger tissue sizes [19,20]. Investigating the cellular architecture of these larger tissues often involves sectioning tissue and employing immuno-histochemistry (IHC), a widely used procedure for organoid analysis [14]. Other methods, such as tissue clearing, 2-photon imaging, and light-sheet imaging, require specialized expertise and imaging systems, making them less commonly used [14,21,22]. Our objective therefore, was to develop a widely applicable image analysis method that could benefit various research groups.
One major challenge associated with large avascular organoids is their susceptibility to developing a necrotic core. A comprehensive structural analysis method must include a measurement approach that filters out dying cells and the necrotic core region [23]. The absence of a vascular system limits the diffusion of oxygen and nutrients from the surface of organoids, leading to the formation of a dead cell core as the organoids grow [24,25]. Despite the emergence of methods to improve nutrient diffusion, physical constraints limit nutrient flow to approximately 400 µm and in long-term 3D organoid cultures, hypoxic core susceptibility remains an issue [26,27,28]. Changes in the volume of dead cell cores or the percentage of dead cells may also reflect features of the disease model [29,30,31]. Image-based analyses have traditionally relied on manual delineation of non-viable tissue boundaries, a process that is subjective, time consuming and impractical for large sample sizes.
Another critical measurement we sought to address was obtaining cell counts for proteins expressed outside the nucleus or in peri-nucleic regions. While robust co-localization imaging methods with cell nuclei are available, antibody labelling without spatial overlap – labelling non-nuclear proteins – presents a significant analytical challenge. Assigning these non-nuclear structures to a specific cell is non-trivial, as illustrated by antibodies marking filamentous structures. For example, microtubule-associated protein (MAP-2) is expressed in neuronal perikarya and dendrites, which in cerebral organoids have complex boundaries and lack stereotypical and layer-specific projection patterns [32,33,34]. Alternatively, mean fluorescence intensity is often used to measure overall antibody expression; however, this approach does not account for tissue size nor reveals the number of cells expressing specific markers [21,33,35,36]. This can lead to misinterpretations, as low cell density and high fluorescence signal might resemble low density and weak fluorescence signal when averaged over a large area. By enabling more precise cellular-level statistics, our approach to estimating cell numbers enhances research utilizing organoid models of human disease.
Overall, our objectives were to enhance whole organoid image analysis by providing a way to identify and separate areas of cell death in non-viable regions and quantify cell number and density of non-nucleic antibody markers in viable tissue areas. The resultant analysis workflow incorporated machine-learning-based cell nuclei segmentation implemented via Cellpose v2.2 (Howard Hughes Medical Institute, Ashburn, VA, USA) providing masked images that were further processed in MATLAB via a custom Graphical User Interface (GUI). The analysis workflow was developed to facilitate processing large datasets of tiled and z-series images via progression through a semi-automated step-sequence.
2. Materials and Methods
2.1. Ethics
Ethics for the project was approved by the Austin Health Human Research Ethics Committee (HREC/16/Austin/472, Melbourne, Australia) and conducted in adherence to the established guidelines set forth by the Austin Hospital, University of Melbourne, and the National Health and Medical Research Council (NHMRC) of Australia.
2.2. Human iPSC Model
Organoids were derived from two control cell lines, a hiPSC line derived from a neonate (Cat #WC026i-5807-3, WiCell, WI, USA) and an embryonic stem cell (ESC) line (Cat #H9 or WA-09, WiCell, WI, USA). Three batches of cortical organoids were generated from each cell line using the protocol established by Velasco et al. [12]. Each batch comprised 12 organoids at two developmental stages: six were collected on day 120 (4-months) post-induction and six on day 180 (6-months).
2.3. Immunohistochemistry
At 4 and 6-months post-induction, a minimum of two technical replicates were immersed in 4% paraformaldehyde and incubated for 2 hours at 4°C, then washed three times in 1X phosphate buffered saline (PBS), and placed in tissue-Tek O.C.T. Compound (Cat # 25608-930); then snap-frozen and stored at -80°C. Serial cryo-sections were cut at 20µm thickness (Cat # CM1950; Leica Biosystems, Buffalo Grove, IL, USA), collected on SuperfrostPlus glass slides (Cat # I6172PLUS, Thermo Fisher, Waltham, MA, USA) and stored at -80°C.
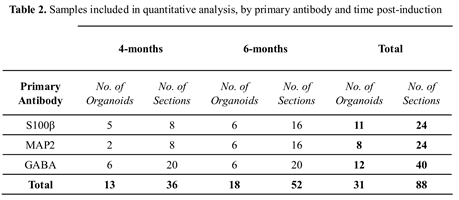
Immunohistochemistry was performed according to Yakoub and Sadek [37]. All primary and secondary antibodies are listed in Table 1. Sections were defrosted for 15 minutes at room temperature (RT), then blocked using 10% normal goat serum (NGS; Cat # 16210064; Invitrogen, Carlsbad, CA, USA) and 0.3% Triton X-100 in PBS, for a minimum of 2 hours, at RT. Primary antibodies were diluted in an antibody vehicle solution (AVS) of 1% NGS and 0.1% Triton X-100 in PBS) and sections incubated overnight at 4°C, in the dark. Table 2 details the number of sections included in our analysis. Slides were washed in a solution of 0.05% Tween20 and PBS and incubated with the secondary antibodies (diluted in AVS) for one hour, at RT (see Table 1). A second wash using a solution of 0.05% Tween20 and PBS preceded a 5-minute incubation with 6-diamidino-2-phenylindole (DAPI). Two final PBS washes were undertaken then sections were mounted using Invitrogen ProLong Gold Antifade mounting medium (Cat # P36934, Thermo Fisher, Waltham, MA, USA) and covered with Menzel-Glaser glass coverslips (Cat # 11911998, # 1.5H, Thermo Fisher, Waltham, MA, USA). Slides were subsequently stored at -80°C until imaged.
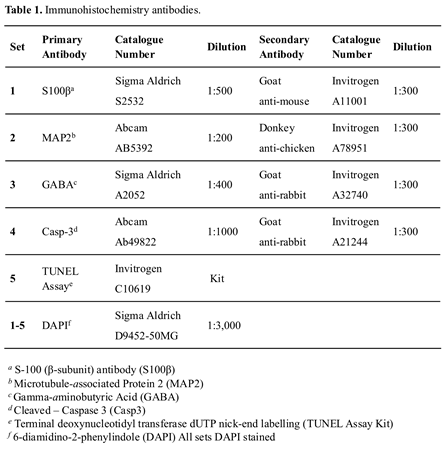
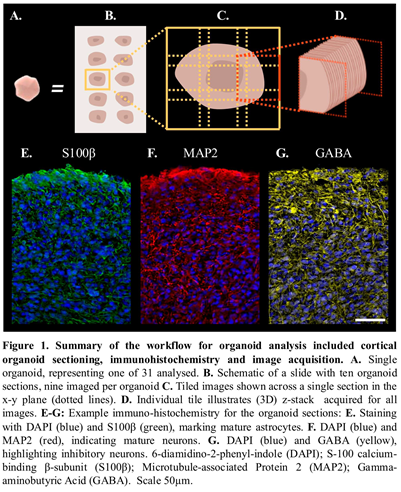
To characterize the morphology of the organoids with respect to protein markers indicative of mature expression patterning, three antibodies were used. In mammalian cells S-100 (β-subunit) (S100β) protein is predominantly expressed by mature astrocytes and distributed throughout the cytoplasm [38,39,40,41]. Microtubule-Associated Protein 2 (MAP2), a cytoskeletal protein mainly expressed in the soma and dendrites of mature neurons [32]. Gamma-aminobutyric Acid (GABA)ergic neurons, an inhibitory neurotransmitter chiefly located in the cytoplasm and dendrites of neurons [42,43]. A total of 88 sections were included in the final analysis, as outlined in Table 2. Additional organoid sections (n=6) were included to verify non-viable cellular and core features using cleaved-caspase-3 antibody and TUNEL assay kit (Table 1).
2.4. Imaging
Images of each organoid slice were acquired using a 20X/0.8NA objective on a Leica THUNDER Imager DMI8 fluorescence microscope (Leica Microsystems, Germany). Image z-stacks with a z-step size of 0.571µm and a pixel size of 0.323µm xy, were acquired to ensure adequate sampling in line with recommendations for post-processing using Leica Application Suite X (LASX, version 3.8.1.26810, Leica Microsystems, Germany). A tile scan function was used to rapidly image the entire organoid slice, with a 10% tile overlap. All sections were labelled with DAPI for nuclei segmentation (excitation wavelength used for imaging 391 nm) and either S100β (ex 479 nm), or MAP2 or GABA (ex 554 nm). The images were subject to small volume computational clearing (SVCC) using the LASX software [44], before being exported. Settings included feature scale - 6000 (nm) and 30% background scale. In addition, confocal images were also acquired on a subset of organoid slices using an LSM900 scanning confocal microscope 20X/0.8NA (Carl Zeiss Inc., Germany). Confocal imaging time was considerably longer at approximately 6 hours (parameters optimized for Nyquist sampling), versus 10 minutes on Leica THUNDER (parameters optimized for LASX processing as noted above). The Leica THUNDER system therefore presented a significant advantage to achieve high throughput and was used for analysis workflow development due to capturing sufficient image quality to segment and analyze antibodies for cell counts. All images were acquired within the Florey Neuroscience Microscopy Facility (The Florey Institute of Neuroscience and Mental Health, Melbourne, Australia).
2.5. Image Data Analysis
A custom set of MATLAB (Version R2022b, Mathworks, Natick, MA, USA) functions were developed for the purpose of image analysis. These incorporated a range of steps, including tile stitching, nuclei and peri-nucleic antibody segmentation, cell-state characterization, the identification of the non-viable cell core boundary and applicable calculations. A description of the image analysis workflow is incorporated in the results section outlined below. All analysis scripts are available on request. The analysis workflow was executed on a Dell PowerEdge R820 Server, equipped with four Intel Xeon E5-4620 processors (2.20GHz, 16M Cache, 7.2GT/s QPI, Turbo, 8 Core) and supported by a RAM capacity of 512GB.
2.6. Statistical Framework
All statistical analyses and figures relating to the visualization of data were completed using GraphPad PRISM software (Version 9.5.1, GraphPad Software Inc., La Jolla, CA, USA). Numeric values are reported to three significant figures. and data is presented as mean ± Standard Error of the Mean (SEM). To compare groups, multiple t-tests with Welch’s correction were conducted to account for unequal variances. To compensate for the potential inflation of Type I errors, the False Discovery Rate (FDR) – using the Benjamini-Hochberg method (Q = 5%) – was also determined. Comparisons with an FDR-adjusted p-value (q) less than 0.05 were considered discoveries.
3. Results
Cortical organoids obtained from two stem cell control lines were collected at two time points, after 4 and 6-months of differentiation. A workflow for their analysis is presented in Figure 1 and included cortical organoid sectioning (Figure 1A-C), immunohistochemistry and image acquisition (Figure 1D-G). To quantify the cellular composition of organoids, we developed a customized image analysis pipeline.
3.1. 3D Analysis of Organoid Slices
As previously outlined, fluorescently labelled cortical organoid slice images were captured using Leica Application Suite (LASX). To preserve the inherent 3D tissue structure, image processing of z-stacks, which comprised 2D tiled images taken across the x-y plane, were reconstructed as a 3D spatial model of the organoid sections. Automated analysis of the entire organoid section was performed to capture the intrinsic structural heterogeneity and provide a more representative sampling approach to quantifying organoid morphological features such as cell density, viability, and antibody expression across developmental stages.
3.2. Identification of Tissue Boundaries
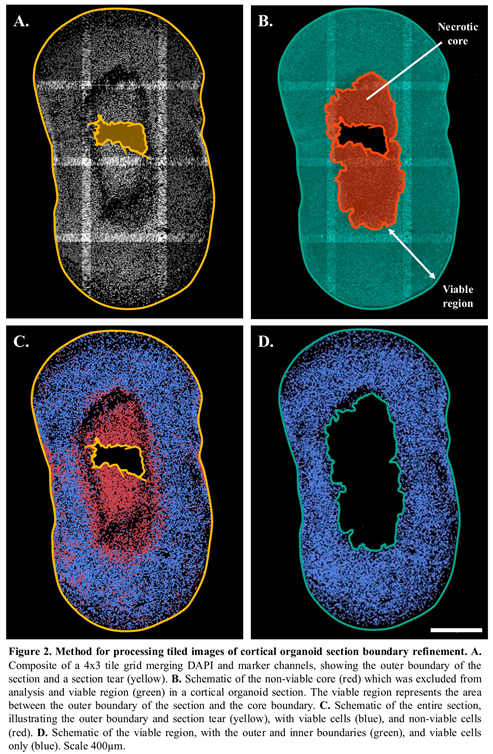
Automated and accurate detection of the outer boundary of each organoid ensured a clear demarcation of the tissue (Figure 2A-B). The identification of tissue artefacts such as tears, folds, non-viable core and their exclusion from further analysis was implemented within the image processing workflow (Figure 2C-D). By automating the detection of sectioning and other artefacts, this process helped filter out non-biological features, ensuring more reliable measurements. Figure 2D is a schematic of the viable region after refinement of the section boundaries and illustrates only the viable cells as described in the next section.
3.3. Nuclei Segmentation
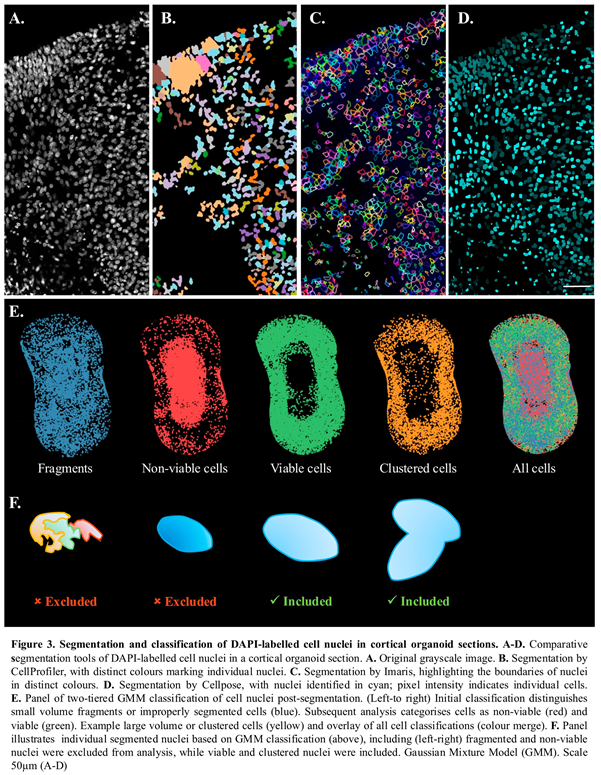
The analysis workflow enabled accurate segmentation of nuclei (Figure 3) and provided the organoid cell counts. Nuclei segmentation was based on DAPI-labelling. Algorithm selection was a crucial step, as tightly packed cellular structures within cortical organoids can be highly confounding for cell counts. Several tools for 3D object segmentation were explored, including Imaris (Oxford Instruments, Switzerland), Cellprofiler (Broad Institute, Cambridge, MA, USA), Cellpose v2.2 and Image J v1.54f. [45]; example segmentation results shown in Figure 3A-D. Each package was evaluated for speed, reliability, and ability to adapt to a heterogenous sample. Compared to other packages tested, the machine learning framework utilized by Cellpose v2.2 demonstrated proficiency when faced with complex and varied samples and was embedded into the analysis workflow. 3D segmentation was completed using the nuclear model with a minimum mask size of 15 pixels and an initial object diameter of 30.8 pixels. Anisotopy was defined as the ratio of z-step size (µm) to pixel size (µm) for each image. The resulting segmented DAPI-labelled images, outputted as 16-bit Tag Image File Format (.tif) files, provided a basis for subsequent analyses within the workflow.
3.4. Cell-State Classification
Nuclei were then classified into four distinct groups: cell fragments, non-viable, viable, and clustered or dividing cells (Figure 3E). This classification was initially based on nuclei volume, calculated from the segmented images outputted by Cellpose v2.2. The volumes were fitted to a Gaussian Mixture Model (GMM) with three components (Figure 3E). The GMM distinguished between very small volumes ( = 8.57µm3), representing cell fragments or improperly segmented nuclei; moderate volumes, representing single cells; and large volumes ( = 548µm3), corresponding to dividing or clustered cells. Fragments were excluded from further analysis (Figure 3F).
DAPI stained nuclei of apoptotic or dead cells typically exhibit lower volumes and higher fluorescent intensities due to condensed DNA and cytoplasm compared to their viable counterparts [46,47]. These features were leveraged for the application of a second GMM, used to classify the group of moderate volumes as either viable ( = 219µm3) or non-viable ( = 149µm3; apoptotic/dead) cells. The estimated mean volume of nuclei within the non-viable and viable regions were provided as initial parameters for the GMM, which incorporated both volume and intensity data. For the purposes of clarity, dying and dead cells are described as non-viable for the remainder of the report. The sequential application of GMMs resulted in each nucleus being allocated to one of the four final groups (Figure 3F).
The results obtained for the nuclei feature detection and cell classification were confirmed using a separate set of organoid sections containing a non-viable cell core. To identify the apoptotic pathway, we included cleaved-Caspase-3 antibody and Terminal deoxynucleotidyl transferase dUTP nick-end labelling (TUNEL) assay (n=3 each). Classification of non-viable cells, at high density within the organoid core, was confirmed by both cleaved-Caspase-3 antibody (Supp. Figure 1A-C), and TUNEL assay (Supp. Figure 1D-F), which showed positive staining concentrated within the organoid core. To verify, at a cellular level, non-viable versus viable cells, the mean fluorescence intensity and diameter of nuclei for either DAPI/TUNEL positive (non-viable) and DAPI+ve/TUNEL-ve (viable) was calculated using Image J (n=20 each). Nuclei intensity plots were obtained using a line-segment 1 µm-width (Supp Figure 1H, I). Classification of non-viable cells using DAPI-nuclei staining confirmed that small diameter (< 6mm), high signal intensity nuclei were TUNEL positive; while lower signal intensity DAPI+ve cell nuclei (>6mm) were TUNEL negative, consistent with viable cell classification used in the analysis workflow.
3.5. Identification of Non-Viable and Viable Regions
To obtain organoid measurements including for example, the core size and cell density, the analysis workflow was developed to automatically delineate viable and non-viable areas.
3.5.1. Non-Viable Regions
Automatically demarcating the non-viable cell core is challenging due to the intermingling of dead and viable cells throughout the organoid. This phenomenon is underpinned by several factors, including the gradient of nutrient diffusion, natural rates of cell death, incurred damage, and variations in hypoxia resistance [48,49]. To demarcate the presence of a core and approximate core boundary, a novel protocol was applied. Binary masks were generated of the non-viable and viable nuclei in each segmented image tile, and Maximum Intensity Projections (MIPs) were created for each of the two masks. Local cell densities were then calculated for both the non-viable and viable MIPs using a sliding window convolution. The necrotic density map was then subtracted from the viable density map, and regions with a high ratio of non-viable cells were identified using a threshold-based method, marking the necrotic core. Finally, morphological smoothing and hole-filling operations were applied to refine the necrotic core boundary.
3.5.2. Viable Region
The viable regions in all samples were calculated from the total area of the section, delineated by the outer boundary, minus the region containing the non-viable cell core (example Figure 2C).
3.5.3. Non-Viable Cells Within the Viable Region
Nuclei centroids positioned within the viable region of the samples were extracted for analysis. The relative frequency of cell death within the viable region was subsequently calculated as the percentage of non-viable cells relative to the total number of cells within the viable region.
3.6. Estimation of Antibody Positive Cell Count
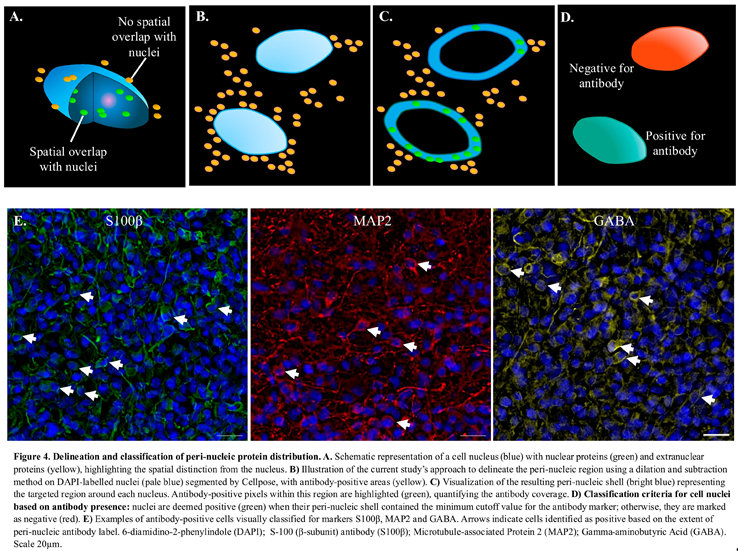
This section outlines the portion of the analysis workflow used to quantify the number of cells expressing S100β, MAP2, and GABA antibodies. As a brief overview, first the antibody-positive voxels were identified by thresholding the antibody-labelled images. Next, a peri-nuclear shell was obtained by dilating the DAPI-mask corresponding to each viable cell nuclei. Finally, the percentage of antibody-positive voxels within the shell was measured. A schematic to distinguish the spatial classification of nuclei and peri-nucleic markers is given in Figure 4A-D for this part of the analysis workflow and described in detail below.
3.6.1. Antibody Positive Voxels.
The measurement of antibody expression involved the application of a cutoff to the antibody image. An adaptive threshold was selected according to Otsu’s three-class method, a classification method based on intensity, with the middle class assigned to the background. This is an established approach that was selected for its robustness when applied to antibody-stained images with multi-modal characteristics [50,51]. The result was a binary image of all voxels identified as positive for the antibody, from which the percentage volume occupied by the antibody was calculated.
3.6.2. Delineation of Peri-Nucleic Region
The masked images of the segmented nuclei were dilated using a spherical structuring element three voxels (~1µm) in diameter (Figure 4A-B). This resulted in a mask of the three-dimensional “shell” around the nuclei, or the peri-nucleic region (Figure 4C).
3.6.3. Identification of Antibody-Positive Cells
In order to distinguish antibody, “positive” cells from antibody “negative” and to account for cells whose nuclei were positioned in close proximity to the antibody labelling expressed by other cells; a cutoff method was applied. The cutoff value was guided by two experts in the domain, who visually classified cells from a single 3D tile for each antibody as either positive or negative (Figure 4D). In Figure 4E are example images of the antibody labelling highlighting cells which were manually identified as positive. Positive cells were defined as those with a 3D fluorescence signal surrounding a DAPI-labelled nucleus. The mean percentage of antibody signal within the peri-nucleic shell of visually identified positive cells was calculated and used to set the minimum cut-off value for classifying antibody positive cells in the image processing workflow. The thresholds were established as 31.5% for GABA, 23.2% for MAP2, and 10.4% for S100β, with any cell exceeding the respective cut-off considered positive. The percentage of antibody-positive cells within the viable regions were then calculated.
3.7. Volume Estimation
To estimate the volume of the slice we combined the x-y pixel map with the z-coordinates of the segmented nuclei. This was performed as a heatmap spatially averaging this information across sub-regions, 200x200 pixels in size. Overlaying the pre-defined inner boundaries of the non-viable core and outer boundary of the organoid slice their volumes could be estimated.
3.8. Temporal Analysis of Organoid Morphology and Maturation
The analysis workflow was applied to measure the developmental trajectory of control cortical organoids between 4 and 6-months post-induction. Measurements included the volume of the non-viable core, cell densities, and three cell populations, comprised of astrocytes (S100β) and neurons, which included all neurons (MAP2) and GABAergic interneuron sub-type. In total, 88 sections from 31 organoids were analysed, as outlined in Table 2.
3.9. A Proportional Decrease in Non-Viable Cells Was Observed from 4 to 6-Months Post-Induction
The structural health of the organoids was assessed by the relative size of the non-viable cell core. A non-viable cell core was identified in 40 (86.9%) of those sampled at 4-months post-induction and 32 (61.5%) of those sampled at 6-months post-induction. There was no change in the total volume of the organoid sections examined over time (Figure 5A). However, analysis of the volume of the non-viable core as a percentage of the total volume was significantly reduced with a mean of 26.4% versus 18.8% at 4 month and 6 months post-induction respectively (Figure 5B); Difference = 7.6%, SE of difference = 3.1%, t(62.9) = 2.5, p = 0.0168, q = 0.0176.
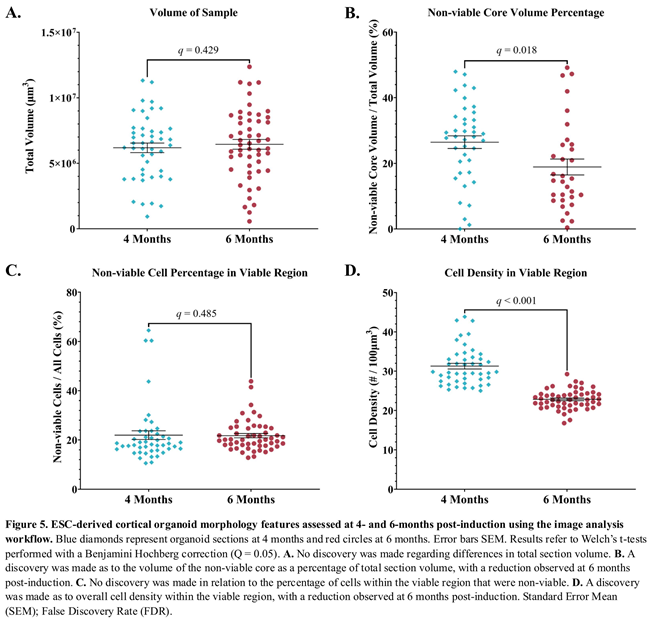
The cellular health of the organoids was evaluated by calculating the percentage of non-viable cells relative to the total cell count within the viable region of the samples. No discovery was made when comparing mean ratios at 4 months ( = 22.0%) and 6 months ( = 21.8%) post-induction (Figure 5C); Difference = 0.19%, SE of difference = 3.1, t(66.26) = 0.096, p = 0.924, q = 0.485.
3.10. Cell Density in Cortical Organoids Was Higher at 4-Months Versus 6-Months Post-Induction.
Cell density was utilized to measure cell proliferation and evaluated in the viable region of cortical organoids. The viable cell density in this region was higher at 4 months ( = 31.3 cells/100µm3) compared to 6 months ( = 22.8 cells/100µm3) post-induction (Figure 5D); Difference = 8.4, SE of difference = 0.794, t(64.4) = 10.6, p < 0.000001, q = < 0.000001.
3.11. Quantifying Expression of Astrocyte and Neuronal Markers.
3.11.1. S100β Expression Was Unchanged from 4 to 6-Months Post-Induction.
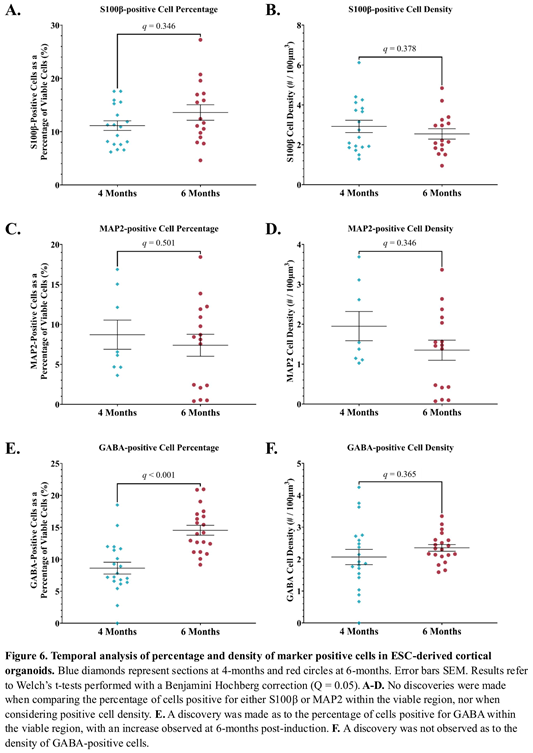
The maturation of individual astrocytes was assessed using the ratio of S100β-positive cells to all viable cells. At 4 months the mean percentage of S100β-positive cells was 11.1%, compared to 13.6% at 6 months post-induction (Figure 6A). No discovery was made with this comparison; Difference = -2.5%, SE of difference = 1.7, t(25.8) = 1.4, p = 0.162, q = 0.346. The mean density of S100β-positive cells was also similar at 4 ( = 2.9 cells/100µm3) and 6 months ( = 2.5 cells/100µm3) post-induction (Figure 6B); Difference = 0.376, SE of difference = 0.404, t(31.7) = 0.93, p = 0.36, q = 0.378.
3.11.2. No Change in MAP2 Expression from 4 to 6-Months Post-Induction.
Temporal assessment of neuron maturation was made using the percentage of MAP2-positive cells in organoids at 4 and 6 months. As a proportion of all viable cells, MAP2-positive cells showed a decrease from 8.7% to 7.4% from 4 to 6 months post-induction respectively, which did not result in a discovery (Figure 6C); Difference = 1.3, SE of difference = 2.3, t(14.8) = 0.577, p = 0.573, q = 0.502. Similarly, no discovery was made in relation to the differences in density of MAP2-positive cells from 4 ( = 1.95 cells/100µm3) to 6 months ( = 1.3 cells/100µm3) post-induction (Figure 6D); Difference = 0.602, SE of difference = 0.445, t(13.8) = 1.35, p = 0.198, q = 0.346.
3.11.3. The Proportion of GABA-Positive Cells Increased, But No Change in GABA-Positive Cell Density 6-Months Post-Induction.
The differentiation of GABAergic neurons was assessed by the percentage of GABA-positive cells at 4 ( = 8.6%) and 6 months ( = 14.5%) post-induction. A discovery revealed a significant increase in the proportion of GABA-positive cells over time (Figure 6E); Difference = -5.9%, SE of difference = 1.2, t(36.8) = 4.9, p = 0.00002, q = 0.0001. An increase in the density of GABA-positive cells was observed between 4 ( = 2.07 cells/100µm3) and 6 months ( = 2.4 cells/100µm3) post-induction, though no discovery was made regarding this change (Figure 6F); Difference = -0.286, SE of difference = 0.258, t(26.0) = 1.1 p = 0.278, q = 0.365.
4. Discussion
We have established an image analysis workflow to serve as a standardized method for the assessment of organoid viability and cytoarchitecture. The workflow was tested on a dataset of more than 1.5 million cells and demonstrated remarkable efficacy in identifying specified cell types and states, as well as providing temporal and spatial information when applied to cortical organoid development.
To enhance our analysis beyond single-plane imaging, we captured the entire organoid slice in 3D, revealing details of the cellular organization that traditional maximum intensity projection methods omit. Additionally, our automated analysis of the complete section enabled us to explore the regional diversity within the organoids across each group. This comprehensive approach provided deeper insights into cellular features such as density, viability, and antibody expression at various developmental stages.
To implement high-throughput imaging we utilized a widefield fluorescence microscope system. The advantage of this imaging approach provided 3D acquisition of entire sections in a fraction of the time needed for confocal microscopy when using similar acquisition parameters. The widefield system adequately captured the nuclear marker and the peri-nuclear environment, which were the primary focus of our analyses. These findings suggest that widefield microscopy is a suitable alternative when a balance between resolution and higher acquisition speed is required.
The Leica Thunder system has three computational clearing algorithms available. Here we implemented Small Volume Computational Clearing (SVCC). This algorithm applies adaptive deconvolution before removing unwanted background [44]. Image datasets captured using this method provided sufficient cellular detail to facilitate automated cell counts. The resultant analysis workflow was designed to process widefield 3D image tiles; however, it could also be applied to any fluorescence image datasets for example, optically-sectioned whole tissue samples using light-sheet microscopy [21,22].
At present, research using organoid models lacks a well-defined benchmark for 'normal' growth and development. We have established an “in-house” method to benchmark the elected organoid protocol tailored to the specific needs of cytoarchitectural analysis, an exercise critical to identify, interpret and compare deviations between control and disease models.
The analysis workflow’s initial task was to quantify non-viable and viable cells using the nuclear label. Non-viable or necrotic cells have previously been identified in organoid image-based studies by their higher fluorescence intensity and smaller diameter nuclei in comparison to functional cells [52,53,54]. While previous studies focused on a single attribute, we adopted a more comprehensive approach by implementing a two-tiered Gaussian Mixture Model that analyzes both volume and intensity. This approach allowed for more complex stratification of candidate cells. We show that nuclei classified using the integrated approach as non-viable cells was confirmed using cleaved-caspase 3 and TUNEL staining, consistent with previous reports [12,36,47,55]. The approach also allowed automatic delineation of the non-viable core boundary from the viable region, which was a significant advancement.
To evaluate organoid viability, the nucleic viability classifications were applied to obtain quantitative “in-house” assessment of cortical organoids including the non-viable core volume and percentage non-viable cells in the viable region. We found a significant decrease in the volume of the non-viable core between 4 and 6-months post-induction. In contrast to this finding, previous research has proposed the “dead cell” core increases over time, caused by the limited diffusion of oxygen and nutrients from the organoid surface in the avascular model [14,48,56]. To interrogate the current finding, we quantified two additional factors likely to affect core size including the densities of viable and dead cells within the viable region. Our results indicated a reduced viable cell density within the viable region, from 4 to 6-months. Second, we found the viable region showed a decreased number of non-viable or dead cells from 4 to 6-months, which is consistent with reported cell death rates in cerebral organoids plateauing as they near synaptic maturity [57]. Taken together these results indicate diffusion rates across the viable region may be higher at 6 months. Additional transcriptional analysis would help to determine whether changes in gene expression involved in aerobic respiration and apoptotic genes are consistent with current findings [58]. Overall, the results suggest that evaluating the non-viable core and viable region’s growth, at a cellular level can help to understand how these factors might influence the health and development of cortical organoids in control and disease models.
To quantify the number of protein labelled cells, the analysis workflow was designed to capture each cell’s peri-nuclear protein expression level. Micro-structure in mature cortical organoids is complex in terms of both tightly packed heterogeneous cells and sub-cellular protein expression patterns, which make automating and obtaining cell counts for non-nucleic markers challenging. Therefore, our approach was to use each viable cell’s DAPI-mask and create a dilated 3D volume or peri-nuclear shell.
With respect to quantifying organoid maturation, our assessment between 4 and 6-months post-induction showed no significant differences in S100β expression, indicating that astrocytic maturation remains stable throughout this period. This finding was somewhat unexpected, given the literature describing a continual increase in proliferation from the beginning of astrogenesis in cerebral models [12,20,59,60]. Two possible explanations for these findings arise: First, it may be that the rate of astrocytic maturation is variable over time and that this variation has not previously been captured. Second, although widely applied as a measure of astrocytic maturation, S100β is not expressed in all mature astrocytes [41,61]. Therefore, quantitative changes in maturation based on S100β may be limited, and additional markers like glial fibrillary acidic protein (GFAP) could provide further insight.
The percentage of all cells characterised as mature MAP2 positive neurons were similar from 4 to 6-months post-induction; while the percentage of GABAergic neurons was significantly increased. These findings suggest a potential shift in the neuronal population towards GABAergic neurons, consistent with previous studies that revealed a shift occurs at approximately 3-6 months post-induction [9,12]. These observations emphasize how the image analysis workflow can be used to evaluate cell number in models of neurodevelopmental disorders, particularly where GABAergic interneurons are thought to have a significant impact [9,62,63].
Future application of the image analysis workflow could include machine learning development. By capturing spatial and single-cell-level information from sample images, including protein signatures, the workflow can also be expanded to incorporate the cells’ molecular profile. This spatial mapping enables detailed profiling of each cell across large replicate datasets. Such advancements align with proposed developments in machine learning, where immunohistochemistry analysis of patient-derived organoids could serve as a valuable tool for personalized drug screening platforms [64,65].
In conclusion, we established a method to benchmark the preferred organoid protocol “in-house”. Functionalities were built into a single, customizable script and incorporated changes to improve their theoretical robustness, tailored to the specific needs of cytoarchitectural cortical organoid analysis. Implementing the current workflow would help laboratories to establish their own benchmark; a critical exercise for identifying, interpreting and comparing deviations across disease and control models.
Supplementary Materials
The following supporting information can be downloaded at the website of this paper posted on Preprints.org.
Funding
This study was supported by National Health and Medical Research Council (NHMRC) Program grant (10915693) to S.P., and Ideas grant (2029883) to S.M., Medical Research Future Fund (MRFF) (GHFMCDI000002) Accelerated Research Stem Cell grant to SP. and S.M. and MRFF Genomic Health Futures Mission Project Grant to S.M. and S.P. and project funding by RogCon, Inc.
Data and Code Availability
The code and GUI are available on request.
Acknowledgments
The Florey Institute of Neuroscience and Mental Health acknowledges the strong support from the Victorian Government and in particular the funding from the Operational Infrastructure Support Grant.
Competing Interests
Steven Petrou is an equity holder of RogCon, Inc. and Praxis Precision Medicine, Inc., Cambridge, MA, USA.
References
- Kim, J.; Koo, B.-K.; Knoblich, J.A. Human Organoids: Model Systems for Human Biology and Medicine. Nature Reviews Molecular Cell Biology 2020, 21, 571–584. [Google Scholar] [CrossRef] [PubMed]
- Di Lullo, E.; Kriegstein, A.R. The Use of Brain Organoids to Investigate Neural Development and Disease. Nature Reviews Neuroscience 2017, 18, 573–584. [Google Scholar] [CrossRef] [PubMed]
- Takahashi, K.; Tanabe, K.; Ohnuki, M.; Narita, M.; Ichisaka, T.; Tomoda, K.; Yamanaka, S. Induction of Pluripotent Stem Cells from Adult Human Fibroblasts by Defined Factors. Cell 2007, 131, 861–872. [Google Scholar] [CrossRef] [PubMed]
- Qian, X.; Nguyen, H.N.; Song, M.M.; Hadiono, C.; Ogden, S.C.; Hammack, C.; Yao, B.; Hamersky, G.R.; Jacob, F.; Zhong, C.; et al. Brain-Region-Specific Organoids Using Mini-Bioreactors for Modeling ZIKV Exposure. Cell 2016, 165, 1238–1254. [Google Scholar] [CrossRef] [PubMed]
- Centeno, E.G.Z.; Cimarosti, H.; Bithell, A. 2D versus 3D Human Induced Pluripotent Stem Cell-Derived Cultures for Neurodegenerative Disease Modelling. Mol Neurodegener 2018, 13, 27. [Google Scholar] [CrossRef]
- Koo, B.; Choi, B.; Park, H.; Yoon, K.J. Past, Present, and Future of Brain Organoid Technology. Mol Cells 2019, 42, 617–627. [Google Scholar] [CrossRef]
- Mao, M.; Mattei, C.; Rollo, B.; Byars, S.; Cuddy, C.; Berecki, G.; Heighway, J.; Pachernegg, S.; Menheniott, T.; Apted, D.; et al. Distinctive In Vitro Phenotypes in iPSC-Derived Neurons From Patients With Gain- and Loss-of-Function SCN2A Developmental and Epileptic Encephalopathy. The Journal of Neuroscience 2024, 44. [Google Scholar] [CrossRef]
- Ovchinnikov, D.A.; Jong, S.; Cuddy, C.; Scheffer, I.E.; Maljevic, S.; Petrou, S. Generation of an iPSC Line (FINi001-A) from a Girl with Developmental and Epileptic Encephalopathy Due to a Heterozygous Gain-of-Function p.R1882Q Variant in the Voltage-Gated Sodium Channel Nav1.2 Protein Encoded by the SCN2A Gene. Stem Cell Research 2023, 71, 103179. [Google Scholar] [CrossRef]
- Paulsen, B.; Velasco, S.; Kedaigle, A.J.; Pigoni, M.; Quadrato, G.; Deo, A.J.; Adiconis, X.; Uzquiano, A.; Sartore, R.; Yang, S.M.; et al. Autism Genes Converge on Asynchronous Development of Shared Neuron Classes. Nature 2022, 602, 268–273. [Google Scholar] [CrossRef]
- Urresti, J.; Zhang, P.; Moran-Losada, P.; Yu, N.-K.; Negraes, P.D.; Trujillo, C.A.; Antaki, D.; Amar, M.; Chau, K.; Pramod, A.B.; et al. Cortical Organoids Model Early Brain Development Disrupted by 16p11.2 Copy Number Variants in Autism. Molecular Psychiatry 2021, 26, 7560–7580. [Google Scholar] [CrossRef]
- Camões dos Santos, J.; Appleton, C.; Cazaux Mateus, F.; Covas, R.; Bekman, E.P.; da Rocha, S.T. Stem Cell Models of Angelman Syndrome. Front. Cell Dev. Biol. 2023, 11. [Google Scholar] [CrossRef] [PubMed]
- Velasco, S.; Kedaigle, A.J.; Simmons, S.K.; Nash, A.; Rocha, M.; Quadrato, G.; Paulsen, B.; Nguyen, L.; Adiconis, X.; Regev, A.; et al. Individual Brain Organoids Reproducibly Form Cell Diversity of the Human Cerebral Cortex. Nature 2019, 570, 523–527. [Google Scholar] [CrossRef]
- von Bartheld, C.S.; Bahney, J.; Herculano-Houzel, S. The Search for True Numbers of Neurons and Glial Cells in the Human Brain: A Review of 150 Years of Cell Counting. Journal of Comparative Neurology 2016, 524, 3865–3895. [Google Scholar] [CrossRef]
- Brémond, C.; Chane, C.; Clouchoux, C.; Histace, A. Recent Trends and Perspectives in Cerebral Organoids Imaging and Analysis. Frontiers in Neuroscience 2021, 15. [Google Scholar] [CrossRef]
- Kassis, T.; Hernandez-Gordillo, V.; Langer, R.; Griffith, L.G. Orgaquant: Human Intestinal Organoid Localization and Quantification Using Deep Convolutional Neural Networks. Scientific Reports 2019, 9, 12479. [Google Scholar] [CrossRef]
- Gritti, N.; Lim, J.L.; Anlaş, K.; Pandya, M.; Aalderink, G.; Martínez-Ara, G.; Trivedi, V. MOrgAna: Accessible Quantitative Analysis of Organoids with Machine Learning. Development 2021, 148. [Google Scholar] [CrossRef]
- Hasnain, Z.; Fraser, A.K.; Georgess, D.; Choi, A.; Macklin, P.; Bader, J.S.; Peyton, S.R.; Ewald, A.J.; Newton, P.K. OrgDyn: Feature- and Model-Based Characterization of Spatial and Temporal Organoid Dynamics. Bioinformatics 2020, 36, 3292–3294. [Google Scholar] [CrossRef]
- Deininger, L.; Jung-Klawitter, S.; Mikut, R.; Richter, P.; Fischer, M.; Karimian-Jazi, K.; Breckwoldt, M.O.; Bendszus, M.; Heiland, S.; Kleesiek, J.; et al. An AI-Based Segmentation and Analysis Pipeline for High-Field MR Monitoring of Cerebral Organoids. Scientific Reports 2023, 13, 21231. [Google Scholar] [CrossRef]
- Paşca, A.M.; Sloan, S.A.; Clarke, L.E.; Tian, Y.; Makinson, C.D.; Huber, N.; Kim, C.H.; Park, J.-Y.; O’Rourke, N.A.; Nguyen, K.D.; et al. Functional Cortical Neurons and Astrocytes from Human Pluripotent Stem Cells in 3D Culture. Nature Methods 2015, 12, 671–678. [Google Scholar] [CrossRef]
- Sloan, S.A.; Darmanis, S.; Huber, N.; Khan, T.A.; Birey, F.; Caneda, C.; Reimer, R.; Quake, S.R.; Barres, B.A.; Paşca, S.P. Human Astrocyte Maturation Captured in 3D Cerebral Cortical Spheroids Derived from Pluripotent Stem Cells. Neuron 2017, 95, 779–790.e6. [Google Scholar] [CrossRef]
- Masselink, W.; Reumann, D.; Murawala, P.; Pasierbek, P.; Taniguchi, Y.; Bonnay, F.; Meixner, K.; Knoblich, J.A.; Tanaka, E.M. Broad Applicability of a Streamlined Ethyl Cinnamate-Based Clearing Procedure. Development 2019, 146. [Google Scholar] [CrossRef] [PubMed]
- Albanese, A.; Swaney, J.M.; Yun, D.H.; Evans, N.B.; Antonucci, J.M.; Velasco, S.; Sohn, C.H.; Arlotta, P.; Gehrke, L.; Chung, K. Multiscale 3D Phenotyping of Human Cerebral Organoids. Scientific Reports 2020, 10, 21487. [Google Scholar] [CrossRef] [PubMed]
- Qian, X.; Song, H.; Ming, G.-L. Brain Organoids: Advances, Applications and Challenges. Development 2019, 146. [Google Scholar] [CrossRef]
- Berger, E.; Magliaro, C.; Paczia, N.; Monzel, A.S.; Antony, P.; Linster, C.L.; Bolognin, S.; Ahluwalia, A.; Schwamborn, J.C. Millifluidic Culture Improves Human Midbrain Organoid Vitality and Differentiation. Lab Chip 2018, 18, 3172–3183. [Google Scholar] [CrossRef]
- Qian, X.; Su, Y.; Adam, C.D.; Deutschmann, A.U.; Pather, S.R.; Goldberg, E.M.; Su, K.; Li, S.; Lu, L.; Jacob, F.; et al. Sliced Human Cortical Organoids for Modeling Distinct Cortical Layer Formation. Cell Stem Cell 2020, 26, 766–781.e9. [Google Scholar] [CrossRef]
- Teng, Y.; Zhao, Z.; Tasnim, F.; Huang, X.; Yu, H. A Scalable and Sensitive Steatosis Chip with Long-Term Perfusion of in Situ Differentiated HepaRG Organoids. Biomaterials 2021, 275, 120904. [Google Scholar] [CrossRef]
- Mansour, A.A.; Gonçalves, J.T.; Bloyd, C.W.; Li, H.; Fernandes, S.; Quang, D.; Johnston, S.; Parylak, S.L.; Jin, X.; Gage, F.H. An in Vivo Model of Functional and Vascularized Human Brain Organoids. Nature Biotechnology 2018, 36, 432–441. [Google Scholar] [CrossRef]
- Rambani, K.; Vukasinovic, J.; Glezer, A.; Potter, S.M. Culturing Thick Brain Slices: An Interstitial 3D Microperfusion System for Enhanced Viability. Journal of Neuroscience Methods 2009, 180, 243–254. [Google Scholar] [CrossRef]
- Garcez, P.P.; Loiola, E.C.; Madeiro da Costa, R.; Higa, L.M.; Trindade, P.; Delvecchio, R.; Nascimento, J.M.; Brindeiro, R.; Tanuri, A.; Rehen, S.K. Zika Virus Impairs Growth in Human Neurospheres and Brain Organoids. Science 2016, 352, 816–818. [Google Scholar] [CrossRef]
- Qian, X.; Nguyen, H.N.; Song, M.M.; Hadiono, C.; Ogden, S.C.; Hammack, C.; Yao, B.; Hamersky, G.R.; Jacob, F.; Zhong, C.; et al. Brain-Region-Specific Organoids Using Mini-Bioreactors for Modeling ZIKV Exposure. Cell 2016, 165, 1238–1254. [Google Scholar] [CrossRef]
- Krenn, V.; Bosone, C.; Burkard, T.R.; Spanier, J.; Kalinke, U.; Calistri, A.; Salata, C.; Rilo Christoff, R.; Pestana Garcez, P.; Mirazimi, A.; et al. Organoid Modeling of Zika and Herpes Simplex Virus 1 Infections Reveals Virus-Specific Responses Leading to Microcephaly. Cell Stem Cell 2021, 28, 1362–1379.e7. [Google Scholar] [CrossRef] [PubMed]
- Matus, A.; Bernhardt, R.; Bodmer, R.; Alaimo, D. Microtubule-Associated Protein 2 and Tubulin Are Differently Distributed in the Dendrites of Developing Neurons. Neuroscience 1986, 17, 371–389. [Google Scholar] [CrossRef] [PubMed]
- Renner, H.; Grabos, M.; Becker, K.J.; Kagermeier, T.E.; Wu, J.; Otto, M.; Peischard, S.; Zeuschner, D.; TsyTsyura, Y.; Disse, P.; et al. A Fully Automated High-Throughput Workflow for 3D-Based Chemical Screening in Human Midbrain Organoids. eLife 2020, 9. [Google Scholar] [CrossRef] [PubMed]
- Zhong, S.; Zhang, S.; Fan, X.; Wu, Q.; Yan, L.; Dong, J.; Zhang, H.; Li, L.; Sun, L.; Pan, N.; et al. A Single-Cell RNA-Seq Survey of the Developmental Landscape of the Human Prefrontal Cortex. Nature 2018, 555, 524–528. [Google Scholar] [CrossRef]
- Stachowiak, E.K.; Benson, C.A.; Narla, S.T.; Dimitri, A.; Chuye, L.E.B.; Dhiman, S.; Harikrishnan, K.; Elahi, S.; Freedman, D.; Brennand, K.J.; et al. Cerebral Organoids Reveal Early Cortical Maldevelopment in Schizophrenia-Computational Anatomy and Genomics, Role of FGFR1. Translational psychiatry 2017, 7, 6. [Google Scholar] [CrossRef]
- Jorfi, M.; D’Avanzo, C.; Tanzi, R.E.; Kim, D.Y.; Irimia, D. Human Neurospheroid Arrays for in Vitro Studies of Alzheimer’s Disease. Scientific Reports 2018, 8, 2450. [Google Scholar] [CrossRef]
- Yakoub, A.M.; Sadek, M. Development and Characterization of Human Cerebral Organoids: An Optimized Protocol. Cell Transplantation 2018, 27, 393–406. [Google Scholar] [CrossRef]
- Donato, R. S100: A Multigenic Family of Calcium-Modulated Proteins of the EF-Hand Type with Intracellular and Extracellular Functional Roles. The International Journal of Biochemistry & Cell Biology 2001, 33, 637–668. [Google Scholar] [CrossRef]
- Vives, V.; Alonso, G.; Solal, A.C.; Joubert, D.; Legraverend, C. Visualization of S100B-Positive Neurons and Glia in the Central Nervous System of EGFP Transgenic Mice. The Journal of Comparative Neurology 2003, 457, 404–419. [Google Scholar] [CrossRef]
- Bedner, P.; Dupper, A.; Hüttmann, K.; Müller, J.; Herde, M.K.; Dublin, P.; Deshpande, T.; Schramm, J.; Häussler, U.; Haas, C.A.; et al. Astrocyte Uncoupling as a Cause of Human Temporal Lobe Epilepsy. Brain: A Journal of Neurology 2015, 138, 1208–1222. [Google Scholar] [CrossRef]
- Miranda-Negrón, Y.; García-Arrarás, J.E. Radial Glia and Radial Glia-like Cells: Their Role in Neurogenesis and Regeneration. Frontiers in Neuroscience 2022, 16, 1006037. [Google Scholar] [CrossRef] [PubMed]
- Fujiyama, F.; Fritschy, J.M.; Stephenson, F.A.; Bolam, J.P. Synaptic Localization of GABA(A) Receptor Subunits in the Striatum of the Rat. The Journal of Comparative Neurology 2000, 416, 158–172. [Google Scholar] [CrossRef]
- Wang, P.; Eshaq, R.S.; Meshul, C.K.; Moore, C.; Hood, R.L.; Leidenheimer, N.J. Neuronal Gamma-Aminobutyric Acid (GABA) Type A Receptors Undergo Cognate Ligand Chaperoning in the Endoplasmic Reticulum by Endogenous GABA. Frontiers in Cellular Neuroscience 2015, 9, 188. [Google Scholar] [CrossRef] [PubMed]
- Felts, L.; Kohli, V.; Marr, J.; Schumacher, J.; Schlicker., O. An Introduction to Computational Clearing. https://www.leica-microsystems.com/science-lab/anintroduction- to-computational-clearing/ 2020.
- Schneider, C.A.; Rasband, W.S.; Eliceiri, K.W. NIH Image to ImageJ: 25 Years of Image Analysis. Nat Methods 2012, 9, 671–675. [Google Scholar] [CrossRef] [PubMed]
- Collins, J.A.; Schandi, C.A.; Young, K.K.; Vesely, J.; Willingham, M.C. Major DNA Fragmentation Is a Late Event in Apoptosis. The Journal of Histochemistry and Cytochemistry 1997, 45, 923–934. [Google Scholar] [CrossRef]
- Kroemer, G.; Galluzzi, L.; Vandenabeele, P.; Abrams, J.; Alnemri, E.S.; Baehrecke, E.H.; Blagosklonny, M.V.; El-Deiry, W.S.; Golstein, P.; Green, D.R.; et al. Classification of Cell Death: Recommendations of the Nomenclature Committee on Cell Death 2009. Cell Death Differ 2009, 16, 3–11. [Google Scholar] [CrossRef]
- Lancaster, M.A.; Renner, M.; Martin, C.-A.; Wenzel, D.; Bicknell, L.S.; Hurles, M.E.; Homfray, T.; Penninger, J.M.; Jackson, A.P.; Knoblich, J.A. Cerebral Organoids Model Human Brain Development and Microcephaly. Nature 2013, 501, 373–379. [Google Scholar] [CrossRef]
- Berger, E.; Magliaro, C.; Paczia, N.; Monzel, A.S.; Antony, P.; Linster, C.L.; Bolognin, S.; Ahluwalia, A.; Schwamborn, J.C. Millifluidic Culture Improves Human Midbrain Organoid Vitality and Differentiation. Lab on A Chip 2018, 18, 3172–3183. [Google Scholar] [CrossRef]
- Otsu, N. A Threshold Selection Method from Gray-Level Histograms. IEEE transactions on systems, man, and cybernetics 1979, 9, 62–66. [Google Scholar] [CrossRef]
- Cai, H.; Yang, Z.; Cao, X.; Xia, W.; Xu, X. A New Iterative Triclass Thresholding Technique in Image Segmentation. IEEE Trans Image Process 2014, 23, 1038–1046. [Google Scholar] [CrossRef]
- Nickels, S.L.; Modamio, J.; Mendes-Pinheiro, B.; Monzel, A.S.; Betsou, F.; Schwamborn, J.C. Reproducible Generation of Human Midbrain Organoids for in Vitro Modeling of Parkinson’s Disease. Stem Cell Research 2020, 46, 101870. [Google Scholar] [CrossRef] [PubMed]
- Smits, L.M.; Reinhardt, L.; Reinhardt, P.; Glatza, M.; Monzel, A.S.; Stanslowsky, N.; Rosato-Siri, M.D.; Zanon, A.; Antony, P.M.; Bellmann, J.; et al. Modeling Parkinson’s Disease in Midbrain-like Organoids. npj Parkinson’s Disease 2019, 5, 5. [Google Scholar] [CrossRef] [PubMed]
- Bolognin, S.; Fossépré, M.; Qing, X.; Jarazo, J.; Ščančar, J.; Moreno, E.L.; Nickels, S.L.; Wasner, K.; Ouzren, N.; Walter, J.; et al. 3D Cultures of Parkinson’s Disease-Specific Dopaminergic Neurons for High Content Phenotyping and Drug Testing. Advanced science (Weinheim, Baden-Wurttemberg, Germany) 2019, 6, 1800927. [Google Scholar] [CrossRef]
- Kerr, J.F.R.; Wyllie, A.H.; Currie, A.R. Apoptosis: A Basic Biological Phenomenon with Wideranging Implications in Tissue Kinetics. Br J Cancer 1972, 26, 239–257. [Google Scholar] [CrossRef]
- Monzel, A.S.; Smits, L.M.; Hemmer, K.; Hachi, S.; Moreno, E.L.; van Wuellen, T.; Jarazo, J.; Walter, J.; Brüggemann, I.; Boussaad, I.; et al. Derivation of Human Midbrain-Specific Organoids from Neuroepithelial Stem Cells. Stem cell reports 2017, 8, 1144–1154. [Google Scholar] [CrossRef]
- Wilson, E.S.; Newell-Litwa, K. Stem Cell Models of Human Synapse Development and Degeneration. Molecular Biology of the Cell 2018, 29, 2913–2921. [Google Scholar] [CrossRef]
- Tanaka, Y.; Cakir, B.; Xiang, Y.; Sullivan, G.J.; Park, I.-H. Synthetic Analyses of Single-Cell Transcriptomes from Multiple Brain Organoids and Fetal Brain. Cell reports 2020, 30, 1682–1689.e3. [Google Scholar] [CrossRef]
- Porciúncula, L.O.; Goto-Silva, L.; Ledur, P.F.; Rehen, S.K. The Age of Brain Organoids: Tailoring Cell Identity and Functionality for Normal Brain Development and Disease Modeling. Frontiers in Neuroscience 2021, 15, 674563. [Google Scholar] [CrossRef]
- Dezonne, R.S.; Sartore, R.C.; Nascimento, J.M.; Saia-Cereda, V.M.; Romão, L.F.; Alves-Leon, S.V.; de Souza, J.M.; Martins-de-Souza, D.; Rehen, S.K.; Gomes, F.C.A. Derivation of Functional Human Astrocytes from Cerebral Organoids. Scientific Reports 2017, 7, 45091. [Google Scholar] [CrossRef]
- Wang, D.D.; Bordey, A. The Astrocyte Odyssey. Progress in Neurobiology 2008, 86, 342–367. [Google Scholar] [CrossRef]
- Mariani, J.; Coppola, G.; Zhang, P.; Abyzov, A.; Provini, L.; Tomasini, L.; Amenduni, M.; Szekely, A.; Palejev, D.; Wilson, M.; et al. FOXG1-Dependent Dysregulation of GABA/Glutamate Neuron Differentiation in Autism Spectrum Disorders. Cell 2015, 162, 375–390. [Google Scholar] [CrossRef] [PubMed]
- Zayat, V.; Kuczynska, Z.; Liput, M.; Metin, E.; Rzonca-Niewczas, S.; Smyk, M.; Mazurczak, T.; Goszczanska-Ciuchta, A.; Leszczynski, P.; Hoffman-Zacharska, D.; et al. The Generation of Human iPSC Lines from Three Individuals with Dravet Syndrome and Characterization of Neural Differentiation Markers in iPSC-Derived Ventral Forebrain Organoid Model. Cells 2023, 12. [Google Scholar] [CrossRef] [PubMed]
- Djuric, U.; Zadeh, G.; Aldape, K.; Diamandis, P. Precision Histology: How Deep Learning Is Poised to Revitalize Histomorphology for Personalized Cancer Care. NPJ Precision Oncology 2017, 1, 22. [Google Scholar] [CrossRef]
- Coudray, N.; Ocampo, P.S.; Sakellaropoulos, T.; Narula, N.; Snuderl, M.; Fenyö, D.; Moreira, A.L.; Razavian, N.; Tsirigos, A. Classification and Mutation Prediction from Non-Small Cell Lung Cancer Histopathology Images Using Deep Learning. Nature Medicine 2018, 24, 1559–1567. [Google Scholar] [CrossRef]
Disclaimer/Publisher’s Note: The statements, opinions and data contained in all publications are solely those of the individual author(s) and contributor(s) and not of MDPI and/or the editor(s). MDPI and/or the editor(s) disclaim responsibility for any injury to people or property resulting from any ideas, methods, instructions or products referred to in the content. |
© 2024 by the authors. Licensee MDPI, Basel, Switzerland. This article is an open access article distributed under the terms and conditions of the Creative Commons Attribution (CC BY) license (http://creativecommons.org/licenses/by/4.0/).
Copyright: This open access article is published under a Creative Commons CC BY 4.0 license, which permit the free download, distribution, and reuse, provided that the author and preprint are cited in any reuse.


