
Submitted:
13 November 2024
Posted:
14 November 2024
You are already at the latest version
Abstract
Enhancing the intelligence of Tiger nut harvesting equipment with the advancement of agricultural machinery is imperative. The conveying and separating device, a critical component of Tiger nut harvesters, faces efficiency issues due to mismatches between excavation feed rate and conveying separation capacities. A visualized Tiger nut harvesting device was designed to address this, incorporating parameters like conveying speed, torque, vibration frequency, and excavation depth. The device comprises a mechanical execution part and an automatic control system, the latter including modules for screw speed, torque, excitation frequency, and excavation depth control. Based on mechanical design analysis, control parameters and methods for each module were defined. An adaptive B-PID controller was proposed for trajectory tracking, combining backstepping and PID. A control model accounting for motion damping and error compensation was derived. Simulink simulations compared B-PID with backstepping controllers, showing B-PID's stable and effective trajectory tracking. Actual experiments assessed mechanical-control coordination using relative error metrics. The results showed that the maximum relative error of rotation speed was 3.8 %, the maximum relative error of frequency was 3.67 %, and the maximum relative error of excavation depth was 1.5 %. Correction models for excavation depth and excitation frequency parameters were established. This study can provide a theoretical basis and support for the intellectualization of Tiger nut harvesting machinery.
Keywords:
tiger nut
; harvester
; transportation separation
; automatic control
; B-PID
1. Introduction
The Tiger nut, scientifically called Cyperus esculentus, represents a multifunctional economic crop that synergistically combines grain, oil, and animal husbandry. Characterized by its well-developed root systems, robust adaptability, and pronounced stress resistance, this species exhibits significant potential for agricultural and ecological applications [1,2,3]. The extensive cultivation of Tiger nuts on a large scale not only facilitates the amelioration of sandy land and the mitigation of wind and sand erosion but also significantly augments farmers' economic revenue, thereby enhancing public living standards [4]. Xinjiang is an important production area for Tiger nuts in China, and harvesting is a crucial step in the production of Tiger nuts [5].
The conveying and separation mechanism constitutes a pivotal core technology within the framework of the Tiger nut harvester, garnering extensive scholarly attention and yielding notable advancements globally. Historically, the pioneering Tiger nut harvester introduced in Spain employed a vibrating screen configuration to separate Tiger nut, a design paradigm that continues to inform contemporary principles of operation [6]. Zhao Zhuang et al. [7] designed a scraper-type Tiger nut conveying device and studied the effects of parameters such as scraper height, width, and spacing on conveying performance. He et al. [8] designed a vibrating chain plate conveying structure and studied the effects of parameters such as vibration frequency and amplitude on soil screening efficiency.
In recent years, a considerable body of research has focused on integrating mechanical components with sensor technology, control algorithms, and other advanced methodologies to enhance the intelligence of agricultural production processes [9,10,11,12,13]. Cheng Pengfei et al. [14] used a distance sensor to collect the thickness signal of potato chunks during transportation. After being processed by a PLC control system, the program automatically controlled the frequency converter to adjust the frequency converter motor, achieving the constant sorting flow rate requirement for potato cleaning equipment. Chen Zhiwei et al. [15] built a measurement and control system for the Tiger nut separation and cleaning test bench, which achieved precise speed control, essential test data acquisition, feeding system control, and other functional requirements. According to the requirements of the test bench, the PID control algorithm was added to the blower speed control to achieve the goal of precise control. Lou Xiuhua et al. [16] proposed a dual objective joint control strategy and control algorithm. They built a corn joint harvester cleaning control system, achieving a cleaning loss rate of 2.7% and an impurity rate of 2.8%. Shangguan Zechao et al. [17] designed a corn harvester monitoring and control system based on STM32 and implemented fuzzy PID control for nonlinear control systems. Wei Dexin et al. [18] developed an online monitoring system for the cleaning loss of corn kernel harvesters. The average cleaning loss rates measured by the monitoring system were 1.41%, 1.58%, and 1.83% at working speeds of 0.8, 1.0, and 1.2 m/s, respectively. Mirzazadeh et al. [19] developed a grain cleaning system for combined harvesters and proposed an RSM model for the cleaning grain harvesting system. They determined the optimal conditions for grain particles to pass through the upper and upper screens: feed rate of 3.33 kg/s, fan speed of 742 rpm, aperture of 10mm, and ideal value of 0.84.
Based on the above research, aiming at the problems of low efficiency caused by the mismatch between the amount of digging feed and the amount of conveying separation in the existing Tiger nut harvesting and conveying separation device, we designed a Tiger nut harvesting and conveying separation device, which can realize the functions of visualization and adjustment of operating parameters such as conveying speed, conveying torque, vibration frequency and digging depth. A torque sensor and dip angle sensor were used to obtain parameters such as auger torque and digging depth, and the B-PID adaptive controller was applied to track and detect the digging depth trajectory. On this basis, the relative error was finally taken as the evaluation index. The coordination between mechanical execution and automatic control was tested to support the development of intelligent harvesting technology and equipment for Tiger nuts in the Xinjiang sandy area.
2. Materials and Methods
2.1. Overall Instrument Structure and Working Principle
2.1.1. Overall Instrument Structure
The harvesting and conveying separation device mainly consist of a rotary tillage excavation device, a five-stage screw conveying device, a vibrating screen, an automatic control system, and a frame. Among them, the rotary tillage excavation device mainly comprises rotary tillage blades, shovels, depth-limiting wheels, etc. The five-stage screw device is mainly composed of the first-stage screw, the second-stage screw, the third-stage screw, the fourth-stage screw, and the fifth-stage screw. The vibrating screen mainly comprises a vibrating front screen, a rear screen, and an excitation device. The automatic control system is mainly composed of a screw speed control module, a screw torque detection module, an excitation frequency control module, and an excavation depth detection module. Set the speed and excitation frequency parameters of each level of helical screw through the human-machine interaction interface inside the control box. The screw torque detection module uses torque sensors to measure the torque generated by each level of helical screw during operation. The excavation depth detection module mainly uses the inclination angle of the depth limiting wheel measured by the inclination sensor to calculate the excavation depth of the rotary tiller, thereby reflecting the harvester's material feeding amount per unit of time. The overall structure is shown in Figure 1.
2.1.2. Working Principle
During the operation, the rotary tillage digging device throws the excavated mixture of Tiger nuts, roots, complex, and a large amount of sand into the vibrating screen. It throws the mixture through the axial movement of the same level and the radial movement between the adjacent two levels of the screw. The interaction between the excitation device and the front and rear screen bodies causes the screen bodies to move away from each other. At the same time, the return spring pulls the screen bodies closer, resulting in a reciprocating periodic vibration of the screen bodies. Currently, the lower-monitor PLC receives instructions from the upper-monitor HMI through the IO port to control the speed and excavation depth of the screw and then outputs the specific values of speed and depth to the HMI interface through analog signals.
Under the combined action of spiral conveying and vibrating screen body, the mixture is in a loose state, which is conducive to the discharge of sand in the gaps between the screen strips and to the destruction of the composite's structural state. This promotes the separation of Tiger nuts and roots from the sand. The technical parameters of the harvesting, conveying, and separation test bench are shown in Table 1.
2.2. Design of Screw Conveyor Speed Control Module
2.2.1. Analysis of the Speed Range of Screw Conveyor
In the process of throwing materials such as sand, the speed of the previous stage of the screw determines the feeding line speed of the subsequent stage of the screw. That is, as the speed of the screw increases, the starting throwing line speed increases, as shown in Figure 2. When the starting throwing speed Vc1 is set to a smaller value during the process of throwing sand, due to the gravity of the material itself, a motion trajectory l1 will be formed. The material will not be directly thrown to the axial action zone of the screw, resulting in material accumulation at the lower end of the screw, which is not conducive to transportation. When the throwing speed Vc3 is high, the sand will be thrown to the inner side of the machine cover at the upper end of the screw and rebound and will not fall into the screw for axial movement. Its motion trajectory is l3. When the starting throwing speed Vc2 is a specific value, and between the larger and smaller values, the sand will be thrown into the screw and move axially along with the rotation of the screw, with a motion trajectory of l2. To ensure that a large amount of sand can be thrown into the screw for axial transport, increase the retention time of materials in the screw, and improve the efficiency of sand removal, it is necessary to obtain the motion trajectory line of the material as l2, which requires that the rotation speed of the screw should not be too high or too low. In the later experimental variable selection, the rotation speed of the screw needs to be studied, and the variable range should be selected based on the previous research group's determination that the maximum rotation speed of the screw is 280 r/min [20].
When materials such as sand are thrown into the next-level screw conveyor, there will be an optimal area for material throwing on the next-level screw conveyor. The coordinates of point D are (0,0). To ensure that the material is smoothly thrown into the optimal area of the next level screw, the following conditions must be met.
In the formula, L is the horizontal distance between the material and the screw shaft when it reaches the highest point, 580 mm; H is the vertical distance between the material and the screw shaft when it reaches the highest point is 210-400 mm; For the sieve radius, Rs is 0.254 m; Vx is the X-direction component of the initial velocity of the material; Vy is the Y-direction component of the initial velocity of the material; t is the time it takes for the material to reach the highest point; α is the angle between the machine and the ground, taken as 10 °. σ is the angle between the material throwing speed and the ground, 65.5 °; μ is the friction coefficient between sand and steel, 0.43; Vq is the linear velocity of the material at the edge of the previous screening body; Vc is the initial velocity at which the material is thrown out.
Then, the initial velocity of sand particles can be calculated from equation (1) to be 2.5~3.2 m/s. Then, the linear velocity of the material at the edge of the previous screen body is 4.5~5.7 m/s. According to equation (2), to get the minimum rotational speed of the screw is 169 r/min. Due to the actual screen body and the screw, there is a gap filled with a large amount of sand and soil and other mixtures, so the actual operation process will cause the reduction of the material at point B linear velocity to achieve the target linear velocity, the minimum value of the rotational speed of the screw should be greater than 169 r/min.
The variables vq, n and Rs are defined as follows:
vq is the linear velocity of the material at the edge of the previous screen body, m/s; n is the rotational speed of the screw shaft, r/min; Rs is the rotational radius of the screen mesh, m.
2.2.2. Screw Speed Control System
When the screw device is working, the operator first selects the required screw speed on the HMI. The upper computer HMI transmits instructions to the lower computer PLC via a communication signal. Upon receipt of the signal, the PLC transmits the instruction to adjust the frequency converter, which then adjusts the speed of the motor by modifying the frequency of the motor's working power supply, thereby achieving the desired regulation of the rotational speed of the screw. The corresponding flow chart is presented in Figure 3.
The screw speed control device mainly includes a touch screen, PLC, motor, inverter, and other hardware. Tiger nut mainly grows on sandy soil, dusty in the harvest; therefore, check the relevant research [21,22,23]; according to the harvesting equipment, the working environment must be isolated from the outside world to choose a resistive touch screen to ensure the regular operation of the equipment: comprehensive price, functional and environmental requirements, and the MT6071IQ resistive touch screen selection. PLC selection should be combined with the actual needs of the work, according to the number of input/output ports (I/O), the number of functional modules required, the working environment, processing speed, and other needs to choose from. After reviewing the relevant literature [24,25,26,27,28], the actual work needs of the Tiger nut harvester are used to select the ES2 host of the DVP series of DELTA. The PLC connects to the HMI through the RS422 port, connects to the six frequency converters through the RS485 communication port, and connects to the analog expansion module through the communication line. In the operation process, mainly through the screw conveying vibration screening after the removal of Tiger nut, straw, etc., to facilitate the control and reliable operation, the selection of the YE3 series of three-phase induction motors. Combined with the actual needs of Tiger nut harvesting equipment, choose Canroon's CV900G series frequency converter, which can be used to adjust the frequency of the drive motor.
2.3. Torque Detection Module for Screw
2.3.1. Modal Analysis of Screw Structure
The screw mainly consists of a screw shaft and left-rotating and right-rotating spiral blades welded together, the screw is made of Q235 material, and the surface of the screw shaft is treated with a blackening process. In the Tiger nut, root, and soil mixture for conveying, high-speed rotation of the screw shaft and blade easy to produces vibration, and the whole machine in the work of vibrating screen screening process will also cause vibration of screw parts. Resonance will cause fatigue damage to structural components, affecting the normal efficiency of the screw and prone to cause accidents. Therefore, the modal analysis of the screw was carried out by using Workbench software, and the first six natural frequencies of the screw were obtained. The maximum displacement deformation of the screw shaft and the spiral blade at different frequencies was analyzed, and its safety and design rationality were tested. Imported the screw model completed by SolidWorks software into Workbench software, set the model material as Q235, and meshed the screw model, resulting in a total of 257,001 nodes and 105,018 units. The constraint was added at the bearing installation at both ends of the screw shaft, and the first six modes were selected for solution. The numerical simulation results are shown in Figure 4 and Table 2.
It can be seen from Table 3 that the first six natural frequencies of the screw were 116.94 ~ 264.53 Hz, and the displacement deformation was 8.179 ~ 23.44 mm. The sixth-order mode has the highest natural frequency (264.53 Hz), while the fifth-order mode has the largest displacement deformation (23.44 mm). Each natural frequency has its corresponding vibration mode. The intensity distribution of vibration in each part and its vibration response under the corresponding mode. In the first six natural frequencies of the screw, the values between the adjacent two natural frequencies were very close. The natural frequencies corresponding to each other were only different in the vibration direction, and the shape of the vibration mode was very similar. It can be seen from Figure 4 that the vibration of the screw was mainly the bending deformation of the center of the screw shaft and the spiral blade. Under the conditions of the first, second, fifth, and sixth-order vibration modes, the maximum deformation of the screw was located at the outermost end of the spiral blade. Under the conditions of the third and fourth-order vibration modes, the maximum deformation was located at the center of the screw shaft.
The pre-determined screw rotational speed of 280 r/min to the intrinsic frequency formula f = n / 60 to solve the screw work excitation frequency of 4.67 Hz. A comparison of the simulation results and theoretical analysis results shows that the excitation frequency of the work of the screw is far less than the screw of the first six orders of the vibration pattern of the intrinsic frequency, which indicates that the work will not resonate; the design is reasonable.
2.3.2. Torque Measuring System for Screw
The screw torque detection is mainly used for the working torque measurement of the five-stage screw. Between the motor and the screw device, the torque sensor is installed through two couplings, and its overall structure is shown in Figure 5. The torque sensor measures the working torque of the screw device. It displays it in the human-computer interface to assist in analyzing the working status of the screw in the vibrating screen. In the human-computer interface, the start and stop of the screw can be controlled by buttons, and the torque value of all levels of screw operation can be obtained in real-time.
The lower computer of this system chose the ES2 PLC of the DVP series from DELTA company, the upper computer chose the MT6071IQ resistive touch screen from Willcom Technology Co., Ltd., and the DY-300N Bengbu torque sensor was selected for measuring the operating torque of the screw. The HMI interface mainly includes the operation status module, parameter setting module, etc., which can be used to adjust rotational speed and torque detection. It is written by DOPSoft software. The interface is shown in Figure 6.
2.4. Excitation Frequency Control System
The vibrating screen is mainly composed of the front screen, back screen, vibration generator, connecting rod, etc., in which the front screen and back screen are welded by the sieve bar, ribbed plate, connected with the frame through the connecting rod, vibration generator, including the exciter, vibration roller, spring and so on. The front and rear screens are equipped with an exciter roller, mainly driven by the screen body away from the exciter movement. In contrast, the two-screen body connected by the spring plays a role in the screen body reset, close to the exciter movement, and the vibrating screen body structure schematic diagram is shown in Figure 7. According to the characteristics of feeding the mixture of large mass and screening to remove sand and soil operation requirements, the cam design process needs to consider the two aspects of high speed and heavy load to improve the vibration frequency. The excitation cam is designed as a four-circular arc cam, taking into account the screen body-only stroke requirements to ensure that the shaker in contact with the excitation roller is smooth and stable, the design of the excitation roller contour for the circumference of the excitation process of the cam in the ascending stage of the movement of the cam motion in the uplift phase of the excitation process is sinusoidal accelerating motion.
The operation of a vibrating screen entails the exciter, which is driven by the power shaft, rotating and simultaneously displacing the vibration roller away from the exciter's movement. This results in the sieve body moving away from the exciter, forcing the front. The screen and the back sieve are transitioned from a static state to a state of motion when a certain distance is traversed. At this point, the spring resets the front screen and the back sieve, thereby initiating the reciprocating vibration of the sieve body. The vibration of the sieve body effectively separates Tiger nuts, roots, sand, and other mixtures. The material is loosened, with sand falling into the sieve bar gap and ultimately being removed from the system.
In selecting the screen body's amplitude and vibration frequency parameters, large amplitude and low frequency were selected for screening materials with large particle sizes and vice versa. Small amplitude and high frequency were selected for screening materials with small particle sizes [29]. The excitation frequency control system outputs commands through the IO port of the PLC to realize the control of the motor speed, and then through the adjustment of the motor, the speed of the excitation cam and eccentric wheel was controlled. Since the screening material was mainly sand and soil, small amplitude and high frequency were selected. Papers [30,31,32,33] indicated that the vibration frequency was set to 7 Hz for the intermediate test level value in the Tiger nut and castor clearing process.
In contrast, a paper [34] reported that the maximum vibration frequency value was 9 Hz in the potato soil separation process. This was relevant for cases where the sieve mesh aperture diameter was small and for sandy materials with fine particle sizes. Combined with the Tiger nut harvesting process, the sand and soil separation requirements, and the results of the pre-experimentation, the maximum vibration frequency parameter value was determined to be 9 Hz. The maximum value of the vibration frequency parameter was 9 Hz, and 7 Hz was taken as the intermediate level for selecting experimental variable factors in the later stage.
2.5. Digging Depth Detection Module
2.5.1. Determination of Digging Depth Parameters
Tiger nut-root-sandy soil complex is one of the objects used in harvesting implement geometry and basic parameters such as the size of the complex need to be determined. In the Tiger nut harvest period, using the five-point method to select the test area, 1 m × 1 m area of the Tiger nut-root-sandy soil complex sampling, the use of vernier calipers (maximum measurement length: 150 mm, measurement accuracy: 0.02 mm), steel tape measure (maximum measurement length: 5000 mm, measurement accuracy: 1 mm) to determine the complex stalk diameter, stalk height, stubble growth depth, growth width, and other dimensional parameters, while determining the quality of the complex, the quality of sand in the complex, as well as the quality of the Tiger nut, roots and soil. At the same time, the mass of the composite, the mass of sand and soil in the composite, and the mass of Tiger nut and roots were determined. The composite's mass ratio of sand and soil and Tiger nut and roots were calculated respectively. The results showed that the average value of the composite stalk diameter was 5.2±0.77 mm, the height of the stalk was 84±4.53 mm, the depth of growth of the composite was 114±3.47 mm. The width of the composite was 162±7.02 mm. For this reason, it was found that the average value of the composite stalk diameter was 5.2±0.77 mm. 7.02 mm, for this reason, to ensure the low damage excavation of Tiger nut, the excavation depth of the machine needs to be more than 120 mm in the process of operation.
2.5.2. Digging Depth Detection System
When the harvester works, the rotary cutter cuts into the ground to plow, and the depth of the digging depth is controlled by the depth-limiting wheel. The depth-limiting wheel contacts the ground, and the reaction force generated with the ground lifts the front end of the harvester (i.e., the rotary tillage device) upward through the support bar. Currently, the inclination sensor on the support bar detects the angle α between the support bar and the ground. The angle information is converted into an electrical signal by the transmitter, which is transmitted to the controller, and the plowing depth of the rotary tillage knife, h, is calculated by using the geometric mathematical model that has already been established for plowing depth and the angle of the angle and transmitted back to the human-machine interactive interface, which is transmitted back to the human-computer interface. The geometric relationship is shown in Figure 8.
The digging depth detection system hardware structure includes the entry inclination sensor, rotary tillage knife, depth limiting wheel, and frame. The entry inclination sensor adopts LCA318T, which mainly measures the digging depth of the rotary tiller. The soil inclination sensor is connected to the PLC's analog input and output ports. When digging depth detection is carried out, the test bar is first zeroed on the HMI interface, and then the value is read, as shown in Figure 9.
2.5.3. B-PID-based Nonlinear Excavation Depth Trajectory Tracking and Regulation System
2.5.3.1. Principle of the Control System
- 1)
- Lyapunov stability theory
In the active domain , an actual number δ > 0 exists for the system for any chosen actual number ε > 0. An equilibrium state is said to be stable in the sense of Lyapunov when it satisfies (3) and when the solutions from any x0 satisfies (4) [35,36,37].
In actual engineering problems, if the equilibrium state xe is stable in the sense of Lyapunov and the stable state xe is perturbed, it will eventually converge to xe. According to Lyapunov’s second law, i.e., it reaches the Lyapunov’s function V is positive definite, and is negative definite.
- 2)
- Barbalat's lemma
Barbalat's lemma is commonly used for nonautonomous systems in nonlinear systems [38,39]. Suppose a continuously derivable function f(t), as t tends to infinity, has a finite number of limit values, and the derivative of f(t) is uniformly continuous. In that case, the derivative of f(t) tends to zero as t tends to infinity.
- 3)
- PID control principle
PID is one of the most used control algorithms in automatic control systems, in which the proportional control P outputs a proportional amount of control according to the size of the error between the controlled quantity and the set value. Increasing the proportion can shorten the adjustment time but will increase the overshooting amount. Integral control I outputs the control quantity according to the integral value of the error, which can eliminate the static error of the system but will increase the overshooting quantity and regulation time. Differential control D outputs the control quantity according to the negative value of the rate of change of the error, which can reduce the amount of overshot and the regulation time but will increase the system jitter for noise and other disturbances. The following equation can express the principle of action of the PID controller.
where U(t) denotes the control quantity, e(t) denotes the error, Kp denotes the proportionality coefficient, Ki denotes the integration coefficient, and Kd denotes the integration coefficient.
2.5.3.2. Structure of the Control System
In this paper, the digging depth detection device is modeled as follows. Where the mass of the digging depth detection device is m, the input driving force F is I, the displacement y1 is y, and the velocity y2 is . Since the soil friction force on the detection device is a nonlinear force positively correlated with the velocity y2 when detecting the digging depth [40], to facilitate the calculations, this paper assumes that the friction force f = cy23, where c is the scale factor. According to Newton's second law, the following mathematical model can be established.
This paper proposes using a backstepping method in conjunction with PID control design to develop a controller for a depth regulation system in excavation. The following section will provide a detailed explanation of this process. Assuming an ideal scenario where the operational displacement of the depth detection mechanism is denoted as y1d, the displacement error is represented by e1, and a Lyapunov function V1 is defined for the displacement setting, the subsequent relationship can be derived as follows.
By taking the derivatives of V1 and e1, the following relationship can be obtained.
Assuming that in an ideal state, the operating speed of the digging depth detection device is denoted by y2d, and the velocity error is represented by e2, if a Lyapunov function V2 is defined for the displacement error and the velocity error, the following relationships can be derived.
At this point, can be rewritten in the following form.
According to Lyapunov's second method, if the system is to achieve equilibrium at this stage, the following relationship must be satisfied.
Herein, k1 is an arbitrary non-zero constant. At this stage, differentiating e2 yields the following relationship.
Differentiating V2 with respect to its variable yields the following relationship.
According to Lyapunov's second method, for the system to achieve equilibrium at this stage, the following conditions must be satisfied.
Herein, k2 represents an arbitrary non-zero constant. Through simplification, the following equation can be obtained.
Given that the proportionality coefficient c is an indeterminate constant, it is therefore stipulated that the actual value of c in the present context is denoted as the indeterminate constant . Consequently, the error and its corresponding derivative are expressed as follows.
A Lyapunov function V3 is established for the displacement error, velocity error, and proportionality coefficient error. The derivative of this Lyapunov function, denoted as , yields the following equation.
According to Barbalat's Lemma, the following relationship can be derived.
Integrating equation (24) yields the following relationship.
Rearranging the above equation yields the following relationship.
Up to this point, the design of the digging depth trajectory tracking controller has been completed. The construction of its Simulink simulation model is illustrated in Figure 10.
2.5.3.3. Simulation Experiment
This section will conduct a validation to verify the effectiveness of the proposed method. Considering that the excavation depth device operates in a highly nonlinear underground environment, this study employs modules within MATLAB software's Simulink to input displacements, including sinusoidal and random displacements, for a comparative analysis between the proposed B-PID controller and the backstepping controller without PID integration. The objective is to observe the tracking performance of both controllers for trajectory y1. The simulation results are shown in Figure 11 and Figure 12.
As shown in Figure 11, for the sinusoidal motion curve, the B-PID controller exhibits better robustness concerning position tracking accuracy compared to the backstepping controller without PID integration. Its fluctuations are more stable during changes in the curve. The backstepping controller without PID integration shows relatively unstable tracking performance at 5 seconds, 15 seconds, 25 seconds, 35 seconds, 45 seconds, and 55 seconds, with noticeable deviations. As shown in Figure 12, the B-PID controller and the backstepping controller demonstrate strong robustness for trajectories generated by random white noise. Simulation results indicate that, compared to other controllers, the B-PID controller has significant tracking accuracy and robustness advantages.
3. Experiment and Result Analysis
In May 2023, practical tests are conducted in the Soil Channel Performance Laboratory of the School of Mechanical and Electrical Engineering at Shihezi University to evaluate the control modules for the screw speed of the conveying and separating device, the detection module for excavation depth, and the control module for vibration frequency. The test materials, including the Tiger nut-root-sand complexes, are sourced from the Tiger nut planting base of the Second Company, 54th Regiment, Third Division of the Xinjiang Production and Construction Corps. Before the tests, the soil in the soil channel test area is leveled and compacted using the flatting device, sprinkler device, and compaction device that are part of the soil channel test rig. The Tiger nut-root-sand complex materials are also laid out in the soil channel test area according to the planting pattern.
The experimental instruments and equipment primarily include the Soil Channel Test Vehicle (TCC-3.0), the tachometer (testo 470), a ruler, a shovel, and other tools. The device used in the experiment is a self-constructed conveying and separating device for Tiger nut harvesting, as depicted in Figure 13.
3.1. Rotational Speed Measurement of Helical Screw
The Tiger nut harvesting, conveying, and separation device employs a multi-stage conveying screw combined with a vibrating screen system. The first stage conveying screw feeds on a mixture of Tiger nut, sand, and other materials excavated by the rotary tillage and digging device, characterized by the highest mass of conveyed materials. The second stage conveying screw processes the mixture after the first-stage screw has removed some of the sand. The third stage conveying screw, primarily ensures the conveyance of Tiger nut while simultaneously removing sand. In the design of this stage, considerations must be made regarding the potential damage to Tiger nuts.
Given that the three-stage conveying screws have different operating objects and functions, their rotational speeds are designed to decrease progressively: the first-stage screw has the highest speed, the second-stage screw has the next highest speed, and the third-stage screw has the lowest speed. The fourth and fifth stage conveying screws mainly serves to remove residual sand and complete the conveyance of Tiger nut. The rotational speeds of the third, fourth, and fifth stage conveying screws are set to be consistent.
The rotational speed ratios between the first, second, and third stage conveying screws were set at 0.8, 0.9, and 1, respectively. After the equipment operated usually, the rotational speeds of each stage’s screw were measured using a tachometer. The results are shown in Table 3. According to the table, when the screw rotational speed ratios were 0.8, 0.9, and 1, the relative errors between the theoretical and measured values were 3.80%, 1.76%, and 2.49%, respectively. All relative errors are below 5%, meeting the requirements.
3.2. Excavation Depth Testing
During the testing process, adjustments to the excavation depth were made on the HMI interface by inputting values of 129mm, 127mm, 125mm, 123mm, and 121mm, respectively. Five test points were selected within the test area, and the excavation depth was measured using a ruler at each point. Each set of measurements was repeated three times, and the average values were recorded. The results are presented in Table 4. As indicated by the table, the relative errors at the five test points were 0.4%, 0.3%, 1.5%, 1.4%, and 0.9%, respectively, with the maximum relative error being 1.5%, which meets the requirements. Additionally, a scatter plot was created with the theoretical values of the excavation depth on the x-axis and the measured values on the y-axis, and a mathematical relationship approximation curve was fitted to the data points. The resulting mathematical relationship between the theoretical and measured values is y=1.115x-15.555, with R² value of 0.9768, indicating the reliability of the correction model.
3.3. Excitation Frequency Test
Adjust the rotational speed of the exciter drive motor to 126 r/min, 108 r/min, 105 r/min, 120 r/min, and 135 r/min on the HMI. By substituting the screw speed into the natural frequency calculation formula f=n / 60, it can be determined that the excitation frequencies are 8.4 Hz, 7.2 Hz, 7 Hz, 8 Hz, and 9 Hz, respectively. Utilizing a high-speed camera (TS4100LR3C8512), the excitation process of the exciter cam on the front and rear screens was recorded. The motion of the front and rear screens was analyzed using the high-speed video dynamic analysis software Xcitex ProAnalyst 2023, obtaining the number of vibrations per minute of the screen body, i.e., the excitation frequency of the screen body. Each experiment was repeated three times, and the average value was taken. Since the exciter structure consists of four circular arc cams, the excitation frequencies of the front and rear screens are consistent. The experimental results show that the relative errors at the five test points are 1.19%, 2.78%, 1.57%, 0.75%, and 3.67%, respectively, with the maximum relative error being 3.67%, below 5%, meeting the requirements.
Additionally, the theoretical values of the excitation frequency were taken as the x-axis, and the measured values as the y-axis. A scatter plot formed by these values was subjected to mathematical relationship curve fitting. The mathematical relationship between the theoretical and measured values after fitting is given by the equation y=0.9408x+0.3092, with R² value of 0.9852, indicating the reliability of the correction model.

Table 5.
Excitation frequency test results.
| Serial Number | 1 | 2 | 3 | 4 | 5 |
|---|---|---|---|---|---|
| Theoretical Value/Hz | 8.4 | 7.2 | 7 | 8 | 9 |
| Measured Value/ Hz | 8.3 | 7 | 6.89 | 7.94 | 8.67 |
| Relative Error/% | 1.19 | 2.78 | 1.57 | 0.75 | 3.67 |
4. Conclusions
(1) Aiming at the issue of low efficiency caused by the mismatch between the digging feed rate and the conveying separation rate in the harvesting of Tiger nut in the Xinjiang sandy area and based on the trend of intellectualization in the mechanical equipment for Tiger nut harvesting, a visualizing device for controlling screw speed, screw torque, vibration frequency, and digging depth was designed. This device includes mechanical execution parts and an automatic control system, laying a foundation for enhancing the intelligence level of Tiger nut harvesting equipment.
(2) An adaptive controller combining backstepping and PID (B-PID) was proposed for tracking and detecting digging depth, and a control model considering motion damping and displacement error compensation was derived. To evaluate the performance of the proposed controller, Simulink simulations were conducted, comparing the B-PID controller with other controllers. Comparative experimental results indicate that the B-PID model provides effective trajectory tracking control performance for digging depth tracking detection.
(3) Module testing experiments were conducted on the Tiger nut harvesting and conveying separation device. The experimental results show that in the screw speed test, when the screw speed ratio is 0.8, 0.9, and 1, the relative errors between theoretical and measured values are 3.80%, 1.76%, and 2.49%, respectively; in the digging depth test, the relative errors at five test points are 0.4%, 0.3%, 1.5%, 1.4%, and 0.9%, with the maximum relative error being 1.5%; in the vibration frequency test, the relative errors at five test points are 1.19%, 2.78%, 1.57%, 0.75%, and 3.67%, with the maximum relative error being 3.67%. Based on these results, correction models for digging depth and vibration frequency parameter control were established.
Author Contributions
Conceptualization, J.Q. and S.C.; methodology, J.Q., J.G., S.C. and J.F.; investigation, J.Q. and J.G.; data curation, J.Q. and J.G.; formal analysis, J.Q., J.G. and W.C.; writing-original draft, J.Q.; writing-review and editing, J.Q., S.C., J.G., W.C., H.M. and Z.M.; project administration, J.Q.; funding acquisition, J.Q. , H.M. and Z.M.; All authors have read and agreed to the published version of the manuscript.
Funding
This research was funded by the Jiangsu Province Agricultural Equipment and Intelligent High-tech Research Key Laboratory Open Fund Project, grant number: MAET202313, the Corps science and technology plan project, grant number: 2024DB016, and the Science and Technology Research Project of Shihezi University, grant number: KJGG202404.
Data Availability Statement
The data presented in this study are available on request from the corresponding author.
Acknowledgments
The authors would like to thank Engineering Research Center for Production Mechanization of Oasis Special Economic Crop, Ministry of Education for its support.
Conflicts of Interest
The authors declare no conflict of interest.
References
- SUN, R; ZHONG, P; LIU, Z. D ; GAO, H.J ; WANG, R.D ; LI, W ; YOU, H.Y ; SONG, X.Y ; WANG, X.L. Research Progress on Stress Resistance of Tiger nut Under Abiotic Stress. Feed and Feeding. 2023, 5, 32–35. [Google Scholar]
- Wang, R.Y.; Wang, X.S.; Xiang, H. A multi-purpose novel oil crop—Tiger nuts. China Oils Fats. 2019, 44, 1–4. [Google Scholar]
- Zhao, X.Q.; Liu, H.; Lu, Z.Y.; Cheng, Y.C.; Zhang, D.J.; Bai, F.F.; Fang, J.; Ren, Y.F. Cultivation technology of windbreak and sand fixation of Tiger nut on desertified and degraded land. Mod. Agric. 2019, 6, 12–13. [Google Scholar]
- L, Ding; H. Q, Guo; W.Z, Wang; Z.J, Lv; Y.L, Lv; R.K, Zhang. Design and experiment of low-set hole metering device for Cyperus esculentus nest-eye metering wheel. Transactions of the Chinese Society of Agricultural Machinery 2022, 53, 86–97. [Google Scholar]
- YANG, X.D; LI, Z.Y. Tiger nut industry in China: current status of development, potential and adaptive suggestions. Chinese Journal of Oil Crop Sciences. 2022, 44, 712–717. [Google Scholar]
- Di, Z.F; Li, Q. L ; Jiang, W ;et al. Research advance and perspective of Tiger nut planting and harvesting machinery technology and equipment. Journal of Shanxi Agricultural University(Natural Science Edition). 2022, 42, 96–106. [Google Scholar]
- Zhao, Z; He,X. N ; Wang, D.W ; Shang, S.Q ; Xu, N ; Zhu, H ; Zheng, X.S. Design and Test of Intermediate Conveying Device for Cyperus esculentus Combine Harvester. Journal of Agricultural Mechanization Research 2023, 45, 172–176. [Google Scholar]
- He, X.; Lv, Y.; Qu, Z.; etc. Parameters Optimization and Test of Caterpillar Self-Propelled Tiger Nut Harvester Hoisting Device. Agriculture 2022, 12, 1060. [Google Scholar] [CrossRef]
- Liu, J.; Zhao, S.; Li, N.; Faheem, M.; Li, P. Development and field test of an autonomous strawberry plug seeding transplanter for use in elevated cultivation. Applied Engineering in Agriculture, 2019; 35, 1067–1078. [Google Scholar]
- Ji, X.; Wei, X.; Wang, A.; Cui, B.; Song, Q. A novel composite adaptive terminal sliding mode controller for farm vehicles lateral path tracking control. Nonlinear Dyn 2022, 110, 2415–2428. [Google Scholar] [CrossRef]
- Song, Zhiqiang; Du, Chuanxing; Chen, Yongcheng; Han, Dianle; Wang, Xinzhong. Development and test of a spring-finger roller-type hot pepper picking header. Journal of Agricultural Engineering 2024, 55. [Google Scholar] [CrossRef]
- Du, C.; Fang, W.; Han, D.; Chen, X.; Wang, X. Design and Experimental Study of a Biomimetic Pod-Pepper-Picking Drum Based on Multi-Finger Collaboration. Agriculture 2024, 14, 314. [Google Scholar] [CrossRef]
- Du, Chuanxing; Han, Dianlei; Song, Zhiqiang; Chen, Yongcheng; Wang, Xinzhong. Calibration of contact parameters for complex shaped fruits based on discrete element method: The case of pod pepper (Capsicum annuum). Biosystems Engineering 2023, 226, 43–54. [Google Scholar] [CrossRef]
- P.F, Cheng. Research on intelligent control and parameter optimization of potato cleaning equipment. Master’s Thesis, Shandong University of Technology, China, 2017.
- Z.W, Chen. Research on Measurement and Control System of Cyperus esculentus Separation and Cleaning Test Bench. Master’s Thesis, Jilin Agricultural University, China, 2022.
- Lou, Xiuhua; Li, Maofeng; Du, Yuefeng; Mao, Enrong; Fu, Lei. Design and Experiment of Cleaning Control System for Corn Combine Harvester. Chinese Journal of Agricultural Machinery Chemistry 2024, 45, 1–8. [Google Scholar]
- Z.C, Shangguan. Development of monitoring and control system for corn harvester based on STM32. Master’s Thesis, Jinan University, China, 2023.
- D.X, Wei. Research and Design of Online Monitoring System for Cleaning Loss of Corn Kernel Harvester. Master’s Thesis, Chinese Academy of Agricultural Sciences, China, 2023.
- Mirzazadeh, A.; Abdollahpour, S.; Hakimzadeh, M. Optimized Mathematical Model of a Grain Cleaning System Functioning in a Combine Harvester using Response Surface Methodology. Acta Technol Agr 2022, 25, 20–26. [Google Scholar] [CrossRef]
- Qi, J.; Gao, J.; Chen, H.K.Z. Parameter Optimization of a Conveying and Separating Device Based on a Five-Stage Screw and Vibrating Screen for Tiger Nut Harvesters. Agriculture https://www.mdpi.com/2077-0472/14/5/682. 2024, 14. [Google Scholar] [CrossRef]
- Francois, M.; Osiurak, F.; Fort, A.; etc. Automotive HMI design and participatory user involvement: Review and perspectives. Ergonomics 2016, 60, 541–552. [Google Scholar] [CrossRef]
- Obeidat, M.S.; Rababa, M.M.; Tyfour, W.R. Effects of vehicle's human machine interface devices on driving distractions. Theor Iss Ergon Sci 2021, 1-21. https://search.library.wisc.edu/article/cdi_proquest_journals_2705211303.
- Jordan, N.; Louis, H.; Eugénie, A.; Julien, C. Influence of human-machine interactions and task demand on automation selection and use. Ergonomics 2018, 1-39. https://europepmc.org/article/MED/30010501.
- Mellado, J.; Núez, F. Design of an IoT-PLC: A containerized programmable logical controller for the industry 4.0. Journal of Industrial Information Integration 2021, 25, 100250. [Google Scholar] [CrossRef]
- M. G, Ioannides. Design and implementation of PLC-based monitoring control system for induction motor. IEEE Transactions on Energy Conversion 2004, 19, 469–476. [Google Scholar] [CrossRef]
- S.X, Wu; J.S, Li. Research on PLC selection in the design of basic automation control system. Town Water Supply 2022, 7. https://qikan.cqvip.com/Qikan/Article/Detail?id=7107493089.
- Yulin, D.; Chunjiao, Z. Design and research of embedded PLC development system. In 2011 3rd International Conference on Computer Research and Development; 2011; https://ieeexplore.ieee.org/document/5764286.
- Guo, L.; Pecen, R. Design Projects in a Programmable Logic Controller (PLC) Course in Electrical Engineering Technology. Technology Interface Journal 2009. https://idc-online.com/technical_references/pdfs/electrical_engineering/001.pdf.
- Y.F, Cheng. Structural optimization design and modal analysis of linear vibrating screen. Master’s Thesis, Taiyuan University of Technology, China, 2014. https://kns.cnki.net/KCMS/detail/detail.aspx?dbcode=CMFD&filename=1014418437.
- J. M, Hou; Z.T, Ren; H.J, Zhu. Design and test of double-layer inclined vibrating air-screen castor cleaning device. Transactions of the Chinese Society of Agricultural Machinery 2022, 53, 39–51. [Google Scholar]
- X. S, Zheng; S.Q, Shang; D.W, Wang; etc. Design analysis and test of air-screen type oil sedge cleaning device. Journal of Agricultural Mechanization Research 2024, 159, 146–153. [Google Scholar]
- J, Zeng. Research on vibrating screen driven by eccentric cam mechanism. Master’s Thesis, Southwest Petroleum University, China, 2019.
- T. H, Xu. A comparative study on the efficiency of vibration screening parameters based on EDEM. Southern Agricultural Machinery 2024, 55, 166–168. [Google Scholar]
- T.C, Jin. Development of potato mechanized harvest potato soil vibration separation test bench. Master’s Thesis, Shenyang Agriculture university, China, 2023.
- Khalil, H.K. Lyapunov Stability. Control Systems, Robotics and Automation 2010. https://eolss.net/Sample-Chapters/C18/E6-43-21-05.pdf.
- Nguyen, N.T. Lyapunov Stability Theory. Model-Reference Adaptive Control. Advanced Textbooks in Control and Signal Processing. Springer, Cham, 2018. pp. 47–81. [CrossRef]
- Shevitz, D.; Paden, B. Lyapunov stability theory of no smooth systems. IEEE Transactions on Automatic Control, 1994. https://ieeexplore.ieee.org/document/317122.
- Wu, Z.; Xia, Y.; Xie, X. Stochastic Barbalat's Lemma and Its Applications. IEEE Transactions on Automatic Control 2012, 57, 1537–1543. [Google Scholar] [CrossRef]
- Farkas, B.A.S.W. Variations on Barbălat's lemma. The American Mathematical Monthly 2016, 123(8), 825–830. [Google Scholar] [CrossRef]
- Lamarque, C.H.; Bernardin, F.; Bastien, J. Study of a rheological model with a friction term and a cubic term: deterministic and stochastic cases. European Journal of Mechanics 2005, 24, 572–592. [Google Scholar] [CrossRef]
Figure 1.
The overall structure of the harvesting, conveying, and separation device.
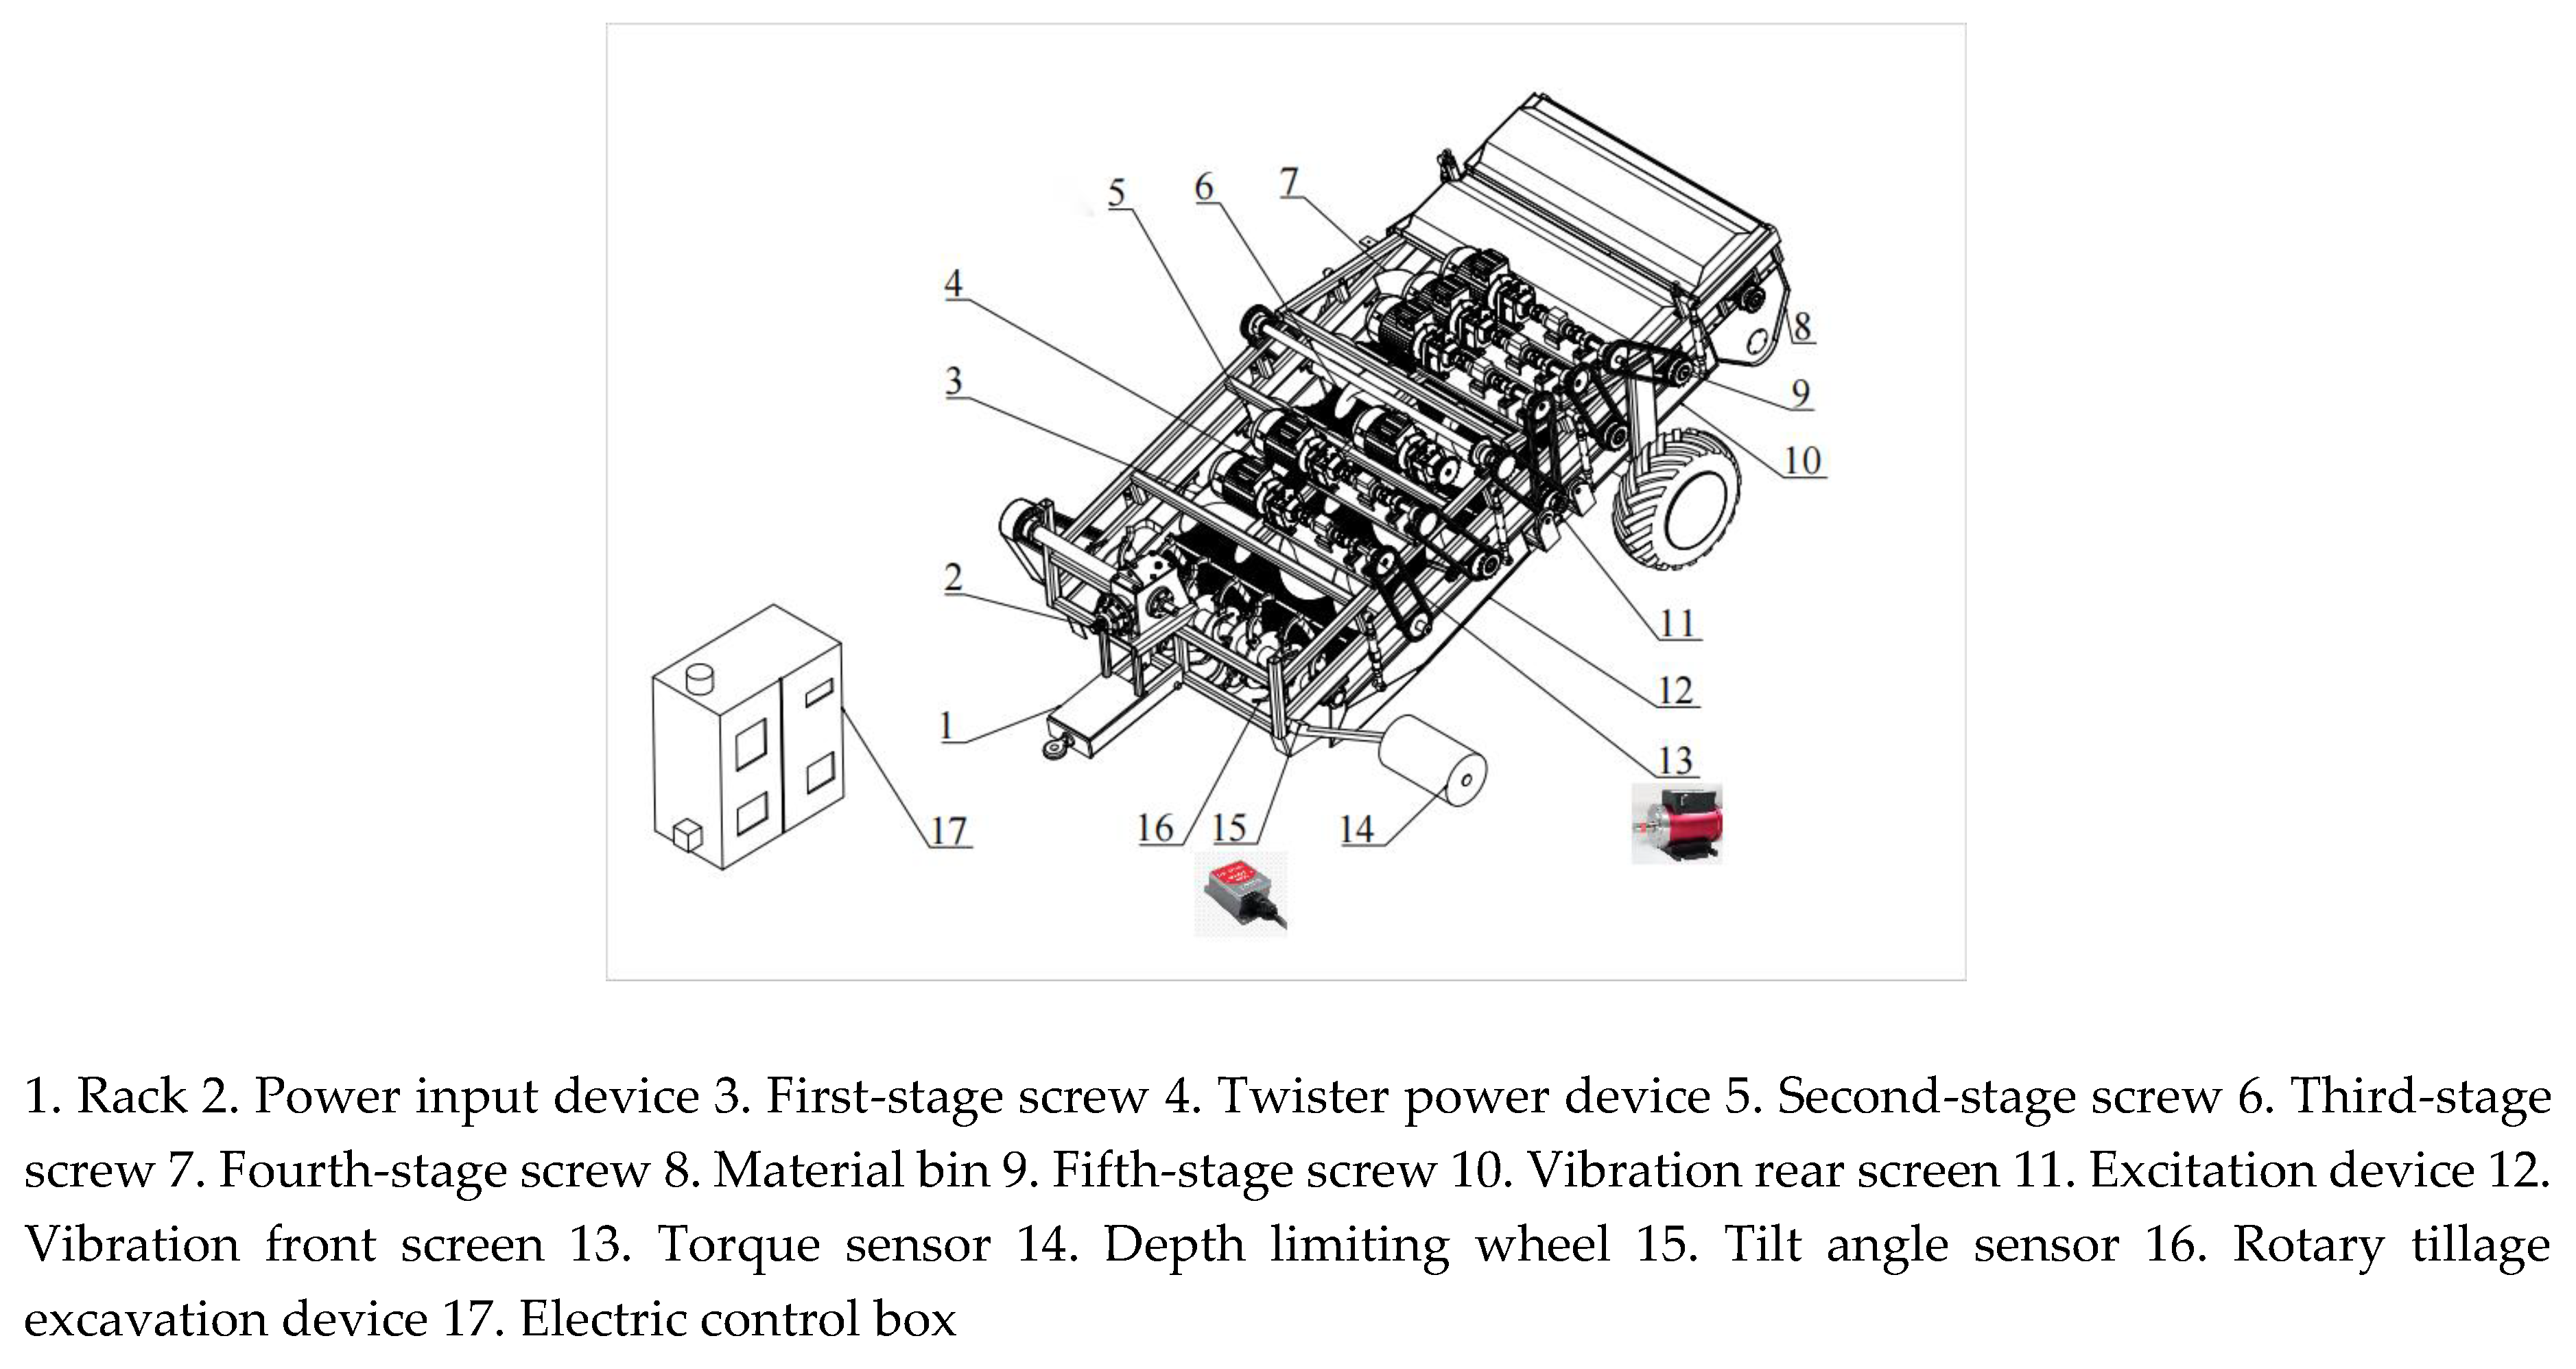
Figure 2.
Analysis of material velocity during the post throwing process.
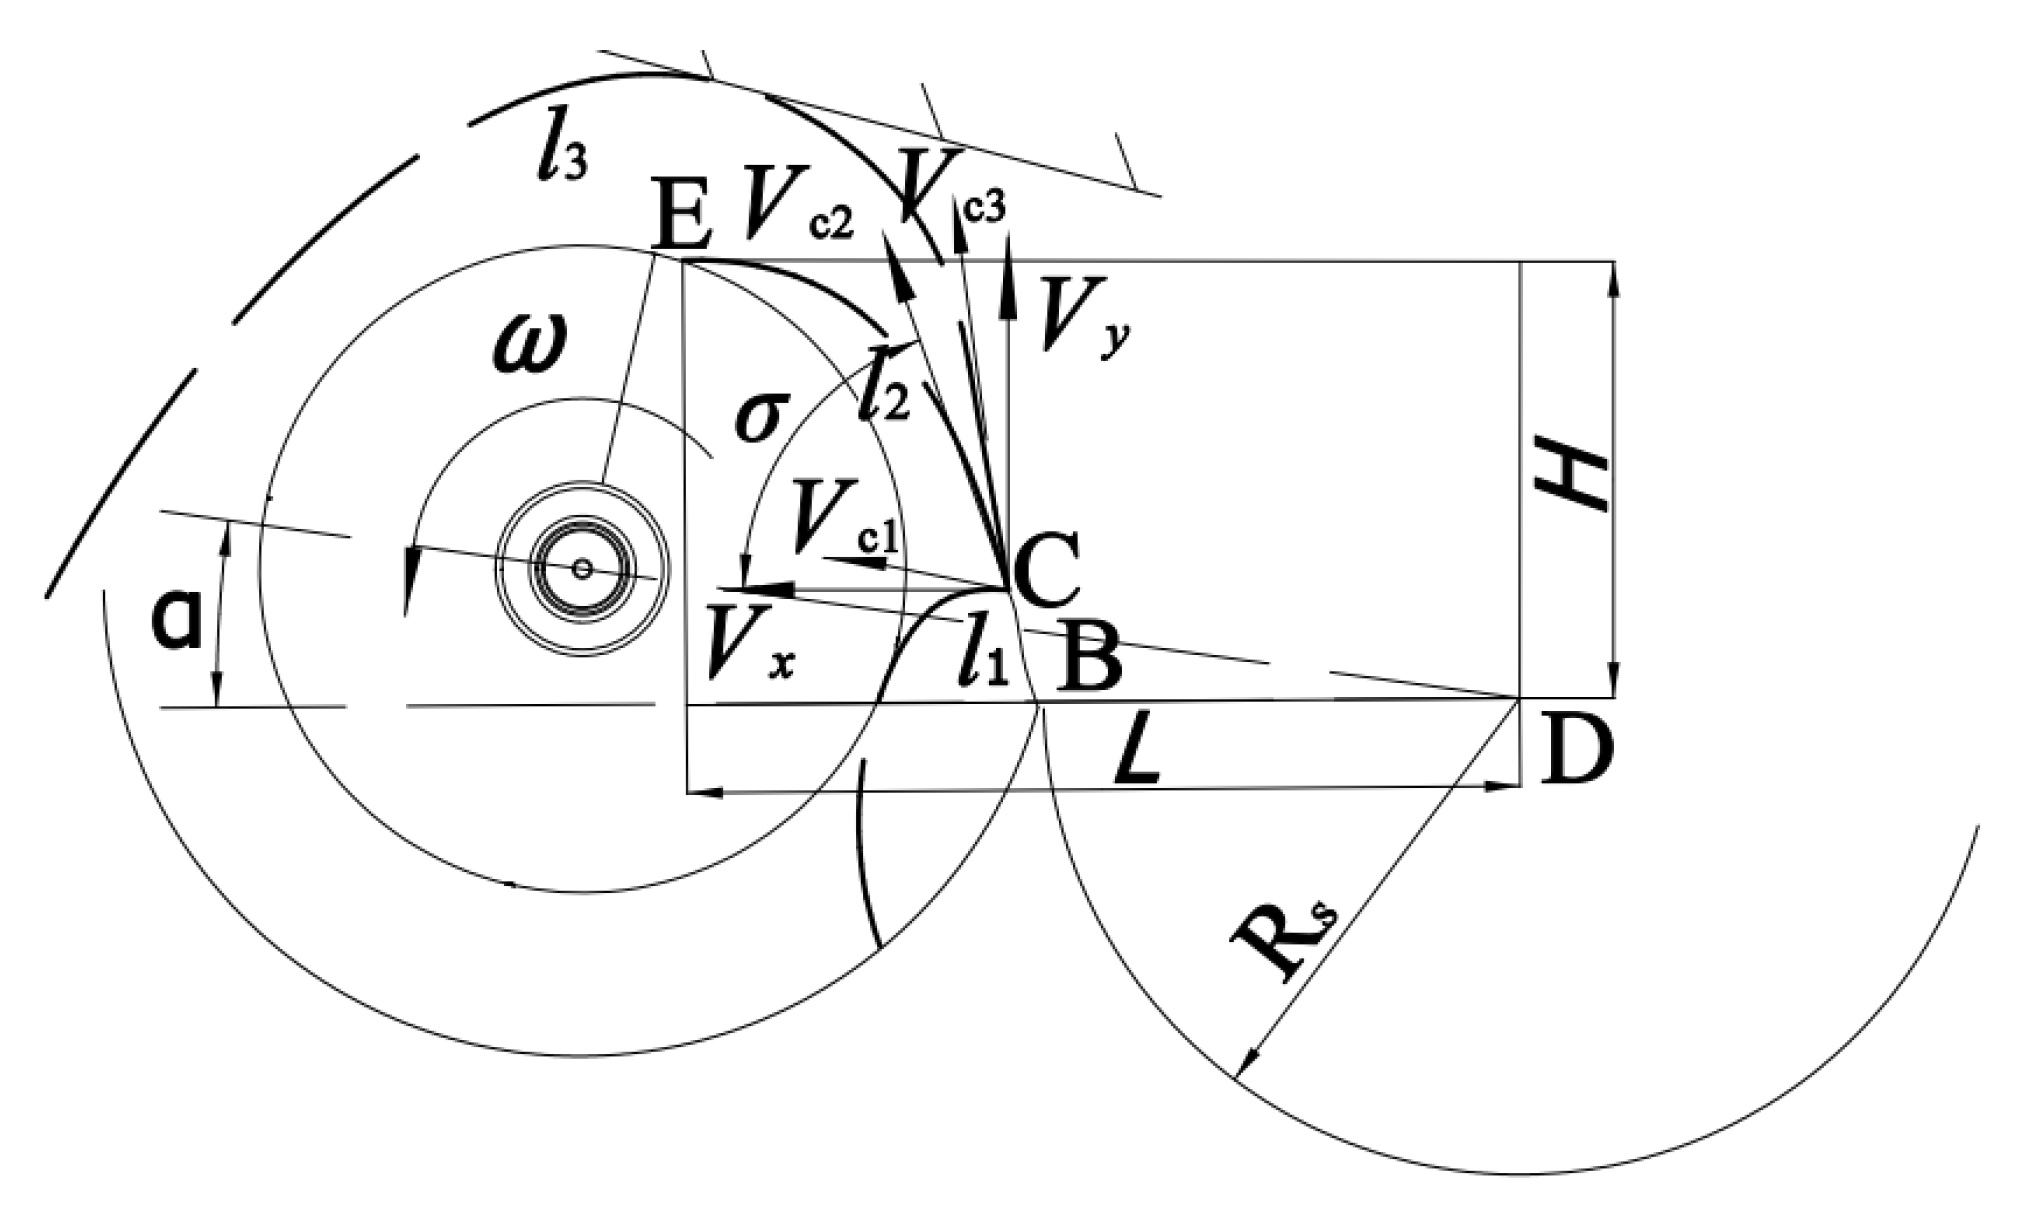
Figure 3.
Screw speed control process.
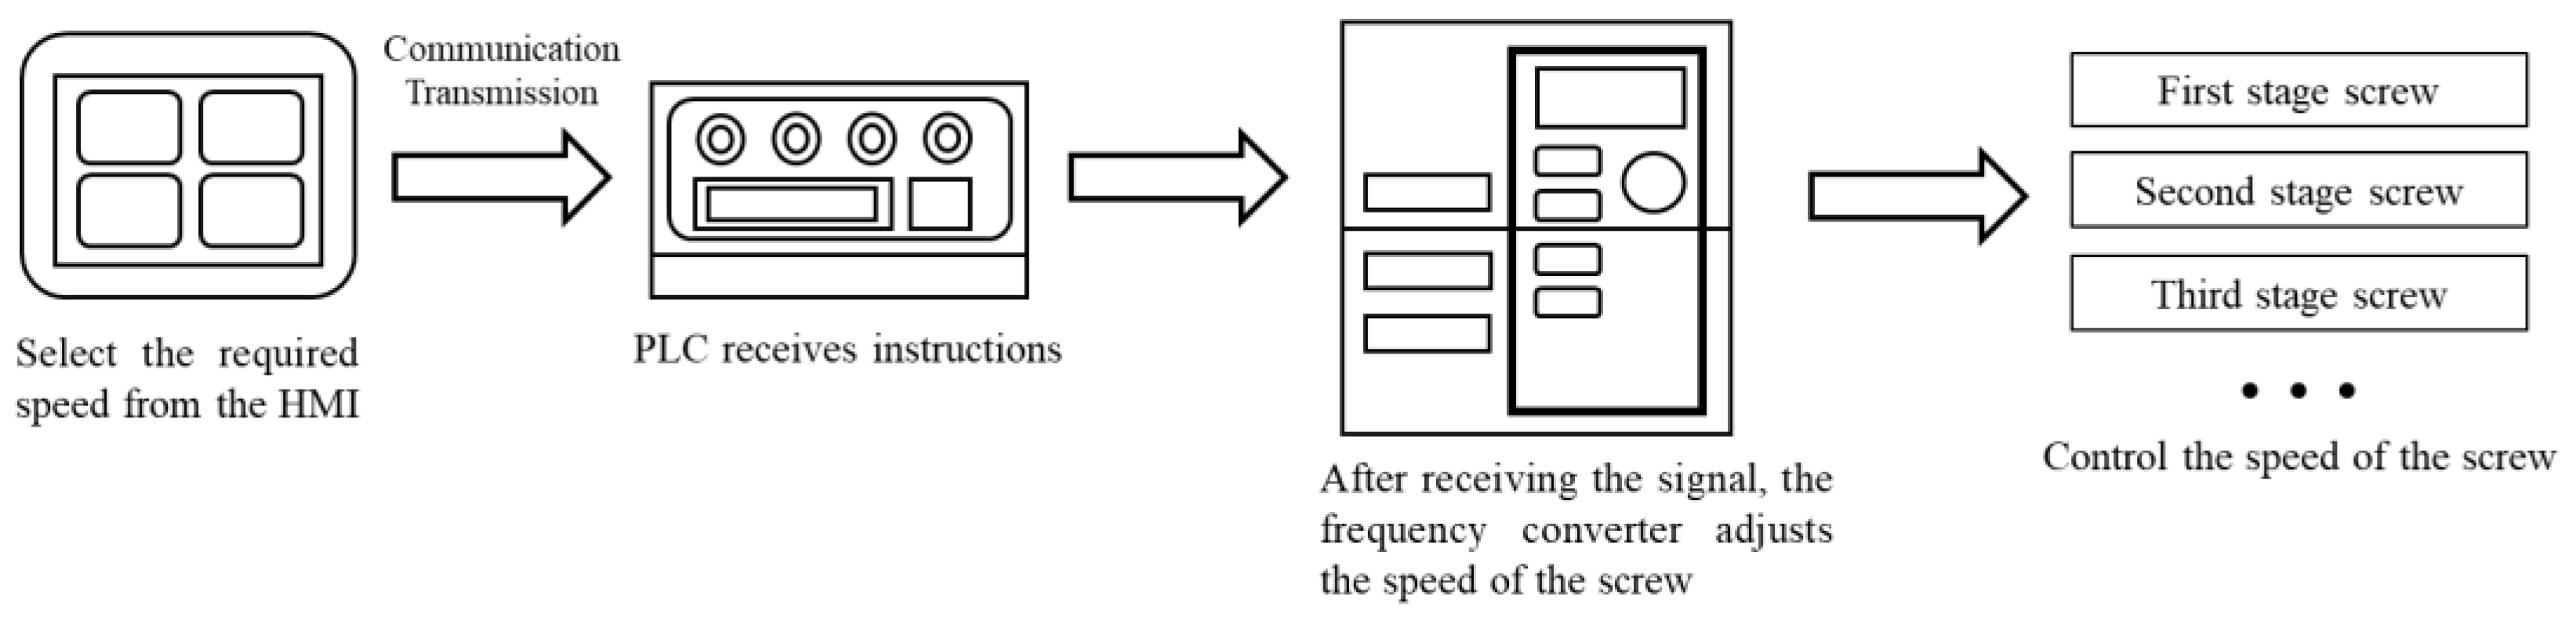
Figure 4.
Modal analysis of the first six orders of vibration of screw. (a) First order; (b) Second order; (c) Third order; (d) Fourth order; (e) Fifth order; (f) Sixth order.
Figure 4.
Modal analysis of the first six orders of vibration of screw. (a) First order; (b) Second order; (c) Third order; (d) Fourth order; (e) Fifth order; (f) Sixth order.
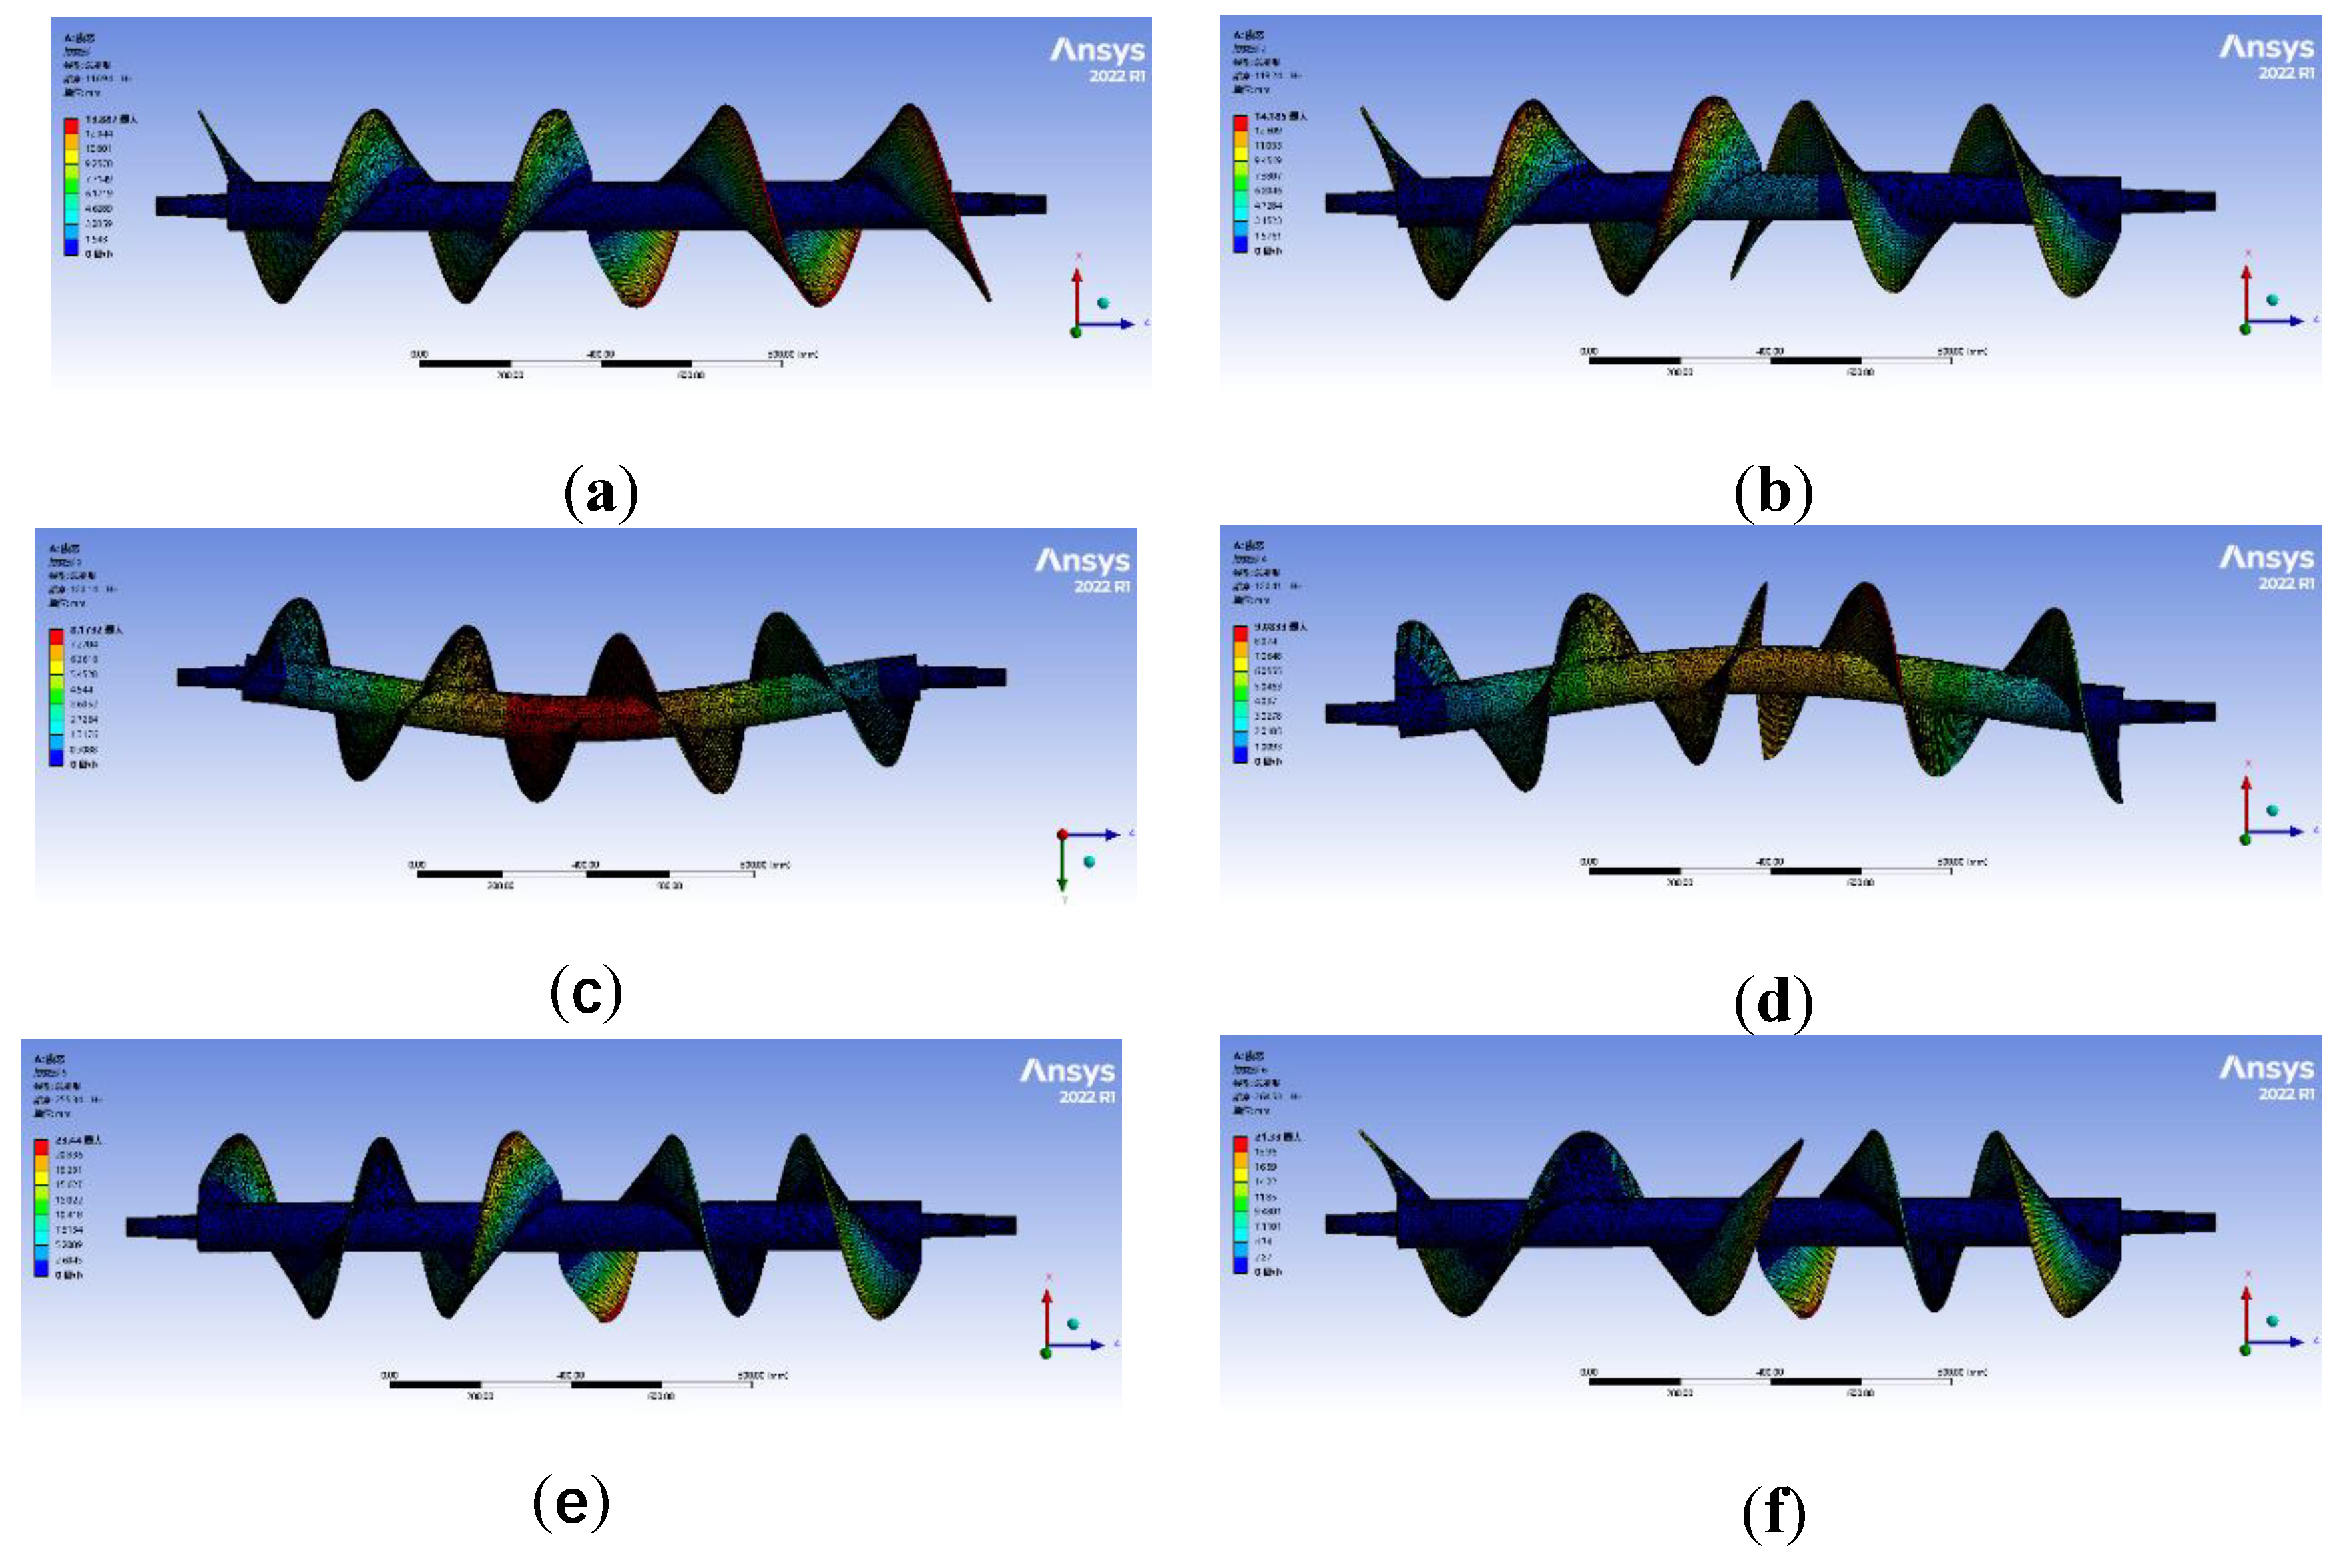
Figure 5.
Hardware structure of screw torque detection system.
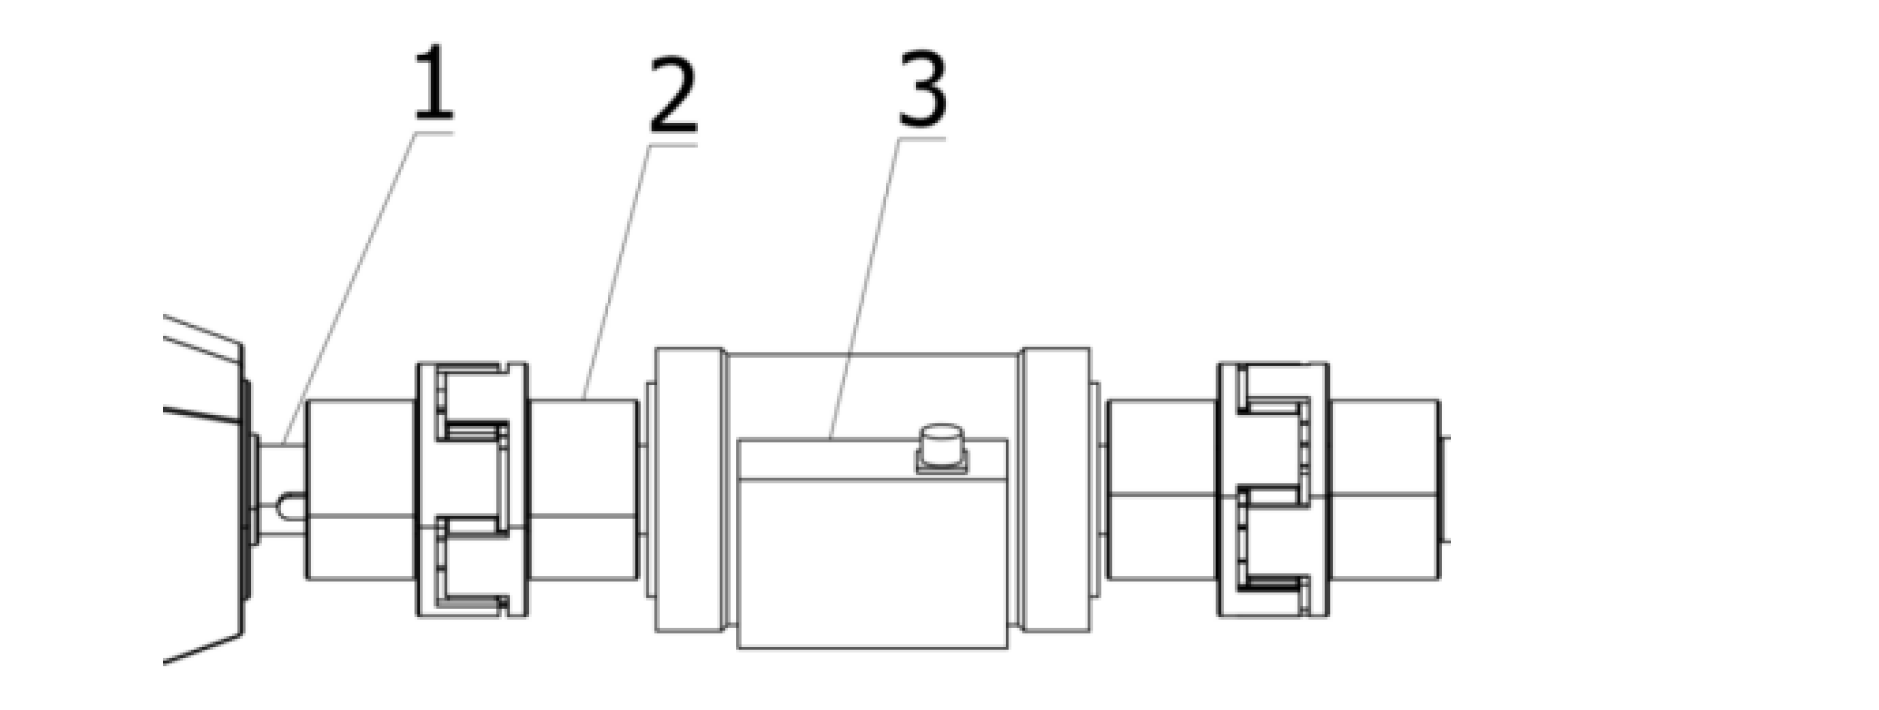

Figure 6.
HMI interface of screw torque and speed detection system.
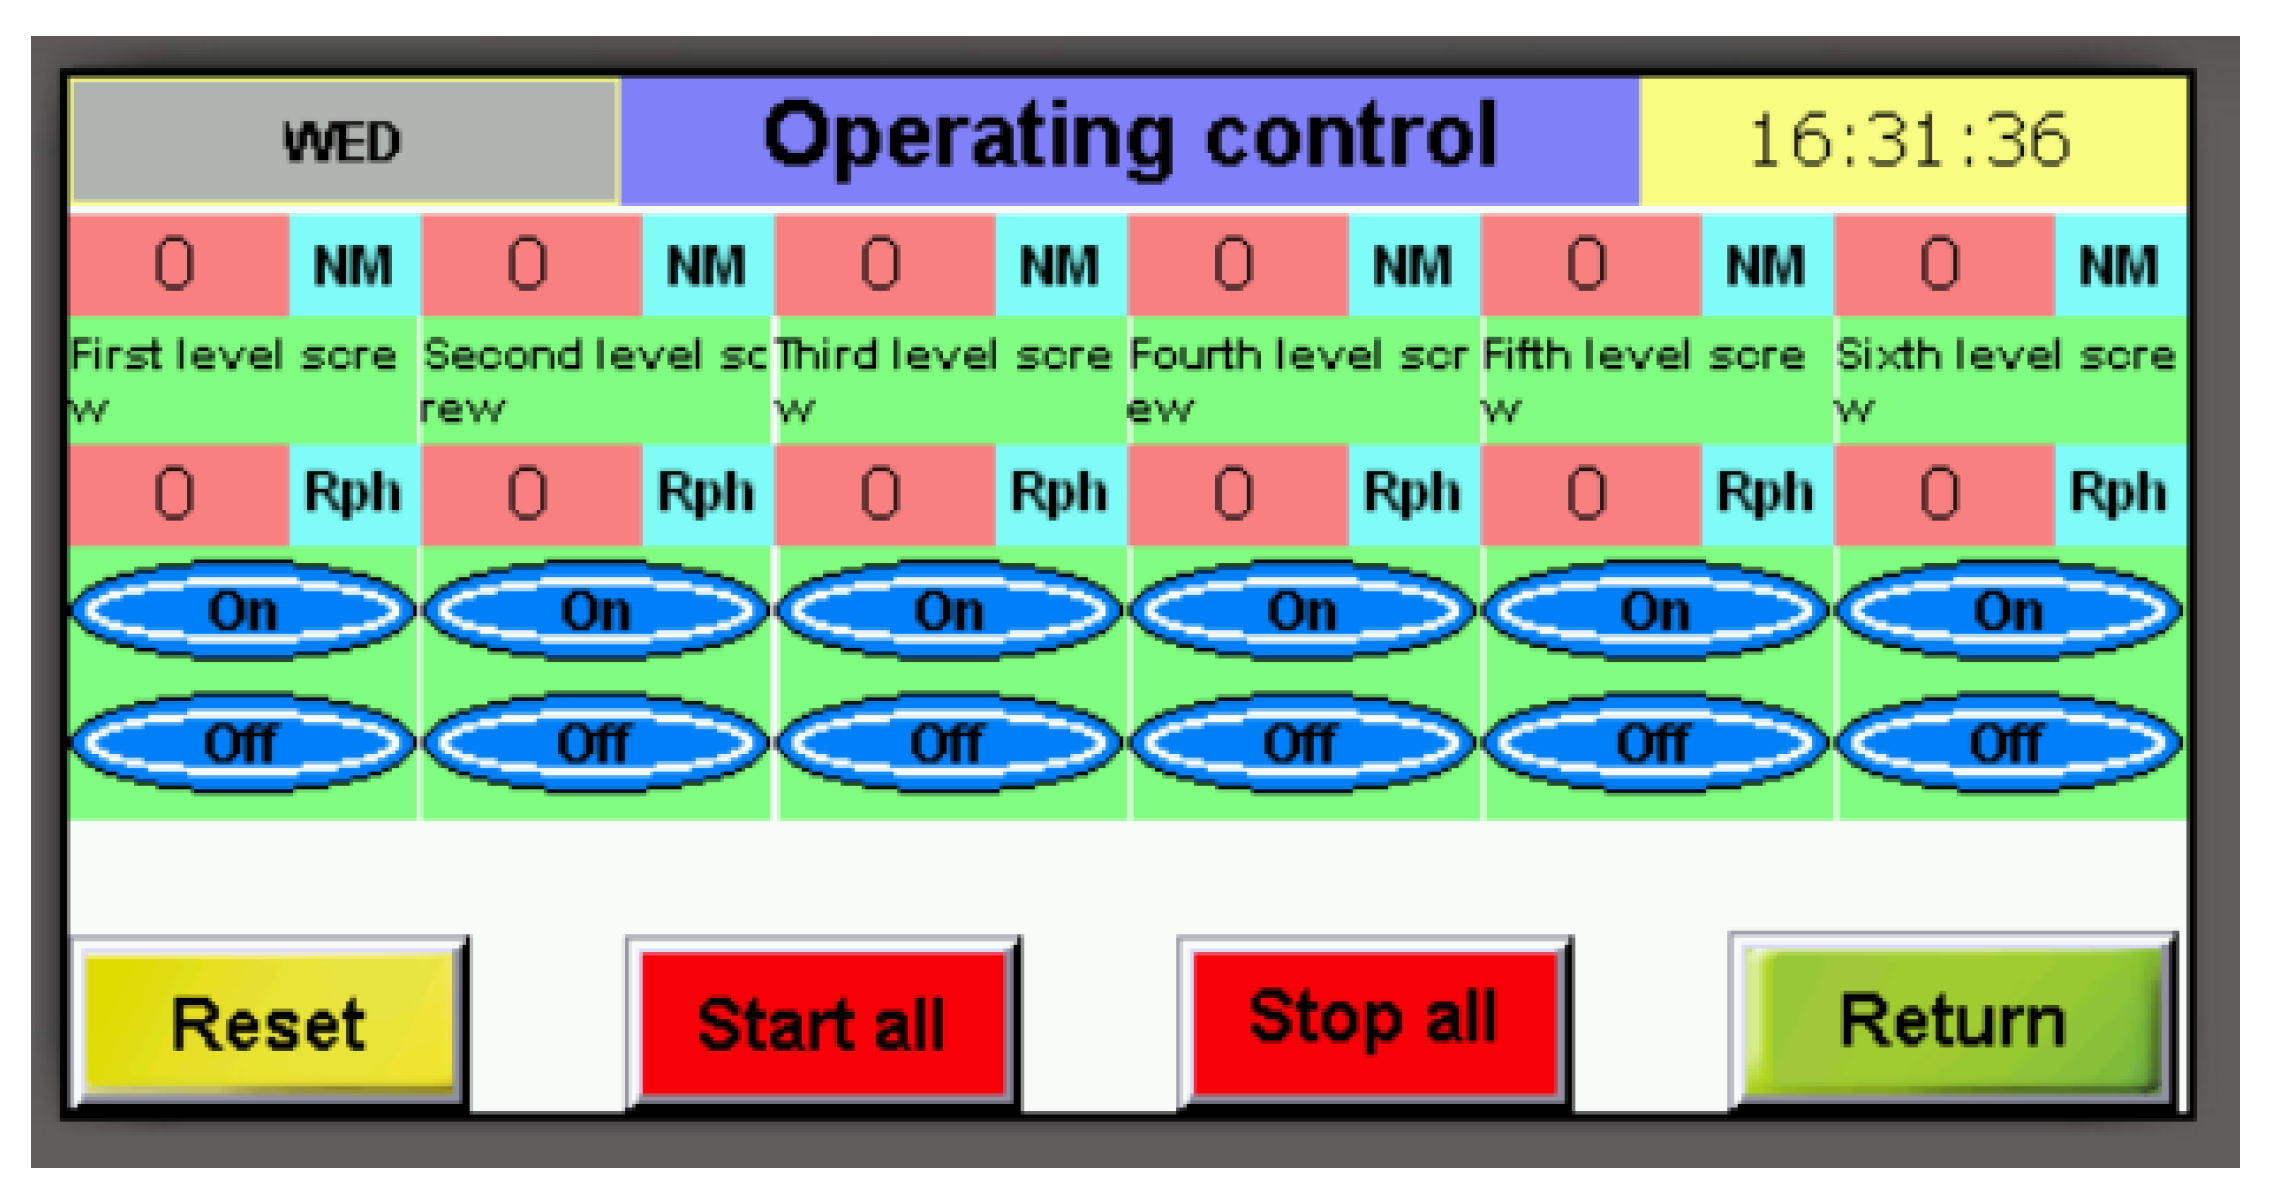
Figure 7.
Schematic diagram of vibrating screen structure.
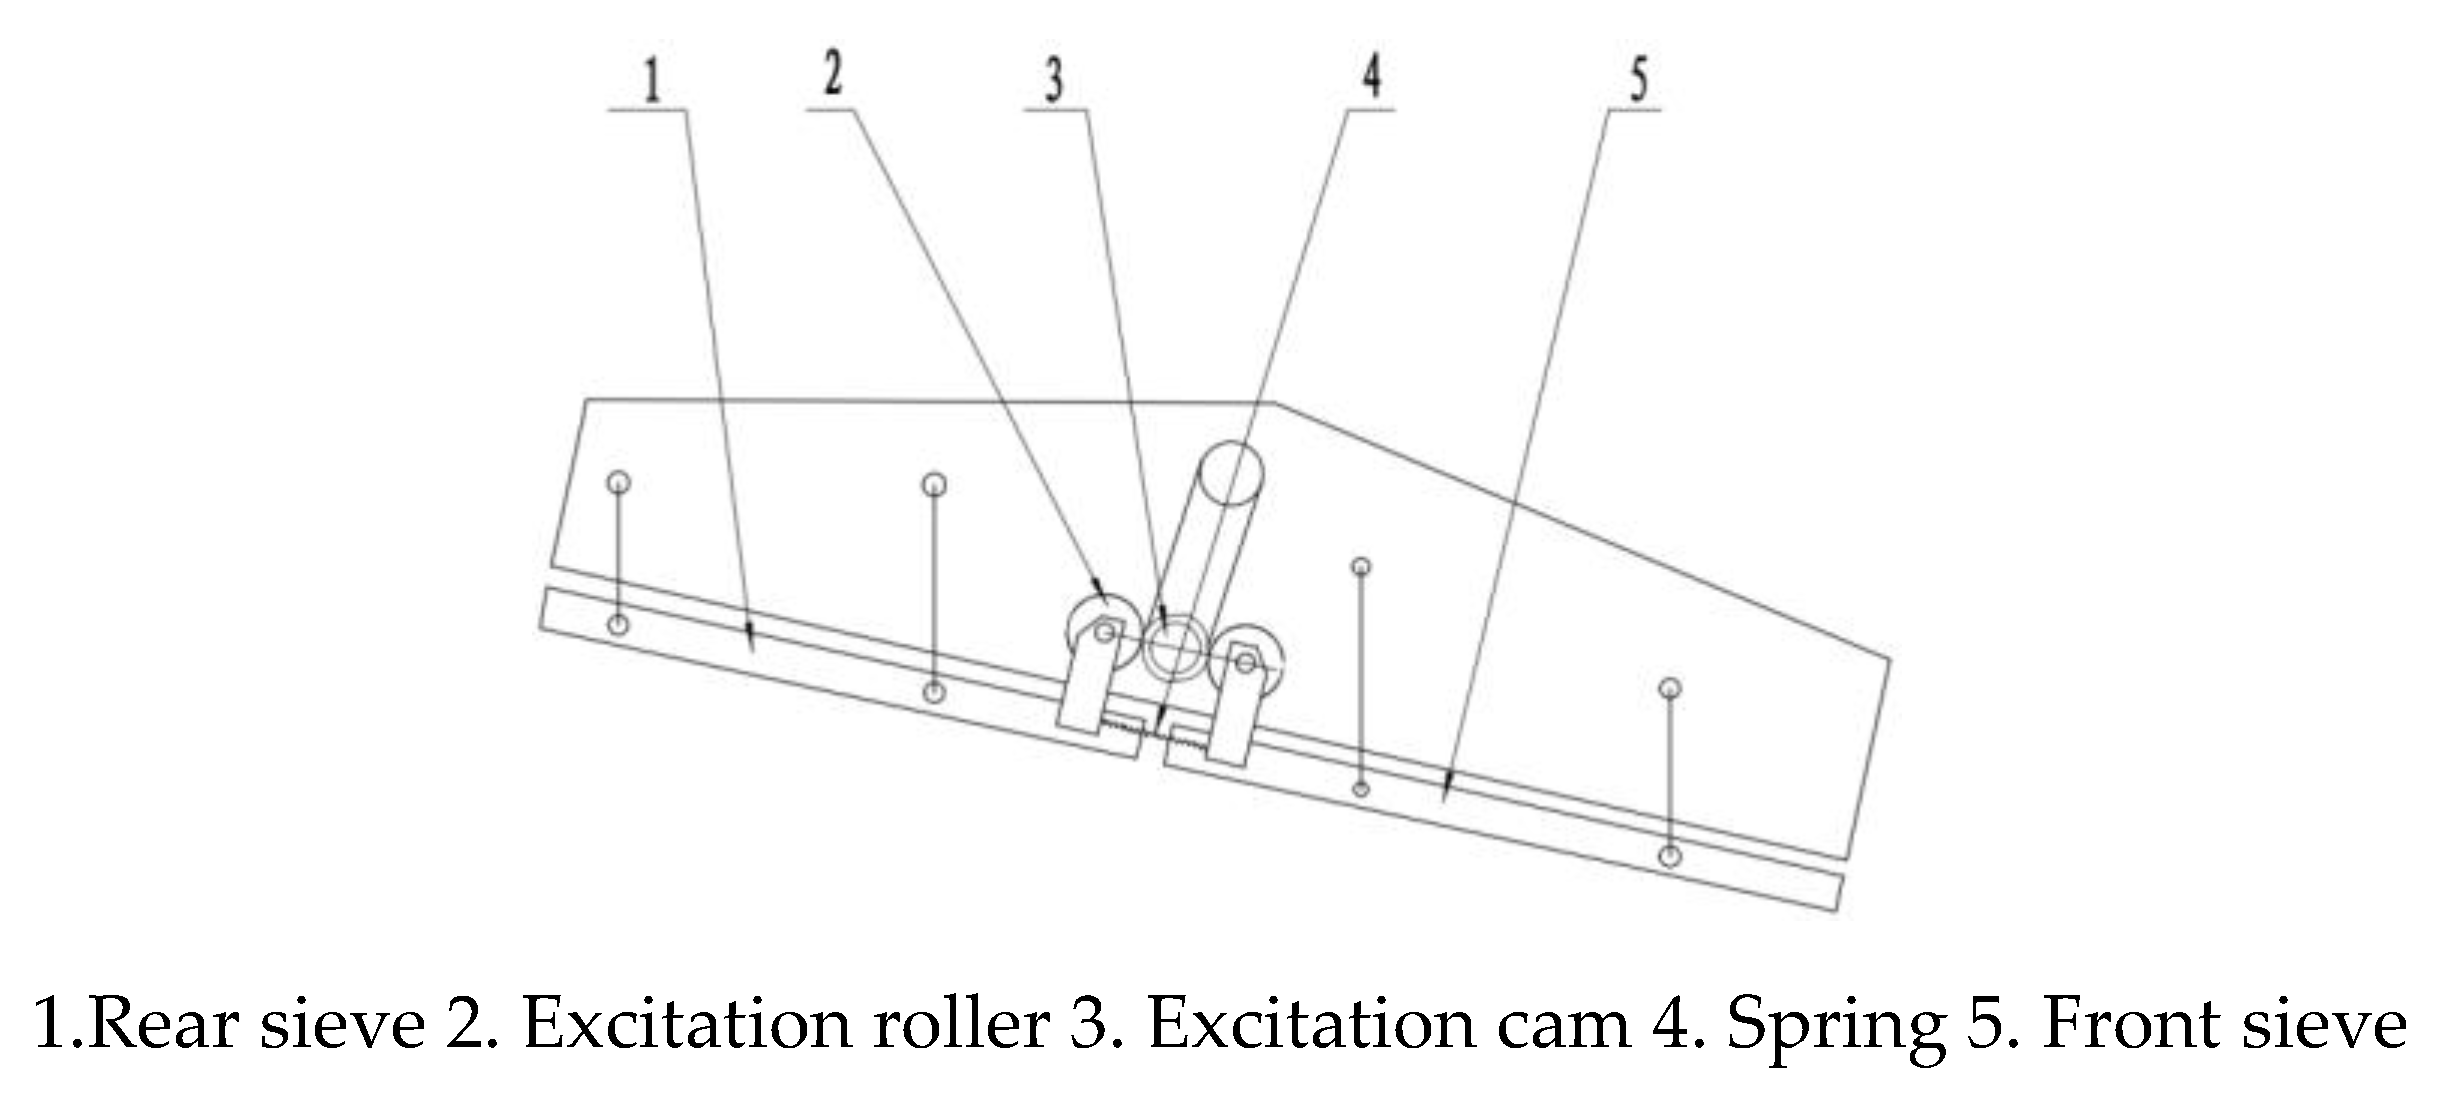
Figure 8.
Rotary tiller depth limiting wheel geometry.
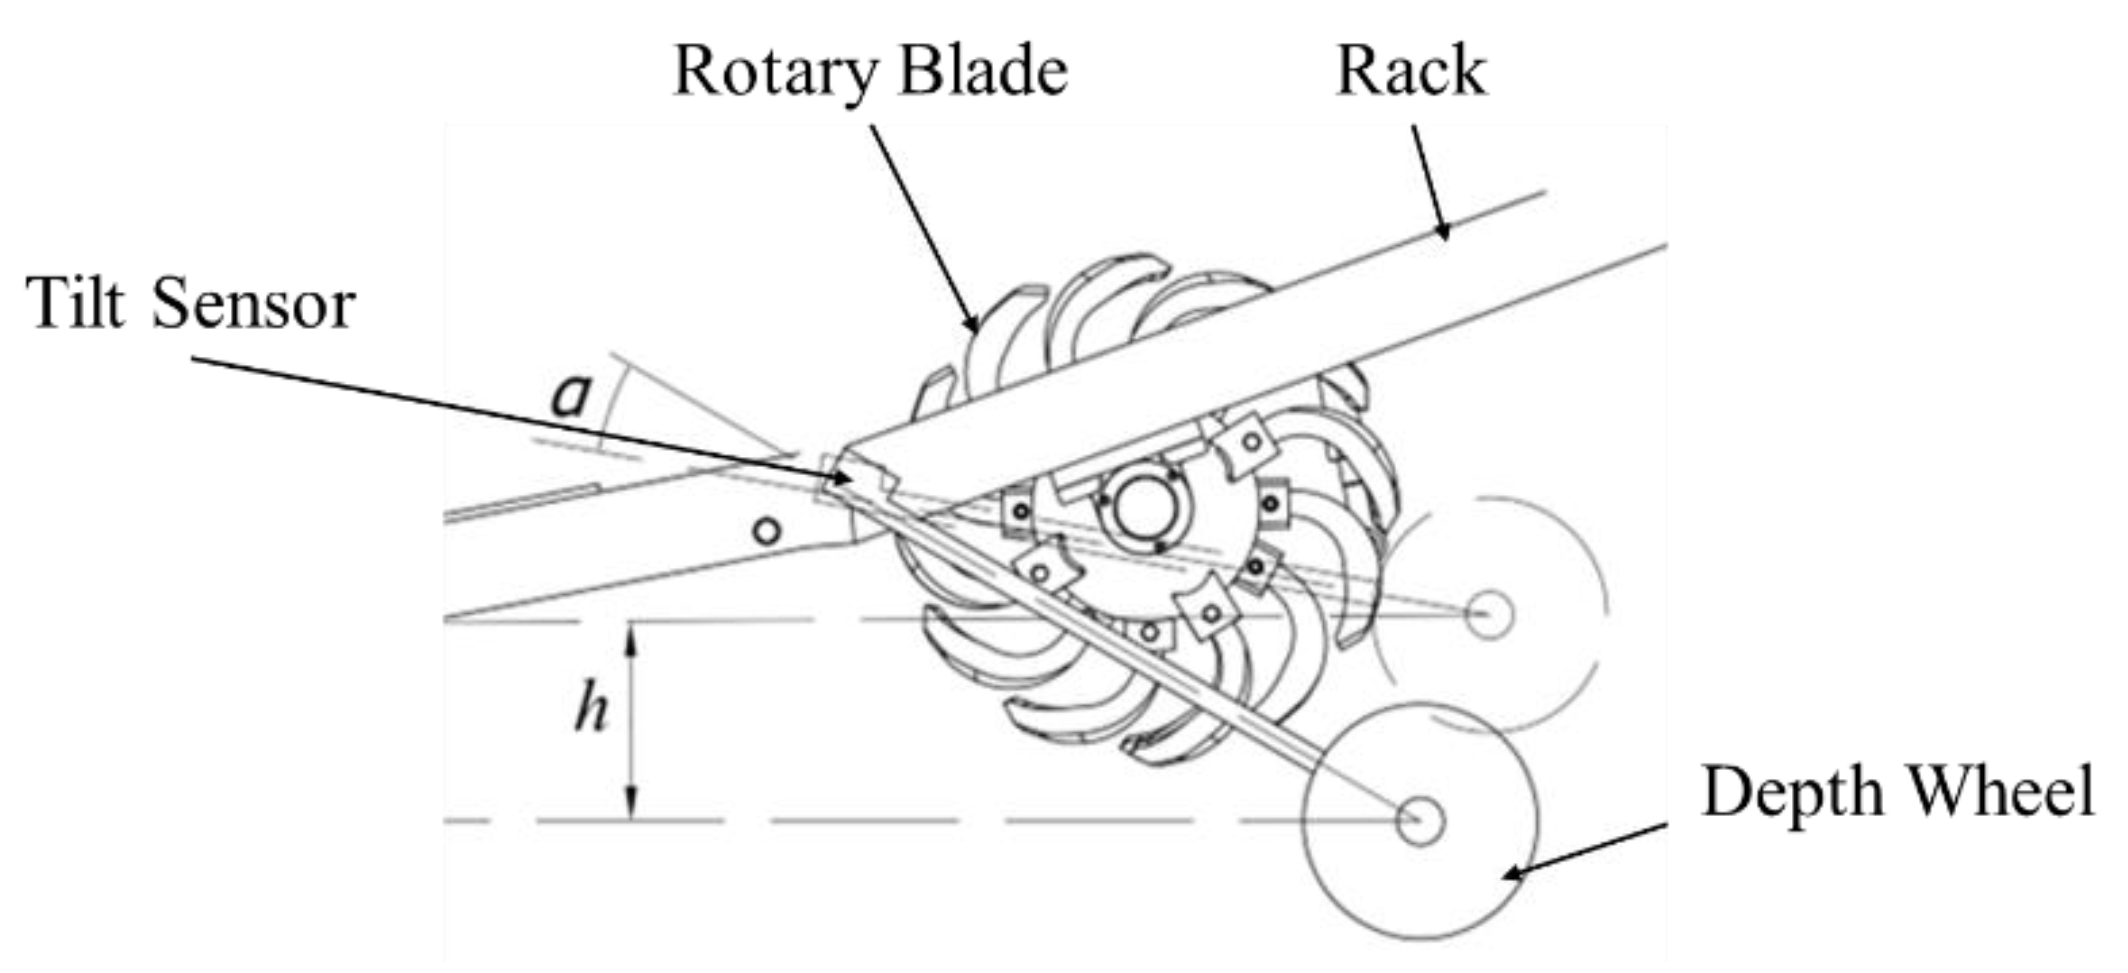
Figure 9.
Zeroing interface of digging depth detection system.
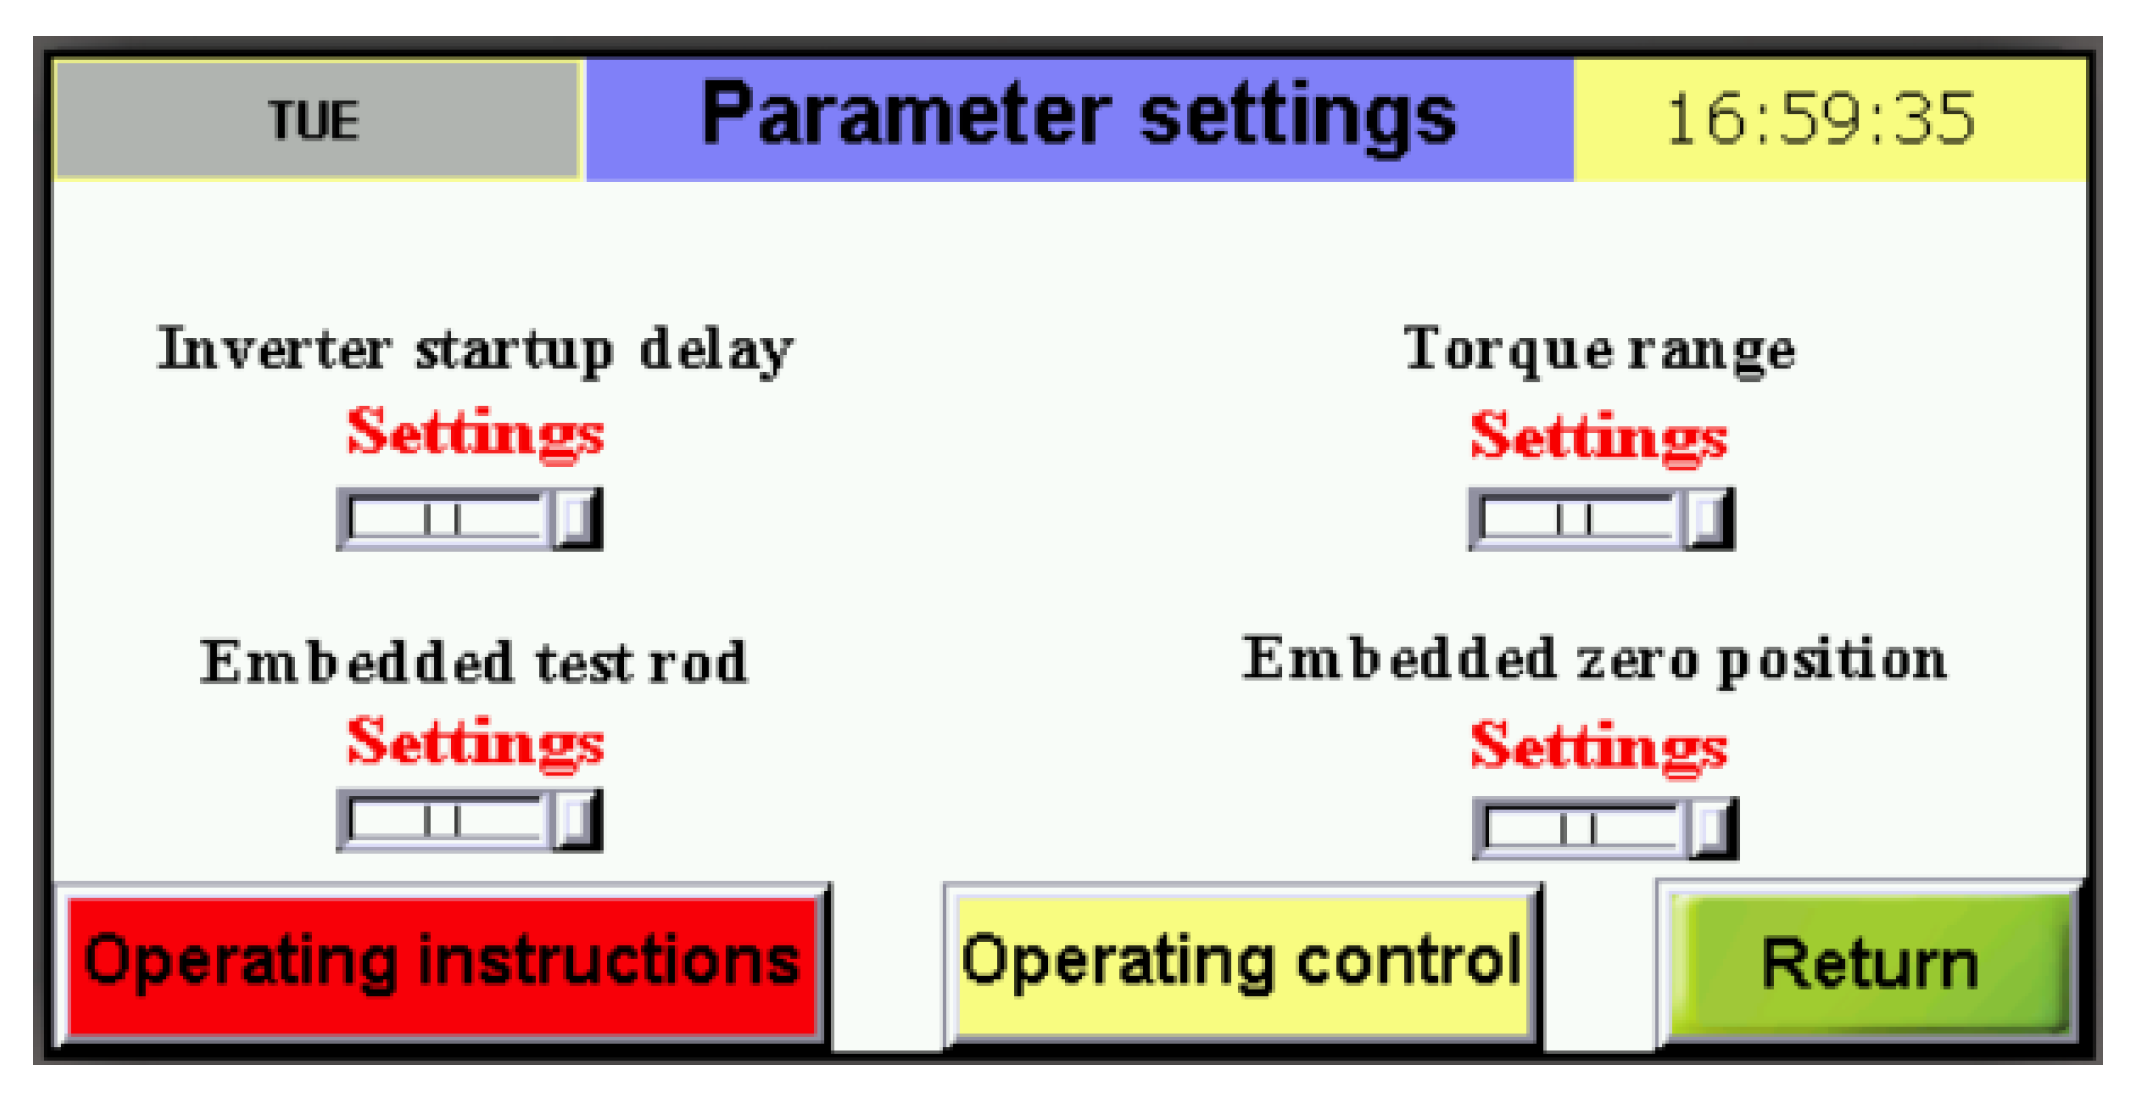
Figure 10.
Simulink model.
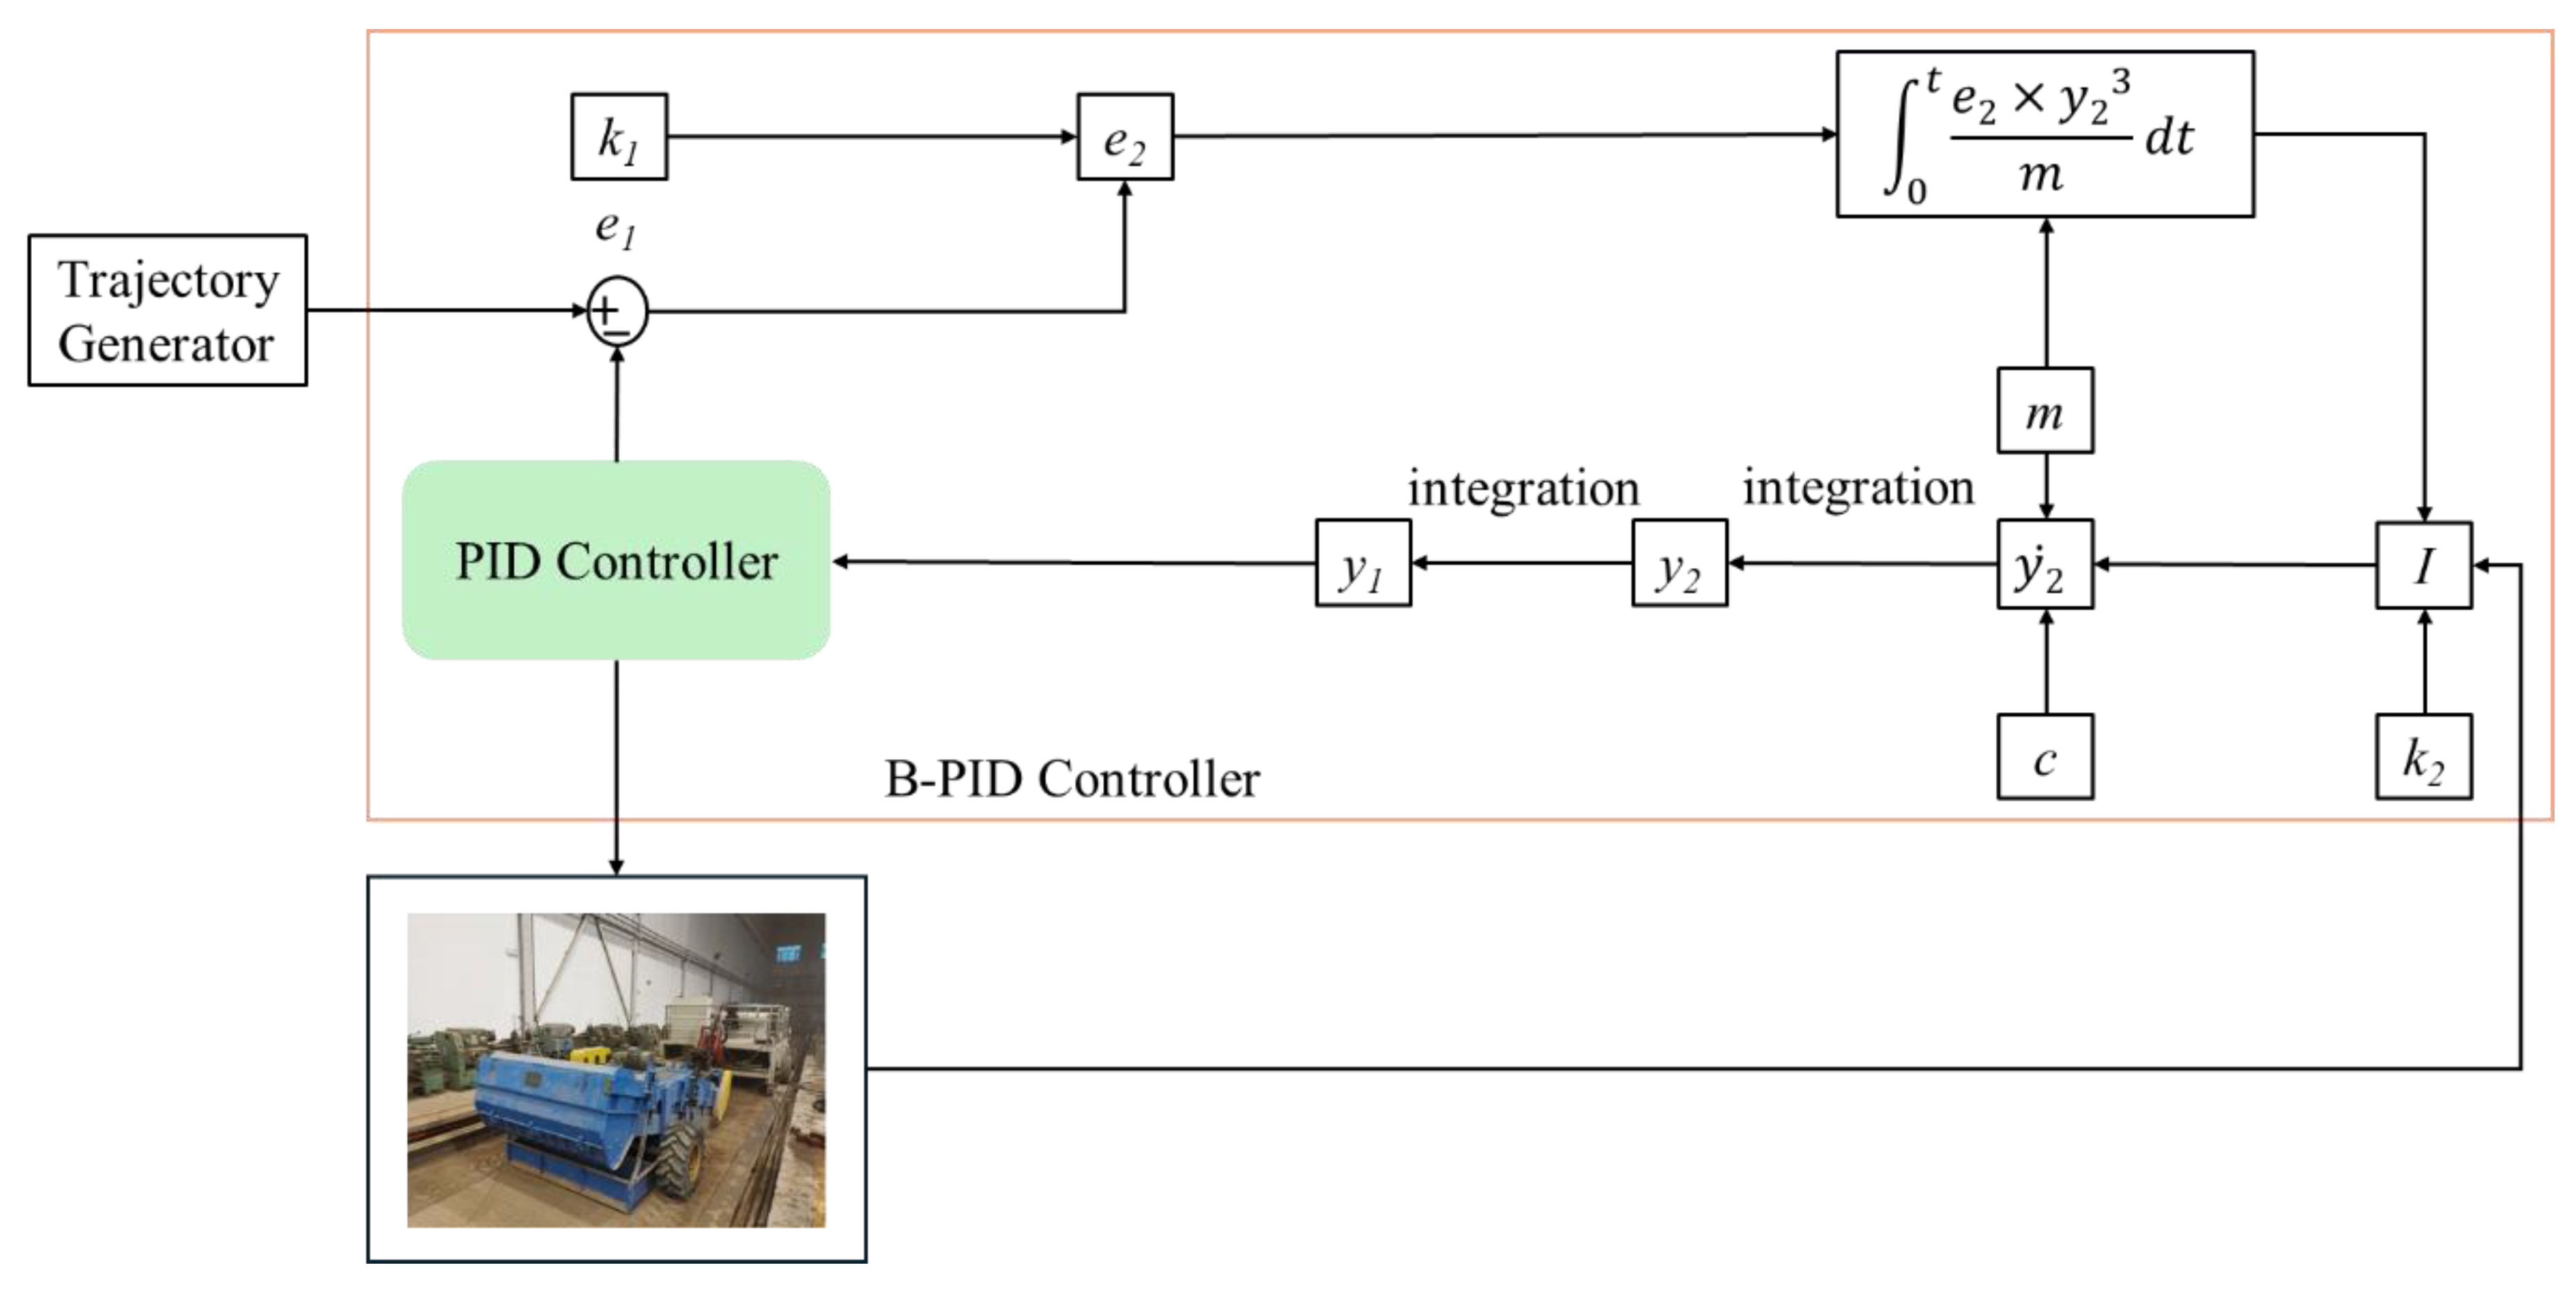
Figure 11.
Simulation results 1.
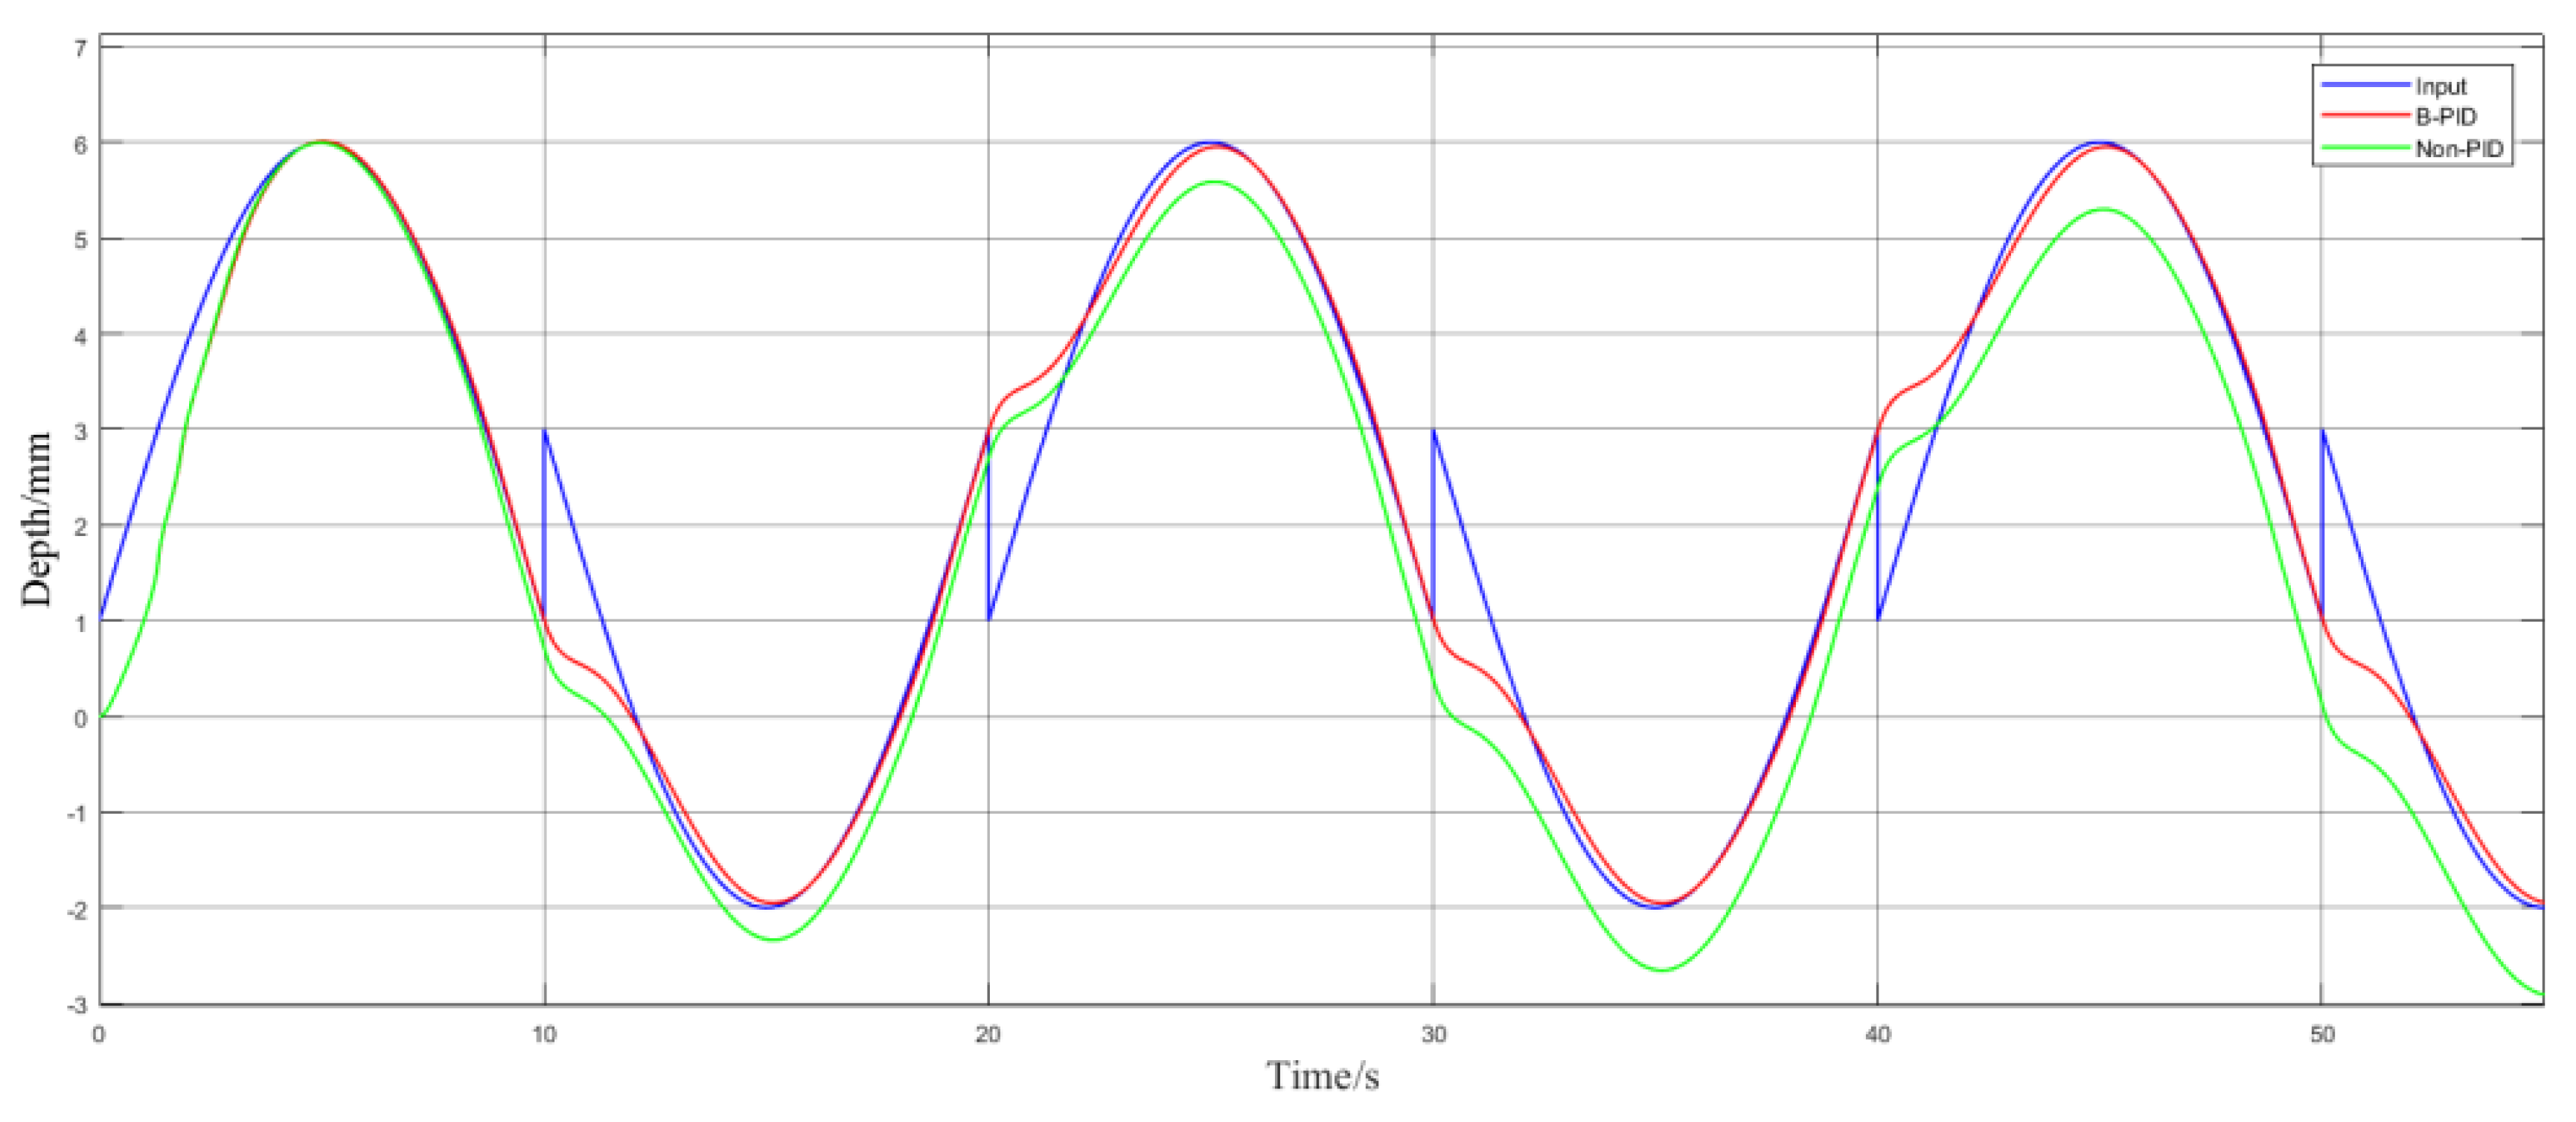
Figure 12.
Simulation results 2.
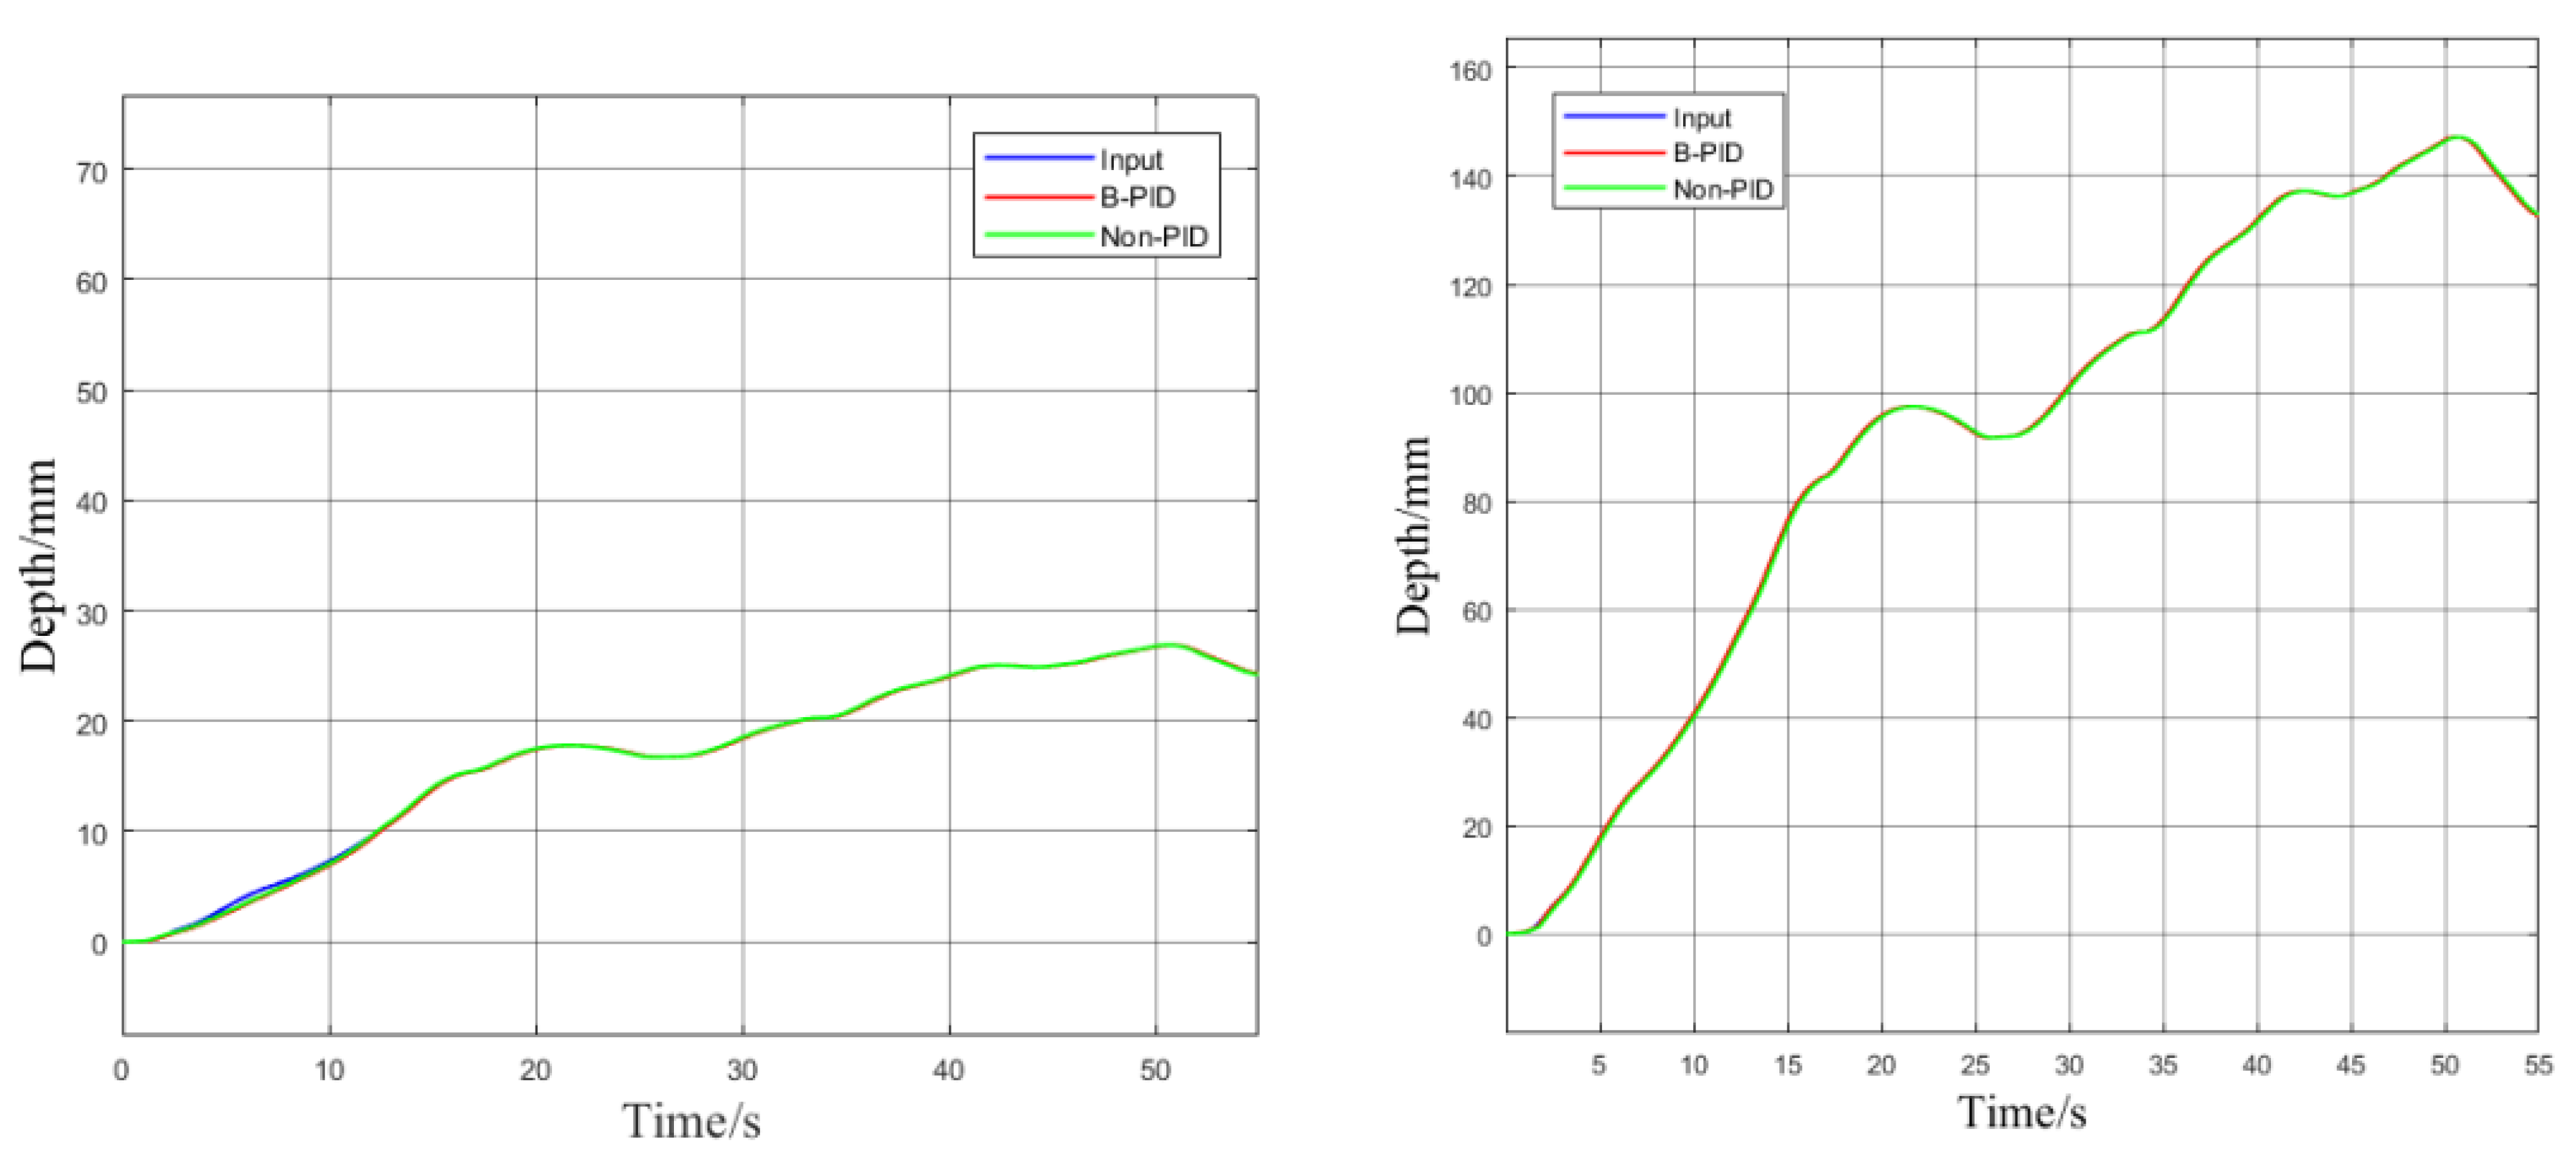
Figure 13.
Conveying and separation device for Tiger nut harvesting.
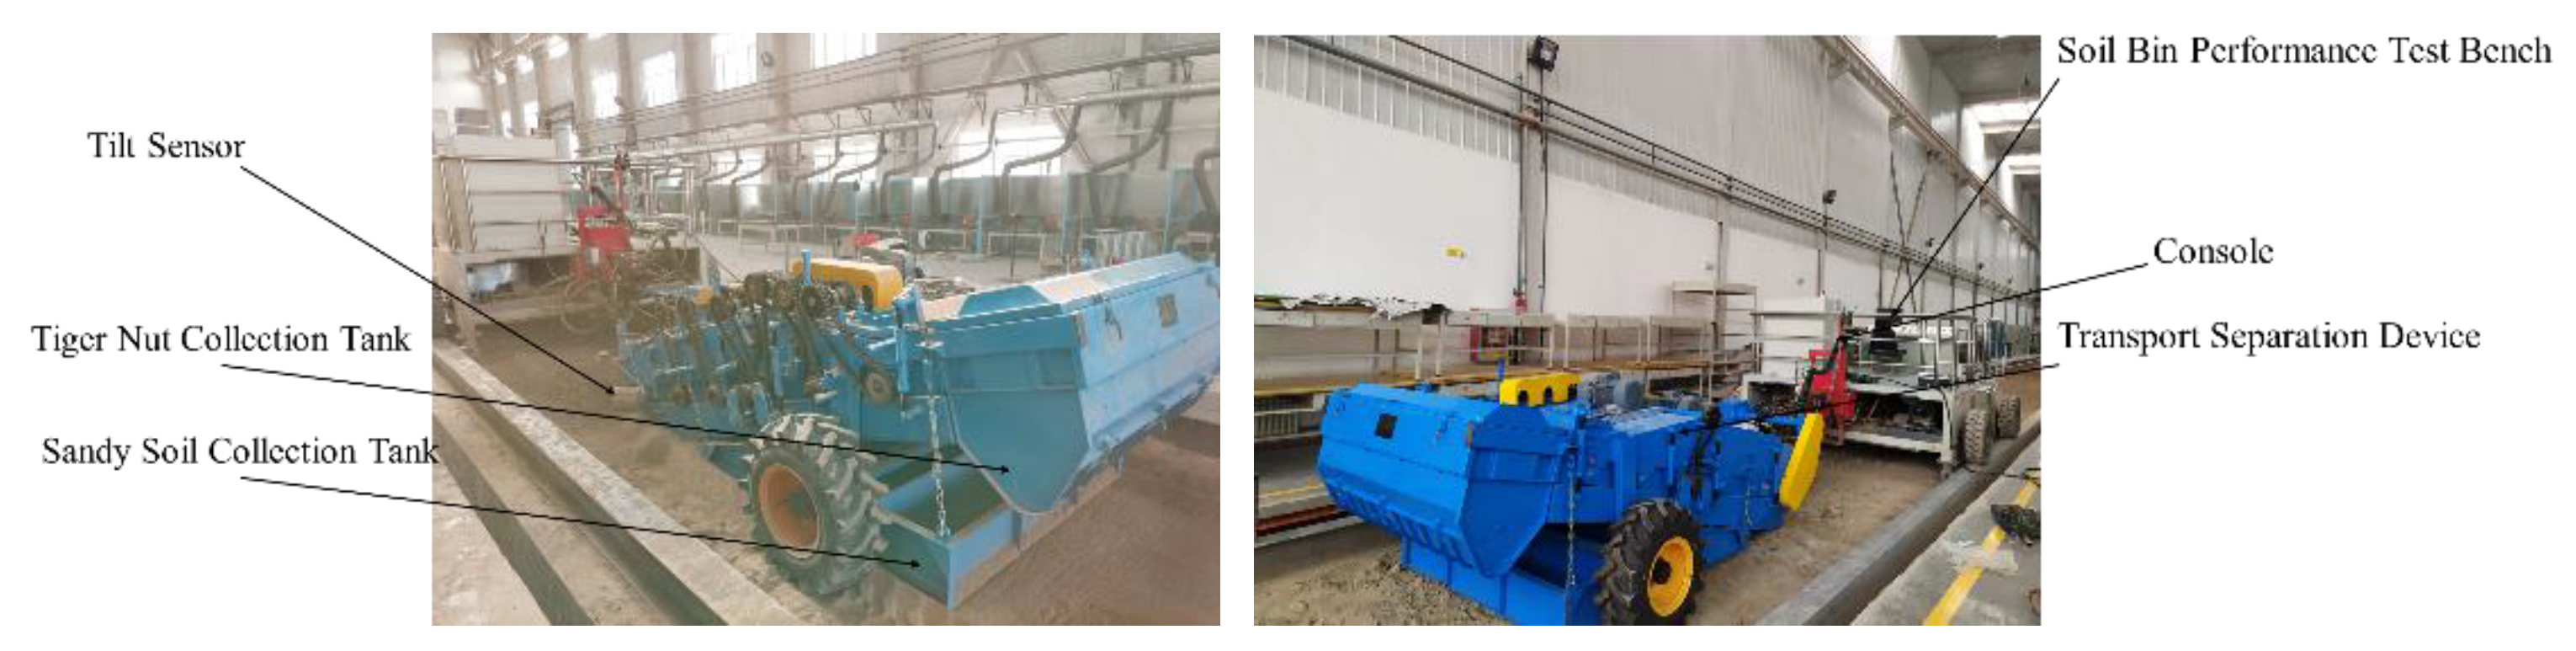
Figure 14.
Electrical wiring of Tiger nut harvester.
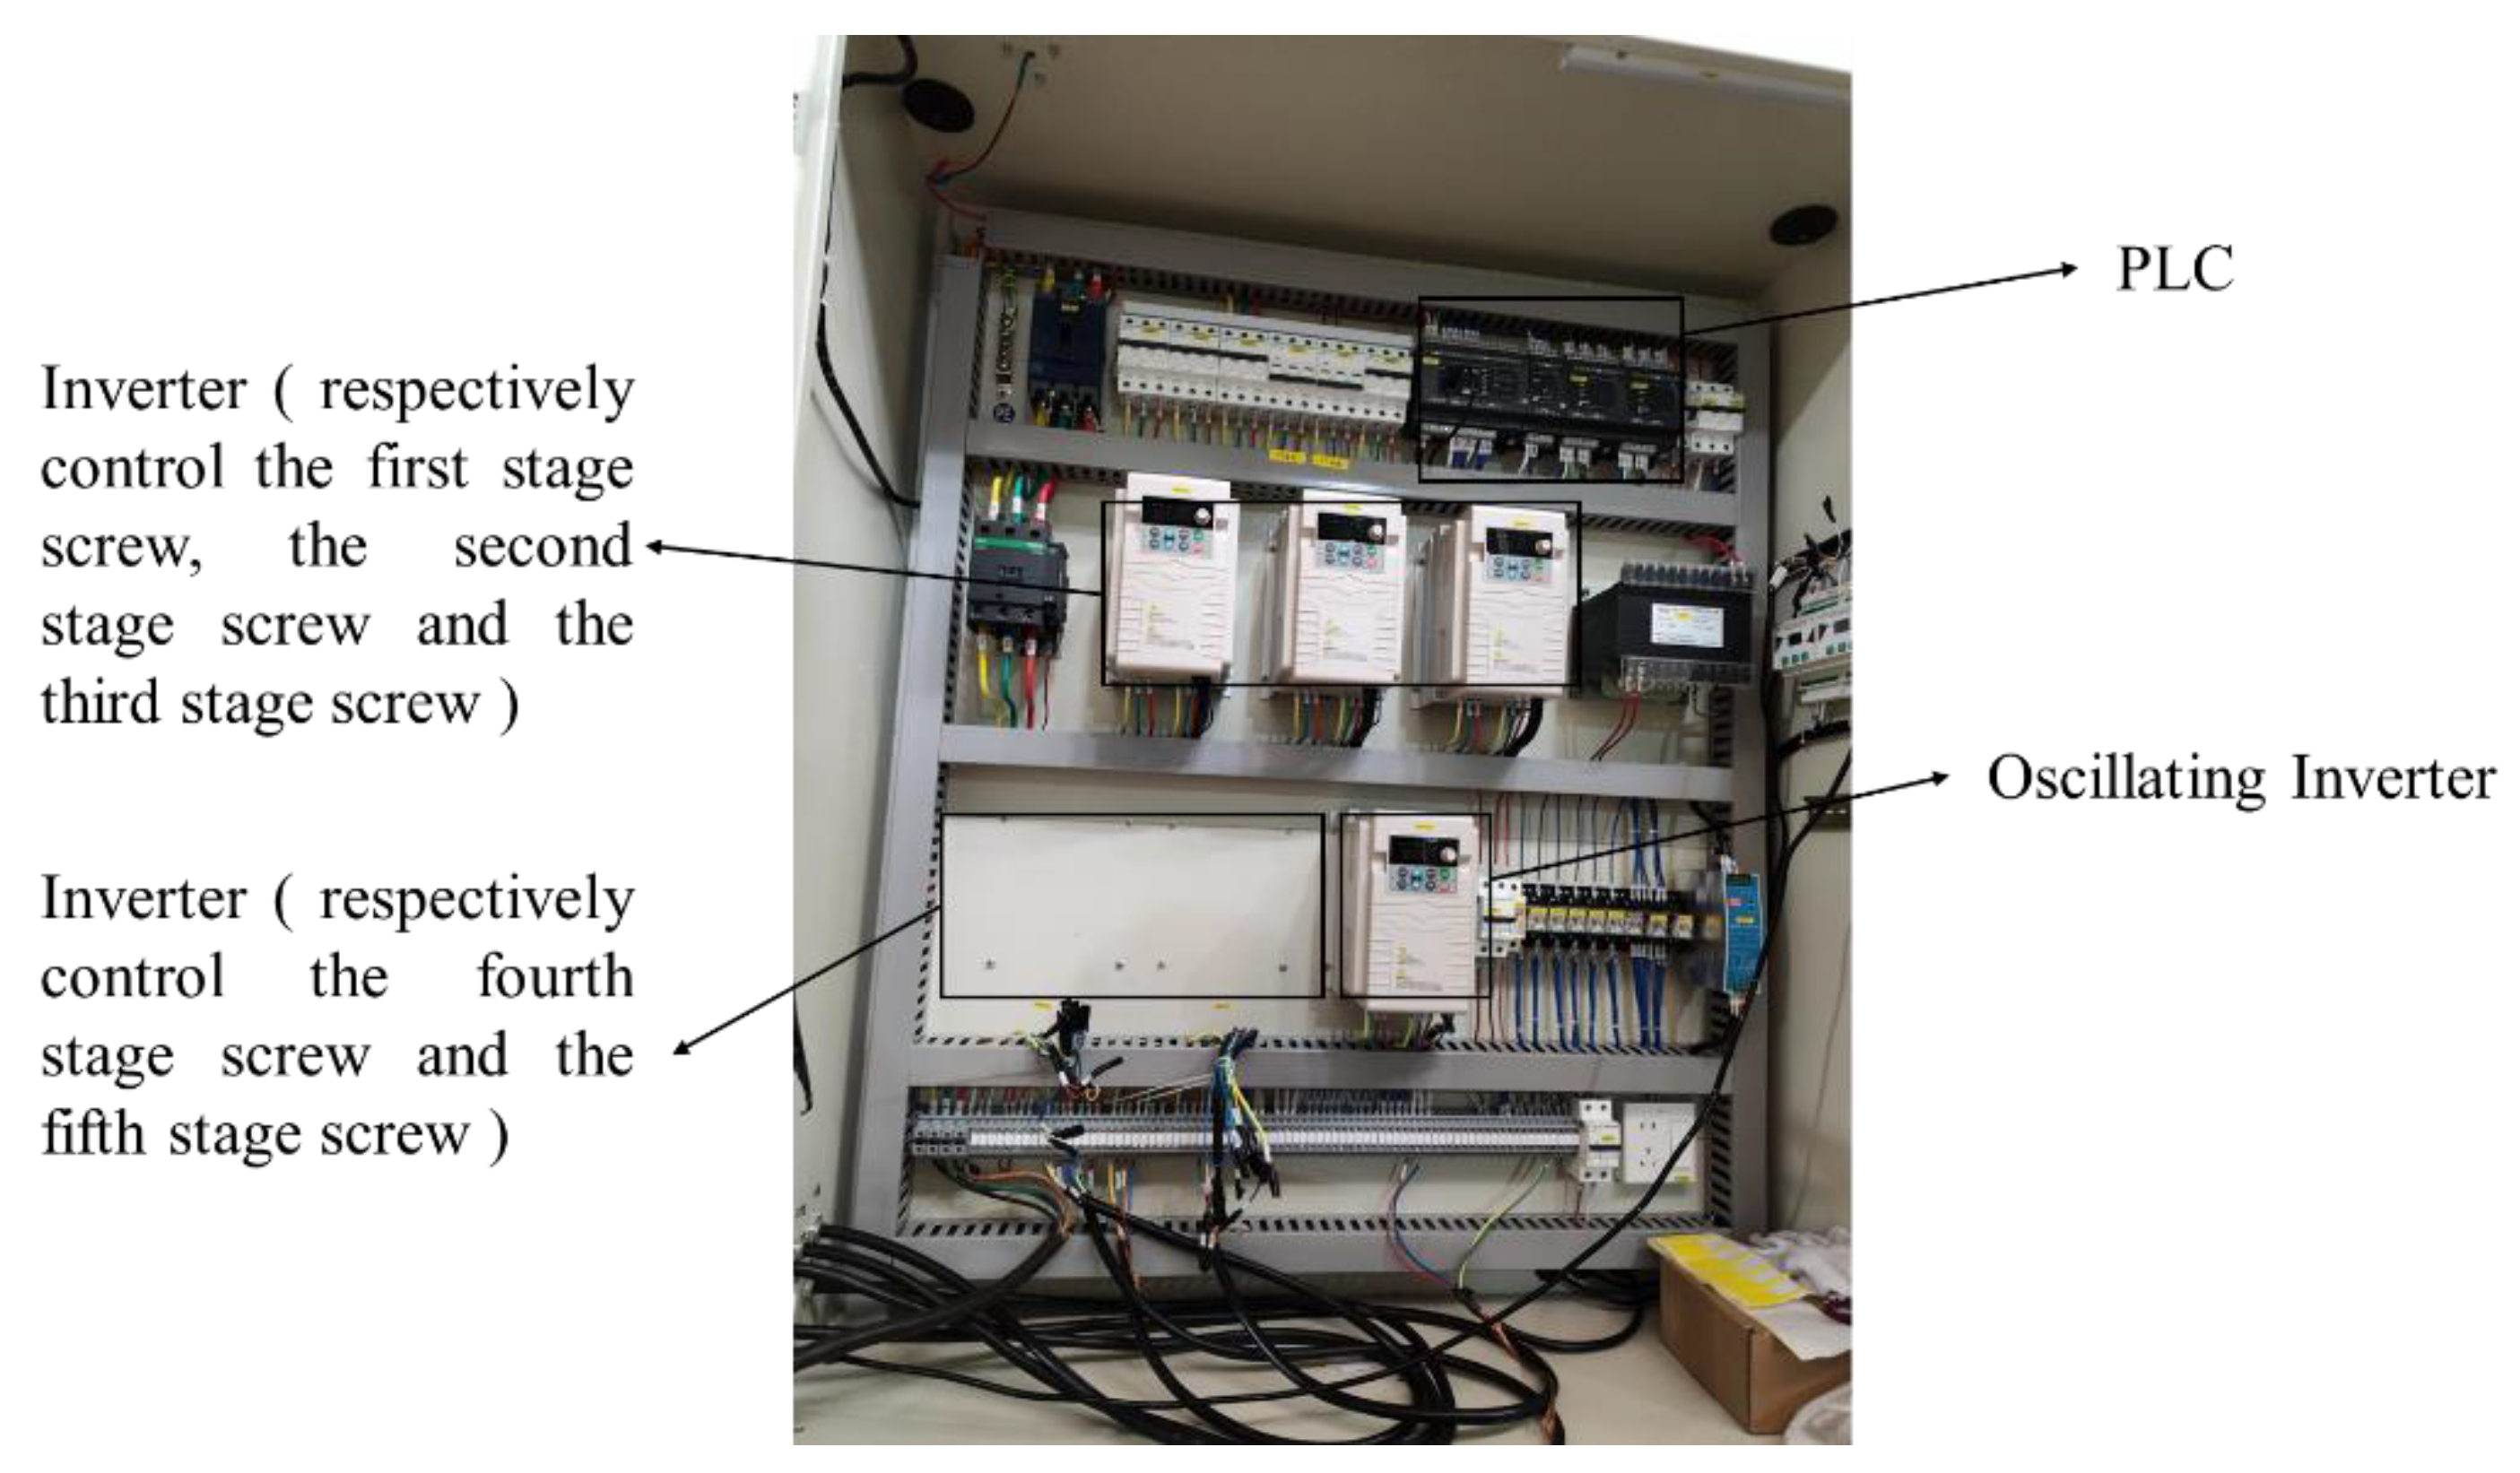
Table 1.
Technical parameters of harvesting, conveying and separation test bench.
| Parameters | Numerical value |
|---|---|
| Length×width×height/ (mm × mm × mm) | 4900×2600 ×1600 |
| Working width/mm | 1600 |
| Total power/ kW | 33 |
| Frequency adjustment range/Hz | 0~25 |
| Adjustment range of conveying speed/ (r/min) | 0~380 |
| Mining depth adjustment range/ (mm) | 0~200 |
Table 2.
Technical parameters of harvesting, conveying and separation test bench.
| Orders | Inherent frequency/Hz | Maximum deformation/mm | Vibration mode description |
|---|---|---|---|
| 1 | 116.94 | 13.887 | The opposite bending deformation of the left-handed and right-handed blades (Z-direction) |
| 2 | 119.24 | 14.185 | The bending deformation of the left-handed and right-handed blades in the same direction (Z-direction) |
| 3 | 133.14 | 8.179 | Bending deformation along the Y-direction |
| 4 | 133.41 | 9.083 | Bending deformation along the X-direction |
| 5 | 255.34 | 23.44 | Isotropic bending deformation of spacer blades (Z-direction) |
| 6 | 264.53 | 21.33 | The bending deformation of both ends of the blade and the middle blade in the same direction (Z-direction) |
Table 3.
Test results of screw performance with different rotational speed ratios.
| Rotational Speed Ratio | Project | First Stage Screw r/min | Second Stage Screw r/min | Third Stage Screw r/min | Fourth Stage Screw r/min | Fifth Stage Screw r/min | Relative Error/% |
|---|---|---|---|---|---|---|---|
| 0.8 | Theoretical Value | 280 | 224 | 179 | 179 | 179 | 3.80 |
| Measured Value | 267 | 213 | 172 | 173 | 175 | ||
| 0.9 | Theoretical Value | 280 | 252 | 227 | 227 | 227 | 1.76 |
| Measured Value | 273 | 246 | 224 | 225 | 223 | ||
| 1 | Theoretical Value | 280 | 280 | 280 | 280 | 280 | 2.49 |
| Measured Value | 277 | 268 | 274 | 276 | 270 |
Table 4.
Excavation depth test results.
| Serial Number | 1 | 2 | 3 | 4 | 5 |
|---|---|---|---|---|---|
| Theoretical Value/mm | 129 | 127 | 125 | 123 | 121 |
| Measured Value/mm | 128.4 | 126.5 | 123.1 | 121.2 | 119.9 |
| Relative Error/% | 0.4 | 0.3 | 1.5 | 1.4 | 0.9 |
Disclaimer/Publisher’s Note: The statements, opinions and data contained in all publications are solely those of the individual author(s) and contributor(s) and not of MDPI and/or the editor(s). MDPI and/or the editor(s) disclaim responsibility for any injury to people or property resulting from any ideas, methods, instructions or products referred to in the content. |
© 2024 by the authors. Licensee MDPI, Basel, Switzerland. This article is an open access article distributed under the terms and conditions of the Creative Commons Attribution (CC BY) license (https://creativecommons.org/licenses/by/4.0/).
Copyright: This open access article is published under a Creative Commons CC BY 4.0 license, which permit the free download, distribution, and reuse, provided that the author and preprint are cited in any reuse.


