
Submitted:
13 November 2024
Posted:
14 November 2024
You are already at the latest version
Preprints on COVID-19 and SARS-CoV-2
Abstract
The COVID-19 pandemic led to extensive school closures and an accelerated shift to remote learning, which had substantial consequences for students' academic development. This study seeks to examine the impact of COVID-19 on learning loss among elementary students in southern Italy, with a focus on grade-level variations across key academic domains: spelling, reading comprehension, reading speed and accuracy, and mathematical abilities. A sample of 332 students from grades II through V participated, with their performance evaluated using standardized assessments for each academic skill. Findings revealed that students in grade III encountered greater difficulties in spelling and reading comprehension compared to both older and younger cohorts, indicating that remote learning may have disproportionately affected the initial stages of skill acquisition. These results highlight the necessity for targeted interventions, especially for younger students and those with preexisting academic challenges, to address the lasting effects of pandemic-related educational disruptions.
Keywords:
Keywords: Covid-19 pandemic
; learning loss
; remote learning
1. Introduction
Global pandemic outbreaks in the 21st century have had far-reaching consequences, affecting numerous regions worldwide [1,2,3]. In response to the rapid spread of the COVID-19 virus, drastic measures were implemented worldwide, chiefly among them school closures [4,5]. This sudden disruption posed a significant challenge in meeting the educational needs of students [6] and severely impacted students’ mental [7,8] and physical health and learning [9,10].
Early studies examining students’ academic performance during the COVID-19 pandemic reported a decline in learning outcomes, commonly referred to as learning loss [11,12,13]. For example, Engzell et al., (2021) sought to investigate the extent to which school closures in the 2020 impacted primary school performance (math, spelling and reading) in a wide sample of Dutch students (aged 8 to 11 years). The authors found a learning loss of about 3 percentile points. The authors posited the effect was equivalent to one-fifth of a school year.
Notably, the COVID-19 pandemic has been associated with a substantial increase in learning losses [15,16,17,18]. The suspension of face-to-face education in countries affected by the pandemic aimed at mitigating the spread of COVID-19; however, it has resulted in short-term learning losses and potential long-term consequences for students’ educational journeys [19]. The magnitude of the impact is staggering, with an estimated 1.6 billion students worldwide affected by school closures (UNESCO, 2020). Educational researchers have been actively investigating the deficits, disruptions, and learning losses experienced by students [9,14,20,21], underscoring the urgent need for interventions to mitigate learning loss during distance learning [16,17,18].
Extensive global studies conducted during the COVID-19 pandemic consistently highlighted the prevalence of learning loss among students [22]. Learning loss is a pervasive issue affecting students across all levels of education [23]. Infants and toddlers exposed to previous pandemics and epidemics have demonstrated enduring adverse effects, such as impaired cognitive development and reduced educational attainment [24,25]. Cognitive development is intricately interconnected with social, emotional, and psychomotor development, forming the basis for knowledge acquisition and sustaining a holistic learning process.
The early years of childhood are particularly critical, as failure to acquire fundamental skills during this period can lead to a decline in developmental levels. Even when schools eventually reopen, the effects of learning loss may persist, negatively impacting children’s educational attainment and potentially affecting future generations [26].
A recent systematic review [10] compiled the findings of 24 studies that analyzed potential learning loss during various phases of lockdown, highlighting several negative consequences of lockdown and the transition to virtual learning schemes on children’s academic performance in various learning areas. It is worth noting that 35% of the included studies did not report any learning loss; therefore, the negative impact on academic performance during lockdown should be further examined to understand the conditions that are most conducive to learning loss.
There is evidence that learning loss, associated with COVID-19 restrictive measures does not show a uniform pattern across all students. For example, both Maldonado and De Witte (2022) and Kuhfeld et al. (2020) found learning losses in some subjects but insignificant impacts in others. On the other hand, Tomasik et al. (2021) observed an impact on elementary school students, but they did not find any impact on secondary school students. This is consistent with the literature indicating that students in the early grades may be more vulnerable than secondary school students due to their inability to seek learning independently, owing to differences in developmental and cognitive abilities [29,30].
Other discriminating factors are certainly related to the characteristics of the students’ family backgrounds. Engzell et al. (2021) determined that losses were up to 60% greater among students from non-educated families.
On the other hand, some specificity in terms of learning domains has been observed. In a study conducted in the United States, more than 1.5 million students exhibited specifically worse performance in mathematics and reading scores compared to the previous academic year [31].
Therefore, several contributing factors could be identified, including: (i) socioeconomic status (type of household and family income); (ii) access to technology, (iii) learning domain; academic year affected by remote learning.
The literature representing the impact of COVID-19 on students’ learning progress is limited in terms of the number of available studies, geographical regions analyzed, and the number of participating students. Given the innovative nature of this topic, it is understandable that educational researchers have only just begun to analyze the learning losses that students have experienced.
The present study aims at shedding light on the variables that make students more susceptible to learning loss, with a particular attention for academic domains affected by remote learning.
We analyzed the differences in learning loss among elementary school children based on their grade level (from II to V) during COVID-19, assuming that the effects of the pandemic on learning may vary depending on the developmental and educational stage affected. Specifically, in the present study we advanced the hypothesis that distance learning had a higher impact when it occurred in the early stage of the learning process, namely at the I grade level of elementary school. Accordingly, the study compares the performance results and outcomes in different learning areas, including spelling, reading comprehension, reading speed and accuracy, as well as mathematical skills.
2. Materials and Methods
2.1. Participants
The study was carried out at four different primary schools in southern Italy during the last semester of the academic year 2022/2023 and enrolled 332 students. Participants were recruited from the second (N= 139), the third (N=56), the fourth (N= 103) and the fifth (N= 34) grades of primary schools. Children attending the first-grade school were excluded due to: 1) the exiguous number of children (N= 11); 2) the test provided for the assessment of learning skills in this sample (PRCR-2, (Cornoldi et al., 2009) differs in its structure, hampering the possibility to compare the performance in this test with those of the other ones.
For the present study, it is worthy to note that second-grade students did not experience remote learning. Conversely, the third-grade primary school children were those who began their schooling during the first wave of COVID-19 and, as a result, they commenced their education journey through distance learning. On the other hand, in children of the fourth- and fifth-grade school learning of academic skills occurs in the traditional school context.
Children were all monolingual Italian native speakers, and they were included in the study after parents were informed about the activities and provided the informed consent. The study was approved by the ethics committee of the Department of Humanistic Studies, University of Naples “Federico II”, Naples, Italy (N° prot. 3/2019) and in agreement with the Declaration of Helsinki (2013) and by the school authorities.
2.2. Materials
The assessment of learning skills (i.e., mathematical, spelling, reading and comprehension skills) was carried out through different psychometric tests (below a brief description has been provided for each of them). Tests were consistent with the grade level of each child.
Reading and comprehension. In order to assess the reading and comprehension skills, participants were provided the “MT Reading test” [33]. The MT battery is the most psychometrically valid Italian instrument to measure the main relevant outcomes about reading skill: speed and accuracy. For the assessment of reading skills, participants were provided a passage which they were instructed to read aloud as fast and accurately as possible within a 4-min time limit. The story was appropriate to the grade level of each participant regarding cognitive and linguistic demands with an increasing number of syllables. Children’s reading skills were assessed through two main parameters:
- -
- Speed: is computed by dividing the number of syllables in the passage and the time spent (in seconds) reading them. In the literature there is a particular consent in considering this measure as a more sensible index of reading skills as compared to the accuracy, especially in transparent/regular orthographies as the Italian (Consensus conference, Specific Learning Deficits 2010; Landerl et al., 1997).
- -
- Accuracy: is computed by counting the number of errors (i.e., misreaded word) adjusted for the amount of text read.
Raw scores (speed and accuracy) were compared with the normative data and assigned to a performance category (see below):
- -
- CAC: Completely Accomplished Criteria (values above the 70° percentile)
- -
- SP: Sufficient Performance (values between the 15° and the 70° percentile)
- -
- AR: Attention Required (values between the 5° and the 15° percentile)
- -
- IIR: Immediate Intervention Required (values below the 5° percentile)
The comprehension task consisted of two stories participants must read (silently or loudly) and answer to 10/12 multiple-answer questions. The story was appropriate to the grade level of each participant. The task was not time constraint: the assessment of the comprehension skills relies uniquely on the accuracy (number of correct responses).
Raw scores about the accuracy were compared with the normative data and assigned to a performance category. Performance categories were identical to those of the reading test.
Writing. In order to assess the writing skills participants were provided the spelling-to-dictation task of the test “BVSCO-2” [36]. In this task, the examinator read aloud a text at students’ pace. Participants were instructed to spell the text as fast and accurately as possible. In this test, stories were adapted to the grade level and the complexity modulated regarding the syntax and the frequency of the words. Importantly, the structure of the test was adapted for testing a single or group of students (respectively individual or collective administration).
The main score in this task is the accuracy (the total number of errors made by the student). Errors can be classified as: 1) Phonological Errors (PE), namely errors which are not respected in the grapheme-phoneme relation (omission, insertion, transposition, substitution); 2) Non-Phonological Errors (NPE), namely a wrong graphic (visual) representation of the words without errors in the relation between grapheme and phoneme (e.g., “squola” instead of “scuola”- “school”). In other words, the miswritten word is phonologically plausible, but orthographically wrong; 3) Accent and Double Letters Errors (ADLE). The former refers to errors in placing the accent (e.g., “mangio”- “I eat” instead of “mangiò”- “He ate”); the latter refers to the omission or the addition of a double consonant (e.g., “pala”- “shovel” instead of “palla”- “ball”).
Accuracy (total number of errors) or each type of error (i.e., PE, NPE, ADLE) were compared with the normative data and assigned to a performance category. Performance categories were identical to those of the previous two tests (CAC, SP, AR, IIR).
Mathematical skills. In order to assess the mathematical skills, students were provided with the collective tasks of the AC-MT battery [37]. This battery consists of four subtests:
- -
- Written arithmetic calculations subtest: participants performed two calculations for each of the four basic number operations (addition, subtraction, division and multiplication), based on two numbers. This subtest aims to assess the student’s ability to apply the normal steps underlying the calculation and whether they are proceduralized
- -
- Quantity discrimination subtest: participants were provided six pairs of numbers, and they had to circle, for each pair, the highest one. This subtest assesses the semantic knowledge about numbers and requires the right reading of the numbers (lexical level)
- -
- Number transformation subtest: participants were provided a set of six digits, each with their own positional category. Students had to write the correct structure of the number (e.g., 2 tens and 5 ones= 25). The task aims to assess the ability to elaborate the syntactic structure of the number which regulates the relationship among the digits that compose them
- -
- Number ranking subtest: the participants order number sequences from the smaller to the higher and vice versa. This subtest assesses the semantic representation of the numbers
For each subtest, the accuracy is computed in terms of the number of right answers without constraints in terms of time. The subtests allow the assessment of 2 main mathematical skills: 1) written arithmetic calculations; 2) knowledge about numbers. The latter is computed by summing the participant’s accuracy in the quantity discrimination, number transformation and number ranking subtests.
The written arithmetic calculation and the knowledge about the numbers scores were compared with the normative data and assigned to a performance category (see below):
- -
- OT: Optimal performance (values above the 70° percentile)
- -
- S: Sufficient performance (values between the 15° and the 70° percentile)
- -
- AR: Attention required (values between the 5° and the 15° percentile)
- -
- IIR: Immediate Intervention Required (values below the 5° percentile)
2.3. Procedure
Children were tested both collectively and individually in a quiet room in their school. The collective and individual assessments were provided in two consecutive days. The collective assessment included the comprehension task, the spelling-to-dictation task and the AC-MT subtests. The individual assessment included the MT Reading test
3. Statistical analysis
Firstly, a chi-square analysis was carried out in order to test the equal distribution of males and females in each grade. Then, a set of univariate ANOVAs were carried out in order to highlight differences between grades (second, third, fourth and fifth) in terms of learning skills (reading, comprehension, written arithmetic calculation and knowledge about the numbers). For each ANOVA, Gender was conceived as a factor in order to test its main effect and the potential interaction Grade x Gender. For the significant results, post-hoc comparisons were Bonferroni corrected. Secondly, in order to test whether the performance categories for each learning skill were equally distributed in each class a set of Chi-square tests was carried out with performance categories (e.g., for the reading task: CAC, SP, AR, IIR) and grades (from II to V) as variables. Multiple pairwise comparison tests were performed to determine which pairwise comparisons among the individual joint conditions were significant. Multiple comparisons were carried out according to Cox and Key (1993): “the individual cells must be recognized as being independent with independent chi-square cell contributions. Thus, the absolute value of the difference between the two cells contributions, Δ(X2), will be distributed as Chi-square with one degree of freedom. Conceptually this is comparable to applying Chi-square to a (1xk) frequency table where k=2. To determine whether the difference between the two Chi-square cell values was significant, the difference was compared with Δ(X2)*=3.841, the theoretical distribution value for Ⲁ= 0.05 and one degree of freedom.”
All the analyses were carried out with “Statistical Package for Social Sciences” (IBM Corp. Released 2021. IBM SPSS Statistics for Windows, Version 28.0. Armonk, NY: IBM Corp).
4. Results
4.1. Gender Distribution Among Grades
The first Chi-square analysis highlighted a significantly different distribution of males and females in each grade (X2(3)= 15.55, p< .001; Table 1).
4.2. Continuous Performance in Each Task Among Grades
Spelling-to-dictation task. The ANOVA reported the 1) significant main effect of gender (F(1,310)= 9.28, p< .001, n2p= .03) with females performed better (i.e., they were more accurate) as compared to males; 2) significant main effect of grade (F(3,310)= 11.23, p< .001, n2p= .10). The analysis failed to report a significant interaction effect grade x gender (F(3,310)= .88, p= .45, n2p< .001). In fact, females committed less errors as compared to males, but both genders presented a similar trend of the data. The post hoc comparisons highlighted that children of the third grade made more errors (mean of errors= 16.21; sd= 11.35) as compared to those of the second (mean of errors = 8.75, sd= 6.69; p< .001), fourth (mean of errors= 7.94, sd= 7.99, p< .001) and fifth (means of errors= 6.79, sd= 6.22, p< .001; Figure 1). No further comparisons reached the significance. Results suggested that third-grade children had lower writing skills as compared to those of the second, fourth and fifth grade.
Comprehension task. The ANOVA reported only the main effect of grade (F(3,310)= 7.17, p< .001, n2p = .06). The analysis did not highlighted neither a main effect of the gender (F(1,310)= 3.41, p= .07, n2p = .01) nor a grade x gender interaction (F(3,310)= 1.08, p= .36, n2p = .01). Post-hoc comparisons highlighted that children of the third grade were less accurate (mean of accuracy= 5.29, sd= 2.11) as compared to those of the second (accuracy mean= 6.25, sd= 2.10, p= .04), fourth (accuracy mean= 7.03, sd= 2.39, p< .001) and fifth grade (accuracy mean= 6.88, sd= 2.36, p= .006; Figure 2). Comparisons have also highlighted a low accuracy in the comprehension task in children of the second grade as compared to those of the fourth (p=.04). Consistently with the previous results, the analyses carried out on the comprehension task revealed a greater difficulty among third-grade children in deducing or inferring information from written stories.
Written arithmetic calculation. The ANOVA reported: 1) the main effect of gender (F(1,310)= 8.51, p< .001, n2p = .03); 2) the main effect of grade (F(3,310)= 119.11, p< .001, n2p = .54); 3) the interaction effect of grade x gender (F(3,310)= 2.72, p= .04, n2p = .03). Post-hoc comparisons highlighted heterogeneous results with children of the third grade which were less accurate (accuracy mean= 5.32, sd= 1.99) as compared with children of the fourth grade (mean off accuracy= 6.50, sd= 1.57, p< .001). On the other hand, the accuracy of children of the third grade were higher than those of the children of the second class (accuracy mean= 2.86, sd= 1.21, p< .001). No further differences in terms of accuracy were highlighted between third and fifth grade (accuracy mean= 5.91, sd= 1.78, p= .47; Figure 3). Finally, children of the second grade were less accurate as compared with those of the other grades (p values < .001).
Knowledge about numbers. The ANOVA reported only the main effect of grade (F(3,310)= 3.72, p= .01, n2p = .03). The analysis did not highlight neither a main effect of the gender (F(1,310)= 3.06, p= .08, n2p < .001) nor a grade x gender interaction (F(3,310)= 2.55, p= .06, n2p = .02). Post-hoc analyses reported one significant comparison, between children of the third and the fourth grade (p= .03). Specifically, students of the third class were more accurate (third grade: accuracy mean = 19.10, sd= 3.86; fourth grade: accuracy mean= 17.33, sd= 3.05; Figure 4).
Reading speed. The ANOVA reported only the main effect of grade (F(3,310)= 68.83, p< .001, n2p = .40). The analysis did not highlight neither a main effect of the gender (F(1,310)= 1.02, p= .31, n2p < .001) nor a grade x gender interaction (F(3,310)= .45, p= .72, n2p< .001). Post-hoc comparisons reported a linear trend about the increase of reading skills as reported in Figure 5. Thus, the syllables per second linearly increased as a function of the class (second: mean of sill./sec= 2.10, sd=.74 < third: mean of sill./sec= 2.69, sd= .81 < fourth: mean of sill./sec= 3.57, sd= .86 < fifth: mean of sill./sec= 3.67,sd=.89) All the pairwise comparisons were significant (p values <.001).
4.2. Distribution of the Performance Categories Among Grades
The Chi-square analysis reported a different distribution of the performance categories among grades for the spelling-to-dictation task (X2(9)= 43.69, p< .001), written arithmetic calculation (X2 (9)= 25.64, p= .01) and knowledge about numbers (X2 (9)= 64.48, p< .001). Results about the comprehension task just approached the significance (X2 (9)= 16.31, p= .06). Chi-square analyses, failed to report any statistical significance in reading tasks in terms of both speed and accuracy (speed: X2 (9)= 13.47, p= 0.14; accuracy: X2 (9)= 11.07, p= .27).
Spelling-to-dictation task. Table 2 shows, for the spelling task, which classification of proportions has a large disparity between the actual observed frequencies (oij) and the theoretically expected frequencies (eij).
Specifically, the performance category IIR for the third grade has the largest chi-square contribution, with a higher observed frequency of this category performance as compared to the expected frequency. The IIR category for the third grade contributes 39% of the total chi-square value (16.93/43.96). Post-hoc analyses highlighted that the observed frequency of the IIR performance category in children of the third grade was significantly higher as compared to the expected frequency. This difference was significantly higher as compared to the same difference in both the other categories (CAC, SP, AR; all p values < .05) and grades (second, fourth and fifth; all p values < .05). In other words, the IIR performance category was more likely to occur in children of the third grade and this distribution was significantly different from the chance.
Comprehension task.Table 3 shows, for the comprehension task, which classification of proportions has a large disparity between the actual observed frequencies and the theoretically expected frequencies.
Specifically, the performance category IIR for the third grade has the largest chi-square contribution, with a higher observed frequency of this category performance as compared to the expected frequency. The IIR category for the third grade contributes 41% of the total chi-square value (6.43/16.31). Post-hoc analyses highlighted that the observed frequency of the IIR performance category in children of the third grade was significantly higher as compared to the expected frequency. This difference was significantly higher as compared to the same difference in both the other categories (CAC, SP, AR; all p values < .05) and grades (second, fourth and fifth; all p values < .05). In other words, the IIR performance category was more likely to occur in children of the third grade and this distribution was significantly different from the chance.
Written arithmetic calculation. Multiple comparisons for the performance categories and grades in terms of written arithmetic calculation did not report significant comparisons. In other words, none of the relevant chi-square cell differences was at least the value of the critical difference to reach the significance (see Table 4 for the disparity between the actual observed and the theoretically expected frequencies).
Knowledge about the numbers. For the knowledge about the numbers, the classification of proportions between the actual observed frequencies and the theoretically expected frequencies is reported in Table 5.
Results revealed that the observed frequency of the OT performance category for children attending the second and third grades was significantly higher than the expected frequencies. Furthermore, the performance category OT for the fourth grade has the largest Chi-square contribution, with a lower observed frequency of this category performance as compared to the expected frequency. The OT category for the fourth grade contributes 24% of the total chi-square value (15.28/64.48). Post-hoc analyses highlighted that the observed frequency of the OT performance category in children of the fourth grade was significantly lower as compared to the expected frequency. This difference was significantly higher as compared to the same difference in both the other categories (CAC, SP, AR; all p values < .05) and grades (second, fourth and fifth; all p values < .05). In other words, the OT performance category was less likely to occur in children of the fourth grade and this distribution was significantly different from the chance. However, the children of the fourth grade were also more likely to have a sufficient performance as compared to the chance.
4. Discussion
The Covid-19 pandemic led to the temporary displacement of over 1.6 billion children from schools worldwide. Although many education systems implemented varying levels of remote learning during the pandemic breakdown, it has been widely acknowledged that school closures led to significant learning losses [16,17,18]. Early childhood is a crucial period, as missing out on essential skill development during this time can hinder overall growth and especially the learning of academic skills. A major concern is that these short-term losses could persist after children return to school, resulting in substantial and permanent learning gaps, as many students who fall behind during the closures may never fully catch up. In that regard, Kaffenberger (2021), applied a pedagogical production function model to estimate the potential long-term learning losses due to COVID-19 school closures and models the potential gains from short-term remediation and a combination of short-term remediation and long-term reorientation of curriculum and instruction to align with children’s learning levels. The author reported that a 3-month school closure could lead to children losing a full year’s worth of learning by the time they reach grade 10. Interestingly, if learning in grade 3 was reduced by half, the learning in grade 10 could be 1.5 years lower than the counterfactual of no shock. These results were consistent with other studies (e.g., Andrabi et al., 2020) which found that even temporary school closures (e.g., 3 months) can cause considerable learning loss in the medium term.
Despite this evidence, other studies indicated that learning loss did not universally occur [27]. Tomasik et al., (2020) highlighted that learning in primary school students was largely slowed down by the school closure as compared to secondary school students, since they learned at more than twice the pace during in-person learning compared to distance learning (see also Hammerstein et al., 2021).
Consistently with the literature, in the present study, we sought to explore to what extent distance learning may have affected the learning of the main academic skills, especially if it occurred in the early stages of the learning process. Specifically, we posited that distance learning exerted a more significant influence when it occurred during the initial stages of the learning process, particularly at the first-grade level. To assess this hypothesis, the study compared student performance across multiple learning domains, including spelling, reading comprehension, reading speed and accuracy, and mathematical proficiency.
The results illustrate that learning loss is not homogeneous across different domains of academic skills. Significant differences in performance were observed between grades for spelling, reading comprehension, and written arithmetic calculations. Notably, students in the third grade, which experienced the consequences of pandemic breakdown in the early stages of learning were particularly affected, exhibiting a higher frequency of errors in the spelling-to-dictation task and lower accuracy in reading comprehension. Additionally, children in this grade seem to require more individualized attention, particularly in reading and spelling skills, as evidenced by their higher proportion in the “Immediate Intervention Required” category in the respective tasks. On the other hand, these domains were less affected in the fourth and fifth grade students, where some learning had already occurred before the Covid-19.
The results reported that children with clinical difficulties in spelling and reading comprehension were more likely to occur in the third grade-group as compared to the others. These results were consistent with Kaffenberger (2021). In fact, Kaffenberger, advanced a short-term remediation effort when these children returned to grade 4. Specifically, this model “assumes one-third of the grade 3 curriculum is covered during grade 4 before moving on to grade 4 topics. Starting in grade 5, instruction reverts to the previously established (pre-pandemic) curriculum and instructional levels. This is a “short-term” remediation model. Modeling this with the more conservative assumption of the loss of one-third of grade 3 learning from school closures, such short-term remediation mitigates about half of the grade 10 learning deficit, reducing the long-term impact of the shock to one-half of a school year.”. The results of our study were also consistent with the findings of Maldonado and De Witte (2020; see also Kuhfeld et al. 2020), which suggested that students in the lower elementary grades were more vulnerable to learning disruptions due to their developmental reliance on structured learning environments and teacher guidance.
The present study also outlined that learning losses during remote education affected different domains. For instance, reading speed showed a linear increase across grades, indicating a progressive improvement that might not be affected by the remote learning conditions. In contrast, reading comprehension and spelling required more intervention, particularly for third-grade students. On the other hand, mathematical skills presented mixed outcomes: while written arithmetic calculations exhibited a significant decline for younger students, knowledge about numbers remained relatively stable. This suggests that while basic conceptual understanding may be less affected by remote learning, the procedural application of mathematical skills is highly sensitive to disruptions in the learning environment. The discrepancy about the impact of remote learning on different domains has been highlighted in the literature (Lerkkanen et al., 2023; see Cortés-Albornoz for a review). For example, Lerkkanen and colleagues (2023), examined the impact of the COVID-19 pandemic and related 8-week school closures on the reading and math skill development of Finnish primary school children, comparing a COVID sample to a pre-COVID sample. The authors found that the development of reading fluency and reading comprehension was slower in the COVID sample compared to the pre-COVID sample. However, the authors did not find any significant differences in math skills in both samples.
Alongside studies highlighting the negative impact of distance learning on mental health (Rega et al., 2022; Maggio et al., 2021), this work adds new evidence on its adverse effects on the acquisition of reading comprehension, and spelling skills, particularly when it occurred during the early stages of learning. It is also possible that this learning loss led to a clinically significant decline in children who already exhibited weaknesses in these areas, as highlighted by a higher frequency of performance falling within the “Immediate Intervention Required” category.
Our findings underscore the necessity for differentiated and targeted interventions to address the observed learning losses. Specifically, since distance learning had more impact in the early stage of learning, future policies should focus on monitoring the learning skills and the extent to which they evolve in function of time as well as design interventions to provide additional support for these children. To mitigate the long-term consequences of learning disruptions, school systems could consider supplemental learning programs, such as after-school tutoring [40] or incorporating adaptive technology-based learning tools which may help to personalize learning for students and enable them to engage in self-paced practice [41]
Funding
This research received no external funding.
Institutional Review Board Statement
The study was conducted in accordance with the Declaration of Helsinki, and approved by the ethics committee) of Department of Humanistic Studies, University of Naples “Federico II”, Naples, Italy (N° prot. 3/2019).”
Acknowledgments
The authors gratefully acknowledge: Lucia Miranda, Marta Barone, Alessia Cirello, Enrica Cortile and Francesca Auricchio for helping with school recruitment and data collection.
Conflicts of Interest
The authors declare no conflicts of interest.
References
- Sampogna G, Del Vecchio V, Giallonardo V, et al. (2021) What is the role of resilience and coping strategies on the mental health of the general population during the covid-19 pandemic? Results from the italian multicentric comet study. Brain Sci 11:1231. [CrossRef]
- Sampogna G, Giallonardo V, Del Vecchio V, et al. (2021) Loneliness in Young Adults During the First Wave of COVID-19 Lockdown: Results From the Multicentric COMET Study. Front Psychiatry 12:. [CrossRef]
- Sampogna G, Pompili M, environmental AF-I journal of, 2021 undefined Mental health in the time of Covid-19 pandemic: A worldwide perspective. mdpi.com.
- Martin F, Borup J (2022) Online learner engagement: Conceptual definitions, research themes, and supportive practices. Educ Psychol 57:162–177. [CrossRef]
- Carter RA, Rice M, Yang S, Jackson HA (2020) Self-regulated learning in online learning environments: strategies for remote learning. Information and Learning Science 121:311–319. [CrossRef]
- Pattnaik J, Nath N (2023) Challenges and Efforts to Recover Pandemic-Induced Learning Losses: A Qualitative Analysis of Indian Primary School Teachers’ Perspectives. Early Child Educ J 1–17. [CrossRef]
- Jackson A, Melvin GA, Mulraney M, et al. (2023) Associations Between Anxiety and Home Learning Difficulties in Children and Adolescents with ADHD During the COVID-19 Pandemic. Child Psychiatry Hum Dev 54:1347–1359. [CrossRef]
- Korpa T, Pappa T, Chouliaras G, et al. (2021) Daily behaviors, worries and emotions in children and adolescents with adhd and learning difficulties during the covid-19 pandemic. Children 8:. [CrossRef]
- Donnelly R, Patrinos HA (2022) Learning loss during Covid-19: An early systematic review. Prospects (Paris) 51:601–609.
- Cortés-Albornoz MC, Ramírez-Guerrero S, García-Guáqueta DP, et al. (2023) Effects of remote learning during COVID-19 lockdown on children’s learning abilities and school performance: A systematic review. Int J Educ Dev 101.
- Orlov G, McKee D, Berry J, et al. (2021) Learning during the COVID-19 pandemic: It is not who you teach, but how you teach. Econ Lett 202:109812. [CrossRef]
- Uğraş M, Zengin E, Papadakis S, Kalogiannakis M (2023) Early Childhood Learning Losses during COVID-19: Systematic Review. Sustainability (Switzerland) 15:. [CrossRef]
- McCoy DC, Cuartas J, Behrman J, et al. (2021) Global estimates of the implications of COVID-19-related preprimary school closures for children’s instructional access, development, learning, and economic wellbeing. Child Dev 92:e883–e899. [CrossRef]
- Engzell P, Frey A, Verhagen MD (2021) Learning loss due to school closures during the COVID-19 pandemic. Proc Natl Acad Sci U S A 118:e2022376118. [CrossRef]
- Toker T (2022) Detecting Possible Learning Losses due to COVID-19 Pandemic: An Application of Curriculum-Based Assessment. International Journal of Contemporary Educational Research 9:78–86. [CrossRef]
- Kuhfeld M, Soland J, Lewis K, et al. (2022) The COVID-19 School Year: Learning and Recovery Across 2020-2021. AERA Open 8:. [CrossRef]
- Kuhfeld M, Tarasawa B, Johnson A, et al. (2020) Learning during COVID-19: Initial Findings on Students’ Reading and Math Achievement and Growth. Brief. NWEA.
- Kuhfeld M, Soland J, Tarasawa B, et al. (2020) Projecting the Potential Impact of COVID-19 School Closures on Academic Achievement. Educational Researcher 49:549–565. [CrossRef]
- de Haas M, Faber R, Hamersma M (2020) How COVID-19 and the Dutch ‘intelligent lockdown’ change activities, work and travel behaviour: Evidence from longitudinal data in the Netherlands. Transp Res Interdiscip Perspect 6:100150. [CrossRef]
- Domingue BW, Dell M, Lang D, et al. (2022) The Effect of COVID on Oral Reading Fluency During the 2020–2021 Academic Year. AERA Open 8:. [CrossRef]
- Domingue BW, Hough HJ, Lang D, Yeatman J (2021) Changing Patterns of Growth in Oral Reading Fluency during the COVID-19 Pandemic. Working Paper. Policy Analysis for California Education, PACE.
- Angrist N, de Barros A, Bhula R, et al. (2021) Building back better to avert a learning catastrophe: Estimating learning loss from COVID-19 school shutdowns in Africa and facilitating short-term and long-term learning recovery. Int J Educ Dev 84:102397. [CrossRef]
- Hammerstein S, König C, Dreisörner T, Frey A (2021) Effects of COVID-19-Related School Closures on Student Achievement-A Systematic Review. Front Psychol 12:746289. [CrossRef]
- Irwin M, Lazarevic B, Soled D, Adesman A (2021) The COVID-19 pandemic and its potential enduring impact on children. Curr Opin Pediatr 34:107. [CrossRef]
- Nelson CA, Scott RD, Bhutta ZA, et al. (2020) Adversity in childhood is linked to mental and physical health throughout life. The BMJ 371:m3048. [CrossRef]
- Kaffenberger M (2021) Modelling the long-run learning impact of the Covid-19 learning shock: Actions to (more than) mitigate loss. Int J Educ Dev 81:. [CrossRef]
- Maldonado JE, De Witte K (2022) The effect of school closures on standardised student test outcomes. Br Educ Res J 48:49–94. [CrossRef]
- Tomasik MJ, Helbling LA, Moser U (2021) Educational gains of in-person vs. distance learning in primary and secondary schools: A natural experiment during the COVID-19 pandemic school closures in Switzerland. International Journal of Psychology 56:566–576. [CrossRef]
- Gonzalez T, De la Rubia MA, Hincz KP, et al. (2020) Influence of COVID-19 confinement on students’ performance in higher education. PLoS One 15:e0239490. [CrossRef]
- Gore J, Fray L, Miller A, et al. (2021) The impact of COVID-19 on student learning in New South Wales primary schools: an empirical study. Aust Educ Res 48:605–637. [CrossRef]
- Colvin MK, Reesman J, Glen T (2022) The impact of COVID-19 related educational disruption on children and adolescents: An interim data summary and commentary on ten considerations for neuropsychological practice. Clinical Neuropsychologist 36:45–71. [CrossRef]
- Cornoldi C, Miato L, Molin A, Poli S (2023) PRCR-2/2009. Prove di prerequisito per la diagnosi delle difficoltà di lettura e scrittura. 1–112.
- Pra Baldi A, Carretti B, Cornoldi C, Giofre D (2016) Prove MT Clinica – Cesare Cornoldi.
- Landerl K, Wimmer H, Frith U (1997) The impact of orthographic consistency on dyslexia: A German-English comparison. Cognition 63:315–334. [CrossRef]
- Guercini C Disturbi specifici dell’apprendimento.
- Cornoldi C, Patrizio MA (2012) BVSCO-2 | Valutazione della Scrittura e della Competenza Ortografica | Giunti EDUcare.
- Cornoldi C, Lucangeli D, Perini N (2002) Test AC-MT 6-11 anni | Valutazione calcolo e soluzione problemi.
- Cox MK, Key CH (1993) Post hoc pair-wise comparisons for the chi-square test of homogeneity of proportions. Educ Psychol Meas 53:951–962. [CrossRef]
- Lerkkanen MK, Pakarinen E, Salminen J, Torppa M (2023) Reading and math skills development among Finnish primary school children before and after COVID-19 school closure. Read Writ 36:263–288. [CrossRef]
- Zoido P, Flores-Ceceña I, Székely M, et al. (2024) Remote tutoring with low-tech means to accelerate learning: Evidence for El Salvador. Econ Educ Rev 98:102506. [CrossRef]
- Nurrijal, Setyosari P, Kuswandi D, Ulfa S (2023) Creative Problem Solving Process Instructional Design in the Context of Blended Learning in Higher Education. Electronic Journal of e-Learning 21:80–97. [CrossRef]
Figure 1.
Mean of errors, between females and males and across grades in the spelling-to-dictation task. Error bars show the standard errors. Asterisks highlight the significant comparisons.
Figure 1.
Mean of errors, between females and males and across grades in the spelling-to-dictation task. Error bars show the standard errors. Asterisks highlight the significant comparisons.
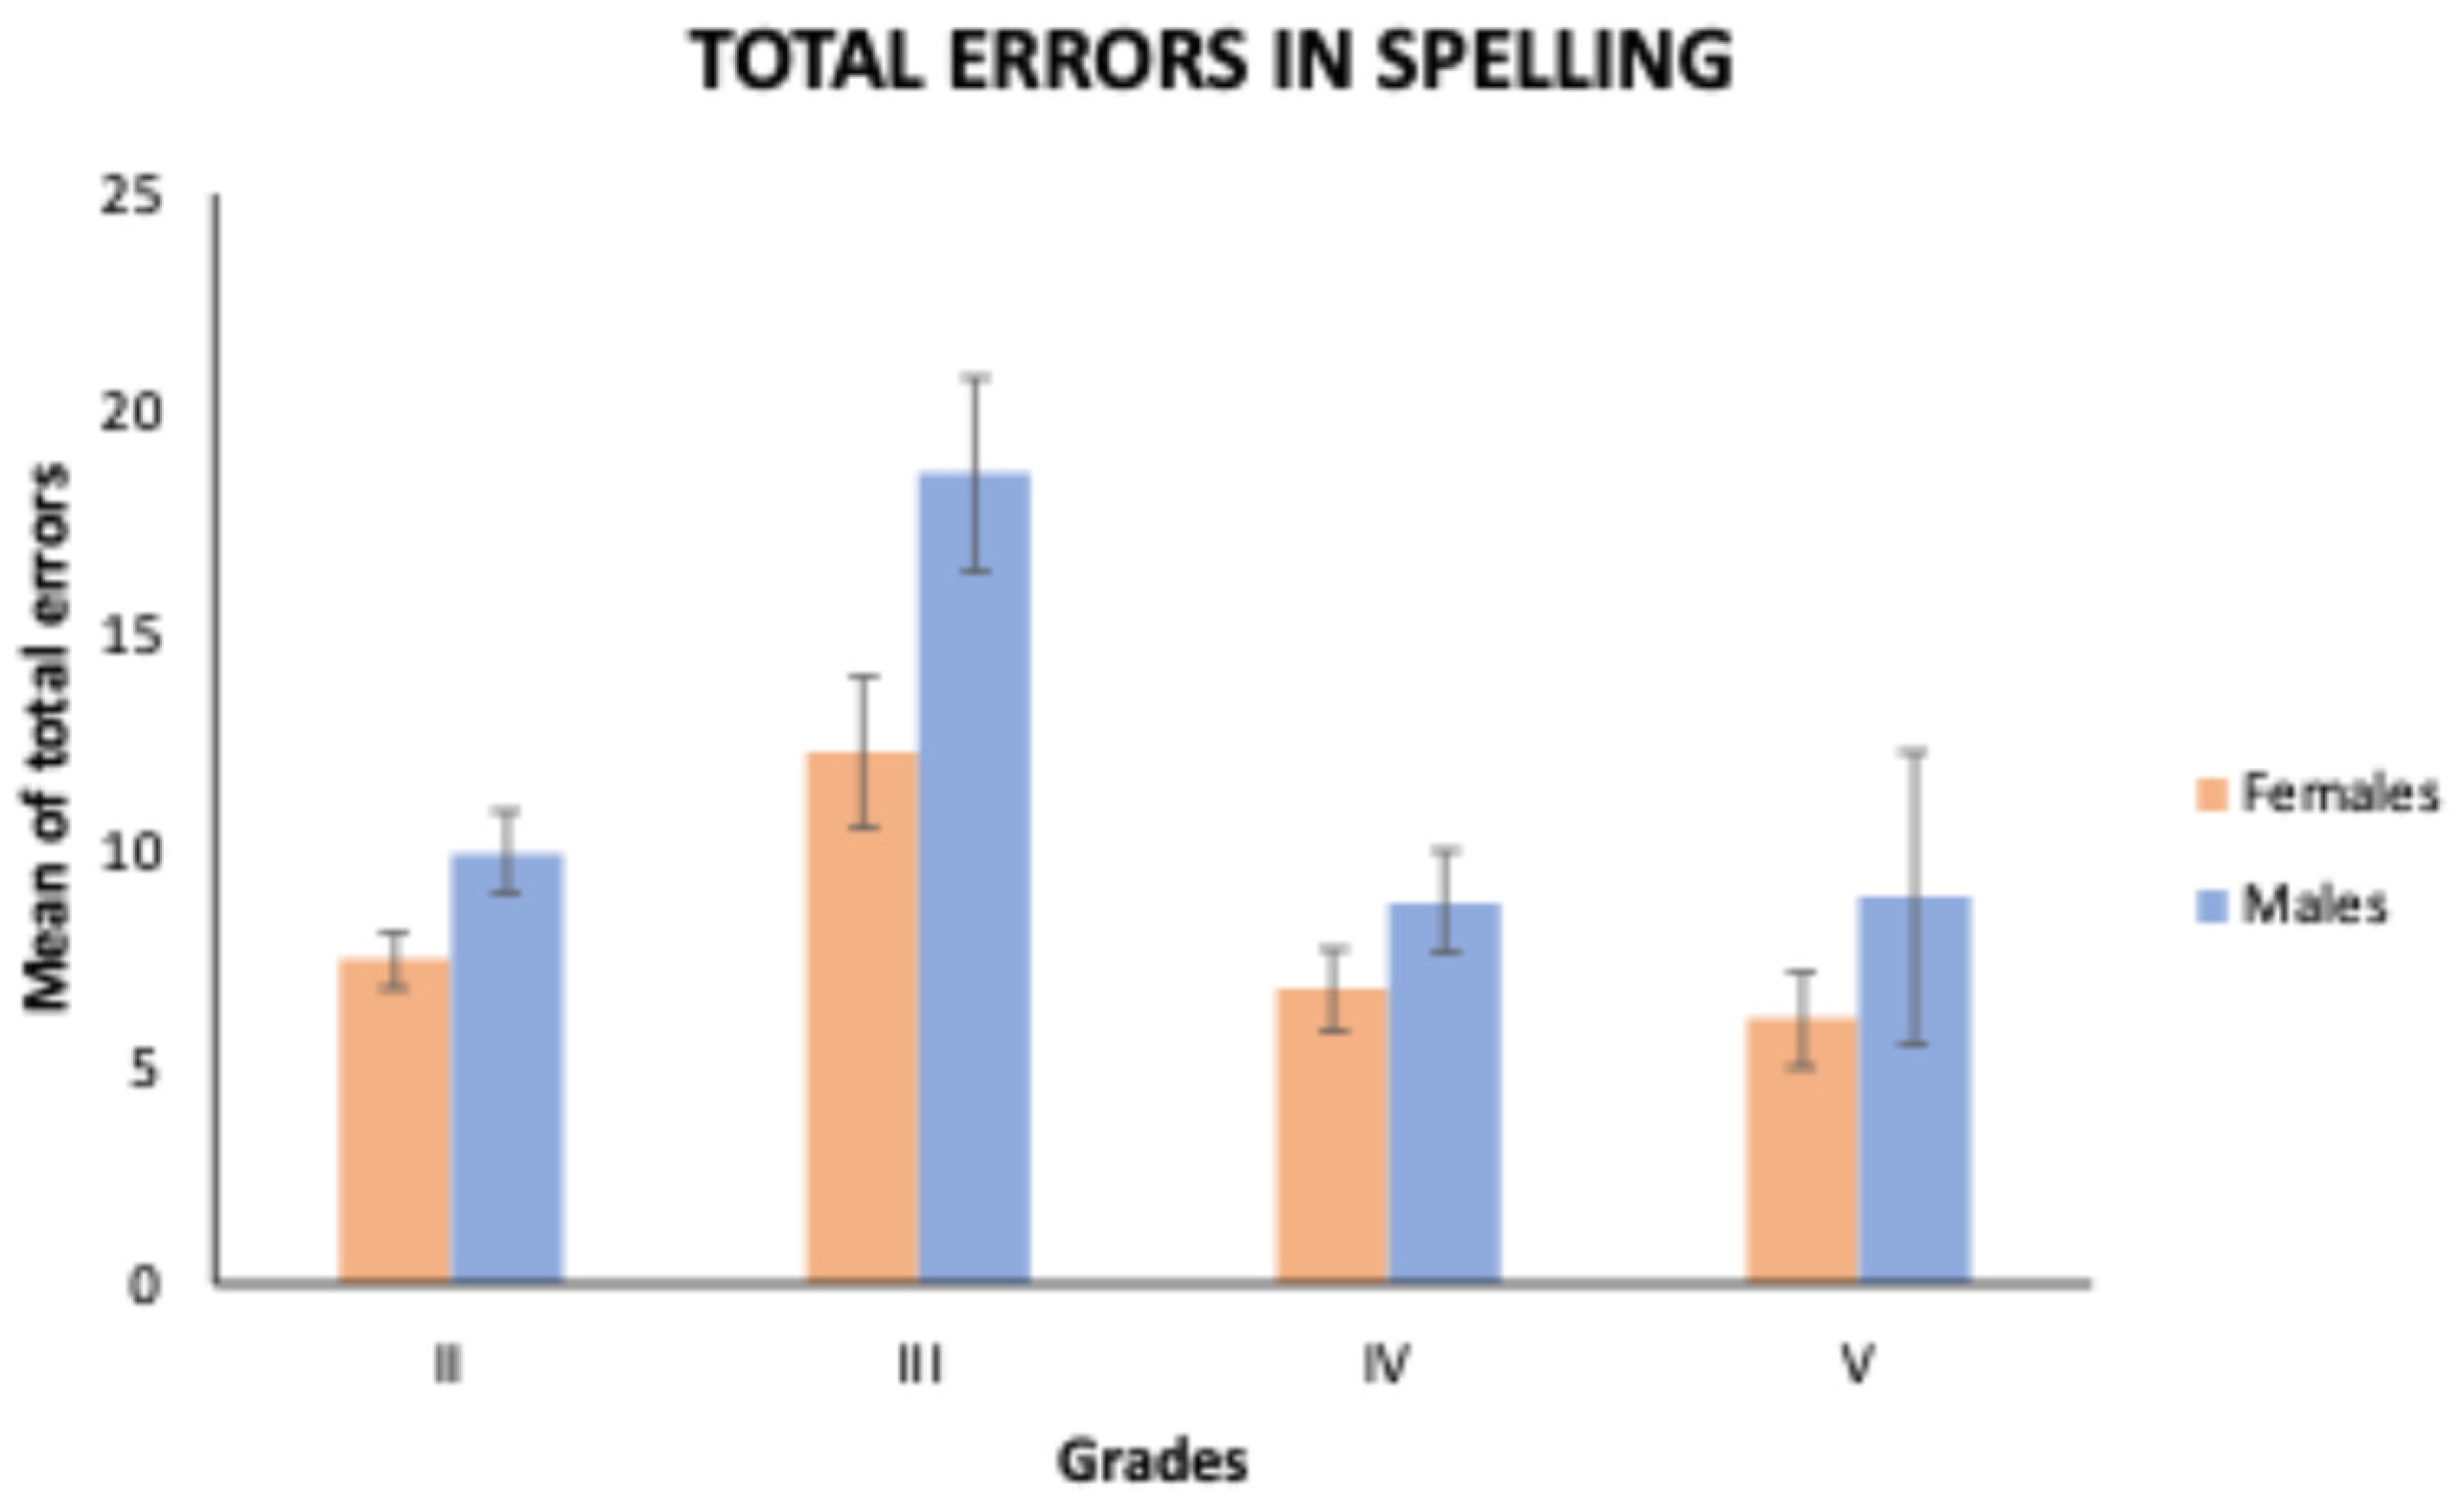
Figure 2.
Mean of errors, between females and males and across grades in the comprehension task. Error bars show the standard errors. Asterisks highlight the significant comparisons.
Figure 2.
Mean of errors, between females and males and across grades in the comprehension task. Error bars show the standard errors. Asterisks highlight the significant comparisons.
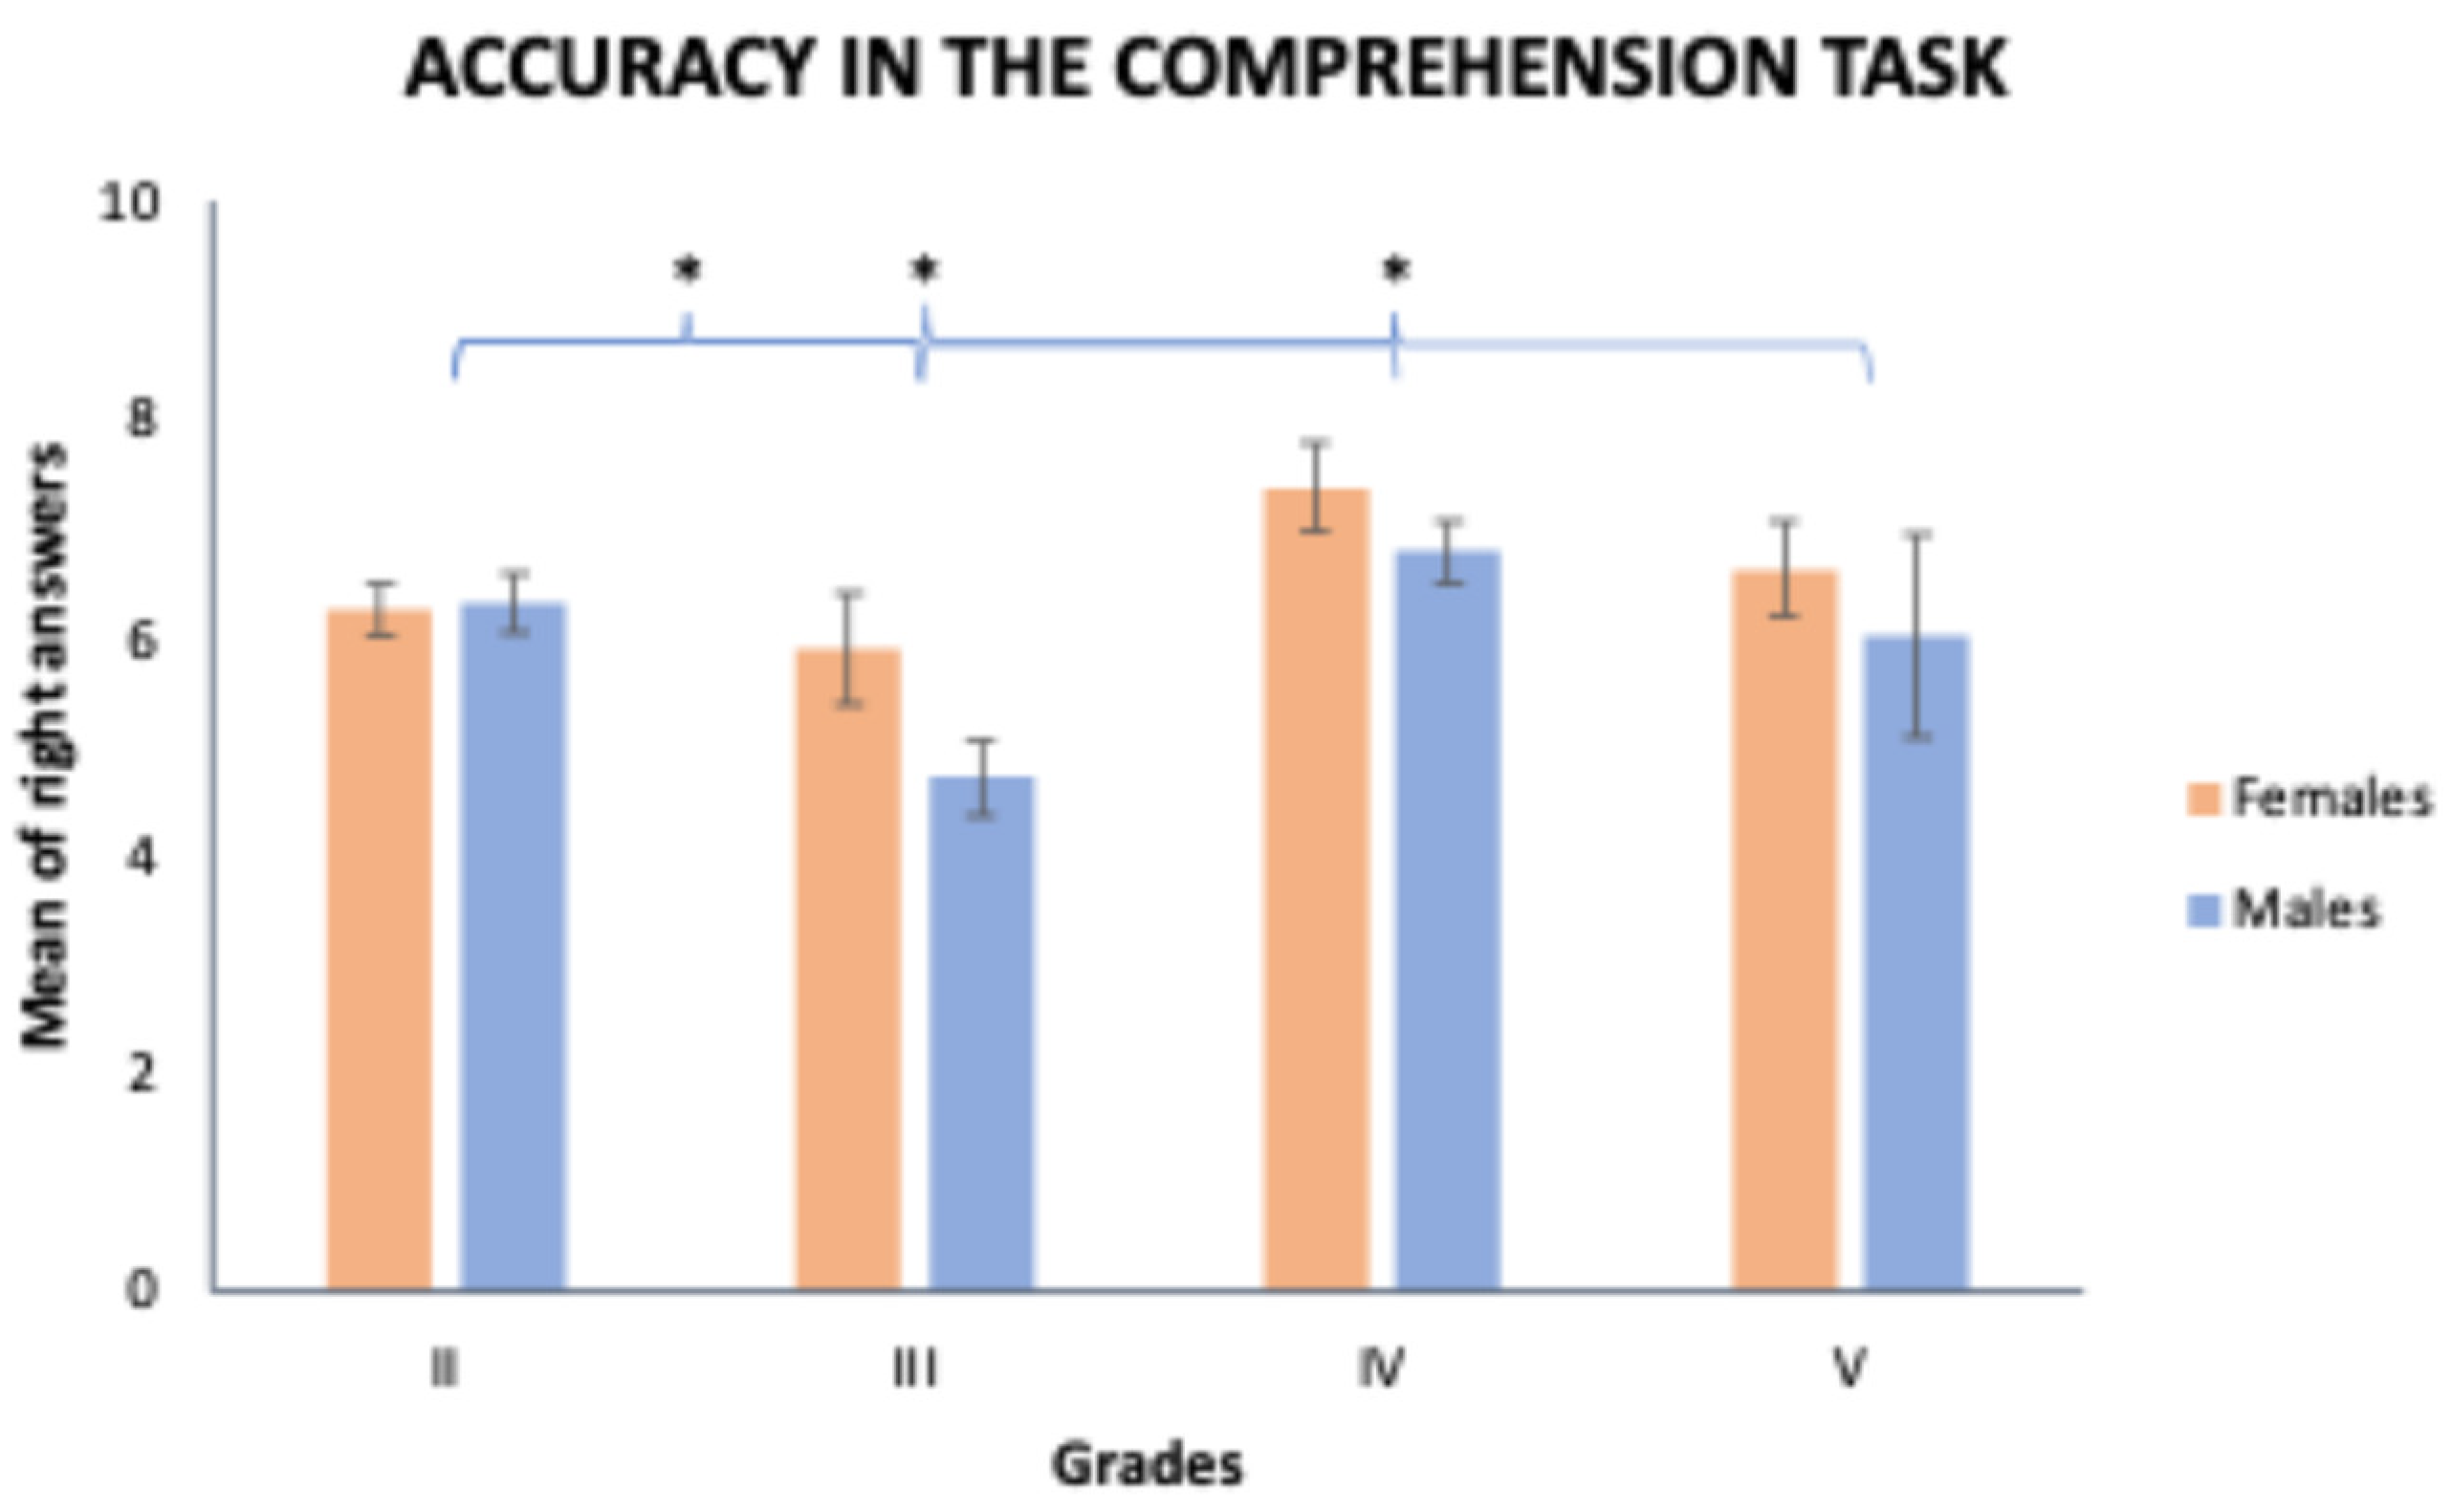
Figure 3.
Mean of errors, between females and males and across grades in the written arithmetic calculation task. Error bars show the standard errors. Asterisks highlight the significant comparisons.
Figure 3.
Mean of errors, between females and males and across grades in the written arithmetic calculation task. Error bars show the standard errors. Asterisks highlight the significant comparisons.
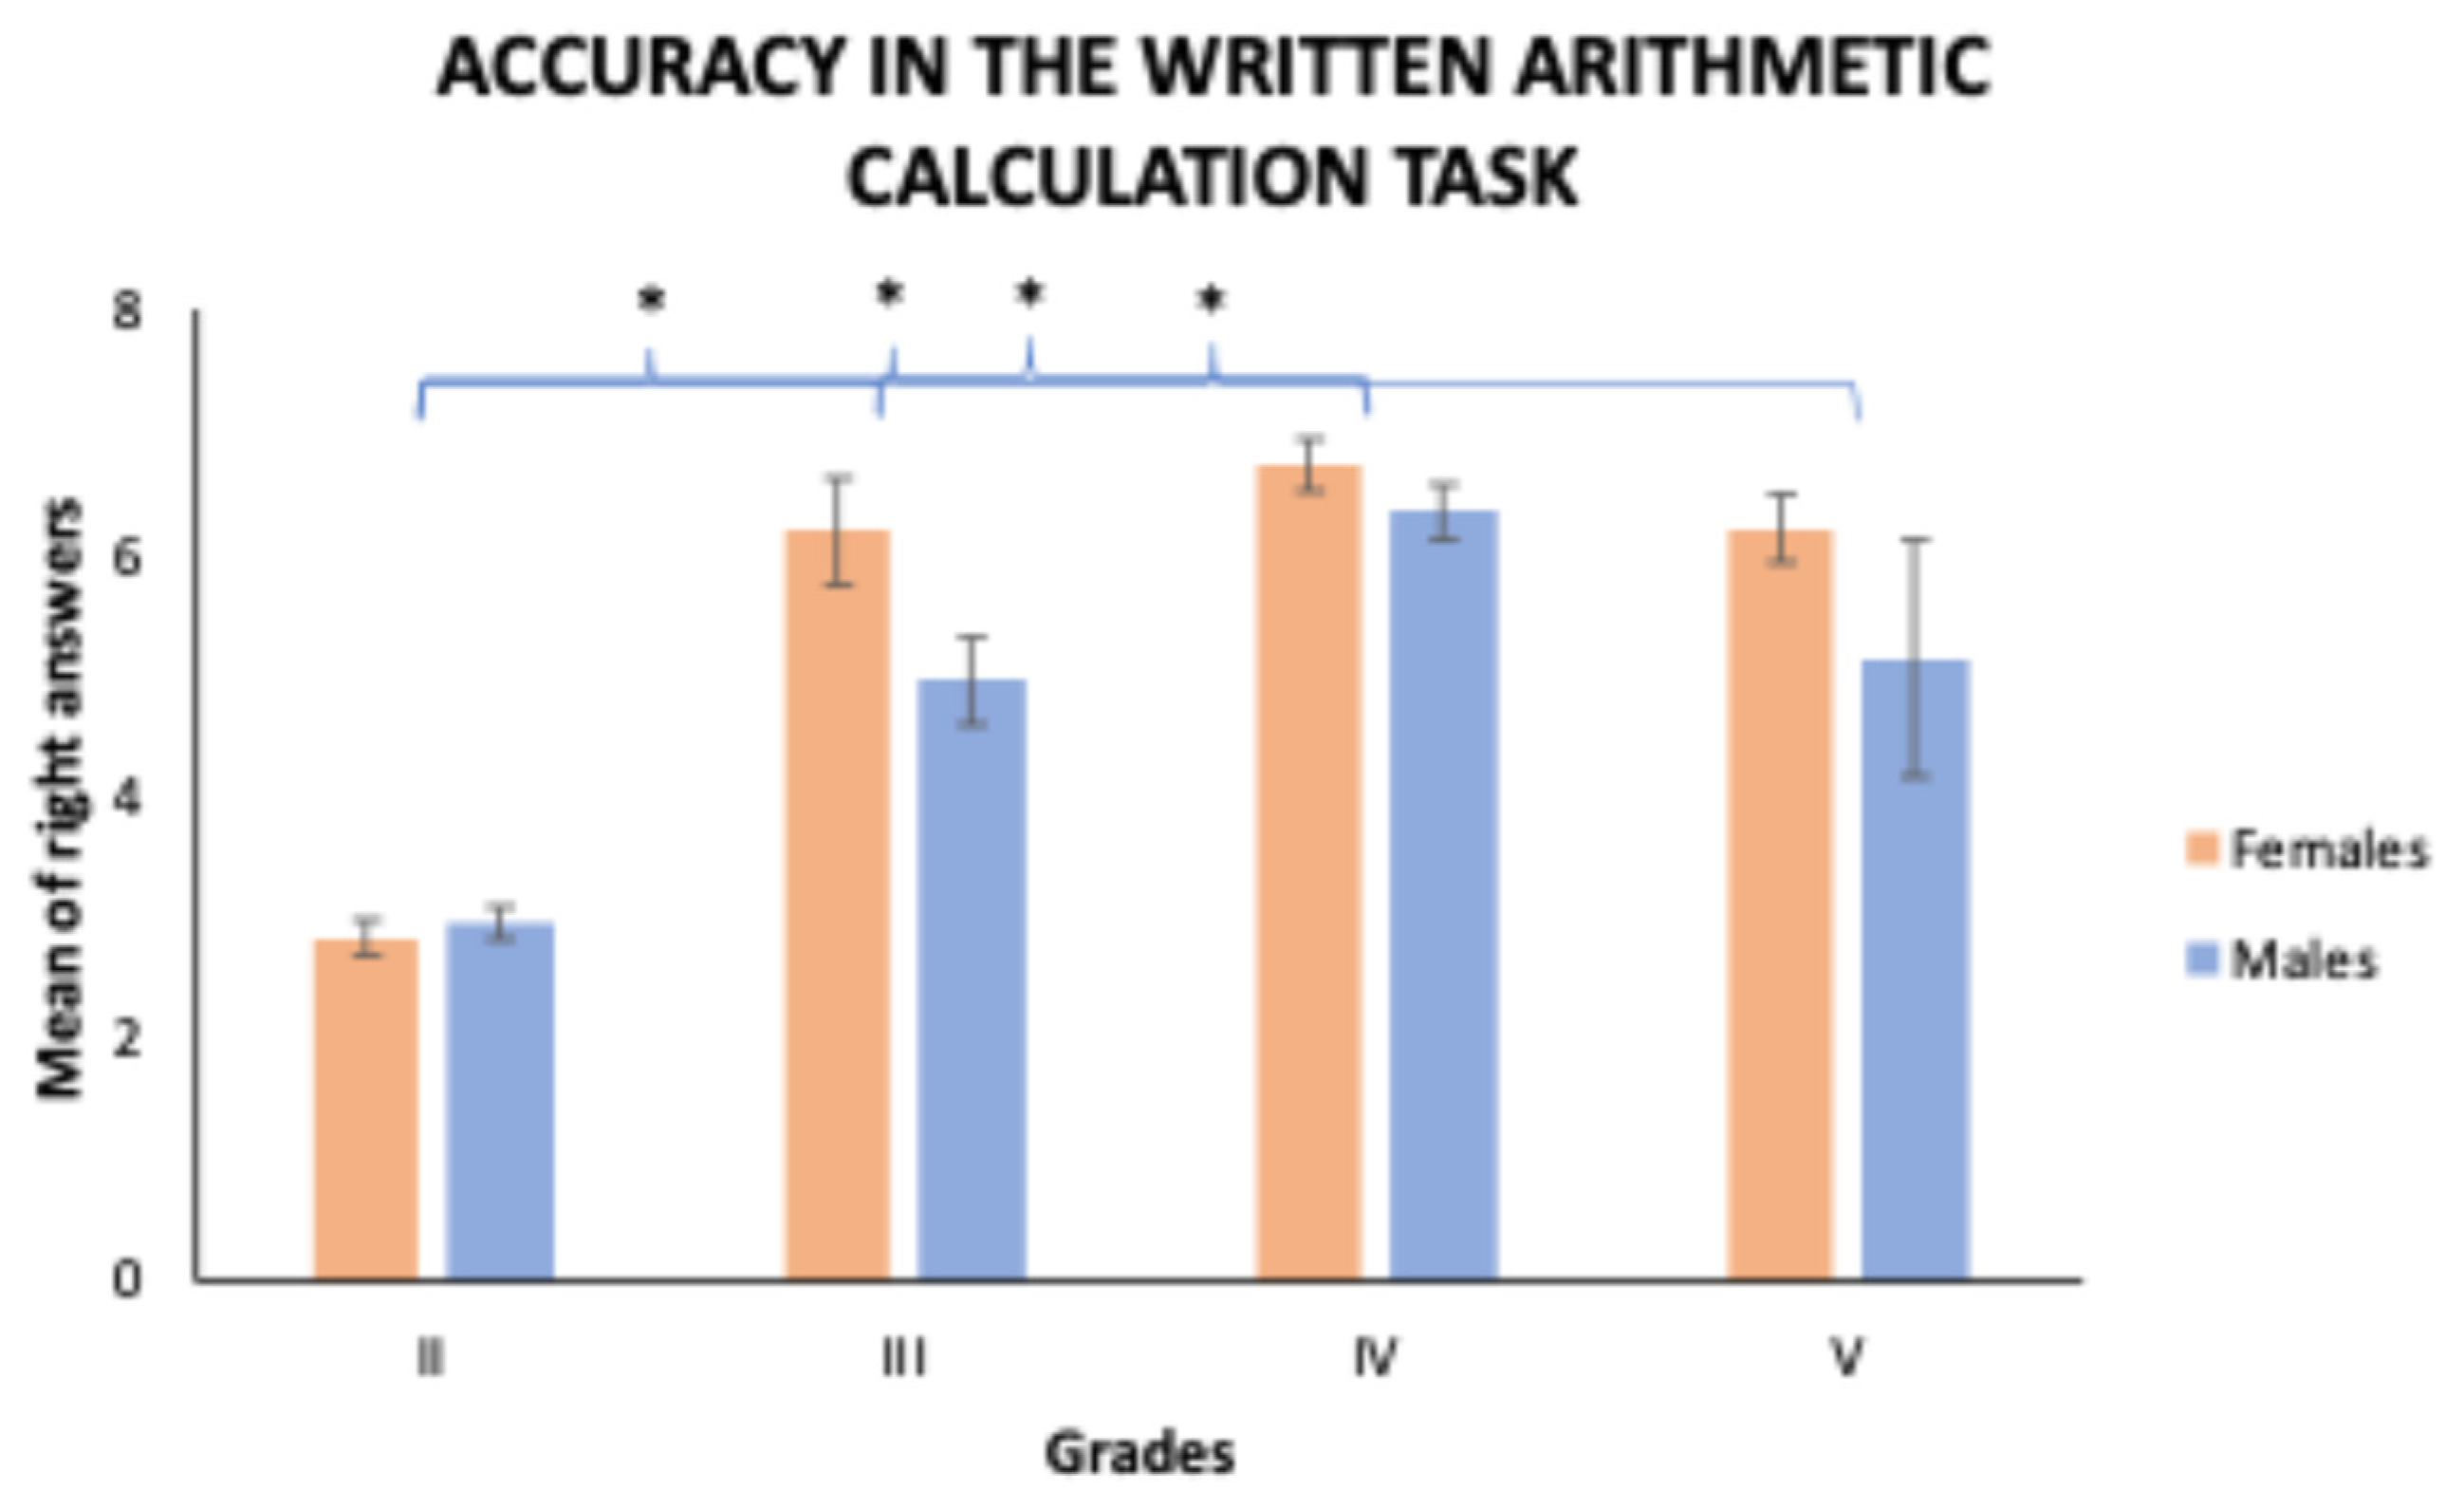
Figure 4.
Mean of errors, between females and males and across grades in the tasks taping the knowledge about the numbers. Error bars show the standard errors. Asterisks highlight the significant comparisons.
Figure 4.
Mean of errors, between females and males and across grades in the tasks taping the knowledge about the numbers. Error bars show the standard errors. Asterisks highlight the significant comparisons.
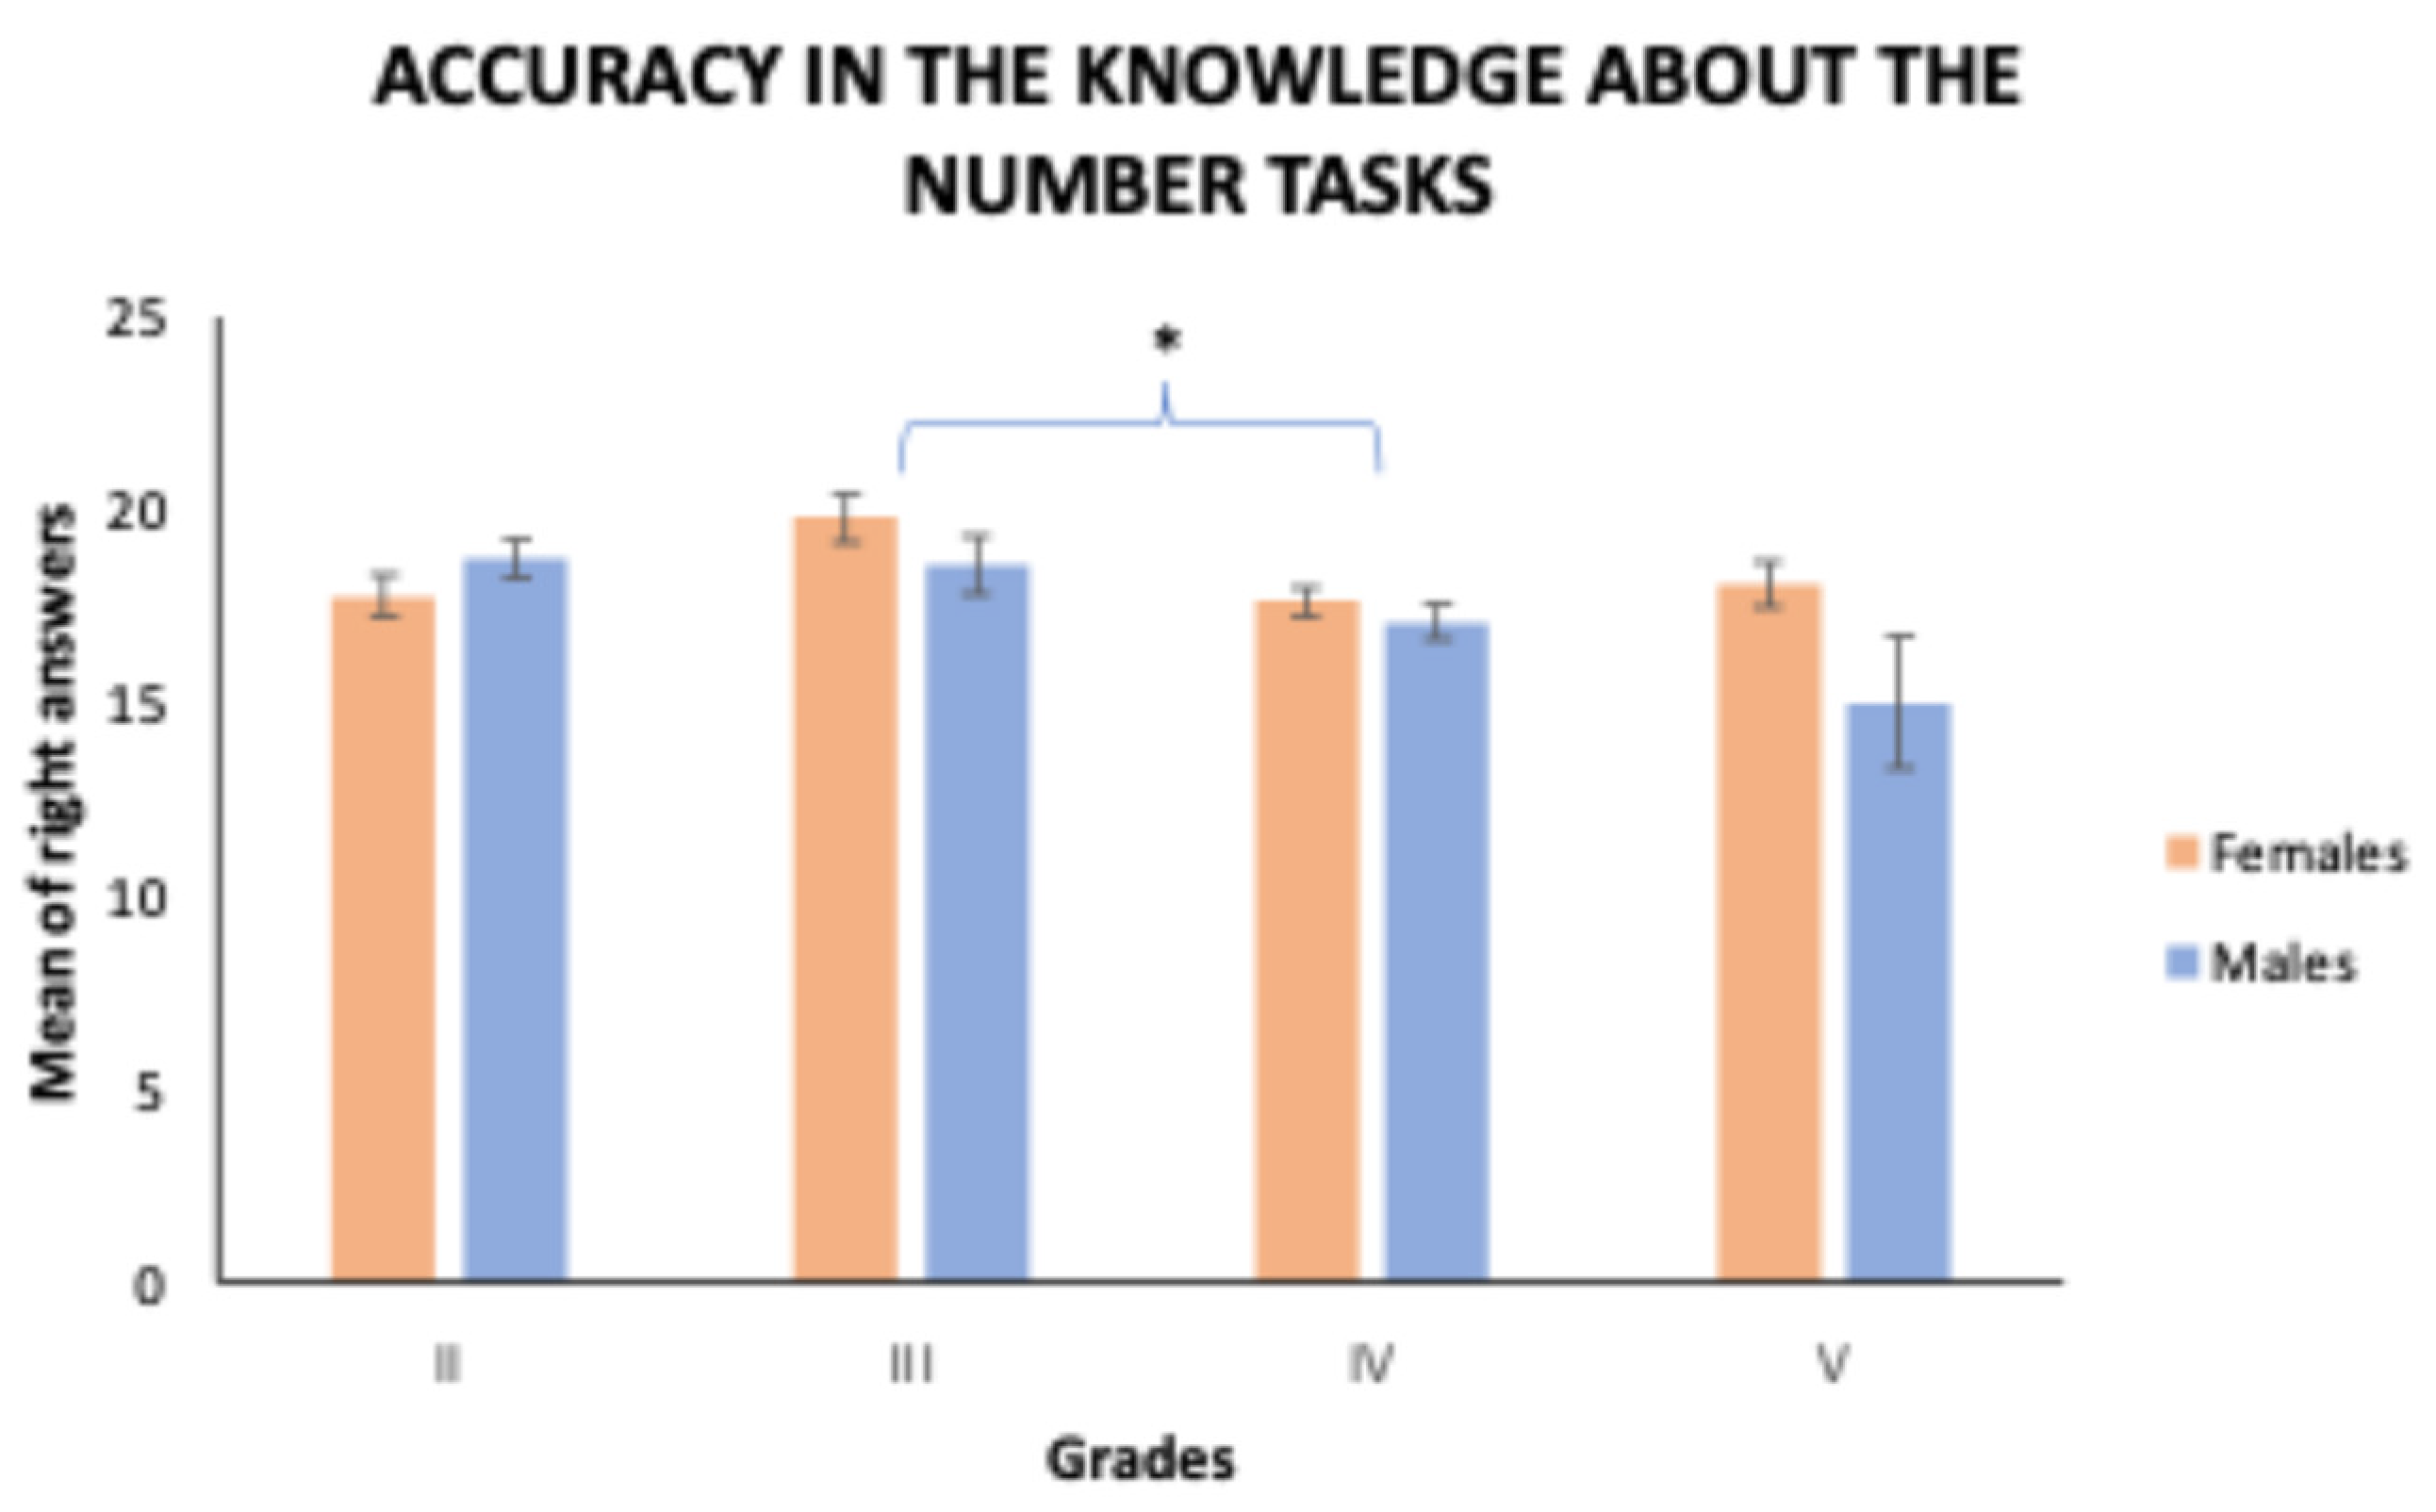
Figure 5.
Mean of errors, between females and males and across grades in the reading task. Error bars show the standard errors. Reading accuracy. The ANOVA failed to report any significant effect.
Figure 5.
Mean of errors, between females and males and across grades in the reading task. Error bars show the standard errors. Reading accuracy. The ANOVA failed to report any significant effect.
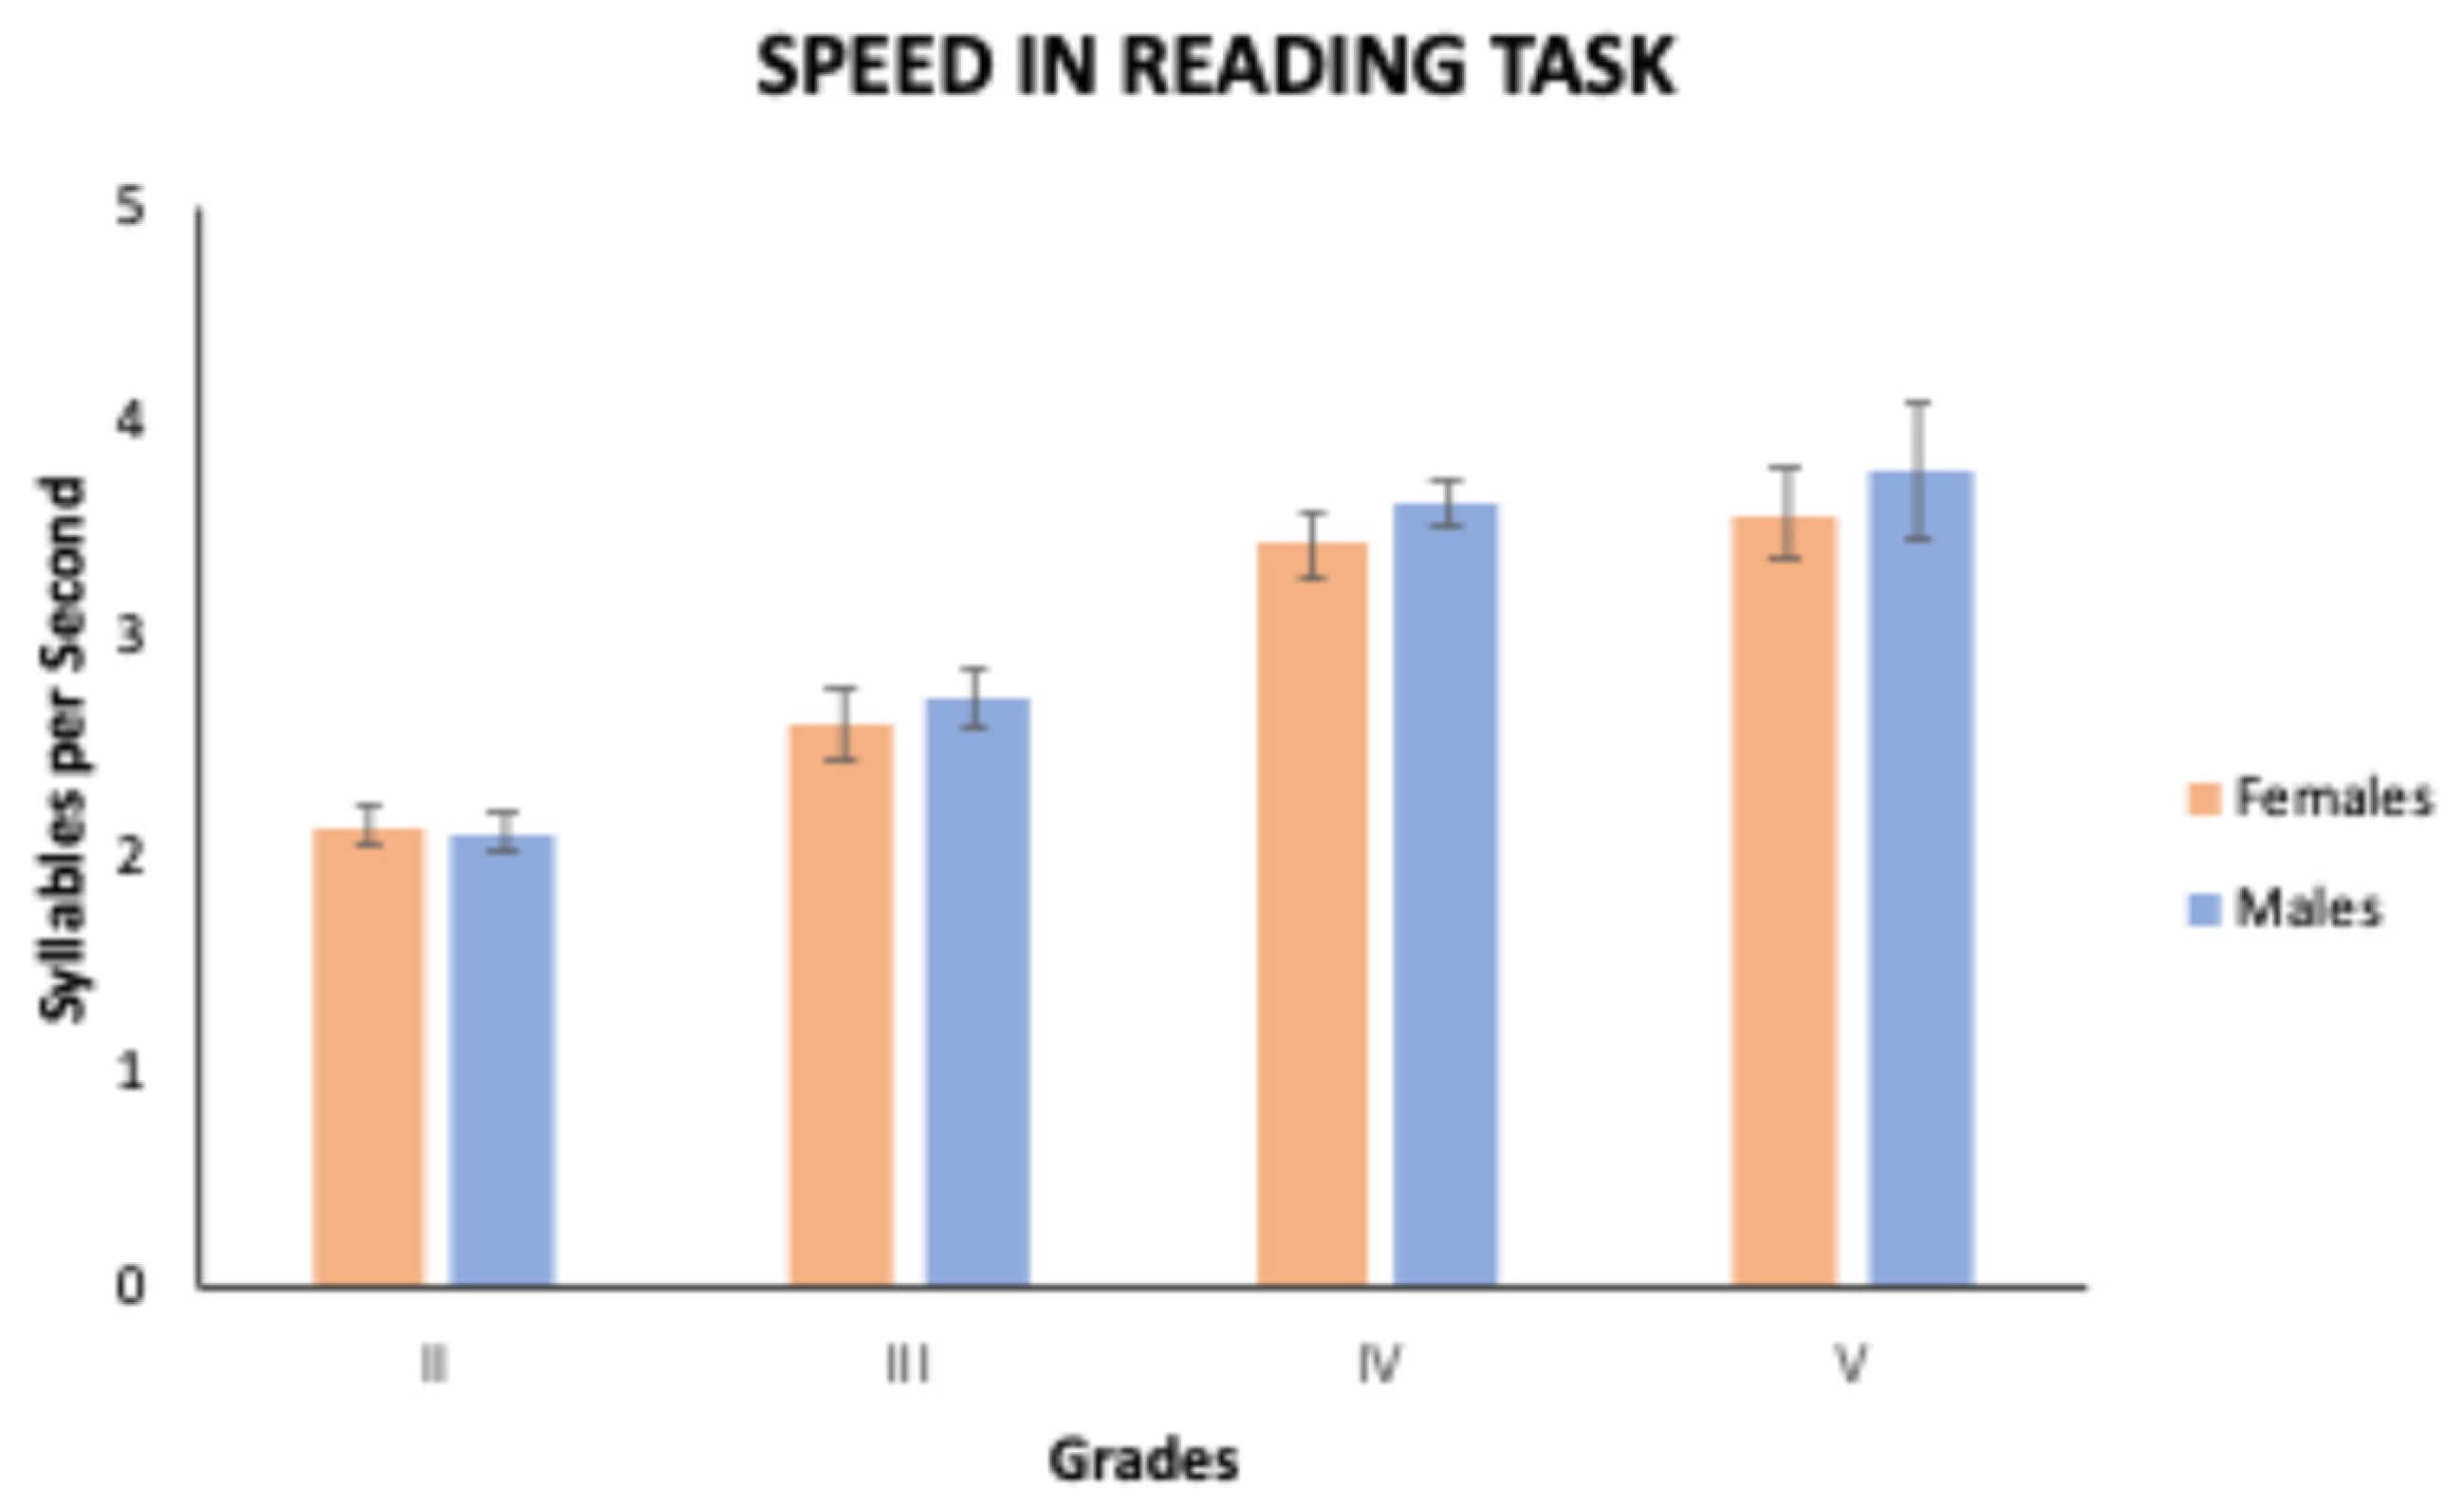

Table 1.
Distribution of males and females for each grade.
| Grade | Males | Females |
|---|---|---|
| II | 43.80% | 56.20% |
| III | 66% | 34% |
| IV | 57.84% | 42.16% |
| V | 27.59% | 72.41% |
1 Tables may have a footer.
Table 2.
Distribution of performance categories in spelling task across grades.
| Performance Category | |||||
|---|---|---|---|---|---|
| GRADE | Statistic | CAC | SP | AR | IIR |
| II | oij | 5 | 66 | 38 | 30 |
| eij | 8.40 | 69.29 | 31.92 | 29.40 | |
| X2 | 1.38 | 0.15 | 1.16 | 0.01 | |
| III | oij | 2 | 23 | 5 | 26 |
| eij | 3.38 | 27.92 | 12.86 | 11.84 | |
| X2 | 0.56 | 0.87 | 4.80 | 16.93 | |
| IV | oij | 8 | 59 | 28 | 7 |
| eij | 6.16 | 50.85 | 23.42 | 21.57 | |
| X2 | 0.55 | 1.30 | 0.89 | 9.84 | |
| V | oij | 5 | 17 | 5 | 7 |
| eij | 2.05 | 16.95 | 7.81 | 7.19 | |
| X2 | 4.24 | 0.0001 | 1.01 | 0.005 | |
| Calculated X2= 43.69 | |||||
| CAC= Completely Accomplished Criteria; SP= Sufficient Performance; AR= Attention Required; IIR= Immediate Intervention Required | |||||
Table 3.
Distribution of performance categories in comprehension across grades.
| Performance Category | |||||
|---|---|---|---|---|---|
| GRADE | Statistic | CAC | SP | AR | IIR |
| II | oij | 19 | 88 | 18 | 14 |
| eij | 21 | 82.31 | 19.74 | 15.96 | |
| X2 | 0.19 | 0.39 | 0.15 | 0.24 | |
| III | oij | 5 | 32 | 6 | 13 |
| eij | 8.46 | 33.16 | 7.95 | 6.43 | |
| X2 | 1.41 | 0.04 | 0.48 | 6.71 | |
| IV | oij | 17 | 60 | 18 | 7 |
| eij | 15.41 | 60.40 | 14.48 | 11.71 | |
| X2 | 0.16 | 0.002 | 0.85 | 1.89 | |
| V | oij | 9 | 16 | 5 | 4 |
| eij | 5.14 | 20.13 | 4.83 | 3.30 | |
| X2 | 2.89 | 0.84 | 0.006 | 0.002 | |
| Calculated X2= 16.31 | |||||
| CAC= Completely Accomplished Criteria; SP= Sufficient Performance; AR= Attention Required; IIR= Immediate Intervention Required | |||||
Table 4.
Distribution of performance categories in written arithmetic calculations skills across grades.
Table 4.
Distribution of performance categories in written arithmetic calculations skills across grades.
| Performance Category | |||||
|---|---|---|---|---|---|
| GRADE | Statistic | CAC | SP | AR | IIR |
| II | oij | 52 | 57 | 13 | 17 |
| eij | 43.67 | 60.47 | 21.42 | 13.44 | |
| X2 | 1.59 | 0.20 | 3.30 | 0.94 | |
| III | oij | 15 | 22 | 13 | 6 |
| eij | 17.60 | 24.36 | 8.63 | 5.42 | |
| X2 | 0.38 | 0.23 | 2.21 | 0,06 | |
| IV | oij | 33 | 44 | 21 | 4 |
| eij | 32.05 | 44.37 | 15.72 | 9.86 | |
| X2 | 0.03 | 0.003 | 1.77 | 3.48 | |
| V | oij | 4 | 21 | 4 | 5 |
| eij | 10.68 | 14.79 | 5.24 | 3.29 | |
| X2 | 4.18 | 2.60 | 0.29 | 0.88 | |
| Calculated X2= 22.19 | |||||
| CAC= Completely Accomplished Criteria; SP= Sufficient Performance; AR= Attention Required; IIR= Immediate Intervention Required | |||||
Table 5.
Distribution of performance categories in knowledge about the number’s knowledge across grades.
Table 5.
Distribution of performance categories in knowledge about the number’s knowledge across grades.
| Performance Category | |||||
|---|---|---|---|---|---|
| GRADE | Statistic | CAC | SP | AR | IIR |
| II | oij | 51 | 58 | 14 | 16 |
| eij | 32.27 | 73.91 | 17.22 | 12.60 | |
| X2 | 10.87 | 3.42 | 0.60 | 0.91 | |
| III | oij | 26 | 16 | 10 | 4 |
| eij | 14.21 | 29.78 | 6.94 | 5.08 | |
| X2 | 9.78 | 6.37 | 1.34 | 0.23 | |
| IV | oij | 6 | 76 | 13 | 7 |
| eij | 25.89 | 54.24 | 12.63 | 9.24 | |
| X2 | 15.28 | 8.72 | 0.01 | 0.54 | |
| V | oij | 1 | 26 | 4 | 3 |
| eij | 8.63 | 18.08 | 4.21 | 3.08 | |
| X2 | 6.74 | 3.47 | 0.01 | 0.002 | |
| Calculated X2= 64.48 | |||||
| CAC= Completely Accomplished Criteria; SP= Sufficient Performance; AR= Attention Required; IIR= Immediate Intervention Required | |||||
Disclaimer/Publisher’s Note: The statements, opinions and data contained in all publications are solely those of the individual author(s) and contributor(s) and not of MDPI and/or the editor(s). MDPI and/or the editor(s) disclaim responsibility for any injury to people or property resulting from any ideas, methods, instructions or products referred to in the content. |
© 2024 by the authors. Licensee MDPI, Basel, Switzerland. This article is an open access article distributed under the terms and conditions of the Creative Commons Attribution (CC BY) license (http://creativecommons.org/licenses/by/4.0/).
Copyright: This open access article is published under a Creative Commons CC BY 4.0 license, which permit the free download, distribution, and reuse, provided that the author and preprint are cited in any reuse.


