1. Introduction
Glioblastoma (GBM) remains one of the most lethal cancers, with a median survival of only 12-15 months and a recurrence rate of about 90% within two years [
1,
2]. The current standard treatment, which involves maximal surgical resection followed by concurrent chemoradiation with temozolomide, has shown limited effectiveness in improving patient outcomes. Despite extensive research efforts to enhance clinical outcomes, treatment resistance remains due to several key challenges. GBM exhibits remarkable inter- and intra-tumoral heterogeneity, leading to genomic and cellular evolution under therapeutic pressure [
3,
4,
5,
6]. Additionally, the plasticity of GBM’s malignant states enables tumor cells to evade treatment through state transitions [
7]. The complex GBM microenvironment also plays crucial roles in disease progression and treatment resistance, characterized by hypoxia, high infiltration of tumor-associated microglia/macrophages (TAMs), and dynamic interactions with brain stromal cells [
8,
9,
10,
11]. Specifically, interactions between TAMs and glioma cells contribute to an immunosuppressive microenvironment that fosters tumor growth and facilitates resistance mechanisms [
12]. These features collectively promote irregular vessel development, an immunosuppressive microenvironment with mesenchymal transition, and treatment-induced synaptic plasticity [
4,
8,
9,
13]. Furthermore, the blood-brain barrier (BBB) poses additional challenges by limiting drug delivery to tumor cells [
14]. Therefore, understanding and modulating the tumor microenvironment (TME) has emerged as a key strategy to overcome current therapeutic limitations.
Odorant receptors (ORs), the largest family of G protein-coupled receptors (GPCRs), are best known for their role in olfactory signal transduction; however, emerging evidence reveals that they are widely expressed outside the olfactory system [
15,
16]. Their non-canonical functions have been highlighted in various diseases, including brain disorders and cancer [
15,
16,
17,
18,
19,
20,
21,
22,
23]. Several studies have demonstrated their potential as therapeutic targets and prognostic biomarkers in cancer, with OR51E2, also known as the prostate-specific G-protein receptor, and OR2B6 showing overexpression in prostate and breast carcinomas, respectively [
24,
25]. OR51E2 overexpression has been linked to cancer cell proliferation and migration, while OR2B6 overexpression in breast carcinoma contributes to invasive behavior and metastatic potential [
25,
26]. In immune regulation, Olfr78, the mouse ortholog of OR51E2, partners with a GPCR to influence macrophage polarization toward a protumoral M2 phenotype [
26]. Beyond cancer and immune regulation, OR dysregulation in brain stromal cells, including microglia, astrocytes, and neurons—central players in neuroinflammatory and degenerative processes—links OR function to mechanisms underlying brain disorders, highlighting their potential as therapeutic targets [
20,
22,
27,
28].
While our previous systematic analysis of adult gliomas using The Cancer Genome Atlas (TCGA) bulk RNA-seq data suggested potential therapeutic roles for ORs, the specific functions of ORs within distinct cell types of the TME remained unclear due to the limitations of bulk sequencing approaches that average signals across heterogeneous cell populations [
17,
18]. Given the complex cellular composition of GBM and the emerging roles of ORs in both tumor cells and the TME, a comprehensive analysis focusing on cell-type specific OR functions and their interactions with the TME is crucial. Here, we performed an integrated transcriptomic analysis by combining TCGA RNA-seq data with expanded single-cell RNA sequencing of GBM patients to identify the cell-type specific roles of ORs and their biological implications. This approach reveals previously undetected interactions between ORs and the TME that were not evident in bulk RNA-seq analyses. It also offers valuable insights into potential therapeutic strategies targeting GBM’s cellular heterogeneity and complex tumor-TME interactions.
2. Results
2.1. Comprehensive Analysis Reveals Distinct OR Expression Patterns in GBM
2.1.1. Distinct OR Expression Patterns in GBM Tissues
Principal component analysis of OR gene expression in TCGA GBM (IDH wildtype), TCGA lower grade glioma (LGG, IDH mutant), and GTEx cerebral cortex samples revealed distinct clustering patterns, demonstrating unique OR expression patterns in GBM compared to LGG and normal brain tissues (
Figure 1A). To identify dysregulated ORs in GBM, we performed differential gene expression analysis comparing GBM with normal brain and LGG tissues, identifying 92 down-regulated and 46 up-regulated ORs in GBM compared to normal brain tissue (
Table S1). Notably, among these dysregulated ORs, 8 up-regulated ORs and 7 down-regulated ORs maintained their expression changes when compared to LGG samples, suggesting their potential involvement in GBM-specific processes (
Figure 1B and C,
Table S1). Interestingly, several of these up-regulated ORs have been previously reported in other cancers. For instance, OR2B6 overexpression has been reported in breast cancer, and OR51E1 has been found to be elevated in advanced prostate cancer and other solid tumors, consistent with our findings [
17,
25,
29,
30,
31]. The persistent dysregulation of certain ORs, such as
OR2B6 and
OR51B5 in comparisons with both normal and LGG tissues suggests that these ORs may be involved in critical GBM-specific processes, potentially contributing to malignancy or treatment resistance. Analysis of OR family distribution revealed that OR family 7 was the most enriched (21%) in up-regulated ORs, while OR family 2 comprised the largest portion (28%) of down-regulated ORs (
Figure 1D). Interestingly, a significant proportion of dysregulated ORs were pseudogenes, with 52% of down-regulated and 32% of up-regulated ORs in this category, indicating that both functional OR genes and pseudogenes may contribute to GBM pathogenesis and its microenvironment (
Table S1).
2.1.2. Distinct OR expression patterns in neoplastic and non-neoplastic cells of GBM
To delineate OR expression patterns at the single-cell level, we analyzed combined GBM scRNA-seq datasets [
32], comprising 1.1 million cells from 240 patients across 26 independent cohorts. The cells were hierarchically classified across three levels: first by neoplastic (tumor-derived) versus non-neoplastic (microenvironment-derived) populations (level 1), followed by major cell types (level 2), and finally by specific cell subtypes (level 3) (
Figure 2A). Consistent with our TCGA GBM analysis, OR family 7 and 2 showed the highest enrichment in neoplastic and non-neoplastic cells, respectively, despite limited OR expression across cell populations (
Figure 1D and
Figure 2B). Differential gene expression analysis revealed that
OR4N2 was up-regulated in neoplastic cells as well as GBM tissues, suggesting its potential tumor-intrinsic function (
Figure 2C and
Table S1). Conversely,
OR2B11,
OR52K1, and
OR3A2 were up-regulated in GBM tissues and non-neoplastic cells, implying their roles in modulating the TME to promote tumorigenesis (
Figure 2C and
Table S1). Furthermore, cell-type specific analysis (annotated according to the reference methodology [
32]) indicated that
OR4N2 were expressed in neoplastic cells, while others such as
OR2B11 were specifically expressed in TME cells such as tumor-associated macrophages (TAM) (
Figure 2D and
Table S2). The specific expression of
OR4N2 in neoplastic cells suggests a possible role in tumor cell survival or proliferation, whereas the upregulation of
OR2B11 in tumor-associated macrophages (TAMs) points to a role in shaping the TME to support tumor growth. The cell-type specificity of OR expression was further validated through correlation analysis between OR expression levels and cell type-specific gene set scores in TCGA GBM tissues (
Figure S1).
2.2. Heterogeneous OR Expression Across Different GBM Malignant States
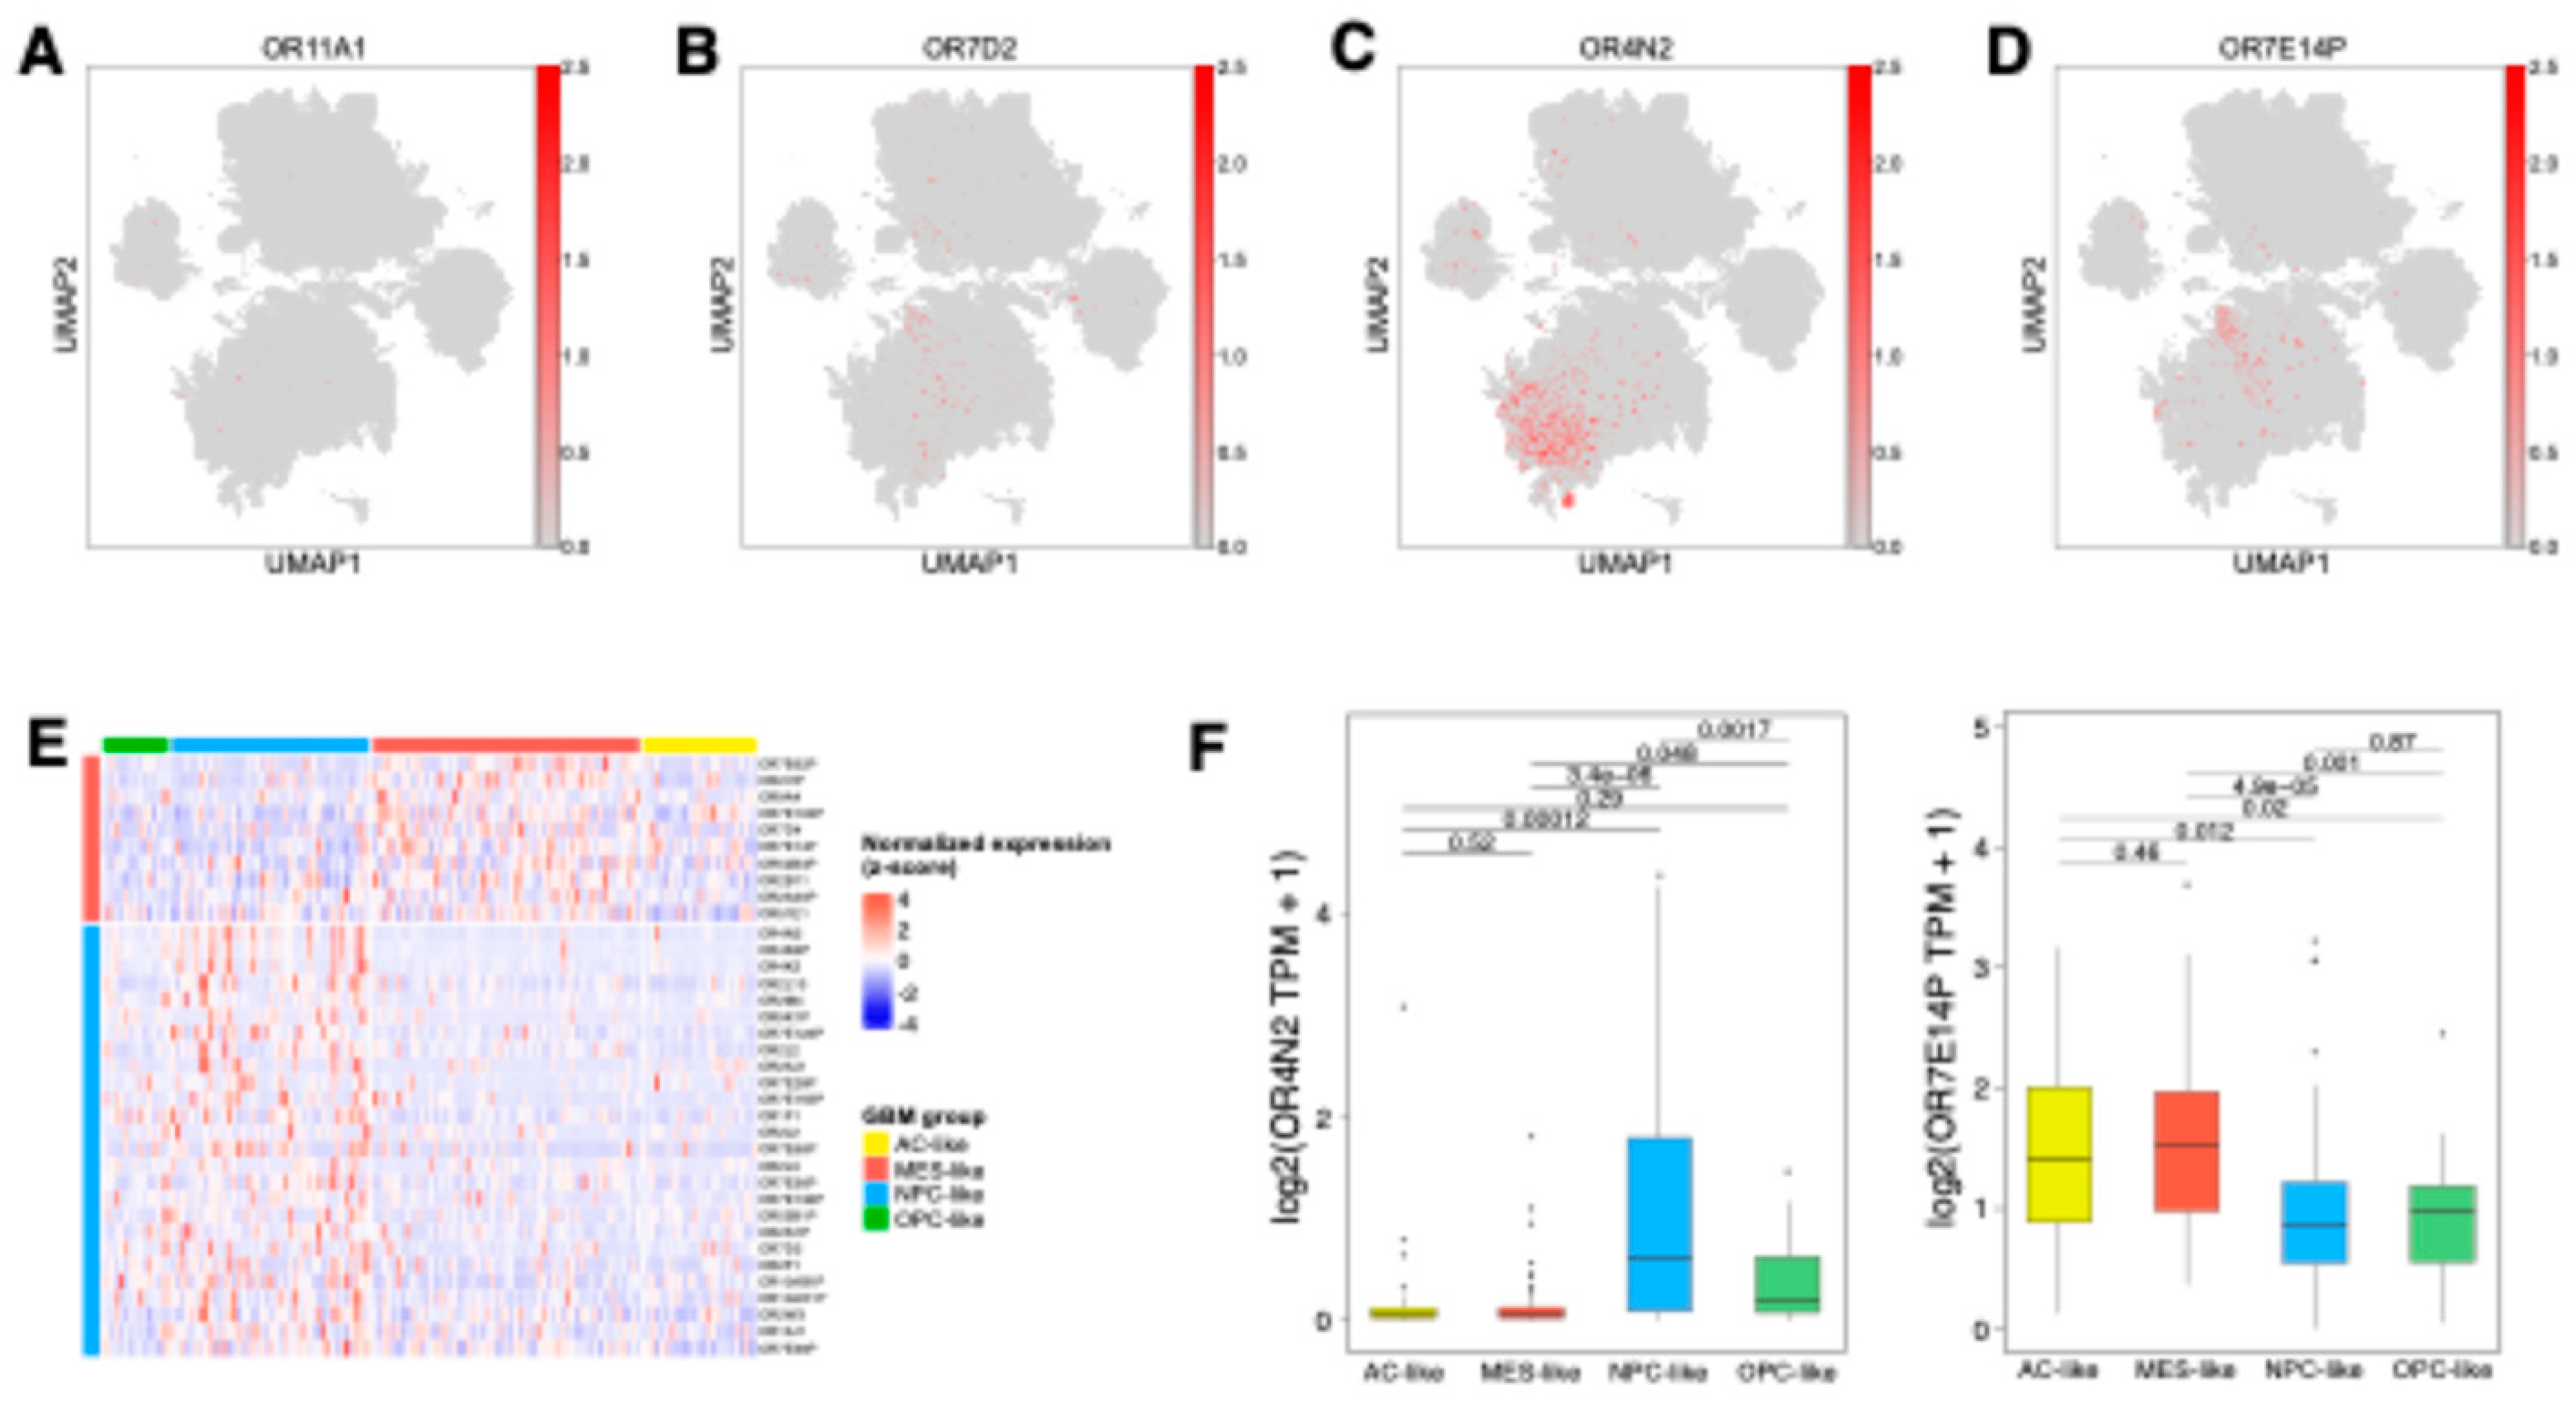
To examine the heterogeneity of OR expression within tumor cells, we analyzed OR expression patterns across four distinct GBM neoplastic cell states. Among the neoplastic-upregulated OR genes,
OR11A1 showed uniformly weak expression, while
OR7D2 exhibited significant expression across all malignant states (
Figure 3A and B,
Table S2). In contrast,
OR4N2 and
OR7E14P demonstrated state-specific patterns, with predominantly enriched in NPC/OPC-like and MES-like states, respectively (
Figure 3C and D). These findings highlighted the distinct regulation of ORs in different GBM cellular states. Despite minor discrepancies due to cellular plasticity and intra-tumoral heterogeneity, where multiple malignant states coexist within bulk tissue samples [
7], validation using TCGA GBM bulk tissue data corroborated these patterns.
OR4N2 exhibited significantly higher expression in tumors with NPC-like features, while
OR7E14P showed elevated expression in tumors with MES-like characteristics compared to other tumors (
Figure 3E and F). Although these state-associated OR genes showed no significant association with clinical outcomes (
Figure S2), these distinct expression patterns suggest that ORs may play specific roles in the unique biology of each malignant state, potentially influencing pathways linked to tumor plasticity and adaptive behaviors.
2.3. Pericyte-enriched OR51E1 promotes vascular remodeling and angiogenesis in GBM
Cell-type-specific OR expression analysis identified vascular-associated OR genes, including
OR51E1, in endothelial cells and pericytes (mural cells) (
Figure 2D,
Figure 4A). Sub-clustering analysis of vascular cells using scRNA-seq data revealed 10 distinct clusters (
Figure 4B), with clear separation between mural and endothelial cell populations (
Figure 4C). Clusters 0, 5, and 6 were enriched for endothelial cells, while clusters 1, 3, 4, 7, 8, and 9 were dominated by mural cells, with cluster 2 showing mixed populations. Among vascular-associated ORs,
OR51E1,
OR51E2,
OR3A2, and
OR7E38P demonstrated cluster-specific expression patterns (
Figure 4D and E,
Table S3). Notably,
OR51E1 exhibited prominent expression in clusters 1, 4, and 9, which were characterized by elevated levels of pericyte markers
RGS5 and
PDGFRB (
Figure 4F). VEGFA, a key regulator of vascular remodeling and angiogenesis [
33], was predominantly expressed in GBM neoplastic cells rather than vascular cells (
Figure S3), suggesting potential paracrine signaling between VEGFA-secreting tumor cells and
OR51E1-positive pericytes. Analysis of TCGA GBM dataset revealed
OR51E1’s strong correlations with vascular cell populations as well; correlation analysis with cell type-specific gene sets demonstrated significant positive associations with both mural (r = 0.63) and endothelial cells (r = 0.4), with mural cells showing stronger correlation (
Figure S4). Consistently,
OR51E1 expression showed significant positive correlations with gene sets of blood vessel remodeling and angiogenesis (
Figure 4G). Furthermore,
OR51E1-high GBM tissues showed significantly elevated expression of
RGS5,
PDGFRB, and
VEGFA compared to
OR51E1-low samples (
Figure 4H). The anatomical analysis using Ivy Glioblastoma Atlas dataset further substantiated these findings, demonstrating that significant
OR51E1 up-regulation in regions of microvascular proliferation and hyperplastic blood vessels (
Figure 4I). Taken together, these results suggest that OR51E1 plays a crucial role in GBM vasculature, particularly in pericyte-mediated vascular remodeling and tumor angiogenesis, potentially influencing tumor progression and therapeutic resistance.
2.4. OR genes modulate GBM aggressiveness via TAM-mediated mechanisms
We identified
OR2B11,
OR3A2, and
OR52K1 as GBM TME-specific genes with enriched expression in tumor-associated macrophages (TAMs) (
Figure 1 and
Figure 2). To understand their roles in TAM populations, including bone marrow-derived macrophages (TAM-BDM) and microglia (TAM-MG), we performed sub-clustering analysis using scRNA-seq data, revealing 14 distinct clusters (
Figure 5A). The TAM sub-clusters showed heterogeneous distribution of TAM-BDM and TAM-MG populations, with distinct OR expression patterns (
Figure 5B and C,
Table S4). Among these OR genes,
OR2B11 showed robust positive correlation with both TAM-BDM and TAM-MG in TCGA GBM tissues, consistent with scRNA-seq analysis (
Figure S1A and S5). Notably, cluster 8, enriched in TAM-BDM and characterized by elevated NF-κB and TGF-β signaling, showed exclusive
OR2B11 expression among OR genes (
Figure 5C and D). These pathways are key regulators of mesenchymal transition in GBM [
13,
34,
35]. Previous studies have demonstrated that MARCO-high TAMs promote immunosuppressive TME and aggressive tumor phenotypes by enhancing radiation resistance, stemness, and mesenchymal transition [
9,
36].
MARCO was up-regulated in cluster 8, and
OR2B11 showed significant positive correlation with
MARCO expression in this cluster (
Figure 5E and F). Consistently,
OR2B11 exhibited significantly higher expression in the mesenchymal subtype compared to other subtypes (
Figure 5G). Although the statistical significance was modest,
OR2B11 expression tended to be associated with poor survival (P = 0.087) and reduced response to anti-PD1 immunotherapy (P = 0.081) (
Figure 5H and I). Collectively, these results suggest that OR2B11 may serve as a potential therapeutic target for GBM by promoting mesenchymal transition and immunosuppressive TME through TAM regulation potentially driving aggressive tumor behavior.
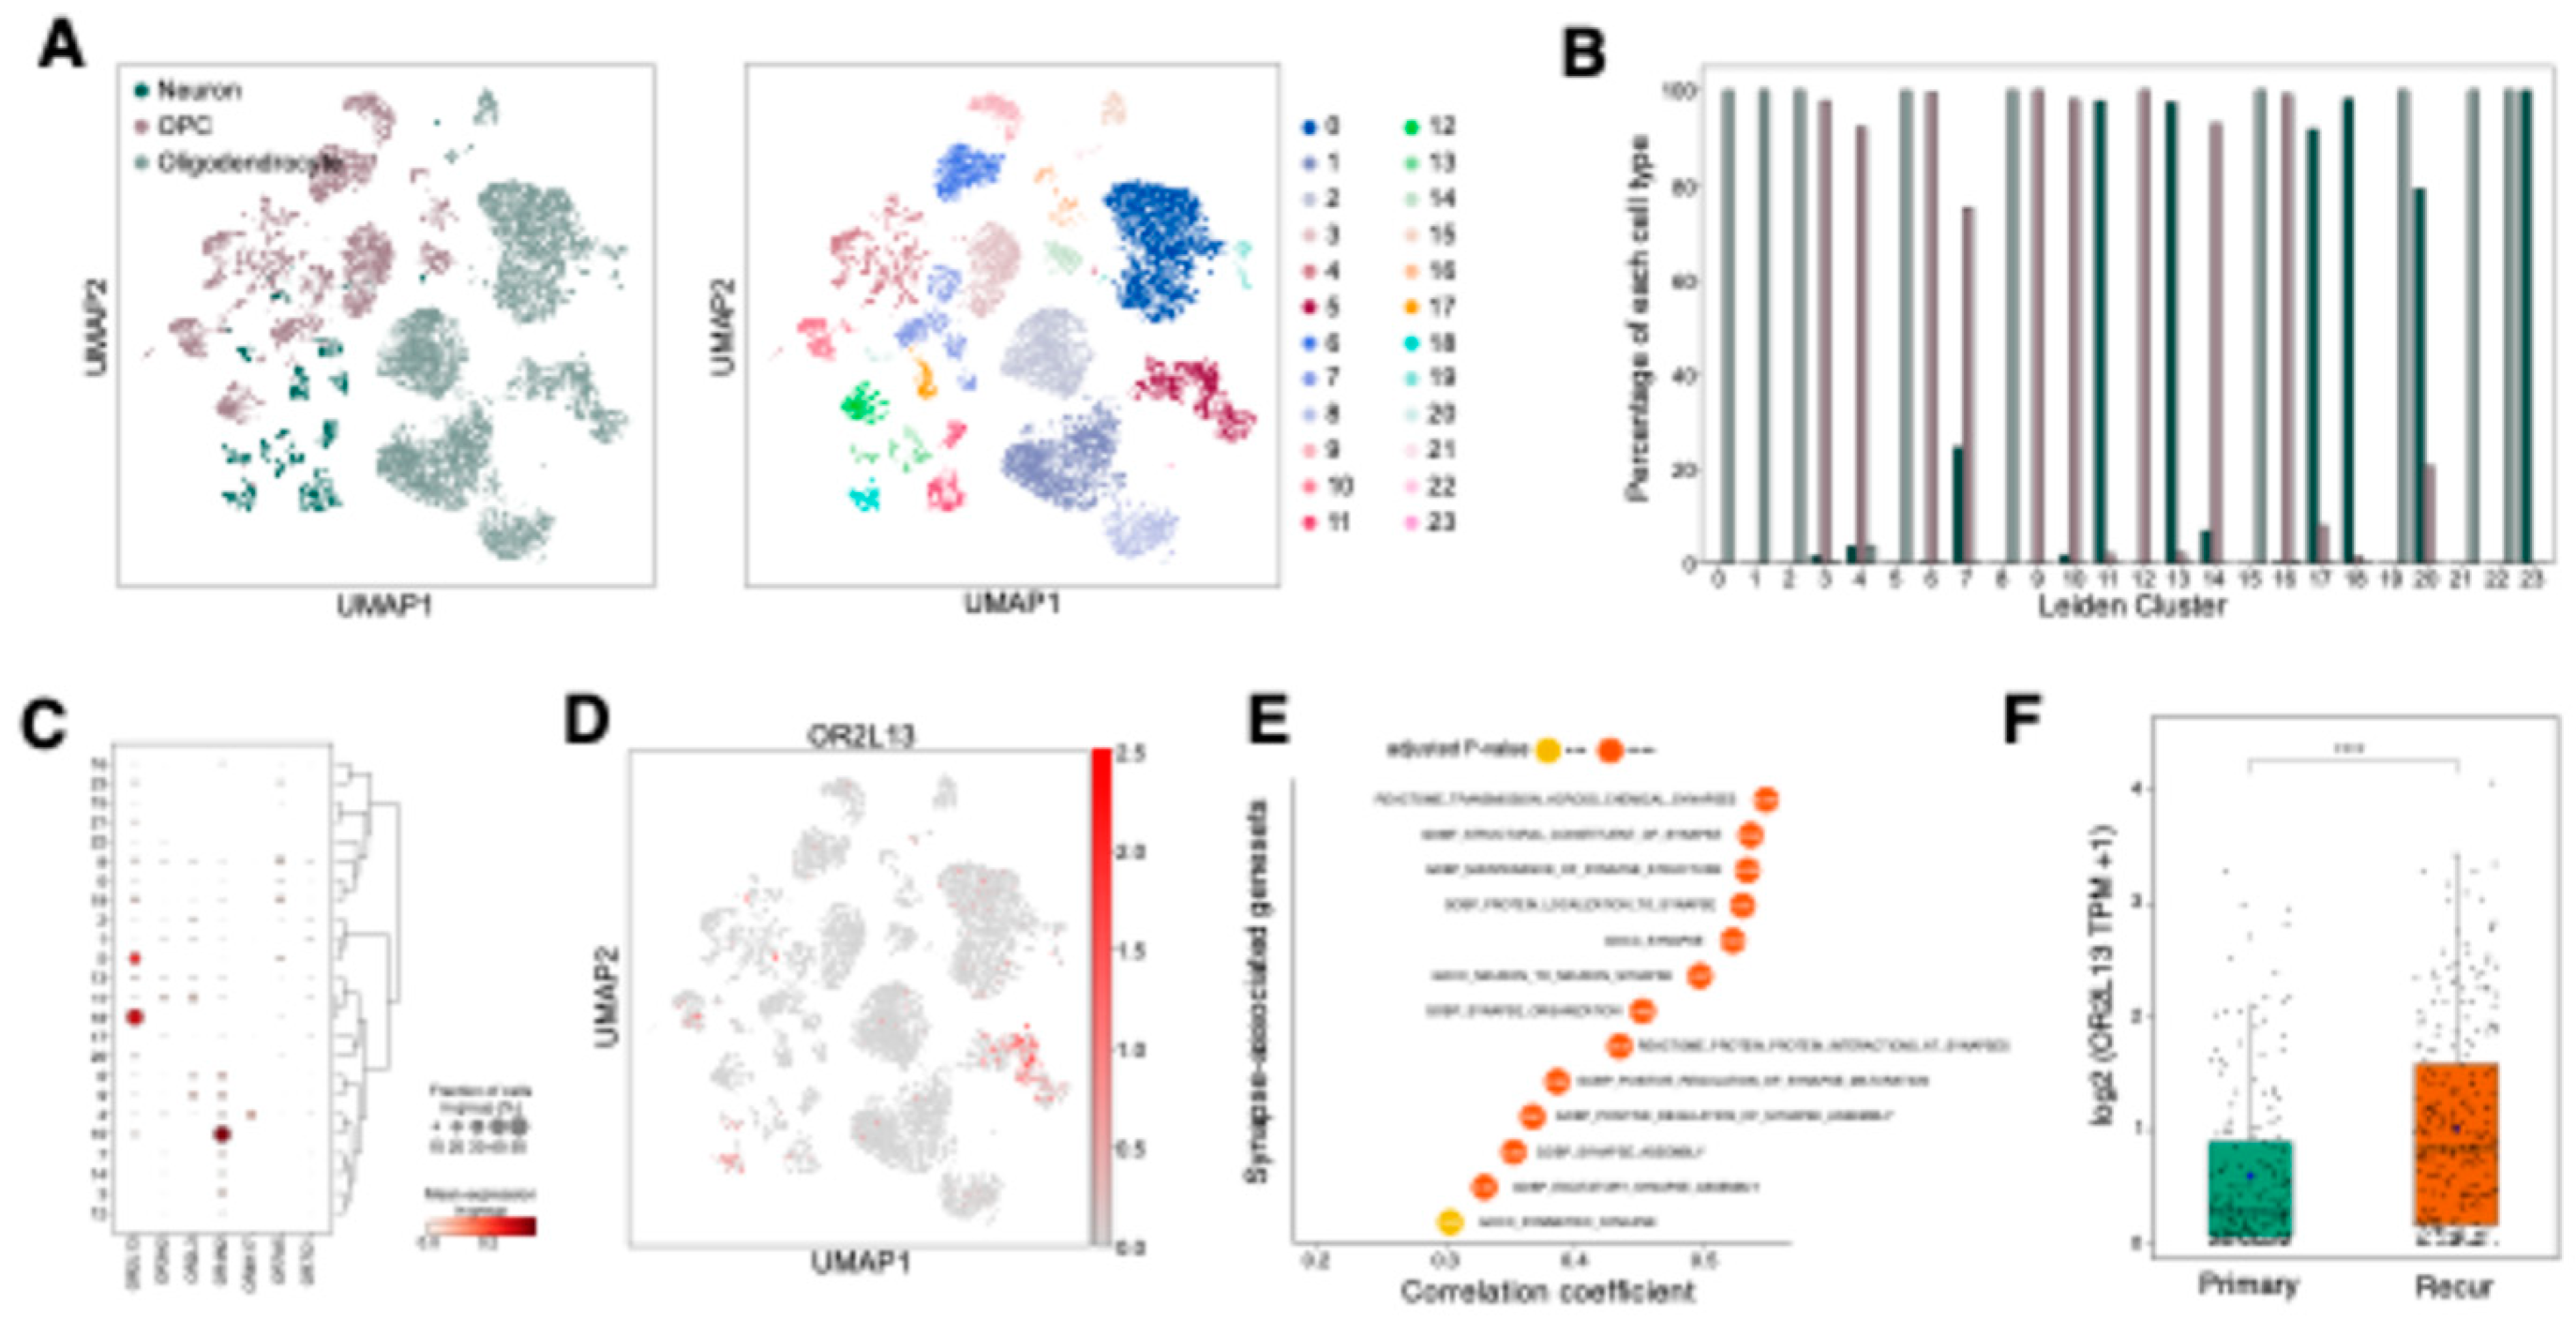
2.5. OR2L13 reflects synaptic adaptations in recurrent GBM following treatment
OR2L13 was identified as a significantly down-regulated OR gene in GBM compared to normal and LGG tissues (
Figure 1B and
Table S1), with cell-type specific expression analysis revealing its predominant expression in oligodendrocytes and neurons rather than tumor cells (
Figure 2D,
Figures S1B and S6). To further characterize its expression pattern, we performed sub-clustering analysis of neurons, oligodendrocytes, and oligodendrocyte progenitor cells (OPCs) using scRNA-seq data (
Figure 6A).
OR2L13 was primarily expressed in clusters enriched for oligodendrocytes and neurons, with minimal expression in OPCs (
Figure 6C, D, and E,
Table S5). Oligodendrocytes and neurons orchestrate synapse activation through myelination-dependent regulation of action potential propagation and neurotransmitter release at synaptic junctions [
37]. Notably, a recent study demonstrated that recurrent GBMs after treatment exhibited enhanced synaptic activity compared to their pre-treatment counterparts[
4]. Analysis of TCGA GBM dataset revealed significant positive correlations between
OR2L13 expression and synapse-associated genesets (
Figure 6F). Consistently,
OR2L13 showed significant upregulation in recurrent tumors in the Glioma Longitudinal AnalySiS (GLASS) dataset (
Figure 6G). These findings suggest that OR2L13 may play a role in treatment-driven neuronal adaptation within GBM, potentially influencing synaptic pathways that support tumor recurrence and therapy resistance.
3. Discussion
In this study, we conducted comprehensive analysis to elucidate cell-type-specific expression and functions of ORs in GBM. Specifically, we identified distinct roles of ORs in the complex cellular composition and dynamic interactions between GBM tumor cells and TME, suggesting ORs as potential therapeutic targets.
Our analysis first revealed distinctive OR expression patterns in tumor cells, particularly highlighting the predominant role of OR family 7. The enrichment of OR family 7 in GBM is particularly noteworthy, as a member of this family, OR7E156P, was previously reported to promote tumor growth and invasion through OR7E156P/miR-143/HIF1A axis [
38]. This suggests that OR families may retain evolutionarily conserved features that can be reactivated during GBM development. Furthermore, we identified two distinct patterns of OR expression in malignant cells:
OR7D2 showed uniformly elevated expression across all malignant cellular states compared to non-neoplastic cells, suggesting its fundamental role in GBM progression, while
OR4N2 and
OR7E14P exhibited state-dependent expression patterns, indicating their involvement in regulating GBM cellular plasticity.
Intriguingly, we found widespread expression of OR pseudogenes in GBM. Although this observation could partly stem from technical limitations due to high sequence homology among OR genes, the experimentally validated functional role of OR7E156P in transcriptional regulation suggests broader involvement of OR pseudogenes in GBM progression [
38]. These findings expand our understanding of OR-mediated gene regulation in GBM beyond canonical protein-coding genes and highlight the potential importance of OR pseudogenes as regulatory factors.
Our analysis revealed three distinct OR-mediated regulatory mechanisms in the TME that could have therapeutic implications. First,
OR51E1 exhibited pericyte-specific enrichment and demonstrated a significant association with vascular remodeling and angiogenesis, particularly in regions of microvascular proliferation. While OR51E1 overexpression has been previously reported in various solid tumors [
17,
29,
30,
31], our study elucidates its specific role in vascular regulation through pericyte-mediated mechanisms. This finding aligns with previous research showing that OR51E1, and its murine ortholog Olfr558, is expressed in renin-positive cells in the kidney and in vascular smooth muscle cells, where it modulates blood pressure by influencing renin expression and vascular reactivity [
39,
40]. Given its established involvement in vascular remodeling and hemodynamics, OR51E1 may have a broader physiological role, influencing vascular function. Considering the limited efficacy of current anti-angiogenic monotherapies in GBM and other solid tumors, OR51E1 presents a promising complementary therapeutic target for modulating tumor vasculature and potentially enhancing therapeutic outcomes.
Second,
OR2B11 demonstrated a strong association with immunosuppressive TAM phenotypes and mesenchymal GBM, which is characterized by extensive TAM infiltration and poor clinical outcomes. Notably, co-expression of
OR2B11 with
MARCO and its correlation with NF-κB/TGF-β signaling pathways, known mediators of mesenchymal transition and radio-resistance, indicates its potential role in orchestrating an immunosuppressive TME [
9,
13,
35,
36]. This is further supported by the higher expression of OR2B11 in non-responders to anti-PD1 treatment [
41], despite marginal statistical significance. Together with previous findings of Olfr78-mediated M2 phenotype generation [
26], these findings suggest that ORs function as critical regulators of innate immune functions in GBM TME and represent promising targets for enhancing immunotherapeutic efficacy.
Third,
OR2L13 exhibited positive correlation with differentiated oligodendrocytes (distinct from OPCs), neurons, and synaptic assembly gene sets, with notable upregulation in recurrent tumors. This expression pattern provides novel insights into treatment-induced neuronal transition and GBM recurrence mechanisms [
4], suggesting that OR2L13-mediated synaptic regulation could be crucial for preventing tumor recurrence. Furthermore, understanding this mechanism could have broader implications for therapeutic strategies in other neurological disorders where synaptic dysregulation plays a key role.
As GPCRs, ORs present both opportunities and challenges in the context of therapeutic development. While their potential as druggable targets is promising, the identification of specific ligands and understanding of their signaling mechanisms require further investigation. Interestingly, OR expression in normal brain cells suggests their potential role in maintaining normal cellular functions. While our study primarily focused on pro-tumoral effects of ORs in GBM, their expression in normal brain cells raises the promising possibility that enhancing OR-mediated normal brain cell functions could contribute to anti-tumoral effects, representing an alternative therapeutic strategy.
In this study, we performed comprehensive transcriptomic analysis integrating bulk RNA-seq and scRNA-seq data. However, several limitations need to be addressed in future studies. First, experimental validation through ligand identification, signaling mechanism characterization, and in vivo functional studies is essential. Second, the therapeutic potential of targeting ORs needs to be rigorously evaluated, particularly considering the challenge of BBB permeability in GBM treatment. Third, the clinical implications of our findings require validation in larger patient cohorts. Nevertheless, our study establishes a foundation for understanding the diverse roles of ORs in GBM pathobiology and presents promising opportunities for therapeutic development.
4. Materials and Methods
4.1. Collection of Data
Bulk RNA-Seq data for this study were obtained from various sources. Low-Grade Glioma (LGG) [
42] and Glioblastoma Multiforme (GBM) [
3,
43] datasets from The Cancer Genome Atlas (TCGA) comprising raw count, TPM and FPKM values were downloaded with ‘GDCquery’ function included in R package ‘TGGAbiolinks’ [
44]. For TCGA-GBM dataset, IDH mutant samples were filtered out, and only 159 IDH wildtype samples were used in this study. Additional glioma datasets were acquired from the Glioma Longitudinal AnalySiS (GLASS) (accessed on 15 Oct 2024,
https://www.synapse.org/Synapse:syn26465623) [
6,
45] and the Ivy Glioblastoma Atlas Project (accessed on 15 Oct 2024,
https://glioblastoma.alleninstitute.org/static/download.html) [
46] including raw count, TPM values and FPKM values, respectively. Cerebral cortex data for normal brain consisting of raw count and TPM values were obtained from the Genotype-Tissue Expression (GTEx) project (accessed on 25 Oct 2024,
https://gtexportal.org/home/downloads/adult-gtex/bulk_tissue_expression) [
47]. RNA-Seq data of GBM samples by anti-PD1 treatment were retrieved from the SRA under the project PRJN482620 (accessed on 26 Jul 2022,
https://www.ncbi.nlm.nih.gov/bioproject/PRJNA482620) [
41]. Raw data were downloaded and mapped to the hg19 reference genome using ‘STAR’ [
48]. TPM values were calculated using the ‘TPMCalculator’ [
49].
4.2. Single-Cell RNA Sequencing Data Processing
The scRNA-seq data were analyzed using the ‘Scanpy’ (version 1.10.2) Python library [
50]. Log-normalized counts were used for further analysis. Cell type specific gene expression was identified by ‘scanpy.tl.rank_genes_groups’ with the Willcoxon rank-sum method and Benjamini-Hochberg correction method [
51]. For each clustering analysis, highly variable genes were identified by ‘scanpy.pp.highly_variable_genes’ with default parameters (min_disp=0.5, max_disp=inf, min_mean=0.0125, max_mean=3, span=0.3, n_bins=20, flavor=’seurat’). Dimensionality reduction using principal component analysis (PCA) was performed using ‘scanpy.pp.pca’ with only highly variable genes and default parameters (zero_center=True, svd_solver=arpack, use_highly_variable=True). The top 30 principal components were used for downstream analyses. The nearest neighbors distance matrix was computed by ‘scanpy.pp.neighbors’ with n_neighbors set to 15. For visualizing the data, Uniform Manifold Approximation and Projection (UMAP) was computed using ‘scanpy.tl.umap’ with default parameters. Cell clustering was performed using the Leiden algorithm by ‘scanpy.tl.leiden’ with a resolution of 0.1 and default parameters to identify distinct cell populations.
4.3.Pathway Enrichment Analysis for scRNA-Seq
Pathway enrichment analysis was conducted as described in Heumos et al., 2023 [
52]. Briefly, fast gene set enrichment analysis (FGSEA) algorithm [
53] implemented in ‘decoupleR’ (version 1.8.0) Python library [
54] with C2 collection of the Molecular Signatures Database (MSigDB) (version 7.5.1) [
55] was used for cluster-specific pathway enrichment analysis. The function ‘decoupler.run_gsea’ was used for GSEA with 10000 permutations and default parameters. For false discovery rate control, zero p-values from GSEA results were substituted with 0.0001 and corrected by ‘scipy.stats.false_discovery_control’ function in ‘SciPy’ (version 1.14.1) Python library [
56]. Additionally, AUCell algorithm [
57] was used to score pathway activity at the single-cell level, by ‘decoupler.run_aucell’ with default parameters. Correlation between cell type specific OR gene expression and AUCell scores was calculated using Pearson correlation by ‘scipy.stats.pearsonr’.
4.4. Differential Gene Expression Analysis
Differential gene expression analysis was performed using the R package ‘DESeq2’ [
58] and visualized with R package ‘ggplot2’ [
59]. GBM, LGG and normal brain RNA-Seq data from TCGA and GTEx were utilized to conduct comparison between GBM and LGG, as well as GBM and normal tissue. By DEG analysis, upregulated and downregulated OR genes were identified specific to GBM. Upregulation and Downregulation were defined based on absolute value of log2 fold change higher than 1.0 and adjusted p-value adjusted by bonferroni method less than 0.05. OR genes that did not fulfill these criteria were considered as not significant genes.
4.5. Correlation Analysis with Geneset Scores
Correlation analysis was conducted using R package ‘Hmisc’ with the Pearson method. P-value from the analysis were adjusted by the Bonferroni method. In case of analysis between OR expression and gene set of pathways, gene sets were acquired from the C2, C5 and Hallmark collections of MSigDB (version 7.5.1) [
55]. The single-sample gene set enrichment analysis (ssGSEA) scores were calculated for each TCGA-GBM tumor sample using the ‘GSVA’ function from the ‘GSVA’ package for the given gene sets [
60].
In case of analysis between OR expression and gene set of cell types, gene sets for each cell types were obtained from the top 100 genes from the results of single cell RNA-sequencing. Analysis was performed using the same approach described above. The results were visualized using R package ‘ggplot2’ [
59] and ‘ggpubr’ [
61].
4.6. Survival Analysis
Survival analysis was performed using RNA-Seq and clinical data from TCGA-GBM. The Kaplan-Meier survival analysis was conducted with R package ‘Survival’ [
62], and survival curve was visualized with ggsurvplot function from R package ‘survminer’ [
63]. GBM tumor samples were categorized into high and low groups based on the expression level of OR genes. The top 30% of samples by OR gene expression was classified as the high group, and the remaining samples were designated as the low group. Survival analysis was then performed to compare the prognosis between high and low groups.
4.7. GBM Subtyping
Subtyping of GBM tumor samples was conducted by using TCGA GBM RNA-Seq data and the ‘GSVA’ R package [
60]. Gene sets defining the mesenchymal, classical, proneural and neural GBM subtypes were acquired from Verhaak et al [
64]. The ssGSEA scores were calculated with the gene sets, and z-scores were computed using the ‘scale’ function in R. The subtype with the highest z-score among these four subtypes was designated as the primary subtype for each GBM tumor sample.
For AC-like, MES-like, OPC-like and NPC-like subtypes, gene sets were defined using the top 100 differentially expressed genes (DEGs) confirmed though single-cell RNA sequencing data. Subtyping of each sample was performed using the same ssGSEA and z-score approach described above.
4.8. Statistical Analysis
Statistical analysis was performed with R version 4.1.2. A Student’s t-test was utilized in analyzing data. TPM and FPKM values were log2 transformed for statistical analysis.
5. Conclusions
In this study, we comprehensively analyzed OR expression patterns in GBM using bulk and single-cell RNA sequencing, uncovering diverse roles of ORs in tumor heterogeneity, malignancy, and modulation of the tumor microenvironment. Our findings suggest that ORs could serve as therapeutic targets, given their impact on cellular plasticity, treatment resistance, and key processes within GBM. These insights provide a strong foundation for future research into OR-targeted therapies and the roles of ORs in GBM pathogenesis.
Supplementary Materials
The following supporting information can be downloaded at the website of this paper posted on
Preprints.org, Figure S1: Cell type specificity validation of differentially expressed ORs using TCGA GBM data; Figure S2: Survival analysis of neoplastic cell-enriched ORs in TCGA GBM cohort; Figure S3: Expression distribution of VEGFA in GBM single-cell RNA-seq data; Figure S4: Correlation analysis of OR51E1 expression with vascular cell gene sets in TCGA GBM data; Figure S5: Correlation analysis of OR2B11 expression with TAM gene sets in TCGA GBM data; Figure S6: Correlation analysis of OR2L13 expression with oligodendrocyte and neuron gene sets in TCGA GBM data; Table S1: Differentially expressed OR genes in GBM compared to normal and LGG; Table S2: Differential OR gene expression across GBM cell types; Table S3: Differential OR gene expression across vascular cell types; Table S4: Differential OR gene expression across TAMs; Table S5: Differential OR gene expression across neurons, OPCs, and oligodendrocytes.
Author Contributions
Conceptualization, H.J.C. and J.K.; Methodology, H.W.Y, D.J.Y, H.J.C. and J.K.; Validation, H.W.Y, D.J.Y, H.J.C. and J.K.; Data curation, H.W.Y, D.J.Y and H.J.C.; Formal analysis, H.W.Y, D.J.Y and H.J.C.; Investigation, H.W.Y, D.J.Y and H.J.C.; Writing – original draft, H.W.Y, D.J.Y and H.J.C.; Writing – review & editing, H.J.C. and J.K.; Visualization, H.W.Y, D.J.Y and H.J.C.; Supervision, H.J.C. and J.K.; Project administration, H.J.C. and J.K.; Funding acquisition, H.J.C. and J.K.
Funding
This work was supported by grants from the National Research Foundation (NRF) (2021R1A2C1009258 to J.K. RS-2023-00209741 to H.J.C.) and a Korean Fund for Regenerative Medicine (KFRM, 23A0105L1 to H.J.C.) and Korea Dementia Research Center (KDRC, RS-2024-00353470 to J.K.).
Institutional Review Board Statement
Not applicable.
Informed Consent Statement
Not applicable.
Data Availability Statement
Acknowledgments
We would like to thank D-HUB (DGIST Hub of Ubiquitous Based Infra-services) for providing the equipment essential to this research.
Conflicts of Interest
The authors declare no conflicts of interest.
References
- Stupp, R.; Mason, W. P.; van den Bent, M. J.; Weller, M.; Fisher, B.; Taphoorn, M. J.; Belanger, K.; Brandes, A. A.; Marosi, C.; Bogdahn, U.; Curschmann, J.; Janzer, R. C.; Ludwin, S. K.; Gorlia, T.; Allgeier, A.; Lacombe, D.; Cairncross, J. G.; Eisenhauer, E.; Mirimanoff, R. O.; European Organisation for, R.; Treatment of Cancer Brain, T.; Radiotherapy, G.; National Cancer Institute of Canada Clinical Trials, G. , Radiotherapy plus concomitant and adjuvant temozolomide for glioblastoma. The New England journal of medicine 2005, 352, 987–996. [Google Scholar] [CrossRef] [PubMed]
- Weller, M.; Cloughesy, T.; Perry, J. R.; Wick, W. , Standards of care for treatment of recurrent glioblastoma--are we there yet? Neuro Oncol 2013, 15, 4–27. [Google Scholar] [CrossRef] [PubMed]
- Brennan, C. W.; Verhaak, R. G.; McKenna, A.; Campos, B.; Noushmehr, H.; Salama, S. R.; Zheng, S.; Chakravarty, D.; Sanborn, J. Z.; Berman, S. H.; Beroukhim, R.; Bernard, B.; Wu, C. J.; Genovese, G.; Shmulevich, I.; Barnholtz-Sloan, J.; Zou, L.; Vegesna, R.; Shukla, S. A.; Ciriello, G.; Yung, W. K.; Zhang, W.; Sougnez, C.; Mikkelsen, T.; Aldape, K.; Bigner, D. D.; Van Meir, E. G.; Prados, M.; Sloan, A.; Black, K. L.; Eschbacher, J.; Finocchiaro, G.; Friedman, W.; Andrews, D. W.; Guha, A.; Iacocca, M.; O'Neill, B. P.; Foltz, G.; Myers, J.; Weisenberger, D. J.; Penny, R.; Kucherlapati, R.; Perou, C. M.; Hayes, D. N.; Gibbs, R.; Marra, M.; Mills, G. B.; Lander, E.; Spellman, P.; Wilson, R.; Sander, C.; Weinstein, J.; Meyerson, M.; Gabriel, S.; Laird, P. W.; Haussler, D.; Getz, G.; Chin, L.; Network, T. R. , The somatic genomic landscape of glioblastoma. Cell 2013, 155, 462–477. [Google Scholar] [CrossRef] [PubMed]
- Kim, K. H.; Migliozzi, S.; Koo, H.; Hong, J. H.; Park, S. M.; Kim, S.; Kwon, H. J.; Ha, S.; Garofano, L.; Oh, Y. T.; D'Angelo, F.; Kim, C. I.; Kim, S.; Lee, J. Y.; Kim, J.; Hong, J.; Jang, E. H.; Mathon, B.; Di Stefano, A. L.; Bielle, F.; Laurenge, A.; Nesvizhskii, A. I.; Hur, E. M.; Yin, J.; Shi, B.; Kim, Y.; Moon, K. S.; Kwon, J. T.; Lee, S. H.; Lee, S. H.; Gwak, H. S.; Lasorella, A.; Yoo, H.; Sanson, M.; Sa, J. K.; Park, C. K.; Nam, D. H.; Iavarone, A.; Park, J. B. , Integrated proteogenomic characterization of glioblastoma evolution. Cancer Cell 2024, 42, 358–377 e8. [Google Scholar] [CrossRef]
- Lee, J. K.; Wang, J.; Sa, J. K.; Ladewig, E.; Lee, H. O.; Lee, I. H.; Kang, H. J.; Rosenbloom, D. S.; Camara, P. G.; Liu, Z.; van Nieuwenhuizen, P.; Jung, S. W.; Choi, S. W.; Kim, J.; Chen, A.; Kim, K. T.; Shin, S.; Seo, Y. J.; Oh, J. M.; Shin, Y. J.; Park, C. K.; Kong, D. S.; Seol, H. J.; Blumberg, A.; Lee, J. I.; Iavarone, A.; Park, W. Y.; Rabadan, R.; Nam, D. H. , Spatiotemporal genomic architecture informs precision oncology in glioblastoma. Nat Genet 2017, 49, 594–599. [Google Scholar] [CrossRef]
- Varn, F. S.; Johnson, K. C.; Martinek, J.; Huse, J. T.; Nasrallah, M. P.; Wesseling, P.; Cooper, L. A. D.; Malta, T. M.; Wade, T. E.; Sabedot, T. S.; Brat, D.; Gould, P. V.; Woehrer, A.; Aldape, K.; Ismail, A.; Sivajothi, S. K.; Barthel, F. P.; Kim, H.; Kocakavuk, E.; Ahmed, N.; White, K.; Datta, I.; Moon, H. E.; Pollock, S.; Goldfarb, C.; Lee, G. H.; Garofano, L.; Anderson, K. J.; Nehar-Belaid, D.; Barnholtz-Sloan, J. S.; Bakas, S.; Byrne, A. T.; D'Angelo, F.; Gan, H. K.; Khasraw, M.; Migliozzi, S.; Ormond, D. R.; Paek, S. H.; Van Meir, E. G.; Walenkamp, A. M. E.; Watts, C.; Weiss, T.; Weller, M.; Palucka, K.; Stead, L. F.; Poisson, L. M.; Noushmehr, H.; Iavarone, A.; Verhaak, R. G. W.; Consortium, G. , Glioma progression is shaped by genetic evolution and microenvironment interactions. Cell 2022, 185, 2184–2199 e16. [Google Scholar] [CrossRef]
- Neftel, C.; Laffy, J.; Filbin, M. G.; Hara, T.; Shore, M. E.; Rahme, G. J.; Richman, A. R.; Silverbush, D.; Shaw, M. L.; Hebert, C. M.; Dewitt, J.; Gritsch, S.; Perez, E. M.; Gonzalez Castro, L. N.; Lan, X.; Druck, N.; Rodman, C.; Dionne, D.; Kaplan, A.; Bertalan, M. S.; Small, J.; Pelton, K.; Becker, S.; Bonal, D.; Nguyen, Q. D.; Servis, R. L.; Fung, J. M.; Mylvaganam, R.; Mayr, L.; Gojo, J.; Haberler, C.; Geyeregger, R.; Czech, T.; Slavc, I.; Nahed, B. V.; Curry, W. T.; Carter, B. S.; Wakimoto, H.; Brastianos, P. K.; Batchelor, T. T.; Stemmer-Rachamimov, A.; Martinez-Lage, M.; Frosch, M. P.; Stamenkovic, I.; Riggi, N.; Rheinbay, E.; Monje, M.; Rozenblatt-Rosen, O.; Cahill, D. P.; Patel, A. P.; Hunter, T.; Verma, I. M.; Ligon, K. L.; Louis, D. N.; Regev, A.; Bernstein, B. E.; Tirosh, I.; Suva, M. L. , An Integrative Model of Cellular States, Plasticity, and Genetics for Glioblastoma. Cell 2019, 178, 835–849 e21. [Google Scholar] [CrossRef]
- Kaur, B.; Khwaja, F. W.; Severson, E. A.; Matheny, S. L.; Brat, D. J.; Van Meir, E. G. , Hypoxia and the hypoxia-inducible-factor pathway in glioma growth and angiogenesis. Neuro Oncol 2005, 7, 134–153. [Google Scholar] [CrossRef]
- Sa, J. K.; Chang, N.; Lee, H. W.; Cho, H. J.; Ceccarelli, M.; Cerulo, L.; Yin, J.; Kim, S. S.; Caruso, F. P.; Lee, M.; Kim, D.; Oh, Y. T.; Lee, Y.; Her, N. G.; Min, B.; Kim, H. J.; Jeong, D. E.; Kim, H. M.; Kim, H.; Chung, S.; Woo, H. G.; Lee, J.; Kong, D. S.; Seol, H. J.; Lee, J. I.; Kim, J.; Park, W. Y.; Wang, Q.; Sulman, E. P.; Heimberger, A. B.; Lim, M.; Park, J. B.; Iavarone, A.; Verhaak, R. G. W.; Nam, D. H. , Transcriptional regulatory networks of tumor-associated macrophages that drive malignancy in mesenchymal glioblastoma. Genome Biol 2020, 21, 216. [Google Scholar] [CrossRef]
- Wang, Q.; Hu, B.; Hu, X.; Kim, H.; Squatrito, M.; Scarpace, L.; deCarvalho, A. C.; Lyu, S.; Li, P.; Li, Y.; Barthel, F.; Cho, H. J.; Lin, Y. H.; Satani, N.; Martinez-Ledesma, E.; Zheng, S.; Chang, E.; Gabriel Sauve, C. E.; Olar, A.; Lan, Z. D.; Finocchiaro, G.; Phillips, J. J.; Berger, M. S.; Gabrusiewicz, K. R.; Wang, G.; Eskilsson, E.; Hu, J.; Mikkelsen, T.; DePinho, R. A.; Muller, F.; Heimberger, A. B.; Sulman, E. P.; Nam, D. H.; Verhaak, R. G. W. , Tumor Evolution of Glioma-Intrinsic Gene Expression Subtypes Associates with Immunological Changes in the Microenvironment. Cancer Cell 2018, 33, 152. [Google Scholar] [CrossRef]
- Venkatesh, H. S.; Johung, T. B.; Caretti, V.; Noll, A.; Tang, Y.; Nagaraja, S.; Gibson, E. M.; Mount, C. W.; Polepalli, J.; Mitra, S. S.; Woo, P. J.; Malenka, R. C.; Vogel, H.; Bredel, M.; Mallick, P.; Monje, M. , Neuronal Activity Promotes Glioma Growth through Neuroligin-3 Secretion. Cell 2015, 161, 803–816. [Google Scholar] [CrossRef] [PubMed]
- Ni, Y.; Zhou, X.; Yang, J.; Shi, H.; Li, H.; Zhao, X.; Ma, X. , The Role of Tumor-Stroma Interactions in Drug Resistance Within Tumor Microenvironment. Front Cell Dev Biol 2021, 9, 637675. [Google Scholar] [CrossRef] [PubMed]
- Bhat, K. P.; Balasubramaniyan, V.; Vaillant, B.; Ezhilarasan, R.; Hummelink, K.; Hollingsworth, F.; Wani, K.; Heathcock, L.; James, J. D.; Goodman, L. D.; Conroy, S.; Long, L.; Lelic, N.; Wang, S.; Gumin, J.; Raj, D.; Kodama, Y.; Raghunathan, A.; Olar, A.; Joshi, K.; Pelloski, C. E.; Heimberger, A.; Kim, S. H.; Cahill, D. P.; Rao, G.; Den Dunnen, W. F.; Boddeke, H. W.; Phillips, H. S.; Nakano, I.; Lang, F. F.; Colman, H.; Sulman, E. P.; Aldape, K. , Mesenchymal differentiation mediated by NF-kappaB promotes radiation resistance in glioblastoma. Cancer Cell 2013, 24, 331–346. [Google Scholar] [CrossRef]
- Wu, D.; Chen, Q.; Chen, X.; Han, F.; Chen, Z.; Wang, Y. , The blood-brain barrier: structure, regulation, and drug delivery. Signal Transduct Target Ther 2023, 8, 217. [Google Scholar] [CrossRef] [PubMed]
- Kang, N.; Koo, J. , Olfactory receptors in non-chemosensory tissues. BMB Rep 2012, 45, 612–622. [Google Scholar] [CrossRef] [PubMed]
- Massberg, D.; Hatt, H. , Human Olfactory Receptors: Novel Cellular Functions Outside of the Nose. Physiol Rev 2018, 98, 1739–1763. [Google Scholar] [CrossRef]
- Chung, C.; Cho, H. J.; Lee, C.; Koo, J. , Odorant receptors in cancer. BMB Rep 2022, 55, 72–80. [Google Scholar] [CrossRef]
- Cho, H. J.; Koo, J. , Odorant G protein-coupled receptors as potential therapeutic targets for adult diffuse gliomas: a systematic analysis and review. BMB Rep 2021, 54, 601–607. [Google Scholar] [CrossRef]
- Kalra, S.; Mittal, A.; Gupta, K.; Singhal, V.; Gupta, A.; Mishra, T.; Naidu, S.; Sengupta, D.; Ahuja, G. , Analysis of single-cell transcriptomes links enrichment of olfactory receptors with cancer cell differentiation status and prognosis. Commun Biol 2020, 3, 506. [Google Scholar] [CrossRef]
- Ferrer, I.; Garcia-Esparcia, P.; Carmona, M.; Carro, E.; Aronica, E.; Kovacs, G. G.; Grison, A.; Gustincich, S. , Olfactory Receptors in Non-Chemosensory Organs: The Nervous System in Health and Disease. Front Aging Neurosci 2016, 8, 163. [Google Scholar] [CrossRef]
- Ansoleaga, B.; Garcia-Esparcia, P.; Llorens, F.; Moreno, J.; Aso, E.; Ferrer, I. , Dysregulation of brain olfactory and taste receptors in AD, PSP and CJD, and AD-related model. Neuroscience 2013, 248, 369–382. [Google Scholar] [CrossRef] [PubMed]
- Lee, N.; Jae, Y.; Kim, M.; Cho, T.; Lee, C.; Hong, Y. R.; Hyeon, D. Y.; Ahn, S.; Kwon, H.; Kim, K.; Jung, J. H.; Chae, S.; Shin, J. O.; Bok, J.; Byun, Y.; Hwang, D.; Koo, J. , A pathogen-derived metabolite induces microglial activation via odorant receptors. FEBS J 2020, 287, 3841–3870. [Google Scholar] [CrossRef] [PubMed]
- Di Pizio, A.; Behrens, M.; Krautwurst, D. , Beyond the Flavour: The Potential Druggability of Chemosensory G Protein-Coupled Receptors. Int J Mol Sci 2019, 20. [Google Scholar] [CrossRef]
- Xu, L. L.; Stackhouse, B. G.; Florence, K.; Zhang, W.; Shanmugam, N.; Sesterhenn, I. A.; Zou, Z.; Srikantan, V.; Augustus, M.; Roschke, V.; Carter, K.; McLeod, D. G.; Moul, J. W.; Soppett, D.; Srivastava, S. , PSGR, a novel prostate-specific gene with homology to a G protein-coupled receptor, is overexpressed in prostate cancer. Cancer Res 2000, 60, 6568–6572. [Google Scholar] [PubMed]
- Weber, L.; Massberg, D.; Becker, C.; Altmuller, J.; Ubrig, B.; Bonatz, G.; Wolk, G.; Philippou, S.; Tannapfel, A.; Hatt, H.; Gisselmann, G. , Olfactory Receptors as Biomarkers in Human Breast Carcinoma Tissues. Front Oncol 2018, 8, 33. [Google Scholar] [CrossRef]
- Vadevoo, S. M. P.; Gunassekaran, G. R.; Lee, C.; Lee, N.; Lee, J.; Chae, S.; Park, J. Y.; Koo, J.; Lee, B. , The macrophage odorant receptor Olfr78 mediates the lactate-induced M2 phenotype of tumor-associated macrophages. Proc Natl Acad Sci U S A 2021, 118. [Google Scholar] [CrossRef]
- Lee, N.; Sa, M.; Hong, Y. R.; Lee, C. J.; Koo, J. , Fatty Acid Increases cAMP-dependent Lactate and MAO-B-dependent GABA Production in Mouse Astrocytes by Activating a Galphas Protein-coupled Receptor. Exp Neurobiol 2018, 27, 365–376. [Google Scholar] [CrossRef]
- Cho, T.; Lee, C.; Lee, N.; Hong, Y. R.; Koo, J. , Small-chain fatty acid activates astrocytic odorant receptor Olfr920. Biochem Biophys Res Commun 2019, 510, 383–387. [Google Scholar] [CrossRef]
- Cui, T.; Tsolakis, A. V.; Li, S. C.; Cunningham, J. L.; Lind, T.; Oberg, K.; Giandomenico, V. , Olfactory receptor 51E1 protein as a potential novel tissue biomarker for small intestine neuroendocrine carcinomas. Eur J Endocrinol 2013, 168, 253–261. [Google Scholar] [CrossRef]
- Giandomenico, V.; Cui, T.; Grimelius, L.; Oberg, K.; Pelosi, G.; Tsolakis, A. V. , Olfactory receptor 51E1 as a novel target for diagnosis in somatostatin receptor-negative lung carcinoids. J Mol Endocrinol 2013, 51, 277–286. [Google Scholar] [CrossRef]
- Massberg, D.; Jovancevic, N.; Offermann, A.; Simon, A.; Baniahmad, A.; Perner, S.; Pungsrinont, T.; Luko, K.; Philippou, S.; Ubrig, B.; Heiland, M.; Weber, L.; Altmuller, J.; Becker, C.; Gisselmann, G.; Gelis, L.; Hatt, H. , The activation of OR51E1 causes growth suppression of human prostate cancer cells. Oncotarget 2016, 7, 48231–48249. [Google Scholar] [CrossRef] [PubMed]
- Ruiz-Moreno, C.; Salas, S. M.; Samuelsson, E.; Brandner, S.; Kranendonk, M. E. G.; Nilsson, M.; Stunnenberg, H. G. , Harmonized single-cell landscape, intercellular crosstalk and tumor architecture of glioblastoma. bioRxiv 2022, 2022.08.27.505439.
- Ferrara, N. , Role of vascular endothelial growth factor in regulation of physiological angiogenesis. Am J Physiol Cell Physiol 2001, 280, C1358–C1366. [Google Scholar] [CrossRef] [PubMed]
- Xu, J.; Lamouille, S.; Derynck, R. , TGF-beta-induced epithelial to mesenchymal transition. Cell Res 2009, 19, 156–172. [Google Scholar] [CrossRef] [PubMed]
- Ye, X. Z.; Xu, S. L.; Xin, Y. H.; Yu, S. C.; Ping, Y. F.; Chen, L.; Xiao, H. L.; Wang, B.; Yi, L.; Wang, Q. L.; Jiang, X. F.; Yang, L.; Zhang, P.; Qian, C.; Cui, Y. H.; Zhang, X.; Bian, X. W. , Tumor-associated microglia/macrophages enhance the invasion of glioma stem-like cells via TGF-beta1 signaling pathway. J Immunol 2012, 189, 444–453. [Google Scholar] [CrossRef] [PubMed]
- Chen, A. X.; Gartrell, R. D.; Zhao, J.; Upadhyayula, P. S.; Zhao, W.; Yuan, J.; Minns, H. E.; Dovas, A.; Bruce, J. N.; Lasorella, A.; Iavarone, A.; Canoll, P.; Sims, P. A.; Rabadan, R. , Single-cell characterization of macrophages in glioblastoma reveals MARCO as a mesenchymal pro-tumor marker. Genome Med 2021, 13, 88. [Google Scholar] [CrossRef]
- Hughes, A. N.; Appel, B. , Oligodendrocytes express synaptic proteins that modulate myelin sheath formation. Nat Commun 2019, 10, 4125. [Google Scholar] [CrossRef]
- Zhao, H.; Du, P.; Peng, R.; Peng, G.; Yuan, J.; Liu, D.; Liu, Y.; Mo, X.; Liao, Y. , Long Noncoding RNA OR7E156P/miR-143/HIF1A Axis Modulates the Malignant Behaviors of Glioma Cell and Tumor Growth in Mice. Front Oncol 2021, 11, 690213. [Google Scholar] [CrossRef]
- Pluznick, J. L.; Protzko, R. J.; Gevorgyan, H.; Peterlin, Z.; Sipos, A.; Han, J.; Brunet, I.; Wan, L. X.; Rey, F.; Wang, T.; Firestein, S. J.; Yanagisawa, M.; Gordon, J. I.; Eichmann, A.; Peti-Peterdi, J.; Caplan, M. J. , Olfactory receptor responding to gut microbiota-derived signals plays a role in renin secretion and blood pressure regulation. Proc Natl Acad Sci U S A 2013, 110, 4410–4415. [Google Scholar] [CrossRef]
- Xu, J.; Choi, R.; Gupta, K.; Warren, H. R.; Santhanam, L.; Pluznick, J. L. , An evolutionarily conserved olfactory receptor is required for sex differences in blood pressure. Sci Adv 2024, 10, eadk1487. [Google Scholar] [CrossRef]
- Zhao, J.; Chen, A. X.; Gartrell, R. D.; Silverman, A. M.; Aparicio, L.; Chu, T.; Bordbar, D.; Shan, D.; Samanamud, J.; Mahajan, A.; Filip, I.; Orenbuch, R.; Goetz, M.; Yamaguchi, J. T.; Cloney, M.; Horbinski, C.; Lukas, R. V.; Raizer, J.; Rae, A. I.; Yuan, J.; Canoll, P.; Bruce, J. N.; Saenger, Y. M.; Sims, P.; Iwamoto, F. M.; Sonabend, A. M.; Rabadan, R. , Immune and genomic correlates of response to anti-PD-1 immunotherapy in glioblastoma. Nat Med 2019, 25, 462–469. [Google Scholar] [CrossRef]
- Brat, D. J.; Verhaak, R. G.; Aldape, K. D.; Yung, W. K.; Salama, S. R.; Cooper, L. A.; Rheinbay, E.; Miller, C. R.; Vitucci, M.; Morozova, O.; Robertson, A. G.; Noushmehr, H.; Laird, P. W.; Cherniack, A. D.; Akbani, R.; Huse, J. T.; Ciriello, G.; Poisson, L. M.; Barnholtz-Sloan, J. S.; Berger, M. S.; Brennan, C.; Colen, R. R.; Colman, H.; Flanders, A. E.; Giannini, C.; Grifford, M.; Iavarone, A.; Jain, R.; Joseph, I.; Kim, J.; Kasaian, K.; Mikkelsen, T.; Murray, B. A.; O'Neill, B. P.; Pachter, L.; Parsons, D. W.; Sougnez, C.; Sulman, E. P.; Vandenberg, S. R.; Van Meir, E. G.; von Deimling, A.; Zhang, H.; Crain, D.; Lau, K.; Mallery, D.; Morris, S.; Paulauskis, J.; Penny, R.; Shelton, T.; Sherman, M.; Yena, P.; Black, A.; Bowen, J.; Dicostanzo, K.; Gastier-Foster, J.; Leraas, K. M.; Lichtenberg, T. M.; Pierson, C. R.; Ramirez, N. C.; Taylor, C.; Weaver, S.; Wise, L.; Zmuda, E.; Davidsen, T.; Demchok, J. A.; Eley, G.; Ferguson, M. L.; Hutter, C. M.; Mills Shaw, K. R.; Ozenberger, B. A.; Sheth, M.; Sofia, H. J.; Tarnuzzer, R.; Wang, Z.; Yang, L.; Zenklusen, J. C.; Ayala, B.; Baboud, J.; Chudamani, S.; Jensen, M. A.; Liu, J.; Pihl, T.; Raman, R.; Wan, Y.; Wu, Y.; Ally, A.; Auman, J. T.; Balasundaram, M.; Balu, S.; Baylin, S. B.; Beroukhim, R.; Bootwalla, M. S.; Bowlby, R.; Bristow, C. A.; Brooks, D.; Butterfield, Y.; Carlsen, R.; Carter, S.; Chin, L.; Chu, A.; Chuah, E.; Cibulskis, K.; Clarke, A.; Coetzee, S. G.; Dhalla, N.; Fennell, T.; Fisher, S.; Gabriel, S.; Getz, G.; Gibbs, R.; Guin, R.; Hadjipanayis, A.; Hayes, D. N.; Hinoue, T.; Hoadley, K.; Holt, R. A.; Hoyle, A. P.; Jefferys, S. R.; Jones, S.; Jones, C. D.; Kucherlapati, R.; Lai, P. H.; Lander, E.; Lee, S.; Lichtenstein, L.; Ma, Y.; Maglinte, D. T.; Mahadeshwar, H. S.; Marra, M. A.; Mayo, M.; Meng, S.; Meyerson, M. L.; Mieczkowski, P. A.; Moore, R. A.; Mose, L. E.; Mungall, A. J.; Pantazi, A.; Parfenov, M.; Park, P. J.; Parker, J. S.; Perou, C. M.; Protopopov, A.; Ren, X.; Roach, J.; Sabedot, T. S.; Schein, J.; Schumacher, S. E.; Seidman, J. G.; Seth, S.; Shen, H.; Simons, J. V.; Sipahimalani, P.; Soloway, M. G.; Song, X.; Sun, H.; Tabak, B.; Tam, A.; Tan, D.; Tang, J.; Thiessen, N.; Triche, T., Jr.; Van Den Berg, D. J.; Veluvolu, U.; Waring, S.; Weisenberger, D. J.; Wilkerson, M. D.; Wong, T.; Wu, J.; Xi, L.; Xu, A. W.; Yang, L.; Zack, T. I.; Zhang, J.; Aksoy, B. A.; Arachchi, H.; Benz, C.; Bernard, B.; Carlin, D.; Cho, J.; DiCara, D.; Frazer, S.; Fuller, G. N.; Gao, J.; Gehlenborg, N.; Haussler, D.; Heiman, D. I.; Iype, L.; Jacobsen, A.; Ju, Z.; Katzman, S.; Kim, H.; Knijnenburg, T.; Kreisberg, R. B.; Lawrence, M. S.; Lee, W.; Leinonen, K.; Lin, P.; Ling, S.; Liu, W.; Liu, Y.; Liu, Y.; Lu, Y.; Mills, G.; Ng, S.; Noble, M. S.; Paull, E.; Rao, A.; Reynolds, S.; Saksena, G.; Sanborn, Z.; Sander, C.; Schultz, N.; Senbabaoglu, Y.; Shen, R.; Shmulevich, I.; Sinha, R.; Stuart, J.; Sumer, S. O.; Sun, Y.; Tasman, N.; Taylor, B. S.; Voet, D.; Weinhold, N.; Weinstein, J. N.; Yang, D.; Yoshihara, K.; Zheng, S.; Zhang, W.; Zou, L.; Abel, T.; Sadeghi, S.; Cohen, M. L.; Eschbacher, J.; Hattab, E. M.; Raghunathan, A.; Schniederjan, M. J.; Aziz, D.; Barnett, G.; Barrett, W.; Bigner, D. D.; Boice, L.; Brewer, C.; Calatozzolo, C.; Campos, B.; Carlotti, C. G., Jr.; Chan, T. A.; Cuppini, L.; Curley, E.; Cuzzubbo, S.; Devine, K.; DiMeco, F.; Duell, R.; Elder, J. B.; Fehrenbach, A.; Finocchiaro, G.; Friedman, W.; Fulop, J.; Gardner, J.; Hermes, B.; Herold-Mende, C.; Jungk, C.; Kendler, A.; Lehman, N. L.; Lipp, E.; Liu, O.; Mandt, R.; McGraw, M.; McLendon, R.; McPherson, C.; Neder, L.; Nguyen, P.; Noss, A.; Nunziata, R.; Ostrom, Q. T.; Palmer, C.; Perin, A.; Pollo, B.; Potapov, A.; Potapova, O.; Rathmell, W. K.; Rotin, D.; Scarpace, L.; Schilero, C.; Senecal, K.; Shimmel, K.; Shurkhay, V.; Sifri, S.; Singh, R.; Sloan, A. E.; Smolenski, K.; Staugaitis, S. M.; Steele, R.; Thorne, L.; Tirapelli, D. P.; Unterberg, A.; Vallurupalli, M.; Wang, Y.; Warnick, R.; Williams, F.; Wolinsky, Y.; Bell, S.; Rosenberg, M.; Stewart, C.; Huang, F.; Grimsby, J. L.; Radenbaugh, A. J.; Zhang, J. , Comprehensive, Integrative Genomic Analysis of Diffuse Lower-Grade Gliomas. The New England journal of medicine 2015, 372, 2481–2498. [Google Scholar] [PubMed]
- McLendon, R.; Friedman, A.; Bigner, D.; Van Meir, E. G.; Brat, D. J.; M. Mastrogianakis, G.; Olson, J. J.; Mikkelsen, T.; Lehman, N.; Aldape, K.; Alfred Yung, W. K.; Bogler, O.; VandenBerg, S.; Berger, M.; Prados, M.; Muzny, D.; Morgan, M.; Scherer, S.; Sabo, A.; Nazareth, L.; Lewis, L.; Hall, O.; Zhu, Y.; Ren, Y.; Alvi, O.; Yao, J.; Hawes, A.; Jhangiani, S.; Fowler, G.; San Lucas, A.; Kovar, C.; Cree, A.; Dinh, H.; Santibanez, J.; Joshi, V.; Gonzalez-Garay, M. L.; Miller, C. A.; Milosavljevic, A.; Donehower, L.; Wheeler, D. A.; Gibbs, R. A.; Cibulskis, K.; Sougnez, C.; Fennell, T.; Mahan, S.; Wilkinson, J.; Ziaugra, L.; Onofrio, R.; Bloom, T.; Nicol, R.; Ardlie, K.; Baldwin, J.; Gabriel, S.; Lander, E. S.; Ding, L.; Fulton, R. S.; McLellan, M. D.; Wallis, J.; Larson, D. E.; Shi, X.; Abbott, R.; Fulton, L.; Chen, K.; Koboldt, D. C.; Wendl, M. C.; Meyer, R.; Tang, Y.; Lin, L.; Osborne, J. R.; Dunford-Shore, B. H.; Miner, T. L.; Delehaunty, K.; Markovic, C.; Swift, G.; Courtney, W.; Pohl, C.; Abbott, S.; Hawkins, A.; Leong, S.; Haipek, C.; Schmidt, H.; Wiechert, M.; Vickery, T.; Scott, S.; Dooling, D. J.; Chinwalla, A.; Weinstock, G. M.; Mardis, E. R.; Wilson, R. K.; Getz, G.; Winckler, W.; Verhaak, R. G. W.; Lawrence, M. S.; O’Kelly, M.; Robinson, J.; Alexe, G.; Beroukhim, R.; Carter, S.; Chiang, D.; Gould, J.; Gupta, S.; Korn, J.; Mermel, C.; Mesirov, J.; Monti, S.; Nguyen, H.; Parkin, M.; Reich, M.; Stransky, N.; Weir, B. A.; Garraway, L.; Golub, T.; Meyerson, M.; Chin, L.; Protopopov, A.; Zhang, J.; Perna, I.; Aronson, S.; Sathiamoorthy, N.; Ren, G.; Yao, J.; Wiedemeyer, W. R.; Kim, H.; Won Kong, S.; Xiao, Y.; Kohane, I. S.; Seidman, J.; Park, P. J.; Kucherlapati, R.; Laird, P. W.; Cope, L.; Herman, J. G.; Weisenberger, D. J.; Pan, F.; Van Den Berg, D.; Van Neste, L.; Mi Yi, J.; Schuebel, K. E.; Baylin, S. B.; Absher, D. M.; Li, J. Z.; Southwick, A.; Brady, S.; Aggarwal, A.; Chung, T.; Sherlock, G.; Brooks, J. D.; Myers, R. M.; Spellman, P. T.; Purdom, E.; Jakkula, L. R.; Lapuk, A. V.; Marr, H.; Dorton, S.; Gi Choi, Y.; Han, J.; Ray, A.; Wang, V.; Durinck, S.; Robinson, M.; Wang, N. J.; Vranizan, K.; Peng, V.; Van Name, E.; Fontenay, G. V.; Ngai, J.; Conboy, J. G.; Parvin, B.; Feiler, H. S.; Speed, T. P.; Gray, J. W.; Brennan, C.; Socci, N. D.; Olshen, A.; Taylor, B. S.; Lash, A.; Schultz, N.; Reva, B.; Antipin, Y.; Stukalov, A.; Gross, B.; Cerami, E.; Qing Wang, W.; Qin, L.-X.; Seshan, V. E.; Villafania, L.; Cavatore, M.; Borsu, L.; Viale, A.; Gerald, W.; Sander, C.; Ladanyi, M.; Perou, C. M.; Neil Hayes, D.; Topal, M. D.; Hoadley, K. A.; Qi, Y.; Balu, S.; Shi, Y.; Wu, J.; Penny, R.; Bittner, M.; Shelton, T.; Lenkiewicz, E.; Morris, S.; Beasley, D.; Sanders, S.; Kahn, A.; Sfeir, R.; Chen, J.; Nassau, D.; Feng, L.; Hickey, E.; Zhang, J.; Weinstein, J. N.; Barker, A.; Gerhard, D. S.; Vockley, J.; Compton, C.; Vaught, J.; Fielding, P.; Ferguson, M. L.; Schaefer, C.; Madhavan, S.; Buetow, K. H.; Collins, F.; Good, P.; Guyer, M.; Ozenberger, B.; Peterson, J.; Thomson, E.; The Cancer Genome Atlas Research, N.; Tissue source sites: Duke University Medical, S.; Emory, U.; Henry Ford, H.; Center, M. D. A. C.; University of California San, F.; Genome sequencing centres: Baylor College of, M.; Broad Institute of, M. I. T.; Harvard; Washington University in St, L.; Cancer genome characterization centres: Broad Institute/Dana-Farber Cancer, I.; Harvard Medical School/Dana-Farber Cancer, I.; Johns Hopkins/University of Southern, C.; HudsonAlpha Institute/Stanford, U.; Lawrence Berkeley National, L.; Memorial Sloan-Kettering Cancer, C.; University of North Carolina, C. H.; Biospecimen Core, R.; Data Coordinating, C.; Project teams: National Cancer, I.; National Human Genome Research, I., Comprehensive genomic characterization defines human glioblastoma genes and core pathways. Nature 2008, 455, 1061–1068. [Google Scholar]
- Colaprico, A.; Silva, T. C.; Olsen, C.; Garofano, L.; Cava, C.; Garolini, D.; Sabedot, T. S.; Malta, T. M.; Pagnotta, S. M.; Castiglioni, I.; Ceccarelli, M.; Bontempi, G.; Noushmehr, H. , TCGAbiolinks: an R/Bioconductor package for integrative analysis of TCGA data. Nucleic Acids Res 2016, 44, e71. [Google Scholar] [CrossRef]
- Barthel, F. P.; Johnson, K. C.; Varn, F. S.; Moskalik, A. D.; Tanner, G.; Kocakavuk, E.; Anderson, K. J.; Abiola, O.; Aldape, K.; Alfaro, K. D.; Alpar, D.; Amin, S. B.; Ashley, D. M.; Bandopadhayay, P.; Barnholtz-Sloan, J. S.; Beroukhim, R.; Bock, C.; Brastianos, P. K.; Brat, D. J.; Brodbelt, A. R.; Bruns, A. F.; Bulsara, K. R.; Chakrabarty, A.; Chakravarti, A.; Chuang, J. H.; Claus, E. B.; Cochran, E. J.; Connelly, J.; Costello, J. F.; Finocchiaro, G.; Fletcher, M. N.; French, P. J.; Gan, H. K.; Gilbert, M. R.; Gould, P. V.; Grimmer, M. R.; Iavarone, A.; Ismail, A.; Jenkinson, M. D.; Khasraw, M.; Kim, H.; Kouwenhoven, M. C. M.; LaViolette, P. S.; Li, M.; Lichter, P.; Ligon, K. L.; Lowman, A. K.; Malta, T. M.; Mazor, T.; McDonald, K. L.; Molinaro, A. M.; Nam, D.-H.; Nayyar, N.; Ng, H. K.; Ngan, C. Y.; Niclou, S. P.; Niers, J. M.; Noushmehr, H.; Noorbakhsh, J.; Ormond, D. R.; Park, C.-K.; Poisson, L. M.; Rabadan, R.; Radlwimmer, B.; Rao, G.; Reifenberger, G.; Sa, J. K.; Schuster, M.; Shaw, B. L.; Short, S. C.; Smitt, P. A. S.; Sloan, A. E.; Smits, M.; Suzuki, H.; Tabatabai, G.; Van Meir, E. G.; Watts, C.; Weller, M.; Wesseling, P.; Westerman, B. A.; Widhalm, G.; Woehrer, A.; Yung, W. K. A.; Zadeh, G.; Huse, J. T.; De Groot, J. F.; Stead, L. F.; Verhaak, R. G. W.; Barthel, F. P.; Johnson, K. C.; Varn, F. S.; Moskalik, A. D.; Tanner, G.; Kocakavuk, E.; Anderson, K. J.; Aldape, K.; Alfaro, K. D.; Amin, S. B.; Ashley, D. M.; Bandopadhayay, P.; Barnholtz-Sloan, J. S.; Beroukhim, R.; Bock, C.; Brastianos, P. K.; Brat, D. J.; Brodbelt, A. R.; Bulsara, K. R.; Chakrabarty, A.; Chuang, J. H.; Claus, E. B.; Cochran, E. J.; Connelly, J.; Costello, J. F.; Finocchiaro, G.; Fletcher, M. N.; French, P. J.; Gan, H. K.; Gilbert, M. R.; Gould, P. V.; Iavarone, A.; Ismail, A.; Jenkinson, M. D.; Khasraw, M.; Kim, H.; Kouwenhoven, M. C. M.; LaViolette, P. S.; Lichter, P.; Ligon, K. L.; Lowman, A. K.; Malta, T. M.; McDonald, K. L.; Molinaro, A. M.; Nam, D.-H.; Ng, H. K.; Niclou, S. P.; Niers, J. M.; Noushmehr, H.; Ormond, D. R.; Park, C.-K.; Poisson, L. M.; Rabadan, R.; Radlwimmer, B.; Rao, G.; Reifenberger, G.; Sa, J. K.; Short, S. C.; Smitt, P. A. S.; Sloan, A. E.; Smits, M.; Suzuki, H.; Tabatabai, G.; Van Meir, E. G.; Watts, C.; Weller, M.; Wesseling, P.; Westerman, B. A.; Woehrer, A.; Yung, W. K. A.; Zadeh, G.; Huse, J. T.; De Groot, J. F.; Stead, L. F.; Verhaak, R. G. W.; The, G. C. , Longitudinal molecular trajectories of diffuse glioma in adults. Nature 2019, 576, 112–120. [Google Scholar] [CrossRef]
- Puchalski, R. B.; Shah, N.; Miller, J.; Dalley, R.; Nomura, S. R.; Yoon, J. G.; Smith, K. A.; Lankerovich, M.; Bertagnolli, D.; Bickley, K.; Boe, A. F.; Brouner, K.; Butler, S.; Caldejon, S.; Chapin, M.; Datta, S.; Dee, N.; Desta, T.; Dolbeare, T.; Dotson, N.; Ebbert, A.; Feng, D.; Feng, X.; Fisher, M.; Gee, G.; Goldy, J.; Gourley, L.; Gregor, B. W.; Gu, G.; Hejazinia, N.; Hohmann, J.; Hothi, P.; Howard, R.; Joines, K.; Kriedberg, A.; Kuan, L.; Lau, C.; Lee, F.; Lee, H.; Lemon, T.; Long, F.; Mastan, N.; Mott, E.; Murthy, C.; Ngo, K.; Olson, E.; Reding, M.; Riley, Z.; Rosen, D.; Sandman, D.; Shapovalova, N.; Slaughterbeck, C. R.; Sodt, A.; Stockdale, G.; Szafer, A.; Wakeman, W.; Wohnoutka, P. E.; White, S. J.; Marsh, D.; Rostomily, R. C.; Ng, L.; Dang, C.; Jones, A.; Keogh, B.; Gittleman, H. R.; Barnholtz-Sloan, J. S.; Cimino, P. J.; Uppin, M. S.; Keene, C. D.; Farrokhi, F. R.; Lathia, J. D.; Berens, M. E.; Iavarone, A.; Bernard, A.; Lein, E.; Phillips, J. W.; Rostad, S. W.; Cobbs, C.; Hawrylycz, M. J.; Foltz, G. D. , An anatomic transcriptional atlas of human glioblastoma. Science 2018, 360, 660–663. [Google Scholar] [CrossRef] [PubMed]
- The GTEx Consortium atlas of genetic regulatory effects across human tissues. Science 2020, 369, 1318–1330. [CrossRef]
- Dobin, A.; Davis, C. A.; Schlesinger, F.; Drenkow, J.; Zaleski, C.; Jha, S.; Batut, P.; Chaisson, M.; Gingeras, T. R. , STAR: ultrafast universal RNA-seq aligner. Bioinformatics 2013, 29, 15–21. [Google Scholar] [CrossRef]
- Vera Alvarez, R.; Pongor, L. S.; Mariño-Ramírez, L.; Landsman, D. , TPMCalculator: one-step software to quantify mRNA abundance of genomic features. Bioinformatics 2019, 35, 1960–1962. [Google Scholar] [CrossRef]
- Wolf, F. A.; Angerer, P.; Theis, F. J. , SCANPY: large-scale single-cell gene expression data analysis. Genome Biol 2018, 19, 15. [Google Scholar] [CrossRef]
- Benjamini, Y.; Hochberg, Y. , Controlling the False Discovery Rate - a Practical and Powerful Approach to Multiple Testing. J R Stat Soc B 1995, 57, 289–300. [Google Scholar] [CrossRef]
- Heumos, L.; Schaar, A. C.; Lance, C.; Litinetskaya, A.; Drost, F.; Zappia, L.; Lucken, M. D.; Strobl, D. C.; Henao, J.; Curion, F.; Single-cell Best Practices, C.; Schiller, H. B.; Theis, F. J. , Best practices for single-cell analysis across modalities. Nat Rev Genet 2023, 24, 550–572. [Google Scholar] [CrossRef] [PubMed]
- Korotkevich, G.; Sukhov, V.; Budin, N.; Shpak, B.; Artyomov, M. N.; Sergushichev, A. , Fast gene set enrichment analysis. bioRxiv 2021, 060012. [Google Scholar]
- Badia, I. M. P.; Velez Santiago, J.; Braunger, J.; Geiss, C.; Dimitrov, D.; Muller-Dott, S.; Taus, P.; Dugourd, A.; Holland, C. H.; Ramirez Flores, R. O.; Saez-Rodriguez, J. , decoupleR: ensemble of computational methods to infer biological activities from omics data. Bioinform Adv 2022, 2, vbac016. [Google Scholar]
- Liberzon, A.; Subramanian, A.; Pinchback, R.; Thorvaldsdottir, H.; Tamayo, P.; Mesirov, J. P. , Molecular signatures database (MSigDB) 3.0. Bioinformatics 2011, 27, 1739–1740. [Google Scholar] [CrossRef]
- Virtanen, P.; Gommers, R.; Oliphant, T. E.; Haberland, M.; Reddy, T.; Cournapeau, D.; Burovski, E.; Peterson, P.; Weckesser, W.; Bright, J.; van der Walt, S. J.; Brett, M.; Wilson, J.; Millman, K. J.; Mayorov, N.; Nelson, A. R. J.; Jones, E.; Kern, R.; Larson, E.; Carey, C. J.; Polat, I.; Feng, Y.; Moore, E. W.; VanderPlas, J.; Laxalde, D.; Perktold, J.; Cimrman, R.; Henriksen, I.; Quintero, E. A.; Harris, C. R.; Archibald, A. M.; Ribeiro, A. H.; Pedregosa, F.; van Mulbregt, P.; SciPy, C. , SciPy 1.0: fundamental algorithms for scientific computing in Python. Nat Methods 2020, 17, 261–272. [Google Scholar] [CrossRef]
- Aibar, S.; Gonzalez-Blas, C. B.; Moerman, T.; Huynh-Thu, V. A.; Imrichova, H.; Hulselmans, G.; Rambow, F.; Marine, J. C.; Geurts, P.; Aerts, J.; van den Oord, J.; Atak, Z. K.; Wouters, J.; Aerts, S. , SCENIC: single-cell regulatory network inference and clustering. Nat Methods 2017, 14, 1083–1086. [Google Scholar] [CrossRef]
- Love, M. I.; Huber, W.; Anders, S. , Moderated estimation of fold change and dispersion for RNA-seq data with DESeq2. Genome Biology 2014, 15, 550. [Google Scholar] [CrossRef]
- Wickham, H., ggplot2: Elegant graphics for data analysis. In Springer-Verlag: 2016.
- Hänzelmann, S.; Castelo, R.; Guinney, J. , GSVA: gene set variation analysis for microarray and RNA-Seq data. BMC Bioinformatics 2013, 14, 7. [Google Scholar] [CrossRef]
- Kassambara, A. ggpubr: 'ggplot2' Based Publication Ready Plots. https://cran.r-project.
- Therneau, T. M.; Grambsch, P. M., The Cox Model. In Modeling Survival Data: Extending the Cox Model, Therneau, T. M.; Grambsch, P. M., Eds. Springer New York: New York, NY, 2000; pp 39-77.
- Kassambara, A., & Kosinski, M survminer: Drawing survival curves using 'ggplot2'. https://cran.r-project.org/package=survminer.
- Verhaak, R. G.; Hoadley, K. A.; Purdom, E.; Wang, V.; Qi, Y.; Wilkerson, M. D.; Miller, C. R.; Ding, L.; Golub, T.; Mesirov, J. P.; Alexe, G.; Lawrence, M.; O'Kelly, M.; Tamayo, P.; Weir, B. A.; Gabriel, S.; Winckler, W.; Gupta, S.; Jakkula, L.; Feiler, H. S.; Hodgson, J. G.; James, C. D.; Sarkaria, J. N.; Brennan, C.; Kahn, A.; Spellman, P. T.; Wilson, R. K.; Speed, T. P.; Gray, J. W.; Meyerson, M.; Getz, G.; Perou, C. M.; Hayes, D. N. , Integrated genomic analysis identifies clinically relevant subtypes of glioblastoma characterized by abnormalities in PDGFRA, IDH1, EGFR, and NF1. Cancer Cell 2010, 17, 98–110. [Google Scholar] [CrossRef]
Figure 1.
Distinct OR expression patterns in GBM compared to normal brain and LGG. (A) Principal component analysis (PCA) of OR gene expression using TCGA and GTEx RNA-seq data. PCA was performed on the expression profiles of 847 OR genes. PCA plot including GBM, LGG (TCGA), and normal cortex (GTEx) samples (left panel). PCA plot showing the distribution of TCGA samples only (right panel). (B) Differential gene expression analysis of OR in GBM. Volcano plots showing differentially expressed OR genes filtered from genome-wide differential expression analysis. GBM versus normal cortex samples (left panel). GBM versus LGG samples (right panel). For clarity, only non-overlapping OR gene labels are displayed. (C) Venn diagrams illustrating the overlap of differentially expressed OR genes between GBM versus normal cortex and GBM versus LGG comparisons. The diagram shows OR genes that are up-regulated (left panel) and down-regulated (right panel) in GBM. (D) Bar plot showing the percentage of dysregulated OR genes within each OR family (calculated as the number of dysregulated OR genes divided by the total number of OR genes per family). Comparison of up- (pink) and down-regulated (green) OR percentages across 14 detected OR families.
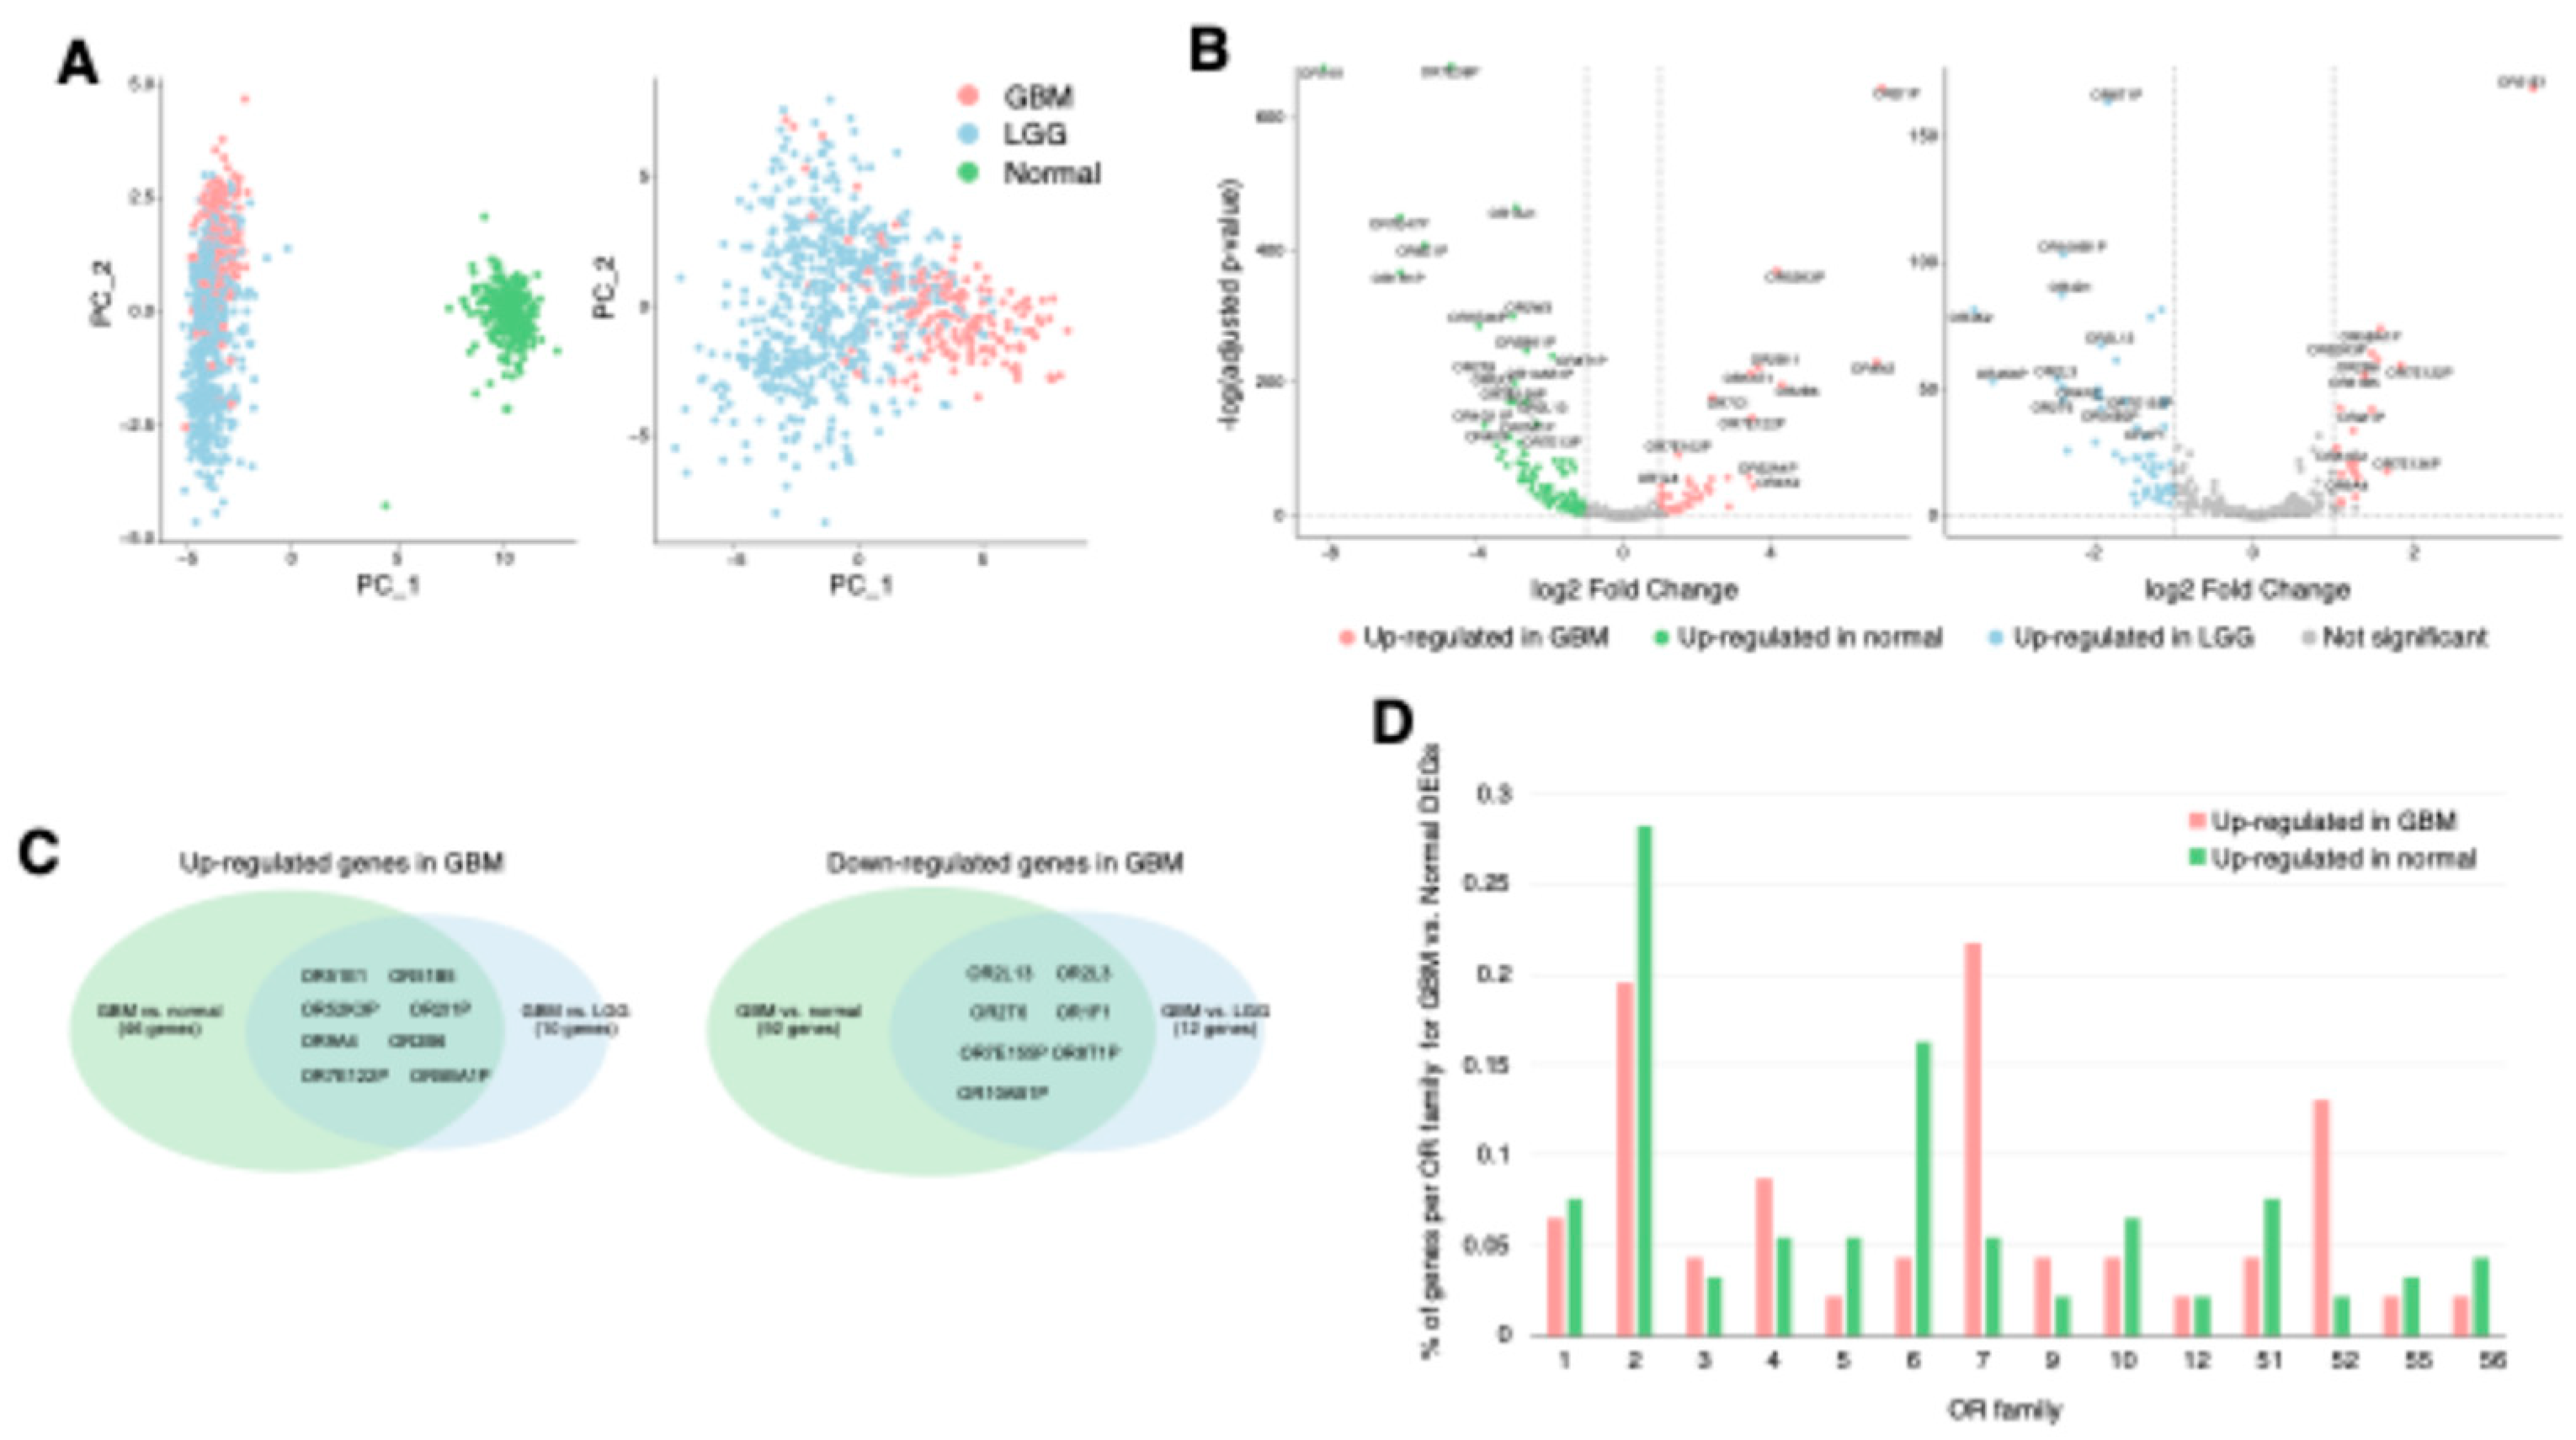
Figure 2.
Cell-type-specific OR expression patterns in GBM at single-cell resolution. (
A) UMAP visualization of single-cell RNA-seq data showing the distribution of cell populations in GBM. Each cell (dot) is colored by cell identity at three annotation levels (left: level 1, middle: level 2, right: level 3), following the reference publication annotation scheme [
32]. (
B) OR family distribution analysis showing the percentage of OR-positive cells across cell populations, demonstrating predominant enrichment of OR family 7 in neoplastic cells and OR family 2 in non-neoplastic cells. Cells with positive expression of any OR in each OR family were designated as OR-positive. (
C) Differential expression analysis of OR genes between neoplastic and non-neoplastic cells. Colored dots represent differently expressed ORs (|log2 fold change| > 1, adjusted p-value < 0.05). (
D) Cell type-specific differentially expressed OR genes based on annotation level 3 (adjusted p-value < 0.05). Statistical significance was assessed by Wilcoxon rank-sum test with Benjamini-Hochberg correction.
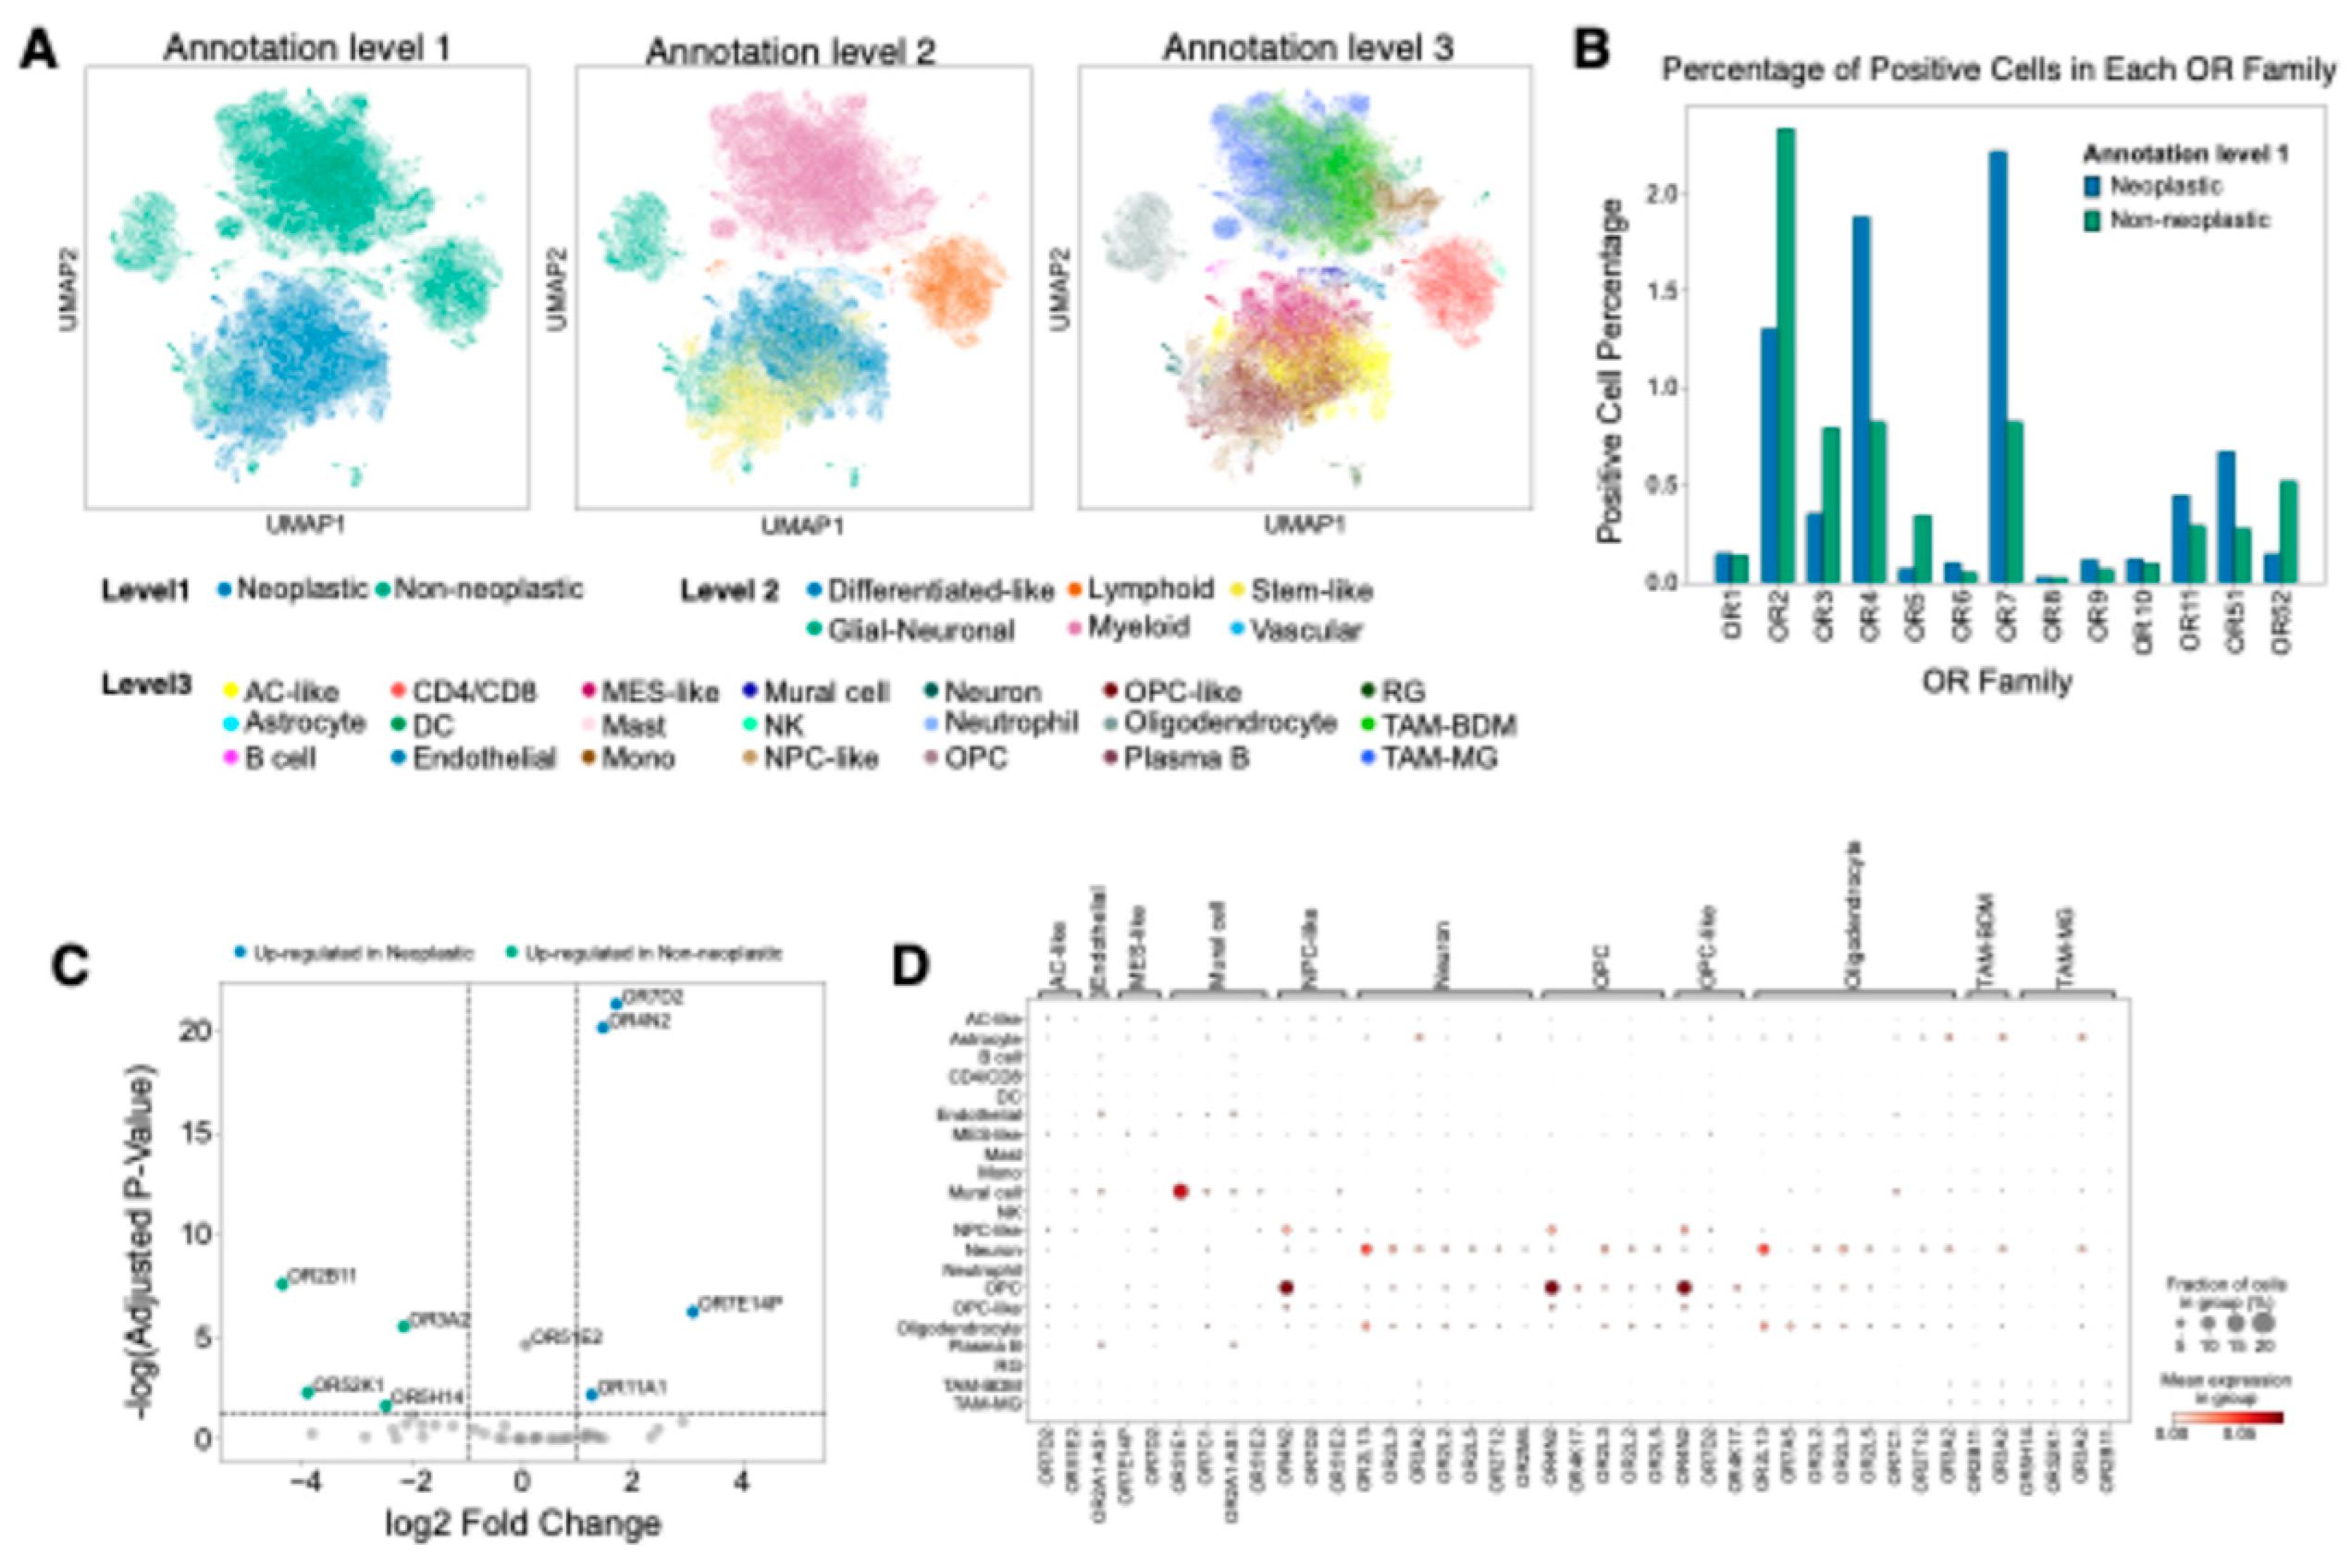
Figure 3.
Neoplastic cell-expressing OR genes in GBM. (A-D) UMAP visualization of single-cell RNA-seq data showing OR expression distribution across neoplastic and non-neoplastic cells. The analysis demonstrates expression patterns of OR11A1 (A), OR7D2 (B), OR4N2 (C), and OR7E14P (D). (E) Heatmap depicting state-specific OR gene expression in TCGA-GBM data. Differential gene expression analysis identified up-regulated OR genes in each GBM state-enriched group (OPC-, NPC-, MES-, AC-like) compared to other groups. The analysis reveals OR genes specifically upregulated in MES- and NPC-like groups, while no significant OR genes were detected in OPC- and AC-like groups. (F) Boxplots showing differential expression of OR4N2 (left panel) and OR7E14P (right panel) across GBM state-enriched groups, with statistical significance determined by Student’s t-test.
Figure 4.
OR51E1 contributes to vascular remodeling and angiogenesis in GBM. (A) UMAP visualization of single-cell RNA-seq data showing OR51E1 expression distribution across neoplastic and non-neoplastic cells, with notable expression in vascular regions. (B) Sub-clustering analysis of 11,974 vascular cells. Each cell (dot) is colored by cell type (left panel) and assigned Leiden cluster (right panel). (C) Bar plot showing the proportion of each cell type within individual Leiden clusters. (D) Differential gene expression analysis of OR genes across Leiden clusters (adjusted p-value < 0.05). (E) UMAP visualization demonstrating OR51E1 expression distribution across vascular cells, with prominent expression in clusters 1, 4, and 9. (F) Violin plots showing expression levels of pericyte markers and angiogenic factors: RGS5 (left), PDGFRB (middle), and VEGFA (right panel). (G) Dot plot showing correlation analysis between OR51E1 expression and angiogenesis-associated gene sets from MSigDB in TCGA-GBM. **** p < 0.0001; *** p < 0.001; ** p < 0.01; * p < 0.05. (H) Box plots showing differential expression of PDGFRB, RGS5, and VEGFA between OR51E1-high (> median) and -low (< median) groups in TCGA-GBM data. (I) Box plot showing OR51E1 expression across distinct histological features from Ivy Glioblastoma Atlas dataset, including cellular tumor, perinecrotic zone, hyperplastic blood vessels, microvascular proliferation, pseudopalisading cells, infiltrating tumor and leading edge. Statistical significance was assessed by ANOVA.
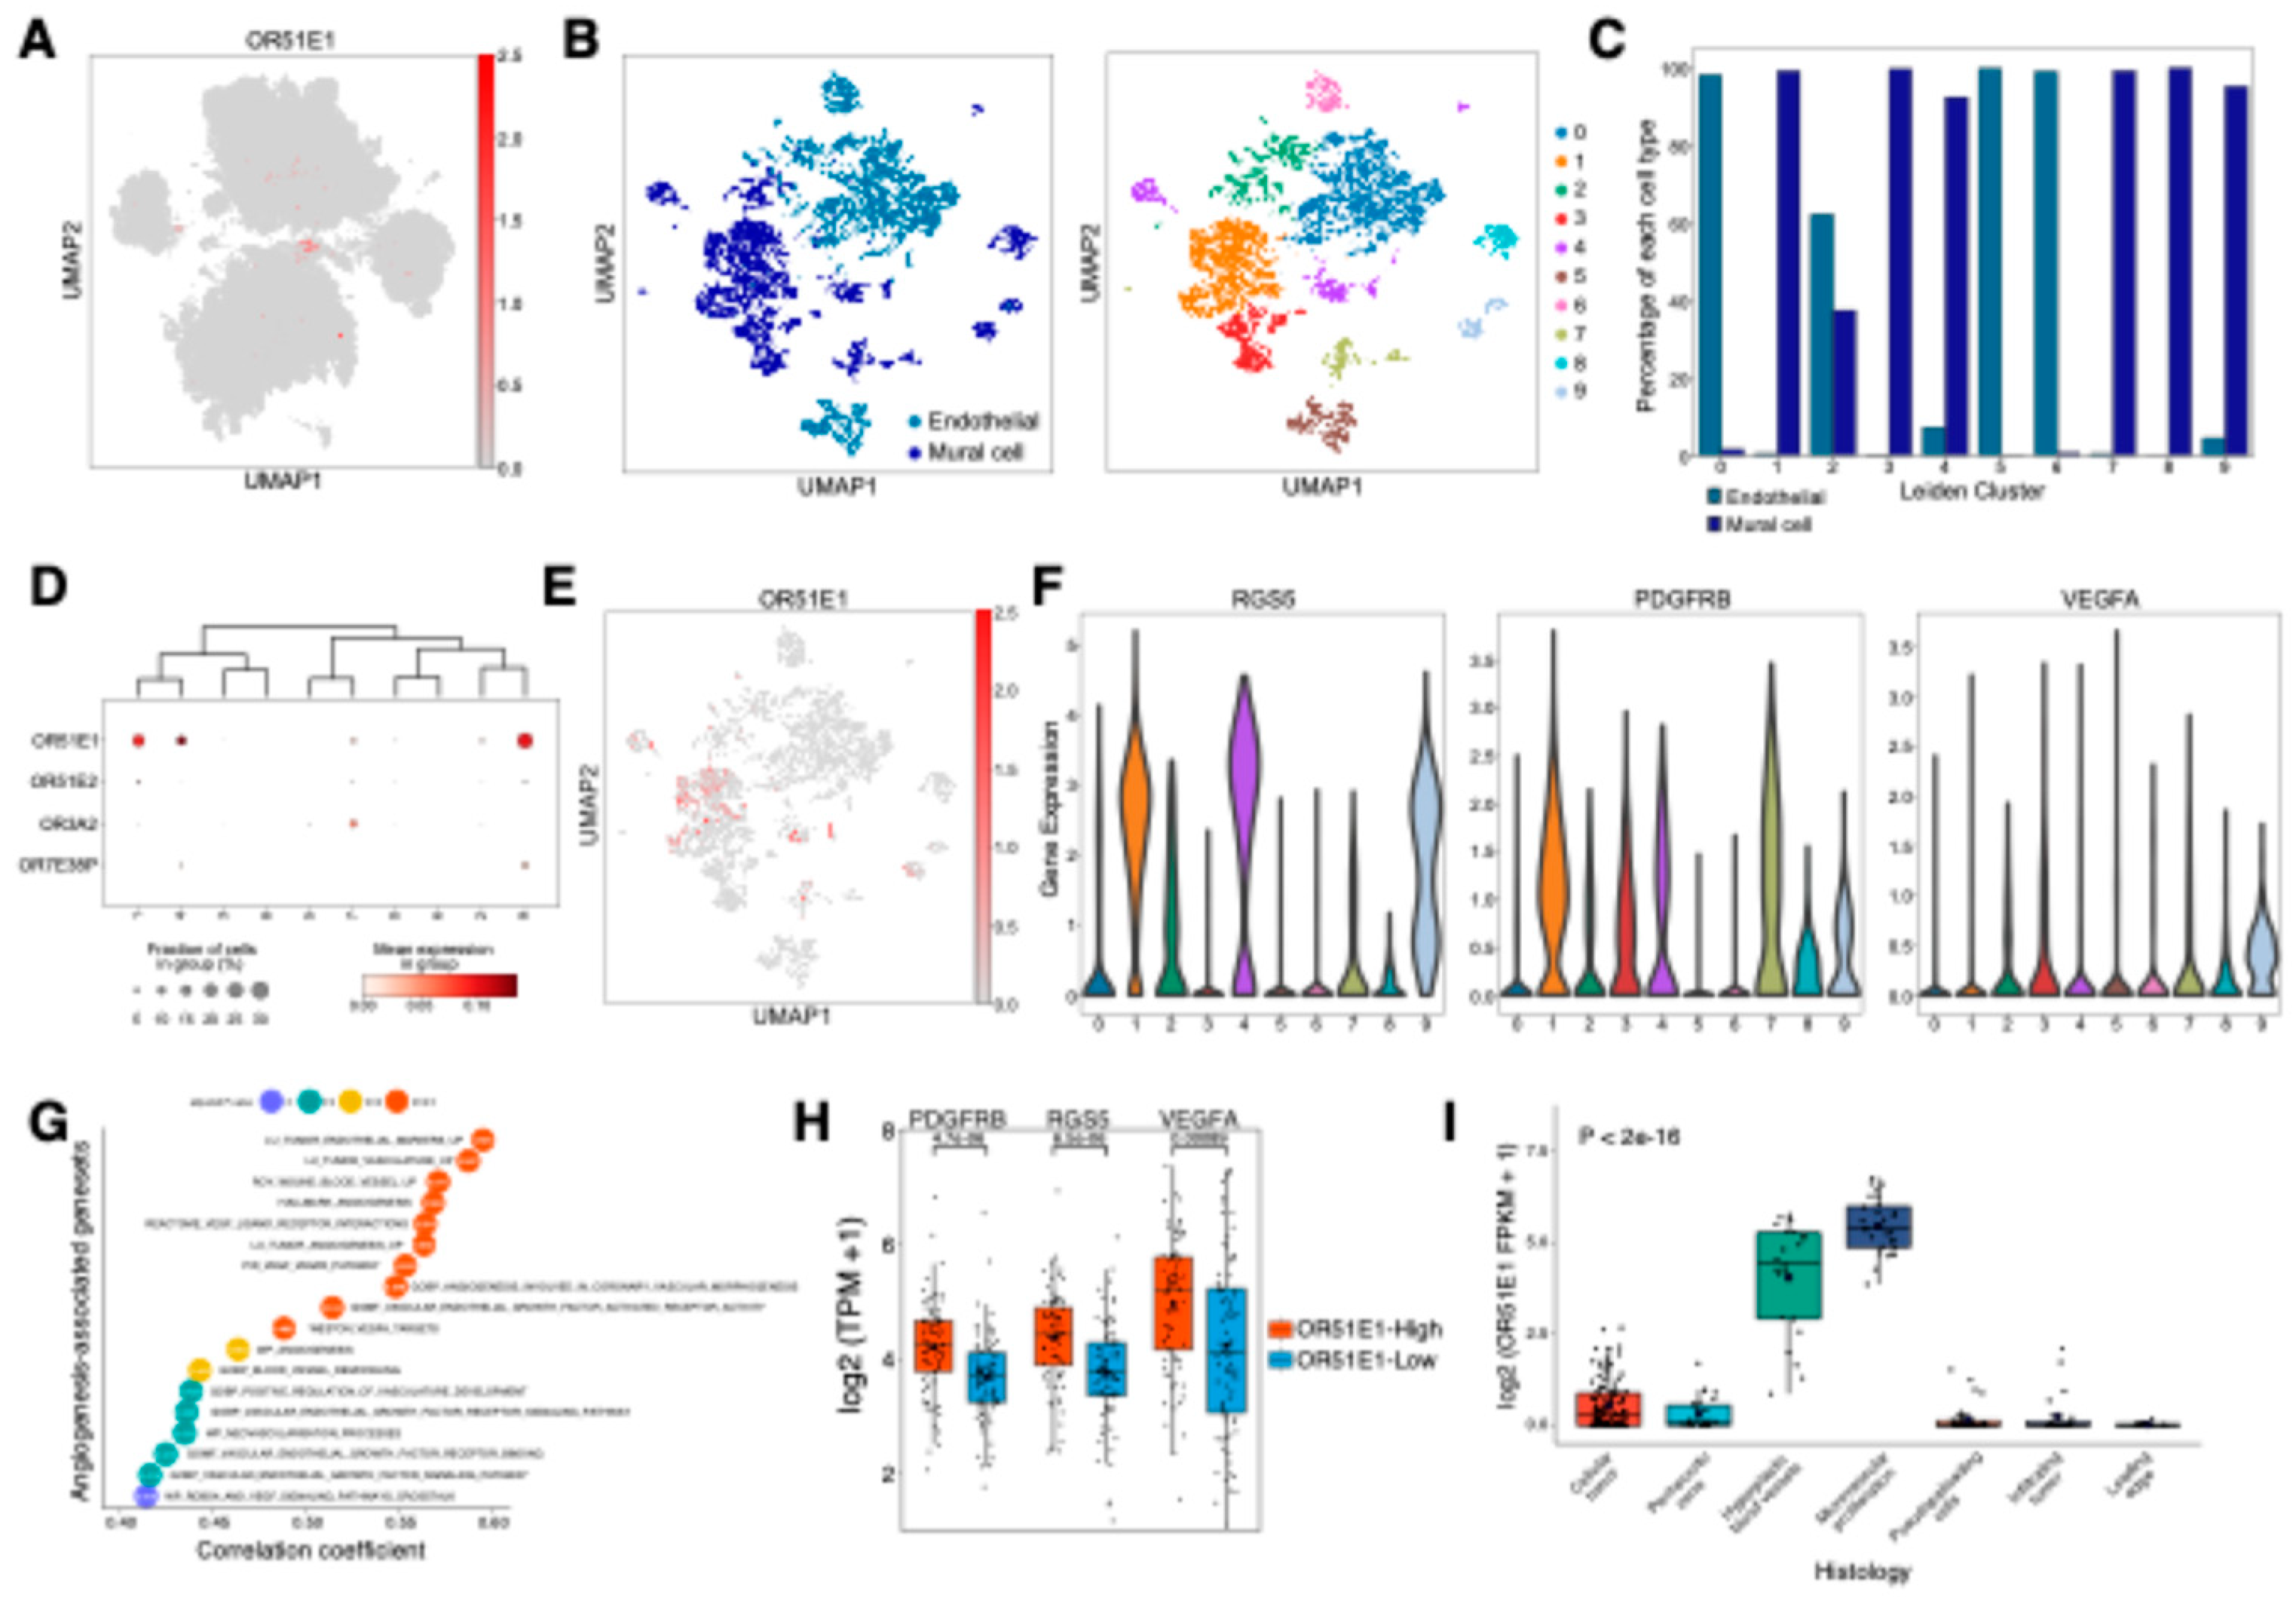
Figure 5.
OR2B11 overlaps with mesenchymal shift-promoting TAM population in GBM. (A) Sub-clustering analysis of 468,339 TAM cells. Each cell (dot) is colored by cell type (left panel) and assigned Leiden cluster (right panel). (B) Bar plot showing the proportion of each cell type within individual Leiden clusters. (C) Differential gene expression analysis of OR genes across Leiden clusters (adjusted p-value < 0.05). (D) Bar plot showing gene set enrichment analysis (GSEA) of immune-related signatures in cluster 8. NES, normalized enrichment score. (E) Violin plot showing MARCO expression levels across Leiden clusters. Statistical significance between cluster 8 and other clusters was assessed by Wilcoxon rank-sum test with Benjamini-Hochberg correction. (F) Scatter plot showing correlation between OR2B11 and MARCO expression, using only cells expressing both genes in cluster 8. The solid line and shadow indicate the linear regression trend with 95% confidence intervals. (G) Box plot showing differential expression of OR2B11 in MES-like-enriched group compared to other groups, with statistical significance assessed by Student’s t-test. (H) Kaplan-Meier survival analysis of TCGA-GBM cohort comparing OR2B11-high (top 30%) and OR2B11-low (bottom 70%) groups. Statistical significance was assessed by log-rank test. (I) Analysis of OR2B11 expression in relation to anti-PD1 treatment response. Box plot showing OR2B11 expression levels between response groups, with statistical significance assessed by Student’s t-test (left panel). Bar plot showing the proportion of responders and non-responders stratified by OR2B11 expression levels, with high and low groups defined by top 30% threshold (right panel).
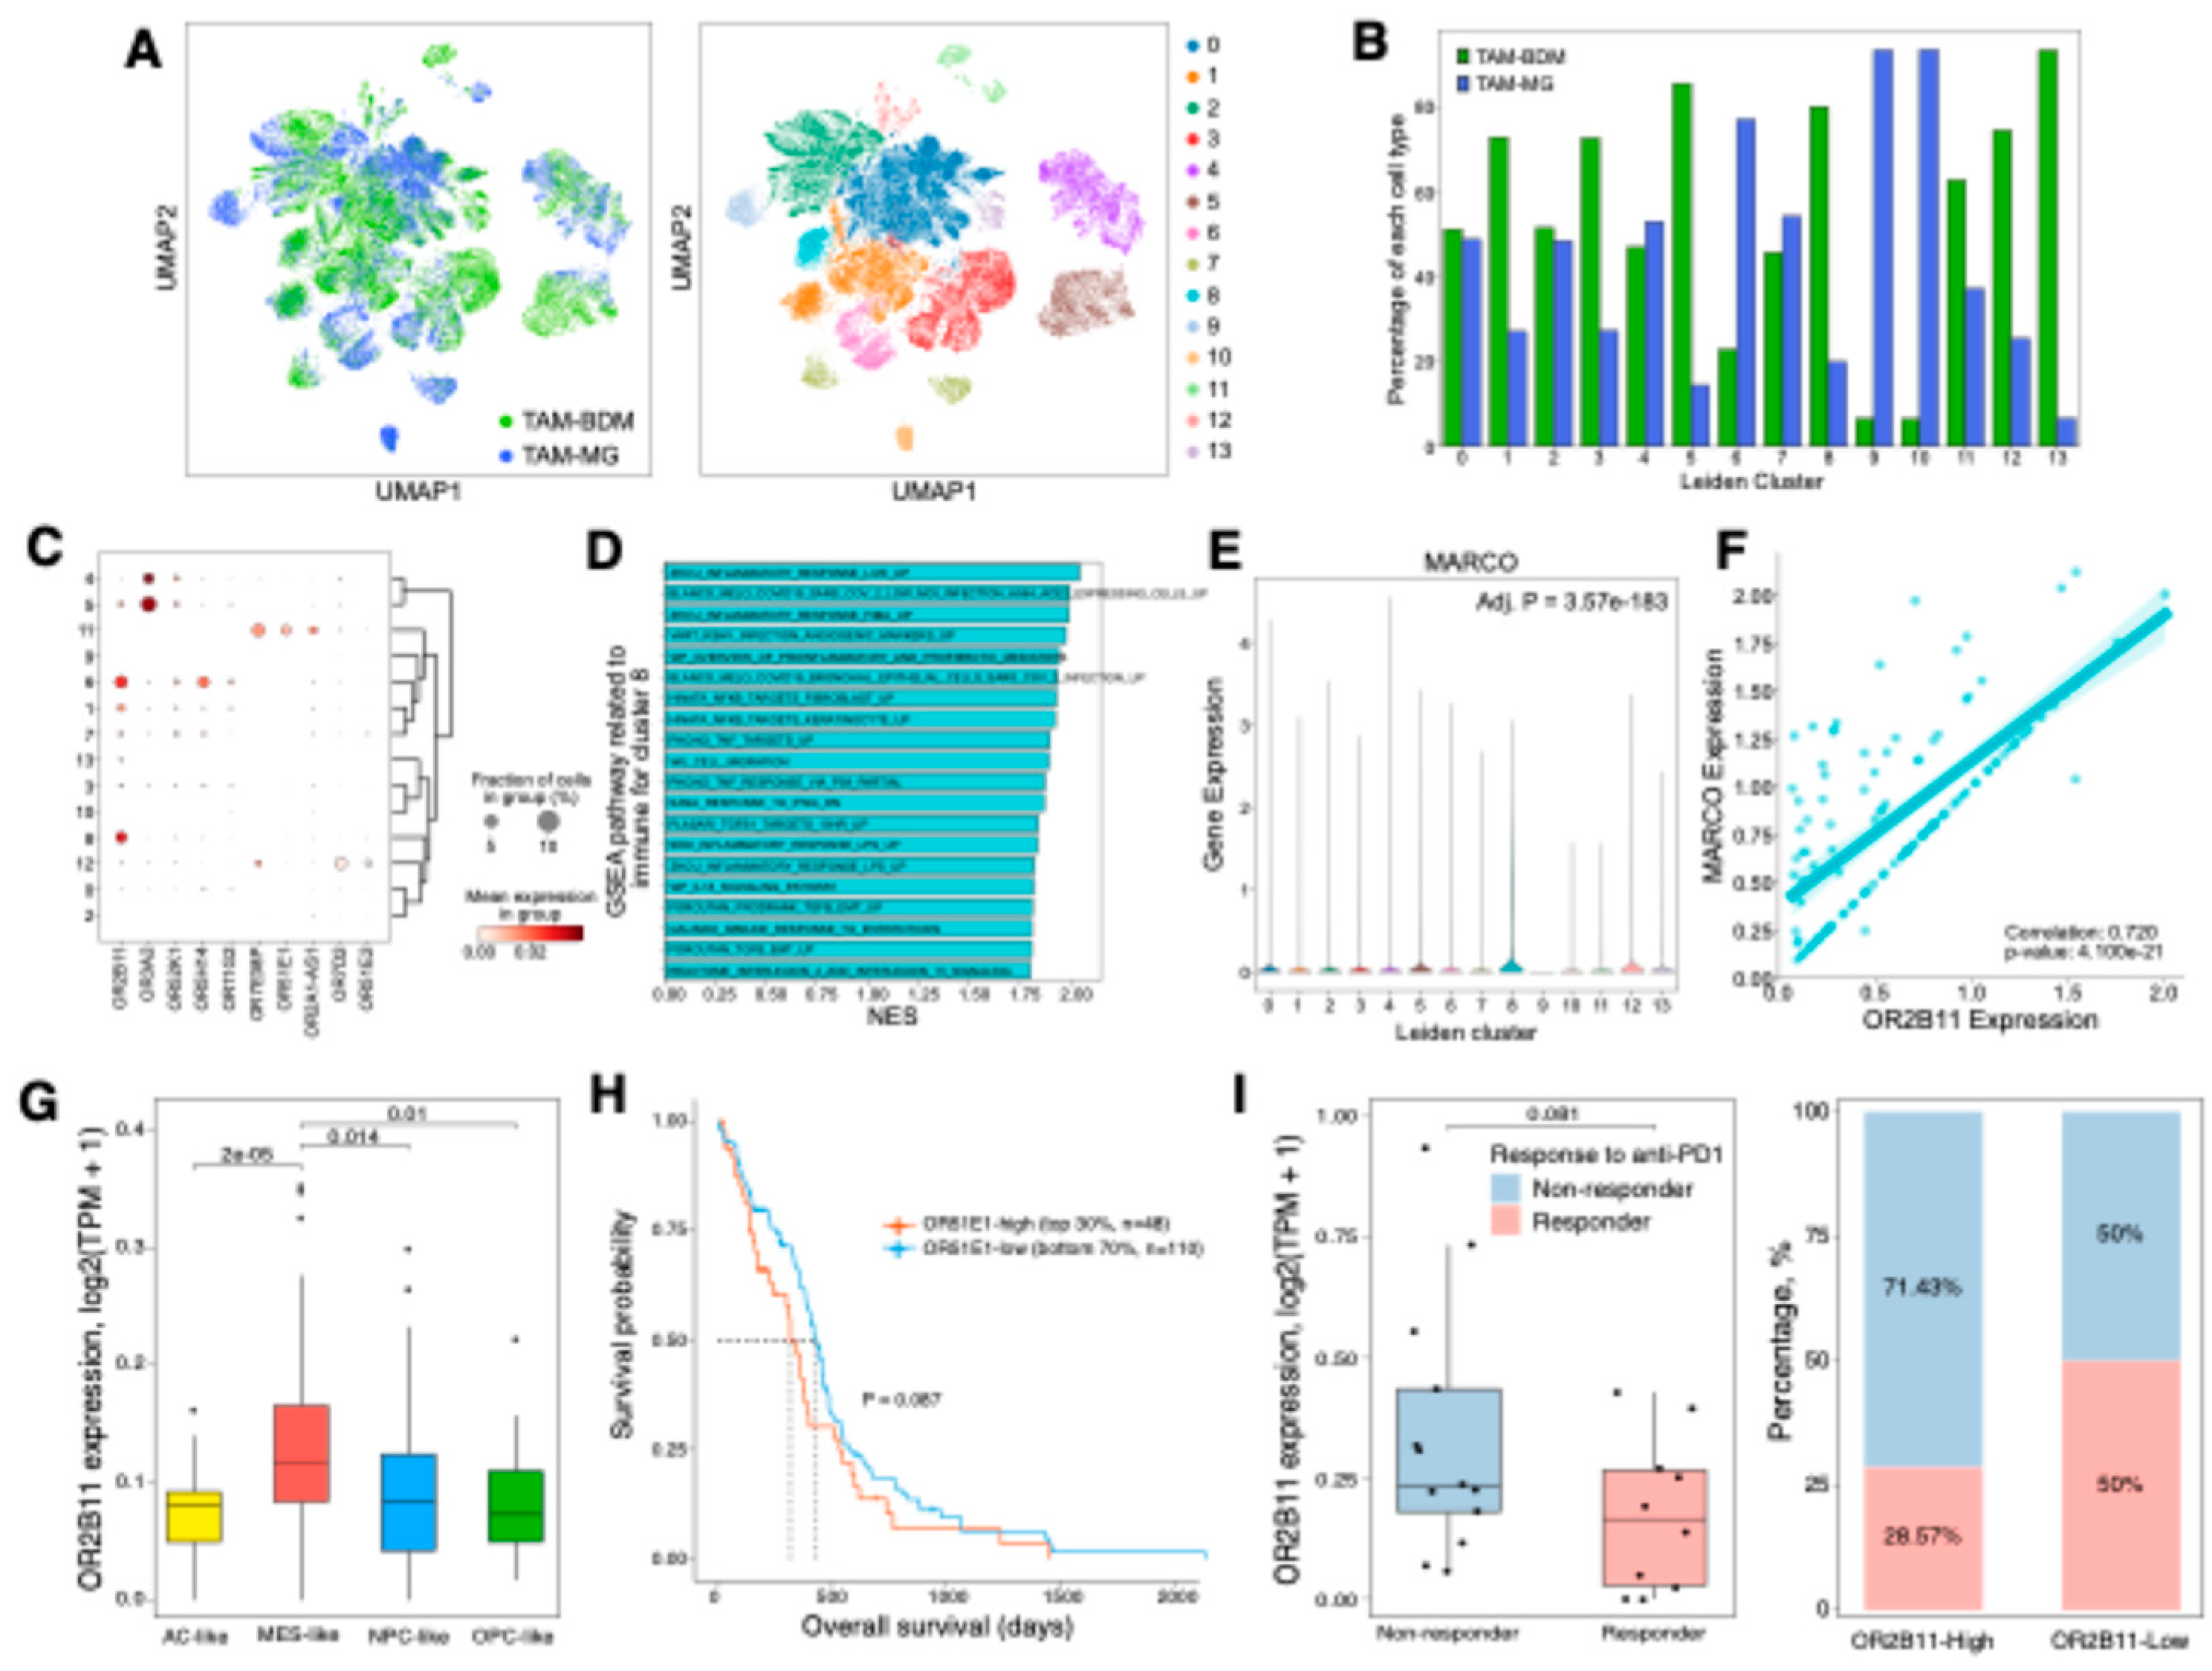
Figure 6.
OR2L13, expressed in oligodendrocytes and neurons, contributes to treatment-induced synaptic plasticity in recurrent GBM. (A) Sub-clustering analysis of 81,600 neurons, OPCs, and oligodendrocytes. Each cell (dot) is colored by cell type (left panel) and assigned Leiden cluster (right panel). (B) Bar plot showing the proportion of each cell type within individual Leiden clusters. (C) Differential gene expression analysis of OR genes across Leiden clusters (adjusted p-value < 0.05). (D) UMAP visualization demonstrating OR2L13 expression distribution across neurons, oligodendrocytes, and OPCs, with prominent expression in subsets of neurons and oligodendrocytes. (E) Dot plot showing correlation analysis between OR2L13 expression and synapse-associated gene sets from MSigDB in TCGA-GBM. **** p < 0.0001; *** p < 0.001. (F) Box plot showing differential expression of OR2L13 between primary and recurrent samples from Glioma Longitudinal AnalySiS (GLASS) dataset. Statistical significance was assessed by Student’s t-test (**** p < 0.0001).
|
Disclaimer/Publisher’s Note: The statements, opinions and data contained in all publications are solely those of the individual author(s) and contributor(s) and not of MDPI and/or the editor(s). MDPI and/or the editor(s) disclaim responsibility for any injury to people or property resulting from any ideas, methods, instructions or products referred to in the content. |
© 2024 by the authors. Licensee MDPI, Basel, Switzerland. This article is an open access article distributed under the terms and conditions of the Creative Commons Attribution (CC BY) license (http://creativecommons.org/licenses/by/4.0/).