
Submitted:
18 December 2024
Posted:
19 December 2024
You are already at the latest version
Abstract
The IgLON Family of Tumor Suppressor Genes (TSG) impact a variety of cellular processes involved in cancer and non-cancer biology. OPCML is a member of this family and as a potent TSG it is commonly silenced in many human cancers and thus an important control point in oncogenesis and tumor growth. Here, we analyze RNA-Seq expression ratios in ovarian cancers from The Cancer Genome Atlas (TCGA) to identify gene sets that exhibit a synergistic survival difference in patients in association with loss of OPCML expression. Using enrichment analyses, we reconstruct functional associations revealing broad secondary cross-talk impacts of OPCML. These results emphasize the role of OPCML's regulation of Receptor Tyrosine Kinase (RTK) signaling pathways (PI3K/AKT and MEK/ERK) while identifying three new potential RTK transcriptomic linkages to KIT, TEK and ROS1 in ovarian cancers. In addition, we show that many other known extracellular signaling receptor ligands are also transcriptionally linked to OPCML. Considering the range of cell surface and signaling pathway impacts of OPCML evident here, we expand the understanding of OPCML's broad cellular influences and conclude that OPCML is a multi-functional, pleiotropic, Tumor Suppressor.
Keywords:
OPCML
; Ovarian Cancer
; IGLON Gene Family
; Tumor Suppressor Genes
; RTK suppression
1. Introduction
The IgLON family of Tumor Suppressor Genes (TSG) were first described in expression studies of brain astrocyte cell cultures [1,2]. There are five protein family members with names reflecting their initial description in neuronal growth and differentiation: Opioid Binding and Cell Adhesion Molecule (OPCML), Neurotrimin (NTM), Neuronal Growth Regulator 1 (NEGR1), Limbic System Associated Membrane Protein (LSAMP), and an unnamed gene (IgLON5). However, early functional genomics screening of gene expression profiles in tumors revealed that IgLON TSGs were important in regulating cell growth, proliferation and differentiation in a variety of tissues, including many types of tumors. In the early 2000s, OPCML was clearly shown to be silenced in the majority of ovarian cancer cases (via DNA methylation of two promoter CpG islands) [3,4,5,6,7]. Over the last two decades, much attention has been given to defining aspects of the mechanism through which OPCML controls receptor tyrosine kinase (RTK) signaling pathways through protein-protein interactions thus playing an important natural role in preventing tumor growth in many cancers [8,9,10].
In healthy cells, low-level constitutive expression of IgLON TSGs maintain an appropriate density of IgLON membrane proteins within lipid raft microdomains to modulate cell surface interactions and signal transduction pathways [10]. Because the suppression or silencing of OPCML results in the loss or absence of the protein in many cancers, this gene/protein provides an excellent target for potential replacement therapies with a site of action at the external surface of the cell membrane [10,11,12,13]. In evaluating the therapeutic potential of OPCML, it is important to keep in mind that it generally has a dimeric structure consisting of two chains each containing three immunoglobulin (Ig) domains, anchored to the cell membrane via a glycosyl-phosphatidylinositol (GPI) moiety [11]. Thus, it is likely that there are several functional activities and processes by which OPCML may impact cells through the interactions of its three Ig domains with other extracellular ligands/targets.
In this study, we assess the range of biological and cellular processes that have synergistic associations with RNA transcript expression levels of OPCML in ovarian cancer (Stage IIIC, high grade serous carcinoma). Subject cohorts and RNA-Seq data were curated by The Cancer Genome Atlas (TCGA) Research Network. Our approach uses RNA-Seq ratios for OPCML normalized to each defined gene feature to bifurcate a subject cohort into a “normal constitutive” expression ratio group (> median ratio) and a “suppressed or silenced” expression ratio group (≤ median ratio). We then test for survival (Cox Hazard Ratios) in the “normal constitutive” ratio group and mortality risk in the “suppressed or silenced” expression ratio group to identify gene sets that exhibit a potential synergy on patient outcomes, relative to OPCML gene expression. Although this is an indirect association measurement, the phenotype being tested is patient overall survival, which is a robust and well defined outcome measured as “days_to_death” after primary diagnosis.
Functional enrichment analyses of these gene sets predict potential downstream linkages between OPCML expression and cellular activities and processes. OPCML’s tumor suppressor activity is ultimately defined by the functional effects of its three Ig domains, which potentially could act along several parallel paths to suppress tumor formation. Thus, the goal of this present study is to look deeper into the multi-functional impacts of OPCML in ovarian cancer.
2. Materials and Methods
Study Data: Subject cohorts utilize RNA-Seq data generated by the The Cancer Genome Atlas (TCGA) Research Network: https://www.cancer.gov/tcga. For high-grade serous Ovarian Cancer (TCGA-OV), inclusion criteria were: Stage IIIC tumors and integer "days_to_death" value (since diagnosis) greater than 0 and less than 3,650 (10 years). These criteria resulted in an ovarian cancer cohort of 189 subjects after the removal of one individual with an extreme RNA-Seq value for OPCML transcript counts (16.2 Standard Deviation units above mean Z-score value).
Survival Analysis: Data download and initial handling used the TCGAbiolinks R package for preprocessing and GC normalization [14,15]. These values were then transformed as values to more uniformly scale the RNA-Seq ratios that were calculated to normalize OPCML expression to other genes. The linear upscale by results in a minimum working value of 2.0 when normalized RNA-Seq values are near zero and ensures that the denominator in calculating the RNA-Seq ratios was never close to zero.
These ratio values were calculated for OPCML and the 60,660 transcript features available in the TCGA data sets. For each transcript feature, the ovarian cancer cohort was bifurcated into two groups by the median ratio value: 1) a “normal constitutive” ratio group (> median ratio; higher relative OPCML expression) and 2) a “suppressed or silenced” ratio group (≤ median ratio; lower relative OPCML expression). Survival analysis of these cohort subgroups used the R packages survminer and survival to assess differences in Kaplan-Meier survival curves (Log model p-values) and Cox Hazard Ratios (HR). All HR values are calculated as the survival risk or benefit for the “normal constitutive” OPCML expression subgroup.
A challenge to working with Hazard Ratios and applying probability distributions to assess significance is that HR distributions are neither symmetric nor balanced relative to the null hypothesis (Ho) assertion that the center of the HR distribution is 1.0. The lower tail of that distribution is limited to a range of 0 to 1. The upper tail can range from 1 to +∞. We applied a simple algebraic transform in R to establish a symmetrical distribution (Eq. 1)
where the symmetrical HR value (HRsym) is derived from inverting the Cox HR when it is less than 1, and then adjusting the center of the null hypothesis distribution to assert HRsym=0 when there is no difference in survival. We finally use a simple Z-score transform (Eq. 2)
where the Z-score HRsym transform (HRz) now has a mean value of 0 (null Ho “no effect” center) and a standard deviation (sd) of 1.
HRz False Discovery Rates (FDR): The high number of survival curves being assessed for each gene ratio raises concerns of high false positive rates or FDR. In this study, Monte Carlo empirical simulations were executed with the expression ratios calculated using randomized gene RNA-Seq matrices plus with randomized survival “days_to_death” values among cohort subjects. From the resulting distributions of HRz values we established the lower 0.025 quantile limits (equivalent to = 0.05 for a two-tailed distribution) for HRz values that would likely be observed (with 95% confidence) due to only random sampling processes across this high-dimensional space (number of subjects * number of features). These randomized HRz thresholds of significance were measured and then applied to the real-world OPCML x data analysis to ensure our acceptance of significant HRz values were not in excess of a controlled false positive rate of 0.025 on either tail of the distribution (net FDR < 0.05). In this study, the vast majority of HRz values scored as significant (over 96%) were in the lower tail of the HRz distribution, i.e. survival benefit in the “normal constitutive” expression group (higher ; HRz < 0).
In addition, we applied a screening criterion for assessing significant HRz results requiring that the Log model p-value of the survival curve for stratification had to be at least 10% more significant than the Log model p-value of a corresponding survival analysis with median stratification based only on single RNA-Seq values. In this way, we ensured that any final decision of a functional significant relationship evidenced a higher significance (lower p-value) than the sole expression by itself. As single gene RNA-Seq values, OPCML itself showed no significant survival differentiation in the ovarian cancer population under study.
Gene and Functional Enrichment Analyses: RNA-Seq features with significant HRz values were used to compile feature sets using custom R scripts. To better assess the functional significance of these gene sets, enrichment analyses used common curated databases: Gene Ontology (GO), Reactome (GSEA, Broad Inst., MIT) and Kyoto Encyclopedia of Genes and Genomes (KEGG). These different enrichment approaches yield different results and our approach here integrated these data streams into a functional snapshot of OPCML in Ovarian cancer [16]. The R packages clusterProfiler, enrichplot and pathfindR were used for executing analyses and visualizing results [17,18,19,20]. Most of the enriched results presented in this paper were generated by subnetwork association analysis of pathfindR using a reference protein interaction network from the BioGRID database [21]. For functional enrichment analyses, Benjamini-Hochberg FDR adjusted p-values were used at =0.050.
3. Results
3.1. Survival Curve HR Analyses
The assessment of RNA-Seq data from an Ovarian cancer cohort focuses on potential survival impacts of each RNA feature (n = 60,660) in independent Kaplan-Meier (KM) survival curve analyses. For each RNA feature, the cohort was first stratified by median RNA-Seq expression to establish a “baseline” contribution to survival (positive or negative) for each gene or feature. In Figure 1, example KM curves are shown for OPCML and CKS1BP3 (CDC28 Protein Kinase Regulatory Subunit 1B Pseudogene 3), neither of which evidence any significant differential survival based on their solo expression levels. In subsequent rounds of RNA-Seq ratio testing (following) these baseline p-values and hazard ratios are used to gauge any statistically significant changes when assessing RNA-Seq ratios of OPCML:.
The survival Hazard Ratio analyses are used to identify possible synergistic associations between OPCML and other genes that show differential survival when coupled with OPCML expression. In Figure 2a, an RNA-Seq ratio of OPCML and CKS1BP3 is shown as a distribution of values among cohort subjects. Median stratification divides the cohort into two subgroups with High vs Low ratios. Although neither OPCML nor CKS1BP3 impact survival based on solo gene expression values (Fig. Figure 1), stratifying by the OPCML:CKS1BP3 ratio yields a significant survival benefit for the “High.Ratio” group (Cox HR = 0.657; model p-value = 0.0049; Fig. Figure 2b). Note, hazard ratios are always calculated as the risk ratio of the High.Ratio group relative to the Low.Ratio group. Although no functional association is yet curated for this CKS1B psuedogene, the active expression of CKS1B has been recently linked to epithelial-mesenchymal transition (EMT) in gastric cancers [22], and the regulation of EMT by OPCML via direct interaction with AXL has been described in ovarian cancers [10].
The rationale for assessing RNA-Seq ratios with survival curves is that synergistic associations between genes can exist across large interaction networks and this approach can potentially reveal linkages that may be distantly connected, e.g. from the cell membrane surface to nuclear transcription factors. Overall, Figure 2 is presented as an example of the underlying survival curve analyses used to produce the HR values that underlie our functional assessment of OPCML. In the following analyses, our goal is to execute an integrative approach across all gene features to identify patterns that reveal potential functional shifts in cellular processes. When single gene impacts become reinforced by other genes in related pathways, then a possible linkage between OPCML and specific downstream functional shifts in cellular and molecular activities becomes more apparent.
To deal with skewed and biased raw Hazard Ratio distributions, HR values were scaled equivalently (Eq. 1) and then Z-transformed (Eq. 2) to ensure normal distributions around the null hypothesis assertion of no difference in survival (HRz = 0.0). Monte Carlo iterations of randomized RNA-Seq and survival data were used to empirically determine false discovery rate thresholds. The baseline false positive rate in these randomized RNA-Seq trials averaged 0.0522. In Figure 3, the distribution of transformed Z-scores (HRz) are shown with the center of the distribution not statistically different from the null Ho assertion of no effect when HRz = 0 (t-test, mu=0, p = n.s.). In addition, the tail quantile values at 0.025 and 0.975 are equivalent and the distribution is normally distributed (Shapiro-Wilks test, Ho: Wstat = 1.0, p = n.s.).
The distribution of HRz scores (Fig. Figure 3) has two prograding tails. The FDR thresholds are empirically determined and closely approximate the theoretical 95% core distribution boundaries for a Standard Normal Z-distribution. Functionally, these boundaries define two groups of genes: a) : HRz values < -2.0 identify genes with a survival benefit under constitutive OPCML expression levels (i.e., better survival in the RNA-Seq High.Ratio group [see Fig. Figure 2b]); b): HRz values > +2.0 identify genes with a survival benefit under suppressed OPCML expression levels (i.e., better survival in the RNA-Seq Low.Ratio group).
These two groups, and , are fundamentally different, yet connected to OPCML via RNA-Seq ratios. We highlight these groups here because they will be a focal point of subsequent analyses with green vs. orange color codes to separate functional results. The number of significant HRz scores for the group by far outnumber the group count (2311 vs. 537; Fig. Figure 3). A fundamental interpretation of this result is simply that survival benefits are more frequently evident when OPCML expression is at “normal constitutive” levels. When OPCML is “suppressed or silenced”, there are other genes ( group) that may potentially compensate for the loss of OPCML expression or parallel pathways that reinforce the impacts of OPCML but on downstream components of RTK signaling pathways.
3.2. Functional Enrichment Analyses
The collection of all significant gene features identified by survival RNA-Seq ratio HRz scores (Fig. Figure 3) were used for functional enrichment analyses. These were executed using the pathfindR package to identify active sub-network structures based on a defined protein interaction network (PIN), the results of which were then used for enrichment analyses [18]. For this project, four PIN database sources were used in serial combination with five pathway gene mapping databases (total independent enrichment analyses = 20). In Figure 4a, the count of enriched functions identified in each combination of PIN x pathway are shown. The PIN analysis sets were fairly equivalent in count results. For subsequent analyses of functions, results from all five protein interaction networks were compiled together, filtering out multiple instances of the same enriched function by keeping the one with the highest reported p-value. This collection of unique entries resulted in a data table with a total of 242 significantly enriched identified functions, pathways and processes.
In Figure 4b, differential composition of identified genes within enrichment functions is shown as a distribution using the ratio of gene counts to counts in each function. The median of the distribution is 4.0 (i.e., genes to ) and is equivalent to the ratio of their total counts which is 4.3 ( genes to ). Thus the median position is close to the expected null position of a distribution determined solely by random assortment based solely on the proportional representation of the two groups of genes. Using the median distribution value (orange line in Fig. Figure 4b) functions were classified into two similar groups: 4x or greater representation of component genes, and < 4x genes, which translates into a greater representation of genes. This classification scheme was used to assess whether functions highly enriched with genes were distinct in terms of cellular processes from other functions identified as significant in the analysis.
In Figure 5, hierarchical clustering of functions by their enriched gene composition does not show any visually distinct segregation of clusters based on the and representation in the final gene sets. Here, 20 top-level clusters are identified (A-T) and three color classification groups are highlighted as examples (a,b,c). In general, the distribution of functions having high proportions of genes are well mixed with those with more genes. The functions do not separate into unified large (> 10) clusters. The overall topology of the tree shows that there is a diversity of enriched functions with many having very limited overlaps in gene composition.
Three example clusters are indicated in Figure 5. In cluster a, there are 10 functions (and ) that have a high degree of gene overlap among them. The functions in this cluster group are described in Table 1. This cluster involves Toll-like Receptor (TLR) pathways. These entries are ranked by p-values and the top 6 have a >4x majority of genes. The 4 functions with more composition form a discrete subgroup, but have sufficient overlap in enriched genes to be highly related in terms of pathway and process activities.
In cluster b (Fig. Figure 5), there are 31 functions evenly split on the and classifications. This cluster is focused on PI3K/AKT signaling in cancer and related IGF1 and FGFR1 signaling (Table 1). We know that OPCML drives degradation of RTK signaling receptors [13] in cancers. This large cluster aligns with how “constitutive normal” expression of OPCML contributes to increased survival in patients. It is interesting to note that when ranked by p-values in Table , the top ten functions are all in the >4x gene count class. Again suggestive of this proximal cellular function by OPCML.
In cluster c (Fig. Figure 5), there are 8 functions. In contrast to clusters a and b, 7 of the 8 are in the >4x gene count class, and the cluster break is at a high level in the tree (at branch P) and thus represents a distinctive functional grouping. In Table 1, this cluster focuses on external membrane cAMP signaling and connected pathways. Of note is the function “Calcitonin-like ligand receptors” (CLRs; Reactome 419812) with a xFold-enrichment of 16.2x, the highest in this study. CLRs have potent tumor micro-environment impacts in terms of stimulating both angiogenesis and cell proliferation [note: need to add ref]. The tumor suppressor activity of OPCML, particularly in its tumor micro-environment location, is clearly antagonistic to the action of CLRs in tumors.
Overall, hierarchical clustering of enriched functions by gene content is an efficient way to organize and visualize functional groupings within a large set of results (n=242). However, the challenge becomes how to work through all the cluster groupings to find key pathways and processes that are relevant to our understanding of the breadth of cellular impacts OPCML may have in suppressing tumor proliferation in ovarian cancer. The short summaries of the three groups selected from Figure 5 (Table ) are obviously important impacts OPCML has on ovarian tumors, but these were identified because they are structurally significant to the topology of the dendrogram. We need a quantitative strategy to winnow through all 242 enriched functions to distill the greatest relevance of these pathways for OPCML’s range of potential actions in ovarian cancer.
To guide identifying functions with high relevance to Ovarian Cancer, we utilized the PubMed database (US National Institute of Health, National Center for Biotechnology Information (NCBI)) to count the number of research publications over a 25-year period (1998 to 2023) relating our gene sets to ovarian cancer. For every single found in our enriched functions, a PubMed search was executed via API to count all articles where that appeared in combination with the subject “ovarian cancer”. In Figure 6, total PubMed counts are shown for both and groups. A primary assumption is that the genes with the highest number of publications in the field of ovarian cancer are likely to be those that are “known” to be relevant to the progression, severity and treatment of these tumors. First, although both gene groups are well represented in the ovarian cancer literature, the group has 2.4x more publication counts among the top 30 genes than the group (2,766 vs. 1,164).
Second, the top six genes, each with more than 100 publications (KIT, EGF, STAR, GAL, FGF2, VIP), have established roles in ovarian cancer. These genes have been studied and published because of their known relevance to understanding this cancer. Third, these gene-level PubMed counts can be combined into an Ovarian Cancer relevancy score for each enriched function as a roll-up score (geometric average) from the constituent genes found in an enriched function. This scoring approach, calculated for all enriched functions identified, allows for a triage ranking of functions relative to their potential involvement with onset and progression of ovarian cancer.
Our “known” Ovarian Cancer Relevancy score (OVca) was used to sort enriched functions from Figure 5 and collapse the complexity and overlaps of the dendrogram relationships into a ranked order for functions with >4x majority of genes and those with less than a 4x majority (i.e., more component genes). Within any function cluster with more than 4 members, selection was limited to the top 4 functions by OVca score. Table 2 presents top 40 ranked functions. Because of the volume of ovarian cancer research published involving constituent genes of these ranked functions, the relevance of these pathways to ovarian cancer is high by default. In Figure 6, KIT, EGF and FGF2 are in the top 5 genes by publication count. In Table , functions with the highest OVca scores are those where KIT, EGF and FGF2 were identified as constituent genes. For most molecular oncologists, there are likely no surprises at the top of this table. However, the strength of this table is that all results are based upon a statistical linkage between OPCML: RNA-Seq ratios and survival benefits observed in patients with “normal constitutive” levels of OPCML expression. OPCML is linked to all the member genes of these functions in some fashion. Thus, cellular level impacts of OPCML are far reaching through many mechanisms of tumor progression and disease severity.
Whereas Table 2 generally reinforces what is already know about OPCML and Ovarian Cancer, a parallel ranking of functions with <4x majority of genes (more genes present) provides a second perspective in Table 3. First, the publication counts for genes related to ovarian cancer are lower and consequently the top row OVca score values are less than in Table 2. Despite these lower OVca scores, p-values and xfold-enrichment values are significant. Second, group genes have a significant survival benefit when OPCML expression is low and these genes are expressed at a level above the median value in the patient cohort. These pathways in Table 3 are parallel to the impacts of OPCML such that when OPCML is silenced or suppressed, the expression of these pathways may ameliorate or compensate for the OPCML deficit and confer a survival benefit to patients.
4. Discussion
4.1. OPCML & IgLON Family Protein Structure
Much like other transmembrane proteins that function as receptors, IgLON family proteins (OPCML, NEGR1, LSAMP, NTM and IGLON5) have extracellular extensions of multiple Ig domains that arose from gene duplication. This multi-modular characteristic affords versatility to each IgLON family member in terms of specific protein-protein interactions each one orchestrates. All IgLONs possess three (3) sequential Ig domains (Fig. Figure 7) which is likely a stereospecific condition for IgLONs to engage in surface interactions with other juxtaposed protein extracellular domains (e.g, some RTKs possess two extracellular Ig domains). In addition, this configuration also enables IgLONs to form dimers via the first Ig domains (D1). Moreover, this further affords the possibility of alternate orientations of IgLONs participating in cell surface interactions either on the same cell (cis) or potential interactions with other neighboring cells (intercellular/trans).
The OPCML monomer has three Ig binding domains (Fig. Figure 7). The crystal structure was solved by Birtley et al. [11] where an excellent structural description of OPCML can be found. In Figure 7 known mutations in OPCML associated with different cancers are highlighted by the amino acid alpha carbons. Although very rare in occurrence, there were 119 clinically reported OPCML mutations presented by Birtley et al. [11]. More significantly, Birtley et al. investigated the impact of point mutations at 8 specific clinically relevant amino acid substitution sites (across all three Ig domains) and demonstrated that the reported clinical mutations at these sites in different tumors inactivated the tumor suppressor activity of OPCML. Thus, each of the three Ig domains appear to be important to the overall functionality of the OPCML protein.
The genesis of this current work, was the recognition that OPCML’s tumor suppressor activity is mechanistically a collection of functional effects defined by three Ig domains that in combination act along parallel paths to suppress tumor formation. The functional effects of OPCML are distributed across all three Ig domains independently, and thus the archetypal and pleiotropic tumor suppressor action of OPCML results from the integration of impacts from each of these three Ig domains. Thus, Birtley et al. [11] demonstrated the clinical relevance and multifunctionality of the three Ig domains and their extraordinary potency of integrated functions to inhibit tumor formation in ovarian cancer cells. The goal of this present study is to look deeper into the multi-functional impacts of OPCML in cancers through its multiple Ig domains.
4.2. RTKs, Ligands & Signaling
One of the principal functions of OPCML as a tumor suppressor protein is to inactivate receptor tyrosine kinases (RTKs) by dephosphorylation of the activated RTK and subsequently stimulating the degradation of that receptor tyrosine kinase (RTK). In ovarian cancers, of that receptor tyrosine kinases (RTK). In ovarian cancers, OPCML drives inactivation and degradation of the RTKs HER2, HER4, FGFR1, FGFR3, EPHA2, and AXL [23], and the specificity of this network is underscored by identification of a group of RTKs that are unaffected by OPCML. There may, however, be more RTKs impacted by OPCML to be described with further research. AXL is a good example of this inactivation/degradation pathway. When AXL is complexed with its ligand GAS6 in ovarian cancer cells, OPCML chaperones the AXL-GAS6 complex into external membrane lipid-raft domains where the complex becomes dephosphorylated through apposition to a raft restricted phosphatase and then targeted for ubiquitin-dependent degradation [10,13]. In the last decade, there has been a growing recognition of the important role that AXL and other RTKs play in ovarian cancers and their role in signaling through PI3K/AKT and MEK/ERK signaling pathways. By driving the dephosphorylation of RTKs within lipid raft domains, OPCML prevents low avidity aggregation of RTK species and their internal downstream signaling machinery that typically allows a high probability of the initiation and maintenance of signaling, and in this way inhibiting sustained ERK signaling, which is crucial for the spectrum of pleiotropic functions exhibited by RTK driven cancers. Thus, we know that OPCML plays a critical role in regulating cancer progression through its interaction with RTKs in the external membrane surface of ovarian cancer cells.
In this work, we demonstrate that in addition to this primary effect on RTKs, OPCML can influence a broader range of cellular activities that reinforce the potency of its Tumor Suppression effects. Beyond OPCML’s chaperoning effects on RTKs into cell-membrane lipid rafts, the analyses reported here regarding functional pathway enrichment (Fig. Figure 5 and Tables 2&3) emphasize deeper secondary association impacts of OPCML with other cellular processes that also impact tumor growth.
In Figure 8, a summary set of gene relationships and functional associations are compiled to illustrate the transcriptomic linkages between OPCML and genes that control broad functional aspects of tumor growth. These analyses are all based on RNA-Seq transcriptome data relative to overall survival in ovarian cancer patients. Here we see a downstream tumor suppressor role for OPCML beyond the direct interaction with membrane RTKs previously reported, and confirmed/validated orthogonally by previously reported pathways. The RNA-Seq ratio analyses reveal significant linkages with genes that span a range of tumor growth activities. Overall, the proteins shown in Fig. 8 are organized by cellular location and general function groupings: 1) known RTK signaling ligands, 2) extracellular matrix proteins, 3) other extracellular ligands, 4) other membrane receptors and proteins, 5) a few intracellular proteins involved with signaling and 6) two transcription factors and one nuclear protein. Note that the circle symbols in Fig. 8 with an asterisk indicate ratios that have a direct and significant survival hazard ratio (HRz) for patients.
Highlighted in Figure 8 are the RTKs KIT, ROS1 and TEK that are significantly associated with OPCML RNA-Seq ratios in this study. These associations have not as yet been reported in any direct experimental studies. However, patient survival HRz scores reveal a new and significant RNA-Seq level linkage between OPCML and KIT, while TEK and ROS1 are prominent in several of the enriched function pathway results.
A key observation in Figure 8 is that there is a diverse range of transcriptomic links between OPCML and other proteins across mainly the extracellular matrix and cell membrane compartments. In this RNA-Seq analysis, we see far broader and more downstream associations at a transcriptional level (c.f. direct protein:protein interaction studies), indicative of the multifunctional “downstream-ripple” effect of OPCML expression. The enumeration of functionally enriched pathways (Figure 5 and Table 2 & Table 3) demonstrates a wide diversity of functions at granular resolution. In contrast, the level of proteins that impact tumor growth processes in Figure 8 reveal how many of these granular pathways align with OPCML’s general cellular activities as a tumor suppressor gene.
Additionally, many of the proteins in Figure 8 impact various immune system functions. Related to OPCML’s prominent external membrane presence, there appear to be many secondary associations connecting OPCML to immune status and activities within the tumor microenvironment. A recent study of NEGR1 colorectal cancers (CRC, mouse model system) showed that a decrease in NEGR1 expression resulted in CRC progression through the PI3K/AKT pathway in addition to a strong immune system interaction resulting in M2 macrophage polarization [24]. This role of immune system modulation may indicate a new role for OPCML specifically, and IgLON family proteins in general, that we are just beginning to describe and understand. Any degree of functional impact on immune modulation via OPCML could have relevant implications for cancer immunotherapies.
4.3. OPCML: Tumor Suppressor “Sphere of Influence”
Given that 49 out of 58 proteins (84%) in Figure 8 are operative externally to the cell or within the cell membrane, we conclude that a cell expressing OPCML could be described as establishing an OPCML "sphere of influence" extending from the extracellular matrix to the internal side of the membrane proximal to the PI3K/AKT and MEK/ERK signal transduction pathways. There are a total of 29 extracellular/membrane functional proteins with linkage to OPCML in contrast to only six intracellular proteins. The impact of OPCML expression in ovarian cancer cells supports strong relationships to external, microenvironment facing signal networks, less so downstream cytoplasm signal networks.
Alongside the regulation of classic outside-in signaling via cell surface receptors, extracellular proteins can impact three important processes in tumor growth: interactions between tumor cells, interactions between tumor and immune system cells, and modulation tumor microenvironments. In Fig. 8, we have identified 15 ligands and 8 proteins in the extracellular space that are important players in these processes. The ligands are mostly chemokines and cytokines (POMC, SHH, IL12A, IL4, CCL11, CXCL6, IL5, CXCL1, LEP and TNFSF11) that influence immune system activity and regulate tissue inflammatory responses. OPCML’s spatial relationship with the extracellular compartment with its three Ig domains allows for the opportunity to interact with other proteins and small molecules in this space. As a result, we see transcriptional linkages between some of these ligands and OPCML. Other proteins present here are involved in matrix remodeling, which can alter tumor invasiveness and thus metastasis (MMP13, S100A8, S100A9 and ELN).
In the membrane compartment there are also associations with G protein-coupled receptors (GPCRs: PTGIR, OPRM1, ADRA1A, HTR2A, HTR2B, FPR2 and NMUR2). We interpret these linkages as potential feedback loops between GPCRs and OPCML to influence OPCML’s cell-surface adhesion molecule role. In addition to these GPCRs, other significant signaling membrane proteins that are impacted by OPCML are FGR, CD36 and NGFR.
Overall, Figure 8 illustrates a potential outward radiating effect of OPCML from a cell expressing the protein to impact the surrounding extracellular matrix. It is possible in such a "sphere of influence" model that the OPCML membrane complement in one cell would regulate oncogenic RTK signals directly impacting that cell, as well as shaping the external mircoenvironments adjoining that cell in such a way that would further reduce other oncogenic processes impacting it. Thus by extension, any cell actively expressing OPCML could be shaping the microenvironment of its neighboring cells. The potential exists for an OPCML tumor suppression "sphere of influence" in which the composition of the extracellular matrix is determined by the collective OPCML titers of adjoining cells, whether these are cancer cells, immune cells or supportive stromal cells. Thus, the range of impacts on tumor growth and potential influence over neighboring cells, establish OPCML as a critical, multifunctional, pleiotropic tumor suppressor gene.
What our analyses show here are the transcriptional linkages that exist across many genes in diverse pathways that demonstrate significant associations with OPCML’s impact on mortality risk (overall survival) in ovarian cancer. This transcriptional association network is obviously quite different from previously demonstrated direct protein/protein interaction networks of physically interacting molecules for OPCML, although as previously stated it does also represent an orthogonal approach for validation of these previously published observations. The RNA-Seq data reveal concordant transcriptional events where subsets of the dozens of transcription factors known to be active in ovarian cancer can shift mRNA production of many genes simultaneously. It is interesting to note that the vast majority of genes shown in Figure 8 are in the group vs. the group. We detect a reduced mortality risk when OPCML expression levels are in a normal, constitutive expression range and the expression of many of the other signaling pathway genes are below the cohort median. This suggests that the seesaw balance of down vs. up-regulation of cell signaling in cancers extends across many parallel functional pathways.
4.4. Conclusions
In this study, we have pursued a broader assessment of the potential functional impacts of OPCML and its component three Ig domains in ovarian cancer. Our bioinformatic approach of using RNA-Seq ratios, survival curves and enriched pathway analyses provides a novel perspective on the scope of cross-talk associations and cellular impacts that OPCML can influence. The net effect of OPCML is more extant than its proximal role in regulating the turnover of membrane RTKs. These normal activities span a breadth of pathways and processes, all of which contribute to the efficacy of OPCML’s tumor suppressor function.
These results highlight the role of OPCML’s regulation of RTK signaling pathways and their downstream signaling (PI3K/AKT and MEK/ERK) whilst also identifying three new potential RTK linkages to KIT, TEK and ROS1 in ovarian cancers. In addition, we show here that multiple known signaling receptor ligands are also linked in terms of gene expression to OPCML. Functional pathway enrichment analyses indicate a broad array of secondary linkages or cross-talk impacts of OPCML that translate to survival benefits for patients when OPCML gene expression is near normal constitutive levels. This information shows the broad reach of tumor suppressor activities engaged by this one gene/protein. Overall, OPCML is a multi-functional, pleiotropic, tumor suppressor that can inhibit tumor growth via multiple, secondary pathways and processes in a way that significantly impacts cancer patient survival outcomes consistent with its functional biology.
Author Contributions
Conceptualization, Adam Marsh and Hani Gabra; Formal analysis, Adam Marsh; Investigation, Sassan Hafizi; Methodology, Adam Marsh and Franziska Gortler; Software, Adam Marsh; Supervision, Hani Gabra; Validation, Sassan Hafizi and Hani Gabra; Visualization, Adam Marsh; Writing – original draft, Adam Marsh; Writing – review & editing, Adam Marsh, Franziska Gortler, Sassan Hafizi and Hani Gabra. All authors have read and agreed to the published version of the manuscript.
Funding
This research received no external funding.
Institutional Review Board Statement
Ethical review and approval were waived for this study due to the sole use of de-identified, publicly available gene expression data available from The Cancer Genome Atlas (TCGA) Research Network.
Informed Consent Statement
Not applicable.
Data Availability Statement
All raw data used in this study is publicly available from The Cancer Genome Atlas (TCGA) Research Network: https://www.cancer.gov/tcga. Results from this project for RNA-Seq ratio survival curves and enriched function analyses are compiled into separate data tables available on FigShare under an MIT User License (DOI: 10.6084/m9.figshare.c.7588115).
Acknowledgments
The results shown here are based upon data generated and curated by The Cancer Genome Atlas (TCGA) Research Network (https://www.cancer.gov/tcga).
Conflicts of Interest
H.G. is the co-founder and Interim CEO of Papyrus Therapeutics. A.M. is an advisor to Papyrus Therapeutics.
Abbreviations
The following abbreviations are used in this manuscript:
| TSG | Tumor Suppressor Gene |
| OPCML | Opioid Binding and Cell Adhesion Molecule |
| OV | ovarian cancer |
| HR | Cox Hazard Ratios |
| HRz | Z-score transformed Hazard Ratios |
| Ig | Immunoglobin binding domain |
| GO | Gene Ontology Database |
| GSEA | Gene Set Enrichment Analysis Database |
| KEGG | Kyoto Encyclopedia of Genes and Genomes |
| FDR | False Discovery Rate |
| RTK | Receptor Tyrosine Kinase signaling pathways |
References
- Wilson, D.; Kim, D.; Clarke, G.; MarshallClarke, S.; Moss, D. A family of glycoproteins (GP55), which inhibit neurite outgrowth, are members of the Ig superfamily and are related to OBCAM, neurotrimin, LAMP and CEPU-1. JOURNAL OF CELL SCIENCE 1996, 109, 3129–3138. [Google Scholar] [CrossRef] [PubMed]
- Hancox, K.; Gooley, A.; Jeffrey, P. AvGp50, a predominantly axonally expressed glycoprotein, is a member of the IgLON’s subfamily of cell adhesion molecules (CAMs). MOLECULAR BRAIN RESEARCH 1997, 44, 273–285. [Google Scholar] [CrossRef] [PubMed]
- Sellar, G.; Watt, K.; Rabiasz, G.; Stronach, E.; Li, L.; Miller, E.; Massie, C.; Miller, J.; Contreras-Moreira, B.; Scott, D.; et al. OPCML at 11q25 is epigenetically inactivated and has tumor-suppressor function in epithelial ovarian cancer. NATURE GENETICS 2003, 34, 337–343. [Google Scholar] [CrossRef] [PubMed]
- Rabiasz, G.; Scott, D.; Miller, E.; Stronach, E.; Taylor, K.; Ntougkos, E.; Gabra, H.; Smyth, J.; Sellar, G. Microarray analysis of OPCML tumour suppressor function in the SKOV-3 ovarian cancer cell line. BRITISH JOURNAL OF CANCER 2004, 91, S54. [Google Scholar]
- Ntougkos, E.; Rush, R.; Scott, D.; Frankenberg, T.; Gabra, H.; Smyth, J.; Sellar, G. The IgLON family in epithelial ovarian cancer: Expression profiles and clinicopathologic correlates. CLINICAL CANCER RESEARCH 2005, 11, 5764–5768. [Google Scholar] [CrossRef] [PubMed]
- Teodoridis, J.; Hall, J.; Marsh, S.; Kannall, H.; Smyth, C.; Curto, J.; Siddiqui, N.; Gabra, H.; McLeod, H.; Strathdee, G.; et al. CpG island methylation of DNA damage response genes in advanced ovarian cancer. CANCER RESEARCH 2005, 65, 8961–8967. [Google Scholar] [CrossRef] [PubMed]
- Mei, F.; Young, T.; Liu, J.; Cheng, X. RAS-mediated epigenetic inactivation of OPCML in oncogenic transformation of human ovarian surface epithelial cells. FASEB JOURNAL 2005, 19, 497. [Google Scholar] [CrossRef]
- Wu, S.Y.; Sood, A.K. New Roles Opined for OPCML. CANCER DISCOVERY 2012, 2, 115–116. [Google Scholar] [CrossRef]
- Zanini, E.; Louis, L.S.; Antony, J.; Karali, E.; Okon, I.S.; Mckie, A.B.; Vaughan, S.; El-Bahrawy, M.; Stebbing, J.; Recchi, C.; et al. The Tumor-Suppressor Protein OPCML Potentiates Anti-EGFR- and Anti-HER2-Targeted Therapy in HER2-Positive Ovarian and Breast Cancer. MOLECULAR CANCER THERAPEUTICS 2017, 16, 2246–2256. [Google Scholar] [CrossRef] [PubMed]
- Antony, J.; Zanini, E.; Kelly, Z.; Tan, T.Z.; Karali, E.; Alomary, M.; Jung, Y.; Nixon, K.; Cunnea, P.; Fotopoulou, C.; et al. The tumour suppressor OPCML promotes AXL inactivation by the phosphatase PTPRG in ovarian cancer. EMBO REPORTS 2018, 19. [Google Scholar] [CrossRef]
- Birtley, J.R.; Alomary, M.; Zanini, E.; Antony, J.; Maben, Z.; Weaver, G.C.; Von Arx, C.; Mura, M.; Marinho, A.T.; Lu, H.; et al. Inactivating mutations and X-ray crystal structure of the tumor suppressor OPCML reveal cancer-associated functions. NATURE COMMUNICATIONS 2019, 10. [Google Scholar] [CrossRef] [PubMed]
- Simovic, I.; Castano-Rodriguez, N.; Kaakoush, N.O. OPCML: A Promising Biomarker and Therapeutic Avenue. TRENDS IN CANCER 2019, 5, 463–466. [Google Scholar] [CrossRef]
- Antony, J.; Zanini, E.; Birtley, J.R.; Gabra, H.; Recchi, C. Emerging roles for the GPI-anchored tumor suppressor OPCML in cancers. CANCER GENE THERAPY 2021, 28, 18–26. [Google Scholar] [CrossRef] [PubMed]
- Colaprico, A.; Silva, T.C.; Olsen, C.; Garofano, L.; Cava, C.; Garolini, D.; Sabedot, T.S.; Malta, T.M.; Pagnotta, S.M.; Castiglioni, I.; et al. TCGAbiolinks: an R/Bioconductor package for integrative analysis of TCGA data. NUCLEIC ACIDS RESEARCH 2016, 44. [Google Scholar] [CrossRef]
- Mounir, M.; Lucchetta, M.; Silva, T.C.; Olsen, C.; Bontempi, G.; Chen, X.; Noushmehr, H.; Colaprico, A.; Papaleo, E. New functionalities in the TCGAbiolinks package for the study and integration of cancer data from GDC and GTEx. PLOS COMPUTATIONAL BIOLOGY 2019, 15. [Google Scholar] [CrossRef] [PubMed]
- Mubeen, S.; Hoyt, C.T.; Gemuend, A.; Hofmann-Apitius, M.; Froehlich, H.; Domingo-Fernandez, D. The Impact of Pathway Database Choice on Statistical Enrichment Analysis and Predictive Modeling. FRONTIERS IN GENETICS 2019, 10. [Google Scholar] [CrossRef] [PubMed]
- Yu, G.; He, Q.Y. ReactomePA: an R/Bioconductor package for reactome pathway analysis and visualization. MOLECULAR BIOSYSTEMS 2016, 12, 477–479. [Google Scholar] [CrossRef]
- Ulgen, E.; Ozisik, O.; Sezerman, O.U. pathfindR: An R Package for Comprehensive Identification of Enriched Pathways in Omics Data Through Active Subnetworks. FRONTIERS IN GENETICS 2019, 10. [Google Scholar] [CrossRef]
- Yu, G. Gene Ontology Semantic Similarity Analysis Using GOSemSim. In STEM CELL TRANSCRIPTIONAL NETWORKS: METHODS AND PROTOCOLS, 2ND EDITION; Kidder, B., Ed.; Humana, New York, NY, 2020; Vol. 2117, Methods in Molecular Biology, pp. 207–215. [CrossRef]
- Wu, T.; Hu, E.; Xu, S.; Chen, M.; Guo, P.; Dai, Z.; Feng, T.; Zhou, L.; Tang, W.; Zhan, L.; et al. clusterProfiler 4.0: A universal enrichment tool for interpreting omics data. INNOVATION 2021, 2. [Google Scholar] [CrossRef]
- Oughtred, R.; Rust, J.; Chang, C.; Breitkreutz, B.J.; Stark, C.; Willems, A.; Boucher, L.; Leung, G.; Kolas, N.; Zhang, F.; et al. The BioGRID database: A comprehensive biomedical resource of curated protein, genetic, and chemical interactions. PROTEIN SCIENCE 2021, 30, 187–200. [Google Scholar] [CrossRef] [PubMed]
- Tanabe, S.; Quader, S.; Ono, R.; Cabral, H.; Aoyagi, K.; Hirose, A.; Yokozaki, H.; Sasaki, H. Molecular Network Profiling in Intestinal- and Diffuse-Type Gastric Cancer. CANCERS 2020, 12. [Google Scholar] [CrossRef] [PubMed]
- McKie, A.B.; Vaughan, S.; Zanini, E.; Okon, I.S.; Louis, L.; de Sousa, C.; Greene, M.I.; Wang, Q.; Agarwal, R.; Shaposhnikov, D.; et al. The OPCML Tumor Suppressor Functions as a Cell Surface Repressor-Adaptor, Negatively Regulating Receptor Tyrosine Kinases in Epithelial Ovarian Cancer. CANCER DISCOVERY 2012, 2, 156–171. [Google Scholar] [CrossRef]
- Dai, S.; Zhuang, H.; Li, Z.; Chen, Z.; Chai, Y.; Zhou, Q. miR-122/NEGR1 axis contributes colorectal cancer liver metastasis by PI3K/AKT pathway and macrophage modulation. JOURNAL OF TRANSLATIONAL MEDICINE 2024, 22. [Google Scholar] [CrossRef]
Figure 1.
Kaplan-Meier Survival Curves: solo genes. Ovarian cancer cohort is median stratified into two subgroups by RNA-Seq expression (gene counts) and differential survival rates are assessed via Kaplan-Meier curves and Cox Hazard ratios. As examples: (a) OPCML median ratio stratification, p-value = n.s.; (b) CKS1BP3 median ratio stratification, p-value = n.s. (CDC28 Protein Kinase Regulatory Subunit 1B Pseudogene 3).
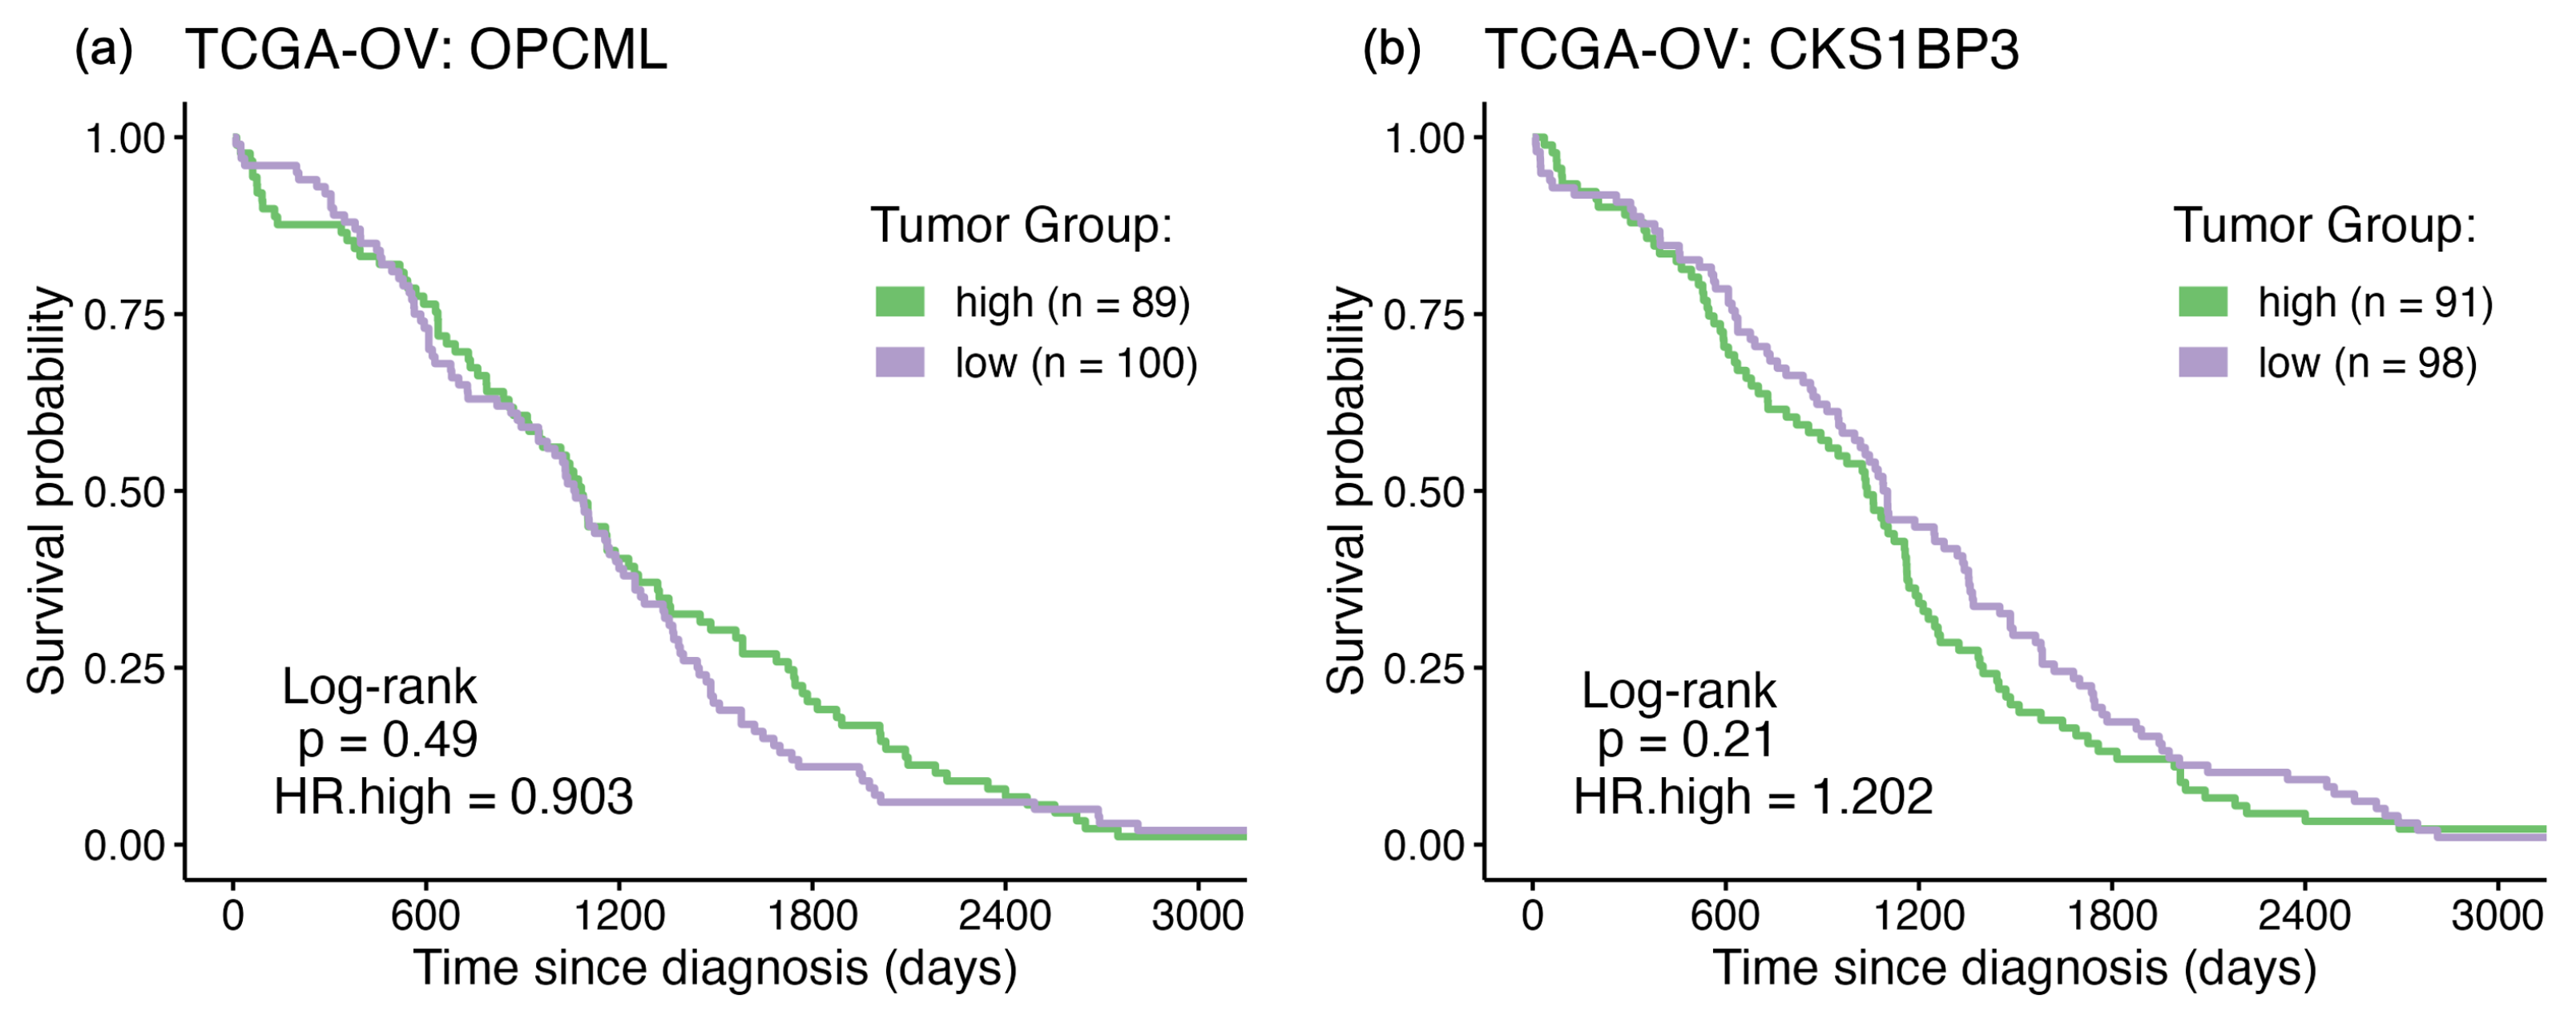
Figure 2.
Kaplan-Meier Survival Curves: RNA-Seq Ratios. As an example, Ovarian cancer subjects are bifurcated by the ratio of OPCML expression normalized to CKS1BP3. (a) Probability Density for OPCML:CSK1BP3 RNA-Seq ratios. Dashed blue line represents median value separating High.Ratio from Low.Ratio subgroups. (b) Survival curve comparison between subgroups (Log model p = 0.0049).
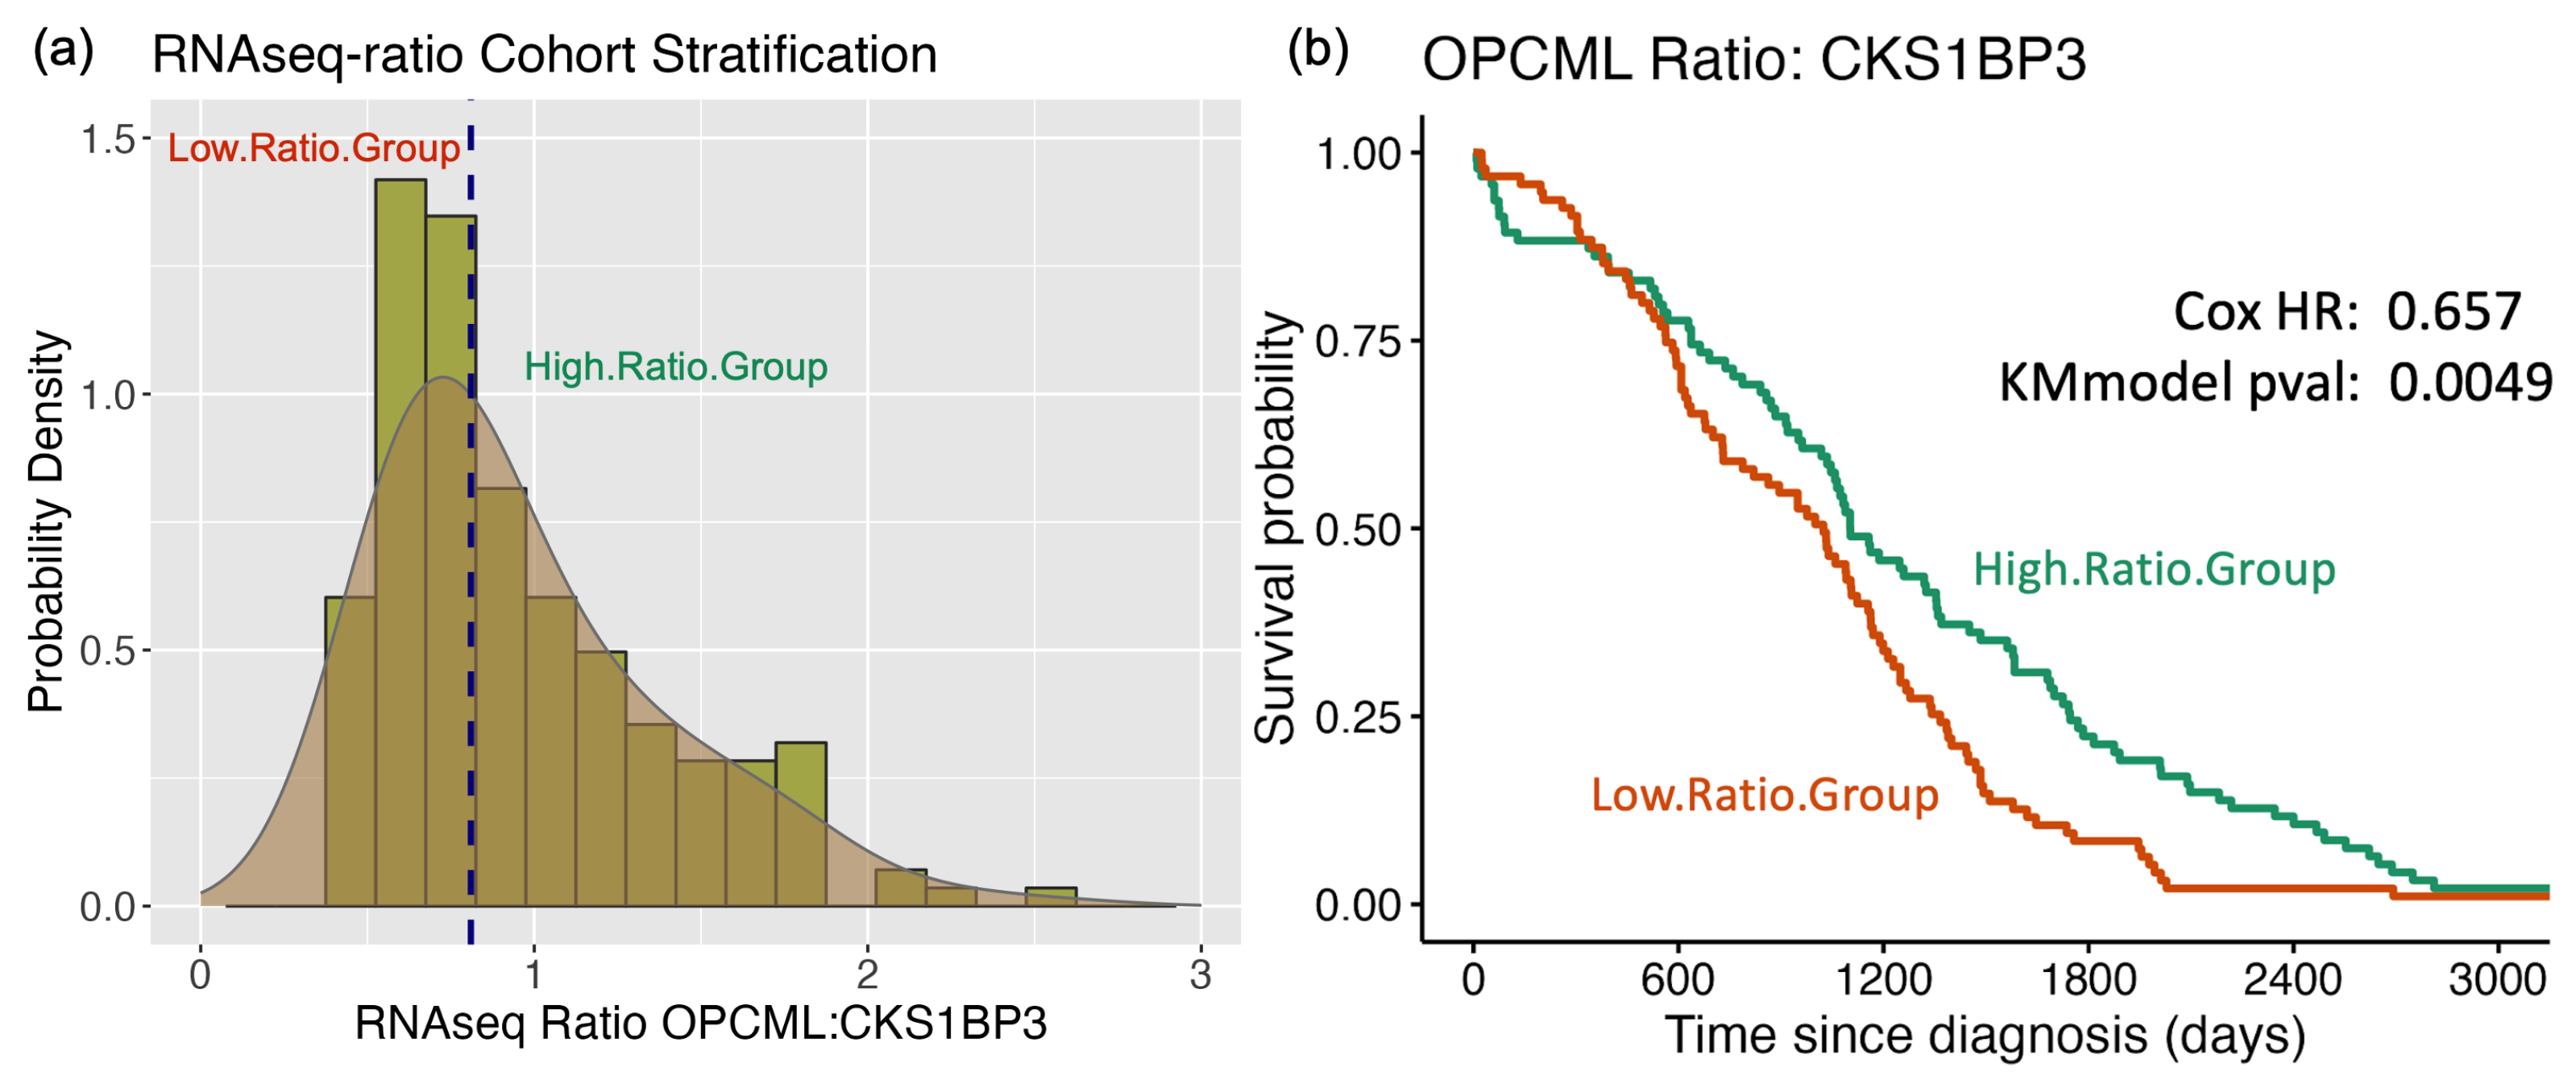
Figure 3.
Transformed Cox Hazard Ratio Distributions: HRz. Z-score distribution of survival Cox HR values (HRz) in Ovarian Cancer subjects. The null hypothesis value of no effect (Ho: HRz=0.0) is shown along with the Monte Carlo False Discovery Rate quantile values for 0.025 and 0.975 tails (blue dashed lines). These FDR thresholds define two groups of genes: and .
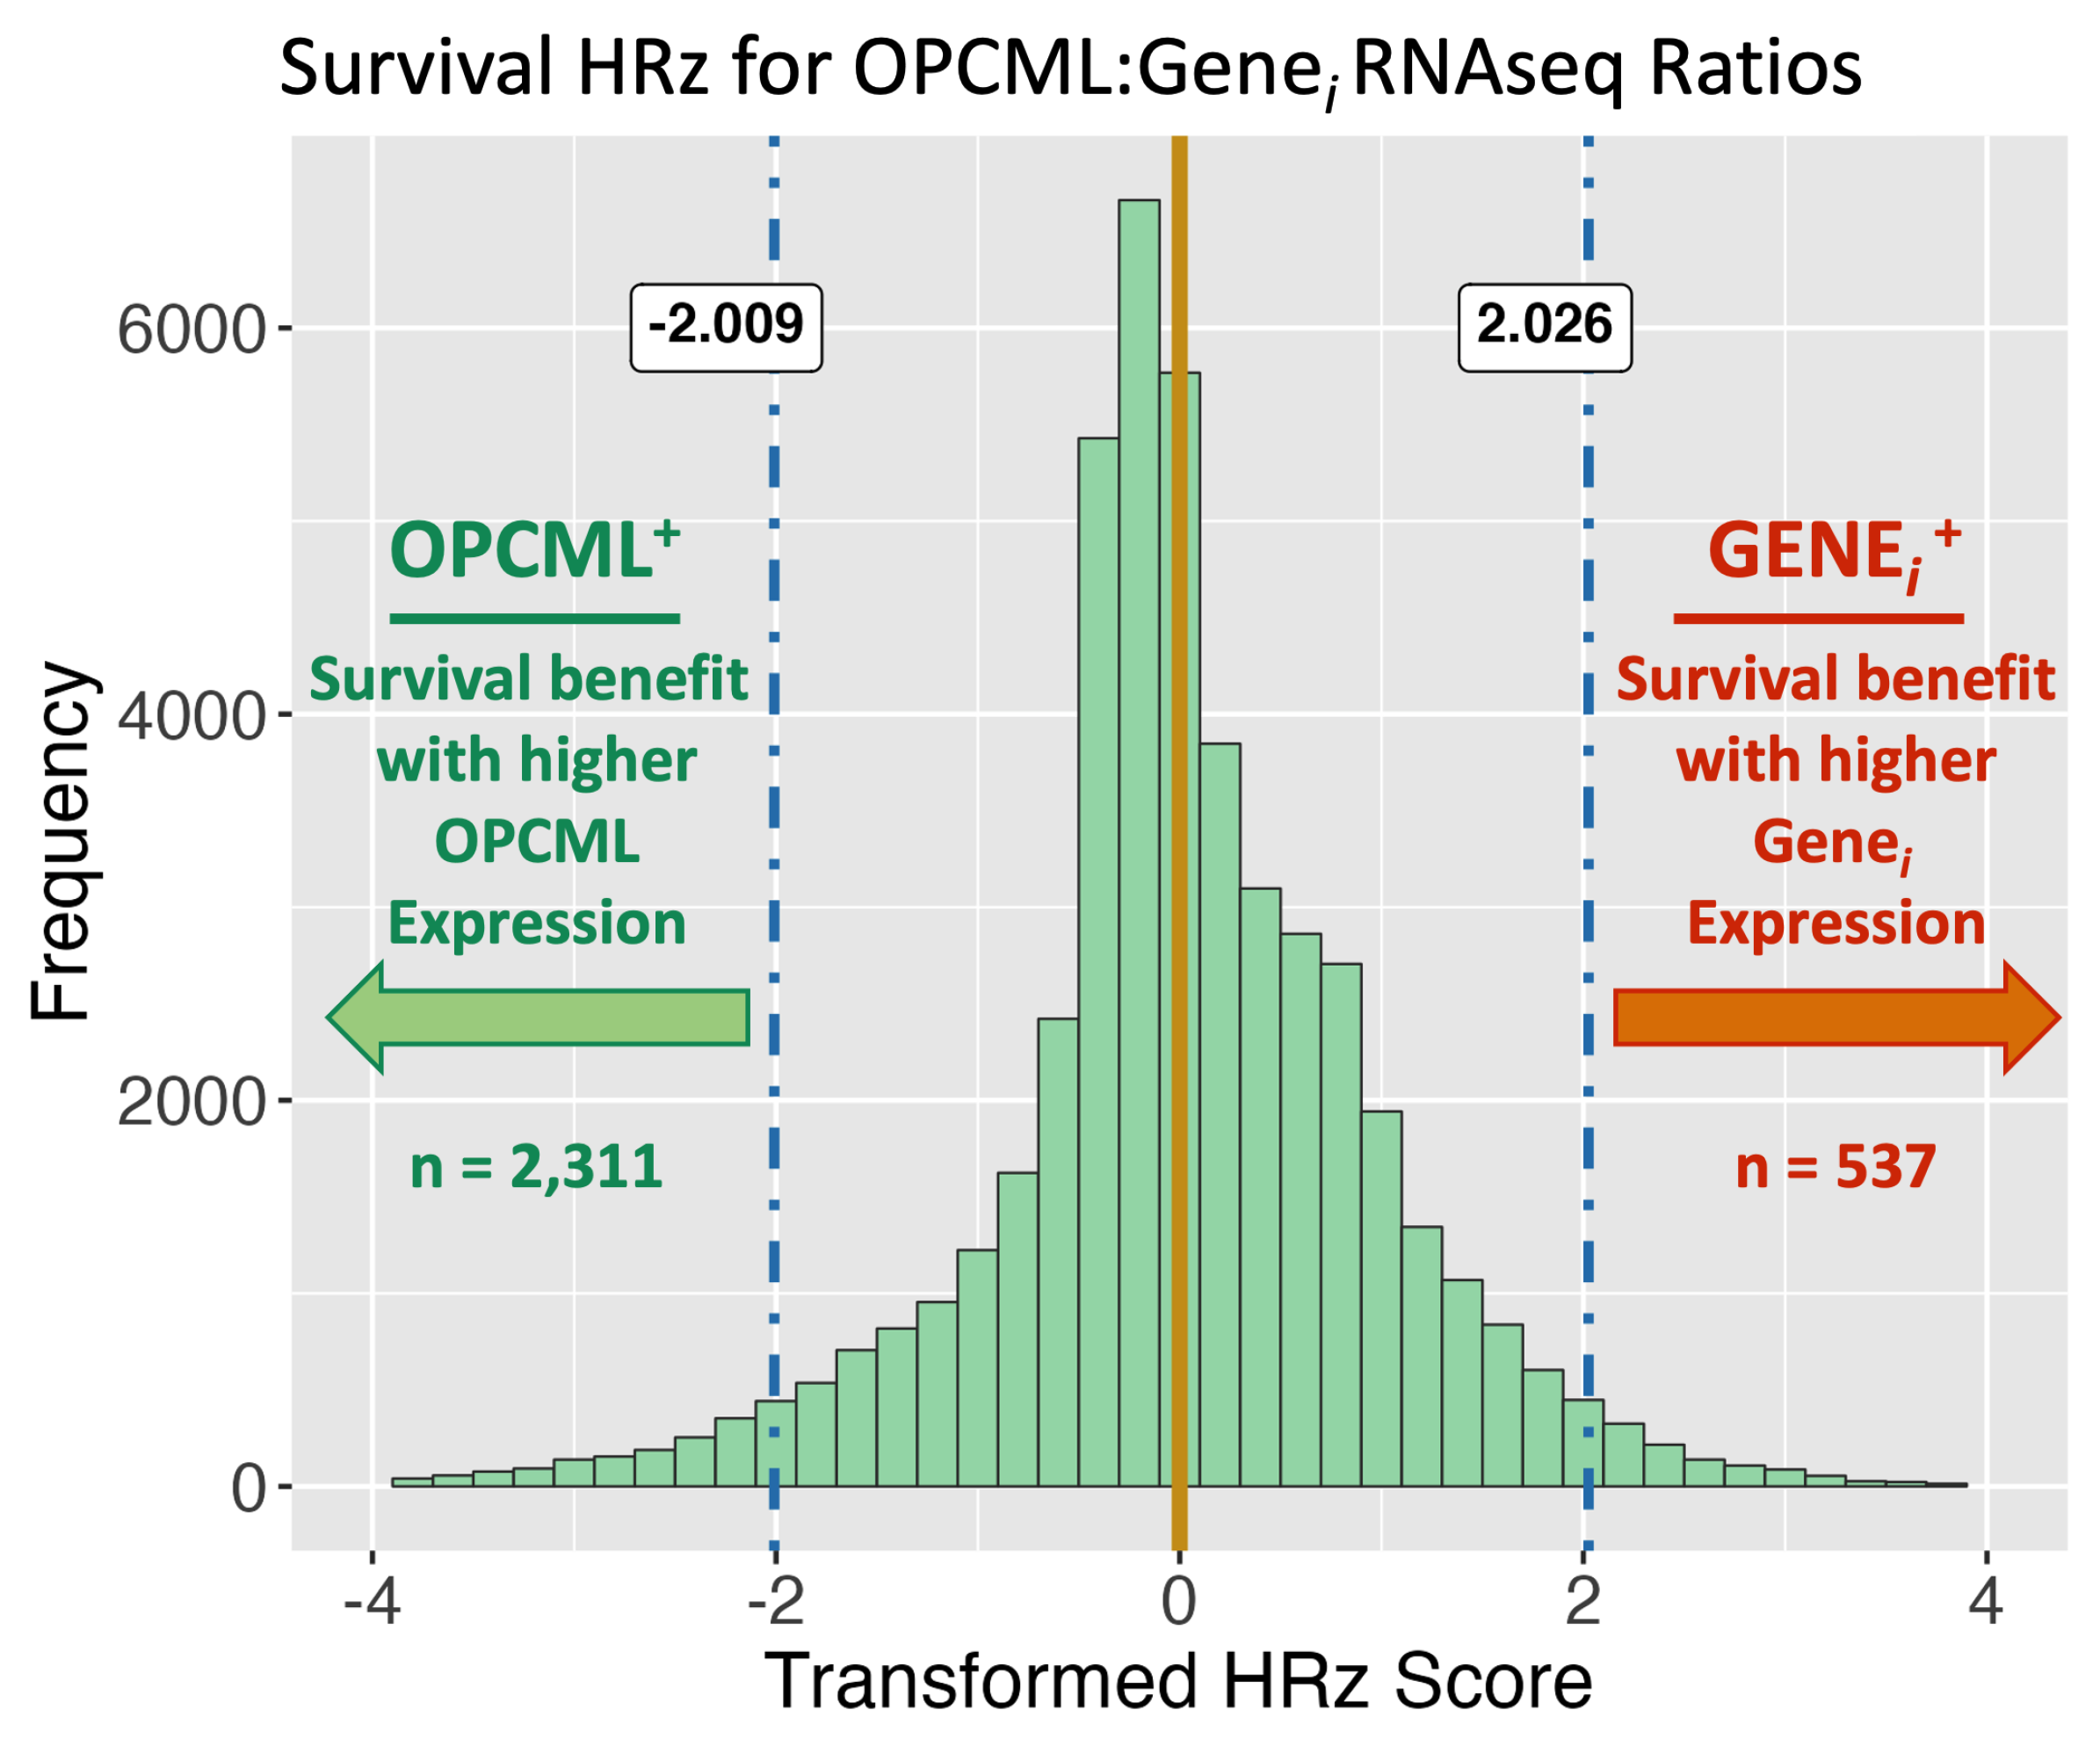
Figure 4.
Functional Network Enrichment Analyses. Subnetwork association analyses for functional enrichment were executed using different protein interaction network databases and pathway gene map databases. Four protein association networks were applied to the analysis of pathways defined in five database sources (total independent analyses executed = 20). a) Enriched function counts are plotted as with the integer count included as a label. b) The gene composition within each function is presented as a ratio of to genes.
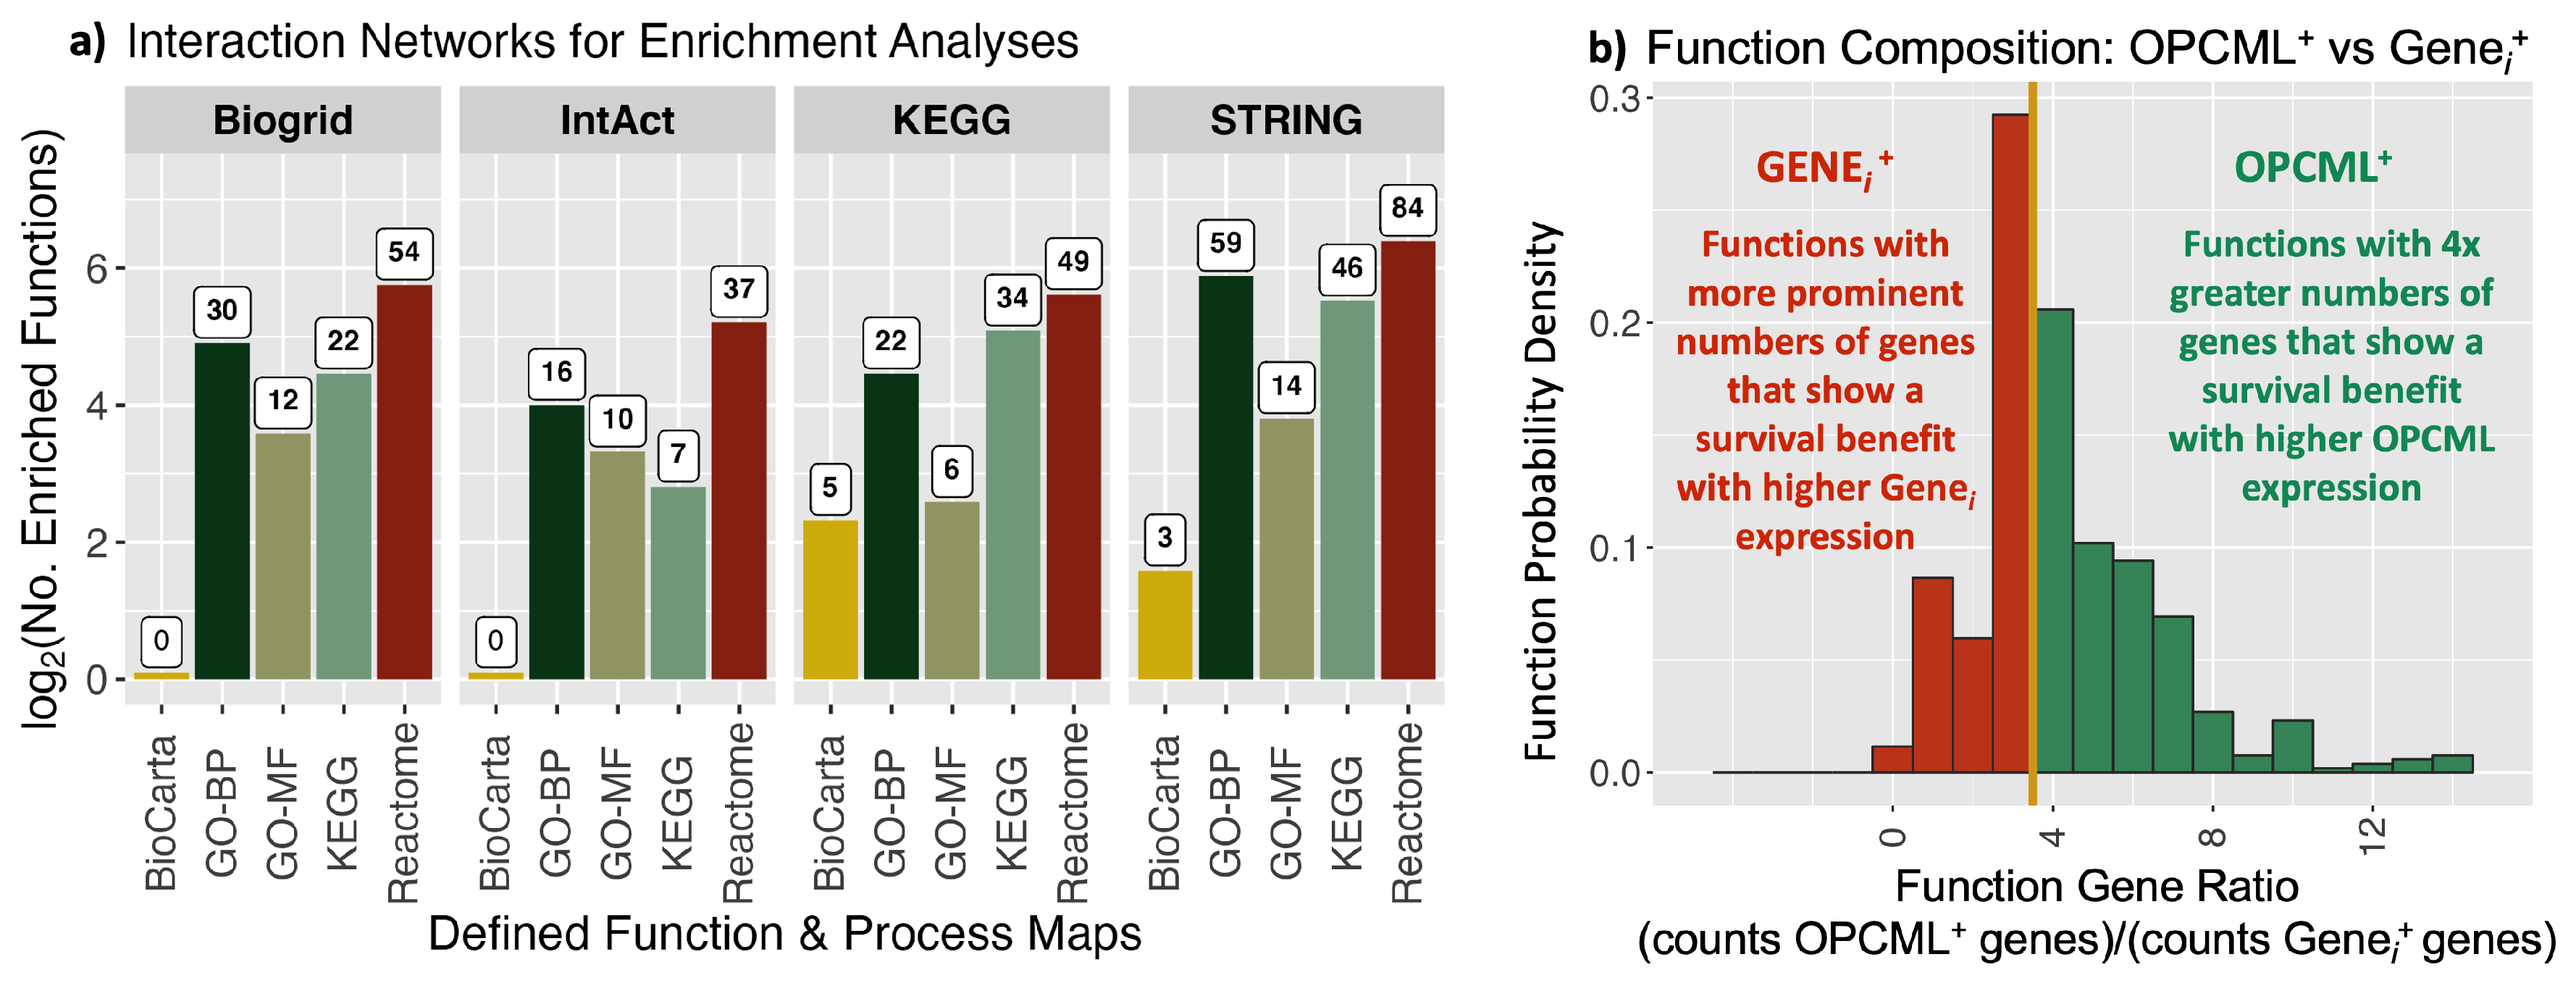
Figure 5.
Hierarchical Clustering of Enriched Functions with Shared Identified Genes. Function identifiers are from the following databases: G=GO (BP), R=Reactome, hsa=KEGG, and M=Biocarta. Font colors are used to indicate functions with a 4x majority of or less. Three clusters are highlighted and presented in more detail in the text: a) Toll-like Receptor signaling pathways, b) PI3K & AKT signaling pathways, and c) cAMP related pathways
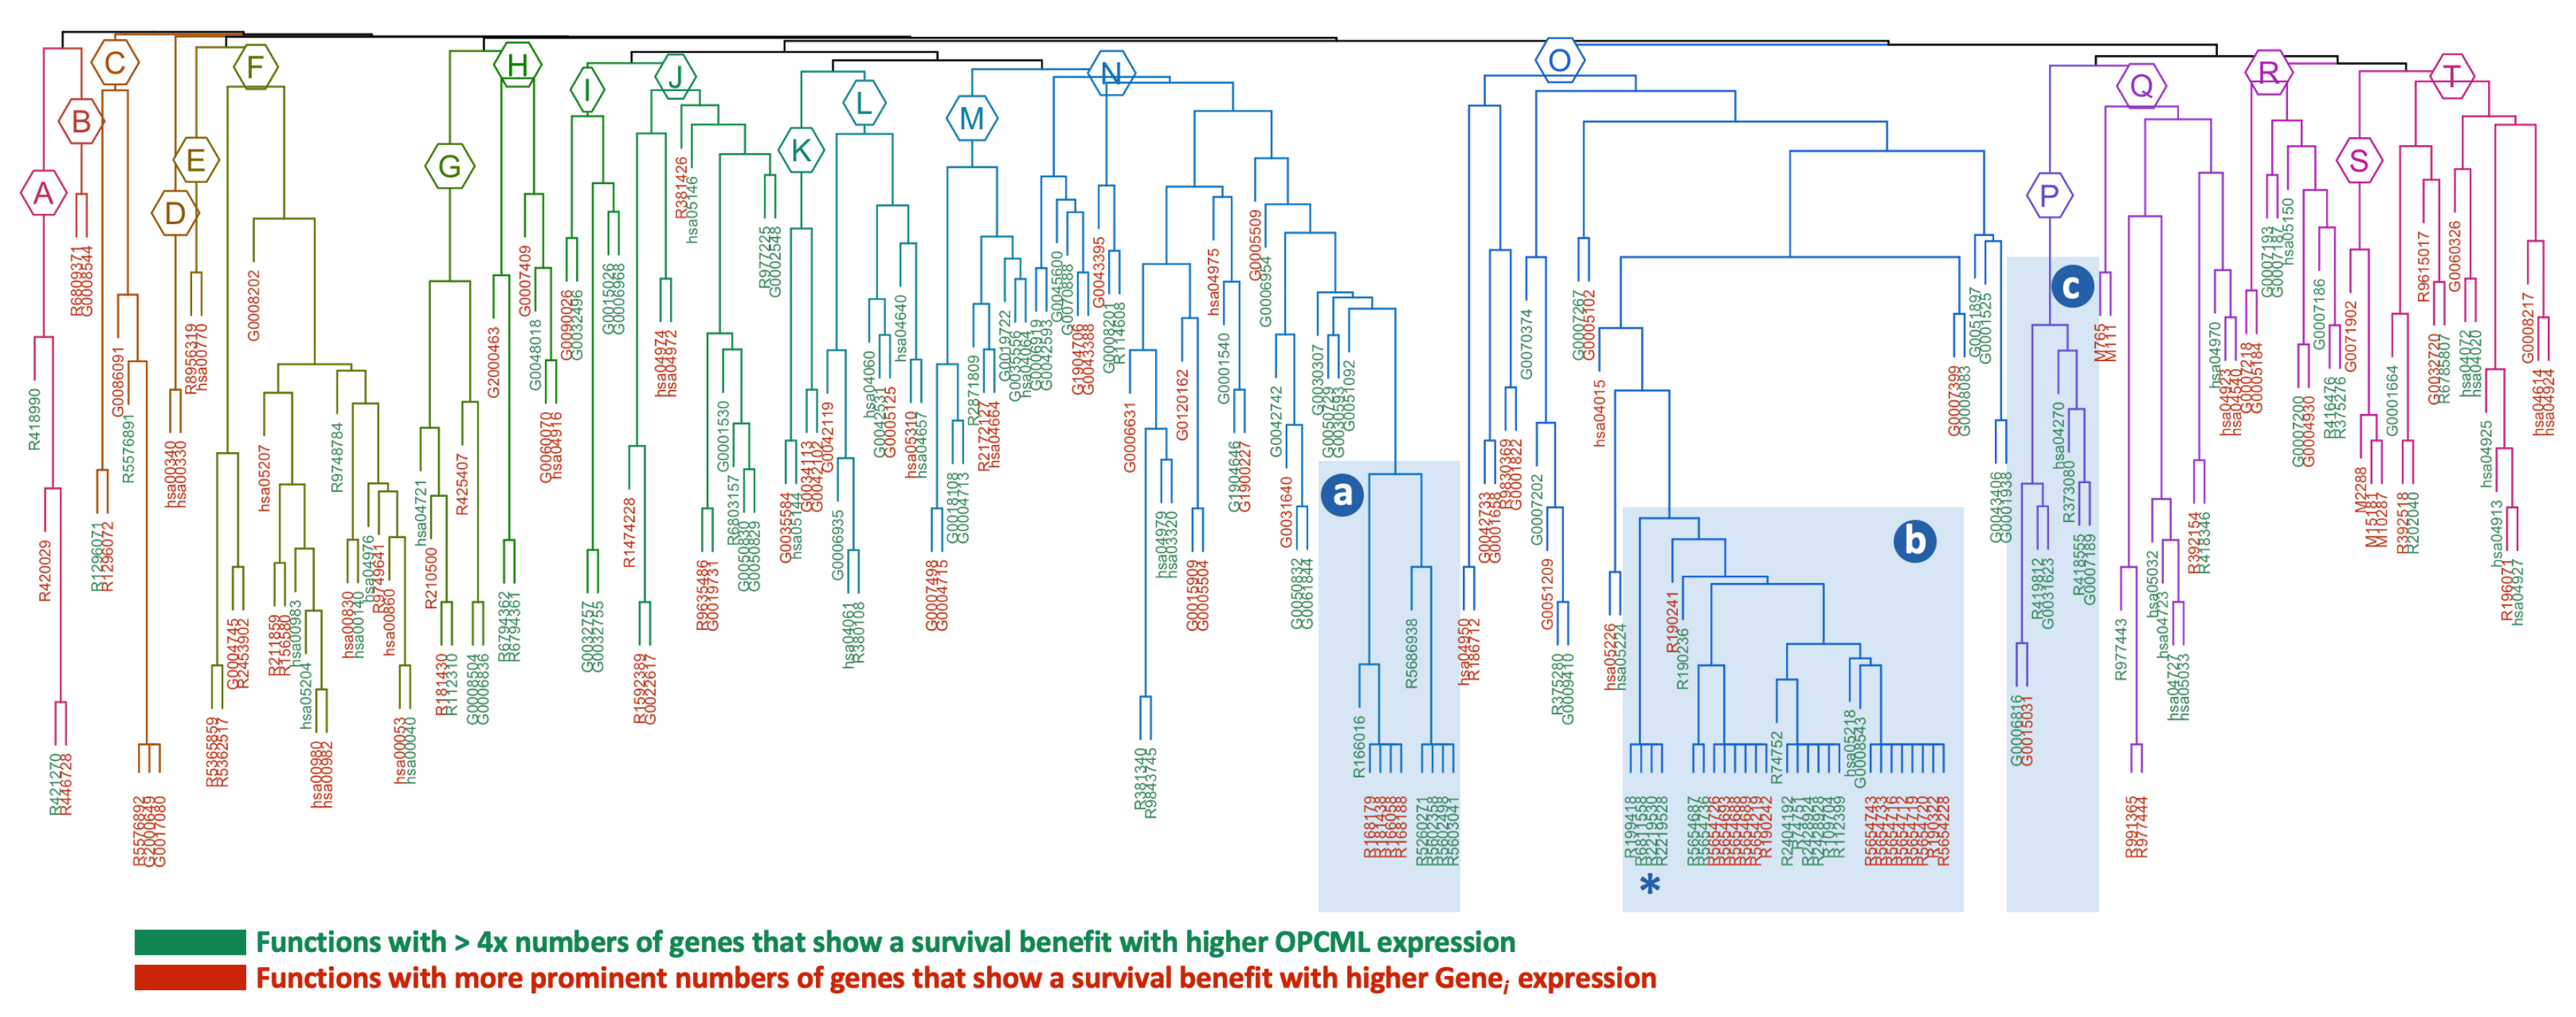
Figure 6.
PubMed Counts for Genes Associated with Ovarian Cancer. Each gene with a significant HRz value that was also identified in at least one enriched function was used in a literature search of NCBI’s PubMed database with the inclusion term “AND+[ovarian cancer]”. The genes are divided into and groups based on their HRz values. The top 30 genes in each group ranked by PubMed citation counts are shown.
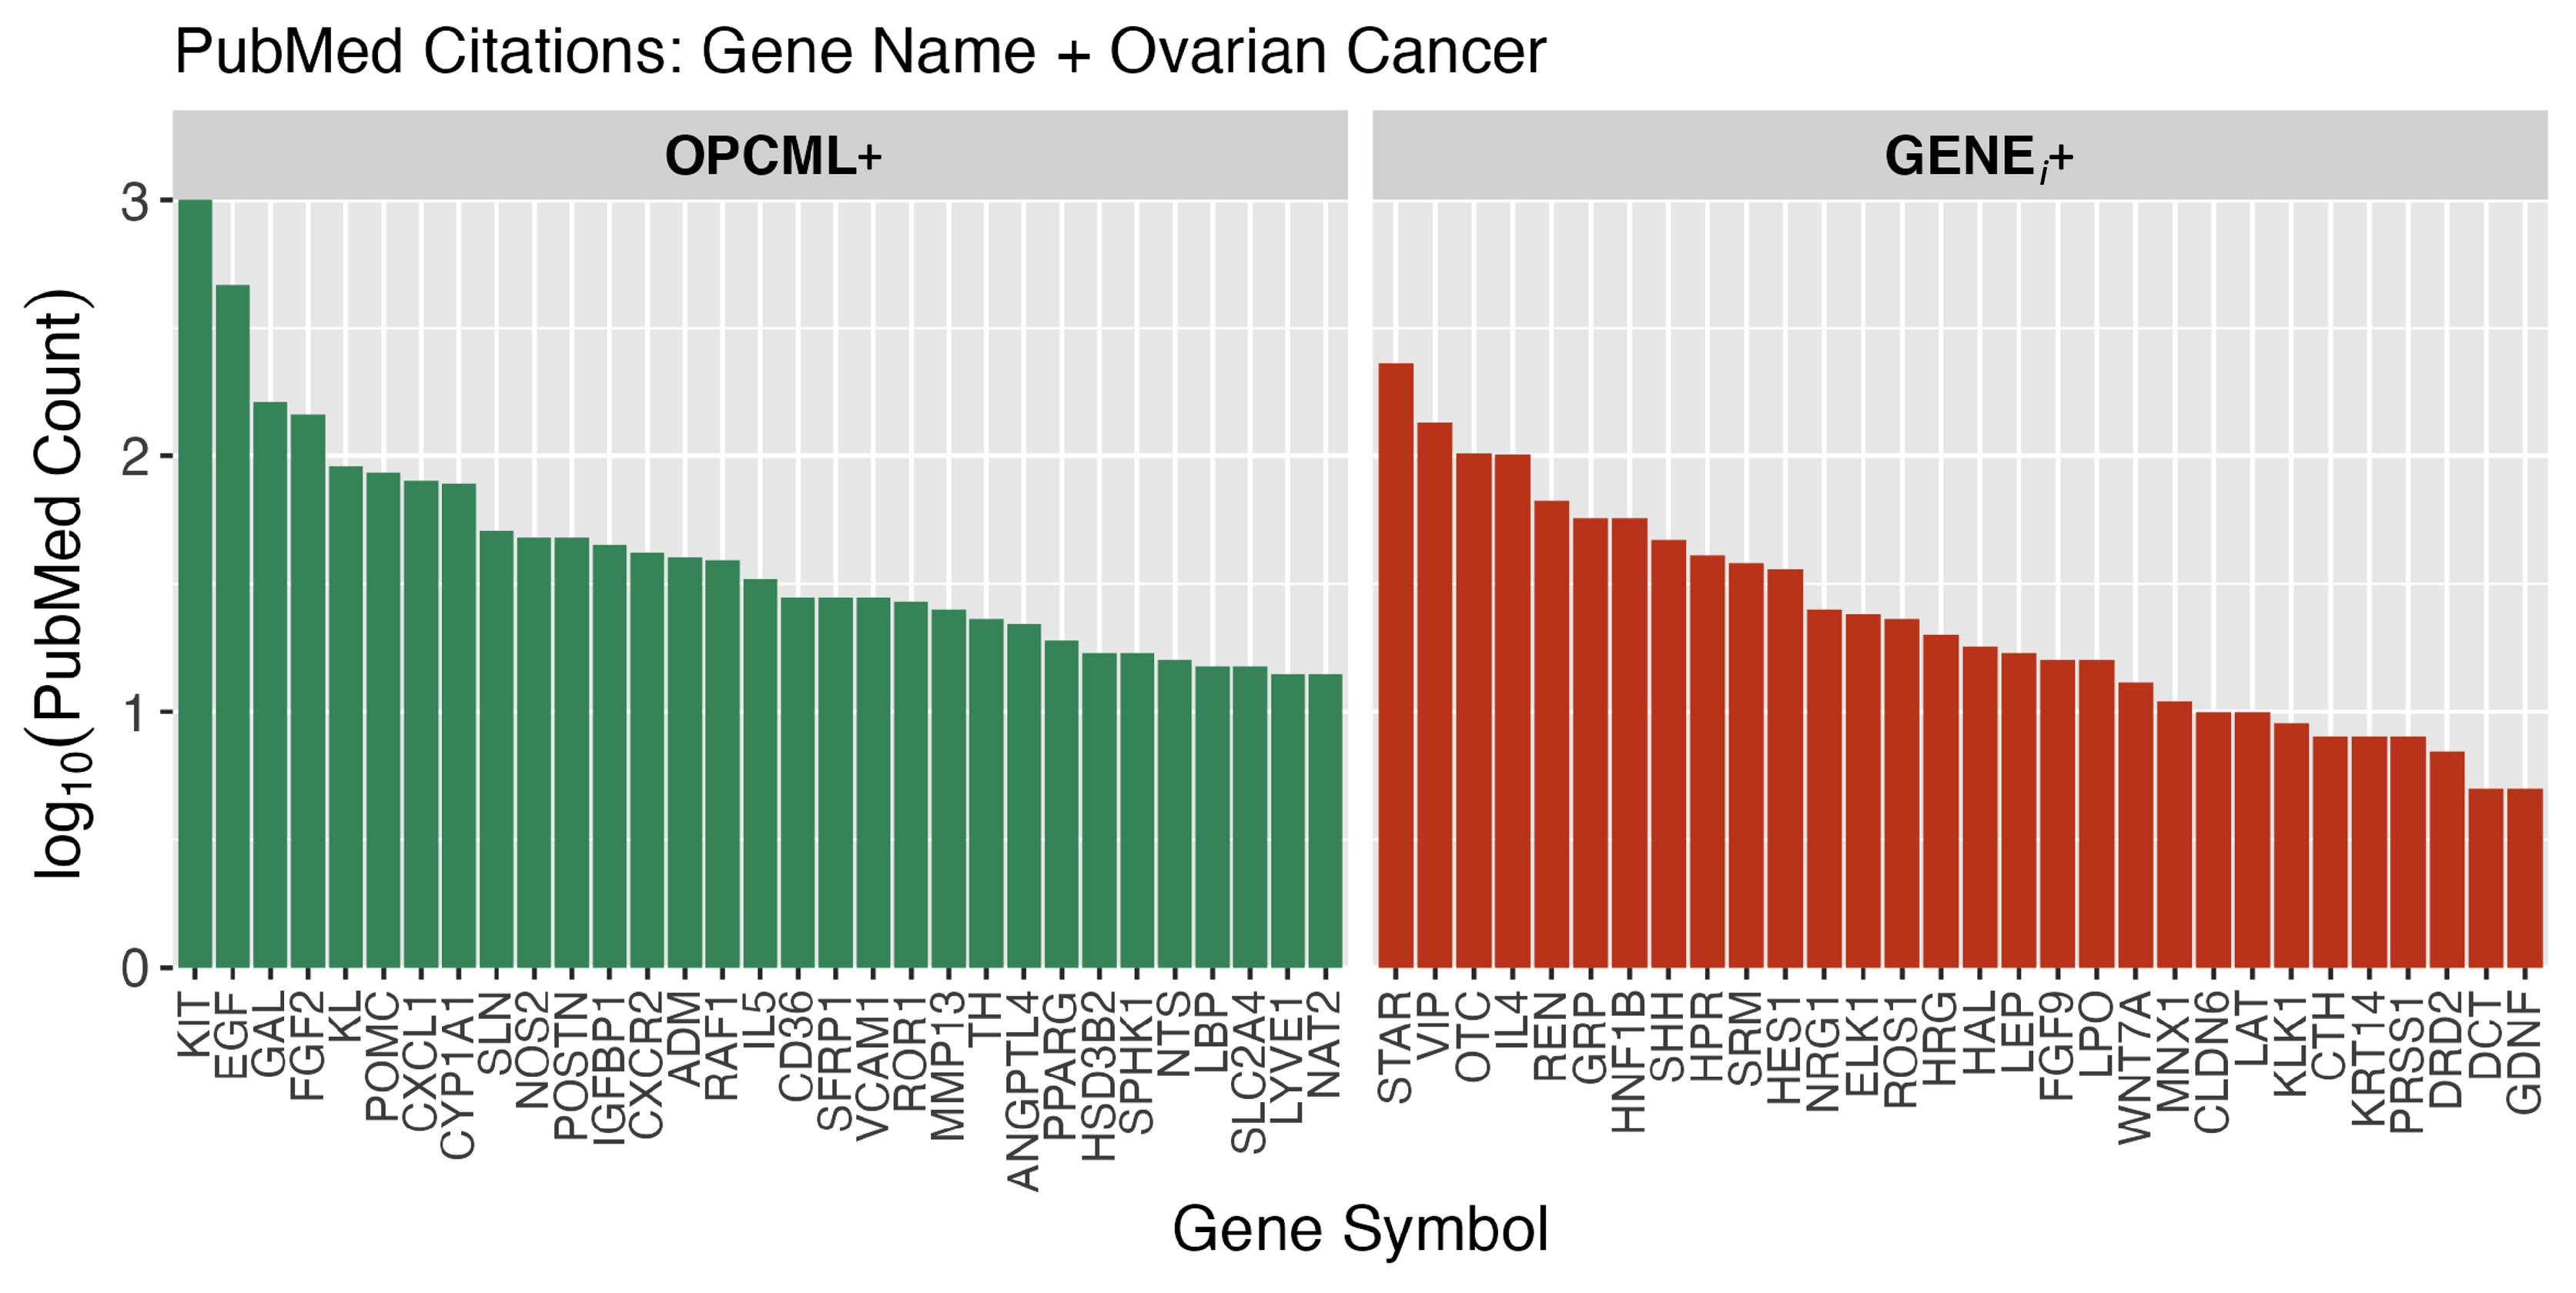
Figure 7.
OPCML 3-Domain Monomer. The beta-rolls of the three Ig domains are shown with: a) different domain colors (D1 = yellow, D2 = green, D3 = blue); b) all known point mutations in cancers with the alpha carbon spheres on the beta ribbons colored by AA name (Birtley et al. [11], Supplementary Table 1); c) the targeted point mutations experimentally evaluated by Birtley et al. (2018) highlighted as magenta colored VDW full residue atom models.
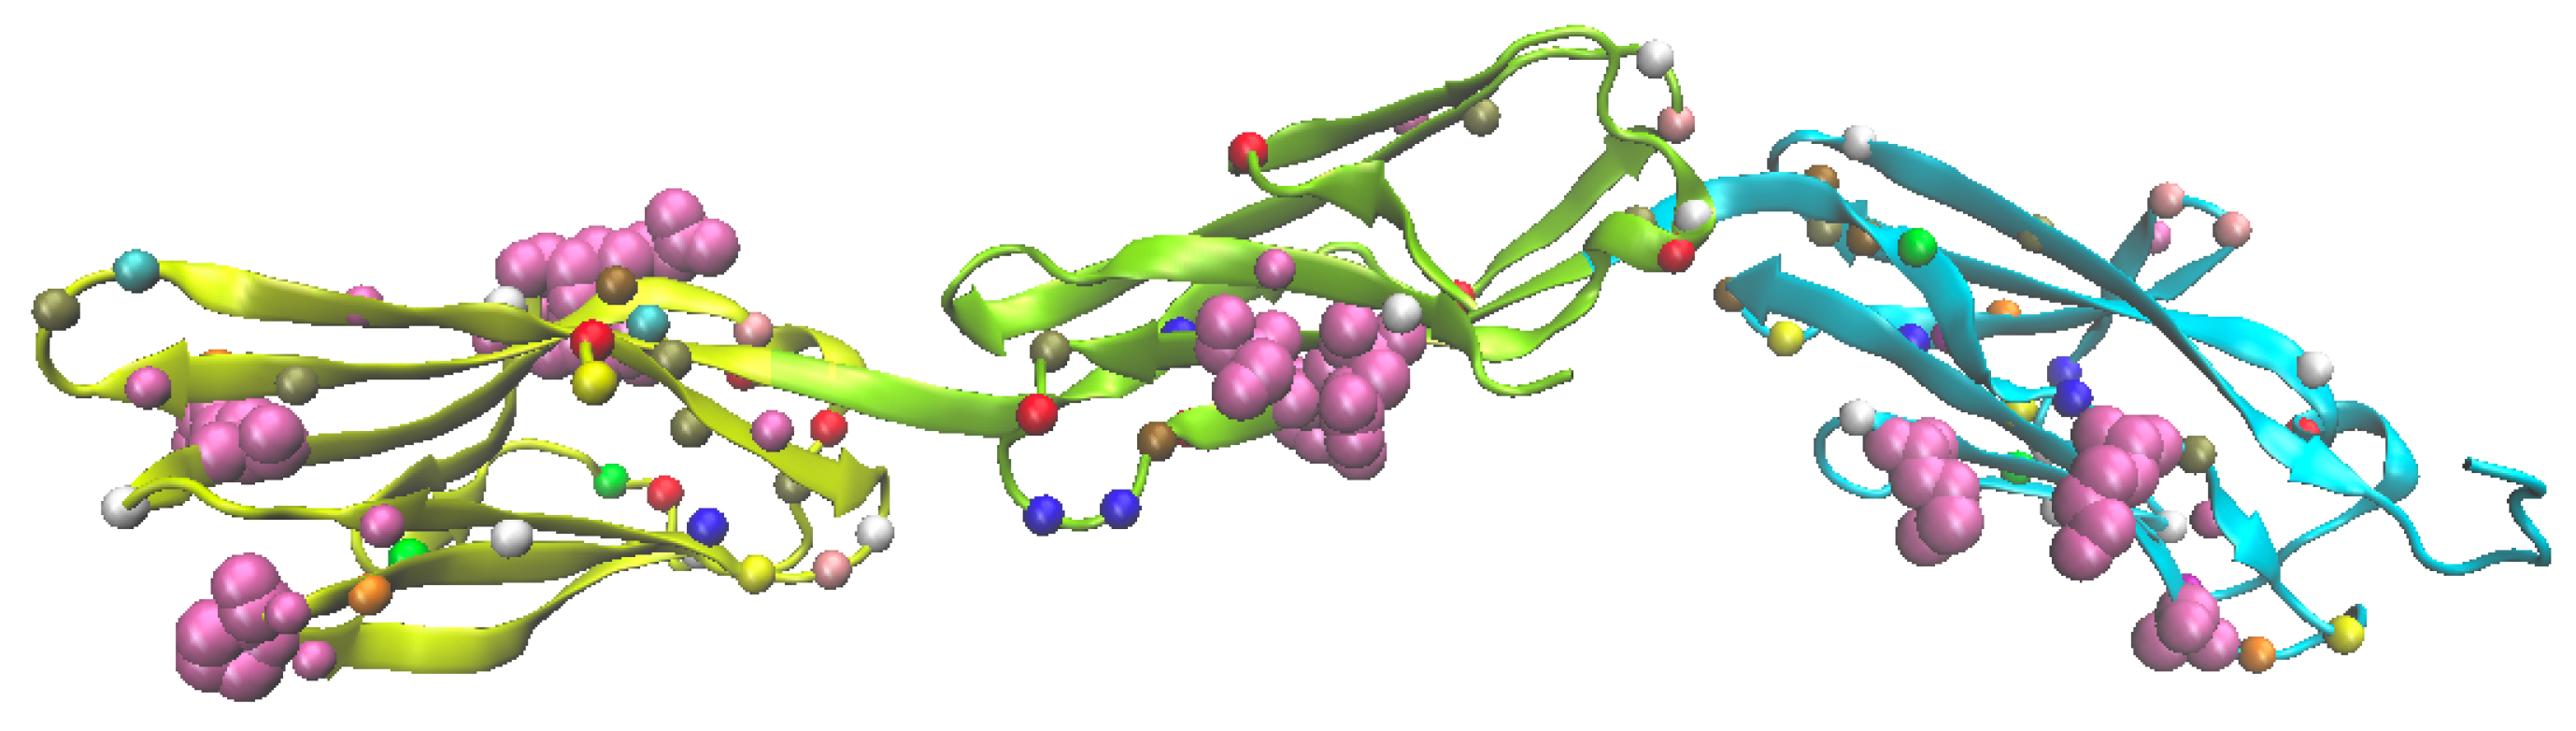
Figure 8.
OPCML is Transcriptionally Linked to many Proteins that Impact Tumor Growth. Protein Genes with RNAseq values that identified them as contributing to enriched functional pathways (Tables 2 & 3) are highlighted here relative to their cellular location. The interaction of OPCML with RTKs is one of the primary effects OPCML exerts as a tumor supressor gene. However, there are other secondary linkages via transcription RNAseq data that reveal a wide range of coordinated effects OPCML has on other processes related to tumor growth. The p-value color scale indicates the significance of enriched functions in which genes were found to be an expressed member.
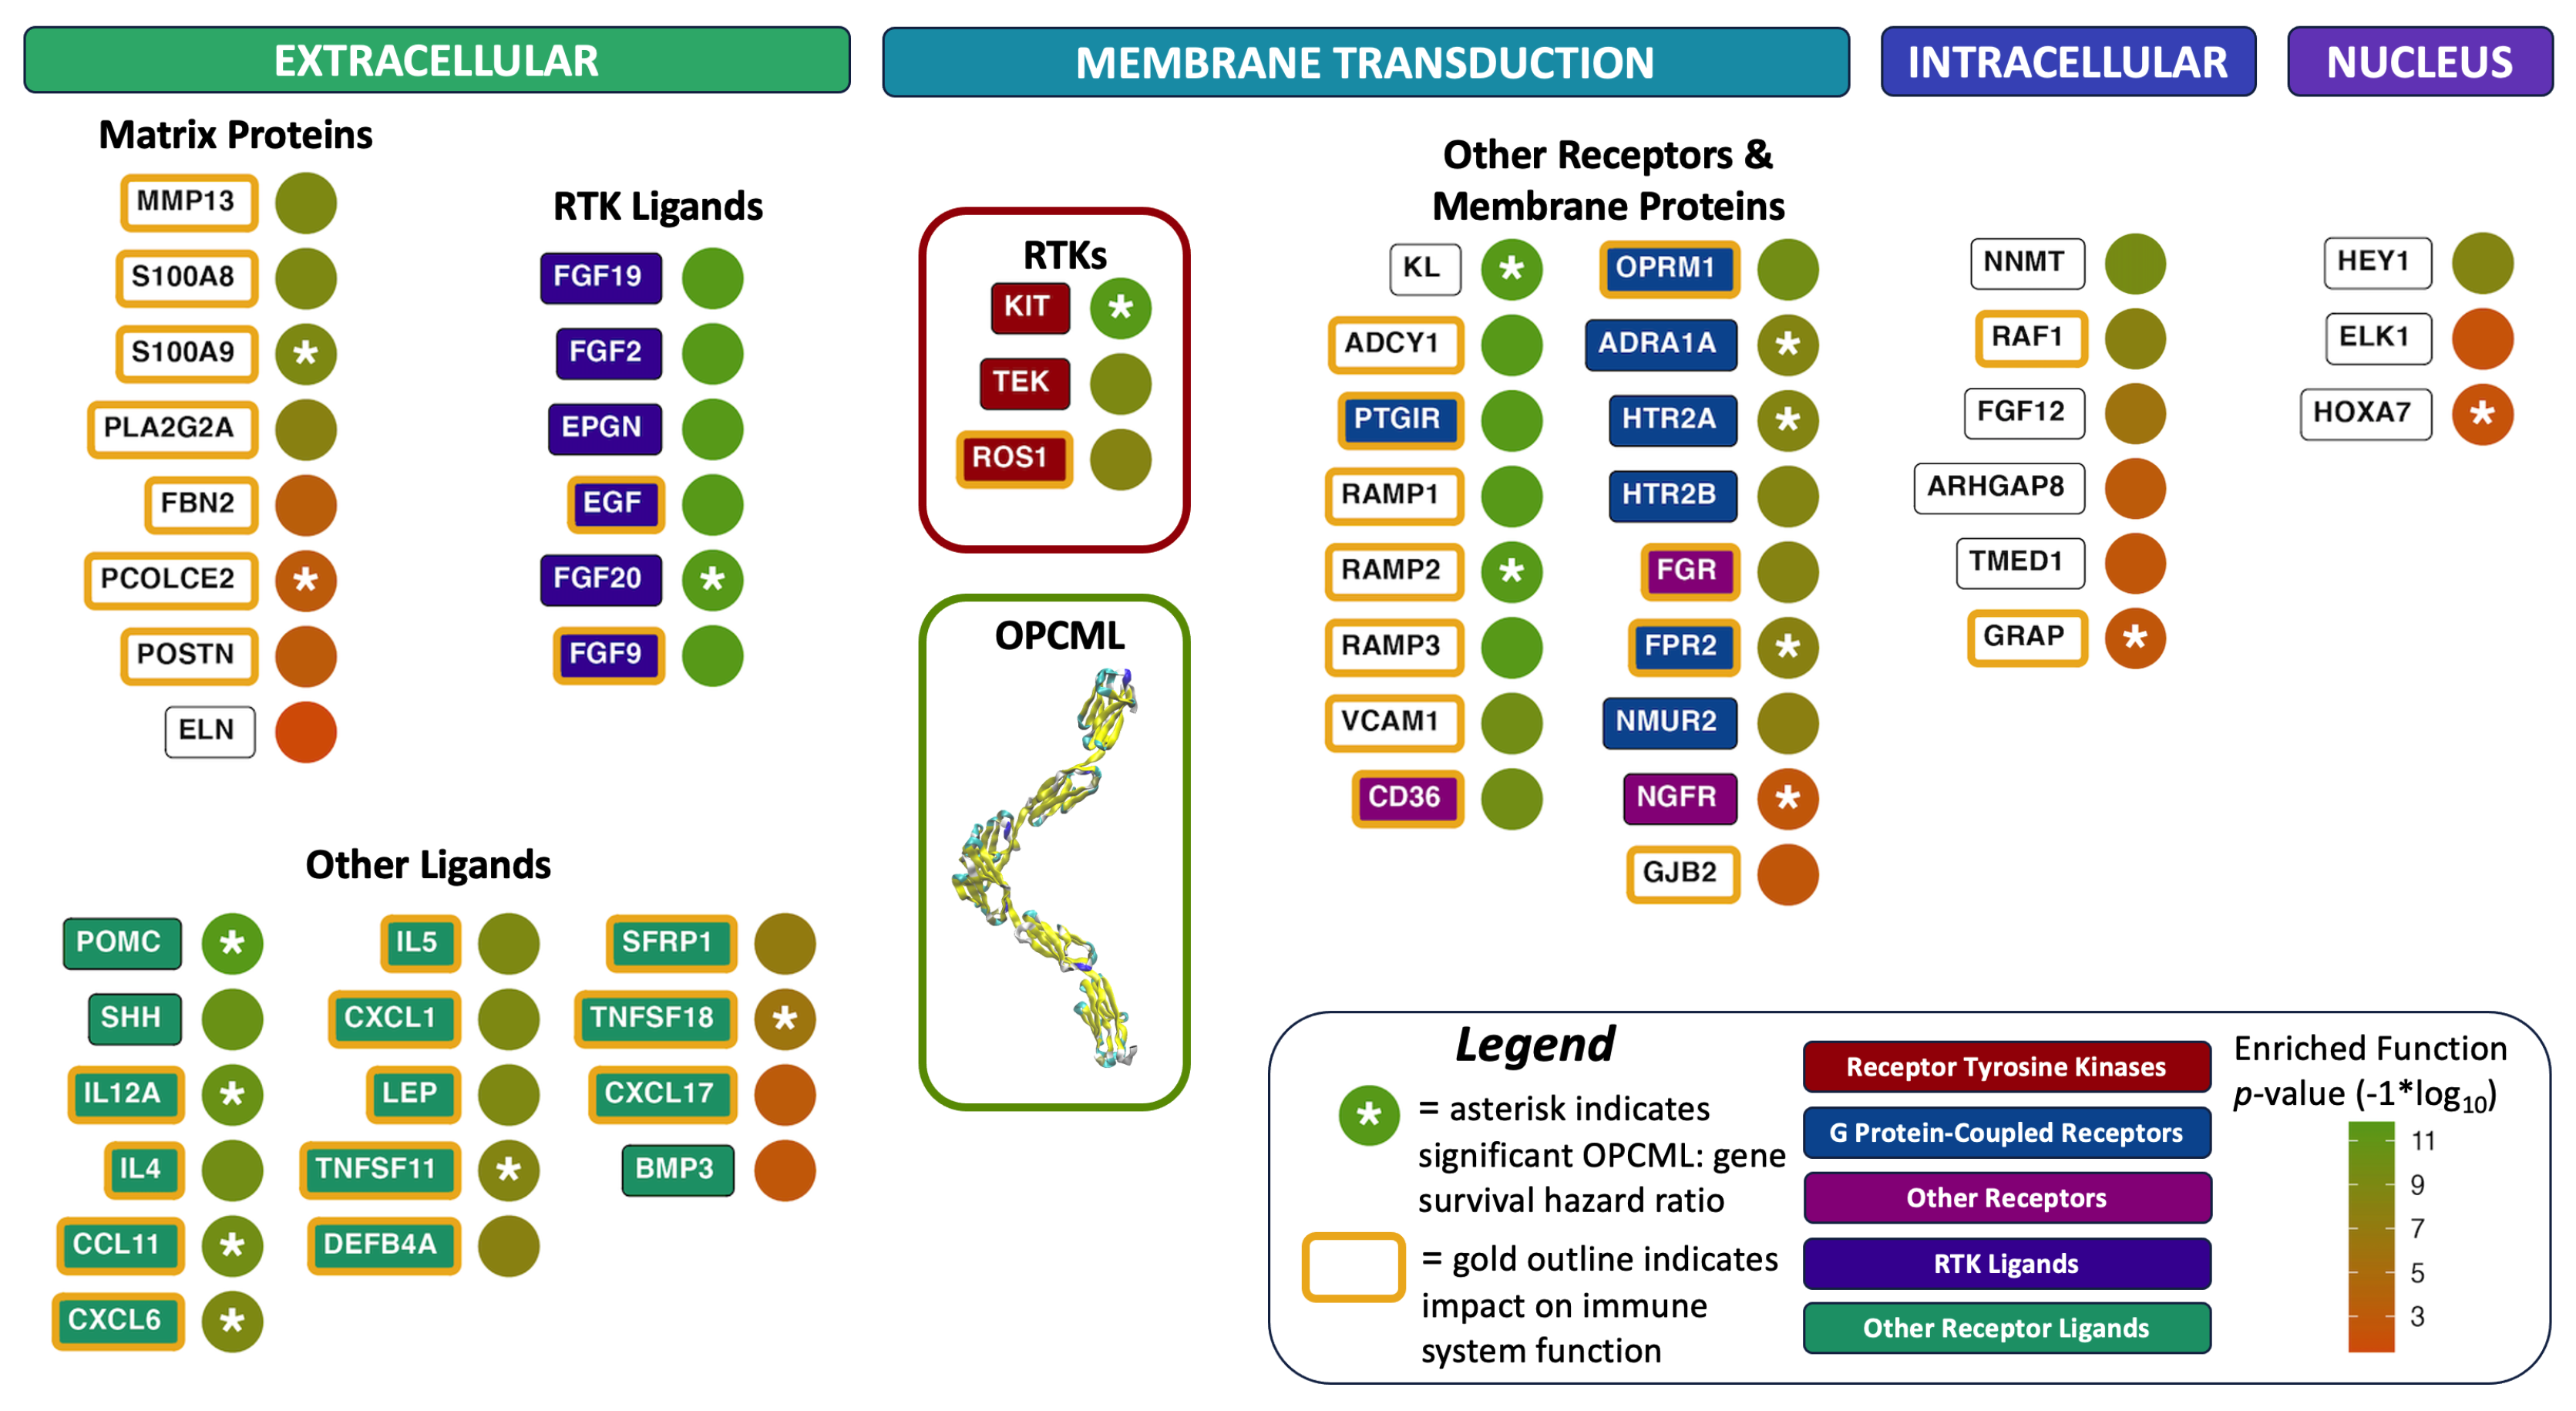

Table 1.
Example Cluster Groups of Related Functions: Three example branches from the dendrogram in Figure 5. The cluster labels “a”, “b” and “c” refer to the groups highlighted in Figure 5 by the light-blue boxes.
| Survival | ||||
|---|---|---|---|---|
| ID | P-value | xFold | Group | Description |
| a: cluster 16 (n=10) | ||||
| R5602498 | 1.51E-09 | 6.48 | OPCML+ | MyD88 deficiency (TLR2/4) |
| R5603041 | 1.51E-09 | 6.07 | OPCML+ | IRAK4 deficiency (TLR2/4) |
| R5686938 | 3.58E-09 | 4.86 | OPCML+ | Regulation of TLR by endogenous ligand |
| R166016 | 1.18E-08 | 1.71 | OPCML+ | Toll Like Receptor 4 (TLR4) Cascade |
| R5602358 | 1.64E-08 | 3.24 | OPCML+ | Diseases associated with the TLR signaling cascade |
| R5260271 | 1.64E-08 | 3.24 | OPCML+ | Diseases of Immune System |
| R181438 | 9.19E-08 | 1.74 | GENE+ | Toll Like Receptor 2 (TLR2) Cascade |
| R168179 | 9.19E-08 | 1.74 | GENE+ | Toll Like Receptor TLR1:TLR2 Cascade |
| R166058 | 9.19E-08 | 1.78 | GENE+ | MyD88:MAL(TIRAP) cascade initiated on plasma membrane |
| R168188 | 9.19E-08 | 1.78 | GENE+ | Toll Like Receptor TLR6:TLR2 Cascade |
| b: cluster 1 (n=31; top 10 shown) | ||||
| R2219530 | 1.41E-12 | 2.52 | OPCML+ | Constitutive Signaling by Aberrant PI3K in Cancer |
| R2219528 | 4.14E-12 | 1.87 | OPCML+ | PI3K/AKT Signaling in Cancer |
| R6811558 | 4.14E-12 | 1.87 | OPCML+ | PI5P, PP2A and IER3 Regulate PI3K/AKT Signaling |
| R199418 | 4.96E-12 | 1.75 | OPCML+ | Negative regulation of the PI3K/AKT network |
| R109704 | 5.83E-12 | 2.76 | OPCML+ | PI3K Cascade |
| R112399 | 8.44E-12 | 2.53 | OPCML+ | IRS-mediated signalling |
| R5654219 | 9.69E-12 | 6.07 | GENE+ | Phospholipase C-mediated cascade: FGFR1 |
| R2428928 | 9.69E-12 | 2.34 | OPCML+ | IRS-related events triggered by IGF1R |
| R2428924 | 9.69E-12 | 2.29 | OPCML+ | IGF1R signaling cascade |
| R74751 | 9.69E-12 | 2.25 | OPCML+ | Insulin receptor signalling cascade |
| c: cluster 6 (n=8) | ||||
| R418555 | 1.69E-12 | 2.35 | OPCML+ | G alpha (s) signalling events |
| R419812 | 1.84E-12 | 16.2 | OPCML+ | Calcitonin-like ligand receptors |
| R373080 | 2.96E-11 | 4.0 | OPCML+ | Class B/2 (Secretin family receptors) |
| hsa04270 | 8.68E-09 | 3.04 | OPCML+ | Vascular smooth muscle contraction |
| G0007189 | 1.49E-08 | 4.77 | OPCML+ | adenylate cyclase-activating G protein-coupled receptor |
| G0031623 | 8.13E-06 | 3.74 | OPCML+ | receptor internalization |
| G0015031 | 0.0007 | 5.28 | GENE+ | external membrane protein transport |
| G0006816 | 0.0106 | 2.31 | OPCML+ | calcium ion transport |
Table 2.
OPCML+ Majority Enriched Functions with Ovarian Cancer Relevance Score. Top 40 enriched functions ranked by known relevance to ovarian cancer via PubMed citation counts. Top 3 (max) constituent genes in both OPCML+ and groups are listed.
Table 2.
OPCML+ Majority Enriched Functions with Ovarian Cancer Relevance Score. Top 40 enriched functions ranked by known relevance to ovarian cancer via PubMed citation counts. Top 3 (max) constituent genes in both OPCML+ and groups are listed.
| ID | P-value | xFold | OVca | Top 3 | Top 3 | Description |
|---|---|---|---|---|---|---|
| R2219530 | 1.41E-12 | 2.52 | 323.3 | KIT, EGF, FGF2 | FGF9 | Constitutive Signaling by Aberrant PI3K in Cancer |
| R2219528 | 4.14E-12 | 1.87 | 323.3 | KIT, EGF, FGF2 | FGF9 | PI3K/AKT Signaling in Cancer |
| R6811558 | 4.14E-12 | 1.87 | 323.3 | KIT, EGF, FGF2 | FGF9 | PI5P, PP2A and IER3 Regulate PI3K/AKT Signaling |
| R199418 | 4.96E-12 | 1.75 | 323.3 | KIT, EGF, FGF2 | FGF9 | Negative regulation of the PI3K/AKT network |
| hsa04640 | 1.69E-05 | 1.91 | 271.0 | KIT, IL5, CD36 | IL4 | Hematopoietic cell lineage |
| R6785807 | 1.42E-10 | 3.01 | 257.5 | FGF2, POMC, NOS2 | IL4 | Interleukin-4 and Interleukin-13 signaling |
| hsa04072 | 0.0029 | 1.76 | 255.9 | KIT, EGF, CXCR2 | DGKK, GRM6 | Phospholipase D signaling pathway |
| G0051897 | 1.74E-05 | 2.31 | 221.8 | KIT, EGF, FGF2 | LEP, ERFE | Positive regulation of phosphatidylinositol 3-kinase/protein kinase B signal transduction |
| hsa04913 | 0.0001 | 1.98 | 201.9 | STAR, CYP1A1, HSD3B2 | Ovarian steroidogenesis | |
| G0006954 | 1.49E-05 | 1.87 | 197.3 | KIT, CXCR2, ADM | Inflammatory response | |
| R375276 | 1.86E-08 | 2.69 | 173.1 | GAL, POMC, CXCL1 | GRP, GPR37L1, PENK | Peptide ligand-binding receptors |
| hsa04927 | 1.10E-06 | 2.25 | 150.8 | STAR, POMC, HSD3B2 | Cortisol synthesis and secretion | |
| hsa04657 | 1.07E-09 | 1.99 | 150.7 | CXCL1, IL5, MMP13 | IL4 | IL-17 signaling pathway |
| G0001938 | 1.74E-05 | 2.64 | 127.9 | EGF, FGF2, CCL11 | Positive regulation of endothelial cell proliferation | |
| hsa04020 | 2.58E-08 | 2.44 | 122.9 | EGF, FGF2, SLN | FGF9, GDNF, SMIM6 | Calcium signaling pathway |
| G0042531 | 0.0002 | 3.28 | 122.6 | KIT, HES1, IL12A | IL4 | Positive regulation of tyrosine phosphorylation of STAT protein |
| hsa04060 | 0.0016 | 1.77 | 109.1 | CXCL1, CXCR2, IL5 | IL4, LEP | Cytokine-cytokine receptor interaction |
| G0043406 | 0.0017 | 2.92 | 96.7 | EGF, FGF2, TNFSF11 | Positive regulation of MAP kinase activity | |
| hsa04979 | 0.0002 | 1.98 | 95.6 | STAR, CD36, ANGPTL4 | Cholesterol metabolism | |
| R114608 | 0.0077 | 1.74 | 93.8 | EGF, CD36, SELP | HRG | Platelet degranulation |
| hsa04064 | 0.0001 | 2.0 | 91.9 | CXCL1, VCAM1, LBP | LAT | NF-kappa B signaling pathway |
| G0048018 | 0.0133 | 2.92 | 88.6 | EGF, NTS, CCL11 | WNT7A | Receptor ligand activity |
| G0006935 | 1.01E-08 | 2.74 | 85.2 | FGF2, CXCL1, CXCR2 | Chemotaxis | |
| R381340 | 1.24E-09 | 2.13 | 84.0 | CD36, ANGPTL4, PPARG | LEP | Transcriptional regulation of white adipocyte differentiation |
| R9843745 | 3.30E-09 | 1.85 | 84.0 | CD36, ANGPTL4, PPARG | LEP | Adipogenesis |
| G0051092 | 6.92E-07 | 2.28 | 83.6 | ROR1, SPHK1, NTS | CRNN | Positive regulation of NF-kappaB transcription factor activity |
| G0001525 | 0.0058 | 2.43 | 77.5 | EGF, HEY1, HOXA7 | LEP | Angiogenesis |
| G0008201 | 0.0009 | 3.99 | 76.2 | POSTN, SFRP1, LTF | HRG, AOC1 | Heparin binding |
| hsa04925 | 3.56E-08 | 3.34 | 75.7 | STAR, POMC, HSD3B2 | CAMK1G, NPPA | Aldosterone synthesis and secretion |
| G0004713 | 5.10E-09 | 2.81 | 75.3 | KIT, FGR, BTK | ROS1 | Protein tyrosine kinase activity |
| R373080 | 2.96E-11 | 4.0 | 70.9 | VIP, ADM, DHH | SHH, WNT7A | Class B/2 (Secretin family receptors) |
| hsa04061 | 6.41E-09 | 1.98 | 69.4 | CXCL1, CXCR2, CCL11 | Viral protein interaction with cytokine and cytokine receptor | |
| R380108 | 5.00E-07 | 1.8 | 69.4 | CXCL1, CXCR2, CCL11 | Chemokine receptors bind chemokines | |
| hsa03320 | 5.91E-08 | 2.0 | 61.5 | CD36, ANGPTL4, PPARG | HMGCS2 | PPAR signaling pathway |
| G0019722 | 0.0003 | 6.75 | 59.2 | POMC, SPHK1, TNFSF11 | LAT | Calcium-mediated signaling |
| R166016 | 1.18E-08 | 1.71 | 59.1 | CD36, LBP, S100A9 | DUSP4, MAP3K8 | Toll Like Receptor 4 (TLR4) Cascade |
| G0070374 | 0.0008 | 2.54 | 59.0 | FGF2, CD36, TNFSF11 | ARHGAP8 | Positive regulation of ERK1 and ERK2 cascade |
| G0031623 | 8.13E-06 | 3.74 | 58.9 | CXCR2, ADM, CD36 | Receptor internalization | |
| G0042742 | 3.53E-06 | 3.0 | 58.4 | NOS2, S100A9, S100A8 | LPO | Defense response to bacterium |
| G0007186 | 0.0029 | 1.81 | 58.3 | VIP, CXCL1, AKR1C2 | GPR17 | G protein-coupled receptor signaling pathway |
Table 3.
GENE+ Enriched Functions with Ovarian Cancer Relevance Score. Top 40 enriched functions ranked by known relevance to ovarian cancer via PubMed citation counts. Top 3 (max) constituent genes in both and GENEgroups are listed.
Table 3.
GENE+ Enriched Functions with Ovarian Cancer Relevance Score. Top 40 enriched functions ranked by known relevance to ovarian cancer via PubMed citation counts. Top 3 (max) constituent genes in both and GENEgroups are listed.
| ID | P-value | xFold | OVca | Top 3 OPCML+ | Top 3 | Description |
|---|---|---|---|---|---|---|
| G0005184 | 0.0001 | 8.1 | 192.2 | GAL, CALCB | GRP, PENK, NPPA | Neuropeptide hormone activity |
| hsa04015 | 9.10E-10 | 1.74 | 179.2 | KIT, EGF, FGF2 | FGF9, LAT, DRD2 | Rap1 signaling pathway |
| hsa05207 | 4.52E-06 | 1.89 | 178.3 | EGF, FGF2, CYP1A1 | FGF9, KPNA7, UGT2B15 | Chemical carcinogenesis - receptor activation |
| G0005102 | 0.0017 | 1.89 | 171.7 | POMC, CXCL1, IGFBP1 | REN, HRG, WNT7A | Signaling receptor binding |
| G0005125 | 3.09E-06 | 2.74 | 164.1 | FGF2, IL5, TNFSF11 | IL4, WNT7A | Cytokine activity |
| hsa05226 | 1.82E-07 | 1.77 | 149.3 | EGF, FGF2, FGF19 | SHH, FGF9, WNT7A | Gastric cancer |
| G0008217 | 0.0027 | 3.64 | 143.5 | POMC, PPARG, RAMP2 | REN, NPPA | Regulation of blood pressure |
| R5654219 | 9.69E-12 | 6.07 | 134.2 | FGF2, KL, FGF20 | FGF9 | Phospholipase C-mediated cascade: FGFR1 |
| R190242 | 1.39E-11 | 5.4 | 134.2 | FGF2, KL, FGF20 | FGF9 | FGFR1 ligand binding and activation |
| hsa04916 | 6.75E-05 | 2.02 | 132.6 | KIT, POMC, RAF1 | WNT7A, DCT | Melanogenesis |
| hsa04664 | 0.0021 | 1.7 | 132.4 | RAF1, IL5, BTK | IL4, LAT | Fc epsilon RI signaling pathway |
| G0120162 | 0.0063 | 1.79 | 125.1 | SLN, CD36, FABP5 | IL4, LEP, ESRRG | Positive regulation of cold-induced thermogenesis |
| R9615017 | 0.0002 | 2.51 | 124.4 | POMC, IGFBP1, PLXNA4 | FOXO-mediated transcription of oxidative stress, metabolic and neuronal genes | |
| R196071 | 1.40E-06 | 2.94 | 96.3 | STAR, POMC, HSD3B2 | TSPOAP1 | Metabolism of steroid hormones |
| G0060326 | 0.0491 | 2.21 | 93.3 | KIT, AGTR1, HOXB9 | Cell chemotaxis | |
| R186712 | 0.0269 | 2.28 | 87.3 | HES1, NR5A2, MAFA | HNF1B | Regulation of beta-cell development |
| M765 | 0.0056 | 3.01 | 85.7 | RAF1, SLC2A4 | ELK1 | BIOCARTA-INSULIN-PATHWAY |
| hsa00330 | 0.0002 | 2.48 | 85.4 | NOS2, SRM, CKM | AOC1, CARNS1 | Arginine and proline metabolism |
| G0032720 | 0.0017 | 2.07 | 76.0 | POMC, LBP, BPI | IL4 | Negative regulation of tumor necrosis factor production |
| R181438 | 9.19E-08 | 1.74 | 71.7 | CD36, S100A9, BTK | DUSP4, MAP3K8 | Toll Like Receptor 2 (TLR2) Cascade |
| R168179 | 9.19E-08 | 1.74 | 71.7 | CD36, S100A9, BTK | DUSP4, MAP3K8 | Toll Like Receptor TLR1:TLR2 Cascade |
| G0001658 | 0.0162 | 5.72 | 71.5 | FGF2 | SHH, GDNF, SALL1 | Branching involved in ureteric bud morphogenesis |
| G0006631 | 0.002 | 2.88 | 70.7 | CYP1A1, CD36, LPL | Fatty acid metabolic process | |
| hsa04540 | 0.0081 | 1.92 | 69.3 | EGF, PRKG1, HTR2A | DRD2, TUBA8 | Gap junction |
| G0005509 | 0.0082 | 2.5 | 66.1 | MMP13, S100A9, S100A8 | SHH, S100A16, SNCB | Calcium ion binding |
| G0001822 | 0.0064 | 2.88 | 64.8 | AGTR1, SIX2 | REN, HNF1B, SALL1 | Kidney development |
| G0043388 | 0.0173 | 4.29 | 62.1 | EGF, PPARG, PRKN | Positive regulation of DNA binding | |
| R211859 | 3.37E-10 | 1.84 | 61.6 | POMC, CYP1A1, NAT2 | ACSM1, ADH4, AOC1 | Biological oxidations |
| R9830369 | 0.007 | 3.85 | 60.0 | FGF2, OSR1, HOXA6 | HNF1B, GDNF, SALL1 | Kidney development |
| G0042102 | 0.0001 | 3.28 | 59.6 | VCAM1, CD1D, NCKAP1L | IL4, LEP | Positive regulation of T cell proliferation |
| hsa04950 | 0.007 | 4.42 | 58.8 | NR5A2, MAFA | HNF1B, MNX1 | Maturity onset diabetes of the young |
| M2288 | 0.0011 | 2.07 | 53.4 | FGF2, CAMK1 | CAMK1G, NPPA | BIOCARTA-NFAT-PATHWAY |
| R166058 | 9.19E-08 | 1.78 | 53.3 | CD36, S100A9, BTK | DUSP4, MAP3K8 | MyD88:MAL(TIRAP) cascade initiated on plasma membrane |
| R168188 | 9.19E-08 | 1.78 | 53.3 | CD36, S100A9, BTK | DUSP4, MAP3K8 | Toll Like Receptor TLR6:TLR2 Cascade |
| hsa05310 | 2.84E-05 | 4.86 | 52.6 | IL5, CCL11, RNASE3 | IL4, PRG2 | Asthma |
| hsa04614 | 0.0003 | 4.63 | 46.1 | AGTR1, CTSG | REN, KLK1 | Renin-angiotensin system |
| M111 | 0.0052 | 4.52 | 43.3 | RAF1, FGR, ADCY1 | BIOCARTA-BARRESTIN-SRC-PATHWAY | |
| R9635486 | 0.0348 | 2.45 | 39.2 | NOS2, LTF, CTSG | Infection with Mycobacterium tuberculosis | |
| G0015909 | 2.44E-05 | 7.29 | 38.6 | CD36, PPARG, FABP5 | Long-chain fatty acid transport | |
| G0042733 | 0.0215 | 4.56 | 36.7 | SHH, WNT7A, SALL1 | Embryonic digit morphogenesis |
Disclaimer/Publisher’s Note: The statements, opinions and data contained in all publications are solely those of the individual author(s) and contributor(s) and not of MDPI and/or the editor(s). MDPI and/or the editor(s) disclaim responsibility for any injury to people or property resulting from any ideas, methods, instructions or products referred to in the content. |
© 2024 by the authors. Licensee MDPI, Basel, Switzerland. This article is an open access article distributed under the terms and conditions of the Creative Commons Attribution (CC BY) license (http://creativecommons.org/licenses/by/4.0/).
Copyright: This open access article is published under a Creative Commons CC BY 4.0 license, which permit the free download, distribution, and reuse, provided that the author and preprint are cited in any reuse.


