
Submitted:
13 November 2024
Posted:
13 November 2024
You are already at the latest version
Abstract
Turbomachinery of gas turbines uses seals to control the leakage between regions of high and low pressure consequently enhancing engine efficiency and performance. Film riding seal hybridizes the advantages of contact and non-contact seals i.e., low leakage and low friction and wear. Literature focuses on the leakage performance of these seals, however, one of their fundamental characteristics, i.e., gap between rotor and seal surface is scarcely presented. Seal pad levitates due to deflection of the springs at its back under the influence of hydrodynamic forces. This study develops a test rig to measure the levitation of film riding seal. High speed motor rotates the rotor and gap sensors measure the levitation of seal pads. Measurements are also compared with predictions from a simple 1-D Reynolds equation based model. Tests performed for the increasing rotor speed indicated that initially until a certain rotor speed, the pads adjust their position, then rub against rotor until another rotor speed, and finally starts levitating with further increase in the rotor speed. Moreover, both measured and predicted results show that pads levitated the most when located at 90° clockwise from the positive horizontal axis (bottom of seal housing) compared to other circumferential positions.
Keywords:
Film riding seal
; levitation
; gas turbine engines
1. Introduction
Enhancing the engine efficiency and reducing the harmful turbine emissions have always been the focus of the research and development in the field of turbomachinery. Sealing in turbomachinery is believed to be one of the most cost-effective techniques in improving the engine performance and efficiency [1]. These machine elements are estimated to achieve performance gains at a four to five times cheaper costs compared to the upgradation of the compressor or turbine [2]. In the gas turbine engines they are primarily used to prevent the gas from entering the bearing cavities, to regulate the cooling flow to various parts of the engine, and to prevent the working fluid flow recirculation between different stages. In addition to their primary duties, seals also contribute to the overall system rotordynamic stability.
Chupp et al. [3] published a detailed review of seals in the turbomachinery of the gas and steam turbines. They focused on the effects of the proper clearance control in the seals on the engine efficiency and component life. A change of 25.4 µm in the blade tip clearance results in the reduction of the specific fuel consumption up to 0.1% and a drop of 1 °C in the temperature of the exhaust gas. Operating conditions including temperatures, pressure, rotor speeds as well as the material properties significantly affect the performance of the seals and the overall engine efficiency and rotordynamic behavior, consequently.
The authors in Ref. [3] discussed the environment and key sealing locations in gas and steam turbines along with the pros and cons of the different types of seals. One of the most common type of seals used in the gas and steam turbines are the labyrinth seals which are low cost simple design offering either direction shaft rotation. However, due to the tighter clearances between the seal and the rotor required for the effective leakage control, they are prone to rubs and consequent degradation in leakage control. In addition, labyrinth seals have the disadvantage of developing destabilizing cross-coupled stiffness coefficients which can be avoided to some extent using a negative swirl brake [4]. Researches have demonstrated that the overall engine performance can be increased up to 6% by replacing the labyrinth seals with the more effective seals [5].
Another seal having commonplace in the turbomachinery is the brush seal which have compliant bristles that can be designed with minimized clearance between the seal and the rotor eventually having better leakage performance compared to the labyrinth seals [6,7]. The typical structure of the brush seals available commercially comprises of a pack of dense metallic bristles depicting a brush sandwiched between a front plate at the high pressure side (upstream) and a back plate at the low pressure side (downstream). The compliant nature of the bristles give brush seals the benefit of accommodating the rotor excursions particularly at the startup and shut-down by bending rather than buckling, however, they are prone to damage under large rotor eccentricities [8].
Film riding seals (FRS) that are self-acting seals combine the best features of the contact seals i.e., lower leakage and non-contact seals i.e., lower friction and wear and consequently lower heat generation and power loss. These types of seals can be of two types, i.e., hydrostatic and hydrodynamic. Hydrostatic FRS uses externally pressurized fluid injected between the seal and the rotor surfaces to maintain a controlled film gap between them. The hydrodynamic FRS on the other hand relies on the rotor’s surface velocity for the generation of the film gap. The surface of the FRS’s pad is initially in contact with the rotor at the static conditions and the rotor lifts-off when it reaches a certain speed by the virtue of the hydrodynamic pressure which is generated due to the combined effects of the rotor speed and the presence of the grooves on the surface of the seal pad. The back of the seal pad is welded to a spring whose another end is welded to the seal housing. These springs deflect due to the hydrodynamic forces on the seal pad making room for the rotor’s lift off and consequent generation of the film thickness between the rotor and the seal surface.
Development of the FRS dates back to the early 1970s [5,9,10]. In Ref. [9], the authors tested the FRS at the advanced engine operating conditions which demonstrated the best potential by significantly reducing the leakage flow rates compared to the conventional seals. The study showed that at the rotor speed of 43 krpm, the FRS operated with less leakage than the labyrinth seals and without any rubbing contact during the 150 hours endurance test. As a follow-on to the tests in Ref. [9], the authors extended their research and tested FRS at more severe conditions in [10]. The rotor speed was increased to 54.6 krpm and the endurance test time to 500 hours. In addition, the tests were also conducted in the dusty environment. The FRS successfully completed the endurance tests with no wear during the first ten hours. Munson et al. [5,11] designed the FRS for the prevention of the compressor discharge flow to the internal flow system of the gas turbine engines. Their designed hydrodynamic FRS with the clearance less than 12 µm had excellent leakage performance compared to the projected performance of the brush and the labyrinth seals at various pressure differentials. Additionally, the FRS leakage was insensitive to the increasing differential pressure. The authors concluded that the designed FRS would improve the overall engine efficiency by 1.5% or 0.5% compared to the labyrinth seal or brush seal, respectively. Steinetz et al. [12] analyzed various FRS design configurations and their effects on the overall performance of the aircraft turbine engine. The study developed an analytical model of the entire secondary airflow system of the engine based on its cycles and the layout provided by the several turbine analysis groups. The airflow distribution obtained from the developed model using the flow characteristics of various FRS design configurations were then used in the calculation of the component efficiencies and later on the overall engine performance using another program named as mission. Replacing conventional seals with the FRS at only three locations improved the specific fuel consumption of the engine by 0.9% and the consequent operating costs by 0.89%.
Sayma et al. [13] carried out a computational fluid dynamics based numerical investigation on the lift force and leakage performance of the FRS. The lift force decreased whereas the leakage increased with the increasing seal gap and pressure ratio.
The design of the grooves or lift pockets on the surface of the FRS have major contributions in the generation of the hydrodynamic forces responsible for the pad deflection and consequent film thickness between the seal and the rotor surfaces. Figure 1 shows two of the earliest designs of the FRS’s grooves from Ref. [14]. The spiral grooves direct the gas inwards whereas in the Rayleigh pads design, the pockets centralize the gas to raise its pressure. Sealing dam at the inner diameter in both designs is used to restrict the flow leakage. The grooves design evolved with time in pursuit of optimum sealing performance. Tibos et al. [2] numerically analyzed the FRS with various types of grooves namely, wedge/tilted wedge, Rayleigh step, inclined, and herringbone grooves. FRS with the Rayleigh step groove was found to have the maximum combined hydrostatic and hydrodynamic load capacity. Jung et al. [15] recently reported the experimental leakage performance of the FRS with seal pads with wedge-type grooves. The authors used both static and dynamic rigs to test the seal. The study also tested the labyrinth and the brush seals of the equivalent dimensions on the same rigs and compared the performance with the FRS. FRS demonstrated significantly lower leakage compared to the labyrinth and the brush seals.
Other researches about the FRS include the work of Trivedi et al. [16] which focused on the film stiffness capability of the hydrostatic FRS. Similarly, Guardino et al. [17] presented a numerical study on the effects of the surface roughness on the lift force and the film stiffness of the FRS.
Published researches about the FRS mainly focused on its leakage performance. However information about one of the fundamental characteristic of the FRS i.e., the levitation of the pads and the consequent generation of the film thickness is scarce. This paper explores the levitation of the pads of the hydrodynamic FRS with wedge-type grooves operating under different rotor speeds. In addition, the effects of the circumferential location of the pads on their levitation is investigated.
2. Description of FRS
Figure 2 shows the schematic view of (a) the FRS and (b) a single segment of the FRS with the nomenclature. FRS produces hydrodynamic forces by the virtue of the grooves on its pads’ surface and the journal’s rotation which compress the springs at the back of the seal pad and thus a film gap generates between the rotating and the non-rotating parts. As shown in the detailed view of the seal pad, the grooves of the FRS in this study are of the wedge type same as those in Ref. [15]. For the testing purposes, the pads of each segment of the FRS are nomenclated in the clockwise direction relative to the displacement sensor which is assumed as the reference point. Currently, a set of four segments combines to make a complete seal. Although each segment of the tested seal design typically contains two pads, however, one pad is removed from each segment for the smooth testing procedures. The radial deflection of the springs due to the hydrodynamic forces away from the rotor’s surface quantifies the levitation of the pads. Note that the levitation is identical to the film thickness between the rotor and the seal pad.
3. Experimental Method for Estimation of FRS’s Pad Levitation
3.1. Description of the Test Rig
Figure 3 shows the (a) schematic of the test rig designed for testing the FRS, and (b) the photograph of the test rig. A high speed motor with a maximum speed limit of 42,000 rpm drives the rotor attached to it through the coupling on one end, whereas, a disk is attached to the rotor at the other end. The test FRS encloses the disk. A couple of the angular contact ball bearings support the rotor at both ends. Note that the current study focuses on the levitation performance (film thickness) of the FRS and the leakage performance is not covered. Four eddy current gap sensors installed 90 degrees apart at the back of each pad of the FRS measures the deflection of the respective pads. Another pair of gap sensors installed 90 degrees apart near the disk measures the rotor’s displacement. In addition, a non-contact laser sensor is used to measure the rotor speed which gets the readings through a laser light reflection from the reflective tape attached to the coupling.
Table 1 shows the geometry parameters of the FRS and the operating conditions. The rotor diameter and the seal pad diameter are equal to 140 mm whereas the axial length of the seal pad is equal to 13 mm.
4. Results
4.1. Measurements of Pad Levitation
The pads of the FRS levitate under the influence of the hydrodynamic forces on the surface of the seal pad. The levitation of the pads of the FRS are estimated by monitoring the DC level of the time signal obtained through the gap sensors installed at the back of each pad. Figure 4 depicts the concept of the DC level.
Figure 5 shows the DC level of the time signal measured by the gap sensors installed near by the back of each pad. The DC level increases at first for all the pads with the increasing rotor speed indicating pad's displacement towards the rotor. This may physically seems absurd as the rotor diameter and seal diameter of curvature are the same, however, it is due to the springs at the back of the pads which might have deflected with different magnitudes after the initial installation. The pad’s displacement towards the rotor thus in fact indicates the adjustment of the springs’ deflections through the tilting motion of the pad rather than the actual radial displacement. The DC level remains unchanged for the next few higher rotor speeds and starts decreasing by further increasing the rotor speed which indicates the pad moving away from the rotor or the occurrence of the levitation phenomena. The levitation of the pad increases with increasing rotor speed due to the increased hydrodynamic pressure and forces. The rotor speed after reaching 8 krpm is decreased and the data is obtained again to check the repeatability of the tests. The pads 1 and 3 rendered nearly similar levitation magnitudes. Pad 2 which is located at the bottom experienced the largest amount of the levitation as the hydrodynamic force and the gravitational force due to the pad’s weight act along the same direction. In contrast, pad 4 located opposite to pad 2 had the smallest levitation due to the opposite direction of the hydrodynamic and the weight forces.
4.2. Pad Levitation vs. Circumferential Location
It can be observed from Figure 5 that the levitation of the seal pads or the consequent film thickness is a strong function of their circumferential locations. Therefore a series of tests were performed to estimate the levitation of the pad at various circumferential locations. Figure 6 summarizes the configurations of the seal pads for the tests performed to investigate the circumferential location of the pads on their levitation performance. The measurements were taken at eight different configurations obtained by rotating the seal housing in the anticlockwise direction with an interval of 45° between 0° and 360°. Thus each pad levitation was measured with its center located at 0°, 45°, 90°, 135°, 180°, 225°, 270°, and 315°.
Figure 7 depicts the effects of the circumferential location of the seal pad on its levitation performance in terms of the DC level of the time signal. The DC level of the time signal significantly changes with the circumferential location of the seal pad. The DC level for all the seal pads drops highest when their location is between 135° and 225° i.e., the bottom part of the seal housing and vice a versa for the locations of 0°, 45°, and 315° i.e., the upper region of the housing.
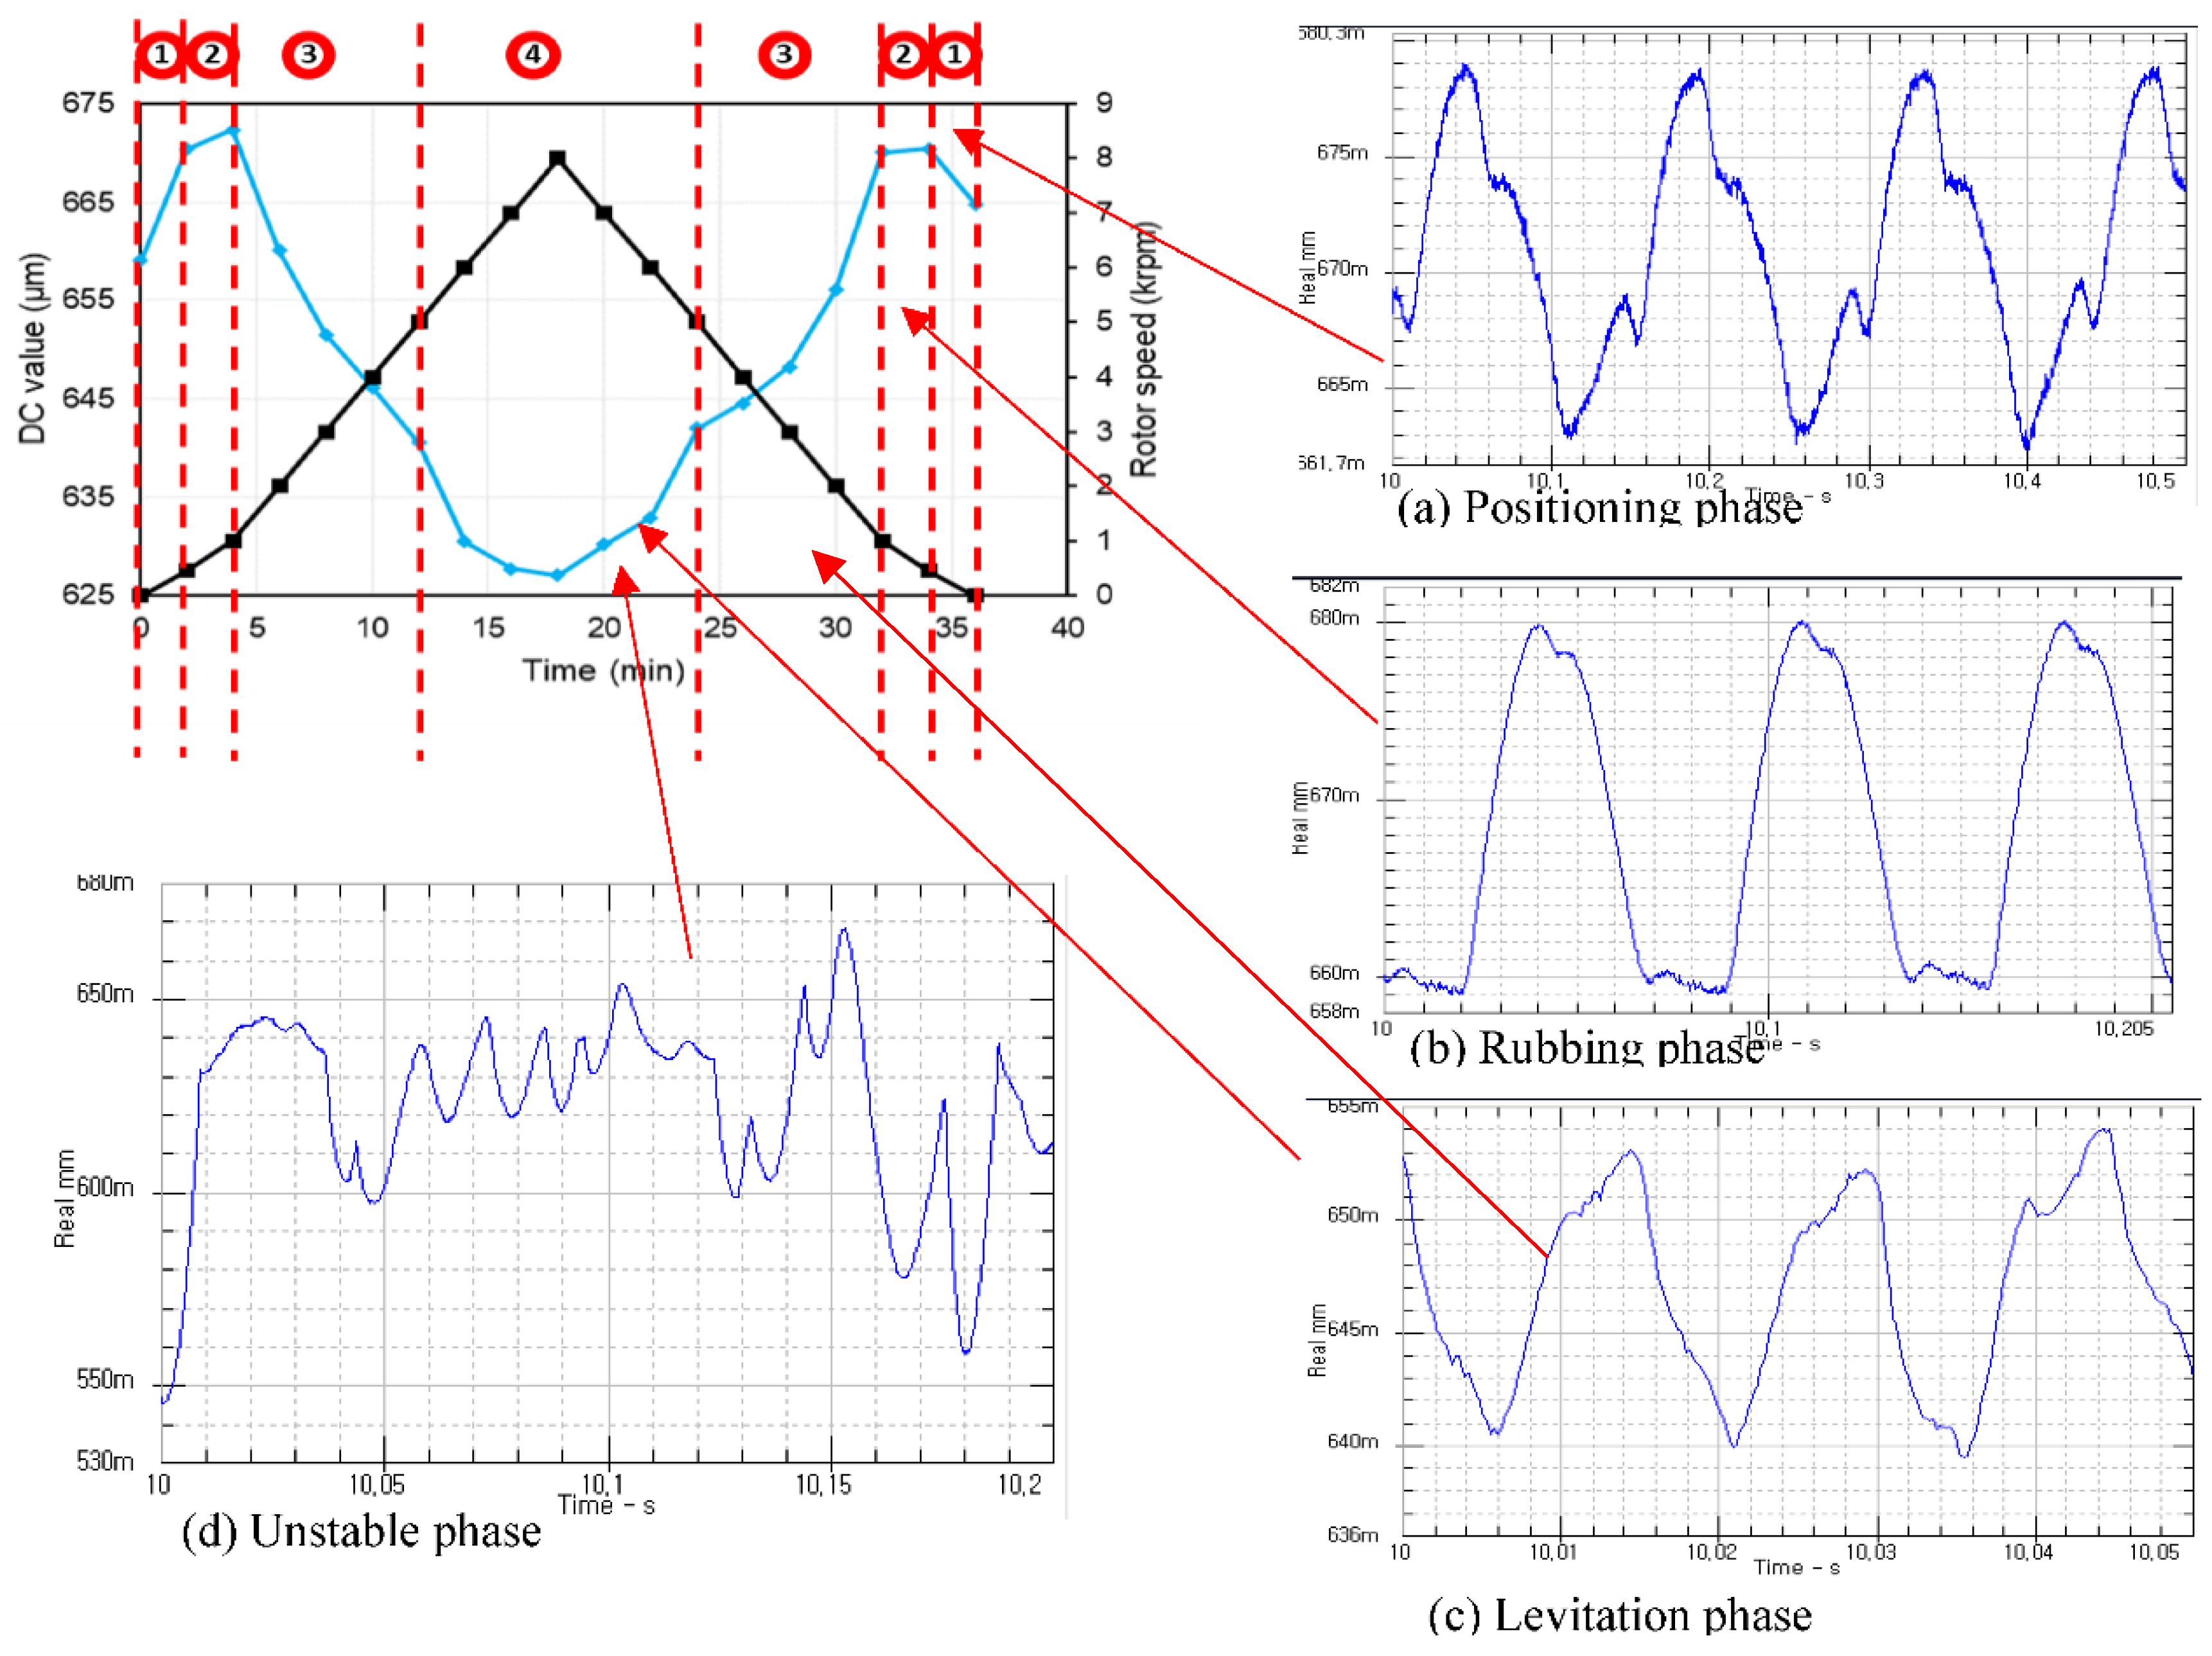
Both Figure 5 and Figure 7 confirm that the DC level of the time signal (indicating levitation) of the seal pads follow a general trend against the varying rotor speeds, i.e., with increasing rotor speed, DC level increases at first, remains constant for some speeds, and then starts dropping with further increase is speed. Based on these results and after monitoring the time signals shown in Figure 12 in the Appendix, the behavior of the seal pads can be divided into four phases as shown in Figure 8. A brief description of the four phases can be given as follows,
- (1)
- Positioning phase: A phase where the seal pad tries to find its position as the two springs at the back of the pad after assembling may get compressed or tensed or one of them is compressed and the other is tensed due to misalignment or any other reason, and thus takes time and to adjust or finds its original position where it should be in even contact with the rotor.
- (2)
- Rubbing phase: The seal pad's displacement remains unchanged for a range of rotor speeds after it finds its real position which is in fact its even contact with the rotor disk. During this phase the pad in in constant contact with the rotor as its displacement remains unchanged. The time signal during this phase has no lower half indicating rubbing of the seal pads against the rotor as shown in the Appendix.
- (3)
- Levitation phase: FRS pads rub against the rotor disk until the pressure force becomes high enough to elevate the pad. The true levitation starts at this point. The time signal during this phase resembles a sinusoidal curve.
- (4)
- Unstable phase: With further increase in the rotor speed, a point comes where the time signal disrupts and noise can be observed indicating the start of the unstable phase. The unstable phase lasts until the largest rotor speed. Although the time signal has noise, its DC level can still be observed indicating pad levitation.
Note that the circumferential location of the seal pad significantly affects the onset and termination rotor speed of each phase, thus differs for each pad.
It can be observed from Figure 5, Figure 6, Figure 7 and Figure 8 that the actual levitation begins after the rotor speed reaches a certain value which serves as a reference point for the calculation of the actual levitation. Note that the onset speed of the levitation differs for each pad. For instance, for the seal pads arranged as configuration 1 in Figure 6, the onset speed of the levitation phase for pads 1, 2, 3, and 4 were, 3 krpm, 1 krpm, 4 krpm, and 3 krpm, respectively.
Figure 9 shows the magnitude of the levitation of the seal pads for increasing rotor speeds. Although the unstable phase have distorted time signal, however, the levitation of the pad occurs in that region too and can be calculated by monitoring the DC level of the time signal from the gap sensors at the back of each pad. The levitation increases with the circumferential angle of the pad’s center until it reaches its peak at 180° in general. It starts decreasing with further increase in the circumferential angle. The levitation pads levitated the most due to the action of the gravitational (due to the mass of the pad) and the levitation forces in the same direction when located in the bottom region of the seal housing, i.e., the circumferential angle range of 135°~225°. In contrast, the gravitational and the levitation forces act opposite to each other when the seal pads are located in the upper region of the seal housing, i.e., the circumferential angles of the pad’s center equal to 0°, 45°, and 315°, thus render the least levitation. Additionally at the lowest rotor speed i.e., 1 krpm, the pads only levitate when they are located in the lower region of the seal housing.
4.3. Test Data Compared with Theory
The experimental levitation of the pad is compared with a theoretical model predictions. The analytical model is based on the 1-D Reynolds equation that governs the pressure distribution on the pad’s surface. The film thickness was modeled according to the measured profile (using Surfcorder SE 3500) of the seal pad groove as shown in Figure 10. Integrating the pressure over the pad surface gives the pressure force which is balanced with the restoring force of the springs at the back of each pad to give equilibrium position. Film thickness over the pad surface calculated at the equilibrium position is its levitation.
Figure 11 compares the pad levitation plotted against the circumferential coordinate with the theoretical predictions at the rotor speed of 7 krpm. The theoretical predictions have similar trend as those of the measurement data with the maximum levitation for the pads located at the bottom and vice a versa for the pads located at the top. The discrepancies between theoretical and measured data particularly for the pads located in the upper region, may be attributed to the manufacturing errors in the groove and land areas as shown in Figure 10. Additionally, the maximum levitation from theoretical predictions shows close agreement with the measured data.
5. Conclusions
One of the core performance characteristics of the FRS is the film thickness between the rotor and the seal surfaces generated as a result of the seal pads’ levitation under the hydrodynamic forces. This study developed an experimental rig to estimate the levitation of the pads of the FRS. The experiments were performed at the rotor speeds up to 8 krpm. In addition, the study investigated the effects of the circumferential location of the seal pads inside the seal housing on their levitation performance. Following conclusions can be drawn from the investigations.
All of the seal pads followed a general trend with increasing rotor speeds and along with the time signal, the behavior could be divided into four phases, namely, the positioning phase, the rubbing phase, the levitation phase, and the unstable phase. Seal pad finds its original position during the initial speeds represented by positioning phase. It rubs against the rotor surface and stops moving in radial direction in the rubbing phase until a certain rotor speed and then starts moving radially opposite to the rotor with a clean time signal representing levitation phase. The time signal becomes distorted at higher rotor speeds indicating unstable phase due to pad fluttering, however, pad radial motion does not cease and increases with increasing rotor speed.
Seal pads rendered the largest levitation when their centers were located in the lower part of the seal housing and vice a versa when they were located at the upper region. This behavior is attributed to the fact that when located at the bottom side of the seal housing, the levitation and the gravitational forces act along the same direction and vice a versa in the upper region. Moreover, a 1-D Reynolds equation based theoretical model predicted the maximum levitation in close agreement with the test data.
Author Contributions
Conceptualization, S.M.M and Y.C.K.; methodology, S.M.M and Y.C.K.; formal analysis, S.M.M and Y.C.K.; investigation, S.M.M and Y.C.K.; resources, Y.C.K.; data curation, S.M.M and E.K.; writing—original draft preparation, S.M.M.; writing—review and editing, Y.C.K.; supervision, Y.C.K.; project administration, S.M.M, Y.C.K. and E.K.; funding acquisition, Y.C.K. All authors have read and agreed to the published version of the manuscript.
Funding
This research was funded by Korea Energy Technology Evaluation and Planning (KETEP) for the research project titled as, “Localization of film riding type seal to improve the efficiency of the secondary air system for large gas turbines and technology development to strengthen supply chain capabilities.”
Data Availability Statement
The authors can provide the presented data in this paper on request through email.
Conflicts of Interest
The authors declare no conflicts of interest. The funders had no role in the design of the study; in the collection, analyses, or interpretation of data; in the writing of the manuscript; or in the decision to publish the results.
Appendix A
Figure 12.
Time signal of the seal pad behavior in (a) Positioning phase, (b) Rubbing phase, (c) Levitation phase, and (d) Unstable phase.
Figure 12.
Time signal of the seal pad behavior in (a) Positioning phase, (b) Rubbing phase, (c) Levitation phase, and (d) Unstable phase.
References
- Black, H.F. Effects of Hydraulic Forces in Annular Pressure Seals on the Vibrations of Centrifugal Pump Rotors. J. Mech. Eng. Sci. 1969, 11, 206–213. [Google Scholar] [CrossRef]
- Tibos, S.M.; Teixeira, J.A.; Georgakis, C. Investigation of Effective Groove Types for a Film Riding Seal. J. Eng. Gas Turbines Power 2017, 139, 1–8. [Google Scholar] [CrossRef]
- Chupp, R.E.; Hendricks, R.C.; Lattime, S.B.; Steinetz, B.M. Sealing in Turbomachinery. J. Propuls. Power 2006, 22, 313–349. [Google Scholar] [CrossRef]
- Childs, D.W.; McLean, J.E.; Zhang, M.; Arthur, S.P. Rotordynamic Performance of a Negative-Swirl Brake for a Tooth-on-Stator Labyrinth Seal. J. Eng. Gas Turbines Power 2016, 138, 1–8. [Google Scholar] [CrossRef]
- Munson, J.; Pecht, G. Development of Film Riding Face Seals for a Gas Turbine Engine. Tribol. Trans. 1992, 35, 65–70. [Google Scholar] [CrossRef]
- Andres, L.S.; Ashton, Z. Comparison of Leakage Performance in Three Types of Gas Annular Seals Operating at a High Temperature (300°c). Tribol. Trans. 2010, 53, 463–471. [Google Scholar] [CrossRef]
- Outriba, B.; Hendrick, P. Influence of Geometrical Parameters on the Performance of Brush Seals for Aero-Engines Bearing Chambers. In Proceedings of the Proceedings of ASME Turbo Expo; 2015; pp. 1–13. [Google Scholar]
- Bird, J.; Keogh, P.S.; Sangan, C.M.; Bowsher, A.; Crudgington, P.; Scobie, J. Dynamic Characterization of an Adaptive Film-Riding Seal. J. Eng. Gas Turbines Power 2023, 146, 1–49. [Google Scholar] [CrossRef]
- Lynwander, P. Development of Helicopter Engine Seals; Cleveland Ohio, 1973. [Google Scholar]
- Lynwander, P. Development of Self-Acting Seals for Helicopter Engines.; Cleveland, Ohio, 1975. [Google Scholar]
- John H., M. Testing of a High Performance Compressor Discharge Seal. In Proceedings of the AIAA/SAE/ASME/ASEE 29th Joint Propulsion Conference and Exhibit; 1993. [Google Scholar]
- Steinetz, B.M.; Hendricks, R.C.; Munson, J. Advanced Seal Technology Role in Meeting Next Generation. In Proceedings of the RTO AVT Symposium on “Design Principles and Methods for Aircraft Gas Turbine Engines”, Toulouse; 1998; pp. 1–13. [Google Scholar]
- Sayma, A.I.; Bréard, C.; Vahdati, M.; Imregun, M. Aeroelasticity Analysis of Air-Riding Seals for Aero-Engine Applications. J. Tribol. 2002, 124, 607–616. [Google Scholar] [CrossRef]
- Sedy, J. Improved Performance of Film-Riding Gas Seals through Enhancement of Hydrodynamic Effects. ASLE Trans. 1980, 23, 35–44. [Google Scholar] [CrossRef]
- Jung, J.W.; Hwang, S.H.; Kim, T.H.; Kim, E.; Ha, J.W. Leakage Measurements of Labyrinth Seal, Brush Seal, and Radial Film Riding Face Seal. KSFM J. Fluid Mach. 2023, 26, 29–37. [Google Scholar] [CrossRef]
- Trivedi, D.; Bidkar, R.A.; Wolfe, C.; Zheng, X. Film-Stiffness Characterization for Supercritical CO2 Film-Riding Seals. Proc. ASME Turbo Expo 2018, 5B-2018, 1–10. [Google Scholar] [CrossRef]
- Guardino, C.; Chew, J.W.; Hills, N.J. Calculation of Surface Roughness Effects on Air-Riding Seals. J. Eng. Gas Turbines Power 2004, 126, 75–82. [Google Scholar] [CrossRef]
Figure 1.
Schematic of the film riding face seal with spiral-grooves and Rayleigh pad faces [14].
Figure 1.
Schematic of the film riding face seal with spiral-grooves and Rayleigh pad faces [14].
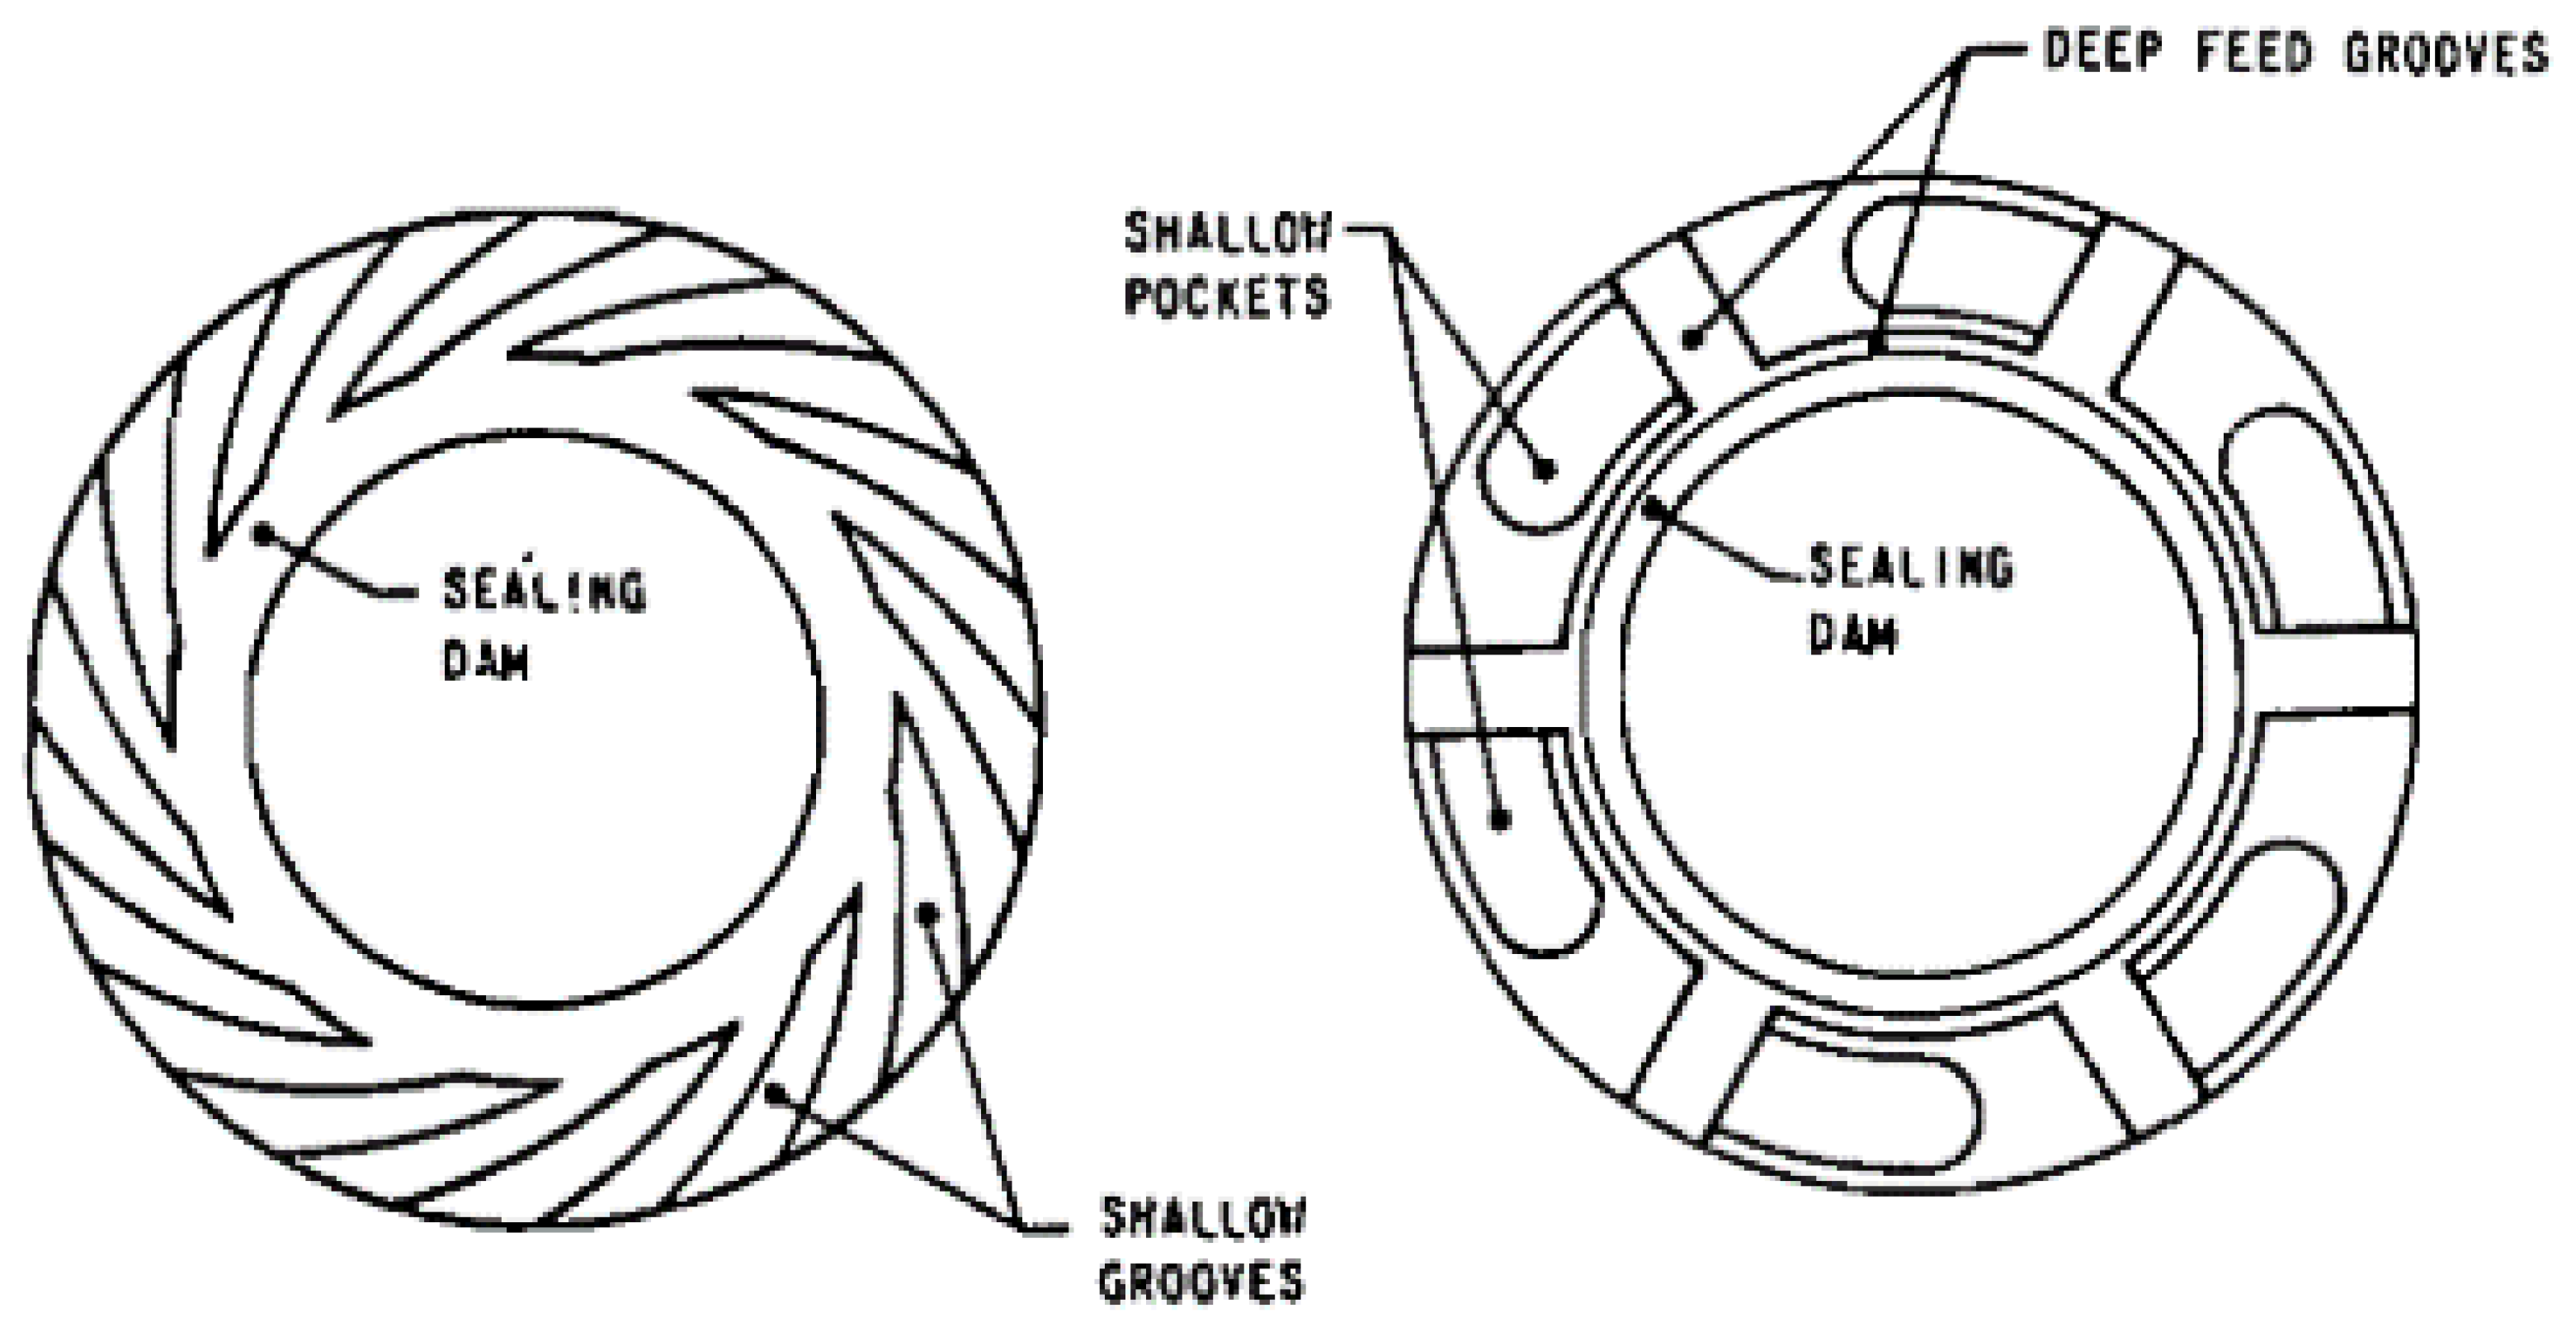
Figure 2.
Schematic and nomenclated view of (a) FRS and (b) FRS segment (Dimensions not to scale).
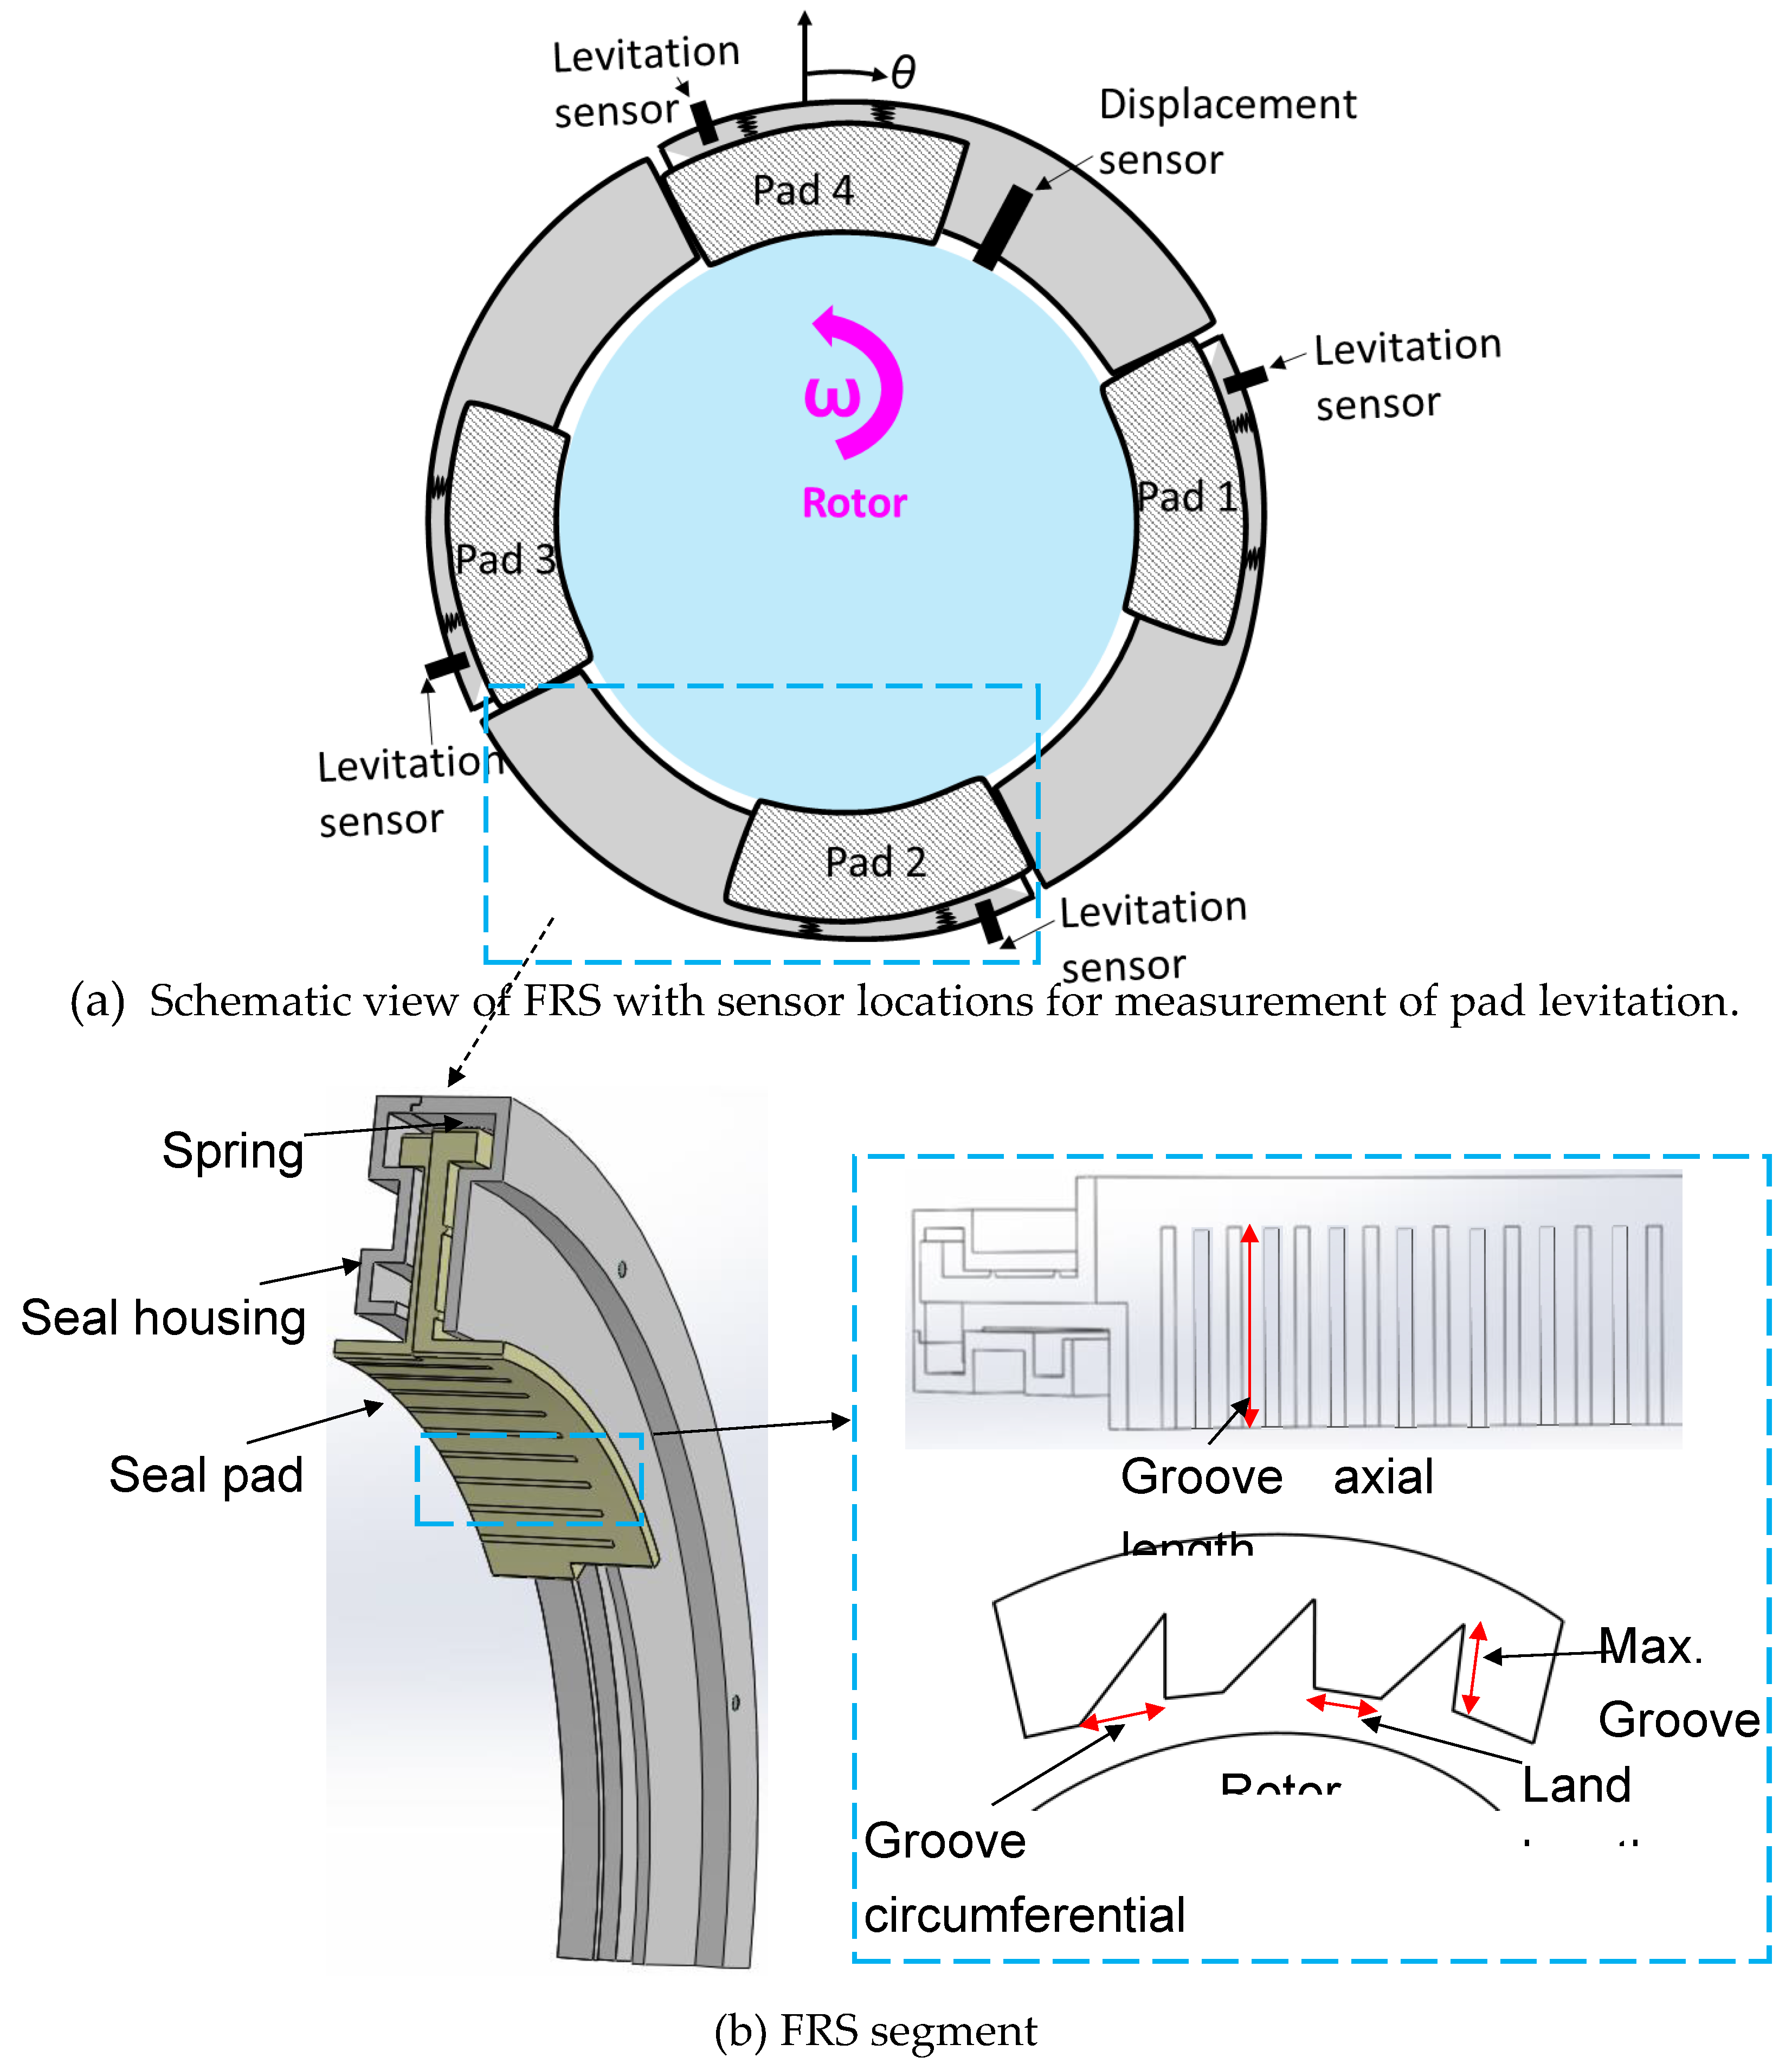
Figure 3.
Cross sectional view of the test rig, and (b) Photograph of the test rig coupled with motor.
Figure 3.
Cross sectional view of the test rig, and (b) Photograph of the test rig coupled with motor.
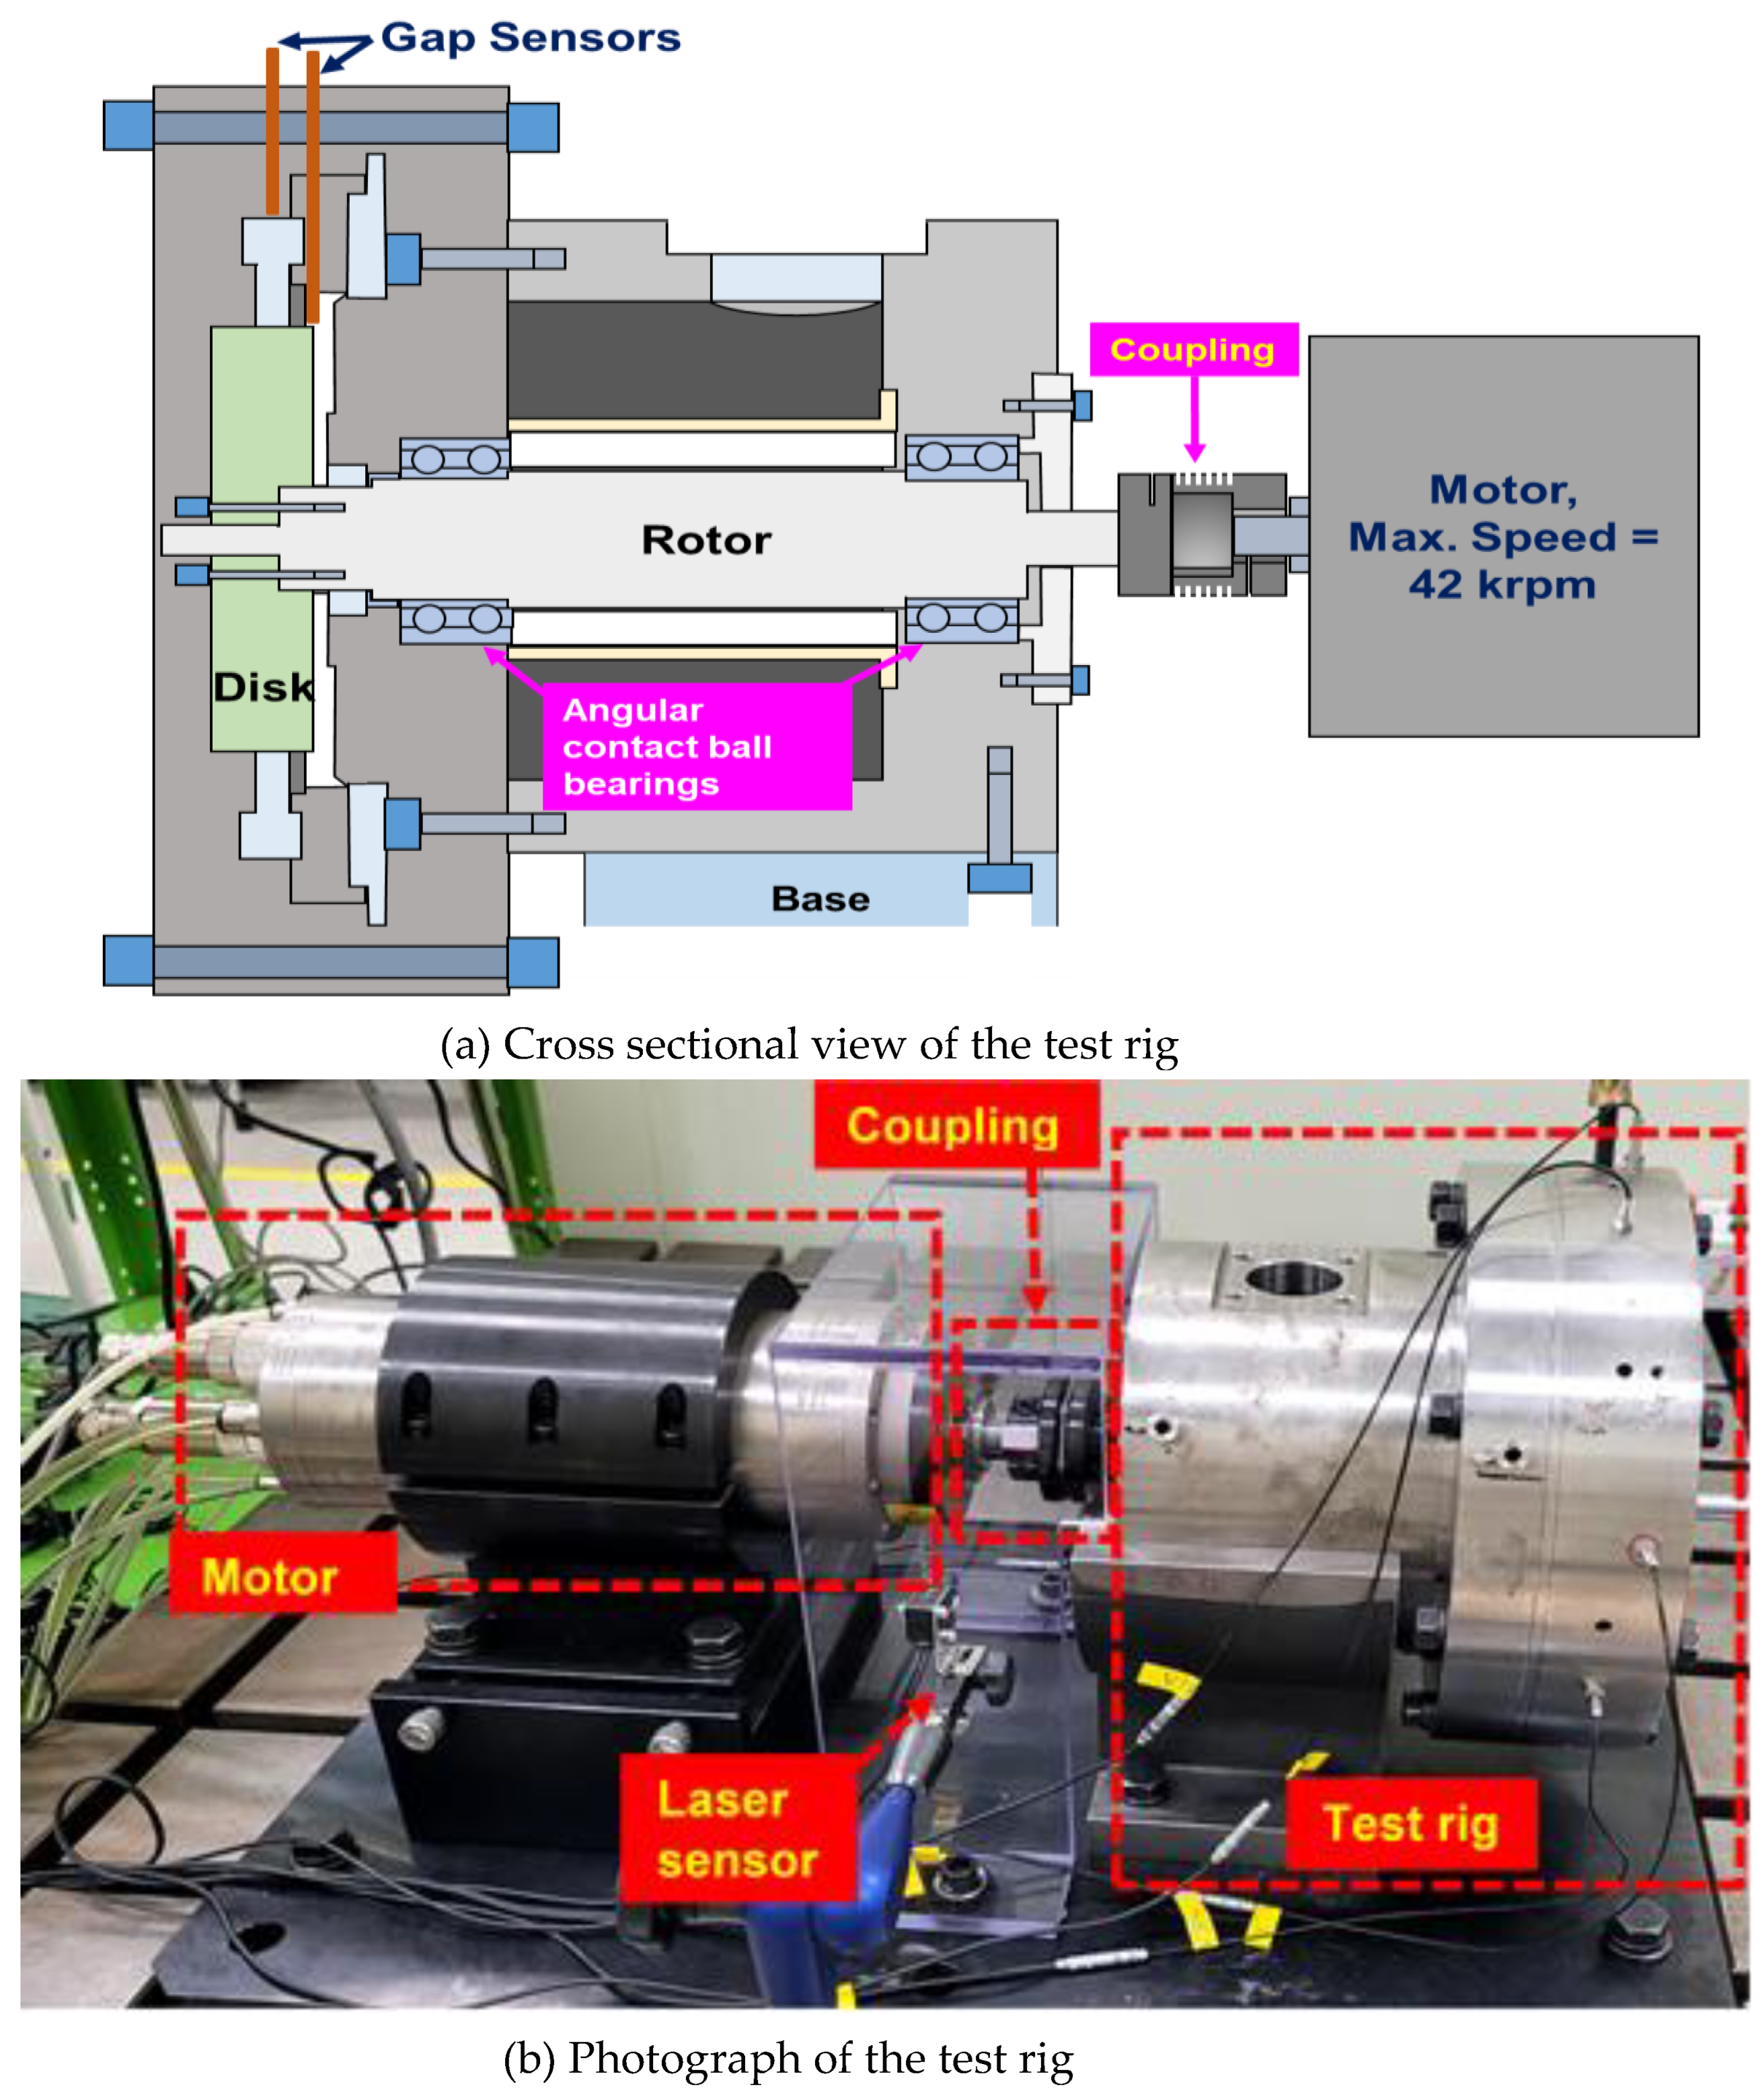
Figure 4.
Schematic of seal segment with the definition of DC level (dimensions not to scale).
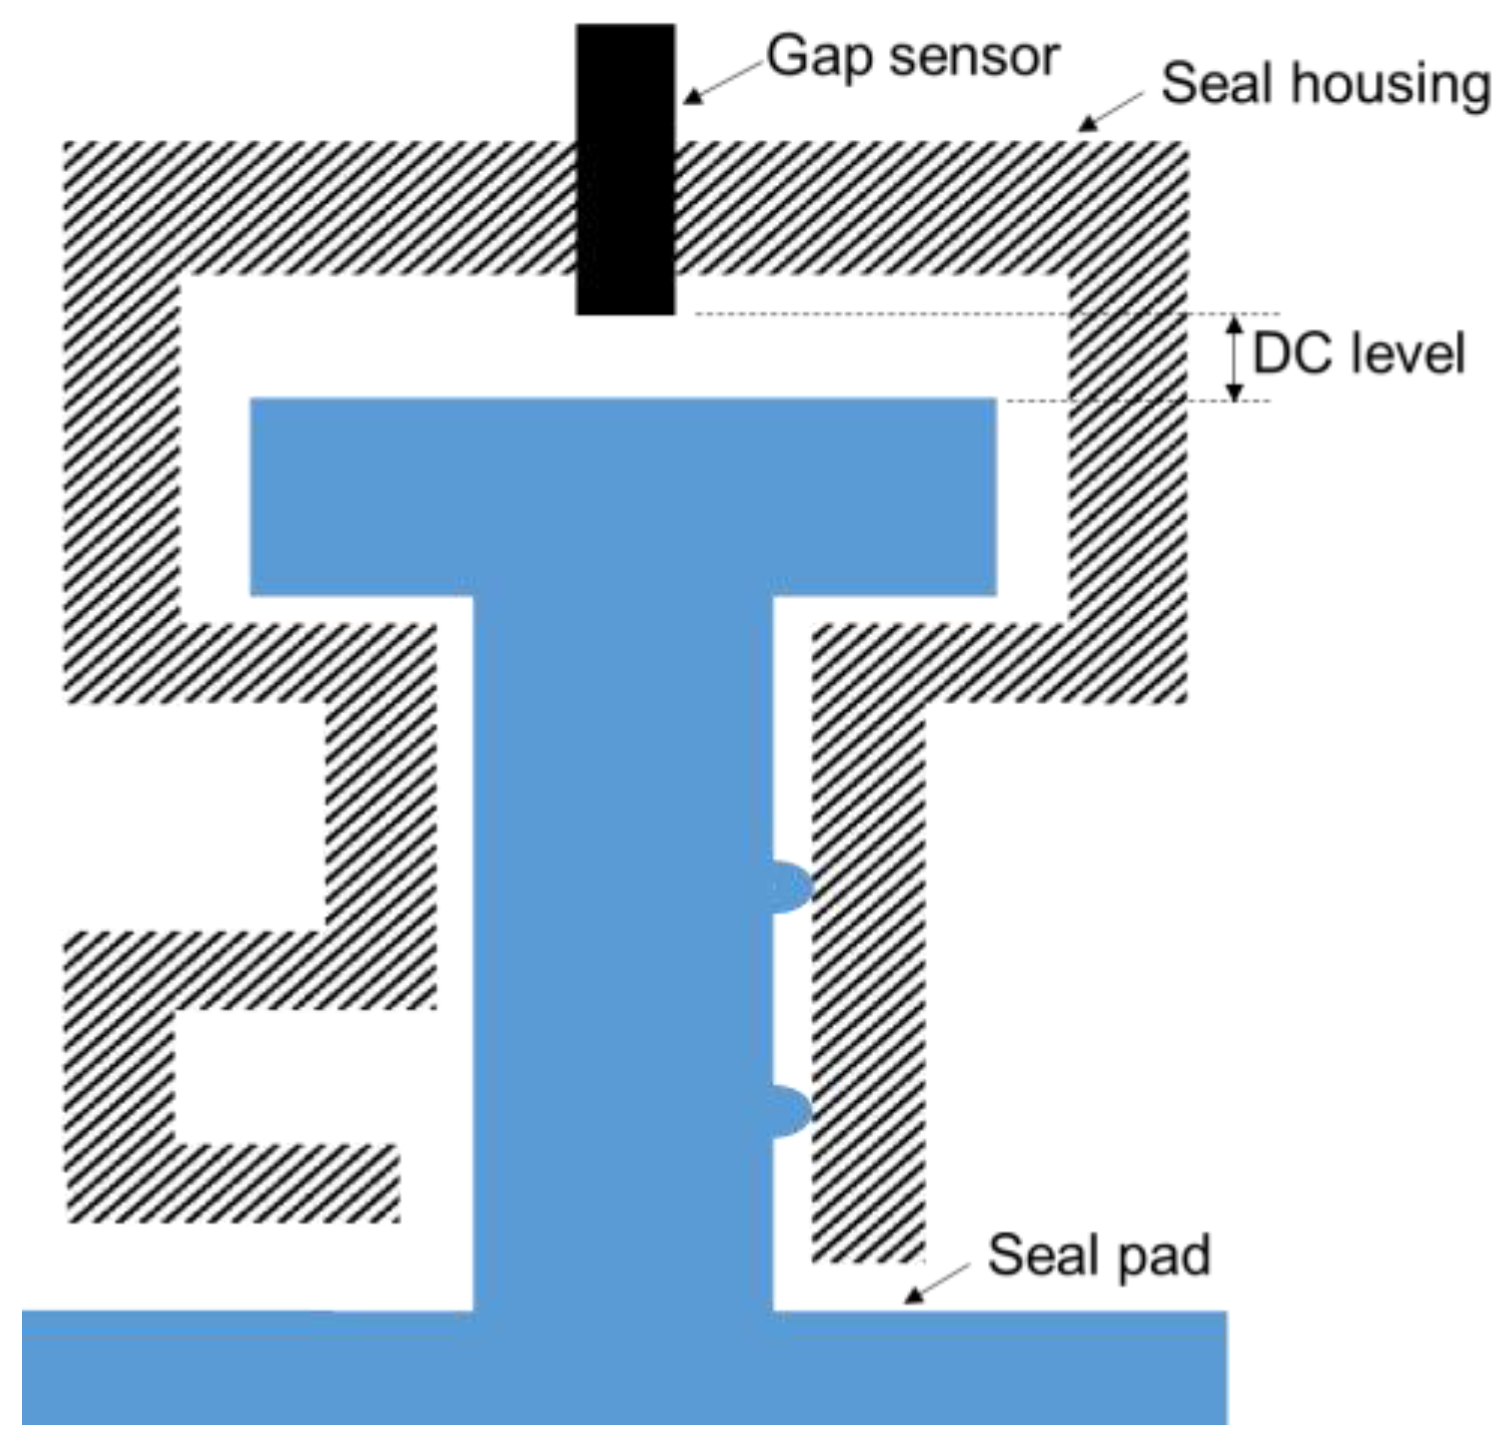
Figure 5.
DC level of time signal from displacement sensors vs. time for varying rotor speeds for (a) pad 1, (b) pad 2, (c) pad 3, and (d) pad 4.
Figure 5.
DC level of time signal from displacement sensors vs. time for varying rotor speeds for (a) pad 1, (b) pad 2, (c) pad 3, and (d) pad 4.
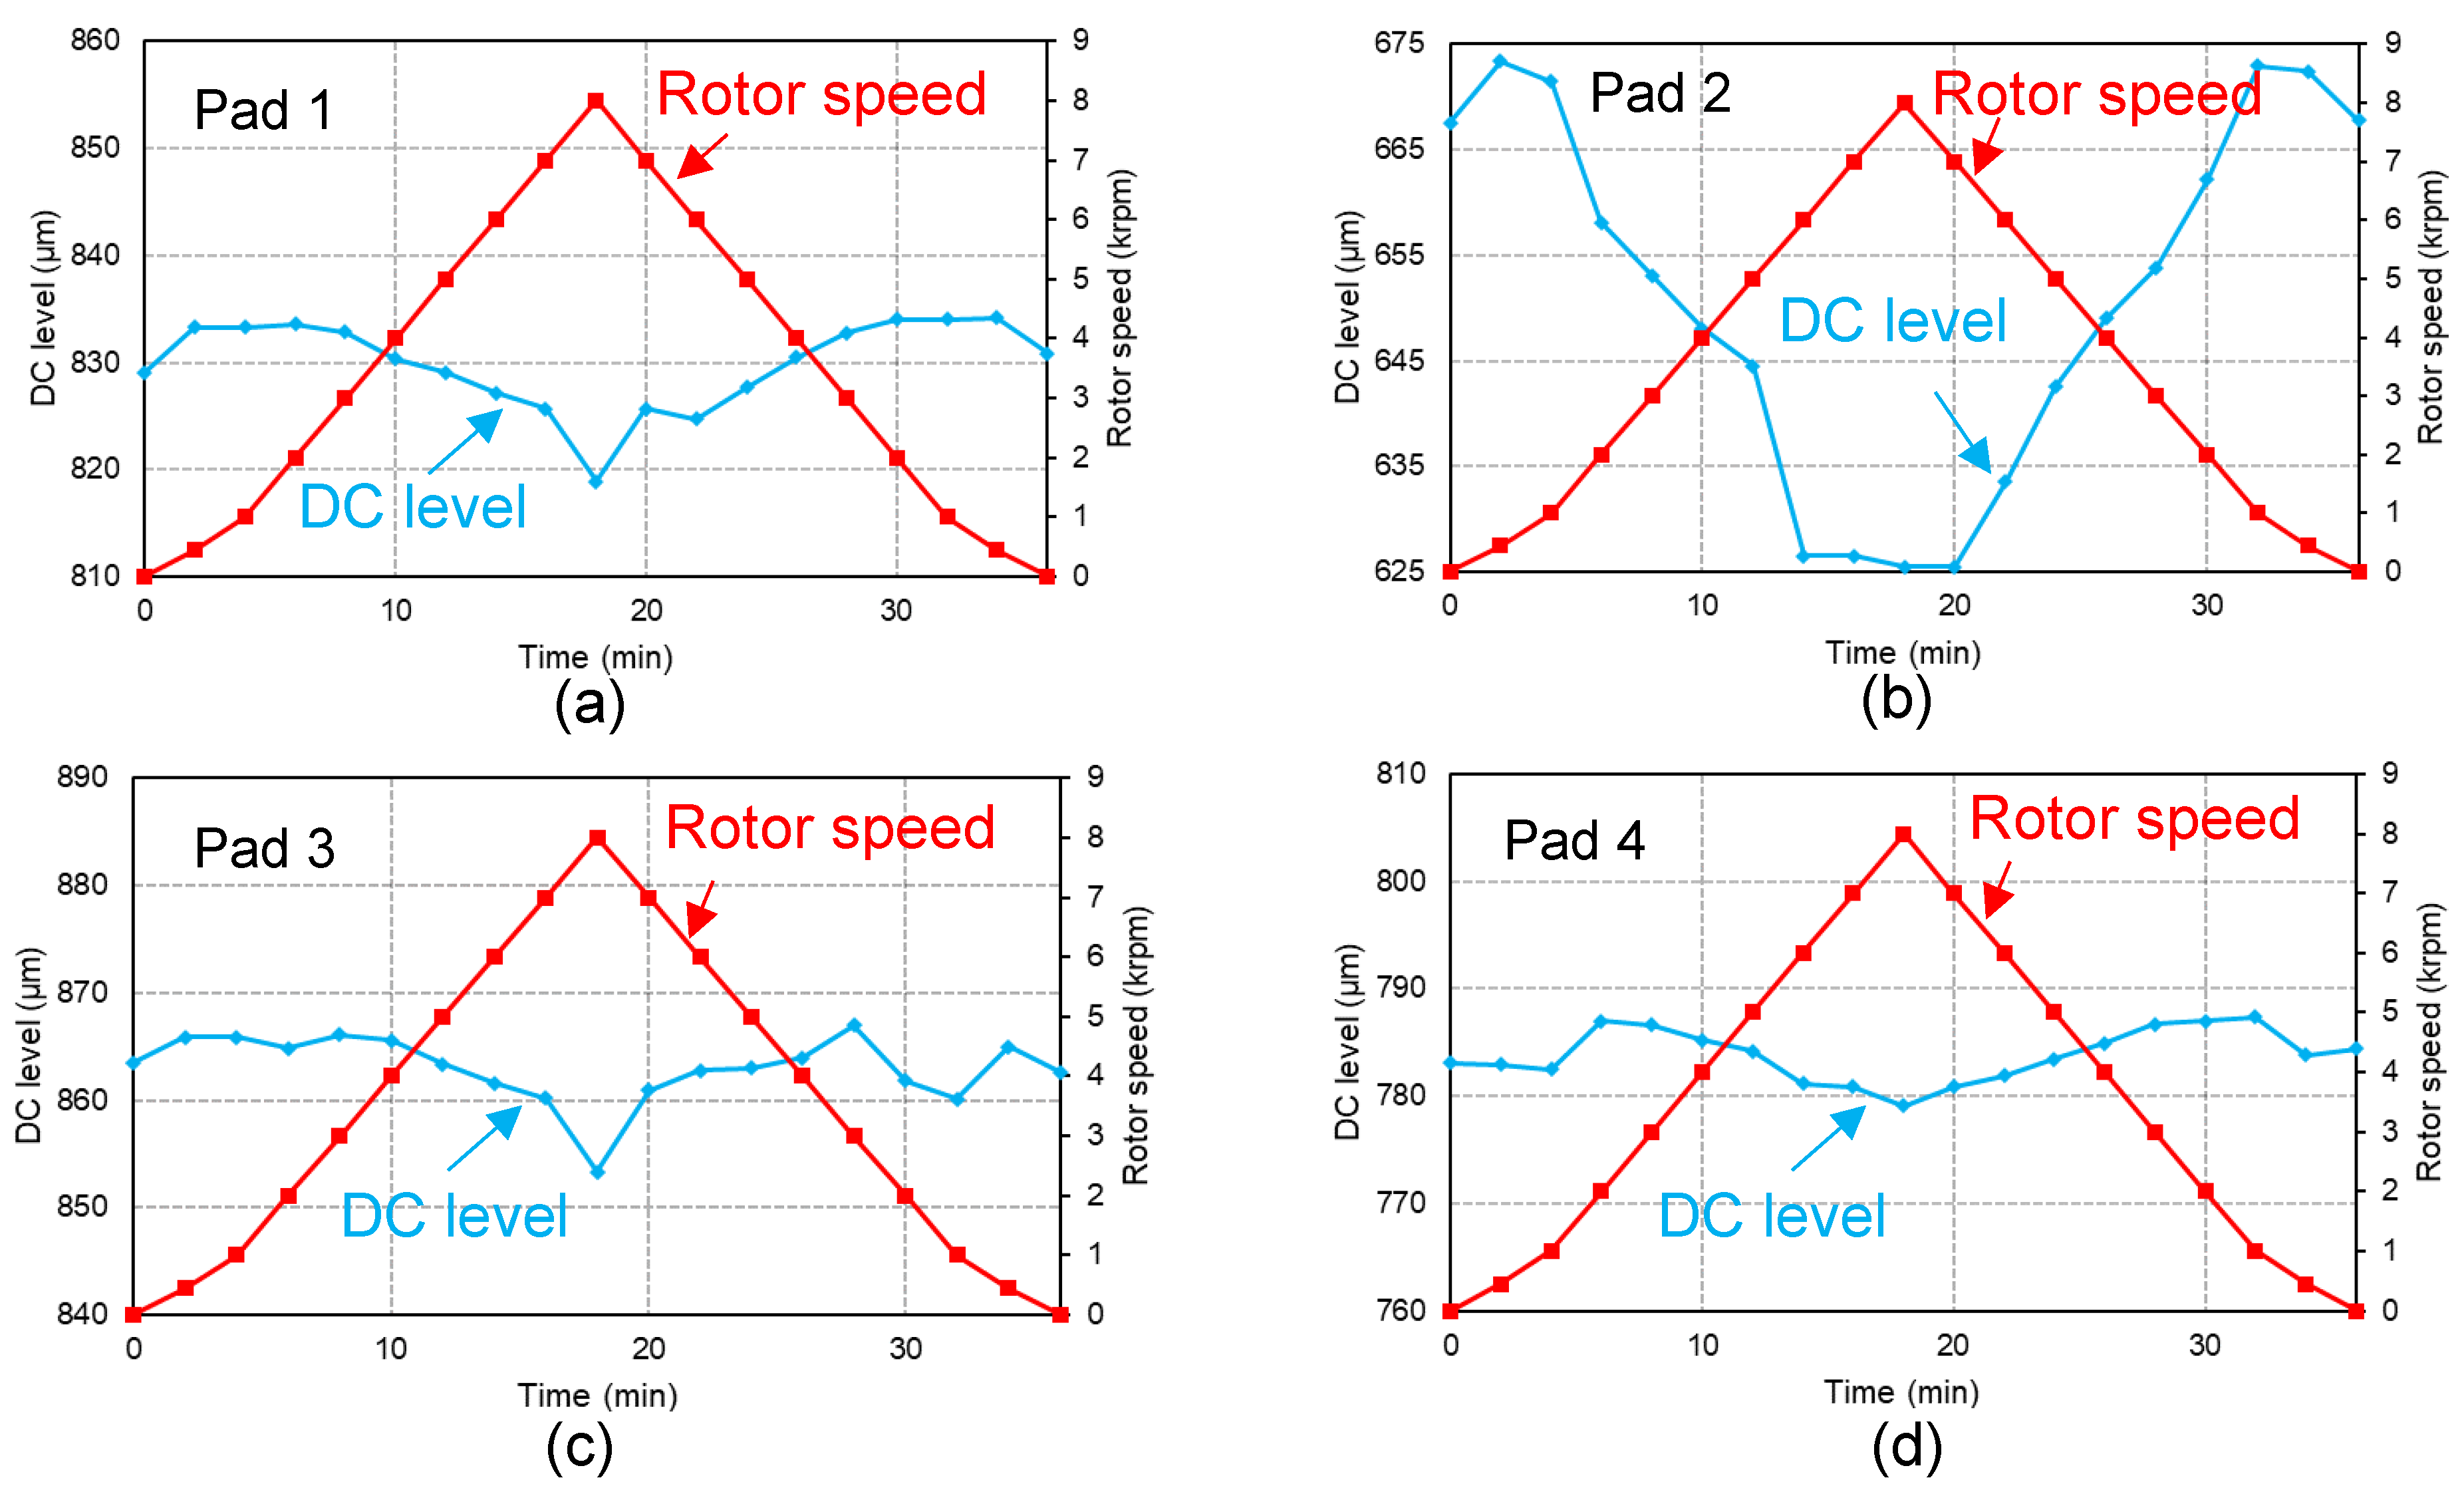
Figure 6.
Eight configurations of seal pads for the estimation of effect of circumferential location on pad levitation.
Figure 6.
Eight configurations of seal pads for the estimation of effect of circumferential location on pad levitation.
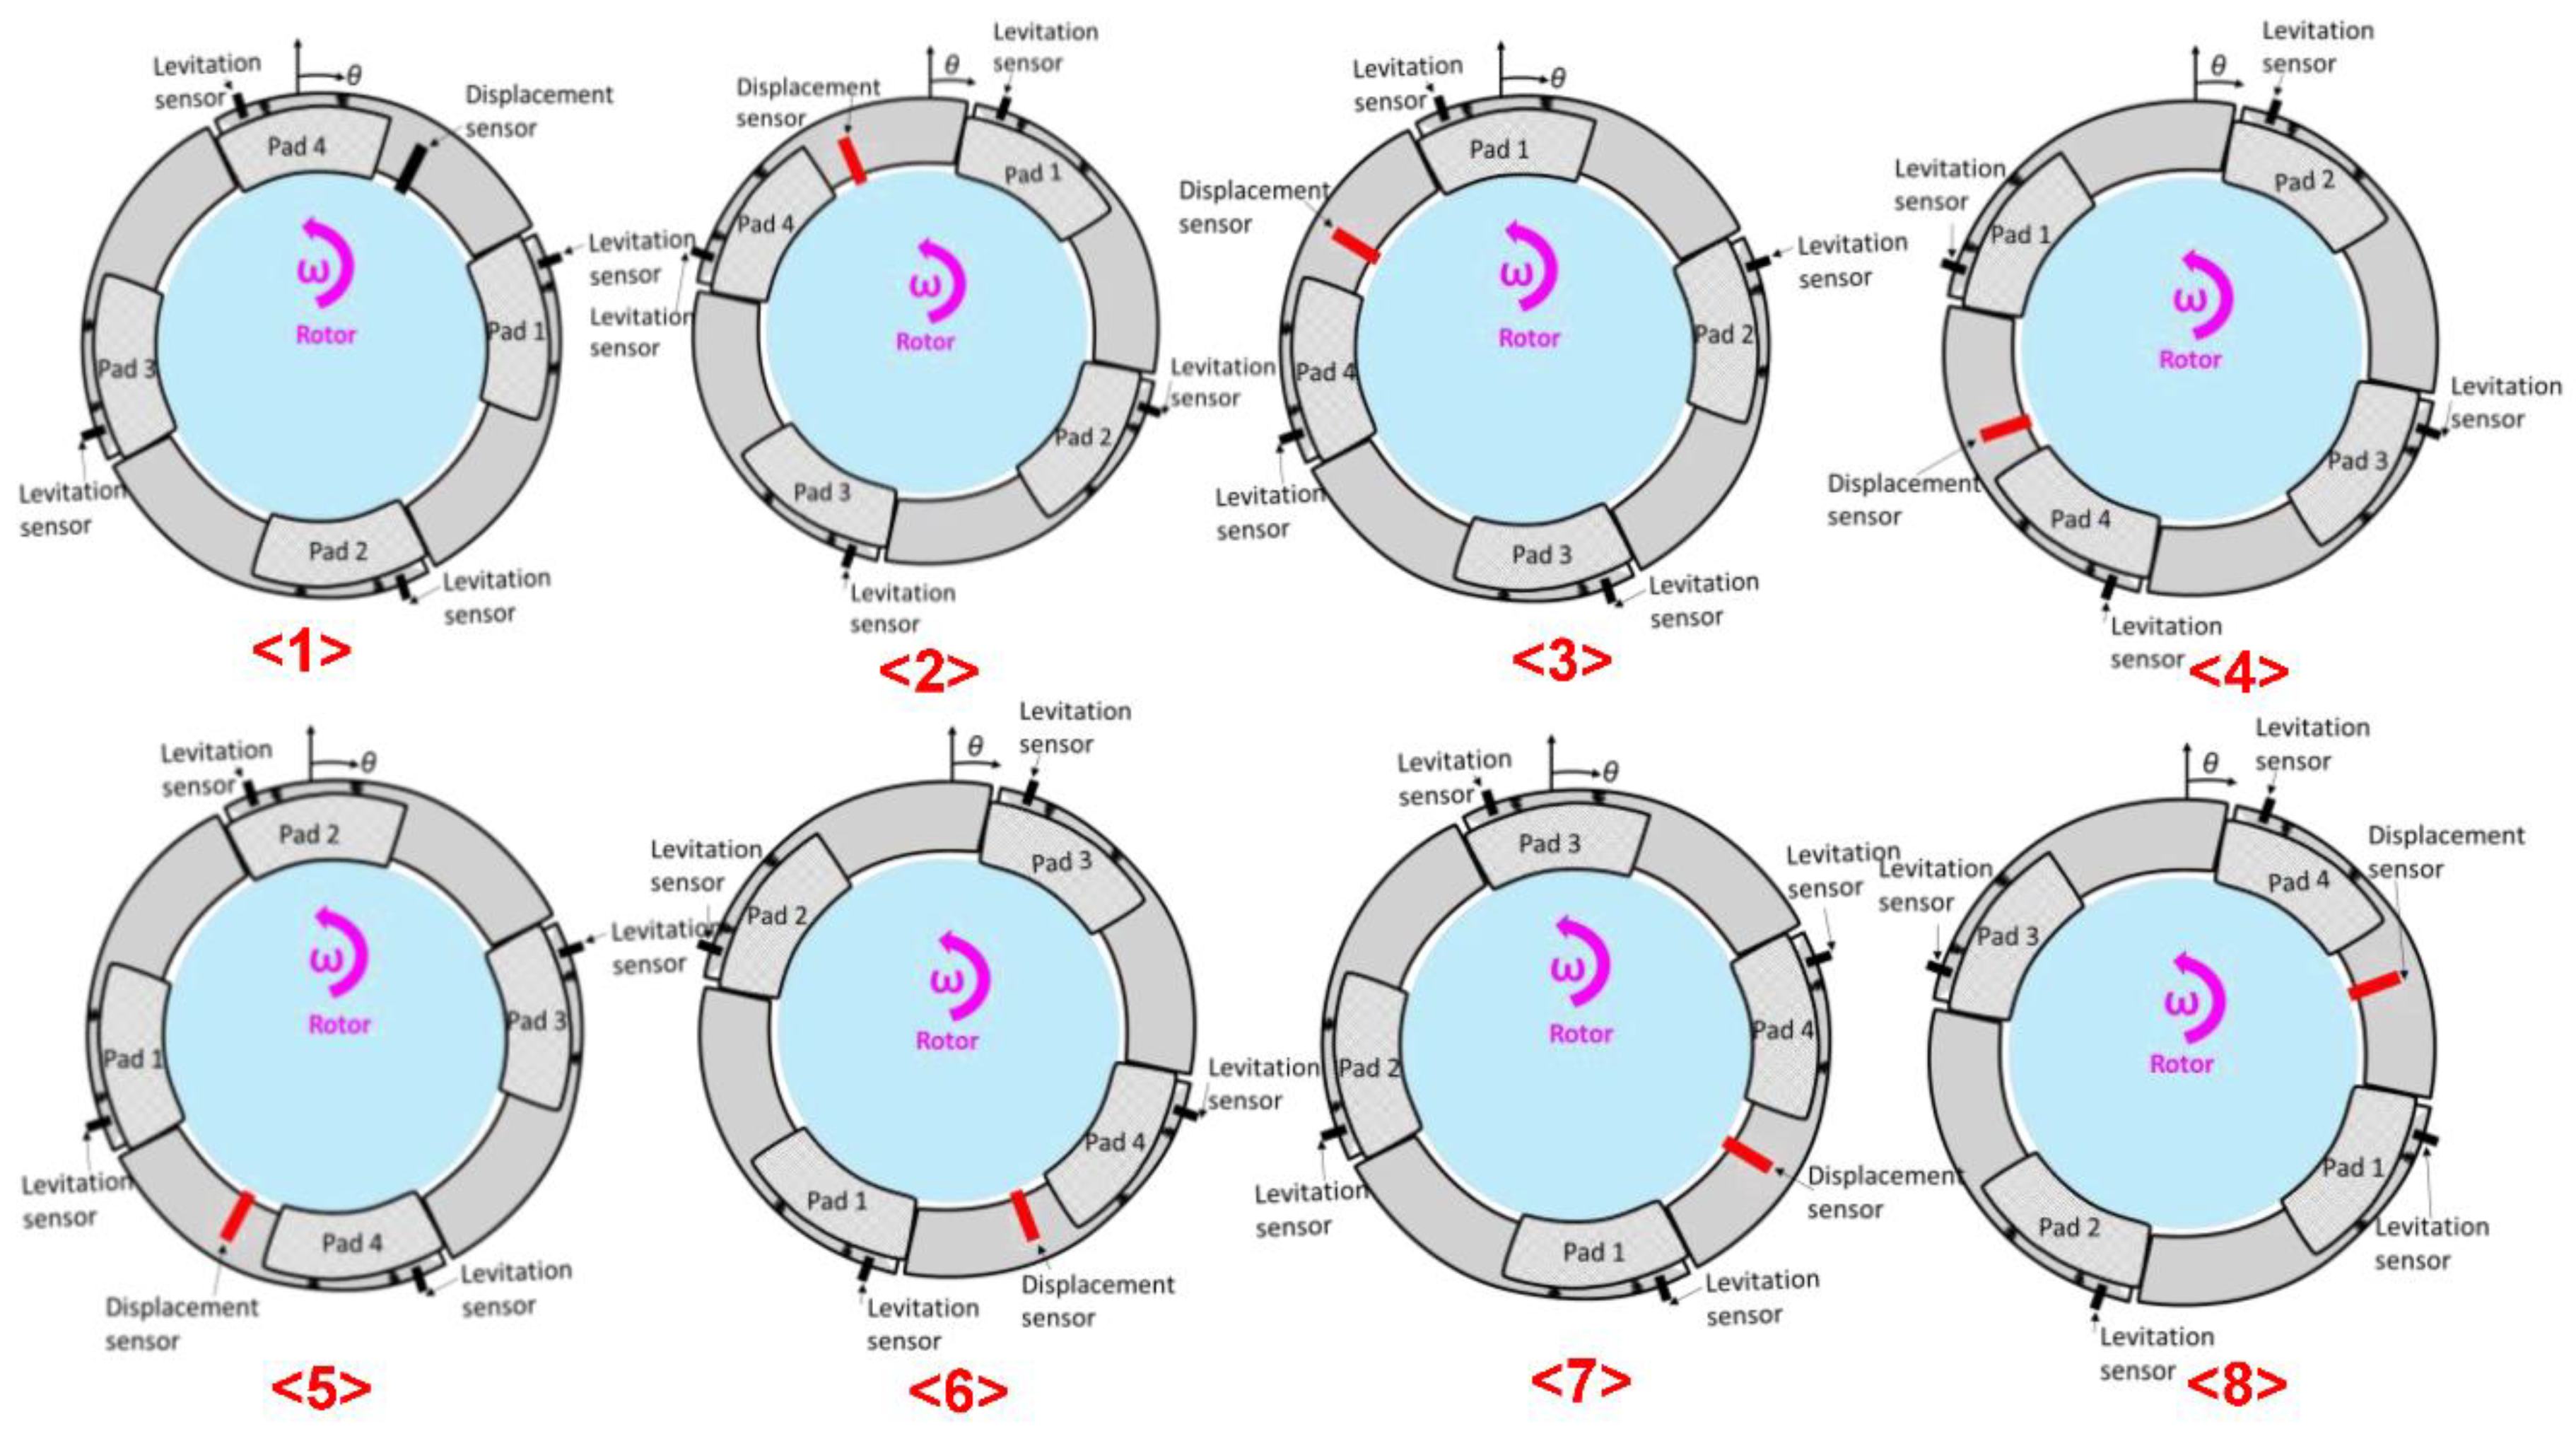
Figure 7.
DC level of time signal from displacement sensors vs. time for varying circumferential location of pad and rotor speeds.
Figure 7.
DC level of time signal from displacement sensors vs. time for varying circumferential location of pad and rotor speeds.
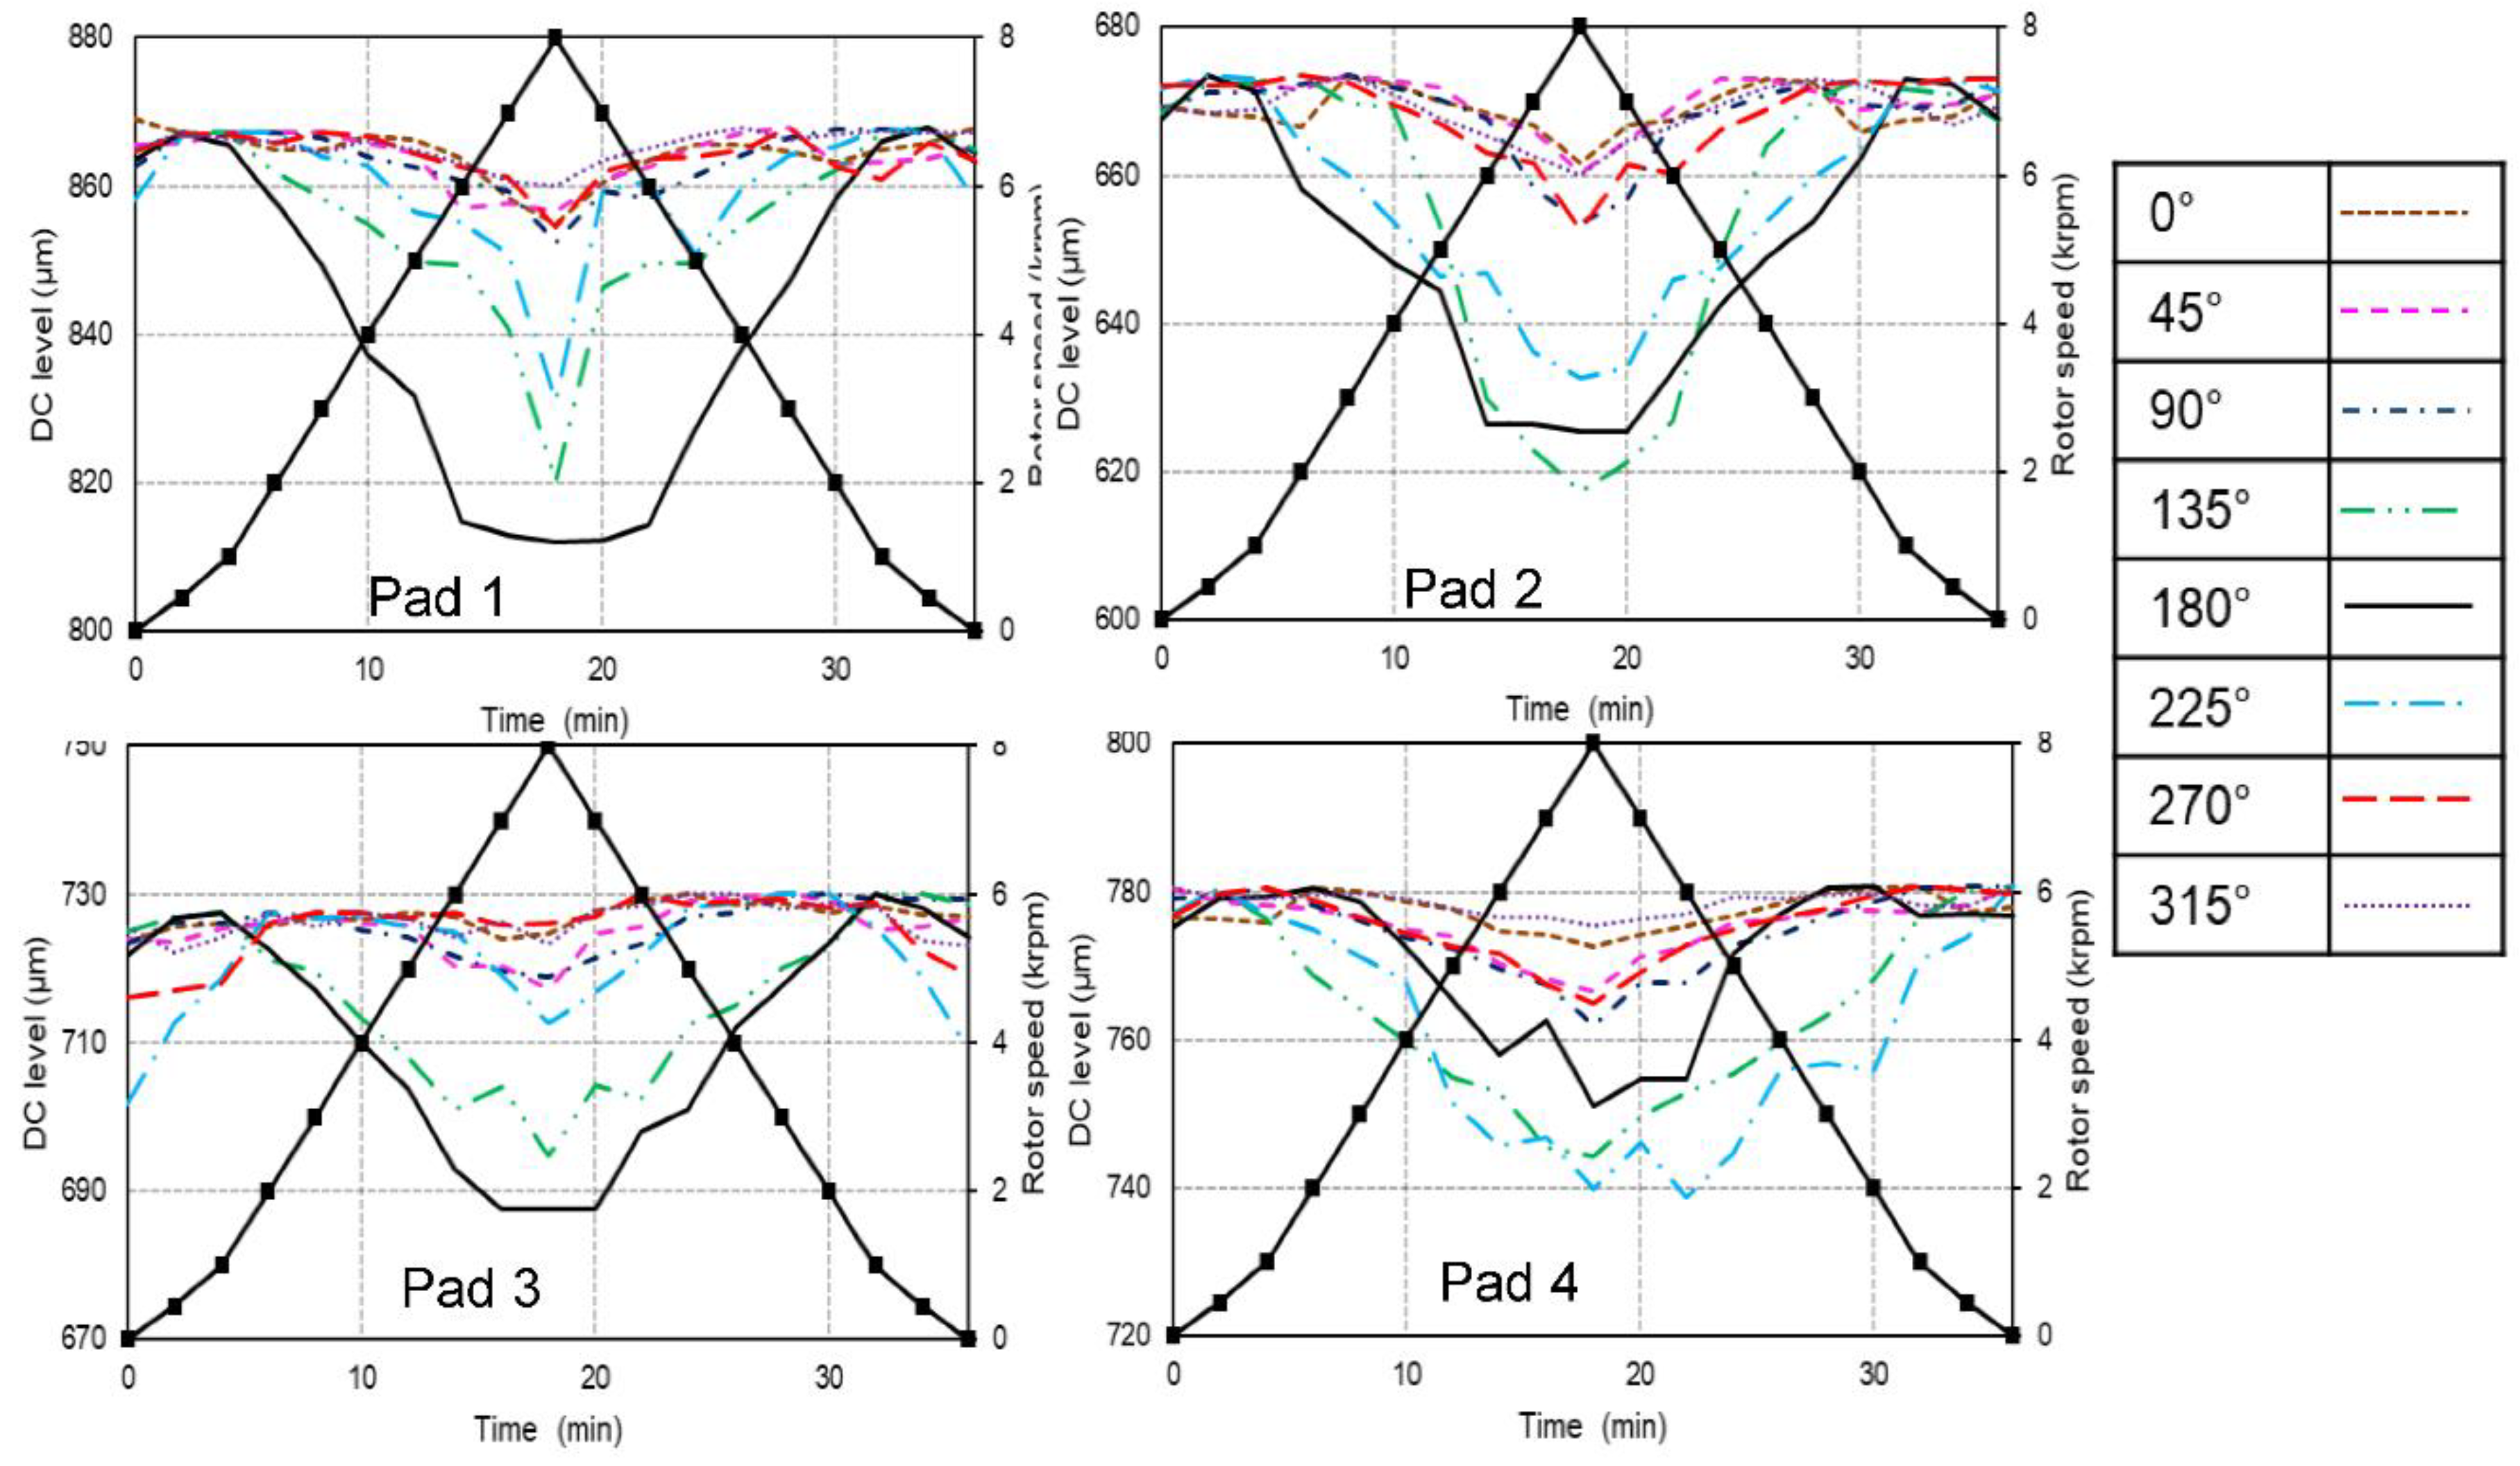
Figure 8.
Depiction of seal pad behavior against the varying rotor speed.
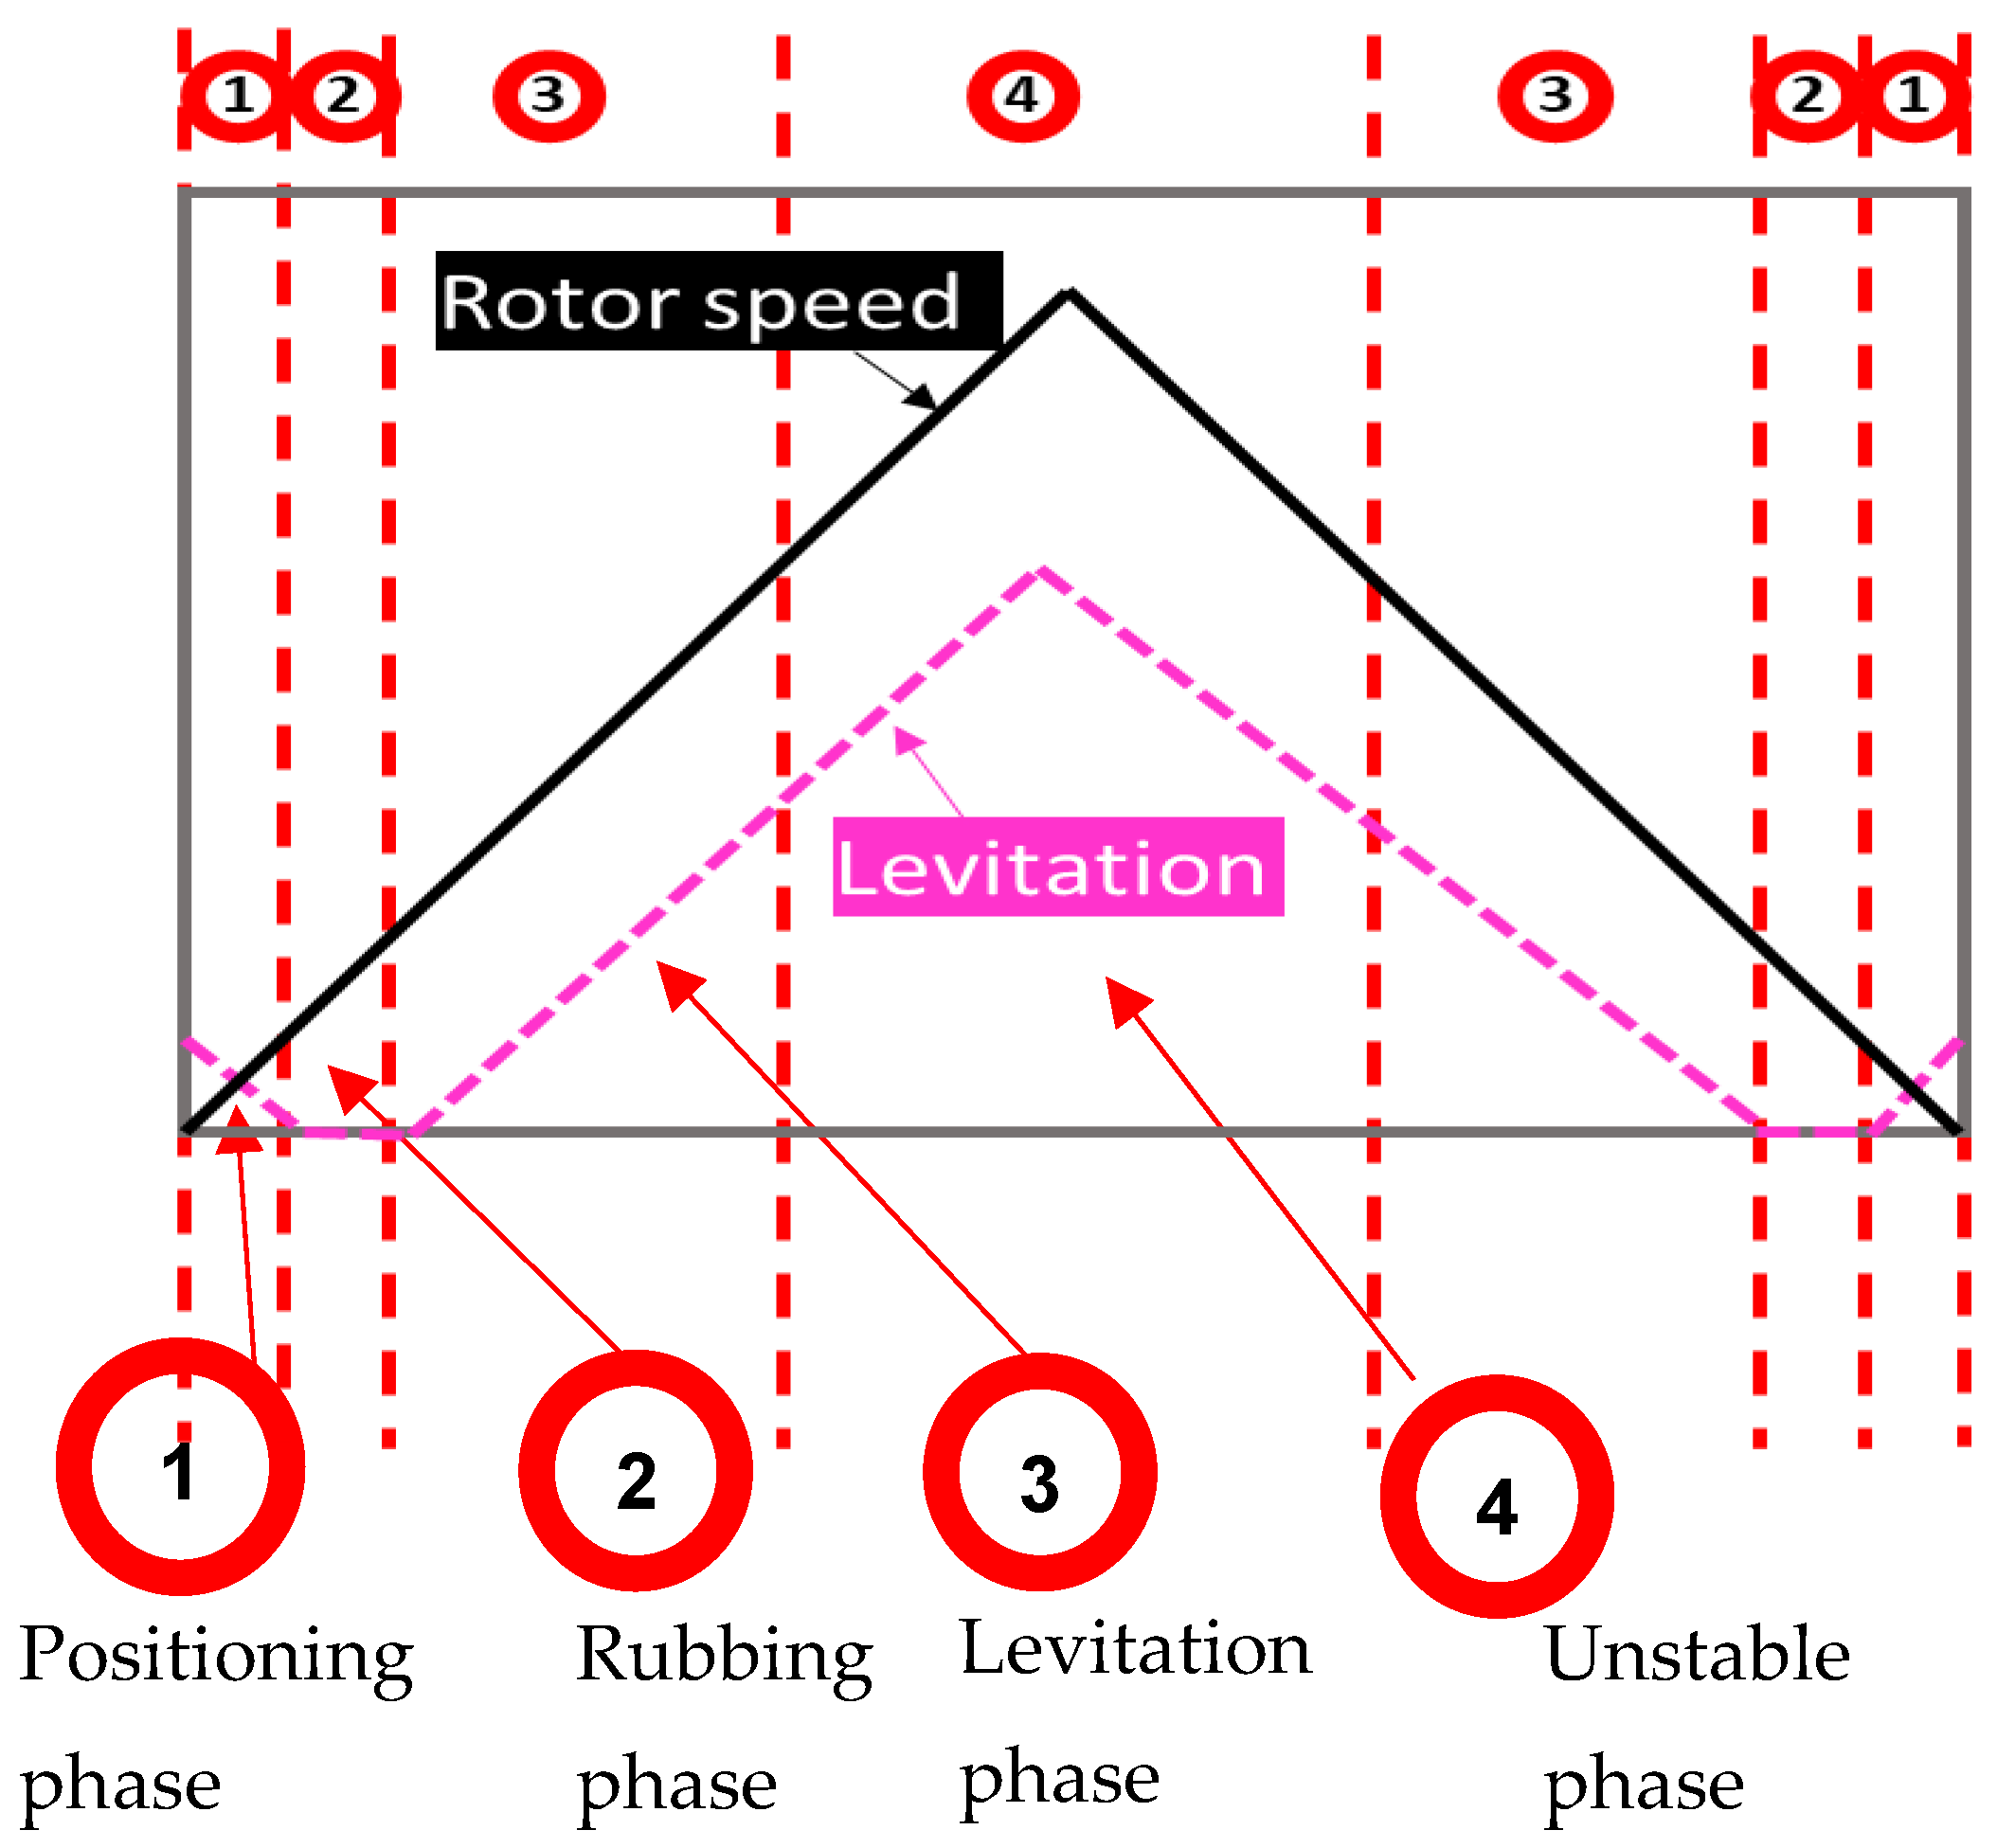
Figure 9.
Levitation of seal pads vs. circumferential location of pad center for varying rotor speeds.
Figure 9.
Levitation of seal pads vs. circumferential location of pad center for varying rotor speeds.
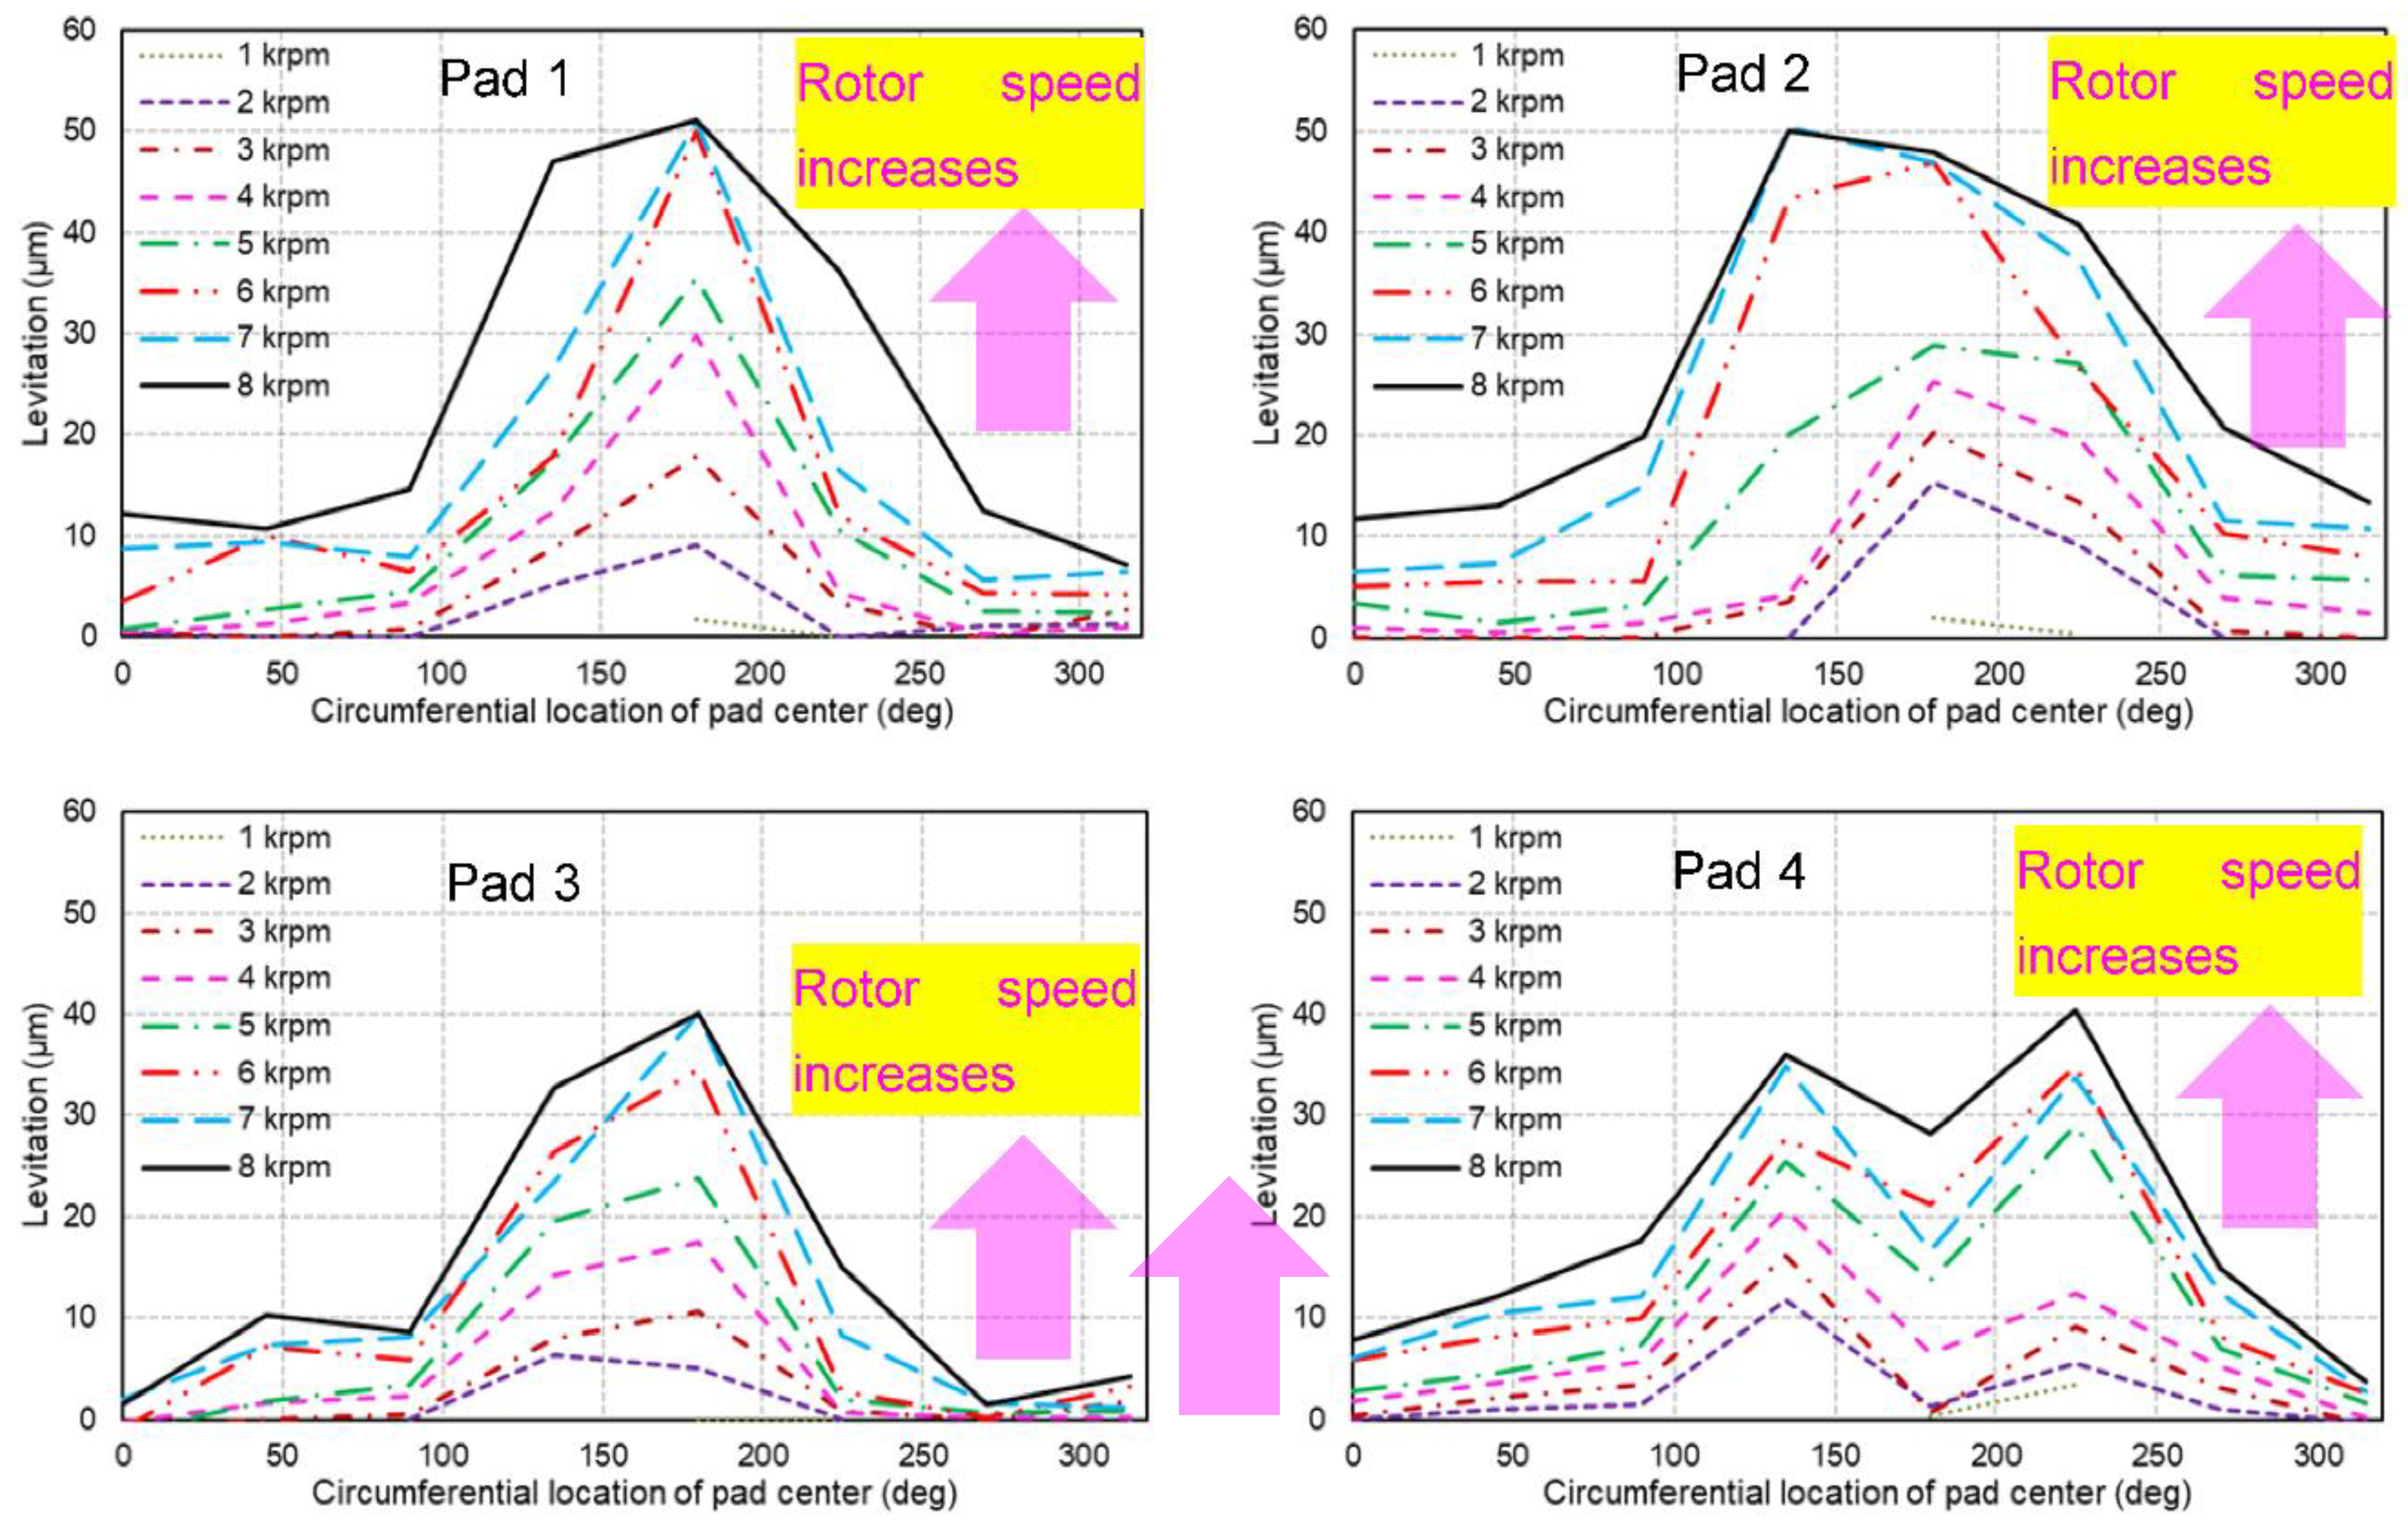
Figure 10.
Measured and theoretical profile of the seal pad groove and adjacent land.
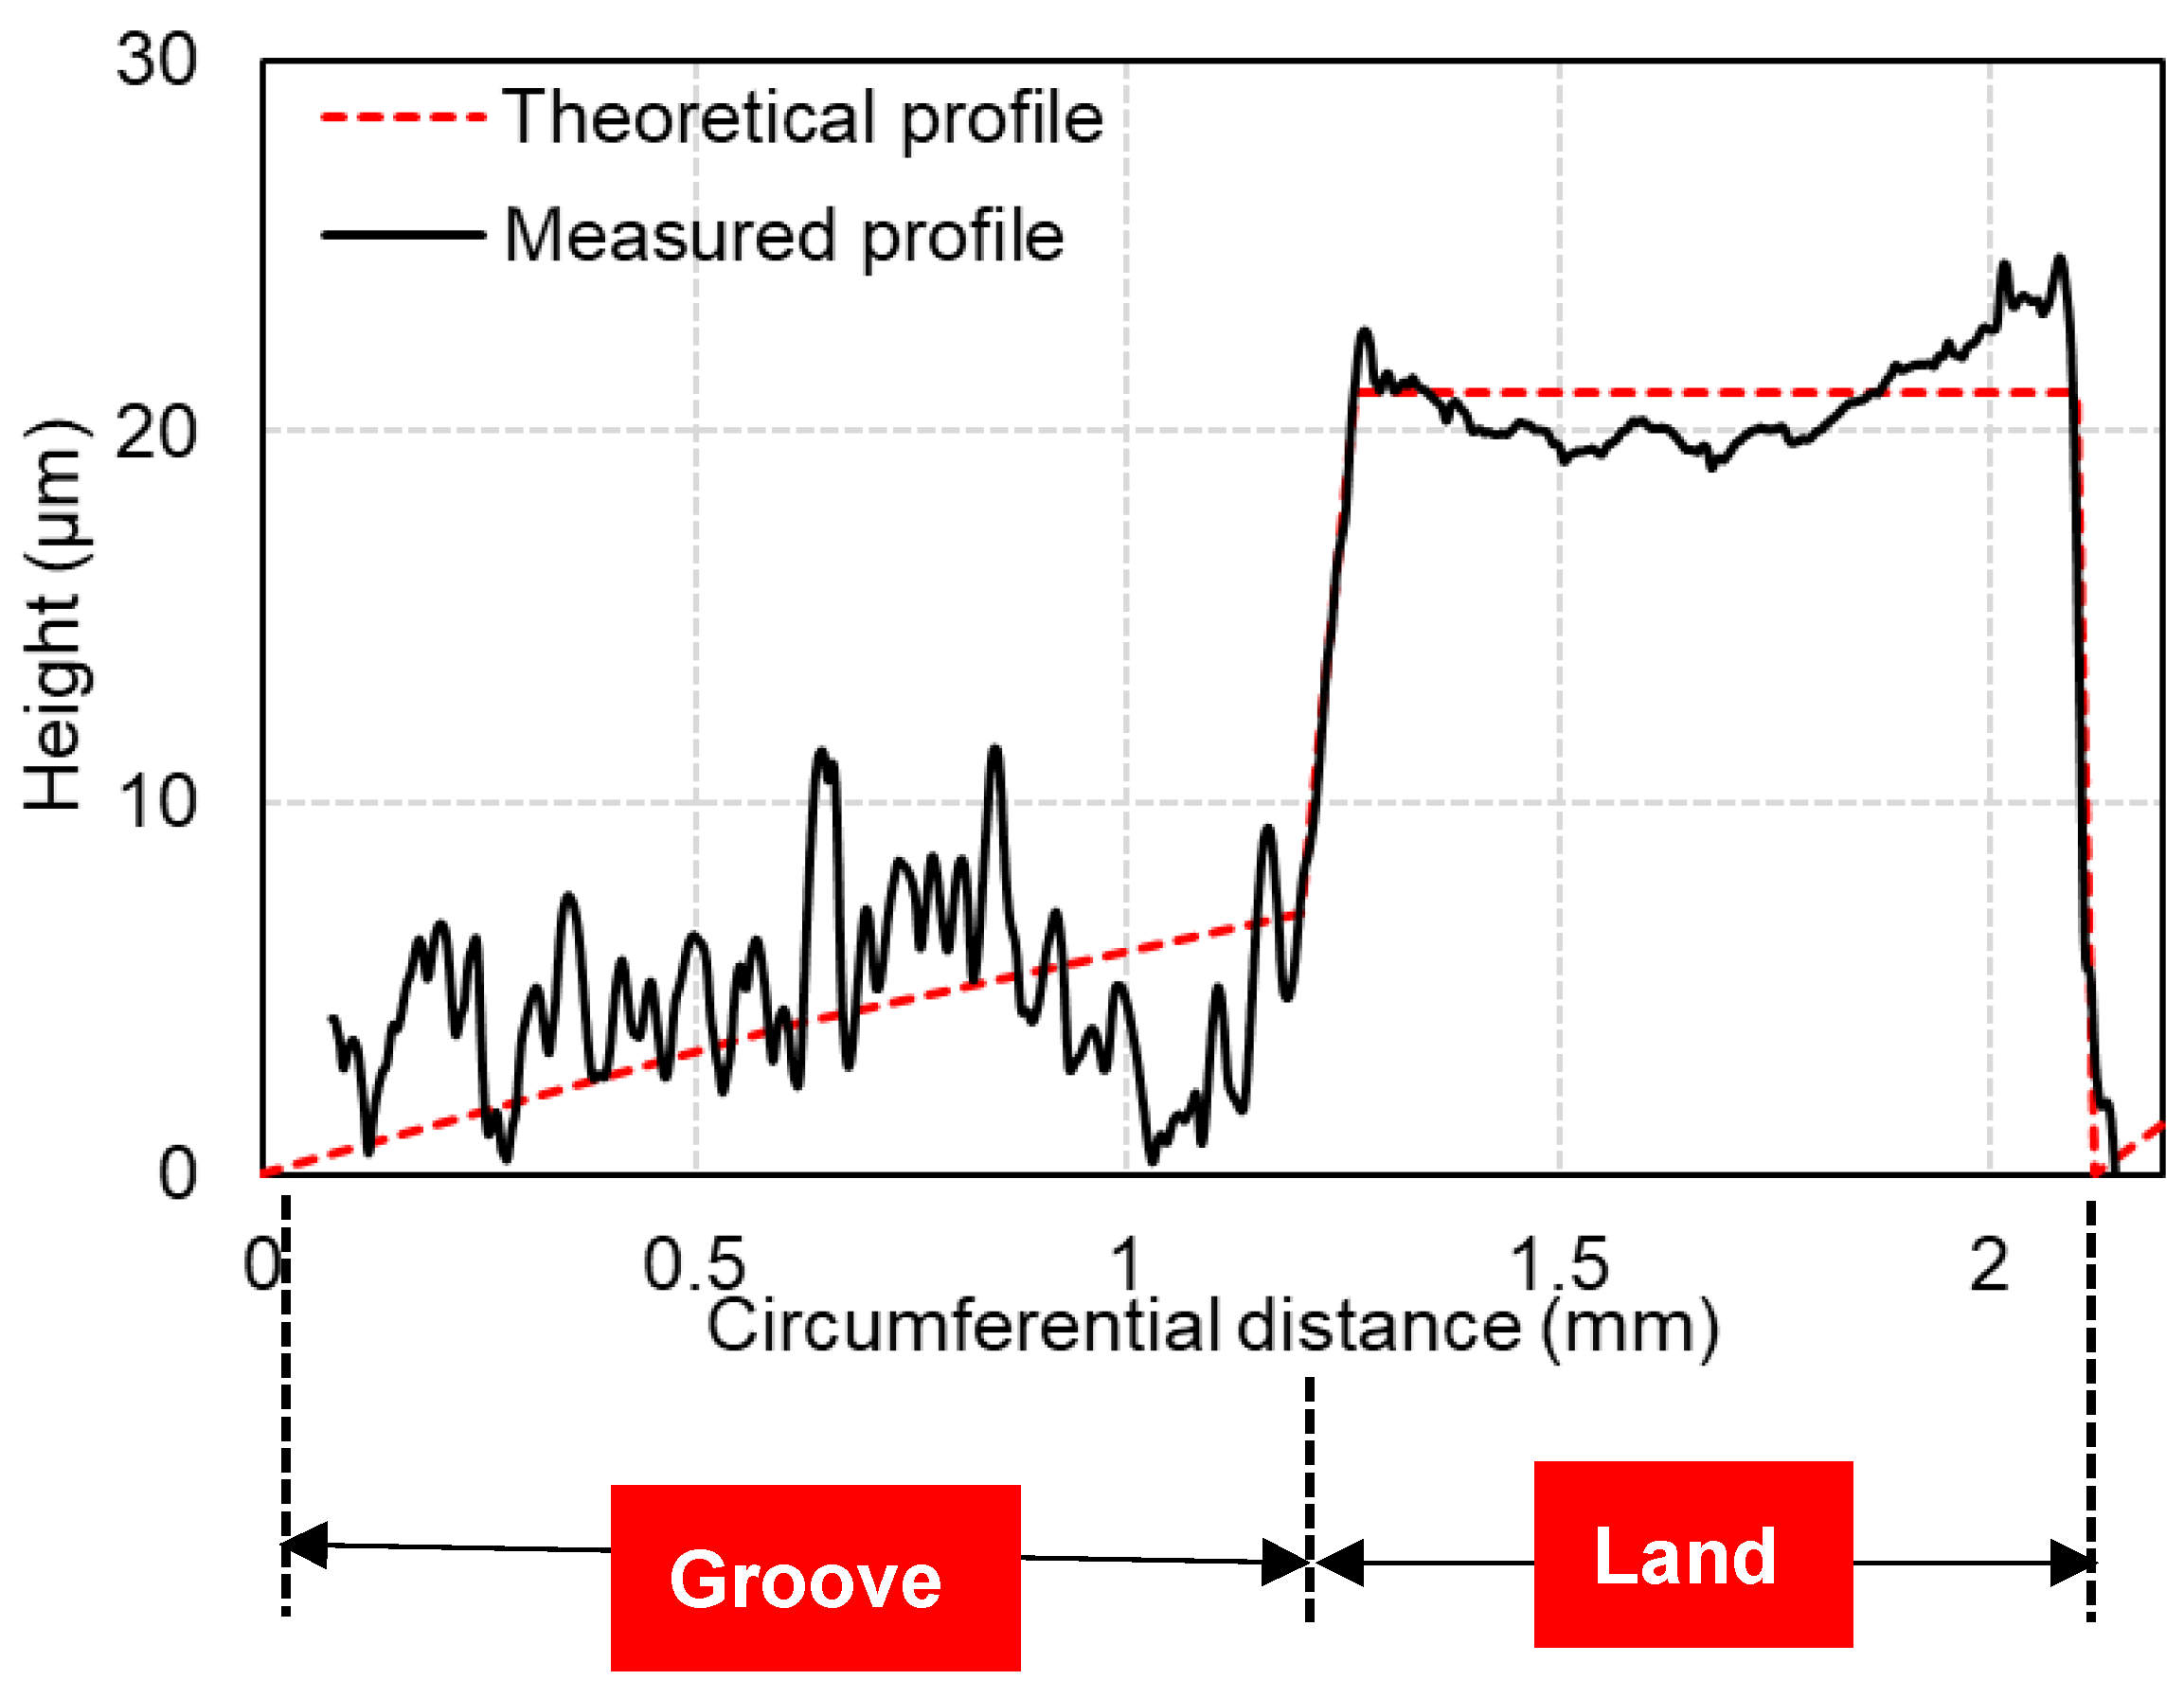
Figure 11.
Comparison between measured and predicted levitation vs. circumferential location of pad center. Rotor speed =7 krpm.
Figure 11.
Comparison between measured and predicted levitation vs. circumferential location of pad center. Rotor speed =7 krpm.
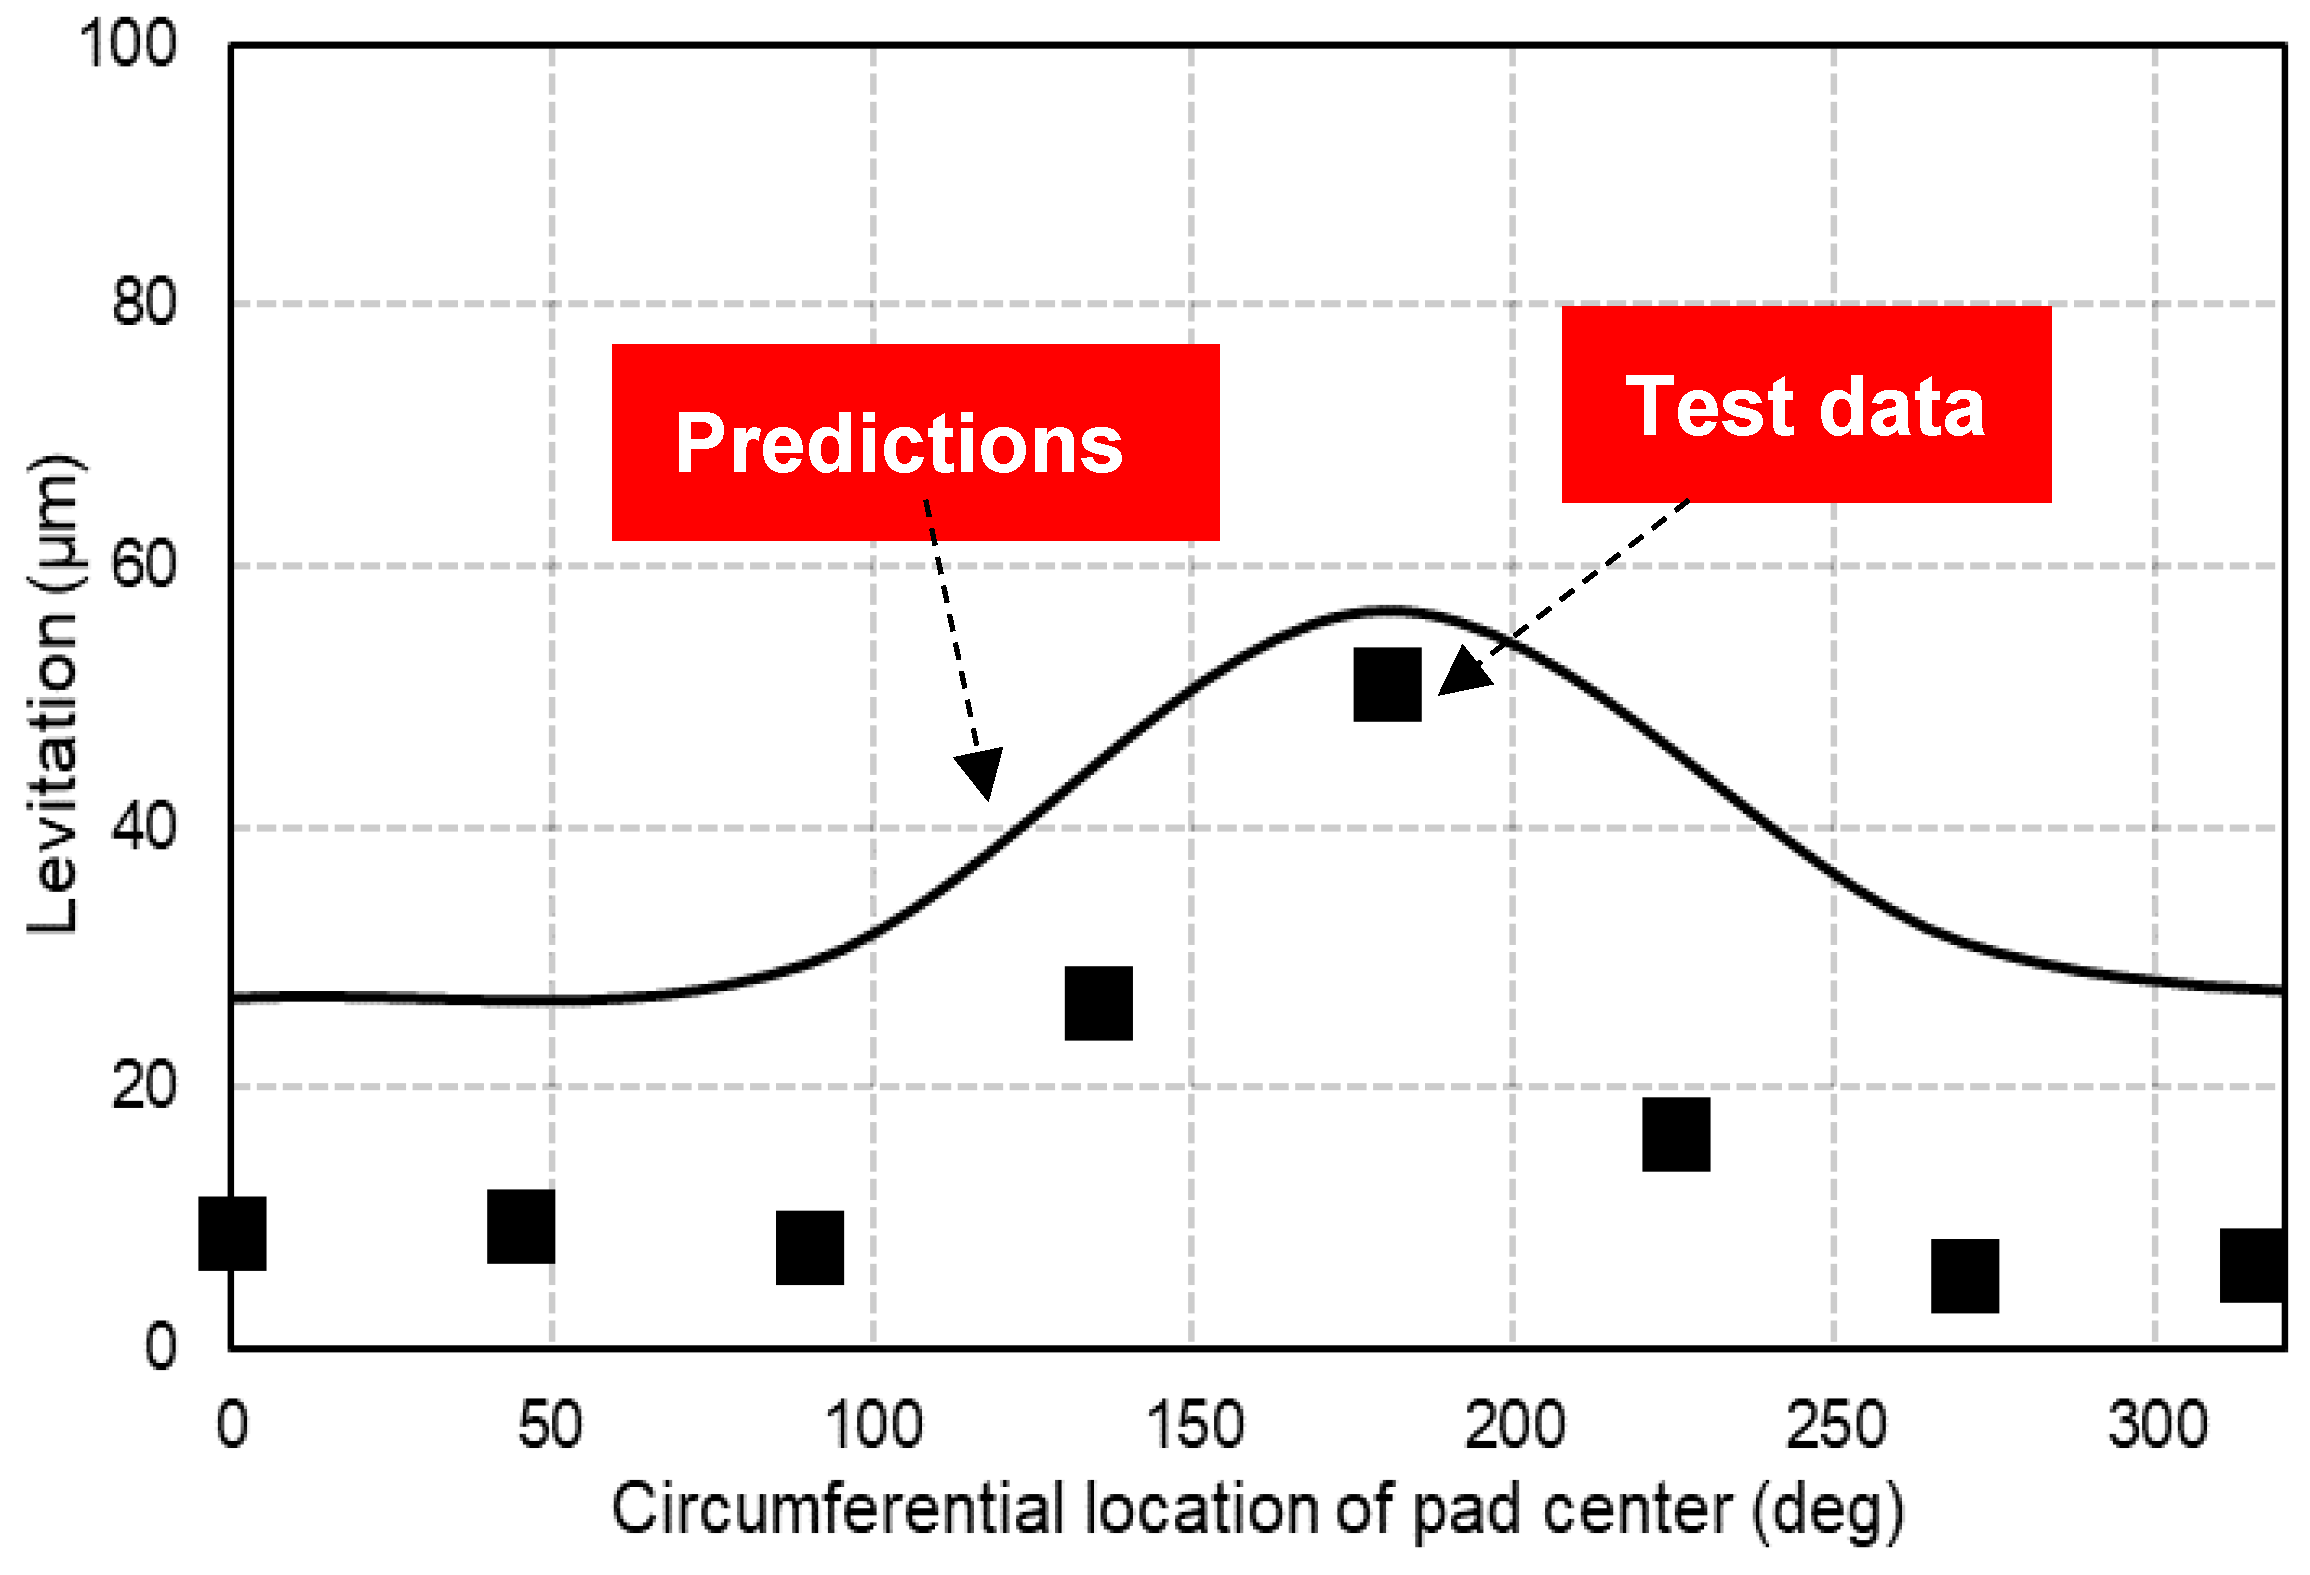

Table 1.
Geometry and operating conditions of the FRS.
| Rotor disk diameter (mm) | Seal pad diameter of curvature (mm) | Seal pad axial length (mm) | No. of grooves per pad | Groove axial length (mm) | Groove arc length (mm) | Groove depth (µm) | Rotor speed (krpm) |
|---|---|---|---|---|---|---|---|
| 140 | 140 | 13 | 24 | 10.4 | 1.22 | 20 | 0-8 |
Disclaimer/Publisher’s Note: The statements, opinions and data contained in all publications are solely those of the individual author(s) and contributor(s) and not of MDPI and/or the editor(s). MDPI and/or the editor(s) disclaim responsibility for any injury to people or property resulting from any ideas, methods, instructions or products referred to in the content. |
© 2024 by the authors. Licensee MDPI, Basel, Switzerland. This article is an open access article distributed under the terms and conditions of the Creative Commons Attribution (CC BY) license (http://creativecommons.org/licenses/by/4.0/).
Copyright: This open access article is published under a Creative Commons CC BY 4.0 license, which permit the free download, distribution, and reuse, provided that the author and preprint are cited in any reuse.


