
Submitted:
12 November 2024
Posted:
13 November 2024
You are already at the latest version
Abstract
Colorectal cancer (CRC) is the third diagnosed cancer worldwide. The 44% of metastatic colorectal cancer patients were diagnosed at an early stage. Despite curative resection, approximately 40% of patients will develop metastases within few years. Previous studies indicate the presence of cancer stem cells (CSCs) and their contribute to CRC progression and metastasis. miRNAs deregulation plays a role in CSCs formation and in tumor development. At the light of previous studies, we investigated the role of miR-486-5p to better understand its role in CSC. The expression of miR-486-5p was assessed in adherent cells and spheres generated from two CRC cell lines to observe the difference of expression in CSC-enriched spheroids. After, we overexpressed and underexpressed this miRNA in adherent and spheres cultures through the transfection of miR-486-5p mimic and a mimic inhibitor. The results demonstrated that miR-486-5p exhibited a notable downregulation in CSC models, and its over-expression led to a significant decrease in colony size. In this study, we confirmed that miR-486-5p plays an onco-suppressive role in CRC, thereby advancing our understanding of the role of this microRNA in the CSC phenotype.
Keywords:
colorectal cancer
; spheres
; cancer stem cells
; miR-486-5p
; onco-suppressive
1. Introduction
Colorectal cancer (CRC) is the third most frequently diagnosed cancer worldwide with an annual incidence of 10,7%, after breast cancer (11.7%) and lung cancer (11.4%), and it is the second leading cause of cancer death, with 9.5% mortality, second to lung [1]. According to the most recent data, about 10% of survivors live with metastatic cancer, 44% of whom were diagnosed at early stage [2]. The disease, which is quite rare before the age of 40, is most common in people between 60 and 75; both incidence and mortality rates are higher in males than females with age-standardized rate (ASR) incidence of 23.4 for men and 16.2 for women and an ASR mortality of 11.1 for men and 7.2 for women (ASR per 100 000 worldwide) [1]. It is estimated that approximately 30-40% of CRC patients who undergo curative resection of the primary tumor will develop metastases within a few years, and that most of these recurrences will occur within the first two years [2,3]. In recent years, screening techniques have made it possible to lower the age of diagnosis when the cancer is in the early stages; in fact, the overall incidence of CRC decreased in individuals over 50 years old but increased in those under 50 years old [4]. As previously mentioned, the 5-year survival of CRC patients varied depending on the tumor stage at the time of diagnosis. Currently, colonoscopy is recognized as the gold standard for the detection of CRC, but it has limited application because of its invasiveness, time-consuming nature, high cost and high operator variability [2]. Common screening methods, such as fecal occult blood test (FOBT) and prognostic tests, such as carcinoembryonic antigen (CEA) quantification, microsatellite instability assessment, and mutations in the most frequently mutated genes KRAS (proto-oncogene KRAS, GTPase), NRAS (proto-oncogene NRAS, GTPase), BRAF (v-RAF murine sarcoma viral oncogene homolog B), and mismatch repair (MMR), unfortunately show low sensitivity [2]. The genetic and epigenetic events involved in adenoma to carcinoma transition and CRC progression are supported by the tumor microenvironment (TME) [5]. The TME represents a very complex network between tumor cells and stromal, endothelial and immune cells, which contributes to the determination of an aggressive tumor phenotype; the presence of inflammatory cells and inflammatory mediators such as chemokines and cytokines facilitates tumor progression, including CRC, by maintaining paracrine signaling between tumor-resident adipocytes, that provide a rich source of energy, and tumor cells, that require energy for their high proliferation [5,6]. The majority of cells within the tumor mass lack self-renewal capacity and are not tumorigenic. However, within the wider TME, cancer stem cell (CSC) niches are anatomically diverse microenvironments in which cells secrete molecules that encourage self-renewal of CSCs, cause angiogenesis and attract immune cells and other factor-secreting stromal cells [7]. CSCs are a small sub-population of cells in the tumor mass that are immortalized, possess the capacity for self-renewal, asymmetrical self-renewal, pluripotency, the ability to restart the original tumor and are involved in tumor growth, initiation, maintenance, survival, metastasis, cancer recurrence, and increased aldehyde dehydrogenase 1 enzymatic activity [8]. In spite of their fundamental role in cancer, CSCs represent only 0.1-10% of the cells present in it. The property of pluripotency and the asymmetric cell division allows CSCs to generate heterogeneous lineages of tumor cells with different phenotypes, resulting in the growth of the primary tumor and the insurgence of new tumors [9]. The presence of Colorectal CSCs (CCSCs) or colon-cancer-initiating cells was first proven in 2007 by Ricci-Vitiani et al. [10] O’Brien et al. [11], and Delerba et al. [12]. The origin of CCSCs is still debated; numerous evidence suggests that CCSCs can be generated from intestinal stem cells (ISCs), or from differentiated intestinal cells that can acquire stem-like characteristics and become CCSCs through a process of de-differentiation. Genetic, epigenetic, and even niche and microenvironmental conditions contribute to this transformation [7,13,14]. Physiologically, the ISC compartment maintains tissue homeostasis by generating new cells that ascend the crypt as differentiated cells and eventually replace apoptotic cells at the top of the crypt [9,14]. The rapid and continuous regeneration to which the intestinal epithelium is subjected, supported by cryptic ISCs, greatly increases the risk of malignant conversion [13].
MicroRNAs (miRNAs) are endogenous short non-coding RNA sequences of 18-25 nucleotides that regulate gene expression at the post-transcriptional level in a sequence-specific manner [15]. Due to their high stability and the possibility of detecting them in human body fluids, miRNAs are being studied as a new class of valuable biomarkers [16]. Indeed, increasing evidence indicates that deregulated expression of miRNAs plays a functional role in CRC, acting as tumor suppressors or oncogenes to regulate the ex-pression of their specific target mRNAs [17]. miRNAs have a significant role in maintaining the physiology of normal colon cells, while alteration of their levels contributes to CRC development, progression, and metastasis, drug resistance, tumor recurrence and plays a role in CSCs formation and in epithelial-to-mesenchymal transition (EMT) [17]. In addition, miRNAs are involved in direct cell-to-cell signaling and paracrine signaling between tumor cells and others TME components as secreted molecules in exosomes or microvescicles [18]. In previous studies, we confirmed the role of miRNAs in CRC investigating the expression of a set of miRNAs selected from literature in CRC patient’s cancer tissue, healthy tissue and serum, and determining the relationships with their clinical parameters. Additionally, we investigated which miRNAs are associated with CSC phenotype using two different CSC in vitro models obtained from human established CRC cell lines [19]. The miR-486-5p has been observed to exhibit altered expression in various tumors [20,21]. It is considered an onco-suppressor in CRC due to its gradual downregulation in tissues as the pathology advances [22]. To confirm its involvement in CRC, in our previous work we evaluated the expression of miR-486-5p in different matrices (sera and stool) of CRC patients at different tumor stages, and conducted a meta-analysis using data from online datasets (Gene Expression Omnibus, GEO). Additionally, we assessed its expression in CSC in vitro models obtained from three established CRC cell lines. Our data indicated that miR-486-5p was downregulated in metastatic patients compared to healthy controls, and in CSC culture models in comparison with parental adherent cells [23]. The scarcity of suitable biomarkers and the high stability of miRNAs in biological fluids motivated our further investigation into the potential role of miRNA-486-5p as a promising diagnostic or prognostic biomarker for CRC. Furthermore, our previous data demonstrated that the inclusion of miR-486-5p measured in sera of CRC patient in a prediction model that includes other predictor factors such as age, sex, smoking history, tumor stage and grade, CEA, and alkaline phosphatase, moderately increased both prognostic and diagnostic power [23].
In this study, we aimed to explore the role of miR-486-5p in CRC and CSC phenotype. Using colonospheres from colon cancer cell lines, we analyzed the presence of CSCs through increased expression of EMT, and stemness markers. By manipulating miR-486-5p levels via mimic and mimic inhibitor transfection, we studied the functional impact of miR-486-5p overexpression and downregulation in colonospheres derived from two human CRC cell lines.
2. Materials and Methods
2.1. Cell Lines and Cell Culture
Two cancer cell lines, HT-29 (representative of the primary tumour, with mutations in APC, BRAF, PIK3CA, SMAD4 and TP53 genes) and T84 (representative of metastatic cancer, with mutations in APC, KRAS, PIK3CA and TP53 genes) were employed to set up two culture models: in adherent conditions and non-adherent conditions (spheres or colonospheres). In adherent culture condition, both cell lines were cultured following American Type Culture Collection (ATCC; Manassas, VA, USA) recommendations in supplemented Dulbecco’s modified Eagle’s medium (DMEM) containing 10% fetal bovine serum (FBS) and 1% penicillin/streptomycin (Pen-Str P-0781; Sigma, St. Louis, MO, USA) at 37°C in 5% CO2. In non-adherent cell culture model, secondary spheres enriched in CSCs were obtained from HT-29 and T84 cell lines following the patented protocol WO2016020572A1 [24]. The protocol was developed to yield spheres in Corning® Costar® Ultra-Low Attachment Multiwell Plates, utilizing spheres culture medium obtained supplementing the DMEM/F-12 nutrient mixture without FBS with 1% penicillin/streptomycin (Pen-Str P-0781; Sigma-Aldrich, St. Louis, Missouri, USA), 1× B-27 (B-27™ Supplement [50×], Minus Vitamin A; Invitrogen, Waltham, Massachusetts, USA), 10 µg/mL insulin (Insulin–Transferrin–Selenium [ITS-G, 100×]; Invitrogen, Waltham, Massachusetts, USA), 4 ng/mL heparin (cell-culture-tested heparin sodium; Sigma), 1 µg/mL hydrocortisone (Sigma-Aldrich, St. Louis, Missouri, USA), 10 ng/mL epidermal growth factor (Sigma-Aldrich, St. Louis, Missouri, USA), 10 ng/mL interleukin 6 (Miltenyi, Bergisch Gladbach, Germany), 10 ng/mL fibroblast growth factor (Sigma), and 10 ng/mL hepatocellular growth factor (Miltenyi, Bergisch Gladbach, Germany). After 72h of incubation at 37°C in 5% CO2, primary spheres were obtained. They were collected by centrifugation, disaggregated with trypsin-EDTA and mechanically disrupted with a pipette. The trypsin was inactivated with the addition of DMEM containing serum and cells were washed with phosphate-buffered saline (PBS) to remove FBS’s traces. Single cells were then resuspended in spheres culture medium and plated in ultra-low adherence multi-well plates. Following an additional incubation period of 72 hours at 37°C in 5% CO2, secondary spheres were generated.
2.2. Transient Transfection with Synthetic miRNA-486-5p Mimics and Inhibitors
The up-regulation and the inhibition of miR-486-5p was induced in monolayer cells and spheres by the transfection of miR-486-5p mimic or inhibitor (Qiagen, Hilden, Germany), respectively, paired with the relative controls. The 5′-FAM-fluorescence-labelled delivery control (Qiagen, Hilden, Germany) was used to measure the transfection efficiency in HT-29 and T84 monolayer cells and colonospheres. The TransIT-X2® Transfection Reagent (Mirus Bio, Madison, WI, USA) was used according to the manufacturer’s instructions to perform the transfection. The miRNA mimic and inhibitor were used at the final concentration of 5 nM and 50 nM, respectively and were prepared in 3 µl/ml of TransIT-X2® and 100 µL/ml of Opti-MEM medium (Gibco, New York, NY, USA) into well of standard 24-well plates containing 6 × 10³ cells in 0.4 mL of medium. The prepared reagents were allowed to stand at room temperature for 15 to 30 minutes and then added directly to the cell culture medium. Prior to further analysis, the cells were cultured for 3 days at 37°C in a 5% CO2 atmosphere.
2.3. RNA Extraction from Cells
Monolayer cells (HT-29 and T84) and derived colonospheres were harvested and disaggregated with trypsin-EDTA, pelleted with centrifugation at 1,500× g for 5 min, and washed twice with PBS. The total RNA was extracted by adding 1 ml of TRI Reagent (Sigma-Aldrich, St. Louis, Missouri, USA) from the pellet. After 15 minutes of incubation at room temperature, 200 µl of chloroform was added and the cells were vortexed and allowed to stand at room temperature for 10 minutes. Then, the cells were centrifuged for 10 minutes at 12,000×g at 4°C, and the supernatant was transferred into a new microtube. After, 500 µl of isopropanol was added to the supernatant, which was vortexed, incubated for 10 minutes at room temperature and centrifuged for 10 minutes at 12,000×g at 4°C. The supernatant was eliminated and was replaced with 75% ethanol solution. The sample was centrifuged for 5 minutes at 17,000×g at 4°C. Then, the supernatant was eliminated, and the sample was allowed to dry at room temperature for 1 hour. After the pellet was resuspended in 50 µl of Milli-Q™ water and the RNA concentration and quality were evaluated with a NanoDrop spectrophotometer (Thermo Fisher Scientific, Waltham, Massachusetts, USA).
2.4. Retrotranscription and Real-Time PCR for miRNA Expression
To obtain the cDNA from extracted RNAs, each sample was diluted in nuclease-free water to achieve a final concentration of 5ng/µl of RNA. The miRCURY™ LNA™ RT Kit (Qiagen, Hilden, Germany) was used according to the manufacturer’s instructions to synthetize cDNA, and the thermocycler was programmed in accordance with the specified protocol: 60 minutes at 42°C, 5 minutes at 95°C, cooling to 4°C. The reactions were spiked with exogenous UniSp6 RNA (RNA Spike-In Kit, Qiagen, Hilden, Germany). The samples were then stored at -20° C until processing. Quantitative Real-Time PCR (quantitative PCR or qPCR) was performed with miRCURY LNA SYBR® Green PCR Kit (Qiagen, Hilden, Germany). miRCURY LNA miRNA PCR primers (Qiagen, Hilden, Germany) was used for miRNA-486-5p (hsa-miR-486-5p, Qiagen, Hilden, Germany). U6 snRNA housekeeping gene was used for data normalization, and UniSp6 primer set was assessed for cDNA quality. For the Real Time-PCR assays the cDNA was diluted 1:80 in nuclease-free water and 4 µL of diluted cDNA was mixed with 5 µL of PCR master mix, 1 µL of nuclease-free water, and 1 µL of each primer. The cDNAs were amplified using the StepOne™ Real-Time PCR system (Applied Biosystems™, Waltham, Massachusetts, USA), which was configured as follows: the first cycle was conducted at 95°C for 10 minutes, followed by 45 cycles in which a 95°C cycle was maintained for 10 seconds and a 60°C cycle was maintained for 1 minute, with a ramp rate of 1.6°C/s. Relative quantification of miRNA expression was calculated using the 2-∆∆Cq method and each reaction was performed in triplicate.
2.5. Retrotranscription and Real-Time PCR assay for Stemness and EMT Genes Expression
The total RNA extracted, as previously described in section 2.3., was retrotranscripted with the GoScript™ Reverse Transcription System (Promega, Madison, WI, USA), according to the manufacturer’s instructions. 1 µg of each extracted RNA was diluted with 9 µl of nuclease-free water, heated for 10 minutes at 70°C, and kept on ice until the reverse transcription reaction mix was added. The thermal cycler was set up according to the protocol: 60 minutes at 42°C, 5 minutes at 95°C, cooling to 4° C. The qPCR was performed using GoTaq® qPCR Master Mix (Promega, Madison, WI, USA), and primers from the StemElite™ (Promega, Madison, WI, USA). The following primers were used to assess the expression of four stemness genes: SOX-2 (forward sequence: 5′-GGAAAGTTGGGATCGAACAA-3′; reverse sequence 5’-GGAGCTTTGCAGGAAGTTTG-3’), KLF-4 (forward sequence: 5’-CGAACCCACACAGGTGAGAA-3’; reverse sequence: 5’-TACGGTAGTGCCTGGTCAGTTC-3’), c-Myc (forward sequence: 5’-CTTTTCCTGTCCTGTCCCAAC-3’; reverse sequence: 5’-CTGCTTTACGCTCAT-3’) and OCT-4 (forward sequence: 5’-TCTCGCCCCCTCCAGGT-3’; reverse sequence: 5’-GCCCCACTCCAACCTGG-3’). The following primers were used to assess the expression of three EMT genes: Vimentin (forward sequence: 5’-GAACCTGAGGGAAACTAATC-3’; reverse sequence: 5’-GAAAGGCACTTGAAAGCT-3’); SLUG (forward sequence: 5’-TGGTTGCTTCAAGGACACAT-3’; reverse sequence: 5’- GTTGCAGTGAGGGCAAGAA-3’) and SNAIL (forward sequence: 5’-TACAAAAACCCACGCAGACA-3’; reverse sequence: 5’-ACCCCACATCCTTCTCACTG-3’). GAPDH was used as housekeeping gene (forward sequence: 5’-CAACAATATCCACTTTACCAGAG-3’; reverse sequence: 5’-TCGGAGTCAACGGATTTG-3’). The cDNA was diluted 1:80 in nuclease-free water and 1 µl of the diluted solution was added to the Master Mix prepared in accordance with the kit protocol. The cDNAs were amplified using the StepOne™ Real-Time PCR system (Applied Biosystems™, Waltham, Massachusetts, USA) configured as follow: the first cycle was conducted at 90°C for 2 minutes, followed by 40 cycles in which a 95°C cycle was maintained for 15 seconds and a 60°C cycle was maintained for 1 minute, with a ramp rate of 1.6°C/s. Relative quantification of miRNA expression was calculated using the 2-∆∆Cq method. Each reaction was performed in triplicate on monolayer cells and spheres prior to and following the transfection of miR-486-5p mimic and inhibitor.
2.6. Cell Viability Assay
The Alamar Blue assay (alamarBlue™ Cell Viability Reagent, Invitrogen, Waltham, Massachusetts, USA) was performed to evaluate the cell viability before and after the miRNA-486-5p transfection in monolayer cells and spheres obtained from HT-29 and T84 cell lines. Cells were seeded in 96-well plate in 100 µl of complete medium at the concentration of 3000cells/well. Once cell adhesion had occurred, 10 µl of alamarBlue reagent was added to 90 µl of culture medium in each well, and the plates were incubated at 37°C in a 5% CO₂ atmosphere for one hour. The absorbance was then measured at a wavelength of 570nm. The data were normalized and the viability rate was calculated.
2.7. CSC Characterization
The ALDEFLUOR kit (Stem Cell Technologies, Vancouver, Canada) was performed according to the manufacturer’s instructions to detect the ALDH1 activity in adherent cells and secondary spheres of HT-29 and T84 cell lines before and after the transfection of miR-486-5p mimic and inhibitor. The diethylaminobenzaldehyde (DEAB) was used as an ALDH1 inhibitor to set ALDH1 gates. Cells were harvested in three tubes per treatment and centrifuged at 250×g at 4°C for 5 minutes. The supernatant was removed and the cell pellet was resuspended in 500μl of ALDEFLUOR Buffer. One of the three tubes was treated with 5µl of ALDEFLUOR reagent (ALDH1), while the second tube was treated with 5 µl of ALDEFLUOR reagent and 10 µl of DEAB reagent. The third tube was used as control. All tubes were incubated at room temperature for 30 minutes and then centrifuged at 250×g at 4°C for 5 minutes. Once the supernatant had been removed, the pellet was resuspended in 400 µl of ALDEFLUOR Buffer for the subsequent flow cytometry reading.
2.8. Soft Agar Colony Formation Assay
The soft agar colony formation assay was employed, as previously described from our group [25], to assess the clonogenic activity of colonospheres derived from the two cell lines (HT-29 and T84) prior to and following the transfection of miR-486-5p mimic and inhibitor. The bottom of a 24-well ultralow-attachment plate cell culture was prepared as follow: 500 µL of 0.8% agar solution in supplemented DMEM was pre-warmed to 37°C and dispensed into each well avoiding bubble formation on the surface and allow it to solidify at room temperature. Secondary spheres were harvested and disaggregated using trypsin-EDTA. The top layer solution was prepared add 2x10⁴ cells/ml in 0,4% agar solution in supplemented DMEM pre-warmed to 37°C. 500 µL of the top layer solution was dispensed in each well, avoiding bubble formation on the surface and allowing it to solidify at room temperature, to obtain a final concentration of 104 cell per well. After solidification, 200 µL of supplemented DMEM was added to each well as a feeder layer and replaced every 3-4 days to feed the cells. Transfection reagents (miR-486-5p mimic and inhibitor prepared as previously descried in 2.2. section) were added to the feeder layer and replaced every 3-4 days. Cells were cultured at 37°C in 5% CO2 for 20 days. Then, cells were stained with 500 μL of iodonitrotetrazolium chloride (Sigma-Aldrich) solution (10g of iodonitrotetrazolium chloride dissolved in 10 mL of sterile H2O) and incubated at 37°C in 5% CO2 for 24 hours. Wells were then washed with PBS 1x and colonies were counted and analyzed using a dissecting microscope and the ImageJ software.
2.9. Statistical Analysis
All graphed data are the result of at least three experiments and are presented as the mean ± standard error. Statistical difference was determined from two-tailed Stu-dent’s t-tests. The values of p < 0.05 were deemed to be statistically significant.
3. Results
3.1. Spheroids and CSCs Enrichment in Colorectal Cell Lines HT-29 and T84
Both cell lines were capable to form colonospheres under serum-free non-adherent condition. The secondary-spheres derived from HT-29 cell lines were compact and well-shaped (Figure 1a); the T84 cell line formed less compact secondary spheres with a grape-cluster shape (Figure 1b). The evaluation of CSC marker ALDH1 expression confirmed the presence of CSCs in the sphere culture models. The percentage of ALDH1 positive cells increased significantly from 6.1% in HT-29 adherent cells to 74.2% in HT-29 colonospheres (Figure 1c) and from 10.85% in T84 in monolayer cells to 24.55% in T84 colonospheres (Figure 1d). Cell viability was evaluated in monolayer and CSCs culture models of HT-29 and T84 cell lines at time 0 (T0) and after 72 hours of incubation (T72) with Alamar blue assay. The HT-29 cell line exhibited a significantly higher viability rate in CSCs culture than in monolayer culture (p<0.001) (Figure 1e). In contrast, the T84 cell line showed a lower viability rate in spheroids than in the monolayer counterpart (Figure 1f).
3.2. Expression Levels of EMT and Stemness Genes Change Between Adherent Cells and Colonospheres
The expression of three EMT genes (SNAIL, SLUG and Vimentin) and of four stemness genes (OCT-4, c-Myc, SOX-2 and KLF-4) were evaluated by qPCR in monolayer and CSCs culture. The HT-29 CSCs exhibited reduced levels of SNAIL and SLUG expression compared with parental adherent cells with a fold change of 0.16 (p<0.001) and 0.46 (p<0.05), respectively, and higher levels of Vimentin in CSCs compared with monolayer-cultured cells with a fold change of 71.30 (p<0.05). The expression of stemness genes OCT-4 and SOX-2 was significantly higher in spheres derived from HT-29 cell line with a fold change of 2.99 (p<0.01) and 2.11 (p<0.01), respectively, but c-Myc and KLF-4 genes were downregulated in CSCs with a fold change of 0.27 (p<0.001) and 0.22 (p<0.001). (Figure 2a). In comparison to adherent cultured cells, T84 CSCs showed an incremented expression of SLUG and Vimentin genes, with a fold change of 9.46 (p < 0.01) and 7.86 (p < 0.05), respectively, while SNAIL expression remained unaltered. In T84 CSCs, all stemness genes were found to be upregulated in comparison with monolayer cells with a fold change of 29.96 for OCT-4 (p<0.01), 4.43 (p<0.05) for c-Myc, 7.84 (p<0.05) for SOX-2 and 3.02 (p<0.05) for KLF-4 (Figure 2b).
3.3. miR-486-5p Is Downregulated In Colonospheres Culture Model
The expression of miR-486-5p was evaluated both in monolayer culture model and in CSC culture model derived from HT-29 and T84 cell lines using qPCR. Results show that the expression levels of miR-486-5p were significantly downregulated in the CSC model compared with the monolayer model. Specifically, miR-486-5p was found to be 0.23-fold lower in HT-29 sphere-cultured cells in comparison to the monolayer counterpart (p<0.05) (Figure 3a), and 0.0015-fold lower in T84 spheroid in comparison to the adherent-cultured cells (p<0.01) (Figure 3b).
3.4. The Effect of Transfection on Cellular Viability
The cellular viability was assessed by Alamar blue assay at time 0 (T0) and after 72 h (T72) of transfection in monolayer and spheroid cultures of both CRC cell lines. The results were obtained after normalization and expressed as percentage. In HT-29 monolayer culture, the viability rate was found to be lower in both mimic (135%) and inhibitor (145%) treated cells, with a statistically significant difference observed only in the mimic-treated cells compared with control (non-transfected) cells (170%) (Figure 4a). In T84 adherent cells, the percentage of viability decreased from 859% in control cells to 708% (p<0.05) in mimic-treated cells and to 748% (p<0.05) in inhibitor-treated cells (Figure 4b). The results obtained on the spheres of both cell lines showed no statistically significant differences (Figure 4c and Figure 4d).
3.5. miR-486-5p Module the ALDH1 Activity in Both Adherent and CSCs
The ALDH1 activity was evaluated after miR-486-5p mimic and inhibitor transfection in HT-29 and T84 cell lines. In HT-29 monolayer the ALDH1-positive cells increased from 6.1% in control cells to 6.95% (p<0.05) in mimic-treated cells and to 8.75% (p<0.001) in inhibitor-treated cells. A comparison of cells treated with the mimic and cells treated with the inhibitor reveals a statistically significant increase in the percentage of ALDH1-positive cells following treatment with the inhibitor (Figure 5a). In adherence-cultured T84 cells, there were no differences in ALDH1 activity between mimic-treated and control cells. However, there was a significant increase in ALDH1 activity from 10.85% in control cells to 21.5% in inhibitor-treated cells (p < 0.001), and a statistically significant increase in inhibitor-treated cells compared with the mimic-treated cells (p < 0.001) (Figure 5b). In HT-29 CSCs the ALDH1 percentage increased from 74.2% in control cells to 83.45% (p<0.001) in mimic-treated CSCs and to 82.7% (p<0.001) in inhibitor-treated cells (Figure 5c). In T84 colonospheres, the percentage of ALDH1-positive cells exhibited a significant decline from 24.55% in no-transfected cells to 13.3% (p < 0.001) in mimic-treated cells and to 21.05% (p<0.01) in inhibitor-treated cells. Furthermore, the data indicates a statistically significant increase in the percentage of ALDH1-positive cells following treatment with the inhibitor, in comparison to cells treated with the mimic (p<0.01). (Figure 5d).
3.6. The Effect of Transfection on Epithelial-Mesenchimal Tansition (EMT) and Stemness Genes Expression
The expression levels of EMT and Stemness genes were evaluated in adherent cells and colonospheres derived from HT-29 and T84 cell lines transfected with miR-486-5p mimic or inhibitor and in untrasfected cells. The levels of SNAIL were found to increase following the inhibition of miR-486-5p in HT-29 adherent cells, in comparison to the control and mimic-treated cells. Conversely, the levels of SNAIL were observed to decrease in inhibitor-treated T84 monolayer cells, in comparison to the control and mimic-treated cells. SLUG expression was decreased by miRNA inhibition in HT-29 adherent culture compared to control and in HT-29 colonospheres compared to untransfected colonospheres. In inhibitor-treated T84 colonospheres it was less expressed respect to control but it resulted more expressed in comparison with mimic-treated cells. The expression levels of Vimentin were reduced in HT-29 colonospheres treated with the mimic with respect to control, but it was further reduced compared to mimic when miRNA was inhibited. OCT-4 in HT-29 adherent cells was underexpressed after both mimic and inhibitor transfection respect to untreated cells, but there was a significant increase of its levels in inhibitor-treated cells compared to mimic-treated cells. In HT-29 colonospheres it was overexpressed after mimic transfection, and it was decreased after inhibition of miR-486-5p respect to mimic-treated cells in T84 adherent cells and in HT-29 and T84 colonospheres. c-Myc expression levels were reduced after both mimic and inhibitor transfection compared to control in T84 adherent cells. Its expression was higher after miRNA inhibition compared to mimic-treated cells in HT-29 monolayer cells and in both colonosphere cultures. Inhibition of miR-486-5p caused a significant reduction of SOX-2 expression in HT-29 adherent cells and in HT-29 and T84 colonospheres compared to mimic-treated cells. In T84 monolayer cells it resulted underexpressed after transfection of the mimic with respect to inhibitor transfected cells. Transfection did not appear to affect the expression of KLF-4 in any of the models employed (Figure 6).
3.7. miR-486-5p Inhibition Enhances the Clonogenic Activity in Cells
We tested the in vitro functional characteristic of miR-486-5p mimic and inhibitor in secondary colonospheres obtained from HT-29 and T84 cell lines, in order to reproduce its overexpression or downregulation. We studied their clonogenic activity by colony-formation assay in soft agar. We calculated the mean value of the number of colonies, the mean value of colonies size, and the amount of colonies within specific size ranges. Colonies larger than 2,500 µm2 were counted and analyzed by ImageJ software. The following size ranges were selected for analysis: from 2,500 µm2 to 5,000 µm2 µm, from 5,100 µm2 to 10,000 µm2, from 10,100 µm2 to 15,000 µm2, from 15,100 µm2 to 20,000 µm2, and from 20,100 µm2 and above. miR-486-5p mimic significantly increase the clonogenic activity of HT-29 spheres-derived. Figure 7g graphically illustrates the increase in colony formation (number of colonies) and reduction in colony size observed in mimic-transfected cells relative to non-transfected cells. In contrast, inhibitor-treated cells exhibited a reduction in the number of colonies and an increment in colonies size respect to untreated cells. Specifically, untreated control cells showed an average of 378 colonies with an average size of 21,400 μm2; mimic-treated cells showed an average of 616.75 colonies with an average size of 17,279.75 μm2; inhibitor-treated cells showed an average of 239.75 colonies with an average size of 37,898.75 μm2. Comparing colonies based on size range, it was observed that the percentage of mimic-treated colonies in 2,500-5,000 μm2 and 5,100-10,000 μm2 range was higher with respect to inhibitor-treated spheres and to control cells. The amount of colonies bigger than 20,100 μm2 was higher in inhibitor-treated cells respect to mimic-treated cells and the percentage of mimic-treated colonies bigger than 20,100 μm2 was lower respect to control cells and to inhibitor-treated cells (Figure 7). T84 spheres-derived showed a significant increment in the number of colonies in inhibitor-treated spheres respect to mimic-treated spheres, and a significant reduction of colonies size in mimic-treated spheres respect to untreated spheres. Dividing cells on size range, mimic-treated spheres exhibited a higher percentage of colonies between 2,500 and 5,000 μm2 and a lower percentage between 5,100 and 10,000 μm2 and between 10,100 and 15,000 μm2 related to control and to inhibitor-treated colonies. The amount of inhibitor-treated colonies in 2,500-5,000 μm2 range was incremented related to control but reduced respect to mimic-treated colonies. In 5,100-10,000 μm2 and 10,100-15,000 μm2 ranges the percentage of inhibitor-treated colonies was lower respect to control and higher respect to mimic-treated colonies. The percentage of inhibitor-treated colonies bigger than 20,100 μm2 was lower respect to control cells (Figure 8).
4. Discussion
Colorectal cancer (CRC) is a well-studied neoplasm with extensive and heterogeneous genomic aberrations, slow progression and well-defined risk factors [26]. Stage at diagnosis is the most important predictor of survival but popular screening methods unfortunately show low sensitivity [2]. An increasing body of evidence suggests that the heterogeneity of CRC is related to colorectal cancer stem cells (CCSCs), thereby supporting the hypothesis that the onset, progression and development of drug resistance in CRC may be related to the maintenance of a CCSCs phenotype through deregulation of the pathways involved in differentiation, transformation, growth and epithelial-to-mesenchymal transition (EMT) [27]. Recent data have demonstrated the significant role of epigenetics in regulating the function of CRC cells and CCSCs [7]. Non-coding RNAs, particularly miRNAs, regulate gene expression and play key roles in cellular functions like self-renewal and differentiation [28]. Due to their stability in biological samples, miRNAs have emerged as promising biomarkers for CRC [17]. Previous research from our group showed that miR-486-5p was downregulated in tumor tissue of CRC patients compared with the healthy counterpart, and in serum was shown the miR486-5p downregulation in metastatic patients compared to non metastatics. Including miR-486-5p in predictive models moderately improved diagnostic and prognostic accuracy when combined with other diagnostic and prognostic factors [23]. The miR-486-5p tumor suppressor role has been identified in lung cancer [29], gastric cancer [30], liver cancer [31], renal cancer [32], thyroid cancer [33], and in ovarian cancer [34]. In contrast, miR-486-5p was observed to be overexpressed in prostate cancer tissues and cell lines, and in vivo studies have demonstrated that miR-486-5p acts as an oncomiR in prostate cancer, as it plays a pivotal role in prostate cancer pathogenicity [35]. In glioblastoma, miR-486–5p also functions as an oncomiR. Indeed, forced expression of miR-486–5p enhanced the self-renewal capacity of glioblastoma neurospheres, while inhibition of endogenous miR-486–5p activated PTEN and FoxO1 and induced cell death [36]. This dual function can be explained by considering the fact that a single miRNA molecule has the ability to target tens to hundreds of different mRNAs, which may have opposing oncogenic or tumor-suppressive functions [37]. Given the involvement of miRNAs in CSCs maintenance, the role of miR-486-5p in the stem cell phenotype has been investigated in CSCs of various tumor types. According to different studies, miR-486-5p may act both as a tumor suppressor and as an oncogene [20,36]. In our previous study, we also evaluated the effects of miR-486-5p on CCSCs using a three-dimensional spheres culture model. The results showed that miR-486-5p has a suppressive role in stemness characteristics, resulting to be downregulated in cancer stem-like cells obtained from different CRC cell lines compared to cells grown in adherent condition, having an effect on stemness genes and and the Wnt, Notch, Hedgehog, and TGF-β pathways. Given the results obtained at the molecular level, this study aims to elucidate the phenotypic and functional effects of miR-486-5p [23]. To confirm its role in CRC and to expand our understanding of its involvement in CSC phenotype, in this work we mimicked an overexpression and a downregulation of the miR-486-5p through transfection of monolayer cells and spheroids enriched in CSCs obtained from the HT-29 and T84 cell lines, representative of the primary colorectal tumor and of the metastatic disease, respectively. Subsequently, a series of functional experiments were conducted to examine the effect of the transfection on the cells grown in adherent conditions and colonospheres of both cell lines. First, we evaluated the characteristics of CSCs obtained by spheres culture, wherein CSCs are trapped and enriched, which is an extremely effective CSC isolation method for cancer cell lines [25]. The expression levels of miR-486-5p in adherent cells and colonospheres were evaluated by qPCR; data confirmed its downregulation in spheroids culture respect to adherent culture condition in both cell lines [23]. After, we assessed the presence of CSCs in spheroid culture models evaluating the ALDH1 activity, a validated CSCs marker in various tumors including CRC [38,39,40]. ALDH1 positive cells percentage were observed to differ between the two cell lines grown in adherence, as reported also by Alowaidi et al., who identified differences in ALDH1 percentage between two colon cell lines [41]. When we compared ALDH1 activity between the two culture models, our results showed a higher percentage of ALDH1-positive cells in spheroid culture models of both cell lines respect to adherence cultured cells. This indicates that both lines were capable of forming colonospheres. After treatments with miR-486-5p mimic and inhibitor, it was observed that ALDH1 activity was affected by transfection in a different manner in the two cell lines. The results of the T84 line experiments confirm the tumor-suppressor role of miR-486-5p. In fact, when cells were treated with the inhibitor, ALDH1 levels were higher compared to those treated with the mimic. In HT-29 cells, we observed an increase in ALDH1 in treated cells compared to the control, both in adherent cells and colonospheres. However, in adherent cells, a slight increase of ALDH1 positive cells was observed when treated with the inhibitor rather than with the mimic; the same was not observed in the colonospheres, where almost identical levels of ALDH1 was observed between cells treated with the inhibitor and those treated with the mimic. The increase in ALDH1 in treated cells in respect to control may be related to a response to treatment; in the literature, it has been observed that in some tumors, its levels can increase in response to treatments [42,43]. CSCs are also characterized by high levels of stemness- and EMT-related genes [44,45]. To characterize the effect of miR-486-5p on stemness and EMT, we compared the expression levels of stemness genes, including OCT-4, SOX-2, c-Myc, and KLF-4, and EMT genes, including Vimentin, SNAIL and SLUG, in both spheroids and parental cells. The transcription factors SOX-2, OCT-4, c-Myc and KLF-4 are known to play critical roles in the regulation of gene expression and are particularly important in the context of cell reprogramming and induced pluripotent stem cells (iPSCs). They have been shown to be overexpressed in CSCs of various tumor types and are therefore used as CSC biomarkers [25,46,47,48,49,50]. When we assessed the expression levels of CSC biomarkers in colonospheres obtained from HT-29 and T84 cell lines, SOX-2 and OCT-4 resulted to be overexpressed in HT-29 colonospheres respect to adherent cells, and OCT-4, SOX-2, c-Myc and KLF-4 resulted to be overregulated in T84 colonospheres in comparison with the adherent counterpart. These data were a further confirmation of the presence of CSCs in our spheroid culture model. To evaluate the effects of miR-486-5p transfection in our culture models (monolayer and spheres culture models), we assessed the same transcription factors in mimic-, inhibitor-transfected and untransfected cells. In our study, the effect of miR-486-5p on OCT-4 as a stemness inhibitor is not entirely clear; in fact, this was observed only in the HT-29 monolayer, where cells treated with the mimic show lower OCT-4 expression compared to those treated with the inhibitor. On the other hand, in HT-29 colonospheres and under both conditions in T84 cells, a result diametrically opposite to that of the HT-29 monolayer was observed. The overexpression of OCT-4 following transfection of miR-486-5p into HT-29 colonospheres may be attributed to the activation of a mechanism aimed at the cells’ attempt to resist the treatment and caused by the treatment itself, as previously reported by other authors who describe an increase in OCT-4 levels in cells treated with a combination of antitumor BEZ235 and miR-21 inhibitor [51]. In our study, miR-486-5p has been observed to enhance the expression of SOX-2 in HT-29 adherent cells and in colonospheres models (pointing out that in the HT-29 colonosphere model, SOX-2 increase showed significance only when compared with cells in which miR-486-5p was inhibited but not with the control cells). Gross-Cohen et al. have provided evidence that the silencing of SOX-2 has been linked to the development of larger tumors, whereas the overexpression of SOX-2 has been associated with the formation of smaller tumors. These findings are also consistent with our results on clonogenic activity in agar assays, confirming that higher expression of SOX-2 corresponds to smaller colonies [52]. In T84 adherent cells SOX-2 appears to be repressed by miR-486-5p and enhanced when the miRNA was inhibited, indicating a direct inhibitory effect of miR-486-5p on SOX-2 expression in this model. These results suggests that the role of SOX-2 may vary in certain contexts, potentially exerting opposing effects beyond a simple prostaminal role [52,53]. The expression levels of c-Myc were found to be higher in both colonospheres models when miR-486-5p was inhibited, in comparison with colonospheres in which miRNA overexpression was simulated. This effect appears to support the hypothesis that miR486-5p plays a protective role with respect the CSC phenotype [54,55,56]. This finding is consistent with what we observed in our previous work and with the literature, as other authors have highlighted its involvement in CSCs [23,56] as well as the influence of miR-486-5p on c-Myc in CRC [57]. Vimentine, SNAIL and SLUG overexpression was demonstrated in several tumors, including CRC [58,59,60,61,62,63,64]. Given their role in EMT, they are considered marker of this process [65,66,67]. When we assessed the expression levels of EMT biomarkers in colonospheres obtained from HT-29 and T84 cell lines, data showed that Vimentin was upregulated in HT-29 colonospheres compared to the adherent counterpart and SLUG and Vimentin was upregulated in T84 colonospheres compared to T84 adherent cells. The EMT process is not a simple two-step event in which tumor cells lose epithelial markers and acquire mesenchymal traits, switching between two fixed phenotypes. Recent studies have shown that tumor cells gain mesenchymal traits sequentially, while retaining some of the previously expressed epithelial characteristics [68]. Furthermore, Jolly, Jia and colleagues demonstrated that partial EMT is linked to stemness [69]. Our data indicated that HT-29 colonosphere models expressed Vimentine as mesenchymal marker, while T84 colonospheres exhibited increased levels of SNAIL and Vimentin in comparison with its respective to adherent counterpart. How miR-486-5p affected EMT process is not clear. The distinctive mutations of our models (such as BRAF and PIK3CA) directly regulate the expression levels of EMT markers via the same pathway that appears to be affected by the inhibition or overexpression of miR-486-5p [70,71,72,73,74]. Vimentine expression resulted significantly downregulated in HT-29 colonospheres but without statistical difference between mimic and inhibitor miR-486-5p transfection and no statistical differences resulted after the transfections in monolayer models and T84 colonospheres. miRNA-486-5p probably was no directly related with Vimentine expression levels but it can influenced Vimentine expression in this specific model (HT-29 colonospheres). The inhibition of miR-486-5p promoted SNAIL expression in HT-29 adherent cells, while in T84 adherent cell models it was seen to suppress SNAIL expression. SLUG resulted downregulated in all culture models after transfections with both miR-486-5p mimic and inhibitor, but the miRNA exerts its suppressive role in the T84 colonosphere model in which miR-486-5p inhibition increases SLUG expression compared to colonosphere in which we simulated the miRNA overexpression. These findings suggest the existence of differences in the involved and activated pathways between the two cell lines, which are plausibly caused by the presence of different genetic mutations [75]. The results collectively indicate that miR-486-5p exerts a complex and variable influence on the pathways regulating stemness- and EMT-associated transcription factors in our in vitro models. Its effect may vary not only between different cell lines, but also between different culture conditions, suggesting that cellular context and microenvironment play a critical role in determining the efficacy of miR-486-5p as a tumor suppressor. Another necessary consideration concerns the fact that the maintenance of the CSCs phenotype despite the absence of upregulation of all stemness and EMT markers can be attributed to the flexibility of stemness networks. Indeed, evidence suggests that certain transcription factors can induce a stem phenotype even when acting individually, through the activation of specific sets of human pluripotency regulators [76]. In our study, we conducted the expression analysis of multiple stemness markers but probably not the combination of markers responsible for maintaining the stemness characteristics observed in transfected colonospheres generated in our laboratory. The impact of transfection was most pronounced when the colonospheres were cultivated in soft agar to evaluate their colony-forming capacity, which is an indicator of cells metastatic potential [77,78]. This technique allowed us to examine the ability of a single cell to grow into a large colony through clonal expansion and to expand CSCs [77,79]. The results of our experiments confirmed that miR-486-5p exerts a suppressive effect on HT-29 colonies. This was highlighted by the fact that when the miRNA content was increased using the mimic, the size of the colonies decreased, contrary to what happened with the use of the inhibitor. Additionally, we observed a correlation between changes in colony size and alterations in the number of colonies. Specifically, a decrease in colony size corresponded to an increase in the number of colonies, and vice versa. This phenomenon may be the result of competition for nutrients: the number of colonies present may be attributed to the equilibrium between the available nutrients and the replication rate of the cells. miRNA 486-5p does not appear to have exerted a direct influence on the viability of the cells, as evidenced by the outcomes of the Alamar blue cell viability assay. However, we postulate that miRNA was capable of limiting the proliferation of cells that, having survived the miR-486-5p treatment, still formed colonies but proliferated at a low rate, resulting in small colonies. On the other hand, miRNA inhibition may have enhanced the proliferative capacity of cells that were able to proliferate by forming large colonies at the expense of other cells that, due to nutrient scarcity, did not form colonies. So, here is an increase in proliferation, but this is limited by nutrient availability, which gave an advantage to the larger colonies. This hypothesis would elucidate why the proliferation assay demonstrated no difference in the proliferation rate of colonospheres despite the evident increase in colony size when miRNA was inhibited and the reduction in size when miRNA overexpression was simulated. This interpretation aligns with previous studies that have highlighted the role of miRNAs in modulating stem cell properties and tumor growth. For instance, Chakraborty et al. emphasized that miRNAs can influence the balance between proliferation and differentiation in stem cells, affecting their tumorigenic potential [80]. Moreover, studies by Lobel et al. [81] demonstrated that nutrient availability plays a crucial role in regulating cell proliferation and colony formation in cancer models. The effect of transfection in T84 colonies was less pronounced yet exhibited a comparable trend. Once more, a reduction in colony size was observed following the simulated overexpression of miR-486-5p, though not to the same extent as in HT-29. It may be hypothesized that this discrepancy can be attributed to the fact that, as this was an already metastatic line, more active metastatic signals were present, which attenuated the suppressive power of miR-486-5p. Furthermore, in this case, there appears to be no competition for nutrients, and a reduction in colony size was accompanied by a decline in colony number. Once more, this could be attributed to the relatively limited impact of miRNA on this particular cell line, given the diverse metastatic active signals. Consequently, the effect of miRNA was insufficient to markedly reduce or increase the proliferative rate of these cells, although a slight reduction in colony size was observed. Considering that clonogenic activity represents a highly sensitive indicator of undifferentiated CSCs, and that colony size are directly correlated with cells proliferation, our results suggest that miR-486-5p has the capacity to inhibit CSCs proliferation, resulting in reduced colony size [77,82].
5. Conclusions
The present study demonstrates that miR-486-5p plays a role in CCSCs proliferation and, consequently, in the promotion of CRC. Our in vitro experiments suggest that miR-486-5p affects pathways regulating stemness and EMT transcription factors, with varying outcomes between cell lines and culture conditions. This highlights the critical role of the cellular context and microenvironment in miR-486-5p efficacy as a tumor suppressor. Based on our previous studies and on the results obtained in this work with the colony formation assay, in which we obtained an increase in colony size with the inhibition of miR-486-5p and a decrease when we simulated its overexpression, we can assume that miR-486-5p does effectively affect the stemness phenotype. These results encourage us to carry out in vivo experiments to gain further insight into the real role of miR-486-5p on progression and metastasis in CRC, which could have a future clinical impact in both the diagnosis and treatment.
Author Contributions
Conceptualization, Federica Etzi, Carmen Griñán-Lisón, Grazia Fenu, Aitor González-Titos, Andrea Pisano, Cristiano Farace, Angela Sabalic, Manuel Picon-Ruiz, Juan Antonio Marchal and Roberto Madeddu; Data curation, Federica Etzi, Carmen Griñán-Lisón and Grazia Fenu; Investigation, Federica Etzi, Andrea Pisano and Angela Sabalic; Methodology, Federica Etzi, Carmen Griñán-Lisón, Grazia Fenu, Aitor González-Titos, Andrea Pisano, Cristiano Farace, Manuel Picon-Ruiz and Juan Antonio Marchal; Supervision, Juan Antonio Marchal and Roberto Madeddu; Writing – original draft, Federica Etzi; Writing – review & editing, Carmen Griñán-Lisón, Grazia Fenu, Andrea Pisano, Juan Antonio Marchal and Roberto Madeddu.
Funding
This research was funded by the Ministry of Science, Innovation and Universities (MCIN/AEI/10.13039/501100011033/ the European Union NextGenerationEU/PRTR) grant number PID2022-140151OB-C22, and the Chair “Doctors Galera-Requena in cancer stem cell research” (CMC-CTS963).
Institutional Review Board Statement
Not applicable.
Conflicts of Interest
The authors declare no conflicts of interest.
References
- Bray F, Laversanne M, Sung H, Ferlay J, Siegel RL, Soerjomataram I, Jemal A. Global cancer statistics 2022: GLOBOCAN estimates of incidence and mortality worldwide for 36 cancers in 185 countries. CA Cancer J Clin. 2024 May-Jun;74(3):229-263. [CrossRef] [PubMed]
- Siegel RL, Wagle NS, Cercek A, Smith RA, Jemal A. Colorectal cancer statistics, 2023. CA Cancer J Clin. 2023 May-Jun;73(3):233-254. [CrossRef] [PubMed]
- Purandare NC, Dua SG, Arora A, Shah S, Rangarajan V. Colorectal cancer - patterns of locoregional recurrence and distant metastases as demonstrated by FDG PET / CT. Indian J Radiol Imaging. 2010 Nov;20(4):284-8. [CrossRef] [PubMed]
- Li J, Ma X, Chakravarti D, Shalapour S, DePinho RA. Genetic and biological hallmarks of colorectal cancer. Genes Dev. 2021 Jun;35(11-12):787-820. [CrossRef] [PubMed]
- Tabuso M, Homer-Vanniasinkam S, Adya R, Arasaradnam RP. Role of tissue microenvironment resident adipocytes in colon cancer. World J Gastroenterol. 2017 Aug 28;23(32):5829-5835. [CrossRef] [PubMed]
- AlMusawi S, Ahmed M, Nateri AS. Understanding cell-cell communication and signaling in the colorectal cancer microenvironment. Clin Transl Med. 2021 Feb;11(2):e308. [CrossRef] [PubMed]
- Ebrahimi N, Afshinpour M, Fakhr SS, Kalkhoran PG, Shadman-Manesh V, Adelian S, Beiranvand S, Rezaei-Tazangi F, Khorram R, Hamblin MR, Aref AR. Cancer stem cells in colorectal cancer: Signaling pathways involved in stemness and therapy resistance. Crit Rev Oncol Hematol. 2023 Feb;182:103920. [CrossRef] [PubMed]
- Jiménez G, Hackenberg M, Catalina P, Boulaiz H, Griñán-Lisón C, García MÁ, Perán M, López-Ruiz E, Ramírez A, Morata-Tarifa C, Carrasco E, Aguilera M, Marchal JA. Mesenchymal stem cell’s secretome promotes selective enrichment of cancer stem-like cells with specific cytogenetic profile. Cancer Lett. 2018 Aug 10;429:78-88. [CrossRef] [PubMed]
- Gupta R, Bhatt LK, Johnston TP, Prabhavalkar KS. Colon cancer stem cells: Potential target for the treatment of colorectal cancer. Cancer Biol Ther. 2019;20(8):1068-1082. [CrossRef] [PubMed]
- Ricci-Vitiani L, Lombardi DG, Pilozzi E, Biffoni M, Todaro M, Peschle C, De Maria R. Identification and expansion of human colon-cancer-initiating cells. Nature. 2007 Jan 4;445(7123):111-5. [CrossRef] [PubMed]
- O’Brien CA, Pollett A, Gallinger S, Dick JE. A human colon cancer cell capable of initiating tumour growth in immunodeficient mice. Nature. 2007 Jan 4;445(7123):106-10. [CrossRef] [PubMed]
- Dalerba P, Dylla SJ, Park IK, Liu R, Wang X, Cho RW, Hoey T, Gurney A, Huang EH, Simeone DM, Shelton AA, Parmiani G, Castelli C, Clarke MF. Phenotypic characterization of human colorectal cancer stem cells. Proc Natl Acad Sci U S A. 2007 Jun 12;104(24):10158-63. [CrossRef] [PubMed]
- Puglisi MA, Tesori V, Lattanzi W, Gasbarrini GB, Gasbarrini A. Colon cancer stem cells: controversies and perspectives. World J Gastroenterol. 2013 May 28;19(20):2997-3006. [CrossRef] [PubMed]
- Medema JP, Vermeulen L. Microenvironmental regulation of stem cells in intestinal homeostasis and cancer. Nature. 2011 Jun 15;474(7351):318-26. [CrossRef] [PubMed]
- Subramanian S, Steer CJ. Special Issue: MicroRNA Regulation in Health and Disease. Genes (Basel). 2019 Jun 15;10(6):457. [CrossRef] [PubMed]
- Tie Y, Liu B, Fu H, Zheng X. Circulating miRNA and cancer diagnosis. Sci China C Life Sci. 2009 Dec;52(12):1117-22. [CrossRef] [PubMed]
- Balacescu O, Sur D, Cainap C, Visan S, Cruceriu D, Manzat-Saplacan R, Muresan MS, Balacescu L, Lisencu C, Irimie A. The Impact of miRNA in Colorectal Cancer Progression and Its Liver Metastases. Int J Mol Sci. 2018 Nov 22;19(12):3711. [CrossRef] [PubMed]
- Rupaimoole R, Calin GA, Lopez-Berestein G, Sood AK. miRNA Deregulation in Cancer Cells and the Tumor Microenvironment. Cancer Discov. 2016 Mar;6(3):235-46. [CrossRef] [PubMed]
- Farace C, Pisano A, Griñan-Lison C, Solinas G, Jiménez G, Serra M, Carrillo E, Scognamillo F, Attene F, Montella A, Marchal JA, Madeddu R. Deregulation of cancer-stem-cell-associated miRNAs in tissues and sera of colorectal cancer patients. Oncotarget. 2020 Jan 14;11(2):116-130. [CrossRef] [PubMed]
- Yan X, Liu X, Wang Z, Cheng Q, Ji G, Yang H, Wan L, Ge C, Zeng Q, Huang H, Xi J, He L, Nan X, Yue W, Pei X. MicroRNA-486-5p functions as a tumor suppressor of proliferation and cancer stem-like cell properties by targeting Sirt1 in liver cancer. Oncol Rep. 2019 Mar;41(3):1938-1948. [CrossRef] [PubMed]
- Zhang X, Zhang T, Yang K, Zhang M, Wang K. miR-486-5p suppresses prostate cancer metastasis by targeting Snail and regulating epithelial-mesenchymal transition. Onco Targets Ther. 2016 Nov 8;9:6909-6914. [CrossRef] [PubMed]
- Liu X, Chen X, Zeng K, Xu M, He B, Pan Y, Sun H, Pan B, Xu X, Xu T, Hu X, Wang S. DNA-methylation-mediated silencing of miR-486-5p promotes colorectal cancer proliferation and migration through activation of PLAGL2/IGF2/β-catenin signal pathways. Cell Death Dis. 2018 Oct 10;9(10):1037. [CrossRef] [PubMed]
- Pisano A, Griñan-Lison C, Farace C, Fiorito G, Fenu G, Jiménez G, Scognamillo F, Peña-Martin J, Naccarati A, Pröll J, Atzmüller S, Pardini B, Attene F, Ibba G, Solinas MG, Bernhard D, Marchal JA, Madeddu R. The Inhibitory Role of miR-486-5p on CSC Phenotype Has Diagnostic and Prognostic Potential in Colorectal Cancer. Cancers (Basel). 2020 Nov 19;12(11):3432. [CrossRef] [PubMed]
- Jiménez G, Hackenberg M, Catalina P, Boulaiz H, Griñán-Lisón C, García MÁ, Perán M, López-Ruiz E, Ramírez A, Morata-Tarifa C, Carrasco E, Aguilera M, Marchal JA. Mes-enchymal stem cell’s secretome promotes selective enrichment of cancer stem-like cells with specific cytogenetic profile. Cancer Lett. 2018 Aug 10;429:78-88. [CrossRef] [PubMed]
- De Lara-Peña L, Farace C, Pisano A, de Andrés JL, Fenu G, Etzi F, Griñán-Lisón C, Marchal JA, Madeddu R. Mimicking the Tumor Niche: Methods for Isolation, Culture, and Characterization of Cancer Stem Cells and Multicellular Spheroids. Methods Mol Biol. 2024;2777:145-161. [CrossRef] [PubMed]
- Sullivan BA, Noujaim M, Roper J. Cause, Epidemiology, and Histology of Polyps and Pathways to Colorectal Cancer. Gastrointest Endosc Clin N Am. 2022 Apr;32(2):177-194. [CrossRef] [PubMed]
- Frank NY, Schatton T, Frank MH. The therapeutic promise of the cancer stem cell concept. J Clin Invest. 2010 Jan;120(1):41-50. [CrossRef] [PubMed]
- Croce CM, Calin GA. miRNAs, cancer, and stem cell division. Cell. 2005 Jul 15;122(1):6-7. [CrossRef] [PubMed]
- Yang S, Sui J, Liu T, Wu W, Xu S, Yin L, Pu Y, Zhang X, Zhang Y, Shen B, Liang G. Expression of miR-486-5p and its significance in lung squamous cell carcinoma. J Cell Biochem. 2019 Aug;120(8):13912-13923. [CrossRef] [PubMed]
- Oh HK, Tan AL, Das K, Ooi CH, Deng NT, Tan IB, Beillard E, Lee J, Ramnarayanan K, Rha SY, Palanisamy N, Voorhoeve PM, Tan P. Genomic loss of miR-486 regulates tumor progression and the OLFM4 antiapoptotic factor in gastric cancer. Clin Cancer Res. 2011;17(9):2657-67. [CrossRef] [PubMed]
- Yan X, Liu X, Wang Z, Cheng Q, Ji G, Yang H, Wan L, Ge C, Zeng Q, Huang H, Xi J, He L, Nan X, Yue W, Pei X. MicroRNA-486-5p functions as a tumor suppressor of proliferation and cancer stem-like cell properties by targeting Sirt1 in liver cancer. Oncol Rep. 2019 Mar;41(3):1938-1948. [CrossRef] [PubMed]
- He Y, Liu J, Wang Y, Zhu X, Fan Z, Li C, Yin H, Liu Y. Role of miR-486-5p in regulating renal cell carcinoma cell proliferation and apoptosis via TGF-β-activated kinase 1. J Cell Biochem. 2019 Mar;120(3):2954-2963. [CrossRef] [PubMed]
- Wen DY, Pan DH, Lin P, Mo QY, Wei YP, Luo YH, Chen G, He Y, Chen JQ, Yang H. Downregulation of miR-486-5p in papillary thyroid carcinoma tissue: A study based on microarray and miRNA sequencing. Mol Med Rep. 2018 Sep;18(3):2631-2642. [CrossRef] [PubMed]
- Ma H, Tian T, Liang S, Liu X, Shen H, Xia M, Liu X, Zhang W, Wang L, Chen S, Yu L. Estrogen receptor-mediated miR-486-5p regulation of OLFM4 expression in ovarian cancer. Oncotarget. 2016 Mar 1;7(9):10594-605. [CrossRef] [PubMed]
- Yang Y, Ji C, Guo S, Su X, Zhao X, Zhang S, Liu G, Qiu X, Zhang Q, Guo H, Chen H. The miR-486-5p plays a causative role in prostate cancer through negative regulation of multiple tumor suppressor pathways. Oncotarget. 2017 Aug 24;8(42):72835-72846. [CrossRef] [PubMed]
- Lopez-Bertoni H, Kotchetkov IS, Mihelson N, Lal B, Rui Y, Ames H, Lugo-Fagundo M, Guerrero-Cazares H, Quiñones-Hinojosa A, Green JJ, Laterra J. A Sox2:miR-486-5p Axis Regulates Survival of GBM Cells by Inhibiting Tumor Suppressor Networks. Cancer Res. 2020 Apr 15;80(8):1644-1655. [CrossRef] [PubMed]
- Svoronos AA, Engelman DM, Slack FJ. OncomiR or Tumor Suppressor? The Duplicity of MicroRNAs in Cancer. Cancer Res. 2016 Jul 1;76(13):3666-70. [CrossRef] [PubMed]
- Toledo-Guzmán ME, Hernández MI, Gómez-Gallegos ÁA, Ortiz-Sánchez E. ALDH as a Stem Cell Marker in Solid Tumors. Curr Stem Cell Res Ther. 2019;14(5):375-388. [CrossRef] [PubMed]
- Goossens-Beumer IJ, Zeestraten EC, Benard A, Christen T, Reimers MS, Keijzer R, Sier CF, Liefers GJ, Morreau H, Putter H, Vahrmeijer AL, van de Velde CJ, Kuppen PJ. Clinical prognostic value of combined analysis of Aldh1, Survivin, and EpCAM expression in colorectal cancer. Br J Cancer. 2014 Jun 10;110(12):2935-44. [CrossRef] [PubMed]
- Huang EH, Hynes MJ, Zhang T, Ginestier C, Dontu G, Appelman H, Fields JZ, Wicha MS, Boman BM. Aldehyde dehydrogenase 1 is a marker for normal and malignant human colonic stem cells (SC) and tracks SC overpopulation during colon tumorigenesis. Cancer Res. 2009 Apr 15;69(8):3382-9. [CrossRef] [PubMed]
- Alowaidi F, Hashimi SM, Alqurashi N, Alhulais R, Ivanovski S, Bellette B, Meedenyia A, Lam A, Wood S. Assessing stemness and proliferation properties of the newly established colon cancer ‘stem’ cell line, CSC480 and novel approaches to identify dormant cancer cells. Oncol Rep. 2018 Jun;39(6):2881-2891. [CrossRef] [PubMed]
- Yue H, Hu Z, Hu R, Guo Z, Zheng Y, Wang Y, Zhou Y. ALDH1A1 in Cancers: Bidirectional Function, Drug Resistance, and Regulatory Mechanism. Front Oncol. 2022 Jun 22;12:918778. [CrossRef] [PubMed]
- Sládek NE, Kollander R, Sreerama L, Kiang DT. Cellular levels of aldehyde dehydrogenases (ALDH1A1 and ALDH3A1) as predictors of therapeutic responses to cyclophosphamide-based chemotherapy of breast cancer: a retrospective study. Rational individualization of oxazaphosphorine-based cancer chemotherapeutic regimens. Cancer Chemother Pharmacol. 2002 Apr;49(4):309-21. [CrossRef] [PubMed]
- Hadjimichael C, Chanoumidou K, Papadopoulou N, Arampatzi P, Papamatheakis J, Kretsovali A. Common stemness regulators of embryonic and cancer stem cells. World J Stem Cells. 2015 Oct 26;7(9):1150-84. [CrossRef] [PubMed]
- Biddle A, Mackenzie IC. Cancer stem cells and EMT in carcinoma. Cancer Metastasis Rev. 2012 Feb 3. Epub ahead of print. [CrossRef] [PubMed]
- van Schaijik B, Davis PF, Wickremesekera AC, Tan ST, Itinteang T. Subcellular localisation of the stem cell markers OCT4, SOX2, NANOG, KLF4 and c-MYC in cancer: a review. J Clin Pathol. 2018 Jan;71(1):88-91. [CrossRef] [PubMed]
- Humphries HN, Wickremesekera SK, Marsh RW, Brasch HD, Mehrotra S, Tan ST, Itinteang T. Characterization of Cancer Stem Cells in Colon Adenocarcinoma Metastasis to the Liver. Front Surg. 2018 Jan 22;4:76. [CrossRef] [PubMed]
- Elbadawy M, Usui T, Yamawaki H, Sasaki K. Emerging Roles of C-Myc in Cancer Stem Cell-Related Signaling and Resistance to Cancer Chemotherapy: A Potential Therapeutic Target Against Colorectal Cancer. Int J Mol Sci. 2019;20(9):2340. [CrossRef] [PubMed]
- Anuja K, Kar M, Chowdhury AR, Shankar G, Padhi S, Roy S, Akhter Y, Rath AK, Banerjee B. Role of telomeric RAP1 in radiation sensitivity modulation and its interaction with CSC marker KLF4 in colorectal cancer. Int J Radiat Biol. 2020 Jun;96(6):790-802. [CrossRef] [PubMed]
- Wei D, Kanai M, Huang S, Xie K. Emerging role of KLF4 in human gastrointestinal cancer. Carcinogenesis. 2006 Jan;27(1):23-31. [CrossRef] [PubMed]
- Darido C, Georgy SR, Cullinane C, Partridge DD, Walker R, Srivastava S, Roslan S, Carpinelli MR, Dworkin S, Pearson RB, Jane SM. Stage-dependent therapeutic efficacy in PI3K/mTOR-driven squamous cell carcinoma of the skin. Cell Death Differ. 2018 Jun;25(6):1146-1159. [CrossRef] [PubMed]
- Gross-Cohen M, Yanku Y, Kessler O, Barash U, Boyango I, Cid-Arregui A, Neufeld G, Ilan N, Vlodavsky I. Heparanase 2 (Hpa2) attenuates tumor growth by inducing Sox2 expression. Matrix Biol. 2021 May;99:58-71. [CrossRef] [PubMed]
- Wuebben EL, Rizzino A. The dark side of SOX2: cancer - a comprehensive overview. Oncotarget. 2017 Jul 4;8(27):44917-44943. [CrossRef] [PubMed]
- Su C, Li D, Li N, Du Y, Yang C, Bai Y, Lin C, Li X, Zhang Y. Studying the mechanism of PLAGL2 overexpression and its carcinogenic characteristics based on 3’-untranslated region in colorectal cancer. Int J Oncol. 2018 May;52(5):1479-1490. [CrossRef] [PubMed]
- Garte SJ. The c-myc oncogene in tumor progression. Crit Rev Oncog. 1993;4(4):435-49. [PubMed]
- Xu BS, Chen HY, Que Y, Xiao W, Zeng MS, Zhang X. ALKATI interacts with c-Myc and promotes cancer stem cell-like properties in sarcoma. Oncogene. 2020 Jan;39(1):151-163. [CrossRef] [PubMed]
- Vlachos IS, Kostoulas N, Vergoulis T, Georgakilas G, Reczko M, Maragkakis M, Paraskevopoulou MD, Prionidis K, Dalamagas T, Hatzigeorgiou AG. DIANA miRPath v.2.0: investigating the combinatorial effect of microRNAs in pathways. Nucleic Acids Res. 2012 Jul;40(Web Server issue):W498-504. [CrossRef] [PubMed]
- Satelli A, Li S. Vimentin in cancer and its potential as a molecular target for cancer therapy. Cell Mol Life Sci. 2011 Sep;68(18):3033-46. [CrossRef] [PubMed]
- Ngan CY, Yamamoto H, Seshimo I, Tsujino T, Man-i M, Ikeda JI, Konishi K, Takemasa I, Ikeda M, Sekimoto M, Matsuura N, Monden M. Quantitative evaluation of vimentin expression in tumour stroma of colorectal cancer. Br J Cancer. 2007 Mar 26;96(6):986-92. [CrossRef] [PubMed]
- Kroepil F, Fluegen G, Vallböhmer D, Baldus SE, Dizdar L, Raffel AM, Hafner D, Stoecklein NH, Knoefel WT. Snail1 expression in colorectal cancer and its correlation with clinical and pathological parameters. BMC Cancer. 2013 Mar 22;13:145. [CrossRef] [PubMed]
- Yanagawa J, Walser TC, Zhu LX, Hong L, Fishbein MC, Mah V, Chia D, Goodglick L, Elashoff DA, Luo J, Magyar CE, Dohadwala M, Lee JM, St John MA, Strieter RM, Sharma S, Dubinett SM. Snail promotes CXCR2 ligand-dependent tumor progression in non-small cell lung carcinoma. Clin Cancer Res. 2009 Nov 15;15(22):6820-9. [CrossRef] [PubMed]
- Arumi-Planas M, Rodriguez-Baena FJ, Cabello-Torres F, Gracia F, Lopez-Blau C, Nieto MA, Sanchez-Laorden B. Microenvironmental Snail1-induced immunosuppression promotes melanoma growth. Oncogene. 2023 Sep;42(36):2659-2672. [CrossRef] [PubMed]
- Alves CC, Carneiro F, Hoefler H, Becker KF. Role of the epithelial-mesenchymal transition regulator Slug in primary human cancers. Front Biosci (Landmark Ed). 2009 Jan 1;14(8):3035-50. [CrossRef] [PubMed]
- Wang Y, Ngo VN, Marani M, Yang Y, Wright G, Staudt LM, Downward J. Critical role for transcriptional repressor Snail2 in transformation by oncogenic RAS in colorectal carcinoma cells. Oncogene. 2010 Aug 19;29(33):4658-70. [CrossRef] [PubMed]
- Thiery, JP. Epithelial-mesenchymal transitions in tumour progression. Nat Rev Cancer. 2002 Jun;2(6):442-54. [CrossRef] [PubMed]
- Wang Y, Shi J, Chai K, Ying X, Zhou BP. The Role of Snail in EMT and Tumorigenesis. Curr Cancer Drug Targets. 2013 Nov;13(9):963-972. [CrossRef] [PubMed]
- Subbalakshmi AR, Sahoo S, Biswas K, Jolly MK. A Computational Systems Biology Approach Identifies SLUG as a Mediator of Partial Epithelial-Mesenchymal Transition (EMT). Cells Tissues Organs. 2022;211(6):689-702. [CrossRef] [PubMed]
- Tam WL, Weinberg RA. The epigenetics of epithelial-mesenchymal plasticity in cancer. Nat Med. 2013 Nov;19(11):1438-49. [CrossRef] [PubMed]
- Jolly MK, Jia D, Boareto M, Mani SA, Pienta KJ, Ben-Jacob E, Levine H. Coupling the modules of EMT and stemness: A tunable ‘stemness window’ model. Oncotarget. 2015 Sep 22;6(28):25161-74. [CrossRef] [PubMed]
- Ren B, Liu H, Yang Y, Lian Y. Effect of BRAF-mediated PI3K/Akt/mTOR pathway on biological characteristics and chemosensitivity of NSCLC A549/DDP cells. Oncol Lett. 2021 Aug;22(2):584. [CrossRef] [PubMed]
- Lin K, Baritaki S, Militello L, Malaponte G, Bevelacqua Y, Bonavida B. The Role of B-RAF Mutations in Melanoma and the Induction of EMT via Dysregulation of the NF-κB/Snail/RKIP/PTEN Circuit. Genes Cancer. 2010 May;1(5):409-420. [CrossRef] [PubMed]
- Moro M, Fortunato O, Bertolini G, Mensah M, Borzi C, Centonze G, Andriani F, Di Paolo D, Perri P, Ponzoni M, Pastorino U, Sozzi G, Boeri M. MiR-486-5p Targets CD133+ Lung Cancer Stem Cells through the p85/AKT Pathway. Pharmaceuticals (Basel). 2022 Feb 28;15(3):297. [CrossRef] [PubMed]
- Xiao, Y. MiR-486-5p inhibits the hyperproliferation and production of collagen in hypertrophic scar fibroblasts via IGF1/PI3K/AKT pathway. J Dermatolog Treat. 2021 Dec;32(8):973-982. [CrossRef] [PubMed]
- Zhang Y, Fu J, Zhang Z, Qin H. miR-486-5p regulates the migration and invasion of colorectal cancer cells through targeting PIK3R1. Oncol Lett. 2018 May;15(5):7243-7248. [CrossRef] [PubMed]
- Iourov IY, Vorsanova SG, Yurov YB. Pathway-based classification of genetic diseases. Mol Cytogenet. 2019 Feb 4;12:4. [CrossRef] [PubMed]
- Zorzan I, Pellegrini M, Arboit M, Incarnato D, Maldotti M, Forcato M, Tagliazucchi GM, Carbognin E, Montagner M, Oliviero S, Martello G. The transcriptional regulator ZNF398 mediates pluripotency and epithelial character downstream of TGF-beta in human PSCs. Nat Commun. 2020;11(1):2364. [CrossRef] [PubMed]
- Nakamura, D. The evaluation of tumorigenicity and characterization of colonies in a soft agar colony formation assay using polymerase chain reaction. Sci Rep. 2023 Apr 3;13(1):5405. [CrossRef] [PubMed]
- Horibata S, Vo TV, Subramanian V, Thompson PR, Coonrod SA. Utilization of the Soft Agar Colony Formation Assay to Identify Inhibitors of Tumorigenicity in Breast Cancer Cells. J Vis Exp. 2015;(99):e52727. [CrossRef] [PubMed]
- Gheytanchi E, Naseri M, Karimi-Busheri F, Atyabi F, Mirsharif ES, Bozorgmehr M, Ghods R, Madjd Z. Morphological and molecular characteristics of spheroid formation in HT-29 and Caco-2 colorectal cancer cell lines. Cancer Cell Int. 2021 Apr 13;21(1):204. [CrossRef] [PubMed]
- Chakraborty C, Chin KY, Das S. miRNA-regulated cancer stem cells: understanding the property and the role of miRNA in carcinogenesis. Tumour Biol. 2016 Oct;37(10):13039-13048. [CrossRef] [PubMed]
- Lobel GP, Jiang Y, Simon MC. Tumor microenvironmental nutrients, cellular responses, and cancer. Cell Chem Biol. 2023 Sep 21;30(9):1015-1032. [CrossRef] [PubMed]
- Rajendran V, Jain MV. In Vitro Tumorigenic Assay: Colony Forming Assay for Cancer Stem Cells. Methods Mol Biol. 2018;1692:89-95. [CrossRef] [PubMed]
Figure 1.
Representative image of secondary spheres formed from HT-29 cell lines (a), and from T84 cell lines (b) obtained in serum-free non-adherent condition. Image captured with 10x lens; ALDH1 positive cells percentage in adherence-grown cells and in spheres obtained from HT-29 cell lines (c), and from T84 cell lines (d); cell viability rate of adherence-grown cells and of spheres obtained from HT-29 cell lines (e), and from T84 cell lines (f). Representative flow cytometry cytogram plot of ALDH1 activity in monolayer cells and spheres; x-axis: FSC-A/ALDH1, y-axis: SSC-A/side scatter (g). The symbol *** indicates statistical difference between monolayer cells and spheres with p-value < 0.001. Values expressed as Mean ± SE.
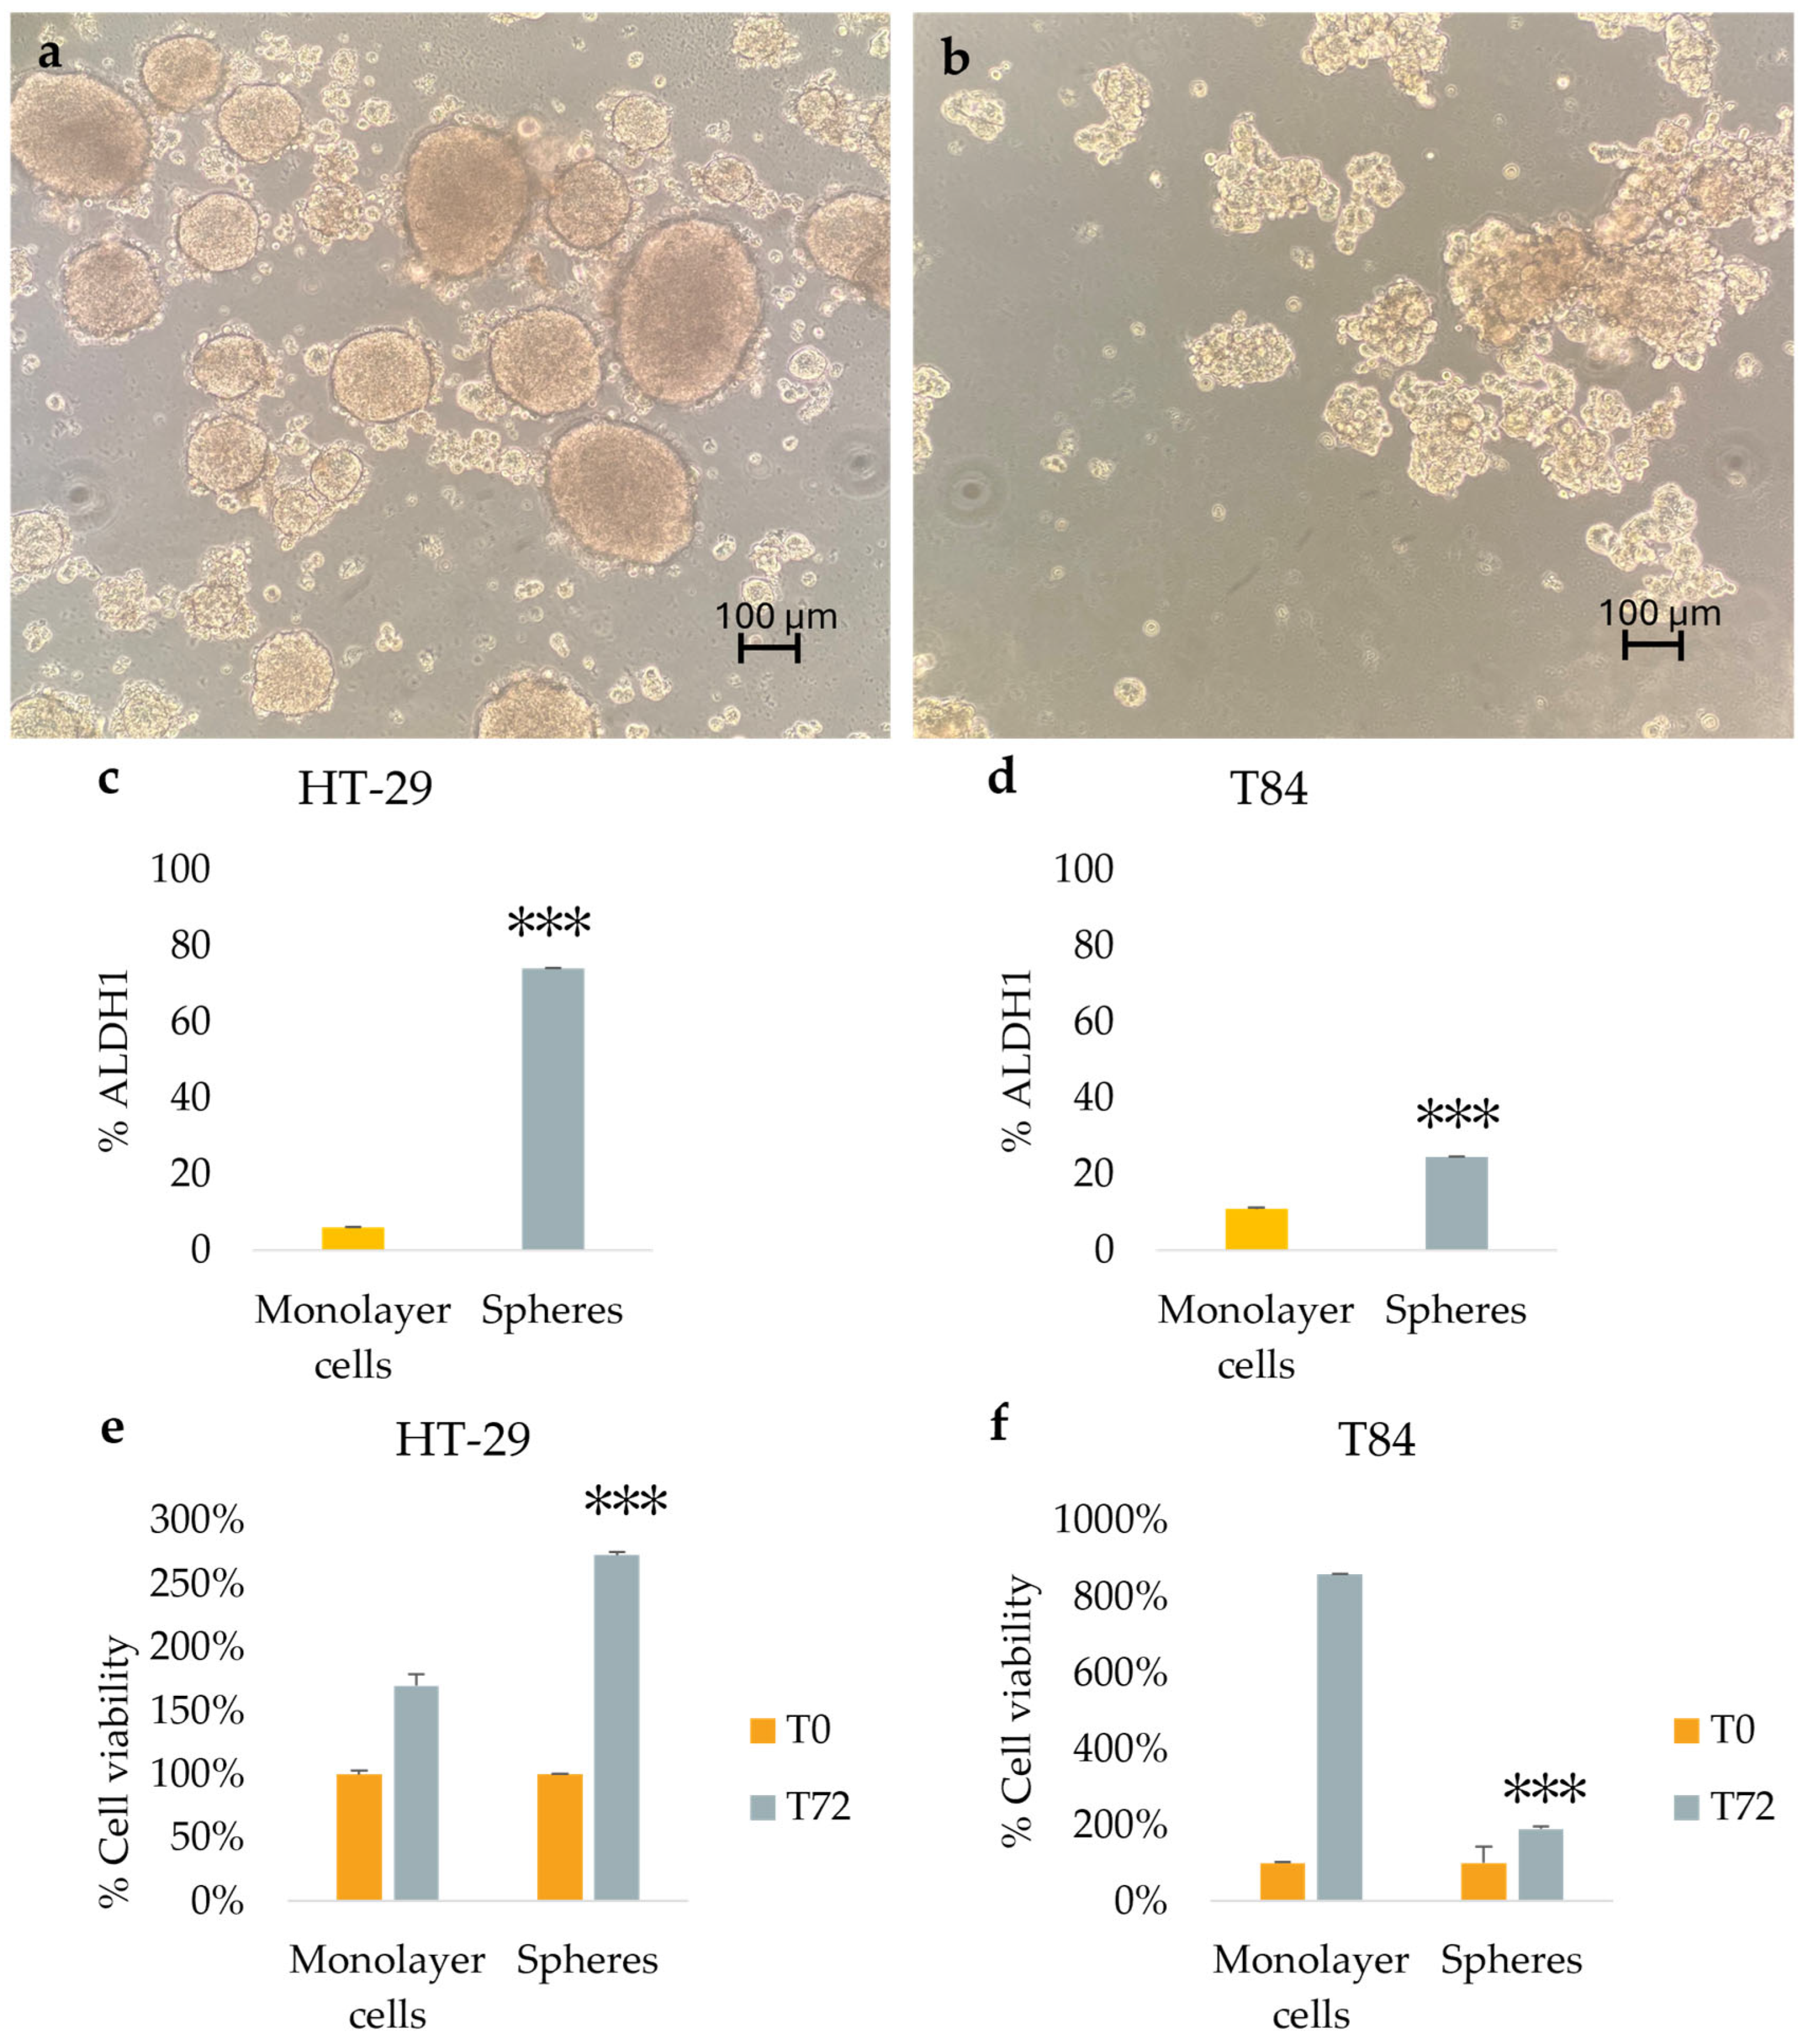
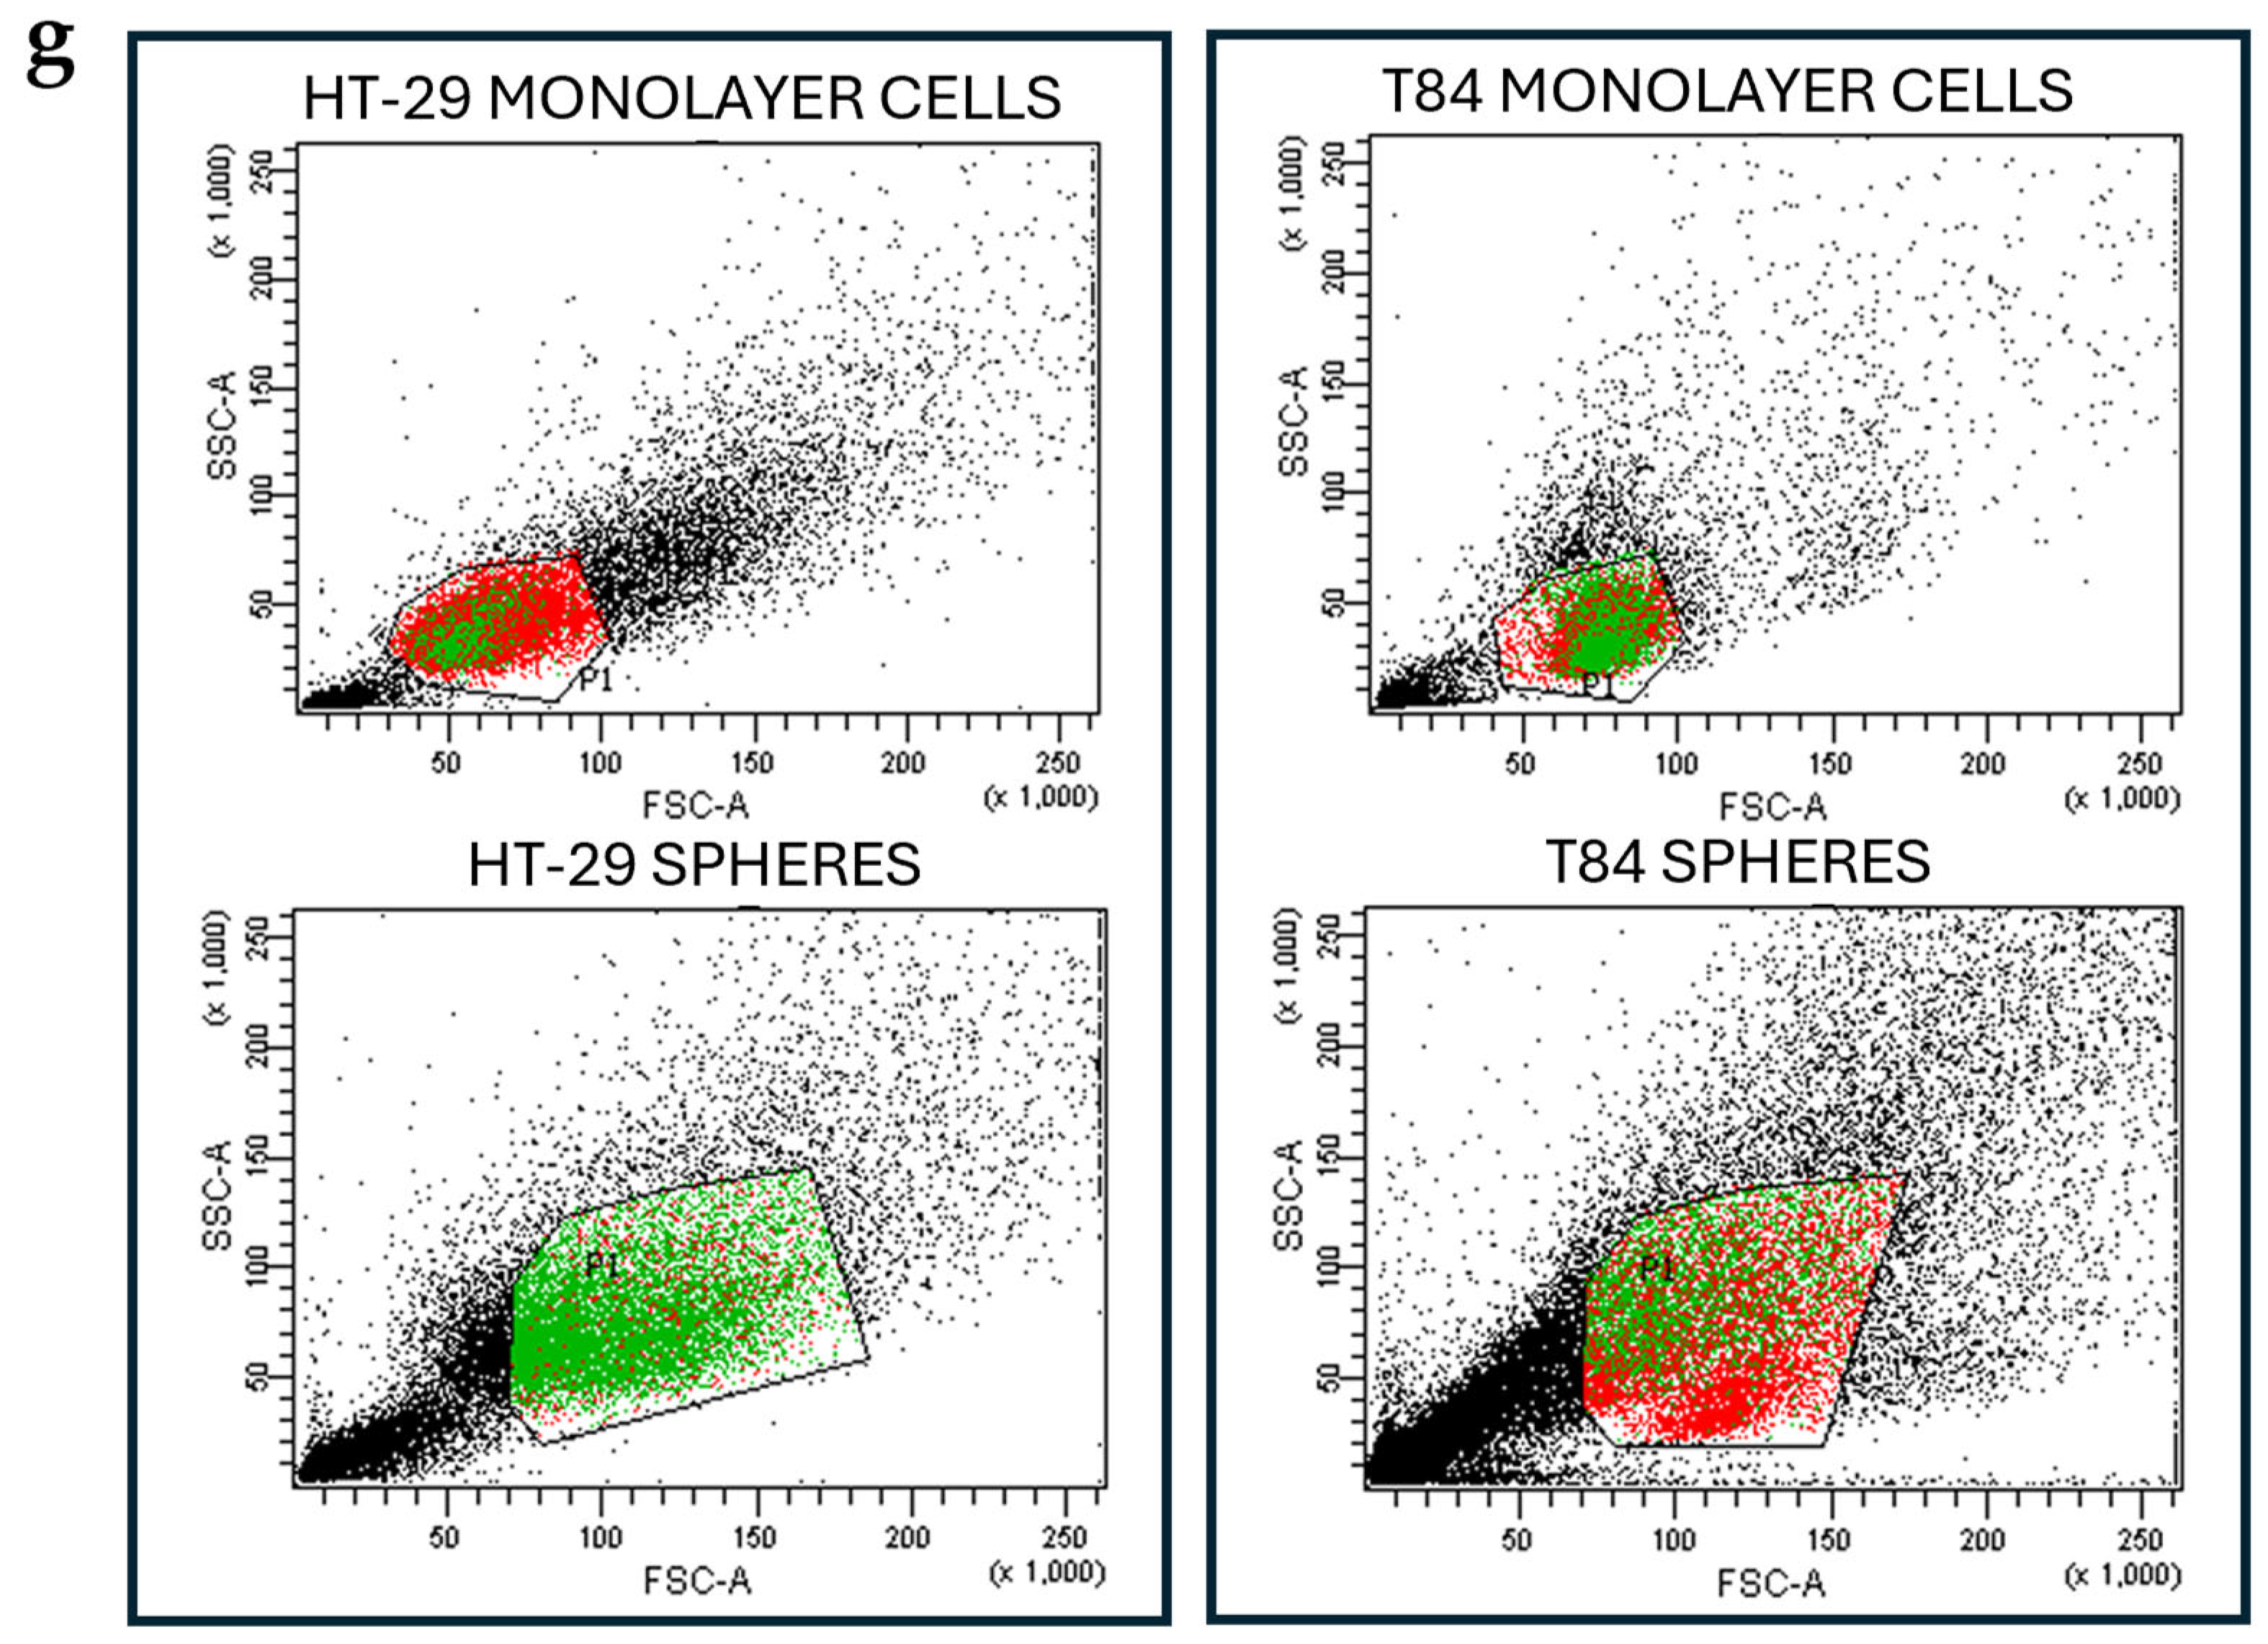
Figure 2.
EMT and stemness markers expression in monolayer cells and in spheres obtained from HT-29 cell lines (a), and from T84 cell lines (b). The symbol * indicates statistical difference between monolayer cells and spheres with p-value < 0.05. The symbol ** indicates statistical difference between monolayer cells and spheres with p-value < 0.01. The symbol *** indicates statistical difference between monolayer cells and spheres with p-value < 0.001. Values expressed as Mean ± SE.
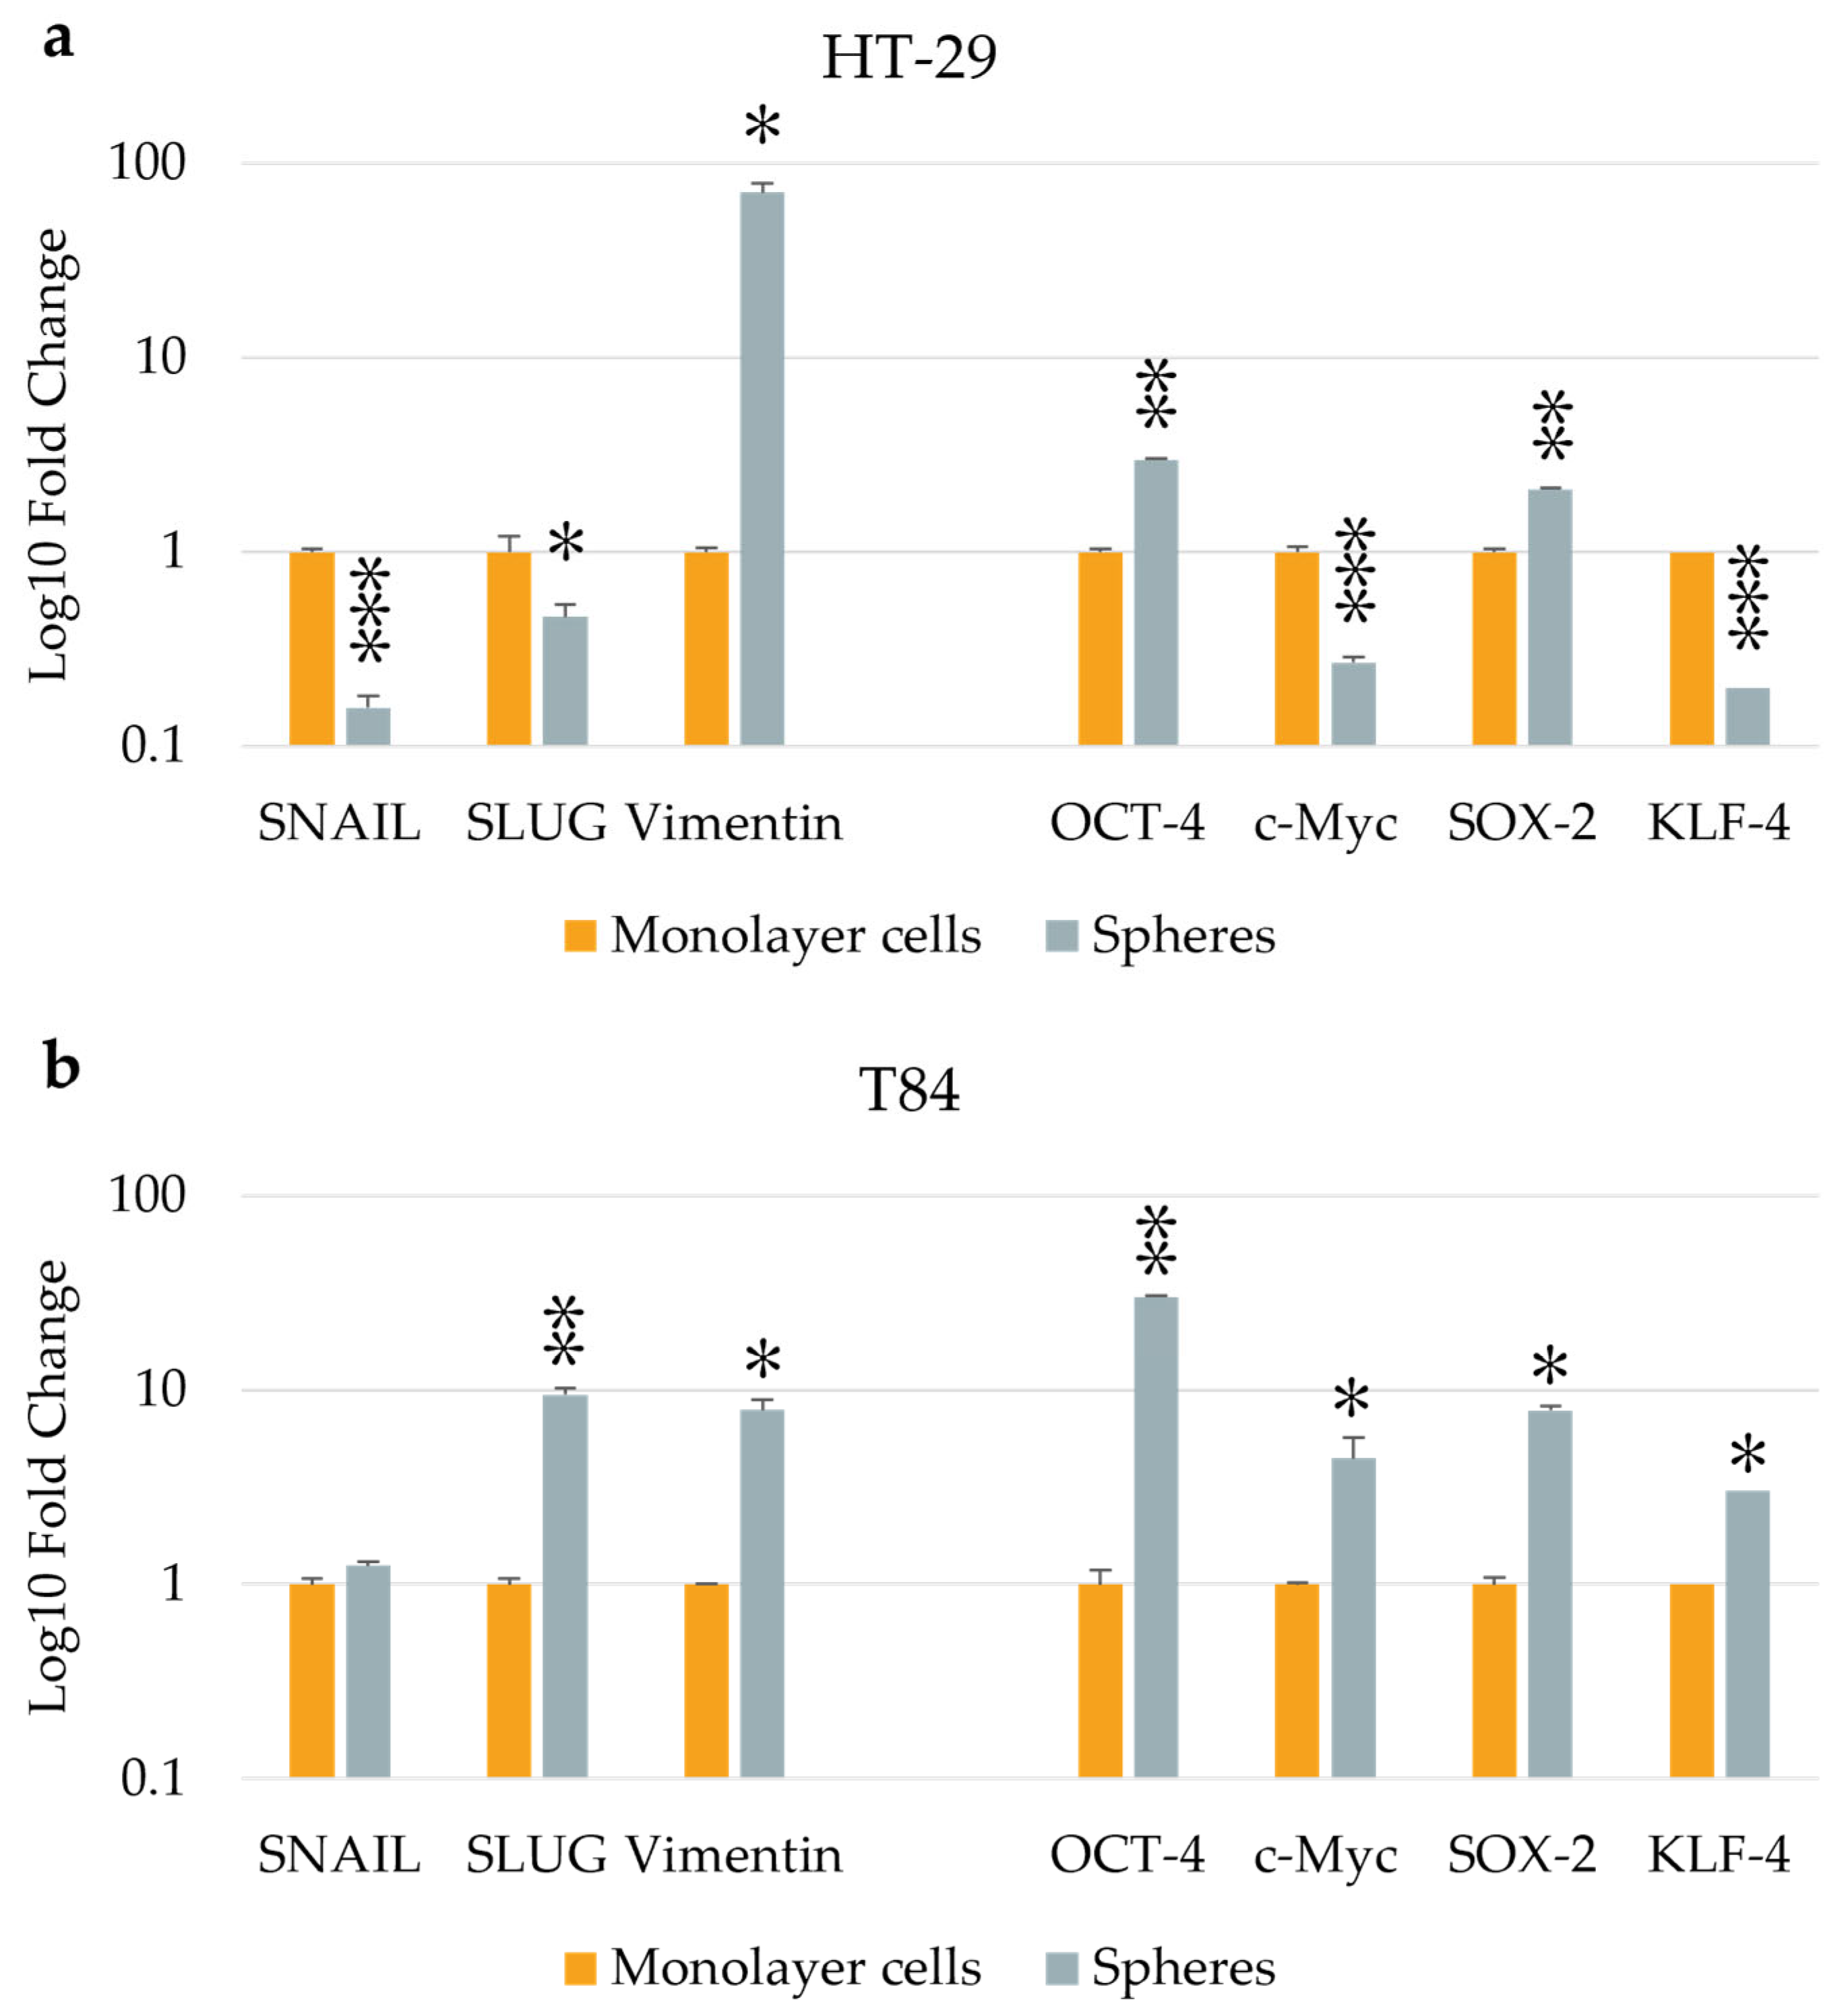
Figure 3.
miRNA-486-5p expression in monolayer cells and in spheres obtained from HT-29 cell lines (a), and from T84 cell lines (b). The symbol * indicates statistical difference between monolayer cells and spheres with p-value < 0.05. The symbol ** indicates statistical difference between monolayer cells and spheres with p-value < 0.01. Values expressed as Mean ± SE.
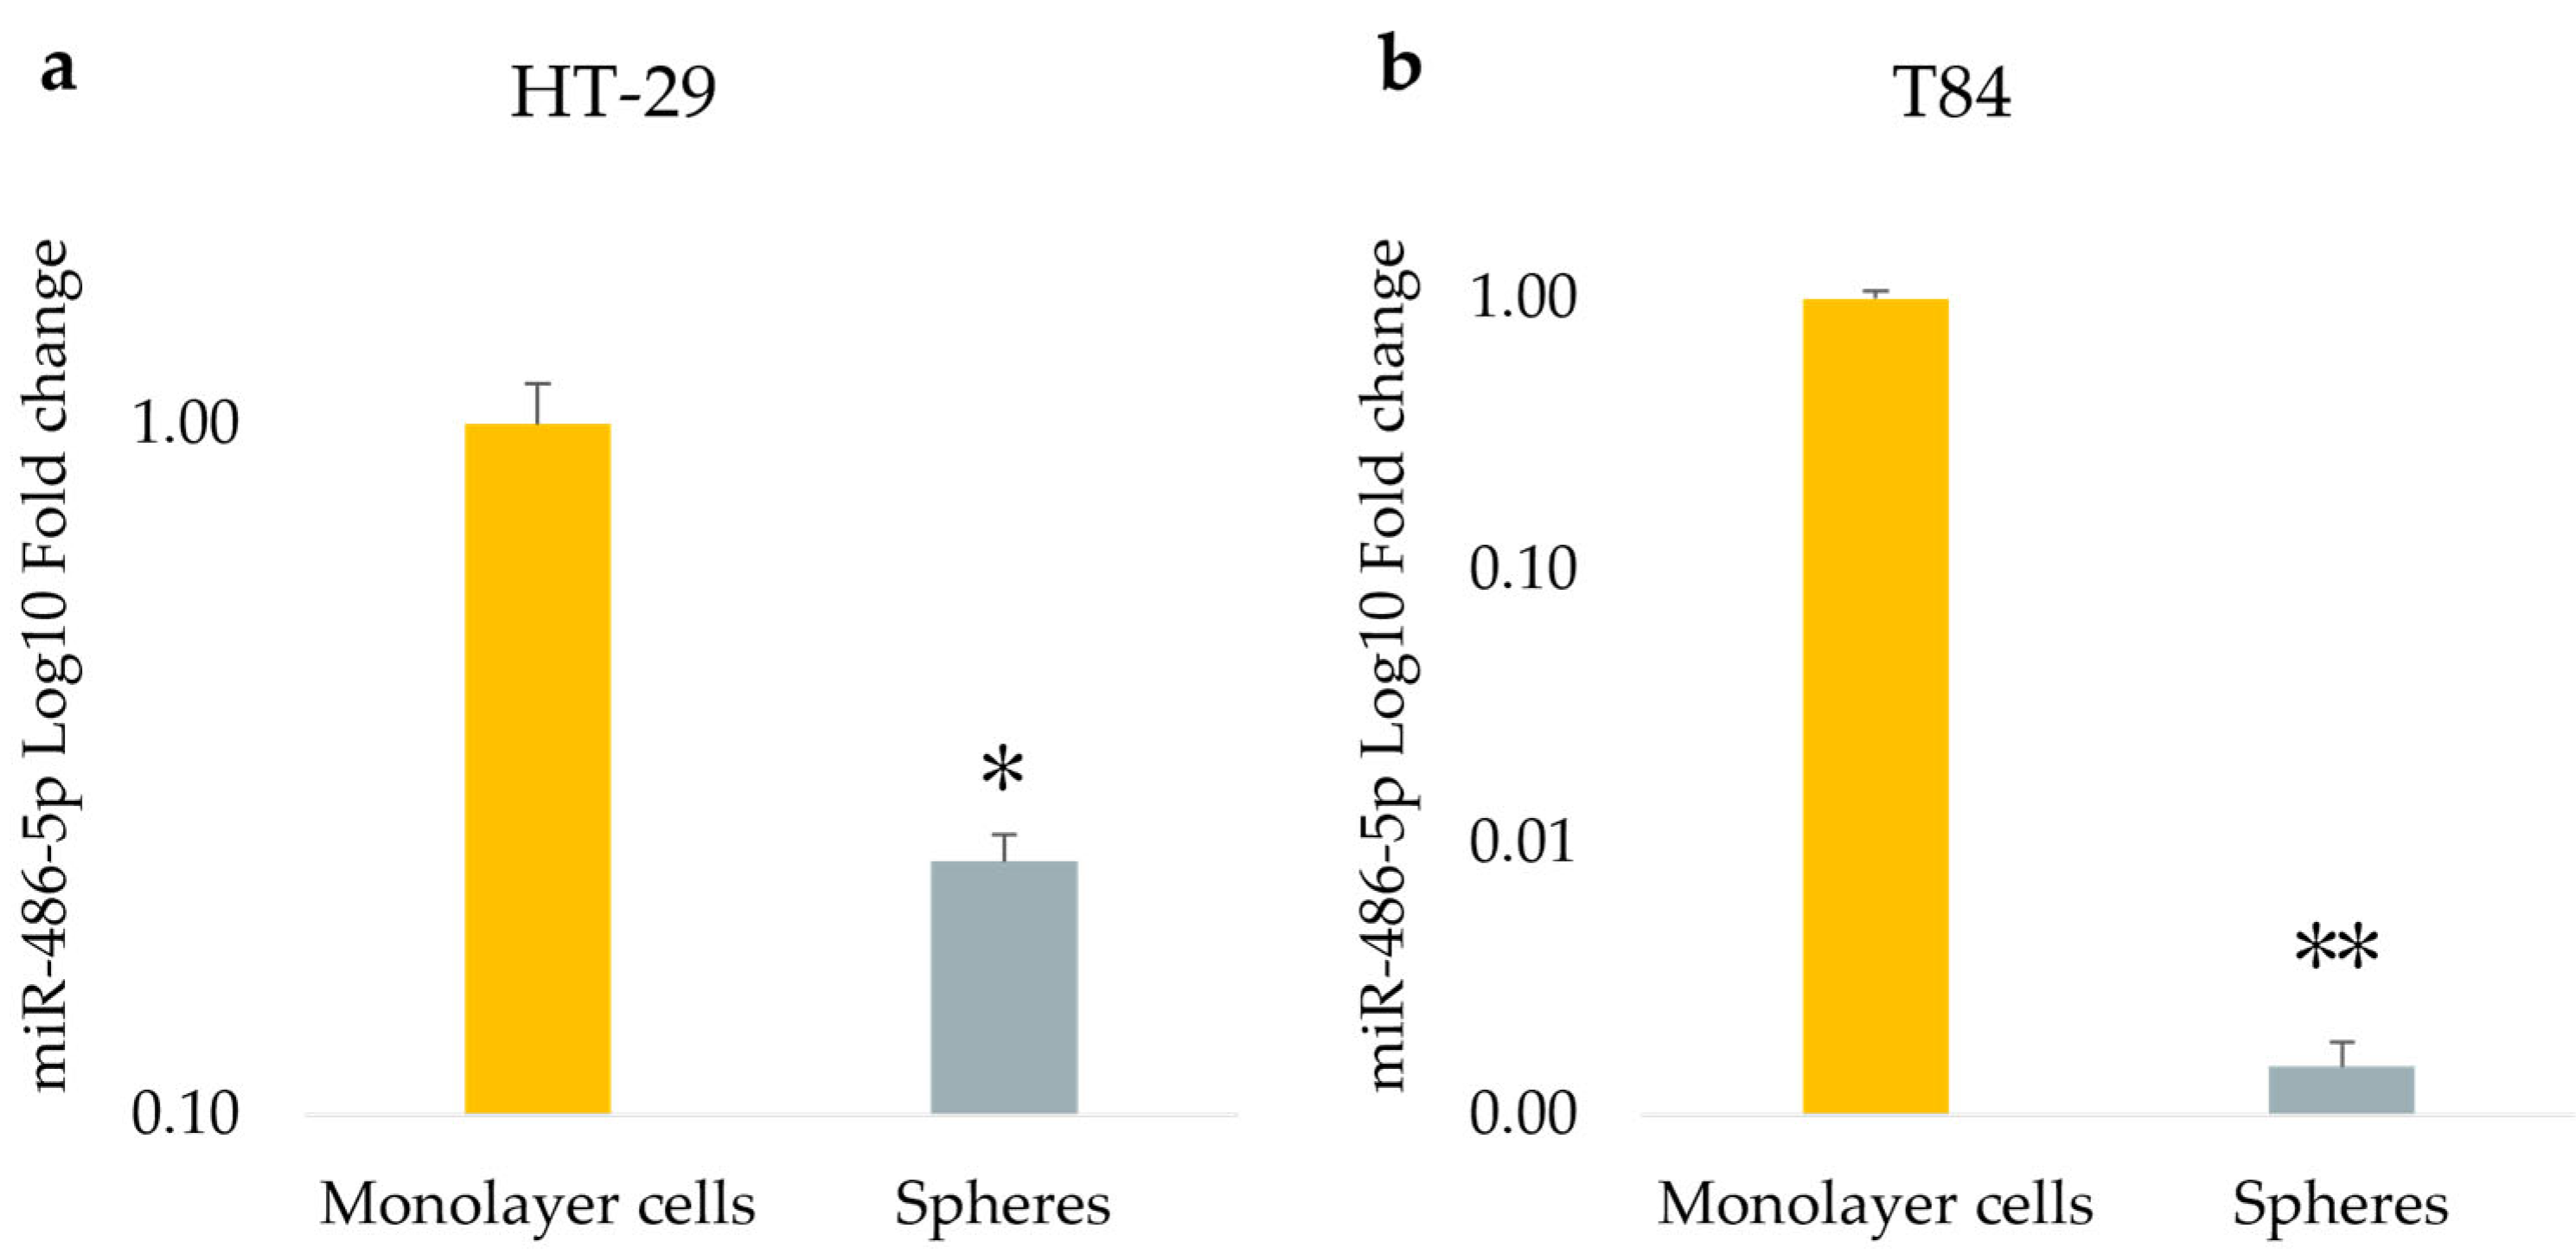
Figure 4.
Cell viability assessed at time 0 (T0) and after 72hours (T72) of miR-486-5p transfection in HT-29 and T84 monolayer (a, b); Cell viability at time 0 (T0) and after 72hounr (T72) of miR-486-5p transfection in spheres obtained from HT-29 and T84 cell lines (c, d). The symbol * indicates statistical difference between control and treated cells with p-value < 0.05. Values expressed as Mean ± SE.
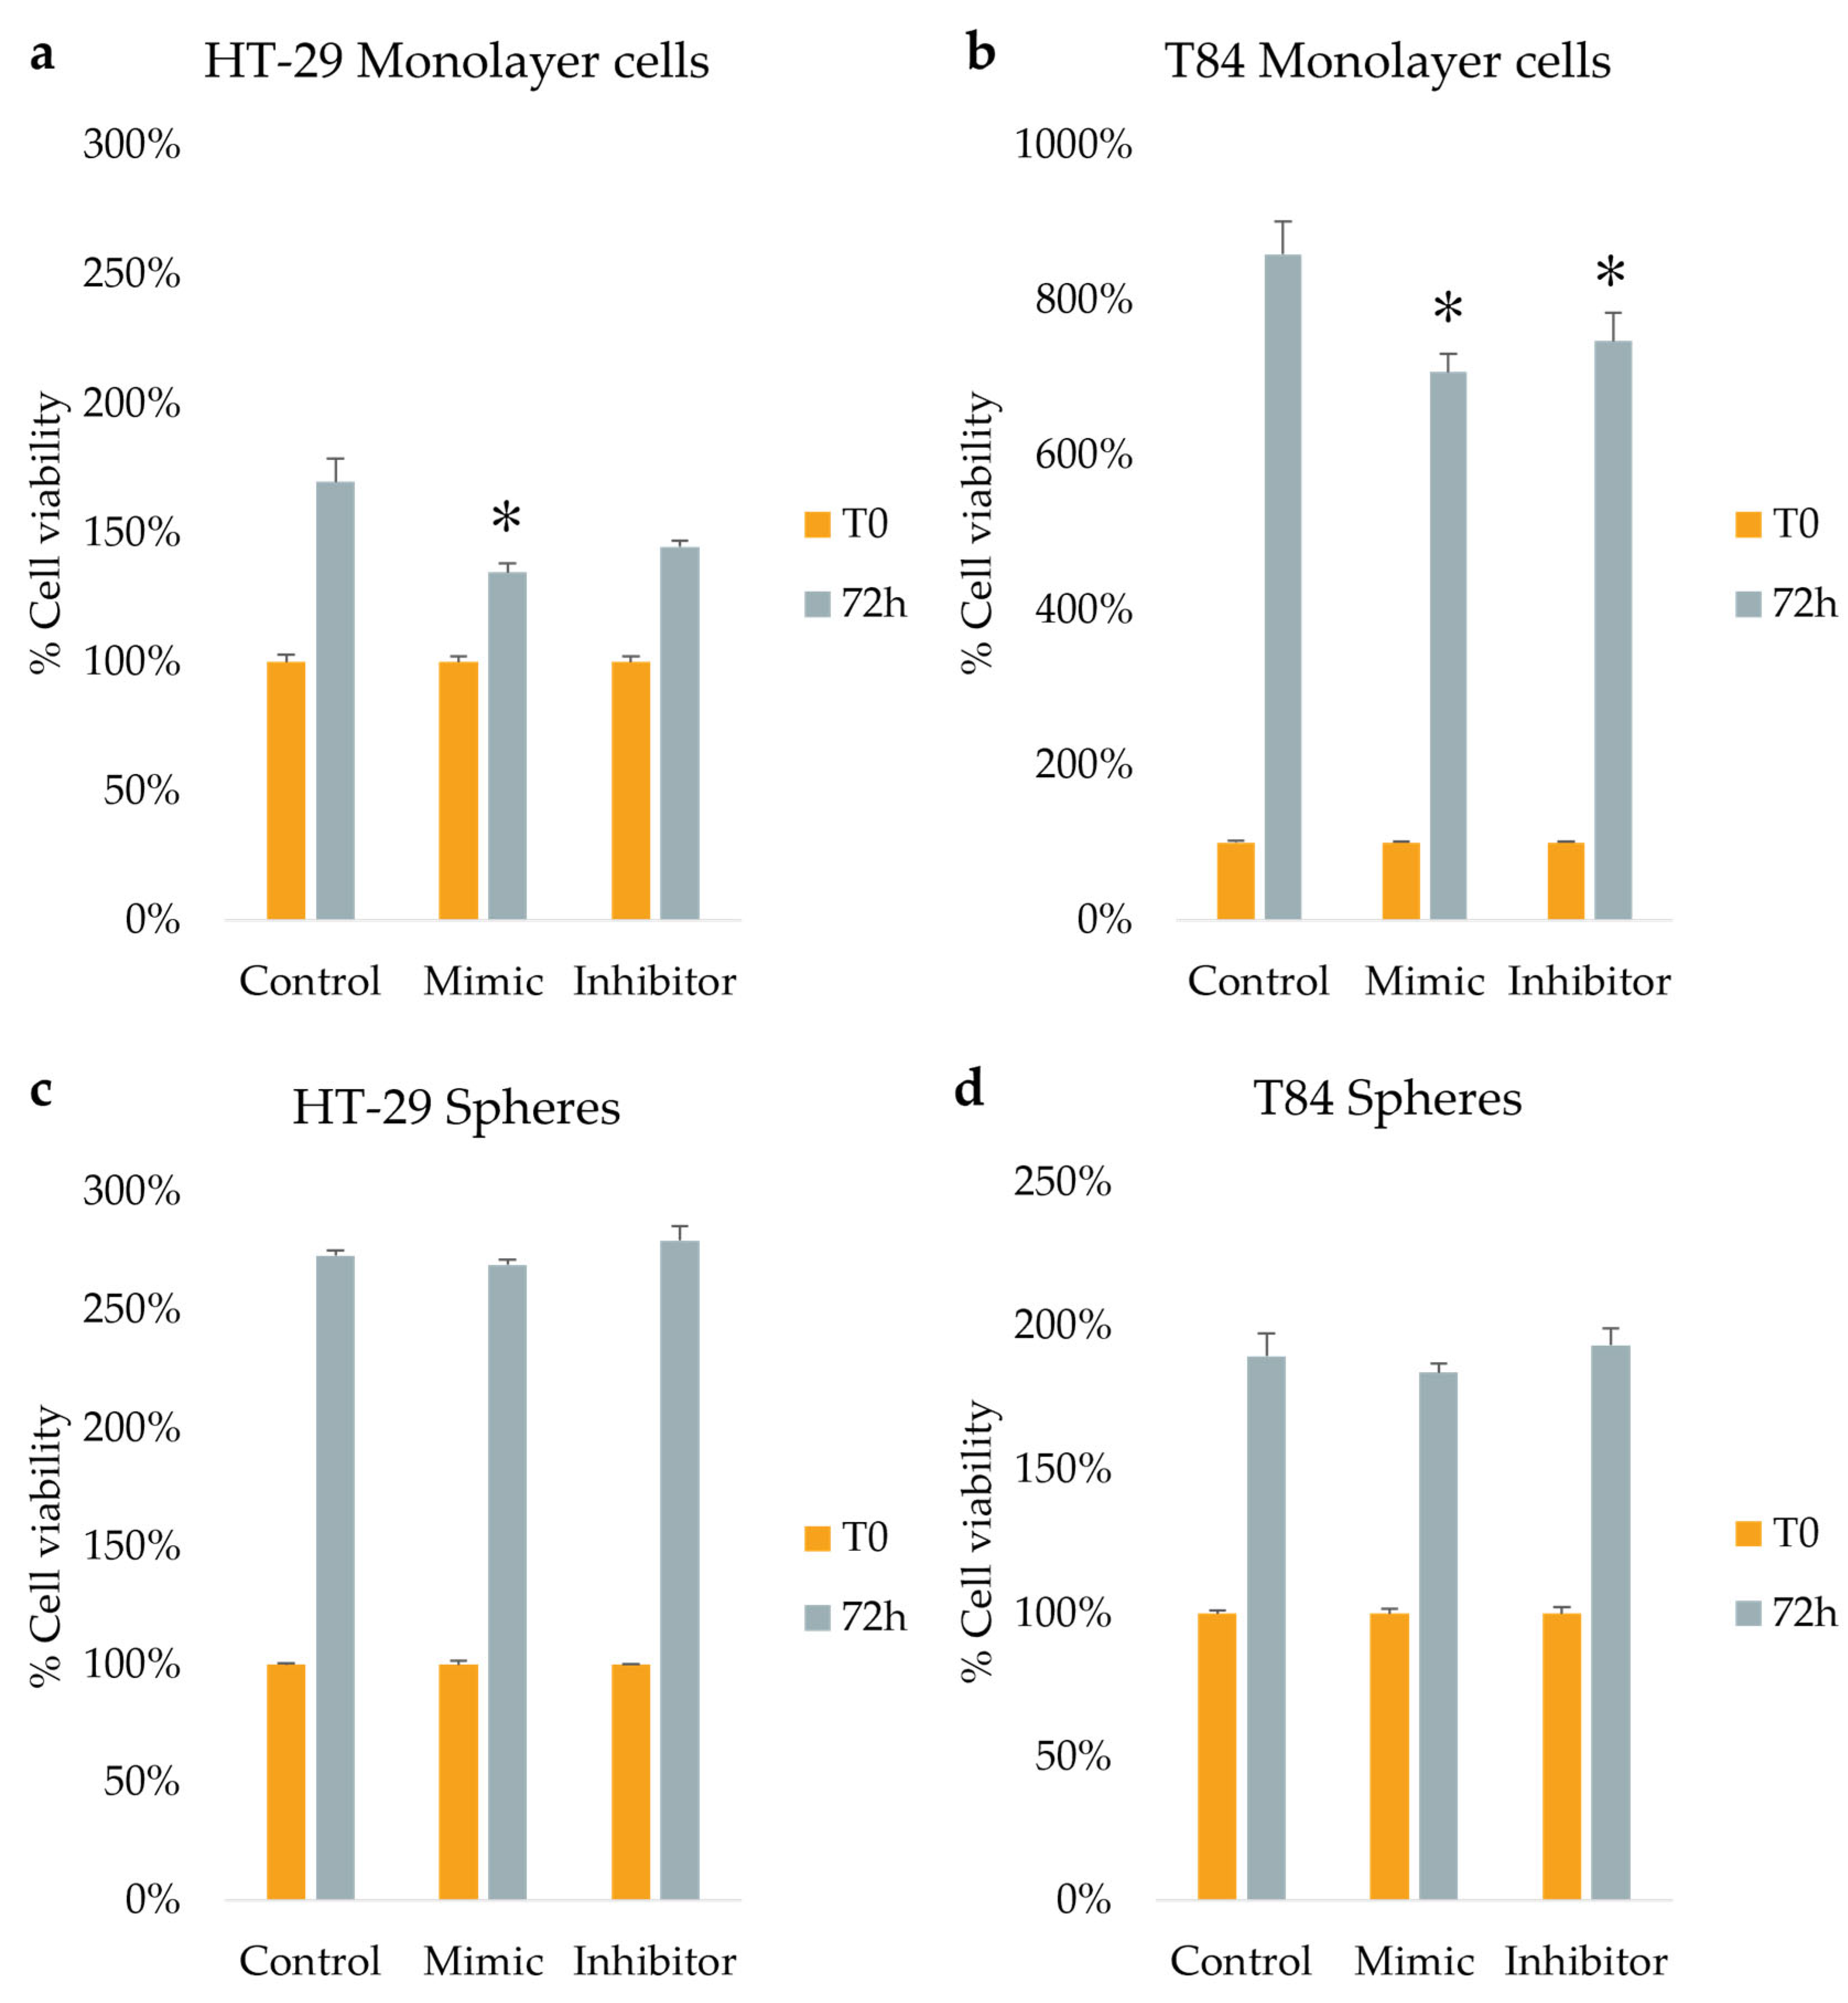
Figure 5.
ALDH1 positive cells percentage after the transfection of miR-486-5p mimic and inhibitor in HT-29 and T84 monolayer (a, b); ALDH1 positive cells percentage after the transfection of miR-486-5p mimic and inhibitor in HT-29 and T84 spheres (c, d). Representative flow cytometry cytogram plot of ALDH1 activity in monolayer cells and spheres after the transfection of miR-486-5p mimic and inhibitor; x-axis: FSC-A/ALDH1, y-axis: SSC-A/side scatter (e). The symbol * indicates the comparison between control and treated cells with a p-value < 0.05. The symbol ** indicates the comparison between control and treated cells with a p-value < 0.01. The symbol *** indicates the comparison between control and treated cells with a p-value < 0.001. The symbol # indicates the statistical difference between mimic- and inhibitor-treated cells with a p-value < 0.05. The symbol ## indicates the statistical difference between mimic- and inhibitor-treated cells with a p-value <0.01. The symbol ### indicates the statistical difference between mimic- and inhibitor-treated cells with a p-value <0.001. Values expressed as Mean ± SE.
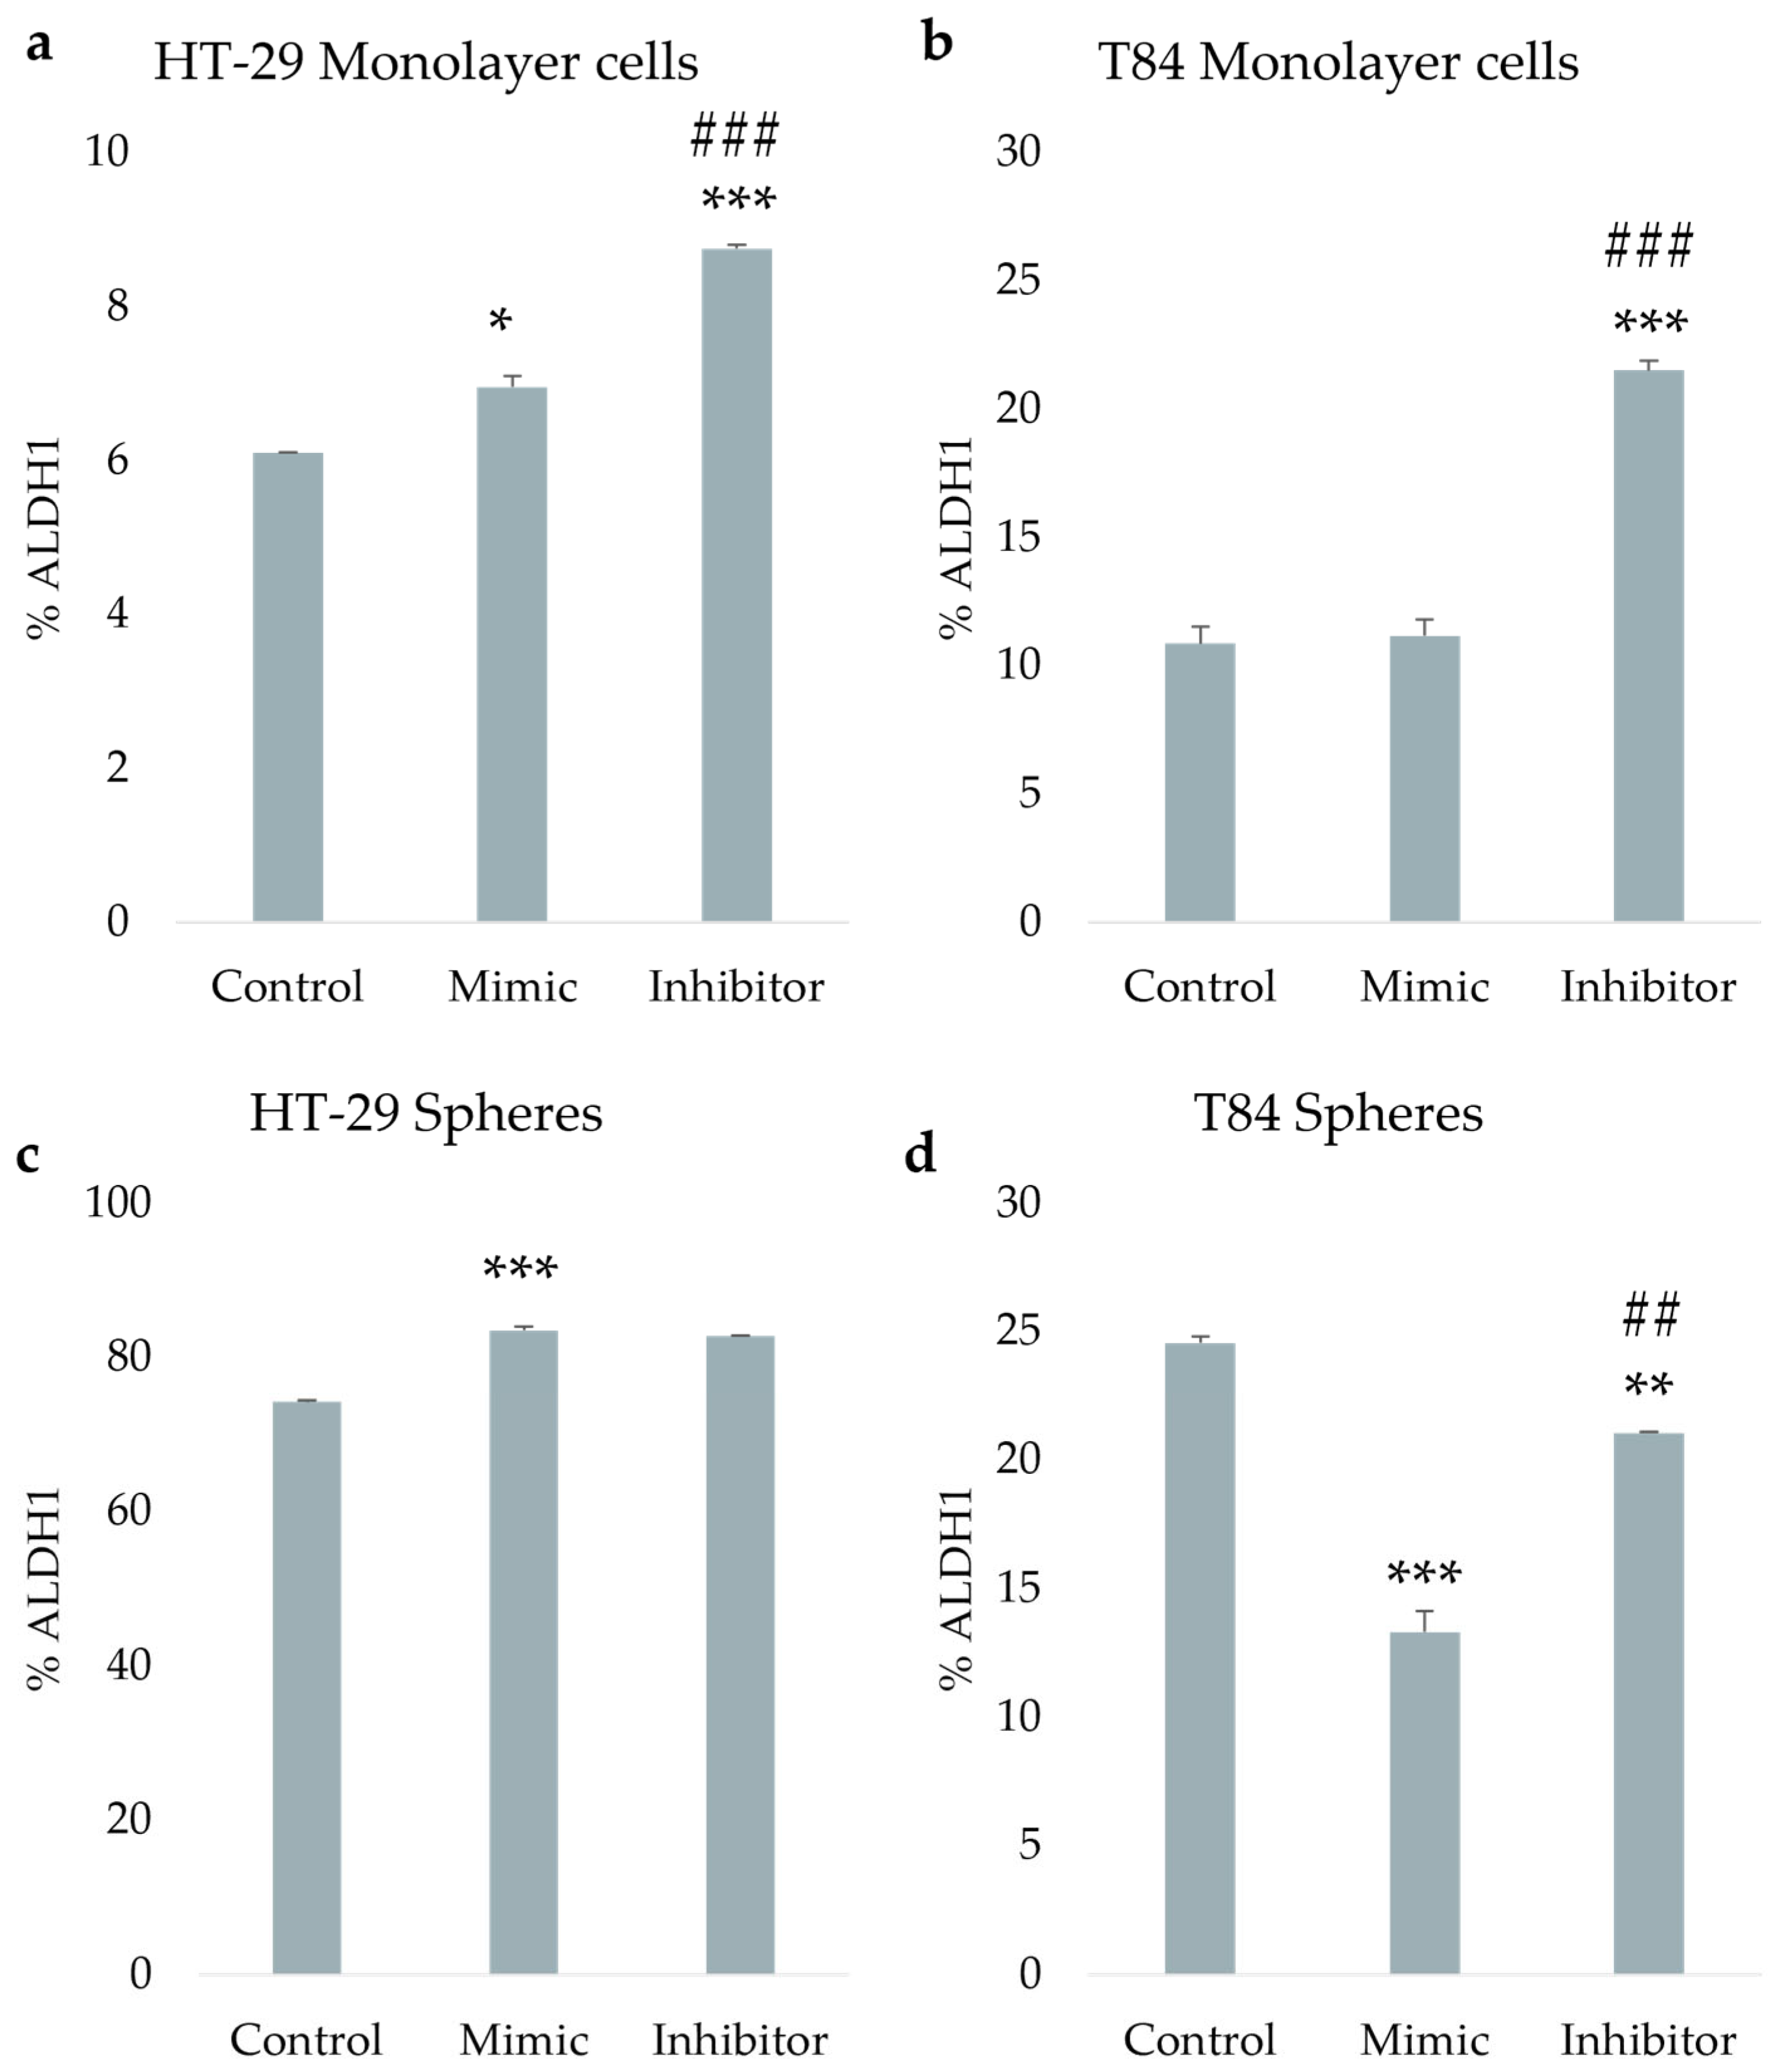
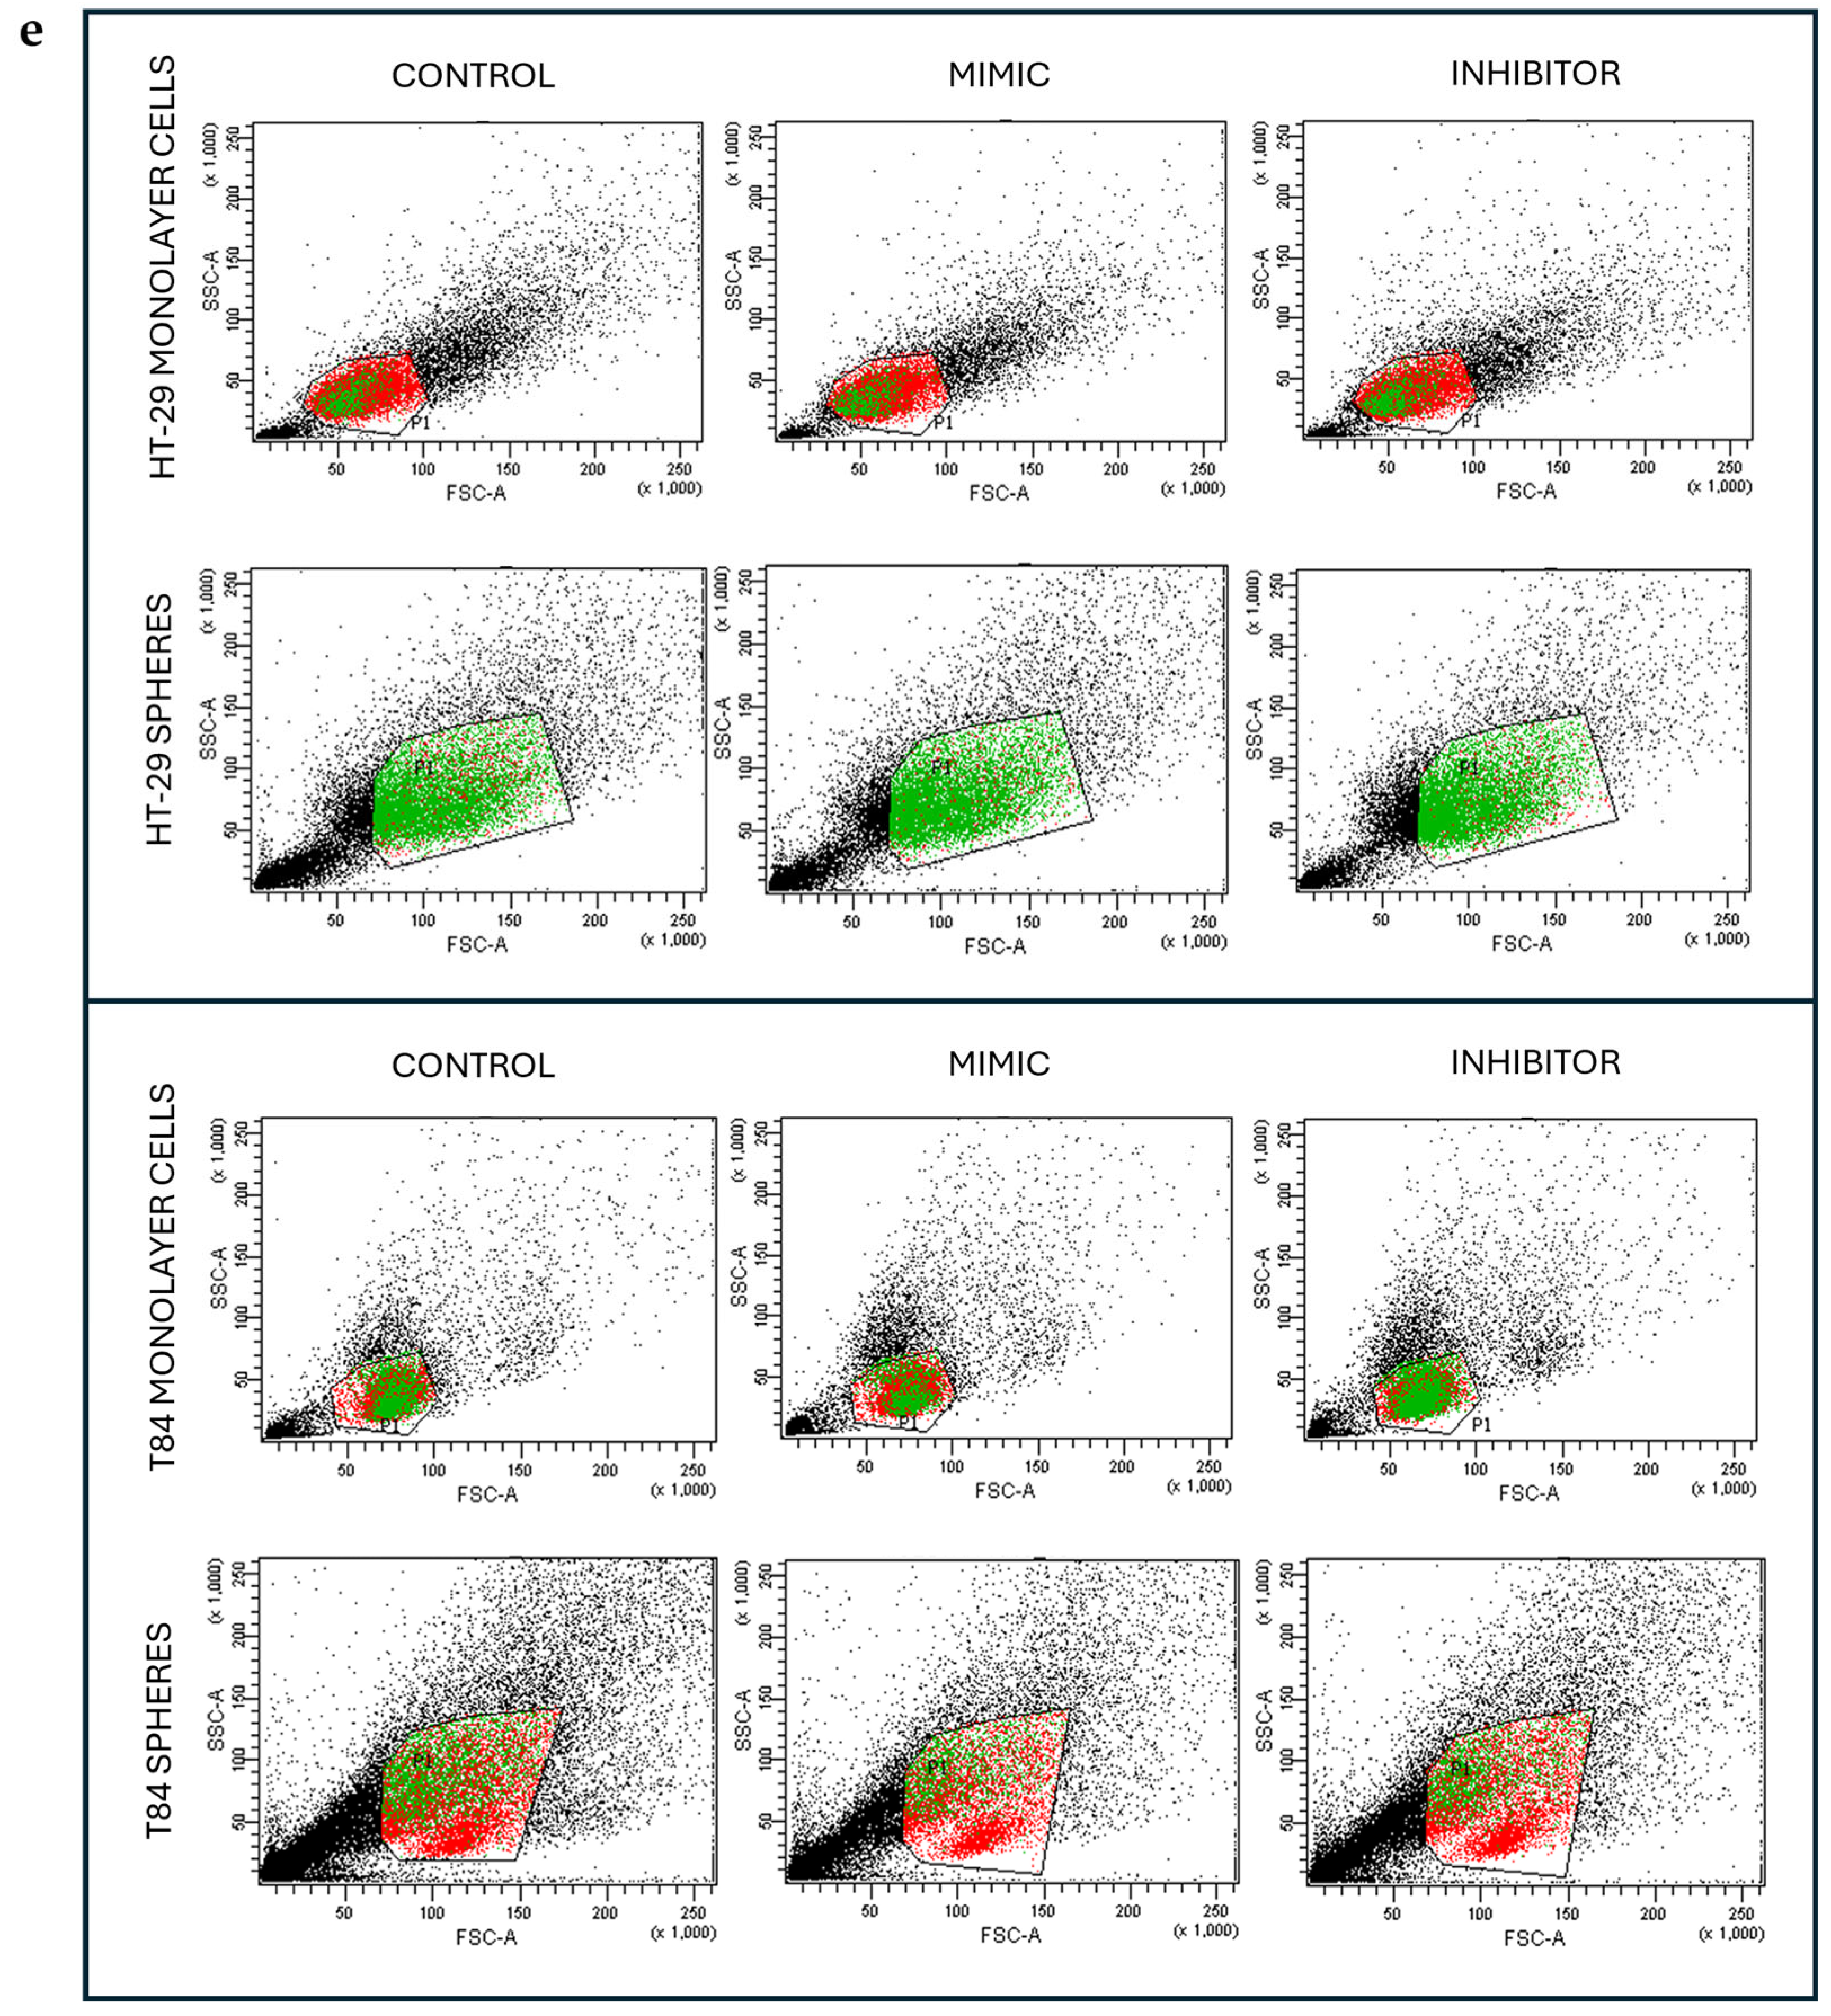
Figure 6.
EMT- and stemness- related gene expression after the transfection of miR-486-5p mimic and inhibitor in HT-29 and T84 monolayer (a, b); EMT- and stemness- related gene expression after the transfection of miR-486-5p mimic and inhibitor in HT-29 and T84 spheres (c, d). The symbol * indicates the comparison between control and treated cells with a p-value < 0.05. The symbol ** indicates the comparison between control and treated cells with a p-value < 0.01. The symbol *** indicates the comparison between control and treated cells with a p-value < 0.001. The symbol # indicates the statistical difference between mimic- and inhibitor-treated cells with a p-value < 0.05. The symbol ## indicates the statistical difference between mimic- and inhibitor-treated cells with a p-value <0.01. The symbol ### indicates the statistical difference between mimic- and inhibitor-treated cells with a p-value <0.001. Values expressed as Mean ± SE.
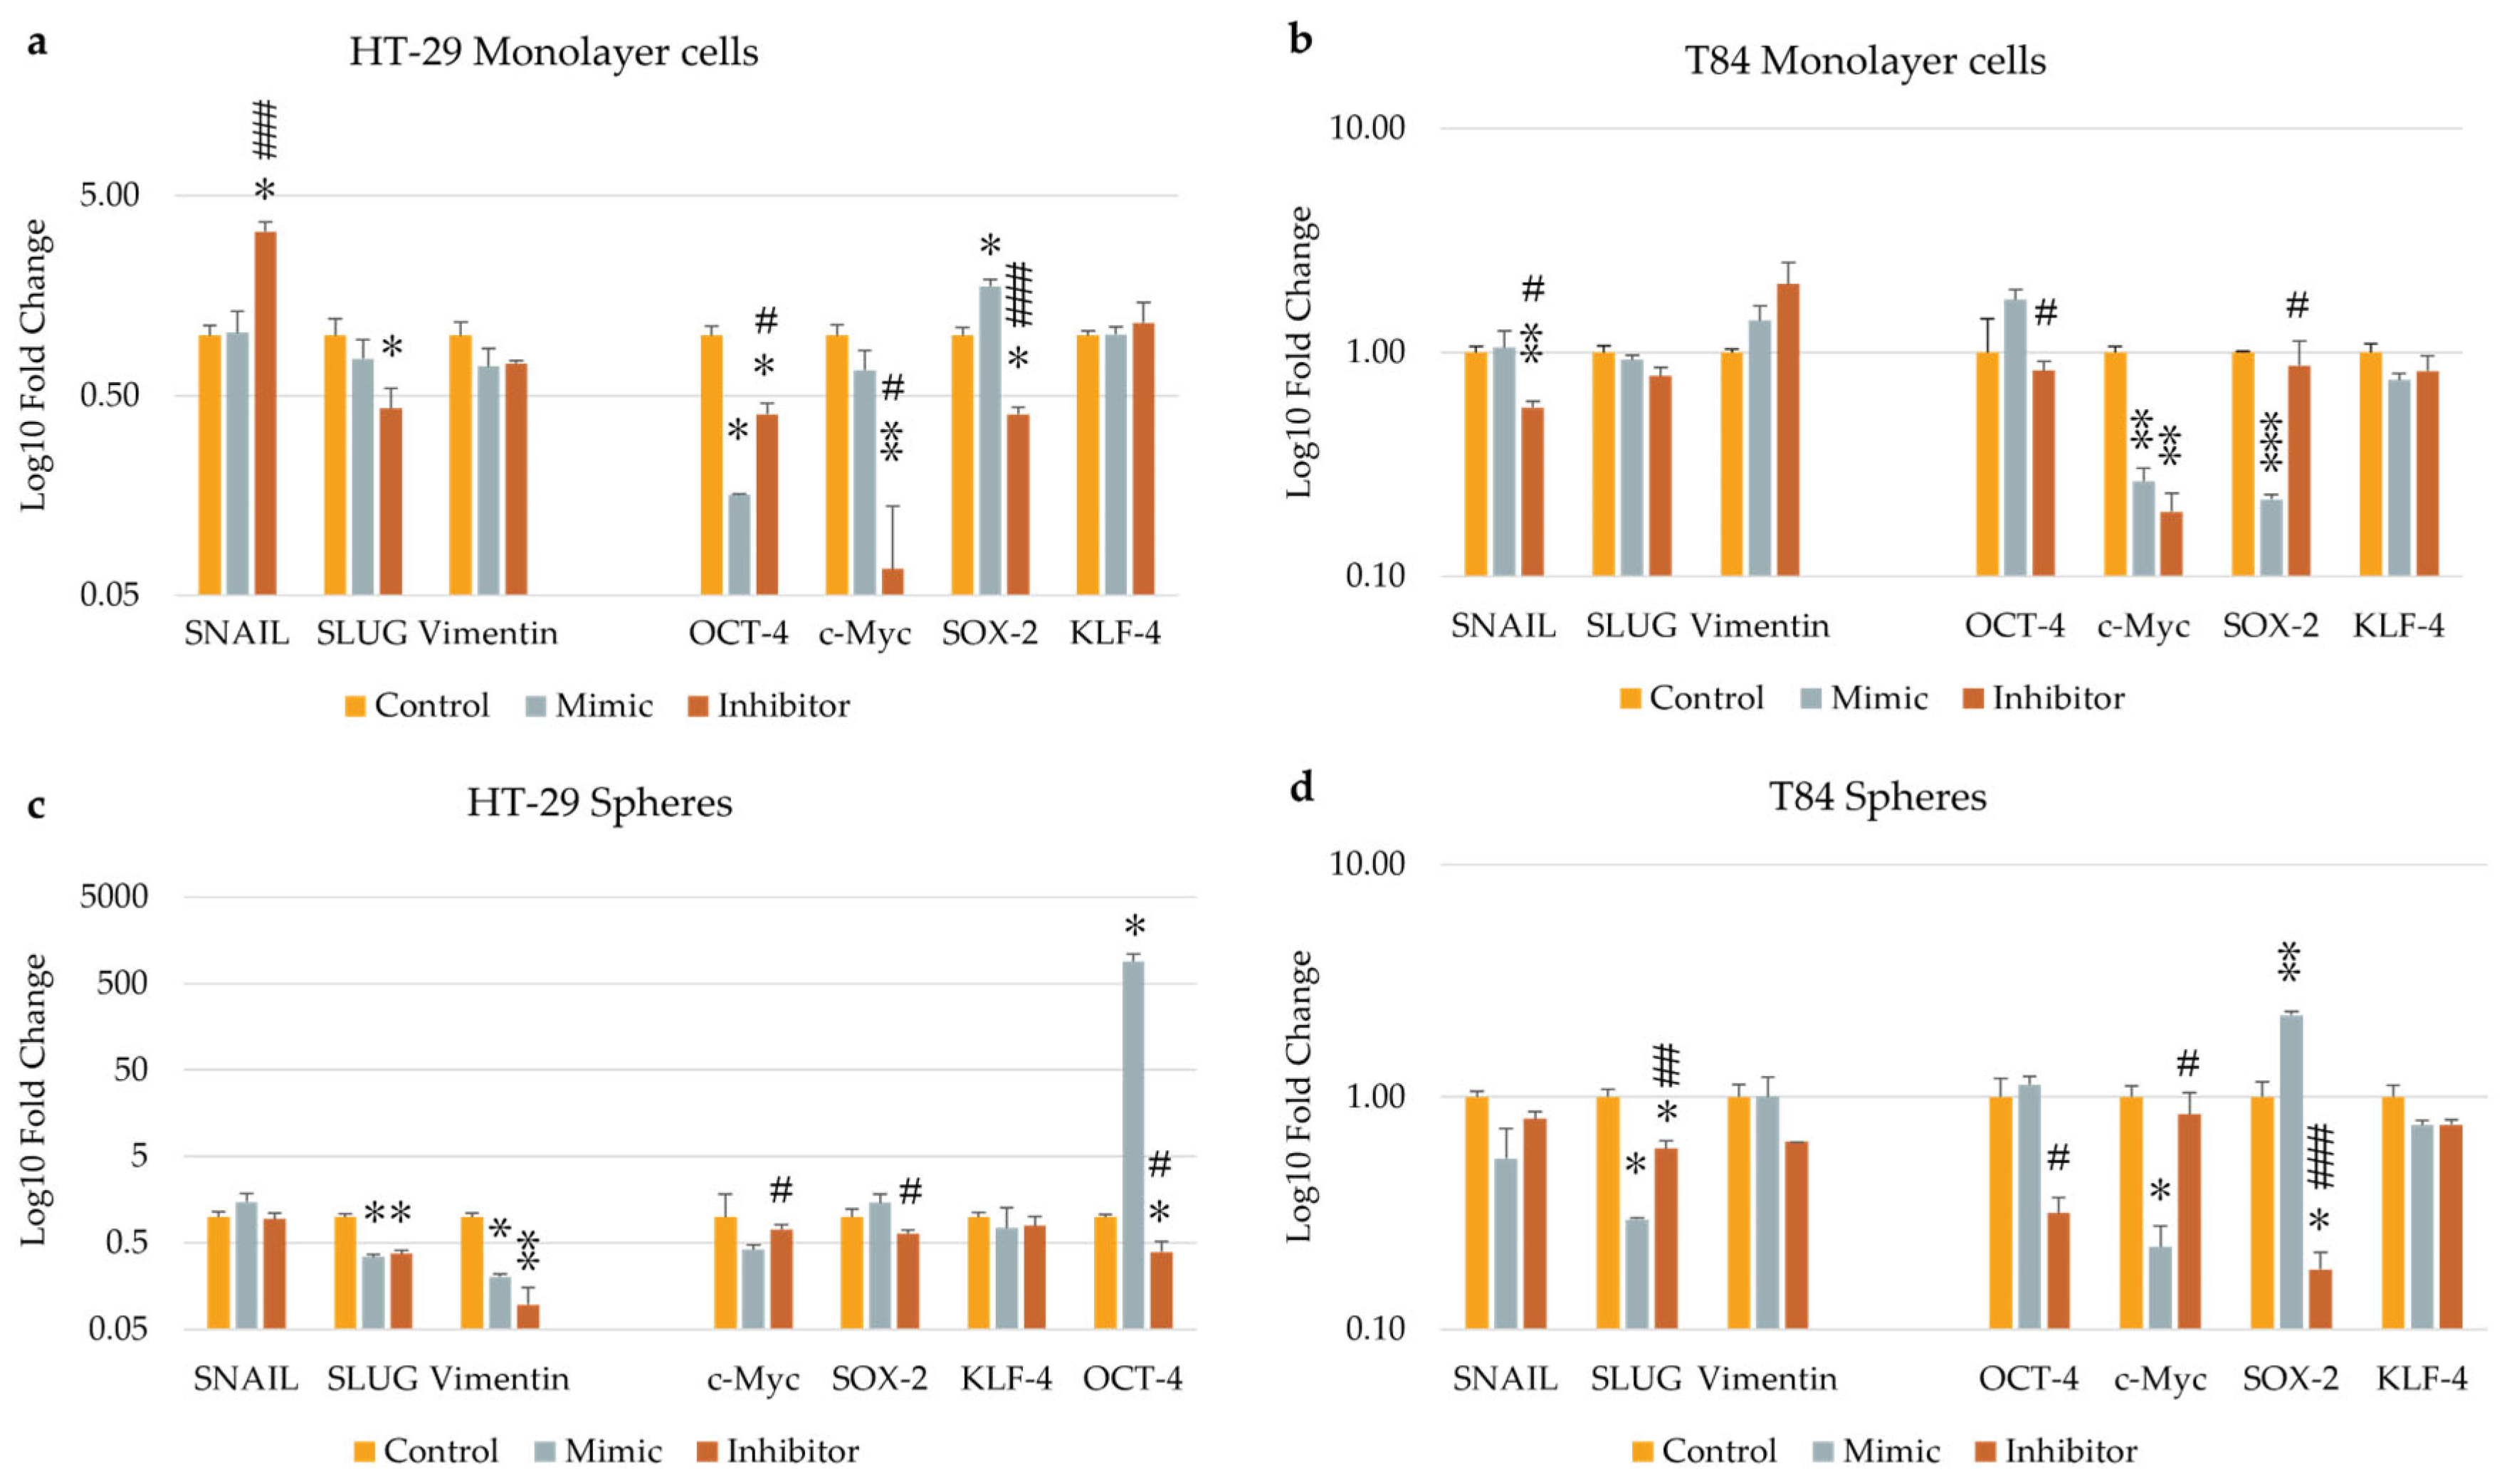
Figure 7.
Representative images of HT-29 untreated cells (a), mimic-treated cells (b) and inhibitor-treated cells (c) in soft agar colony formation assay. Comparison of the number of colonies of untreated, mimic-treated and inhibitor-treated HT-29 cells (d). Comparison of average colony area of untreated, mimic-treated and inhibitor-treated HT-29 cells (e). Percentage of colonies divided by size (f). A comparison of the area and number of colonies for HT-29 spheres (g). The symbol * indicates the comparison between control and treated cells with a p-value < 0.05. The symbol ** indicates the comparison between control and treated cells with a p-value < 0.01. The symbol *** indicates the comparison between control and treated cells with a p-value < 0.001. The symbol # indicates the statistical difference between mimic- and inhibitor-treated cells with a p-value < 0.05. The symbol ## indicates the statistical difference between mimic- and inhibitor-treated cells with a p-value <0.01. The symbol ### indicates the statistical difference between mimic- and inhibitor-treated cells with a p-value <0.001. Values expressed as Mean ± SE.
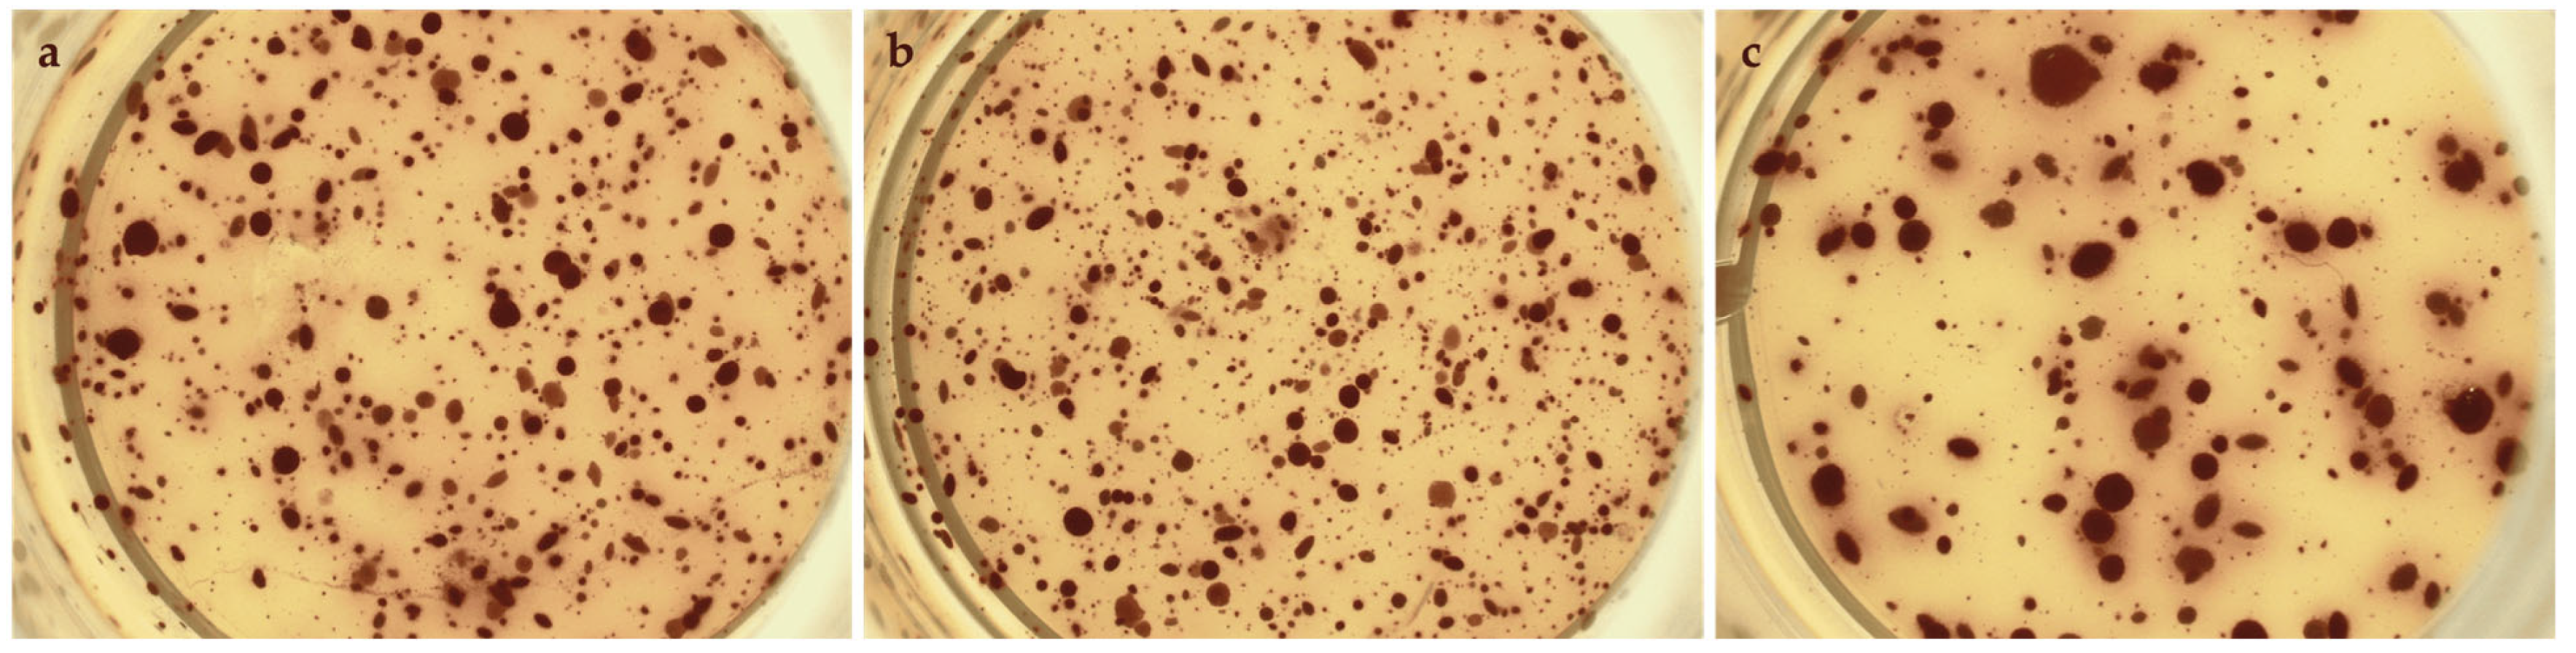
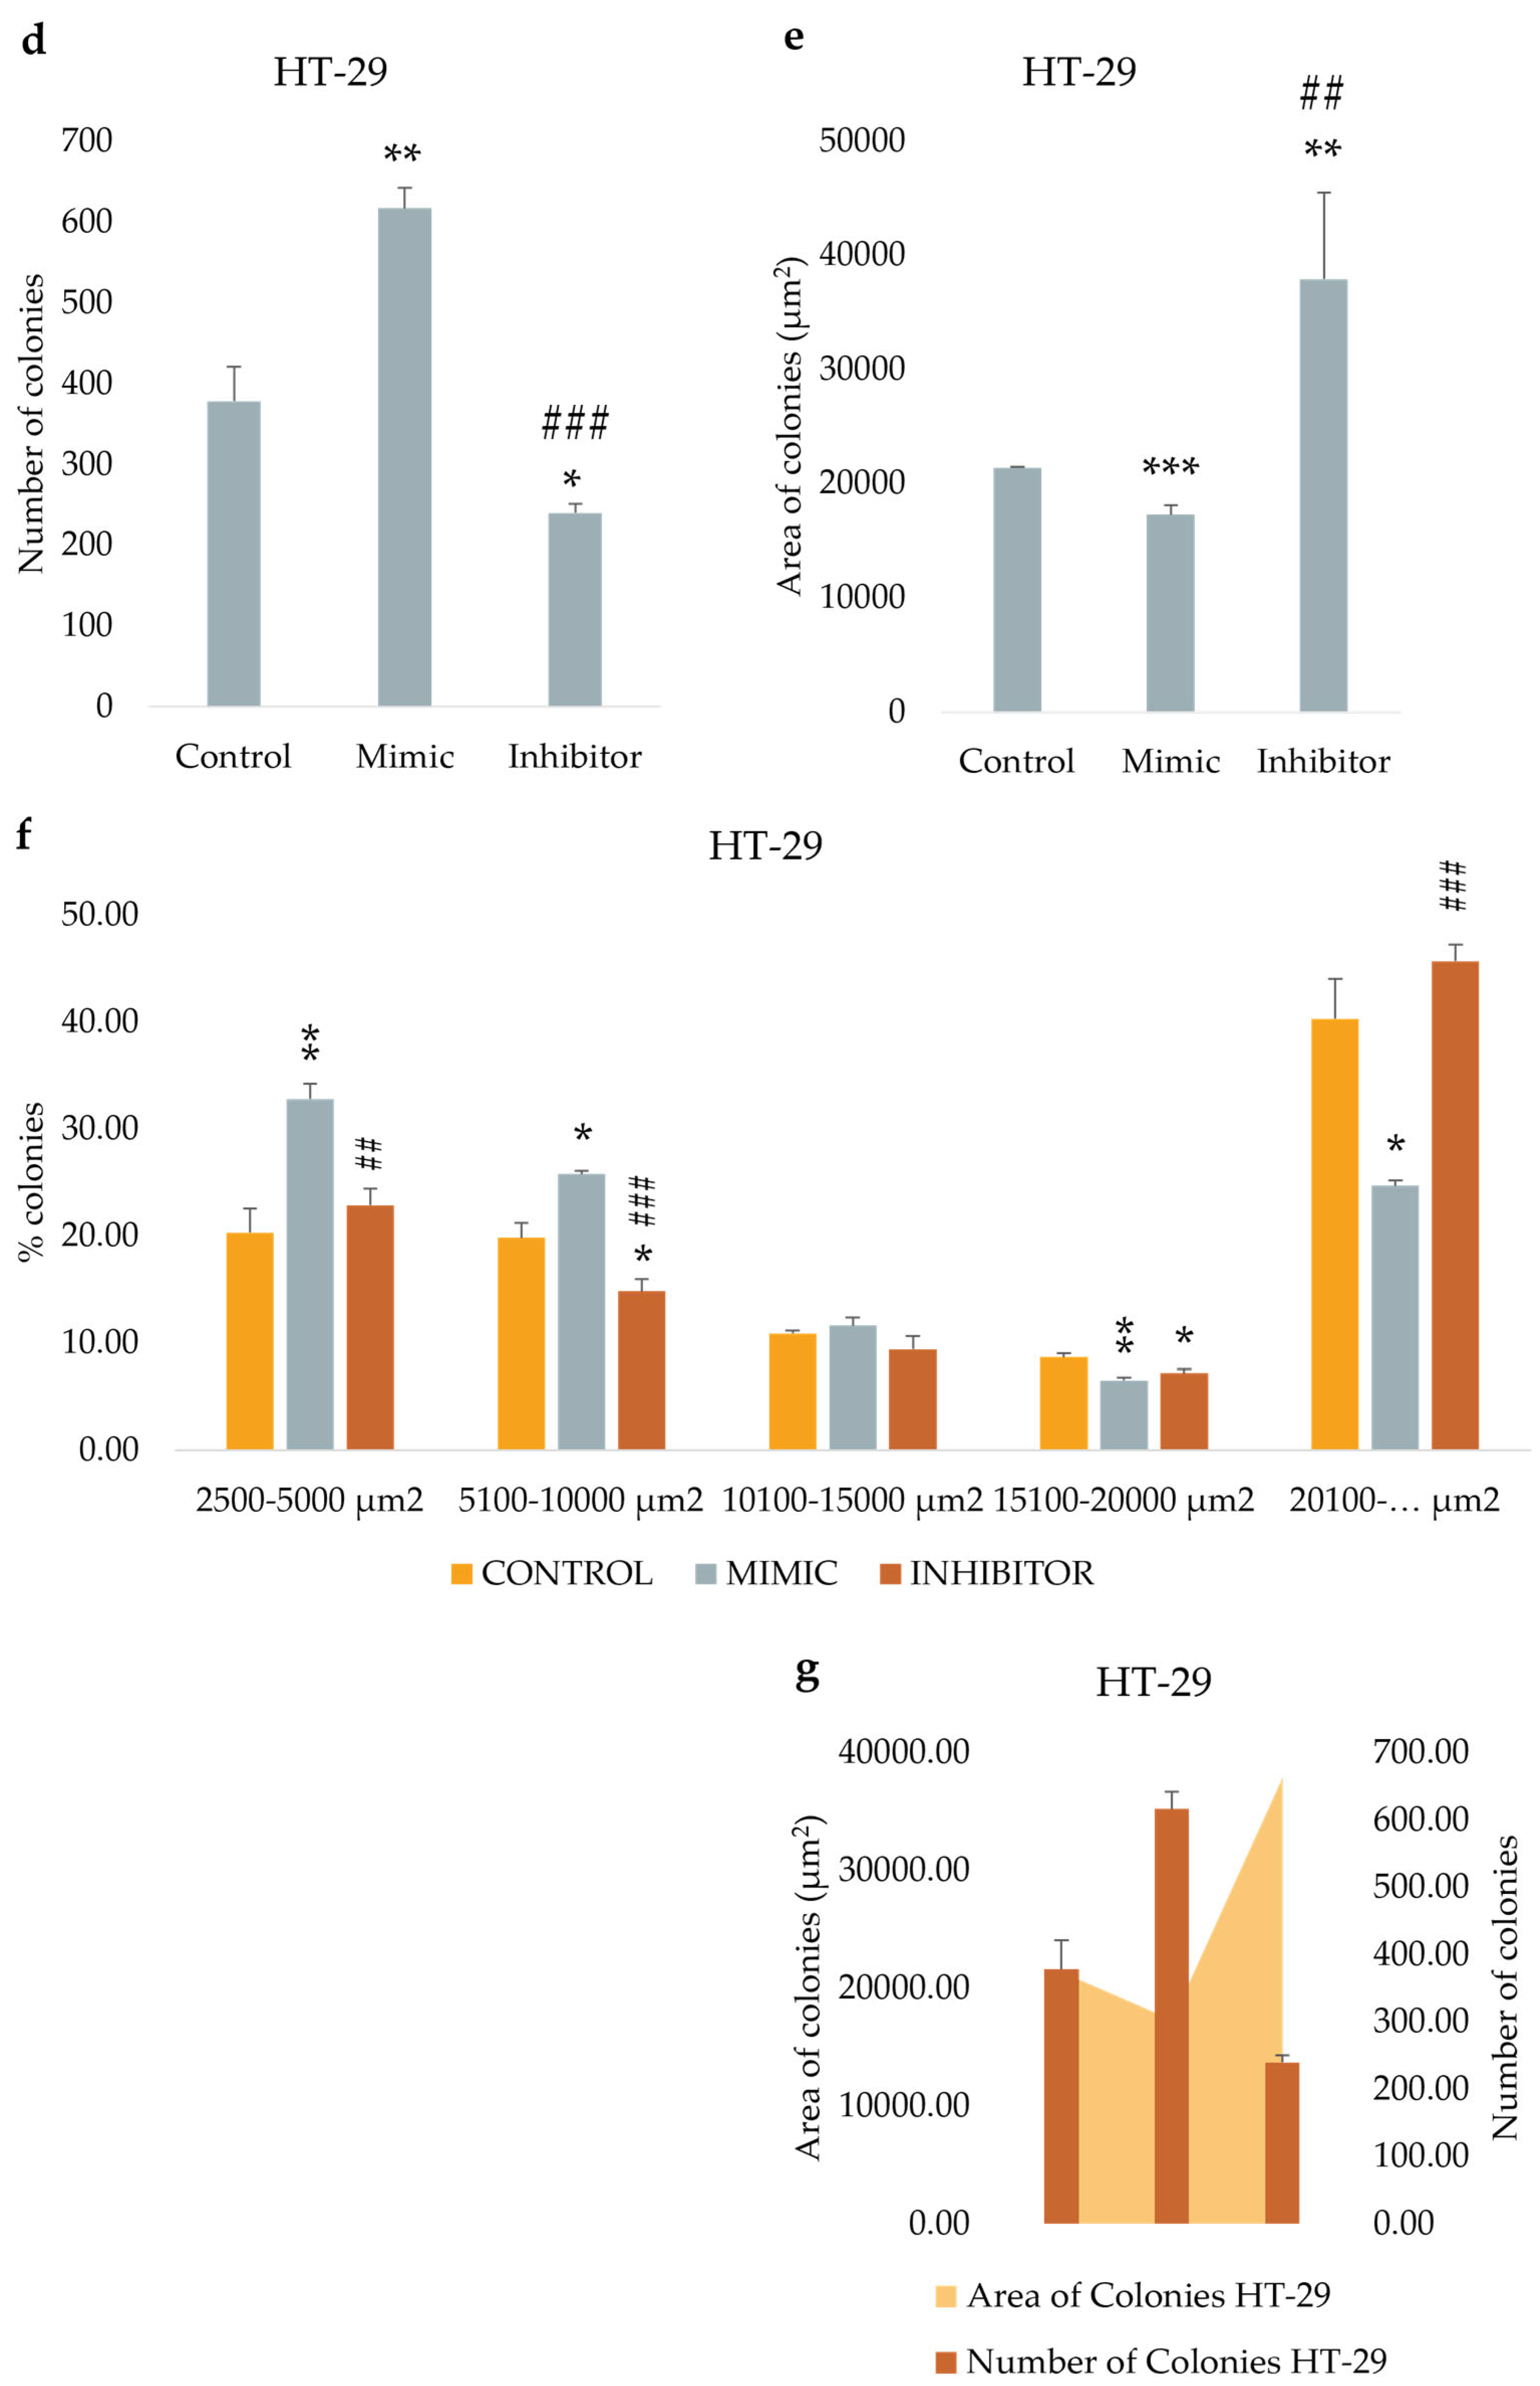
Figure 8.
Representative images of T84 untreated cells (a), mimic-treated cells (b) and inhibitor-treated cells (c) in soft agar colony formation assay. Comparison of the number of colonies of untreated, mimic-treated and inhibitor-treated T84 cells (d). Comparison of average colony area of untreated, mimic-treated and inhibitor-treated T84 cells (e). Percentage of colonies divided by size (f). A comparison of the area and number of colonies for T84 spheres (g). The symbol * indicates the comparison between control and treated cells with a p-value < 0.05. The symbol ** indicates the comparison between control and treated cells with a p-value < 0.01. The symbol *** indicates the comparison between control and treated cells with a p-value < 0.001. The symbol # indicates the statistical difference between mimic- and inhibitor-treated cells with a p-value < 0.05. The symbol ## indicates the statistical difference between mimic- and inhibitor-treated cells with a p-value <0.01. The symbol ### indicates the statistical difference between mimic- and inhibitor-treated cells with a p-value <0.001. Values expressed as Mean ± SE.
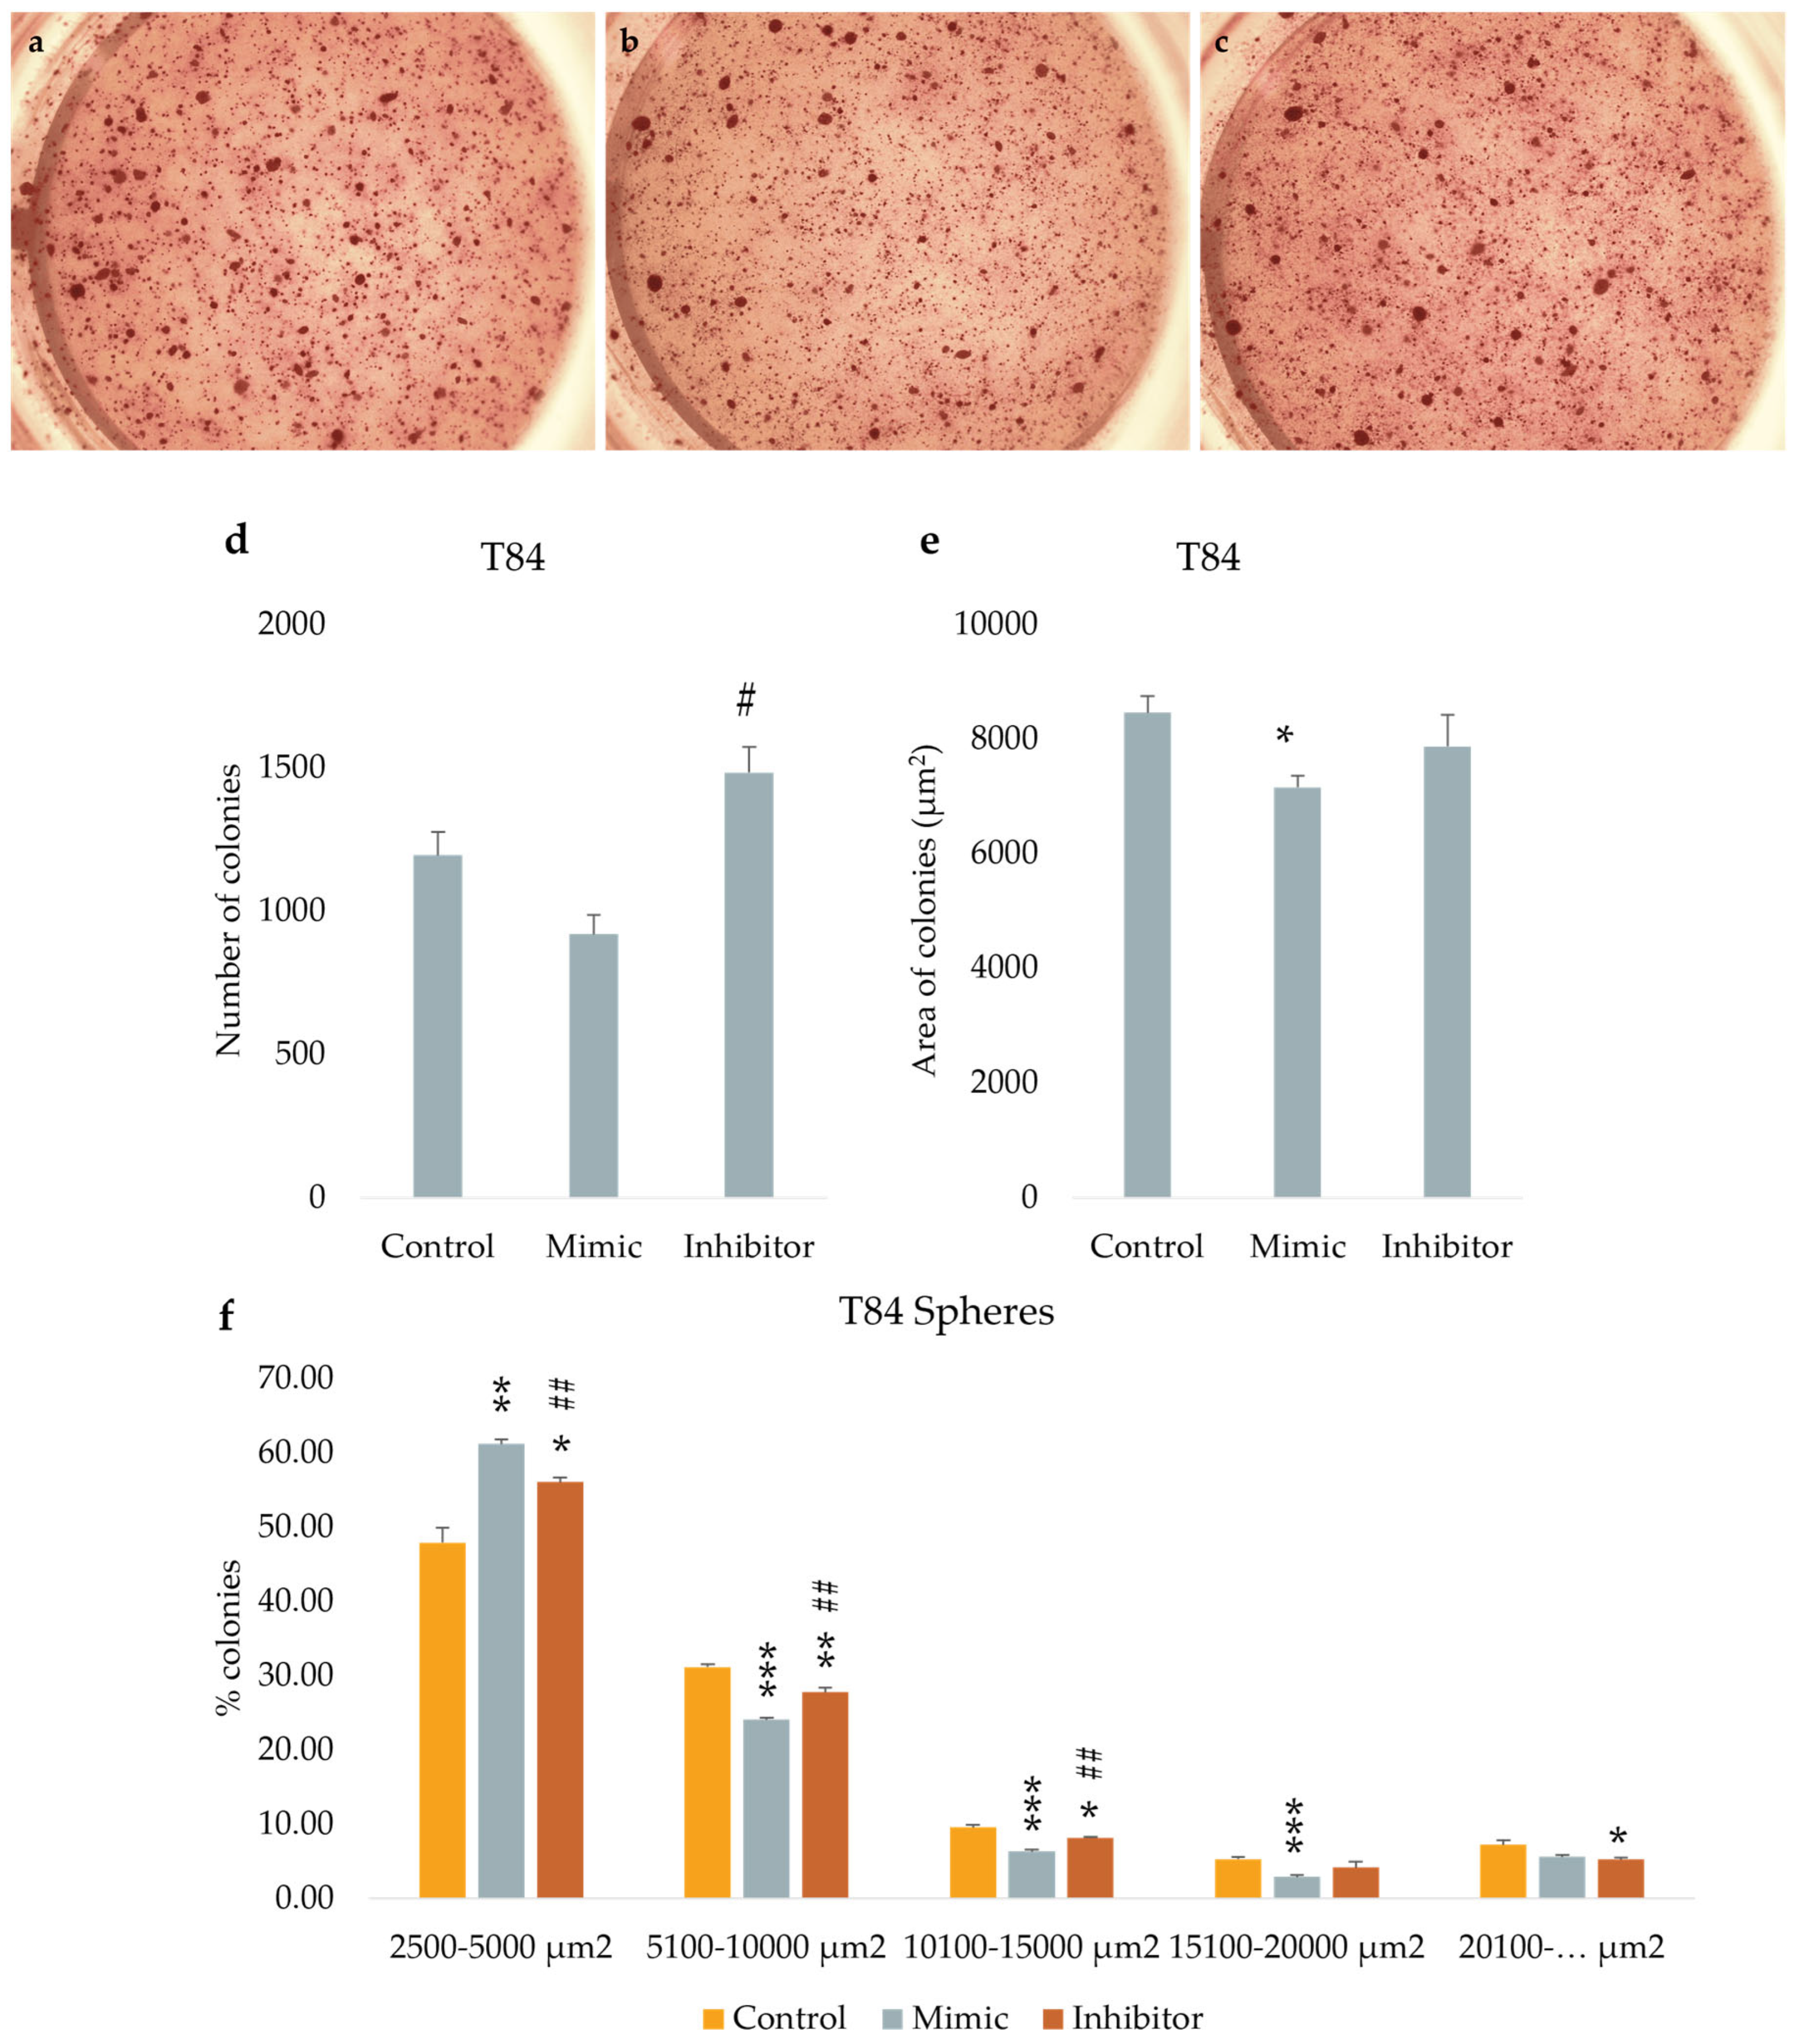
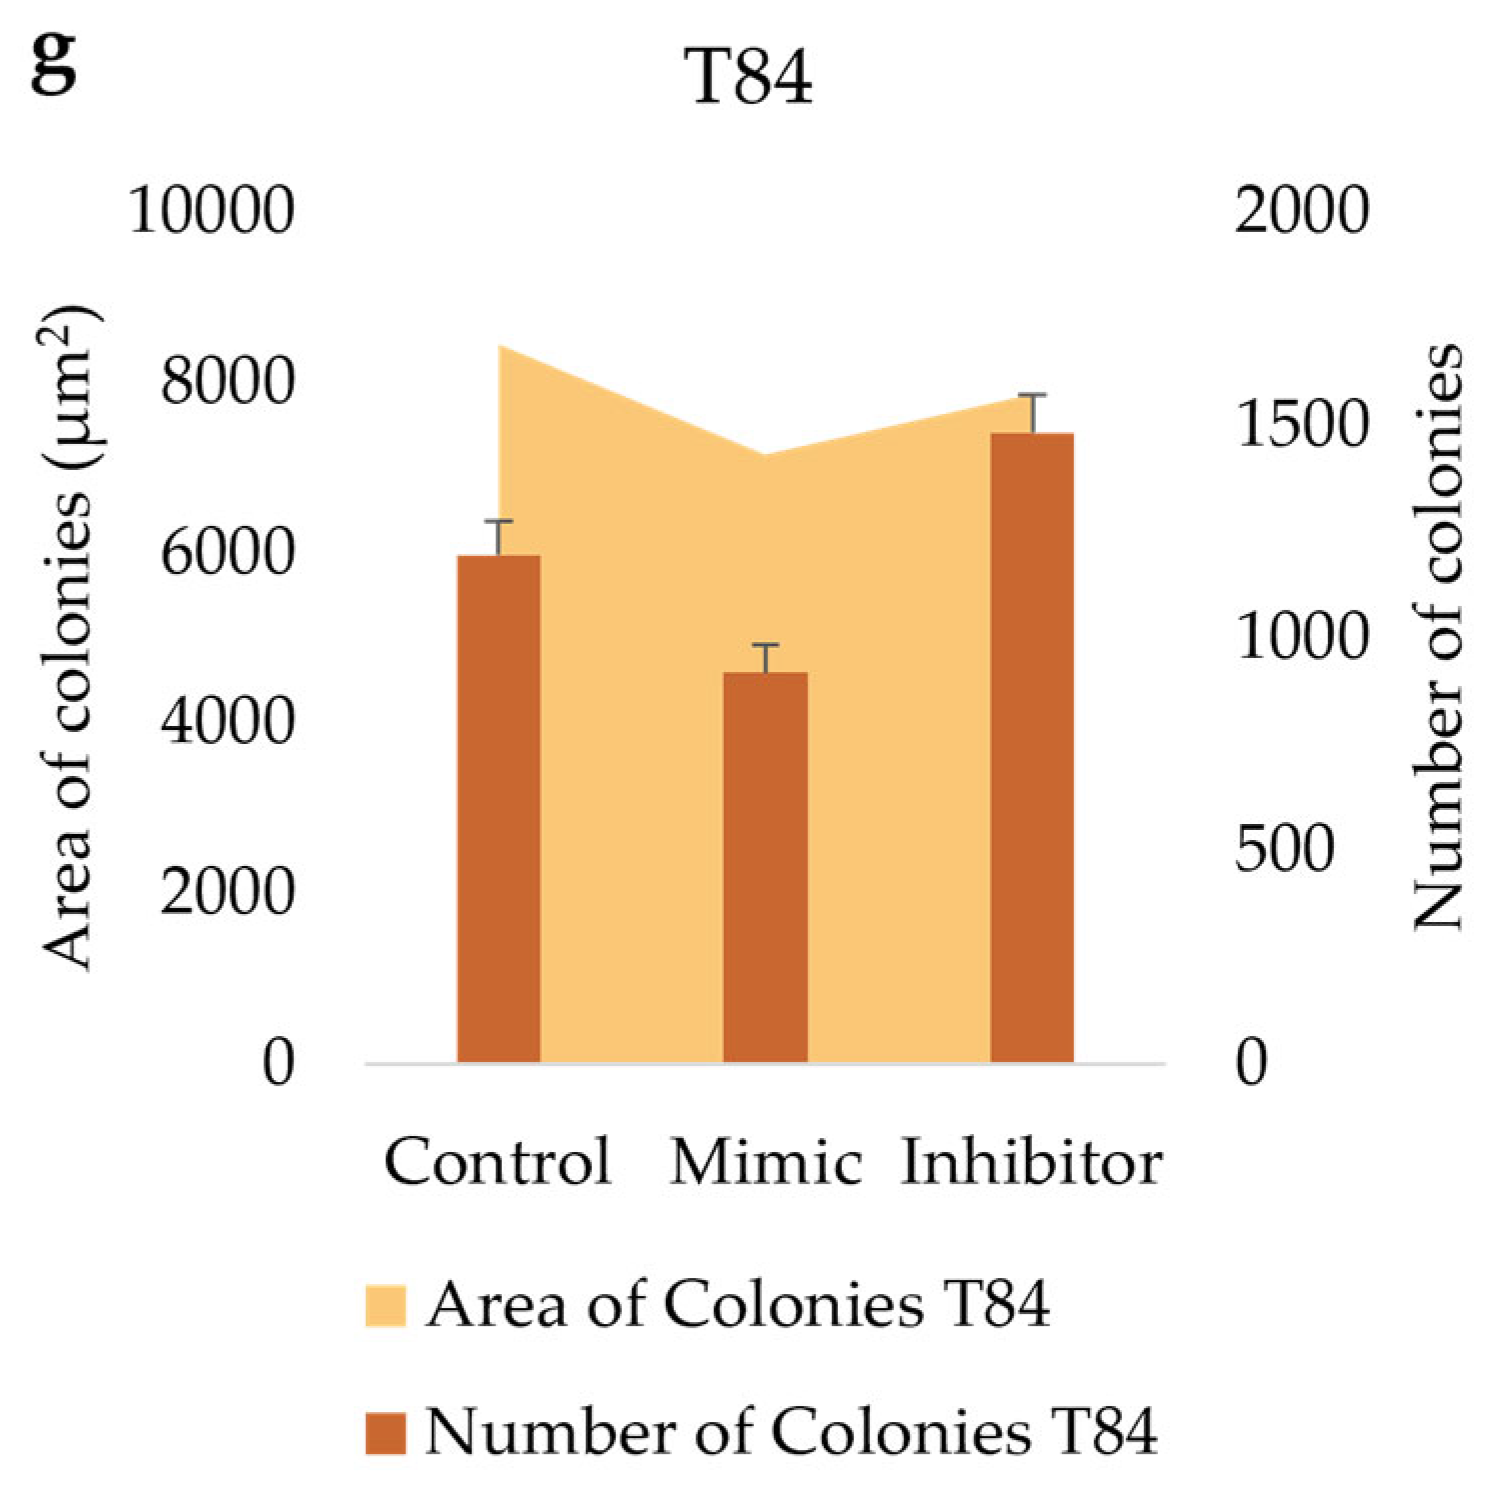
Disclaimer/Publisher’s Note: The statements, opinions and data contained in all publications are solely those of the individual author(s) and contributor(s) and not of MDPI and/or the editor(s). MDPI and/or the editor(s) disclaim responsibility for any injury to people or property resulting from any ideas, methods, instructions or products referred to in the content. |
© 2024 by the authors. Licensee MDPI, Basel, Switzerland. This article is an open access article distributed under the terms and conditions of the Creative Commons Attribution (CC BY) license (http://creativecommons.org/licenses/by/4.0/).
Copyright: This open access article is published under a Creative Commons CC BY 4.0 license, which permit the free download, distribution, and reuse, provided that the author and preprint are cited in any reuse.


