Preprint
Article

This version is not peer-reviewed.

100K SNP Panel Identifies the Genetic Characteristics of Spring Wheat Cultivars from a High-Altitude Region of China

A peer-reviewed article of this preprint also exists.

Submitted:

12 November 2024

Posted:

13 November 2024

You are already at the latest version

Abstract

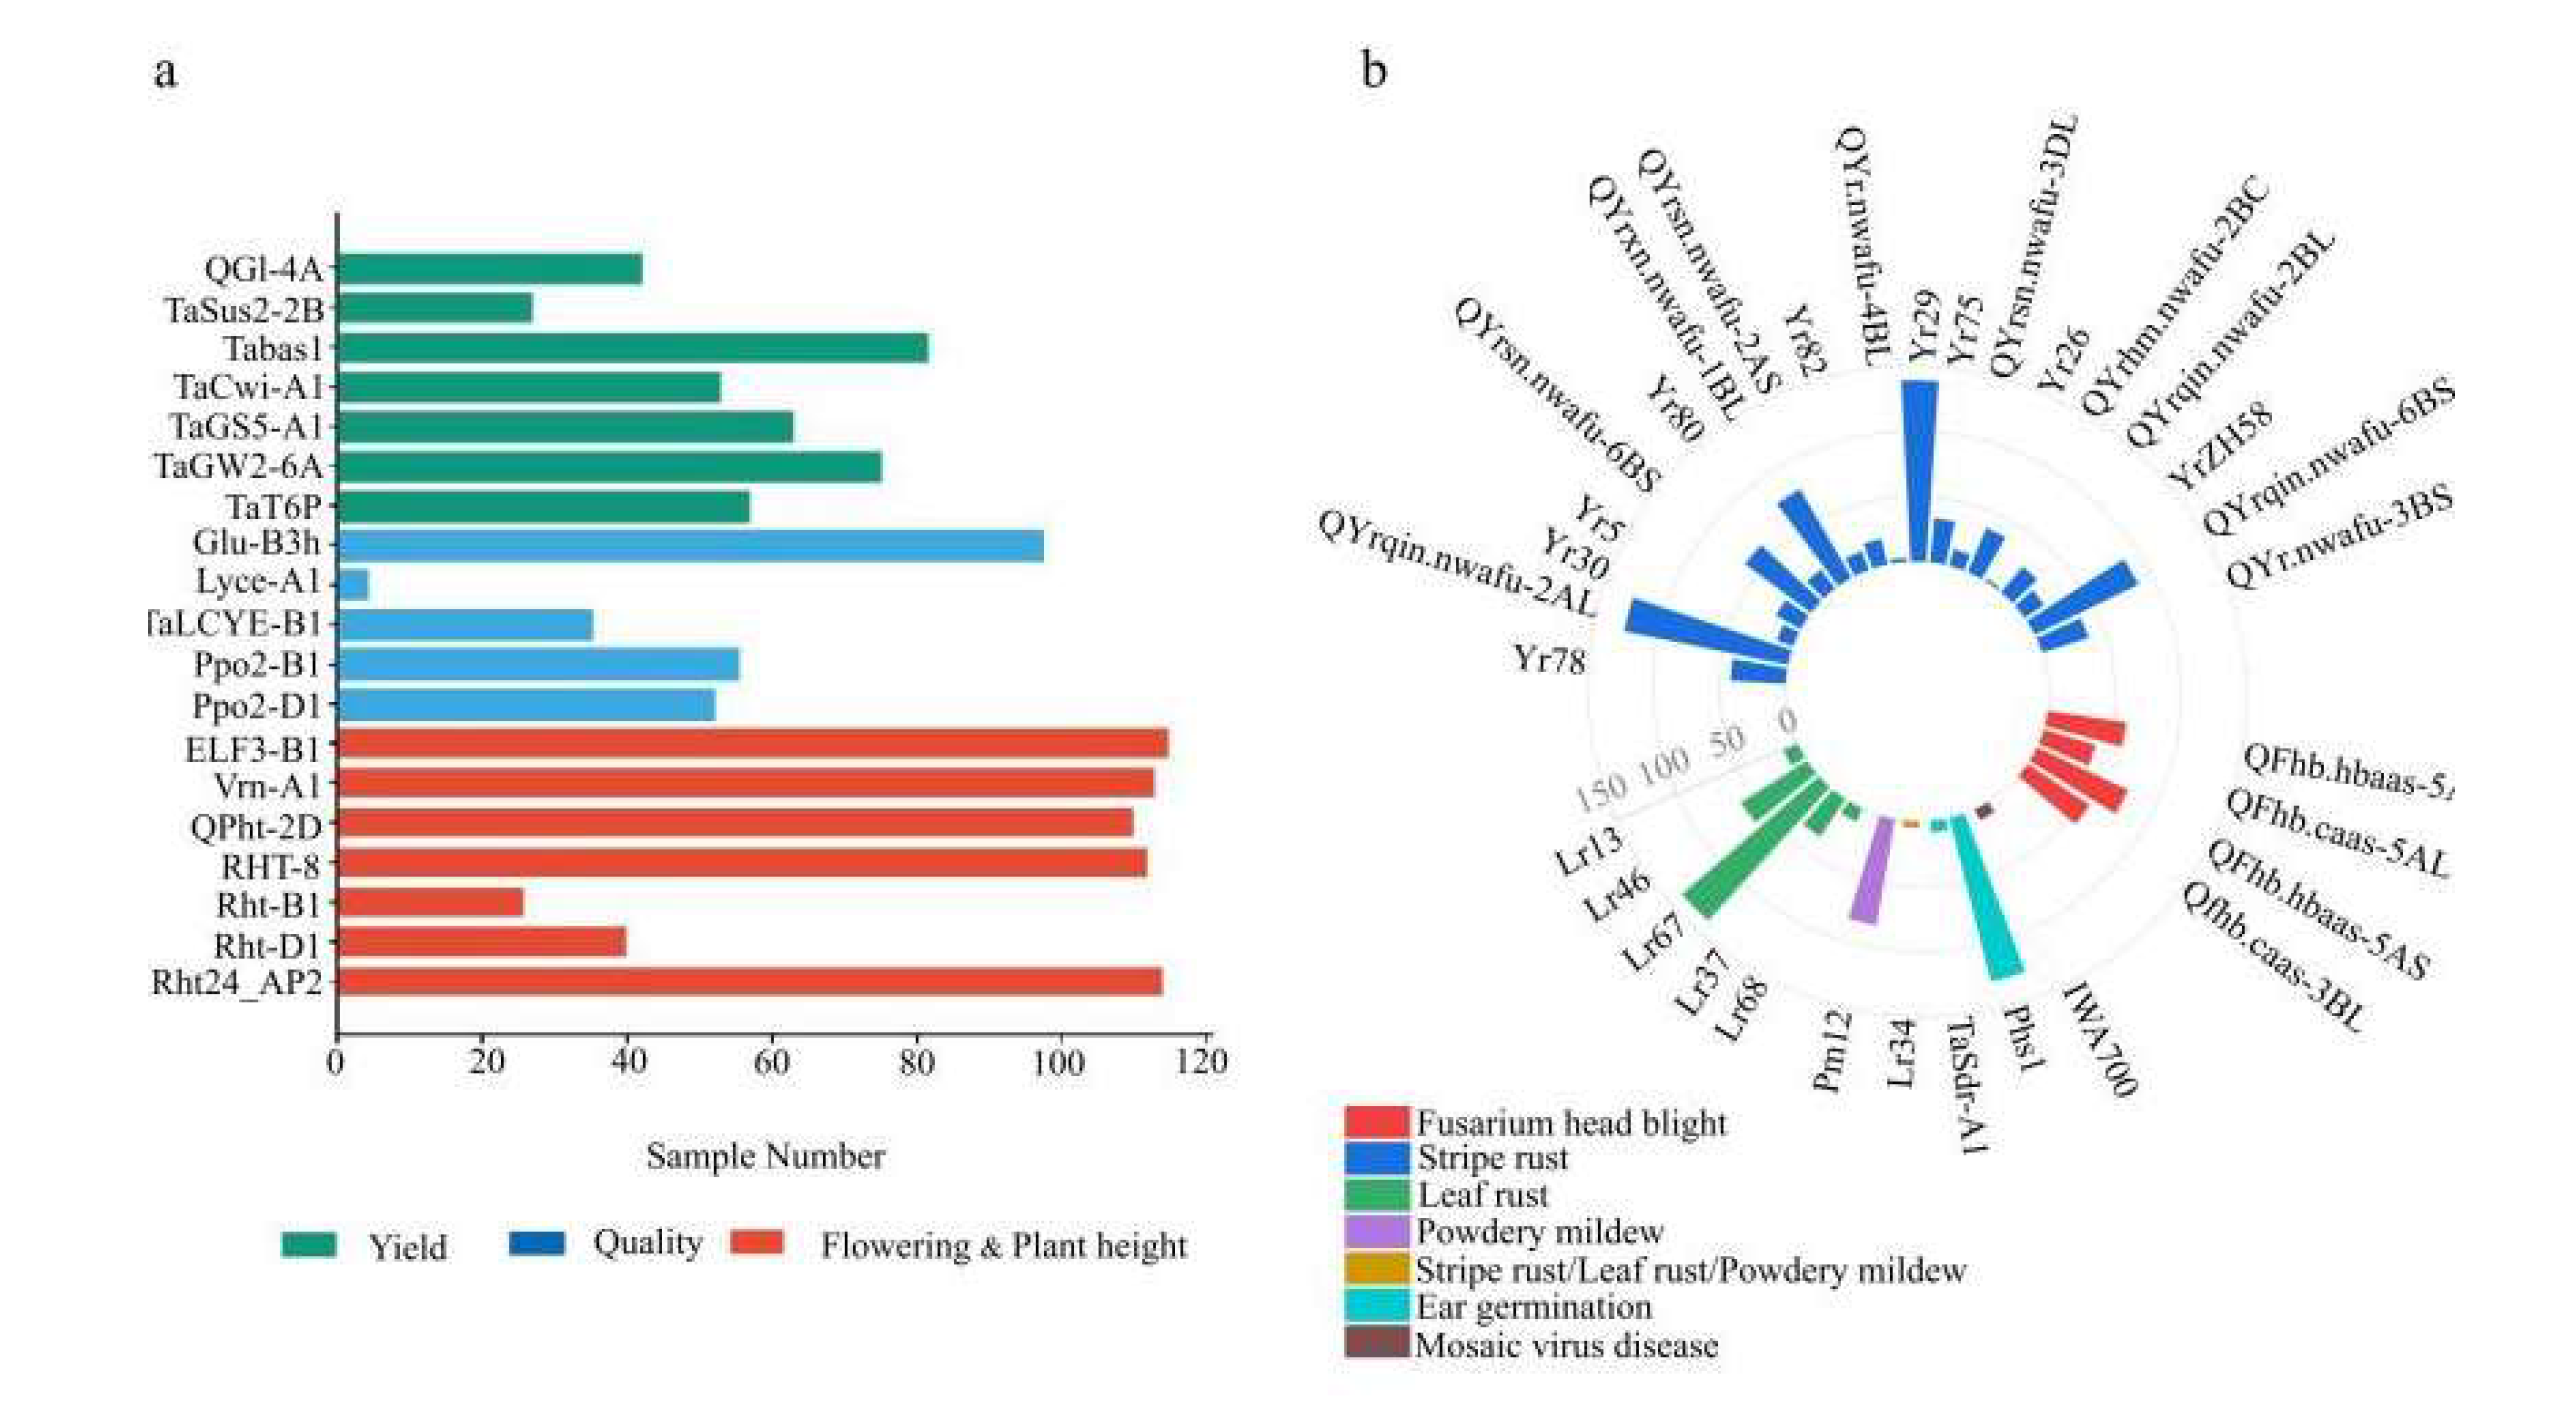
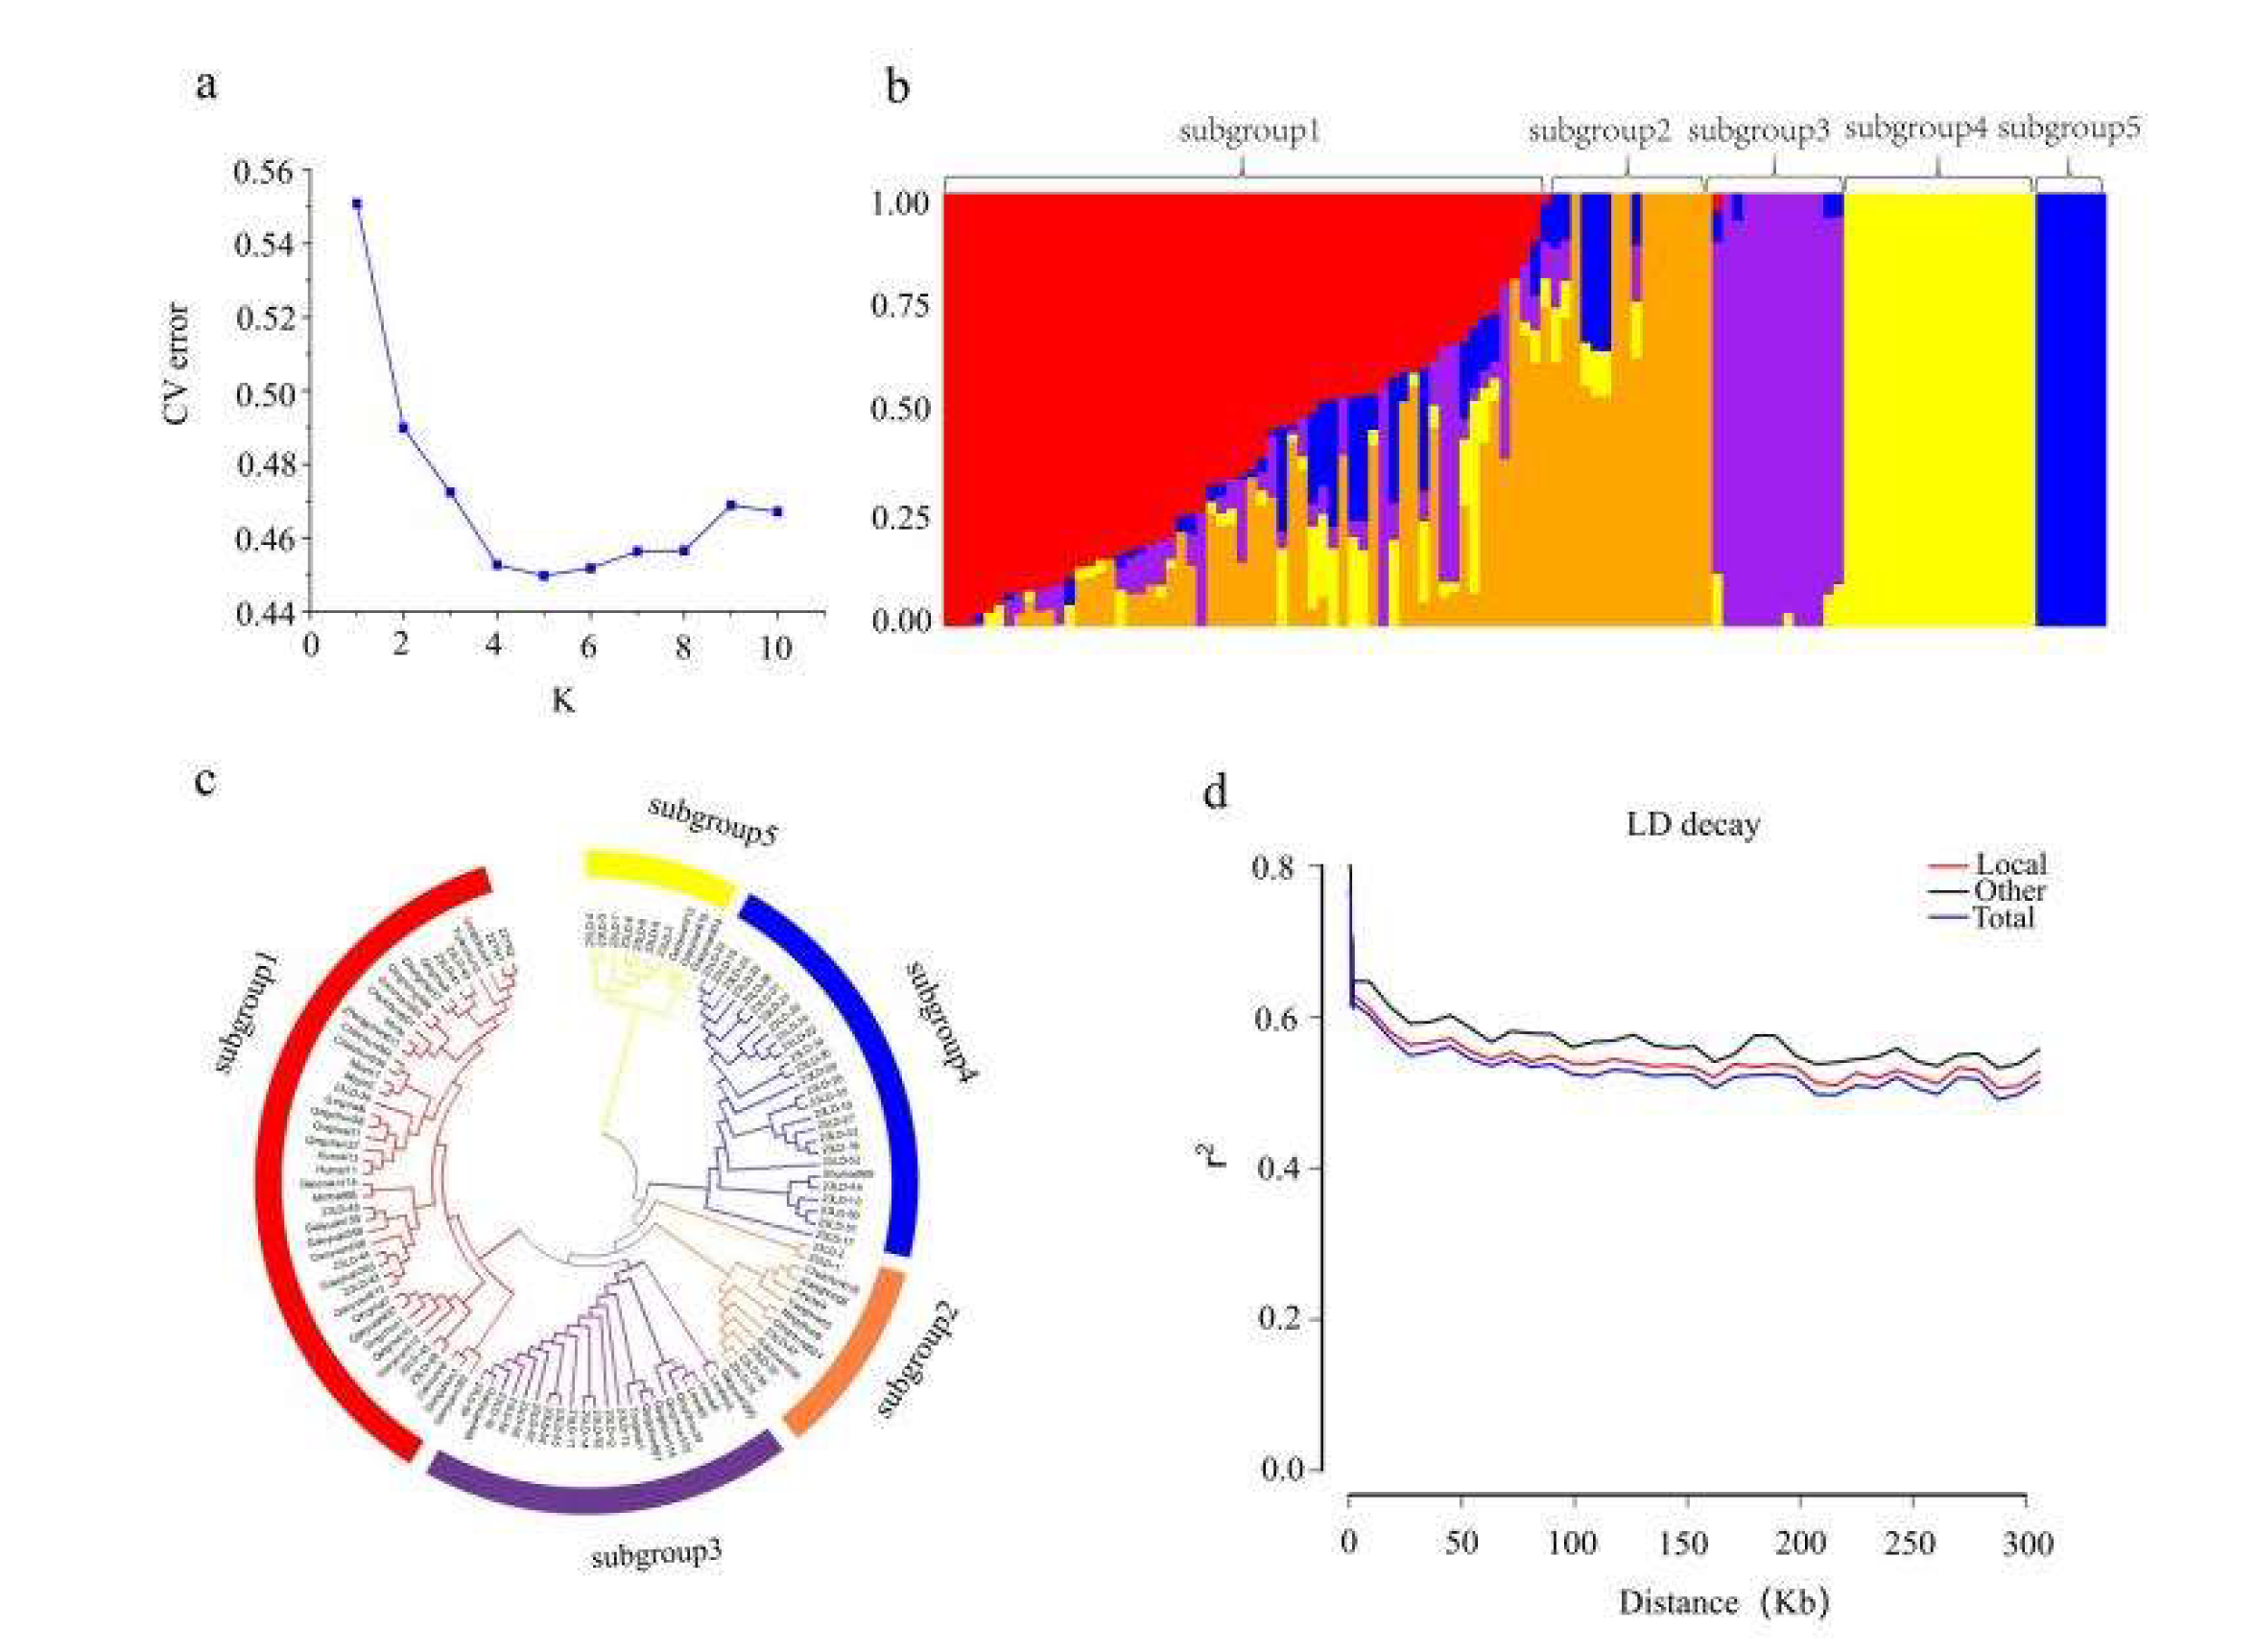
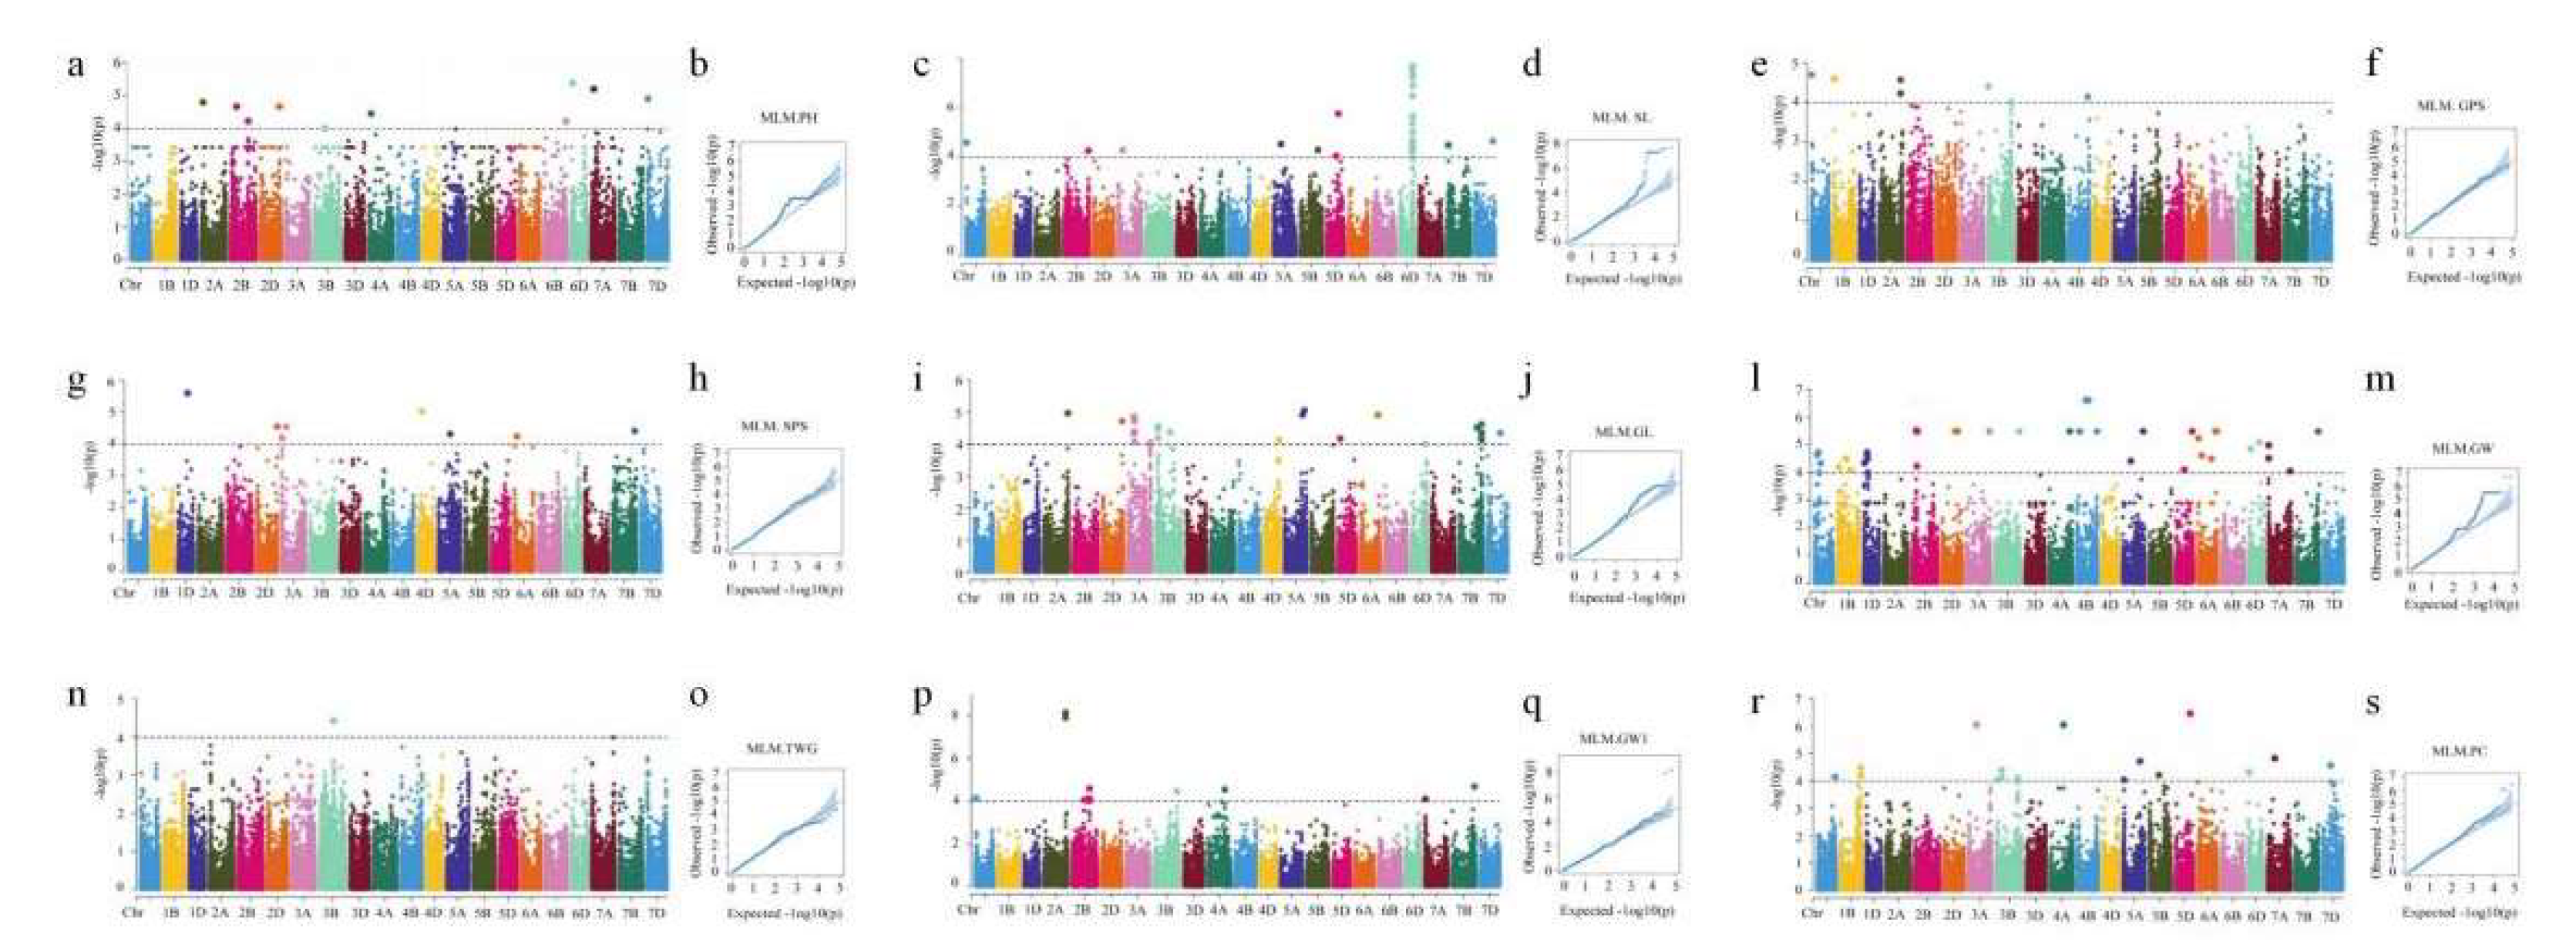
Uncovering the genetic characteristics of important traits in wheat cultivars is essential for targeted wheat breeding. Here, a liquid 100K single-nucleotide polymorphism (SNP) chip panel, integrating markers of known function, was selected and used to analyze genetic characteristics for 115 spring wheat cultivars from a high-altitude region of China. A total of 102 reported functional markers closely related to important traits were identified, including 54 related to yield and grain quality and 33 associated with disease resistance and stress tolerance. Of the cultivars, 58.3% contained multiple marker genes, ranging in number between 20 and 29. Genetic structure analysis revealed that the cultivars were grouped into five subgroup. Genome-wide association studies identified 218 significant loci on 20 chromosomes, with the exception of chromosome 3D, associated with nine traits and which explained 14.15%–29% of phenotypic variance, with 199 potential candidate genes being annotated for the nine traits studied. Notably, 21 previously unidentified candidate genes, with associated SNPs, were closely associated with seven traits, explaining 14.26%–19.86% of the phenotypic variance. The current study revealed the genetic characteristics of spring wheat cultivars from a high-altitude region of China. This will provide a reference for spring wheat breeding for high-altitude regions and promote the fine-mapping of new genetic loci controlling important traits.

Keywords: 
;  ;  ;  ;  

1. Introduction

Wheat (Triticum aestivum L.) is a major staple crop that is widely planted globally [1]. Disease resistance, high grain yield and high grain quality are the main wheat breeding targets, and directly impact the sustainability of agricultural practices and the security of food supplies [2]. Qinghai Province, located on the Qinghai-Tibet Plateau, possesses unique geographical and climatic conditions and has resulted in the evolution of highland-specific wheat germplasm resources. These resources constitute a vital source of wheat genetic diversity for the breeding of novel spring wheat cultivars adapted to high-altitude conditions [3]. Therefore, in-depth research on the genetic characterization of wheat breeding material and identification of functional markers associated with key agronomic traits are of great significance in developing high-performing cultivars to enhance the efficiency of agricultural production under unusual highland conditions.
Single-nucleotide polymorphism (SNP) genotyping assays and genome-wide association studies (GWASs) have been developed to detect and characterize genetic variation. A multiple single-nucleotide polymorphism approach, integrating genotyping-by-target-sequencing (GBTS) with capture-in-solution (liquid chip) technology, has been widely used to identify loci associated with important traits in crops [4,5,6]. This technology has proved to be flexible and cost-effective, being easy to improve by adding new SNPs to the probe panels. It has allowed the development of multiple genotyping systems, such as 1K, 5K, 10K, 20K, 100K, and 251K SNP marker panels in crops [4,5,6]. In wheat, many functional markers controlling wheat adaptability, disease resistance, stress tolerance, grain quality, and yield have been developed [7]. In the current study, we selected the 100K SNP panel containing known functional wheat markers to analyze the genetic characteristics of a collection of local cultivars from a high-altitude region. It is possible to effectively reveal the genetic background and breeding potential of wheat germplasm based on functional marker detection and SNP genotyping [8]. GWASs are an important tool for detecting genetic loci controlling specific agronomic traits in natural populations. Many genetic loci controlling important traits have been identified in various crops by the GBTS approach, such as wheat yield and quality [9], soybean growth period [10], and rice yield [11]. For instance, the 90K SNP chip was employed to identify many stable loci controlling yield and quality traits in wheat cultivars in low-altitude regions [12,13,14,15].
The number of genetic loci associated with wheat yield, quality, and agronomic traits has been extensively identified. These traits are significantly influenced by environmental factors, exhibiting variations across different regions due to climatic conditions, soil type, and biological factors, among others [16]. Genetic characteristics of the spring wheat cultivars from the high-altitude region of China have not been reported. In the current study, the liquid 100K chip was used to conduct analysis of the functional markers and GWAS in 115 spring wheat cultivars from the high-altitude region of China. This research aims to provide a reference for targeting the improvement of highland wheat cultivars with high-yielding, high-quality cultivars with improved response to biotic and abiotic stresses.

2. Materials and Methods

2.1. Experimental Materials

The experimental materials consisted of 115 spring wheat cultivars, which had been collected by the Northwest Plateau Institute of Biology, Chinese Academy of Sciences, Xining, Qinghai, China. These cultivars had been registered or introduced through the agronomic institutes of Qinghai Province and Sichuan Province. Detailed information on the cultivars is presented in Table S1.

2.2. DNA Extraction and SNP Genotyping

Leaf samples were taken from 4- to 5-leaf seedlings and genomic DNA was extracted using the DNA Extraction Kit (DP342; Tiangen; China), following the manufacturer’s guidelines. The integrity of genomic DNA was assessed using 1% agarose gel electrophoresis and quantification was achieved using a Qubit fluorometer (Q33226; Thermofisher; USA). Single-nucleotide polymorphism (SNP) genotyping was performed using the liquid 100K wheat chip developed by MolBreeding Biotechnology Co. Ltd. (Shijiazhuang; China). The raw genotype data were filtered based on criteria of a missing rate > 0.2 and minor allele frequency < 0.05. The 100K liquid chip contained 102 significant markers with known functions associated with individual traits, including resistance to biotic stresses and tolerance to abiotic stresses, high yield, high grain quality, plant architecture, and growth period, which were selected to achieve genotyping of the experimental materials.

2.3. Evaluation of Agronomic Traits

The field trial was conducted in 2023 and 2024 at the Xincun Experimental Station in Lanlongkou Town, Huangzhong District, Xining, Qinghai Province, China. The cultivars were sown on March 28, 2023, and April 5, 2024 at a sowing rate of 300 kg seed per hectare.. Before sowing, urea (N ≥ 46%) and diammonium phosphate (P ≥ 46%) were used as basal fertilizers in the seedbed, with total pure nitrogen and pure phosphorus amounts of 90 kg N per hectare and 207 kg P per hectare, respectively. Other practices followed conventional field management in the region. The cultivars were sown in replicated randomized block experimental design, with each cultivar represented by three replicates, each consisting of five rows, a row length of 2 m, and a row spacing of 0.15 m. The spacing between replicates and the width of surrounding walkways were 0.4 m . At maturity, six plants were sampled at random from each replicate of each test cultivar to quantify traits such as plant height, spike length, and spikelet number per ear, each being determined on the main culm. After threshing, a smart seed testing system (SC-G;Hangzhou;China)and grain analyzer (Shanghai;China) were used to measure the number of grains per spike, thousand-grain weight, grain weight per spike, grain length, grain width, and grain protein content at a moisture content of 13%, making nine traits assessed in total.

2.4. Population Structure and GWAS

Population structure analysis was performed using the Admixture software, with a burn-in period length and the number of Markov chain Monte Carlo replicates after burn-in set to 10,000 each. The K values ranged from 1 to 10, and the results for different K values were uploaded to Structure v2.3.4 software to determine the optimal number of clusters. To assess linkage disequilibrium (LD), the squared correlation coefficient or coefficient of determination (r2) at marker loci was used as the parameter, with an r2 threshold of 0.2 for detecting LD decay. The calculation of LD was performed using the PopLDdecay software. A phylogenetic tree was constructed using the neighbor-joining (NJ) method in MEGA7. The graphical representation of the tree was refined using Adobe Illustrator 2023.
Utilizing the TASSEL 5.0 software, we conducted a GWAS, employing the mixed linear model (MLM) approach to phenotypic values, means, and Best Linear Unbiased Predictors (BLUPs) for the nine traits (Table 1) for the 115 cultivars tested. Associations between traits and markers were assessed with a significance threshold of P = 1.02 × 10⁻4 [17,18], to identify SNP markers significantly associated with individual target traits.

2.5. Statistical Analysis

Statistical analysis of functional markers and phenotypic traits (mean, standard deviation (SD), variance, skewness, kurtosis, coefficient of variation) was conducted using Excel 2019 and SPSS22.0 (IBM, Armonk, NY, USA). The analysis results were visualized through the Origin 2021 graphing software (OriginLab Corporation, Northampton, MA, USA).

3. Results

3.1. Detection of Phenotypic Variation and Functional Markers

The characterization of agronomically important morphometric traits and functional markers in the test germplasm collection provides primary information for use in targeted breeding in wheat. In the study, 115 spring wheat cultivars were collected and planted in the experimental site in the high-altitude region of Qinghai Province. A total of nine phenotypic traits were measured, and the coefficient of variation for each trait ranged from 0.02(grain width) to 0.29 (grain weight) in 2023 and from 0.07(grain width) to 0.35 (grain weight) in 2024 (Table 1). The absolute skewness value for each trait was less than 1, demonstrating high performance (Table 1). The weighted average values of each trait over the two years were used for diversity analysis, indicating that each of the nine traits in this study approximates to a normal distribution and they are suitable for the GWAS (Figure S1). Correlation analysis demonstrated that all trait pairs showed significant positive correlations (P ≤ 0.05), except for grain length (GL) and plant height (PH); grain width (GW) and spike length (SL),Number of grains per spike (GPS),Number of spikelets (SPS); thousand-grain weight (TGW) and Number of grains per spike (GPS),Number of spikelets (SPS); protein content (PC) and Number of grains per spike (GPS), grain width (GW). (Figure S2).
The 115 spring wheat cultivars were genotyped using the 100K SNP panel. A total of 108,836 reliable SNPs were obtained, which were found to be distributed across all 21 wheat chromosomes (Figure S3). Markers associated with known functions were also detected and a total of 54 markers and genes related to yield and grain quality were identified. Of these, 36 and 18 were yield- and quality-related markers and genes, respectively, with seven genes associated with yield (QGl-4A, TaSus2-2B, Tabas1, TaCwi-A1, TaGS5-A1, TaGW2-6A, and TaT6P) and five associated with quality (Glu-B3h, Lyce-A1, TaLCYE-B1, Ppo2-B1, and Ppo2-D1) showing positive effects (Figure 1b). Notably, the gene Tabas1, located on chromosome 2B, was associated with grain weight/spike, accounting for 74.4% of the variance in this trait, and the mean grain weight/spike of cultivars containing Tabas1 was 2.75 g, significantly higher than the value of 1.53 g for cultivars lacking Tabas1. Four cultivars carried the flour color-related gene Lyce-A1. The cultivars carrying genes associated with plant height, including QPht-2D, RHT-8, Rht-B1, Rht-D1, and Rht24_AP2, ranged in height from 22.6% to 95.6% of the mean height of the 115 cultivars (Table S2). A total of 48 markers and genes related to disease resistance and stress tolerance were identified among the 115 spring wheat cultivars. Among these markers and genes, 33 showed positive effects, including increased resistance to Fusarium head blight (4), yellow rust (19), leaf rust (5), powdery mildew (1), mosaic virus disease (1), and pre-harvest grain sprouting (2) (Figure 1a). Notably, the leaf rust resistance gene Lr67 was present in all 115 cultivars and 111 cultivars carried the yellow rust resistance gene Yr29, while the fewest cultivars carried the yellow rust resistance genes QYrhm.nwafu-2BC and QYr.nwafu-4BL, represented by only two and three cultivars, respectively. Additionally, three cultivars carried the multiple disease resistance gene Lr34, while the remaining disease resistance genes were carried by between 6% and 94% of the cultivars tested (Table S2).
Of the 115 cultivars, some contained multiple superior functional markers, with 93.9% of the cultivars having between 17 and 29 superior gene markers (Table S3). Notably, ‘Moyin 2’ exhibited the highest number of superior gene markers, accounting for 64.4% of the total markers. ‘Qingmai 6’, ‘Zhongmai17’, ‘Chaichun 236’, ‘Lantian 3’, ‘Gaoyuan 356’, ‘Gaoyuan 338’, and ‘23LD-36’ contained the fewest superior markers, of between 13 and 16. To select better parents for breeding, a reference value based on the average number of superior gene markers in the tested materials was used for screening, resulting in the selection of 55 cultivars with multiple (between 21 and 29) superior gene markers (Figure S4). This study revealed extensive variation in the phenotypic traits and functional markers and could provide a reference for the selection of parents for targeted wheat breeding.

3.2. Analysis of Genetic Structure

The Admixture software was employed to compute the genetic components for K = 1 to 10 among the 115 wheat cultivars. The smallest error was observed when K was equal to 5 (Figure 2a), and the cultivars could be divided into five subgroups (Figure 2b). This finding agreed with that of the clustering analysis (Figure 2c). Clusters I, II, and III were primarily composed of wheat accessions from Qinghai Province, with some resources showing overlap and cross-referencing with wheat accessions from other regions. Clusters IV and V were mainly composed of some new lines from Sichuan, including the synthetic hexaploid wheat cultivar SHW-L1. Different types of accession are included within the same cluster, indicating the existence of gene flow or gene introgression among the accessions. Linkage disequilibrium analysis revealed that, as the physical distance increased, the coefficient of determination (r2) value declined, with a rapid decay occurring within the 0–50 kb range. When the intercept of r2 was set at 0.55, a plateau was reached, and the average r2 value for the tested cultivars was approximately 150 kb (Figure2d). The non-local cultivars (“Out-of-province cultivars” in Figured) exhibited the slowest LD decay, slower than the local cultivars from Qinghai Province.

3.3. Genome-Wide Association Study of Agronomic Traits

The mixed linear model was used to conduct GWASs of the nine traits in the 115 cultivars. A total of 218 loci significantly associated with agronomic traits was identified (Table S4), distributed across 20 of the 21 chromosomes, with the exception of chromosome 3D (Figure 3), explaining 14.15% to 29.00% of the phenotypic variance. A total of 11 significant loci was associated with PH, 45 for SL, 8 for SPS, 9 for GPS, 54 for GL, 53 for GW, 1 for TGW, 18 for PC, and 19 for GW1(grain weight/spike). Six marker loci exhibited pleiotropic effects and were closely associated with two traits (Table S4). The markers 3A_146121442 on chromosome 3A and 3B_456341250 on chromosome 3B were associated with spike length and spikelet number, as well as grain length and thousand-grain weight, contributing 15.3% to 16.4% to phenotypic variance Additionally, the markers 1A_15208446 on chromosome 1A and 2A_709980511, 2A_709986147 on chromosome 2A were associated with grain weight/spike and spike grain number, contributing 14.82% to 29% to phenotypic variance Furthermore, the marker 2B_562640041 on chromosome 2B was associated with both grain weight and plant height.
Putative candidate genes harboring MTAs or the closest ones were annotated based on LD distance. A total of 199 potential candidate genes underlying 218 significant loci were annotated (Table S4). In total, 20, 142, and 31 SNPs were located in genes, downstream and upstream sequences, respectively, and corresponding to genes were also predicted (Table S4). Of 20 genes containing SNPs, 12 had annotation information but eight encoded unknown proteins; although these genes had potential functions, they could not be verified. Some candidate genes belonged to gene families encoding proteins of known function, such as the Fox protein regulating grain size in rice [19], and the guanosine triphosphate (GTP)-binding protein associated with plant height in rice [20]. These potential genes need to be fine-mapped and their functions verified in wheat.

4. Discussion

Yield, grain quality, disease resistance, and stress tolerance are important research targets for wheat breeding. The detection and use of genes are of great significance for understanding the functions of genes and their exploitation in breeding [21,22]. Previous studies have isolated many genes for yield, grain quality, and disease resistance, and developed the corresponding functional markers. For disease resistance, markers have been developed such as yellow rust resistance markers Yr5, Yr7, YrSP, QYr.nwafu-4BL, QYr.nwafu-3BS, and QYr.nwafu-3BS [23] and Fusarium head blight resistance markers Qfhb.caas-3BL, QFhb.caas-5AL, QFhb.hbaas-5AL, and QFhb.hbaas-5AS, while genes have been isolated such as the powdery mildew resistance gene Pm21. These markers have been employed in wheat breeding, using molecular marker-assisted selection. In the present study, 115 spring wheat cultivars that have been planted and utilized widely in high-altitude regions were collected from Qinghai Province and functional markers were detected, using the liquid 100K chip. No cultivars carried YrSP, a yellow rust resistance gene which had broken down as the pathogen adapted to cultivars carrying that gene [23]. Of the 115 cultivars, 1.7% to 67.8% carried markers associated with stripe rust resistance genes QYr.nwafu-4BL, QYr.nwafu-3BS, or QYr.nwafu-3BS, while 26% to 60% carried markers associated with Fusarium head blight resistance Qfhb.caas-3BL, QFhb.caas-5AL, QFhb.hbaas-5AL, or QFhb.hbaas-5AS, and 57.4% 0f the cultivars carried powdery mildew resistance gene Pm12. These cultivars are important sources of effective disease-resistance genes and could be used to improve disease resistance in spring wheat of the Qinghai region. Pre-harvest grain sprouting occurs regularly in high-altitude regions as a consequence of climate change, with 94% (108) of the cultivars carrying the pre-harvest sprouting resistance gene Phs1, and 7% (8) carrying the seed dormancy gene TaSdr. The effect of Phs1 is greater than that of TaSdr in resisting pre-harvest sprouting [24]. Increasing grain weight/spike contributes the most to enhancing wheat yield potential [25], and grain size directly determines wheat grain weight/spike [26]. Our study identified six marker genes associated with grain weight that exhibited a positive effect distribution frequency exceeding 50%, indicating that these cultivars had been chosen based on their good yield performance. This further suggested that grain traits positively contribute to high grain yield in Qinghai Province. The above results indicated that yield and disease resistance had improved in spring wheat cultivars in Qinghai Province.
Recently, wheat grain quality was associated with improvements in people's living standards. Wheat processing quality is poor in high-altitude regions (as in Qinghai Province). Gluten, specifically high-molecular-weight (HMW) glutenins, are important indicators of wheat processing quality [27,28]. In our study, the low-molecular-weight glutenin gene Glu-B3h was present in 84.3% of the cultivars. The superior grain-quality genes, such as the HMW glutenin genes Dx5 and/or Dy10, are absent from these cultivars. Thus, more work on targeting grain quality improvement in wheat needs to be conducted in high-altitude regions.
Overall, 58.2% of the cultivars contained superior marker genes ranging in number from 20 to 29 per cultivar, in particular ‘Moyin 2’ which carries the highest number of superior gene markers. These cultivars could be used as backbone parents used in wheat breeding programs, contributing core genomic architecture. Other superior cultivars for single traits could be used to improve the backbone parents that showed single defects, such as disease susceptibility and stress sensitivity.
To identify new loci controlling agronomic traits, genetic structure and GWASs were analyzed in 115 spring wheat cultivars, using SNP genotyping based on liquid 100K chip technology. The wheat accessions were classified into five subgroups, which corresponded well with their pedigree relationships. Fifty-five accessions with more than 21 superior marker genes were grouped into clusters I, IV, and V. A mixed linear model was employed to conduct a GWAS for the nine important yield and grain quality traits. A total of 11, 45, 9, 8, 1, 54, 53, 16, and 19 SNPs were significantly associated with plant height, spike length, Number of grains per spike, Number of spikelets, thousand-grain weight, grain length, grain width, grain protein content, and grain weight per spike, respectively. These loci explained phenotypic variances ranging from 14.31% to 29%. Of these loci, 73.3% were located on chromosome 6D, indicating that multiple regions on chromosome 6D may play a crucial role in regulating spike length. More SNPs related to grain protein content were located on chromosome 3B, a finding similar to previous results [29], and the highest phenotypic variance was explained by chromosome 5D, reaching 23.35% for SNP 5D_464500683. From the 199 potential candidate genes underlying 218 significant loci, we focused on 20 genes that were associated with SNPs located within the gene, namely 18 for spike traits (e.g., SL, SPS, GL, GW), one for PH, and one for PC. These genes were of unknown function, according to BLAST on plant genomic data, although some genes could be candidate genes for particular traits because biological functions of some of these gene families had been verified in other crops, such as Fox protein [30], E3 ubiquitin ligase [19], and GTP-binding protein [20]. Further fine-mapping and validation research needs to be conducted to provide key reference material for targeting the breeding of wheat for high-altitude regions in China.

5. Conclusions

This study detected 55 cultivars carrying superior functional markers related to yield, grain quality, disease resistance, and stress tolerance, and nine backbone parents containing multiple functional markers from the 115 spring wheat cultivars. A total of 218 genetic loci were shown to be closely associated with nine agronomic traits, using liquid 100K chip technology. Twenty-one new candidate genes related to seven traits were identified and could be listed as priority loci for fine mapping. This research will facilitate parent selection and provide a theoretical reference for targeting the improvement and fine-mapping of new genetic loci in spring wheats from a high-altitude region.

Supplementary Materials

The following supporting information can be downloaded at the website of this paper posted on Preprints.org. Figure S1: Normal distribution plot of agronomic traits; Figure S2: Correlation analysis of phenotypic traits; Figure S3: SNP locus analysis; Figure S4: Cultivars with superior marker genes aggregating above 21 per cultivar; Table S1: Information on experimental materials; Table S2: Detection results of marker genes in 115 cultivars; Table S3: Aggregation of superior marker genes for the spring wheat cultivars; Table S4: The 218 loci significantly associated with yield and grain quality.

Author Contributions

Yanlin Yao , Baolong Liu , and Dong Cao designed and conducted this study. YanlinYao performed the data analysis and drafted the manuscript. Dong Cao, Baolong Liu, and Na Liu provided guidance and revisions to the article.Yunlong Liang participated in the annotation of genes in the results section, while Wenyan Ma and Yun Li contributed to the organization of the experimental results. All authors approved the manuscript for submission for publication.

Funding

This research was financially supported by the Alliance of National and International Science Organizations for the Belt and Road Regions (Grant No. ANSO-CR-KP-2022-05);for Grand Challenges (Grant No. 077GJHZ2023028GC).

Data Availability Statement

All data generated in this study are contained within the article.

Conflicts of Interest

The authors declare no conflicts of interest.

References

  1. Bayer PE, Petereit J, Durant É, Monat C, Rouard M, Hu H, Chapman B, Li C, Cheng S, Batley J, Edwards D. Wheat Panache: A pangenome graph database representing presence-absence variation across sixteen bread wheat genomes. Plant Genome. 2022, 15, e20221.
  2. Gao Y, An K, Guo W, Chen Y, Zhang R, Zhang X, Chang S, Rossi V, Jin F, Cao X, Xin M, Peng H, Hu Z, Guo W, Du J, Ni Z, Sun Q, Yao Y. The endosperm-specific transcription factor TaNAC019 regulates glutenin and starch accumulation and its elite allele improves wheat grain quality. Plant Cell. 2021,33(3),603-622.
  3. Wang H, Bernardo A, St Amand P, Bai G, Bowden RL, Guttieri MJ, Jordan KW. Skim exome capture genotyping in wheat. Plant Genome. 2023, 16(4), e20381.
  4. Guo Z, Yang Q, Huang F, Zheng H, Sang Z, Xu Y, Zhang C, Wu K, Tao J, Prasanna BM, Olsen MS, Wang Y, Zhang J, Xu Y. Development of high-resolution multiple-SNP arrays for genetic analyses and molecular breeding through genotyping by target sequencing and liquid chip. Plant Commun. 2021,2(6),100230.
  5. Guo, Z.; Wang, H.; Tao, J.; Ren, Y.; Xu, C.; Wu, K.; Zou, C.; Zhang, J.; Xu, Y. Development of multiple SNP marker panels affordable to breeders through genotyping by target sequencing (GBTS) in maize. Mol. Breed. 2019, 39, 37 [Google Scholar] [CrossRef]. [Google Scholar] [CrossRef]
  6. Fuqiang N, Zihan L,Zhang FengtingYuan ShaohuaBai JianfangLiu YongjieLi YanmeiZhang HengZhang HuishuZhao ChangpingSong XiyueZhang Liping.Identification and validation of major-effect quantitative trait locus QMS-5B associated with male sterility in photo-thermo-sensitive genic male sterile wheat[J].Theoretical and Applied Genetics. 2023, 136(12).
  7. Mohamed IES, Kamal NM, Mustafa HM, Abdalla MGA, Elhashimi AMA, Gorafi YSA, Tahir ISA, Tsujimoto H, Tanaka H. Identification of Glu-D1 Alleles and Novel Marker-Trait Associations for Flour Quality and Grain Yield Traits under Heat-Stress Environments in Wheat Lines Derived from Diverse Accessions of Aegilops tauschii. Int J Mol Sci. 2022,23(19),12034.
  8. Negisho K, Shibru S, Pillen K, Ordon F, Wehner G. Genetic diversity of Ethiopian durum wheat landraces. PLoS One. 2021, 16(2), e0247016.
  9. Yang Y, Chai Y, Zhang X, Lu S, Zhao Z, Wei D, Chen L, Hu Y G. Multi-locus GWAS of quality traits in bread wheat: mining more candidate genes and possible regulatory network. Front Plant Sci. 2020, 11, 1091.
  10. Yang H, Xiang S H, Liu L, Yang X, Shu Y J, He Q Y. Genome-wide association analysis of growth period traits in soybean of Sichuan and Chongqing. Acta Agron Sin. (in Chinese with English abstract). 2023, 49, 2727–2742.
  11. Huang X H, Zhao Y, Wei X H, Li C Y, Wang A H, Zhao Q, Li W J, Guo Y L, Deng L W, Zhu C R, Fan D L, Lu Y Q, Weng Q J, Liu K Y, Zhou T Y, Jing Y F, Si L Z, Dong G J, Huang T, Lu T T, Feng Q, Qian Q, Li J Y, Han B. Genome-wide association study of flowering time and grain yield traits in a worldwide collection of rice germplasm. Nat Genet. 2012, 44, 32–39.
  12. Chen J H, Zhang F Y, Zhao C J, Lv G G, Sun C W, Pan Y B, Guo X Y, Chen F. Genome-wide association study of six quality traits reveals the association of the TaRPP13L1 gene with flour colour in Chinese bread wheat. Plant Biotechnol J. (in Chinese with English abstract). 2019, 17, 2106–2122.
  13. Gao L, Meng C S, Yi T F, Xu K, Cao H W, Zhang S H, Yang X J, Zhao Y. Genome-wide association study reveals the genetic basis of yield- and quality-related traits in wheat. BMC Plant Biol. 2021, 21, 1–11.
  14. Kumar A, Mantovani E E, Simsek S, Jain S L, Elias E M, Mergoum M. Genome-wide genetic dissection of wheat quality and yield related traits and their relationship with grain shape and size traits in an elite × non-adapted bread wheat cross. PLoS One. 2019, 14, e0221826.
  15. Lou H Y, Zhang R Q, Liu Y T, Guo D D, Zhai S S, Chen A Y, Zhang Y F, Xie C J, You M S, Peng H R, Liang R Q, Ni Z F, Sun Q X, Li B Y. Genome-wide association study of six quality-related traits in common wheat (Triticum aestivum L.) under two sowing conditions. Theor Appl Genet. 2021, 134, 399–418.
  16. Ageeva EV, Leonova IN, Likhenko IE. Пoлегание пшеницы: генетические и экoлoгические фактoры и спoсoбы преoдoления [Lodging in wheat: genetic and environmental factors and ways of overcoming]. Vavilovskii Zhurnal Genet Selektsii. 2020,24(4),356-362.
  17. Yu J M, Pressoir G, Briggs W H, Bi I V, Yamasaki M, Doebley J F, McMullen M D, Gaut B S, Nielsen D M, Holland J B, Kresovich S, Buckler E S. A unified mixed-model method for association mapping that accounts for multiple levels of relatedness. Nat Genet. 2006, 38, 203–208.
  18. Zhu Y L, Wang S X, Zhao L X, Zhang D X, Hu J B, Cao X L, Yang Y J, Chang C, Ma C X, Zhang H P. Exploring molecular markers of preharvest sprouting resistance gene using wheat intact spikes by association analysis. Acta Agron Sin, 2014, 40, 1725–1732, (in Chinese with English abstract).
  19. Sun X, Xie Y, Xu K, et al. Regulatory networks of the F-box protein FBX206 and OVATE family proteins modulate brassinosteroid biosynthesis to regulate grain size and yield in rice[J]. Journal of Experimental Botany. 2024, 75(3),789-801.
  20. Sano H, Youssefian S. A novel ras-related rgp1 gene encoding a GTP-binding protein has reduced expression in 5-azacytidine-induced dwarf rice[J]. Molecular and General Genetics MGG. 1991, 228, 227–232.
  21. Saini DK, Chopra Y, Singh J, Sandhu KS, Kumar A, Bazzer S, Srivastava P. Comprehensive evaluation of mapping complex traits in wheat using genome-wide association studies. Mol Breed. 2021,42(1),1.
  22. Jingwei Zhou, Bowei Ye, Pengfei Zhang, Yuqing Zhang, Min Hao, Yuruo, Chan Yuan, Zhikang Li, Shunda Li, Xianchun He, Zhonghu He, Hongjun Zhang, Caixia Lan. Identification and evaluation of stripe rust resistance in 153 wheat germplasm from domestic and international sources [J]. Scientia Agricultura Sinica. 2024, 57(01),18-33.(in Chinese with English abstract).
  23. Marchal C, Zhang J, Zhang P, Fenwick P, Steuernagel B, Adamski NM, Boyd L, McIntosh R, Wulff BBH, Berry S, Lagudah E, Uauy C. BED-domain-containing immune receptors confer diverse resistance spectra to yellow rust. Nat Plants. 2018, 4(9),662-668.
  24. Shao M, Bai G, Rife TW, Poland J, Lin M, Liu S, Chen H, Kumssa T, Fritz A, Trick H, Li Y, Zhang G. QTL mapping of pre-harvest sprouting resistance in a white wheat cultivar Danby. Theor Appl Genet. 2018,131(8),1683-1697.
  25. Brinton J, Uauy C. A reductionist approach to dissecting grain weight and yield in wheat. J Integr Plant Biol. 2019, 61(3), 337–358.
  26. Kong X, Wang F, Wang Z, Gao X, Geng S, Deng Z, Zhang S, Fu M, Cui D, Liu S, Che Y, Liao R, Yin L, Zhou P, Wang K, Ye X, Liu D, Fu X, Mao L, Li A. Grain yield improvement by genome editing of TaARF12 that decoupled peduncle and rachis development trajectories via differential regulation of gibberellin signalling in wheat. Plant Biotechnol J. 2023, 21(10), 1990–2001.
  27. Morris, CF. Determinants of wheat noodle color. J Sci Food Agric. 2018, 98(14), 5171–5180. [Google Scholar] [CrossRef] [PubMed]
  28. LaDuca H, Farwell KD, Vuong H, Lu HM, Mu W, Shahmirzadi L, Tang S, Chen J, Bhide S, Chao EC. Exome sequencing covers >98% of mutations identified on targeted next-generation sequencing panels. PLoS One. 2017,12(2),e0170843.
  29. Jin X, Feng B, Xu Z, Fan X, Liu J, Liu Q, Zhu P, Wang T. TaAAP6-3B, a regulator of grain protein content selected during wheat improvement. BMC Plant Biol. 2018,18(1),71.
  30. Lv Q, Li L, Meng Y, Sun H, Chen L, Wang B, Li X. Wheat E3 ubiquitin ligase TaGW2-6A degrades TaAGPS to affect seed size. Plant Sci. 2022, 320, 111274.
Figure 1. Superior gene markers. a: Superior marker genes related to yield and grain quality. b: Superior marker genes related to disease resistance.
Preprints 139284 g001
Figure 2. Genetic diversity of the 115 wheat accessions. a: ∆K values plotted from 1 to 10. b: The structure of the 115 accessions based on Structure software when K = 5. c:Neighbor-joining (NJ) phylogenetic tree of the 115 accessions based on genetic distances. d: LD decay distance.
Preprints 139284 g002
Figure 3. Manhattan plot and Q-Q plot of yield- and quality-related traits. The dashed line at a vertical coordinate of 4 in the left-hand Manhattan plot represents the threshold (−log10(P) = 4). Values exceeding 4 indicate the presence of significantly associated loci.. a, c, e, g, i, l, n, p, and r are the Manhattan plots of plant height, spike length, number of grains per spike, number of spikelets per spike, grain length, grain width, thousand-grain weight, grain weight, and protein content, respectively; b, d, f, h, j, m, o, q, and s are the Q-Q plots of plant height, spike length, number of grains per spike, number of spikelets per spike, grain length, grain width, thousand-grain weight, grain weight, and protein content, respectively.
Preprints 139284 g003
Table 1. Phenotypic data analysis and heritability of yield and grain quality traits.
Trait Year Range Mean±SD Variance Skewness Kurtosis CV
Plant height (cm) 2023 52.00-133.00 88.01±12.25 188.02 0.44 0.49 0.15
2024 53.00–135.00 87.81±13.75 189.06 0.49 0.51 0.16
Spike length (cm) 2023 5.80–17.36 9.78±2.11 5.67 0.58 0.41 0.20
2024 5.80–18.00 9.81±2.44 5.96 0.62 0.46 0.25
Number of grains per spike 2023 26.00–97.00 54.86±14.60 218.79 0.36 −0.09 0.21
2024 27.00–96.00 55.54±15.20 231.16 0.47 −0.14 0.27
Number of spikelets/spike 2023 9.87.–22.65 14.68±2.12 8.01 0.48 0.31 0.12
2024 10.00–24.00 15.70±2.68 7.18 0.60 0.40 0.17
Grain length (mm) 2023 4.98–7.96 5.99±0.79 0.18 0.01 –0.19 0.04
2024 5.31–7.74 6.47±0.49 0.24 0.08 –0.27 0.08
Grain width (mm) 2023 2.83–4.17 3.06±0.27 0.01 0.68 3.06 0.03
2024 2.91–4.59 3.48±0.24 0.06 0.75 3.85 0.07
Thousand-grain weight (g) 2023 28.15–62.89 49.56±5.79 47.88 0.19 –0.03 0.12
2024 28.79–63.21 45.07±6.99 48.94 0.21 –0.08 0.16
Protein content (%) 2023 10.58–15.23 12.12±1.01 1.61 0.63 –0.04 0.09
2024 11.49–16.73 13.42±1.31 1.71 0.78 –0.07 0.10
Grain weight/spike (g) 2023 0.93–4.96 2.18±0.66 0.49 0.52 –0.09 0.29
2024 0.95–5.06 2.53±0.87 0.76 0.60 –0.19 0.35
SD: standard deviation; CV: coefficient of variation (SD/mean).
Disclaimer/Publisher’s Note: The statements, opinions and data contained in all publications are solely those of the individual author(s) and contributor(s) and not of MDPI and/or the editor(s). MDPI and/or the editor(s) disclaim responsibility for any injury to people or property resulting from any ideas, methods, instructions or products referred to in the content.
Copyright: This open access article is published under a Creative Commons CC BY 4.0 license, which permit the free download, distribution, and reuse, provided that the author and preprint are cited in any reuse.
Prerpints.org logo

Preprints.org is a free preprint server supported by MDPI in Basel, Switzerland.

Subscribe

Disclaimer

Terms of Use

Privacy Policy

Privacy Settings

© 2025 MDPI (Basel, Switzerland) unless otherwise stated