
Submitted:
12 November 2024
Posted:
13 November 2024
You are already at the latest version
Abstract
In this work we introduce a modification of the Relative Entropy method in order to perform geographically explicit quantification of the rainy season across the Brazilian Northeast (NE). We apply this novel approach to data from the ERA5-land project for the period 1980 to 2022, with ~9 km spatial resolution, to obtain the strength of seasonality, duration of the rainy season (in months), and center of the rainy season, throughout the NE, on both the ERA5-Land grid and municipality level. Our results agree well with results of a number of other works for several municipalities and regions within the NE. We also provide user-friendly software with Graphical User Interface for ease of extraction of rainy season parameters (strength, duration and the center of the rainy season), together with the monthly precipitation series for any point, or municipality average.
Keywords:
rainy season
; Brazilian Northeast
; modified Relative Entropy method
1. Introduction
The rainy season in the Brazilian Northeast (NE) depends strongly on the geographic location. For instance, the NE capital Recife which is located in the coastal area of the state of Pernambuco, experiences excess rain from March to August [1], while the city of Serra Talhada only 400 km away in the interior of the state of Pernambuco (located in the semiarid area) experiences concentrated rain in the period from January to April [2]. Several studies report that six consecutive rainy months vary across NE: between January and June in the northern part, between March and August in the eastern coastal area, and between November and April in the southern part [3,4,5]. Based on rainfall data from 148 stations covering 1972 - 2002 period, Oliveira et al. [4], identified three rainiest months across NE: March, April and May in the northern part, June, July and August in the eastern coastal area, and December, January and February in the southern part.
Northeast Brazil is one of the regions most vulnerable to climate change, worldwide, with an area of and inhabitants. The welfare of its habitants highly depends on climate conditions that vary from recurrent and prolonged drought in the semiarid area where the rural population is primarily dependent on subsistence agriculture [6,7], to flash floods in coastal regions that can trigger massive landslides, which can cause numerous fatalities [8,9]. These extreme conditions are related to the interannual variability of large-scale oscillation systems, El Niño - Southern Oscillation (ENSO) in the equatorial Indo-Pacific Ocean, and the meridional sea surface temperature gradient (MGRAD) over the tropical Atlantic. During the positive phase of ENSO (El Niño) and negative phase of MGRAD, there is a decrease in rainfall over NE, while during the negative phase of ENSO (La Niña) and positive phase of MGRAD the rainfall in NE is above the average. In general, severe and prolonged droughts occur in El Niño years in which the direct impact of ENSO is amplified by pre-existing Atlantic sea surface temperature (SST) anomalies [10]. Intraannual variability is characterized by well defined seasonal patterns which are related to the seasonal displacement of the Atlantic intertropical convergence zone (ITCZ) [11,12]. The seasonal cycle of rainfall in NE affects energy production [13], carbon storage in tropical dry forest [14], agricultural productivity [15] and water quality [16]. Regions characterized by high rainfall seasonality tend to have a higher percentage of total annual precipitation concentrated during the short period of time, which leads to a higher probability of the occurrence of floods [17]. In order to mitigate water related hazards, that can compromise various economic sectors such as energy production and agriculture [18,19], infrastructure [20], and affect ecosystems [21] and human health [22], it is fundamental to enhance our understanding of the variability of rainfall anomalies at different temporal and spatial scales, especially in the regions with vulnerable population and higher frequency of severe drought. To this end, a systematic quantification of the rainy and dry seasons from historical data, at different geographic locations across the Brazilian NE, appears to be of utmost importance.
Currently, systematic, spatially explicit quantification of the rainy season duration and timing for the Brazilian Northeast, based on established statistical methods, is still lacking in the body of literature. Recent studies in this direction provide results based on monthly rainfall climatology, identifying six rainiest months and three months as a peak of rainy season. The results depend on the dataset used and the period considered. Rao et al. [3] studied rainfall regime in Brazil, using Climate Research Center (CPC) gauge based global daily precipitation with a horizontal resolution of 0.50 latitude/longitude and time span from 1979 to 2011. For the NE they found that the three rainiest months were FMA in the northern part, JFM in the central part, NDJ in the southern part and MJJ in the eastern coastal part. Using station data for approximately the same period, Oliveira et al. [4] found peak of the rainy season to be shifted forward one month: MAM in the northern part, DJF in the southern part and JJA in the eastern coastal part. Rainfall seasonality can be evaluated using specially designed indices, such as statistics-based precipitation seasonality index SI [23], that classify rainfall regime according to the degree of variability in monthly rainfall throughout the year. When calculated for the entire period and as average of individual years, SI provides the information of the replicability of rainfall regime at a certain location [24,25]. However, a complete description of rainfall seasonality requires the knowledge of the magnitude, duration and timing of the wet season. Feng et al. [26] introduced the Relative entropy (RE) method based on information theory, which provides a set of indicators for quantification of the magnitude, duration and timing of the wet season. This method was shown successful for regions with a well-defined wet and dry season and was used with both observational and model data [27,28].
The principal purpose of the current work is to introduce a modification of the Relative Entropy method in order to perform geographically explicit quantification of the rainy season across the Brazilian Northeast. The results of this study, in geographically explicit form, should be taken into account for agricultural planning, better planning of use of water resources for renewable energy, as well as to develop more efficient measures for the protection and mitigation of the impact from water related natural hazards (drought and floods).
2. Materials and Methods
2.1. Data
ERA5-Land is an advanced reanalysis dataset that provides high-resolution (about 9 km) land surface data over the global domain [29]. The high resolution of the dataset enhances the accuracy and detail of land surface representations, making it particularly valuable for localized studies. ERA5-Land provides a continuous record of land surface conditions from 1950 to the present with hourly time resolution. This extensive temporal coverage supports long-term studies, climate monitoring, and trend analysis. The dataset is freely accessible through the Copernicus Climate Data Store (CDS). The CDS portal provides user-friendly tools and services for data retrieval and analysis, ensuring that researchers and practitioners can easily integrate ERA5-Land data into their workflows.
In this work we used data from the ERA5-Land for the period 1980 to 2022, as this period matches most of the other works that we compare with. For each grid point at resolution of ~9km the data are integrated into monthly precipitation series, with the goal of quantifying the timing and duration of the rainy season from historical data, in a geographically explicit manner.
2.2. Relative Entropy
Relative Entropy method was introduced [26,27] to quantify the length and timing of the rainy season in the regions with a single pronounced rainy epoch, across the globe. For a given discrete probability distribution information entropy (measure of uncertainty) is defined as
attaining a maximum of for the uniform distribution (maximum uncertainty), and a minimum of zero when only one of the values is unity, all the others being zero (no uncertainty). For two distributions and the relative entropy
measures the inefficiency of assuming when the true distribution is .
For the particular case of monthly rain distribution , assuming uniform distribution leads to relative entropy
Relative entropy quantifies strength of seasonality and varies between 0 for a uniform rain distribution across the year, to when all the rain occurs in a single month.
The effective number of months of the rainy season duration is found as [27]
and the centroid of the rainy season is found as [27]
The quantities (strength of seasonality), (duration of the rainy season, in months), and (center of the rainy season), represent the principal foci of interest of the current work.
2.2. Modification of the Relative Entropy Method
To test the applicability of the Relative Entropy method for the Brazilian Northeast, a test was performed on precipitation data for Recife (Caxanga station) in the period 1911-1970 and Serra Talhada in the period 1911-1991, collected by the Superintendência de Desenvolvimento do Nordeste (SUDENE) and provided by APAC [30,31]. The original Relative Entropy definition yields values of n~9.62 and n~8.45 for Recife and Serra Talhada, respectively, in agreement with findings of Ref. [27], but in disaccord with the commonly accepted values of n=6 and n=4 months of the rainy season in the two regions [1,2]. The thresholding adopted in [26,27] between the rainy season and the dry season may be adequate for some parts of the world, but here it appears too stringent, and the duration of the rainy season is by far overestimated.
To mitigate this discrepancy between the results of the RE method and the “common sense” adopted by the scientific community (and community in general) for the Brazilian Northeast, rather than adopting for the probability the ratio of precipitation in month with total yearly precipitation as in [26,27], here we address the excess precipitation – the probability of precipitation above the mean, in any given month
To this end, first the z-score is calculated for each month , where is the average and is the monthly precipitation standard deviation along the years of the period under study, and then the months with precipitation below the average are discarded, to find the set of months with precipitation above the average, and finally the excess precipitation probability is defined as
The precipitation histograms for Recife and Serra Talhada, for SUDENE data, are shown in Figure 1,
while the excess rain probability distributions as defined in (6) for the two sites are shown in Figure 2.
Using the definition of excess precipitation probability (6) in equations (3-5) leads to values of and n~3.59 for Recife ad Serra Talhada, centered about June and March, respectively, in agreement with (albeit slightly underestimating) the widely accepted observational (phenomenological) conclusions.
The objective of this work is to implement this modification of the Relative Entropy method over the vortices across the Brazilian Northeast, and thus establish geographically explicit areas of rainfall season duration and timing on purely phenomenological grounds, without assuming any functional form for precipitation probability distributions, therefore free of any parametrization.
3. Results
The mean monthly precipitation data from the ERA5-Land project across the Brazilian NE, for the period 1980 to 2023 is shown in Figure 3, the results being quite compatible with the interpolated station precipitation data for the period 1904-1998 [13].
The mean yearly precipitation is shown in Figure 4, where the orange/yellow region corresponds to the so called “Poligono das Secas” (the Drought Polygon).
The main results of this work are presented in Figure 5, where the Strength of seasonality , duration of the rainy season in months , and the center of the rainy season are displayed across the Brazilian NE. The spatial distribution of coincides with the rainiest months as found in ref. [3,4] where different datasets were used. Rao et al. [3] found that the three rainiest months were FMA in the northern part, JFM in the central part, NDJ in the southern part and MJJ in the eastern coastal part, while Oliveira et al. [4] found a peak of rainy season in MAM in the northern part, DJF in the southern part and JJA in the eastern coastal part.
The results for the capitals of the nine NE states Alagoas (AL), Bahia (BA), Ceará (CE), Maranhão (MA), Paraíba (PB), Pernambuco (PE), Piauí (PI), Rio Grande do Norte (RN) and Sergipe (SE) are presented in Table 1.
Hänsel at al. [32] investigated climate variability in the capitals of North-Eastern Brazil, based on temperature and precipitation data from nine meteorological stations recorded during the period 1961-2011. They found that the rainy season occurred in different periods in northern and the south-eastern stations. In the northern region, the wettest months are January to April in Teresina and January to June at São Luís and Fortaleza. The rainy season in other six stations span from March to July, with peak in April and May in Aracaju and Salvador, and from April to July at Natal, João Pessoa, Recife, and Maceió. The values of duration of the rainy season presented in Table 1 agree with these results. For Terezinha, Recife, Maceo, Aracaju and Salvador we obtained the same duration of rainy season, for Sao Luiz and Fortaleza one month shorter, and for Natal and João Pessoa one month longer. The values for the center of the rainy season in Natal, João Pessoa, Recife and Maceo agree with the period of highest rainfall in these cities found in [32]. On the other hand, the values of the duration of the rainy season calculated using the original RE method (shown in parentheses in the one before last column of Table 1) by far overestimate these findings.
3.2. Sofware
For ease of extraction of the rainy season parameters (strength, duration and the center of the rainy season), together with the monthly precipitation series for any point or municipality average, we also provide user-friendly software with Graphical User Interface for the Windows platform as presented in Figure 6, as part of supplementary material of this paper, together with an Excel file with mean season parameters for all the 1794 municipalities of the Brazilian NE.
The software displays a map of the Brazilian NE with state (dark gray) and municipality (medium gray) borders, together with (red) points corresponding to ERA5-Land grid vertex positions. Municipality Barra in the state of Bahia (BA) is outlined in blue in Figure 6, being the current choice, that may be changed through the combo box in the lower left part of the control dialog box, or by simply clicking the left mouse button with cursor positioned anywhere inside the municipality – the point of choice is displayed as a red circle. As the cursor is moved across the map, the current cursor position and the corresponding local rain season parameters are displayed in the top part of the dialog box. The middle part of the control dialog box also permits choice of a specific point, by specifying the latitude and longitude values. Finally, the “Extract” button generates an ASCII file (displayed immediately in Notepad), where the pointwise or municipality average values are listed (together with the monthly precipitation sequence), depending on the choice of the “Municipality” or “Point” radio buttons. If the “Point” option is chosen the values are calculated applying the Inverse Distance Squared method on up to four neighboring grid points (SW, SE, NW and NE), while points close to the NE border area may have less than four neighboring grid points, and the values are derived from these.
5. Conclusions
We analyzed rainfall seasonality in the Brazilian Northeast (NE), by using the Relative Entropy (RE) method. To better match the results of other works, and commonly accepted values for the length and the center of the rainy season in this region, we introduced the modification of the original RE method (MRE), which is based on the concept of excess precipitation – the probability of precipitation above the average. By applying the MRE approach on ERA5-Land high resolution gridded dataset (~9 km) for the period 1980–2022 we obtained spatial distribution of seasonal characteristics of rainfall (strength, duration and center of rainy season) across the NE. We found that the length of the rainy season lasts 4-5 months in the northern region, 5-6 months in the central and southern regions and 6-7 months in the eastern coastal region. The center of the rainy season ranges from February to March in the northern part, January to February in the central and southern parts and April to June in the eastern coastal part. The results for the NE capitals agree well with the results obtained by classical statistical methods, while the original RE method overestimated by far the length of the rainy season. We also developed a dedicated user-friendly software that permits to obtain the parameters of rainfall seasonality, together with the monthly precipitation series, for any point on the map, or any of the 1794 municipalities (by averaging over the corresponding grid cells). The results of this study showed that the modified RE method provides reliable information about rainfall seasonality in the Brazilian NE, and should be taken into account for agricultural planning, better planning of efficient use of water resources, and to develop more efficient measures for the protection and mitigation of the impact from extreme water related conditions (drought and floods).
Supplementary Materials
The following supporting information can be downloaded at the website of this paper posted on Preprints.org, Excel file: NE_Municipality_rainy_season.xlsx; Executable for Windows: RainySeasonNE.exe.
Author Contributions
Conceptualization, B.S. and V.D.; methodology, B.S. and T.S.; software, B.S.; validation, B.S., T.S. and A.S.A.S.; formal analysis, B.S., V.D., I.T., A.S.A.S. and T,S.; investigation, B.S., V.D., I.T., A.S.A.S. and T.S.;; data curation, B.S. and A.S.A.S..; writing—original draft preparation, B.S., V.D., I.T., A.S.A.S. and T.S..; writing—review and editing, B.S., V.D., I.T., A.S.A.S. and T.S..; visualization, B.S.; supervision, B.S.; project administration, B.S. and I.T. All authors have read and agreed to the published version of the manuscript.
Funding
This research received no external funding.
Data Availability Statement
The original data used in the study are openly available in the ERA5-Land dataset repository from the Copernicus Climate Data Store at https://cds.climate.copernicus.eu/datasets/reanalysis-era5-land.
Acknowledgments
B.S. and T.S. acknowledge support of Brazilian agency CNPq through the research grants 308782/2022-4 and 309499/2022-4. B.S. acknowledges support of Brazilian agency CAPES through grant 88887.937789/2024-00. I.T. and V. Dj. are grateful for the financial support of the Ministry of Science, Technological Development and Innovation of the Republic of Serbia (project 451-03-65/2024-03/200162).
Conflicts of Interest
The authors declare no conflicts of interest. The funders had no role in the design of the study; in the collection, analyses, or interpretation of data; in the writing of the manuscript; or in the decision to publish the results.
References
- Silva, E.C. Spatial variability of precipitation correlated with relief in Recife metropolitan region and surrounding areas. JHRS 2016, 6(5), 225–234. [Google Scholar] [CrossRef]
- Jardim, A.M.D.R.F.; de Queiroz, M.G.; Júnior, G.D.N.A.; da Silva, M.J.; da Silva, T.G.F. Estudos climáticos do número de dias de precipitação pluvial para o município de Serra Talhada-PE. Revista Engenharia na Agricultura 2019, 27(4), 330–337. [Google Scholar] [CrossRef]
- Rao, V.B.; Franchito, S.H.; Santo, C.M.; Gan, M.A. An update on the rainfall characteristics of Brazil: seasonal variations and trends in 1979-2011. Int. J. Climatol. 2016, 36. [Google Scholar] [CrossRef]
- Oliveira, P.D.; Santos e Silva, C.M.; Lima, K.C. Climatology and trend analysis of extreme precipitation in subregions of Northeast Brazil. Theor. Appl. Climatol. 2017, 130, 77–90. [Google Scholar] [CrossRef]
- Costa, R.L.; de Mello Baptista, G.M.; Gomes, H.B.; dos Santos Silva, F.D.; da Rocha Júnior, R.L.; de Araújo Salvador, M.; Herdies, D.L. Analysis of climate extremes indices over northeast Brazil from 1961 to 2014. Weather Clim. Extrem. 2020, 28, 100254. [Google Scholar] [CrossRef]
- Marengo, J.A.; Torres, R.R.; Alves, L.M. Drought in Northeast Brazil—past, present, and future. Theor. Appl. Climatol. 2017, 129, 1189–1200. [Google Scholar] [CrossRef]
- Marengo, J.A.; Galdos, M.V.; Challinor, A.; Cunha, A.P.; Marin, F.R.; Vianna, M.D.S.; Bender, F. Drought in Northeast Brazil: A review of agricultural and policy adaptation options for food security. Clim. Resil. Sustain. 2022, 1(1), e17. [Google Scholar] [CrossRef]
- Espinoza, N.S.; dos Santos, C.A.; Silva, M.T.; Gomes, H.B.; Ferreira, R.R.; da Silva, M.L.; Mishra, M. Landslides triggered by the May 2017 extreme rainfall event in the east coast northeast of Brazil. Atmosphere 2021, 12(10), 1261. [Google Scholar] [CrossRef]
- Marengo, J.A.; Alcantara, E.; Cunha, A.P.; Seluchi, M.; Nobre, C.A.; Dolif, G.; Moraes, O.L. Flash floods and landslides in the city of Recife, Northeast Brazil after heavy rain on May 25–28, 2022: Causes, impacts, and disaster preparedness. Weather Clim. Extrem. 2023, 39, 100545. [Google Scholar] [CrossRef]
- Robertson, A.W.; Kirshner, S.; Smyth, P. Downscaling of daily rainfall occurrence over northeast Brazil using a hidden Markov model. J. Climate 2004, 17(22), 4407–4424. [Google Scholar] [CrossRef]
- Hastenrath, S. Exploring the climate problems of Brazil’s Nordeste: a review. Climat. Change 2012, 112(2), 243–251. [Google Scholar] [CrossRef]
- Utida, G.; Cruz, F.W.; Etourneau, J.; Bouloubassi, I.; Schefuß, E.; Vuille, M.; Turcq, B. Tropical South Atlantic influence on Northeastern Brazil precipitation and ITCZ displacement during the past 2300 years. Sci. Rep. 2019, 9(1), 1698. [Google Scholar] [CrossRef] [PubMed]
- Luiz-Silva, W.; Maceira, M.E.P.; Rotunno Filho, O.C.; Chou, S.C. On the Observations and Environmental Modeling in Xingo Hydropower Plant-Northeast Brazil: Present and Future Hydroclimatic Features. Environ. Model. & Assess 2022, 27(1), 13–28. [Google Scholar] [CrossRef]
- Rohr, T.; Manzoni, S.; Feng, X.; Menezes, R.S.; Porporato, A. Effect of rainfall seasonality on carbon storage in tropical dry ecosystems. J. Geophys. Res.-Biogeo. 2013, 118(3), 1156–1167. [Google Scholar] [CrossRef]
- Vale, T.M.C.D.; Spyrides, M.H.C.; Cabral Júnior, J.B.; Andrade, L.D.M.B.; Bezerra, B.G.; Rodrigues, D.T.; Mutti, P.R. Climate and water balance influence on agricultural productivity over the Northeast Brazil. Theor. Appl. Climatol. 2024, 155(2), 879–900. [Google Scholar] [CrossRef]
- Dias, A.P.; Calegar, D.; Carvalho-Costa, F.A.; Alencar, M.D.F.L.; Ignacio, C.F.; Silva, M.E.C.D.; Moraes Neto, A.H.A.D. Assessing the influence of water management and rainfall seasonality on water quality and intestinal parasitism in rural northeastern Brazil. J. Trop. Med. 2018, 2018(1), 8159354. [Google Scholar] [CrossRef]
- Rodrigues, D.T.; Gonçalves, W.A.; Spyrides, M.H.C.; Andrade, L.D.M.B.; de Souza, D.O.; de Araujo, P.A.A.; e Silva, C.M.S. Probability of occurrence of extreme precipitation events and natural disasters in the city of Natal, Brazil. Urban Clim. 2021, 35, 100753. [Google Scholar] [CrossRef]
- Jääskeläinen, J.; Veijalainen, N.; Syri, S.; Marttunen, M.; Zakeri, B. Energy security impacts of a severe drought on the future Finnish energy system. J. Environ. Manag. 2018, 217, 542–554. [Google Scholar] [CrossRef]
- Meza, I.; Siebert, S.; Döll, P.; Kusche, J.; Herbert, C.; Eyshi Rezaei, E.; Hagenlocher, M. Global-scale drought risk assessment for agricultural systems. Nat. Hazards Earth Sys 2020, 20((2), 695–712. [Google Scholar] [CrossRef]
- Hu, X.; Hall, J.W.; Shi, P.; Lim, W.H. The spatial exposure of the Chinese infrastructure system to flooding and drought hazards. Nat. Hazards 2016, 80(2), 1083–1118. [Google Scholar] [CrossRef]
- Marengo, J.A.; Cunha, A.P.; Cuartas, L.A.; Deusdará Leal, K.R.; Broedel, E.; Seluchi, M.E.; Bender, F. Extreme drought in the Brazilian Pantanal in 2019–2020: characterization, causes, and impacts. Front. Water 2021, 3, 639204. [Google Scholar] [CrossRef]
- Ebi, K.L.; Vanos, J.; Baldwin, J.W.; Bell, J.E.; Hondula, D.M.; Errett, N.A.; Berry, P. Extreme weather and climate change: population health and health system implications. Annu. Rev. Public Health 2021, 42, 293. [Google Scholar] [CrossRef] [PubMed]
- Walsh, R.P.D.; Lawler, D.M. Rainfall seasonality: description, spatial patterns and change through time. Weather 1981, 36(7), 201–208. [Google Scholar] [CrossRef]
- Livada, I.; Asimakopoulos, D.N. Individual seasonality index of rainfall regimes in Greece. Clim. Res 2005, 28(2), 155–161. [Google Scholar] [CrossRef]
- Stosic, T.; Tošić, M.; Lazić, I.; da Silva Araújo, L.; da Silva, A.S.A.; Putniković, S.; Stosic, B. Changes in Rainfall Seasonality in Serbia from 1961 to 2020. Theor. Appl. Climatol. 2024, 155(5), 4123–4138. [Google Scholar] [CrossRef]
- Feng, X.; Porporato, A.; Rodriguez-Iturbe, I. Changes in rainfall seasonality in the tropics. Nat. Clim. Change 2013, 3(9), 811–815. [Google Scholar] [CrossRef]
- Pascale, S.; Lucarini, V.; Feng, X.; Porporato, A.; Hasson, S.U. Analysis of rainfall seasonality from observations and climate models. Clim. Dyn. 2015, 44, 3281–3301. [Google Scholar] [CrossRef]
- Mao, Y.; Wu, G.; Xu, G.; Wang, K. Reduction in precipitation seasonality in China from 1960 to 2018. J. Climate 2022, 35(1), 227–248. [Google Scholar] [CrossRef]
- Muñoz-Sabater, J.; Dutra, E.; Agustí-Panareda, A.; Albergel, C.; Arduini, G.; Balsamo, G.; … Thépaut, J.-N. ERA5-Land: a state-of-the-art global reanalysis dataset for land applications. Earth Syst. Sci. Data 2021, 13, 4349–4383. [Google Scholar] [CrossRef]
- Barbosa, N.F.; Stosic, B.D.; Stosic, T.; Lopes, P.M.; Moura, G.B.D.A.; Melo, J.S. Kernel smoothing dos dados de chuva no Nordeste. Rev. Bras. Eng. Agric. Ambient. 2014, 18, 742–747. [Google Scholar] [CrossRef]
- APAC - Agência Pernambucana de Águas e Climas. Available online: http://www.apac.pe.gov.br (accessed on 16 October 2024).
- Hänsel, S.; Medeiros, D.M.; Matschullat, J.; Petta, R.A.; de Mendonça Silva, I. Assessing homogeneity and climate variability of temperature and precipitation series in the capitals of North-Eastern Brazil. Front. Earth Sci. 2016, 4, 29. [Google Scholar] [CrossRef]
Figure 1.
Mean precipitation series for Recife for 1911-1970 (a) and Serra Talhada for 1911-1991 (b) from station data [30,31].
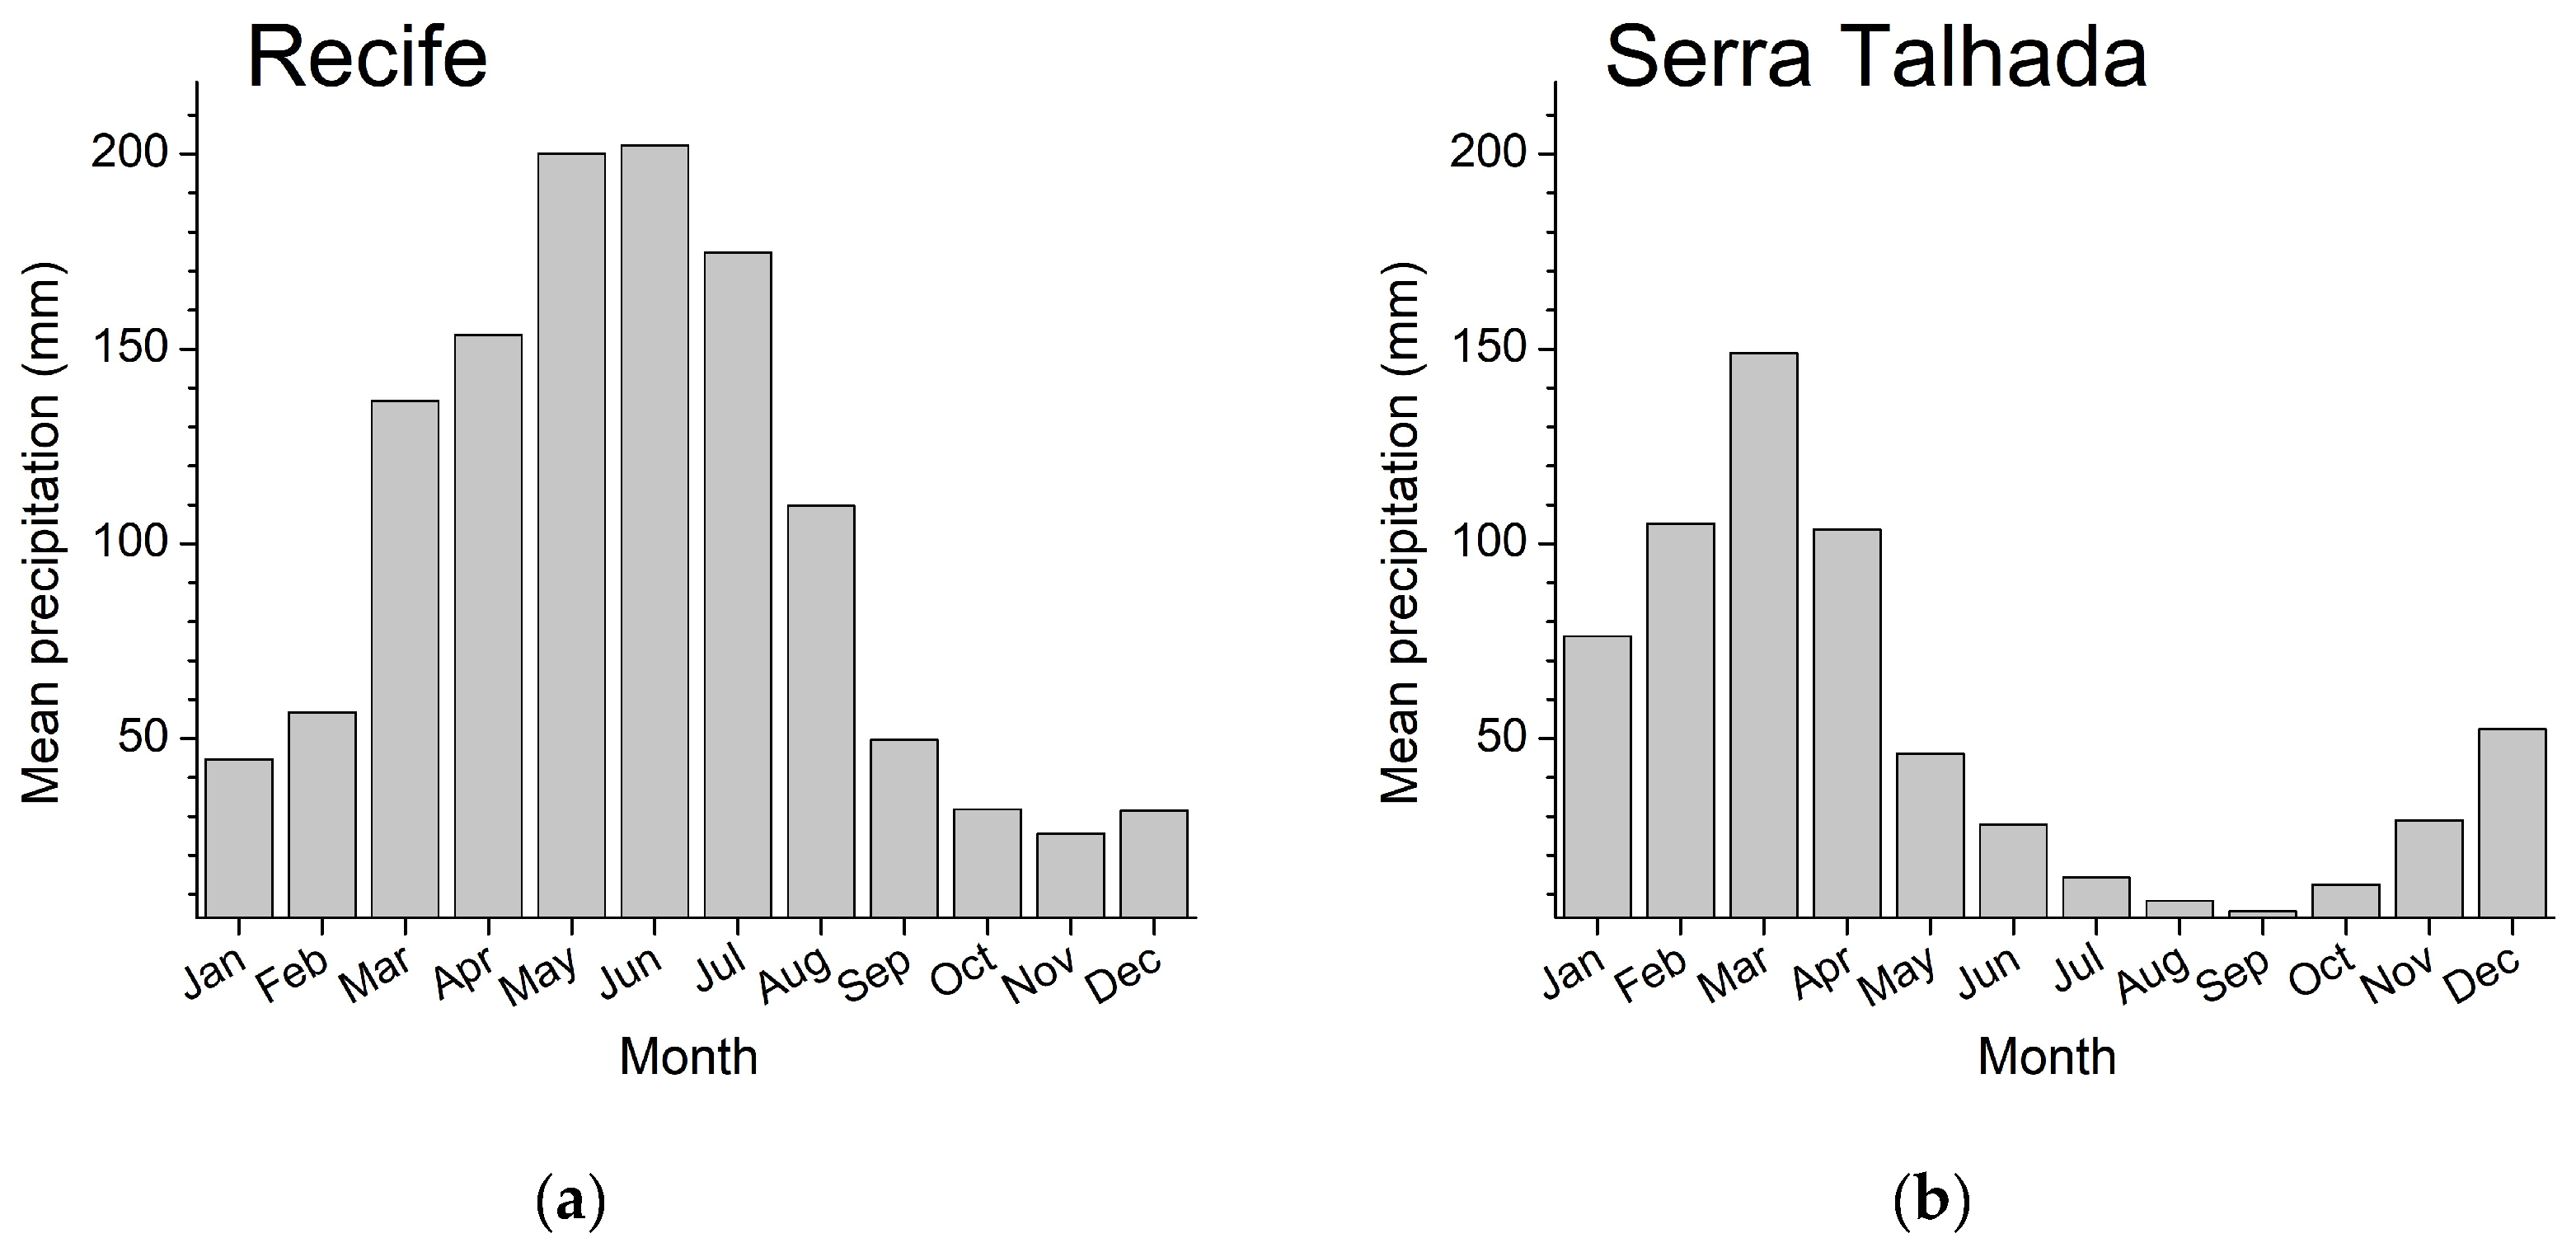
Figure 2.
Excess precipitation probability for Recife (a) and Serra Talhada (b).
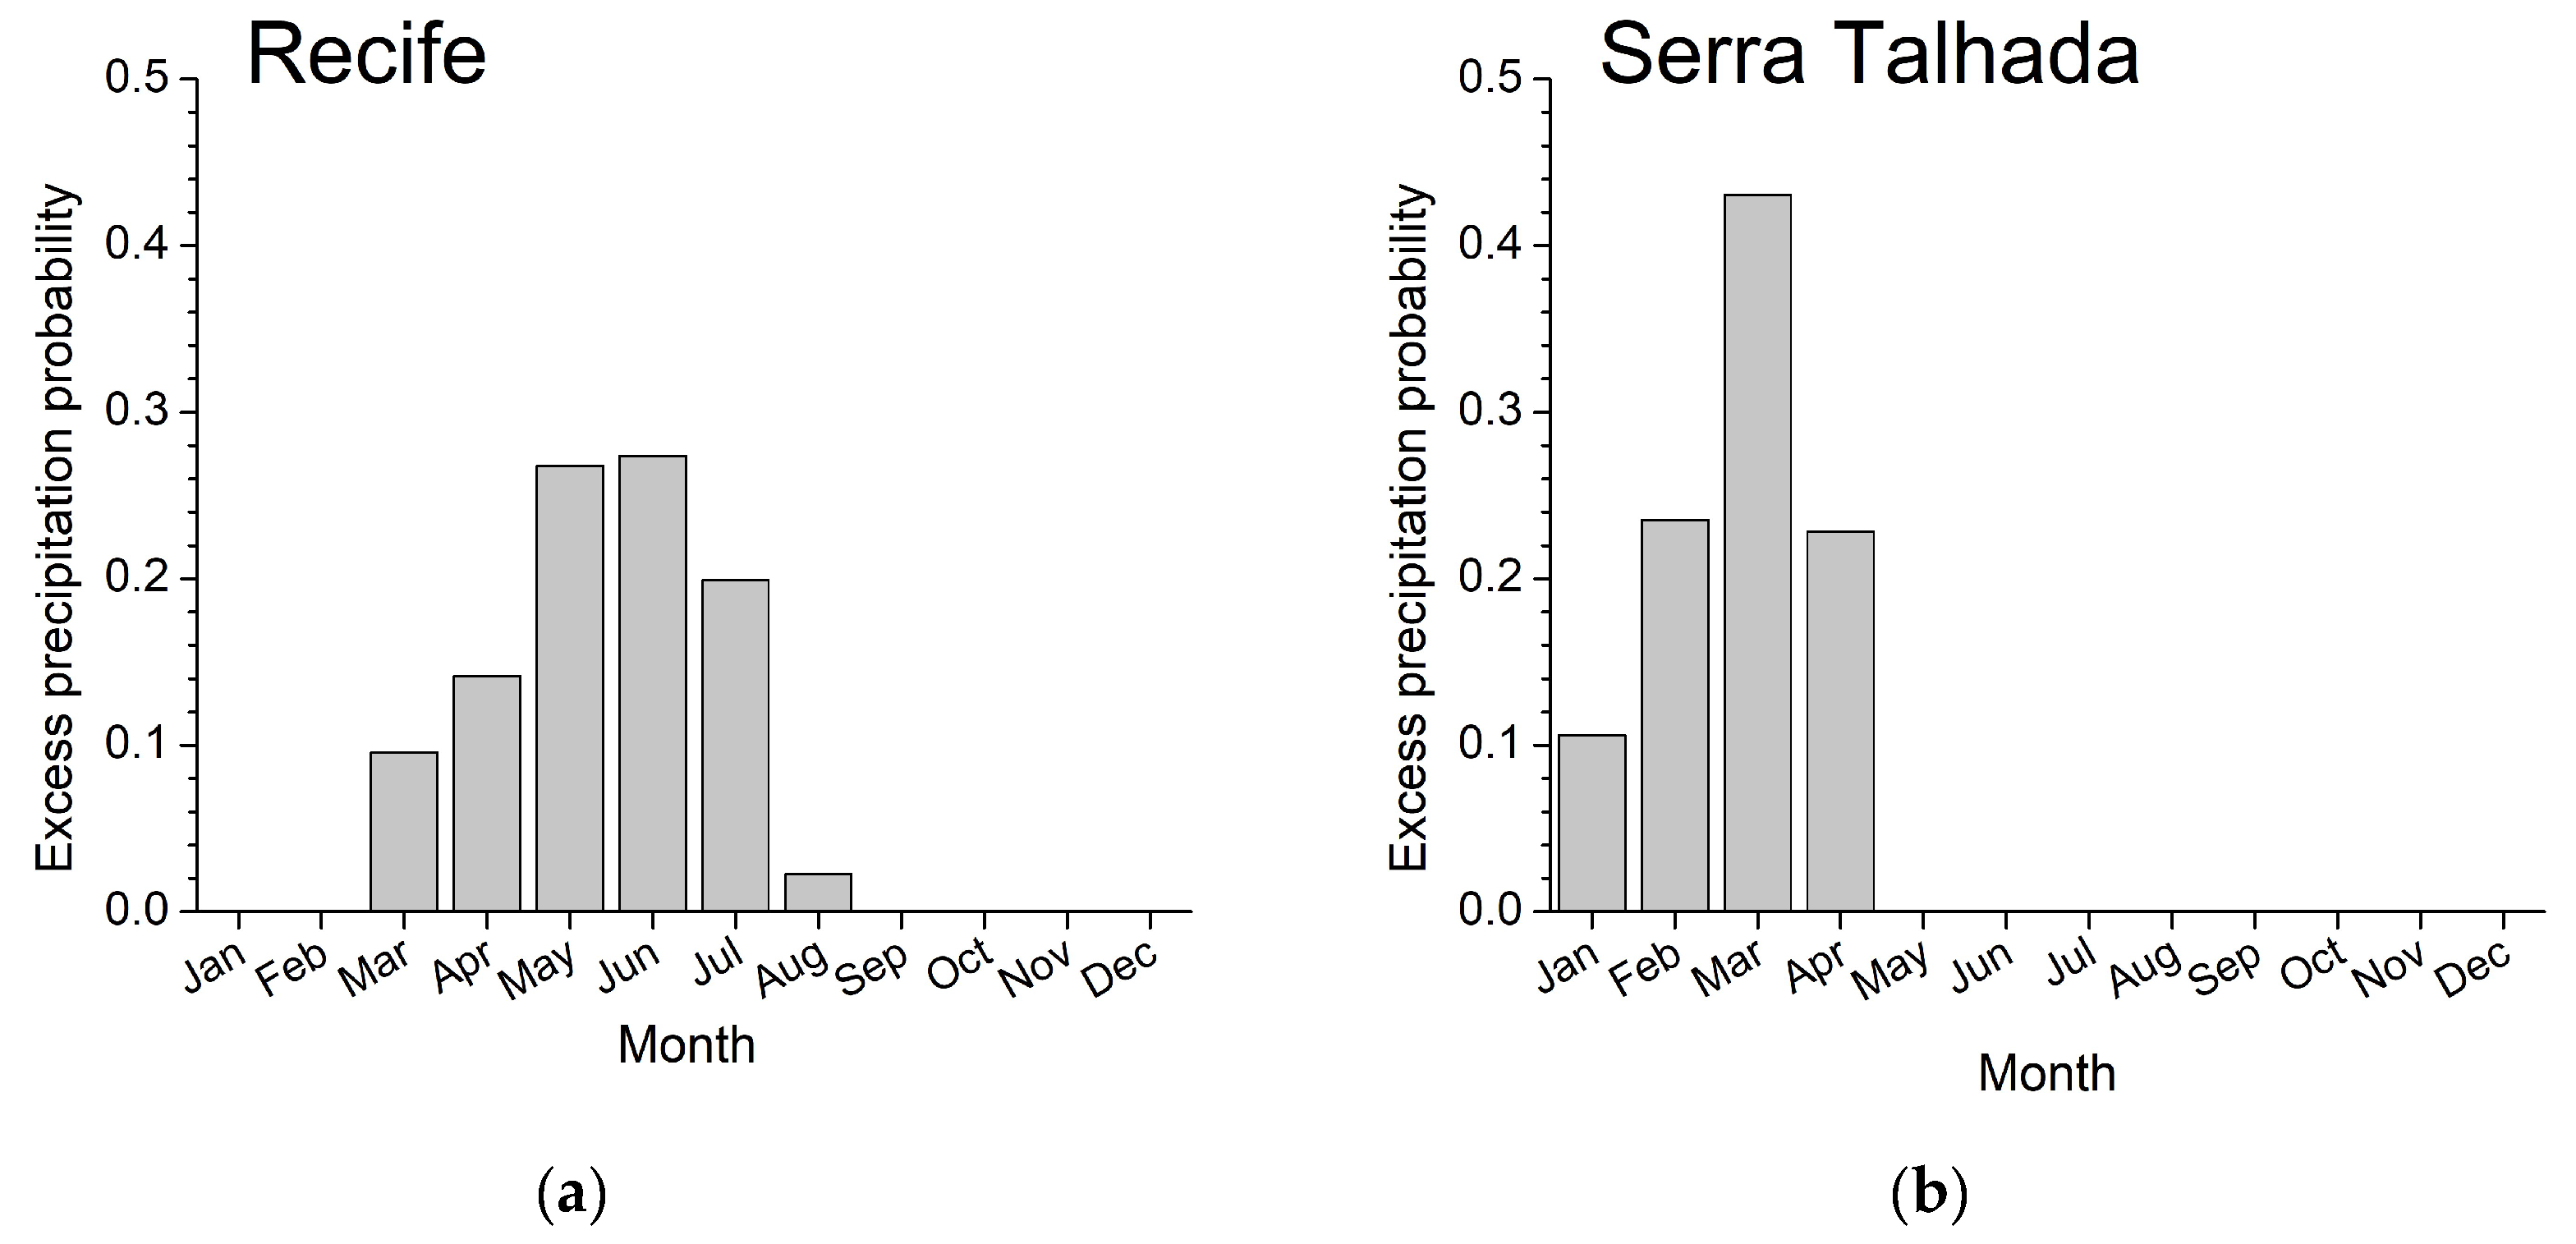
Figure 3.
Mean monthly precipitation in mm/month for the Brazilian NE, in the period 1950 to 2023.
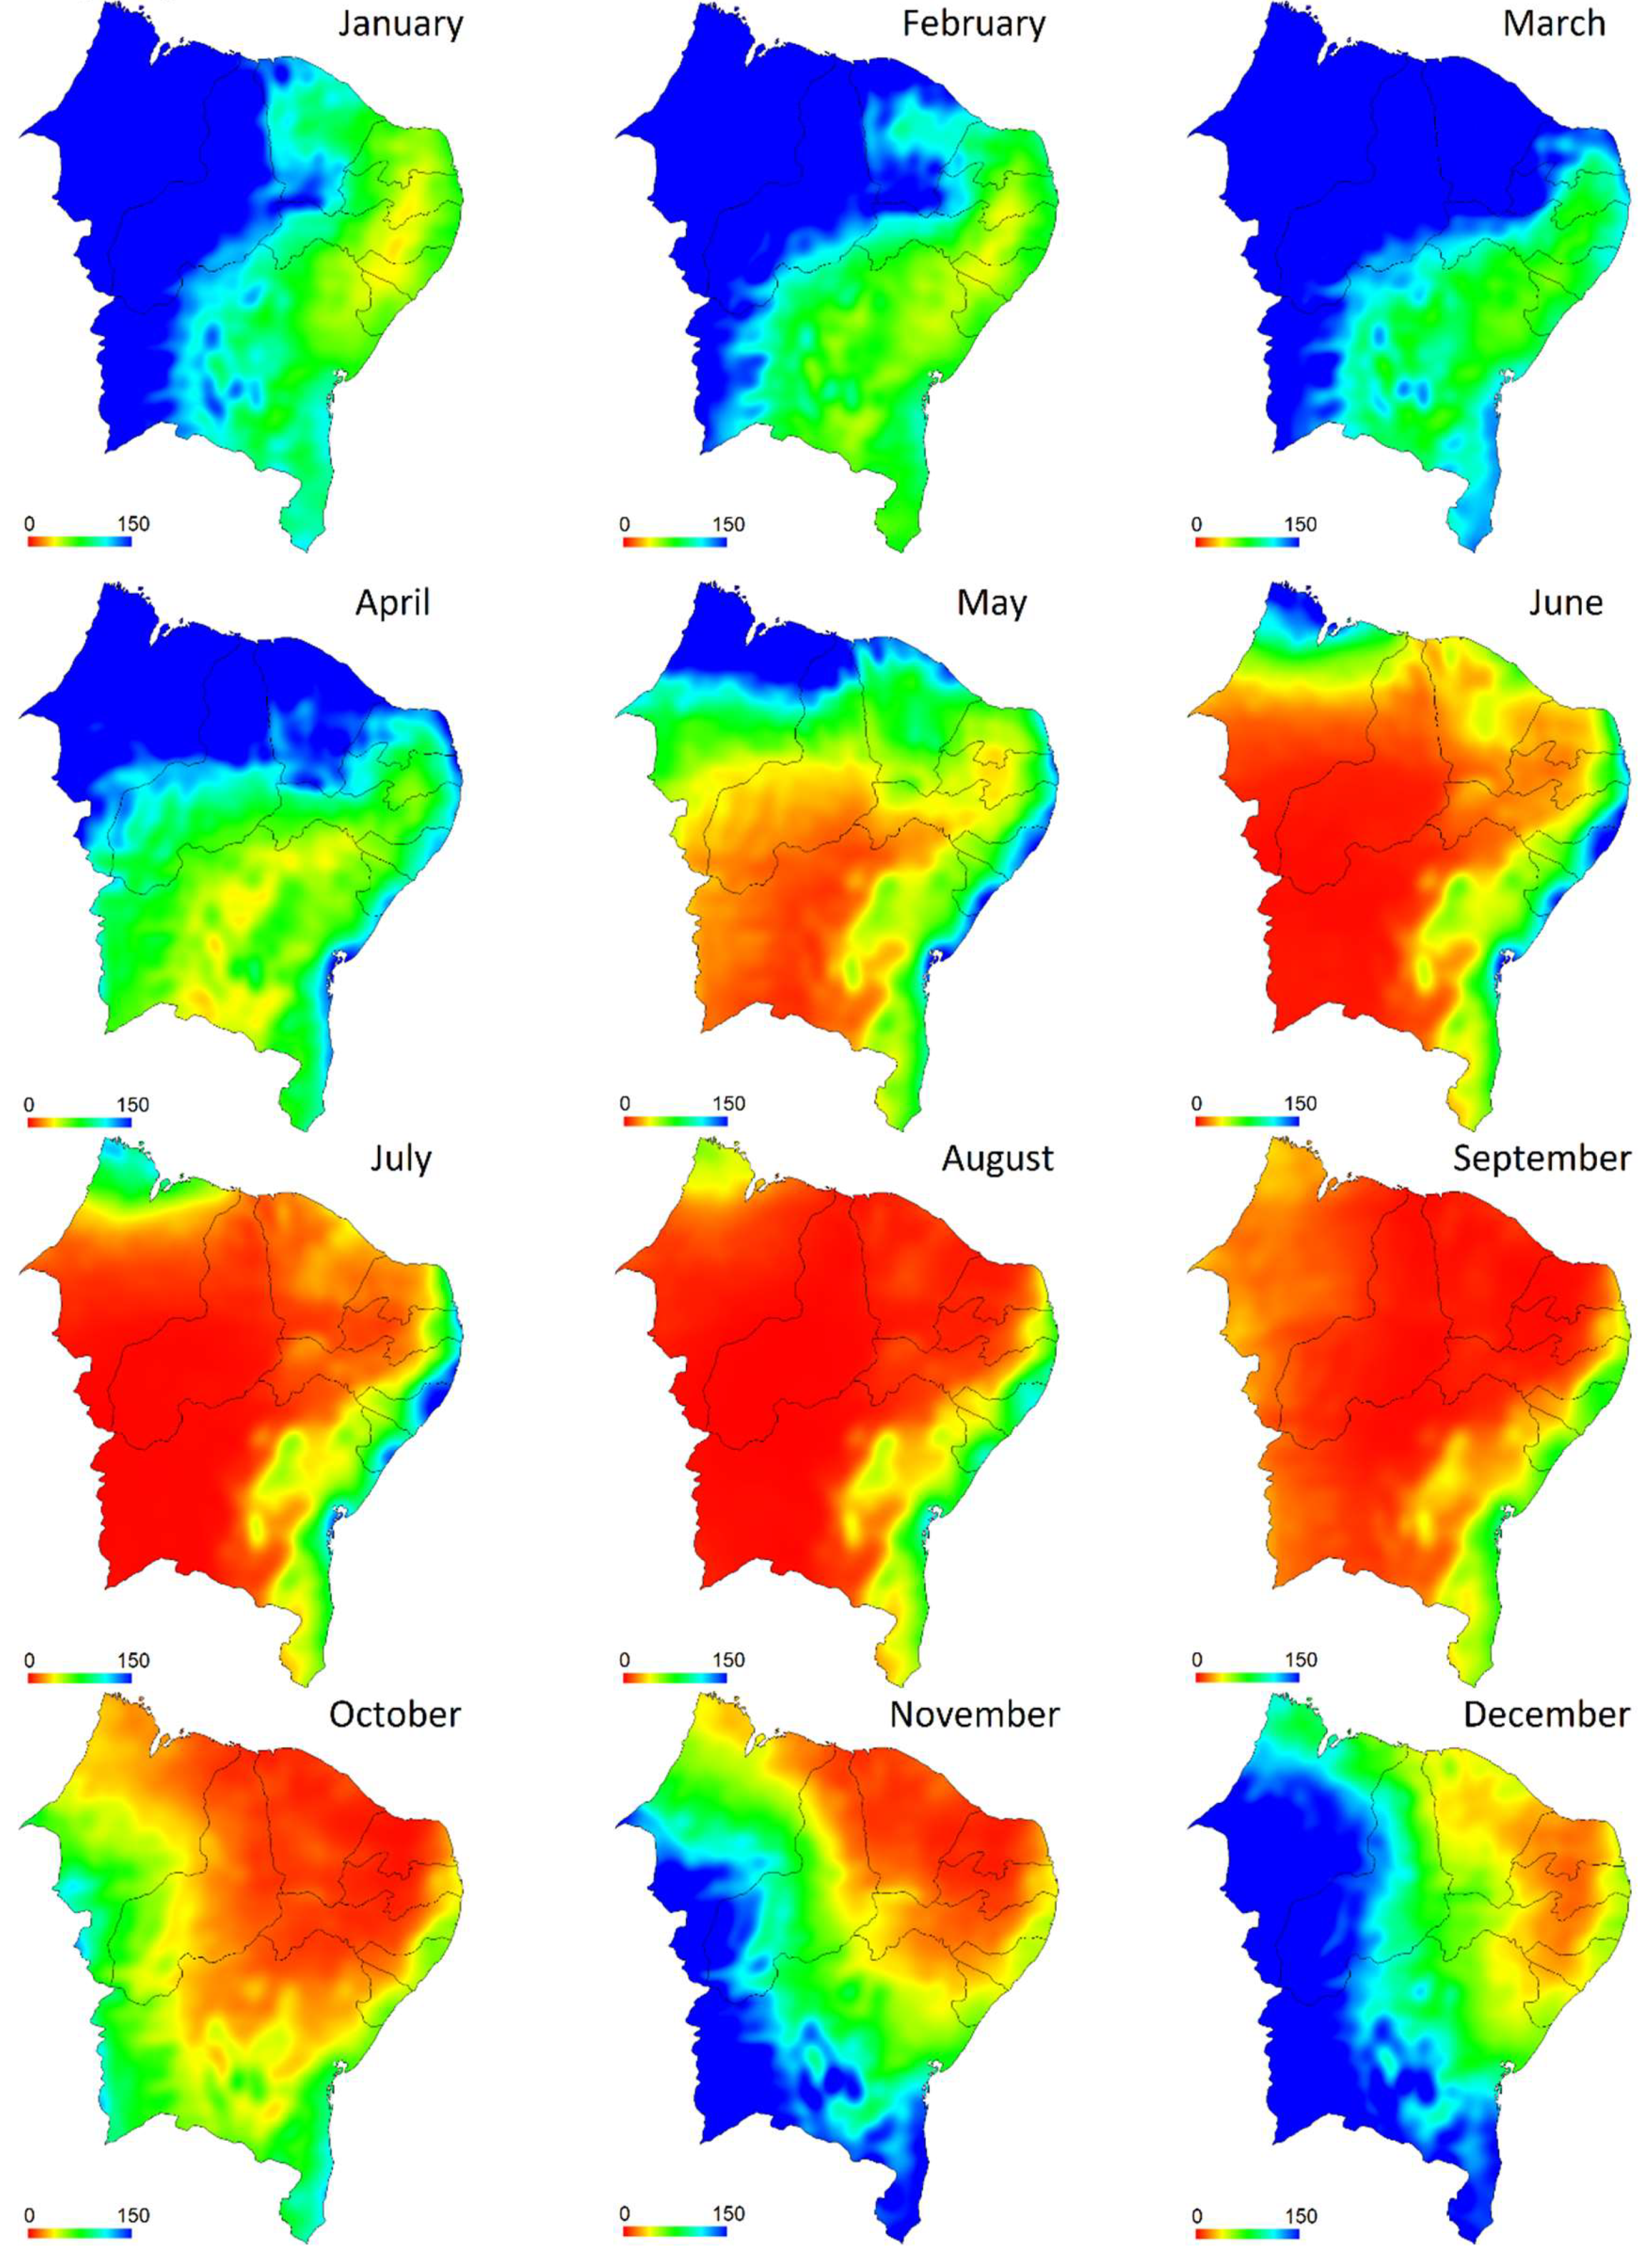
Figure 4.
Mean yearly precipitation in mm for the Brazilian NE, in the period 1950 to 2023.
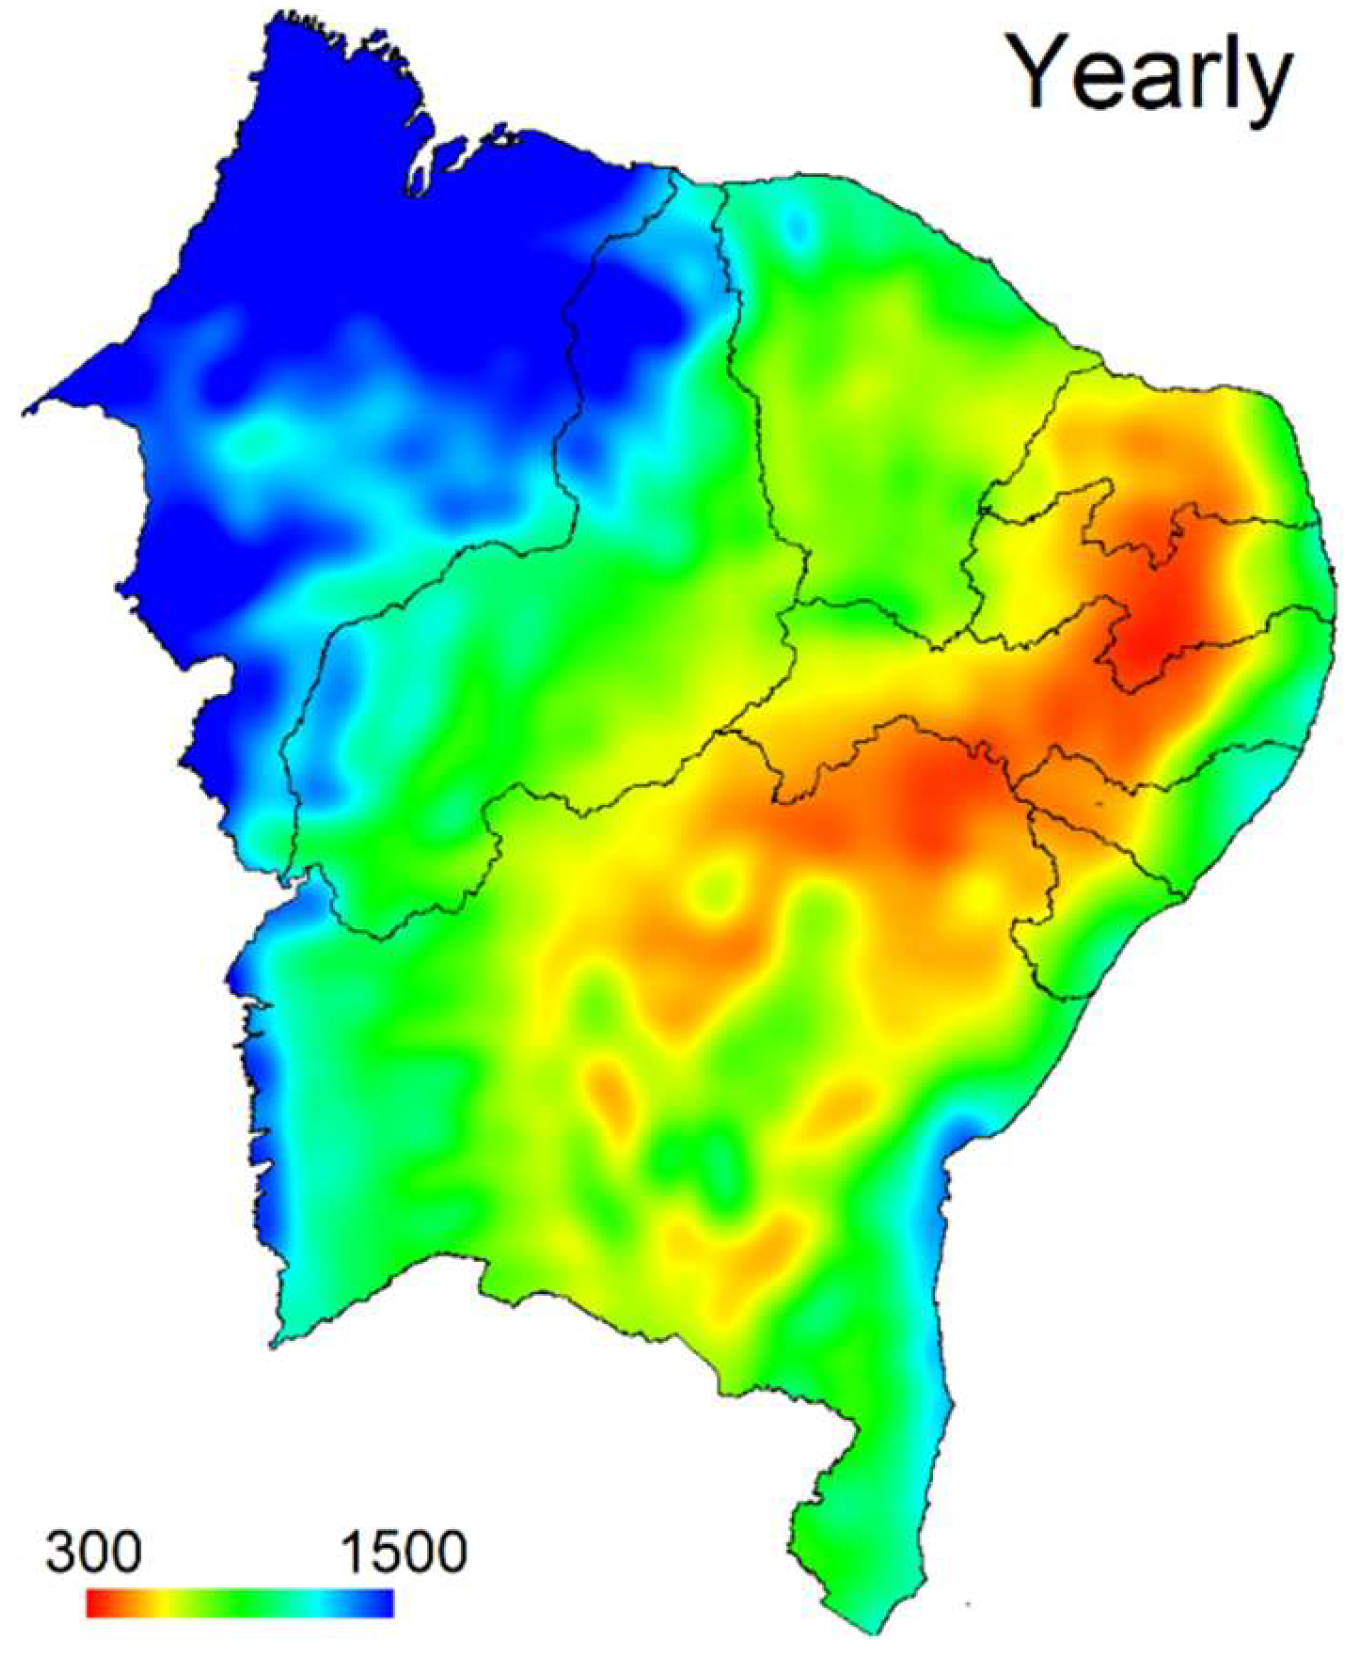
Figure 5.
Strength of seasonality D(p) (left panel), duration of the rainy season in months n(p) (center panel), and the center of the rainy season C(p) (right panel).
Figure 5.
Strength of seasonality D(p) (left panel), duration of the rainy season in months n(p) (center panel), and the center of the rainy season C(p) (right panel).
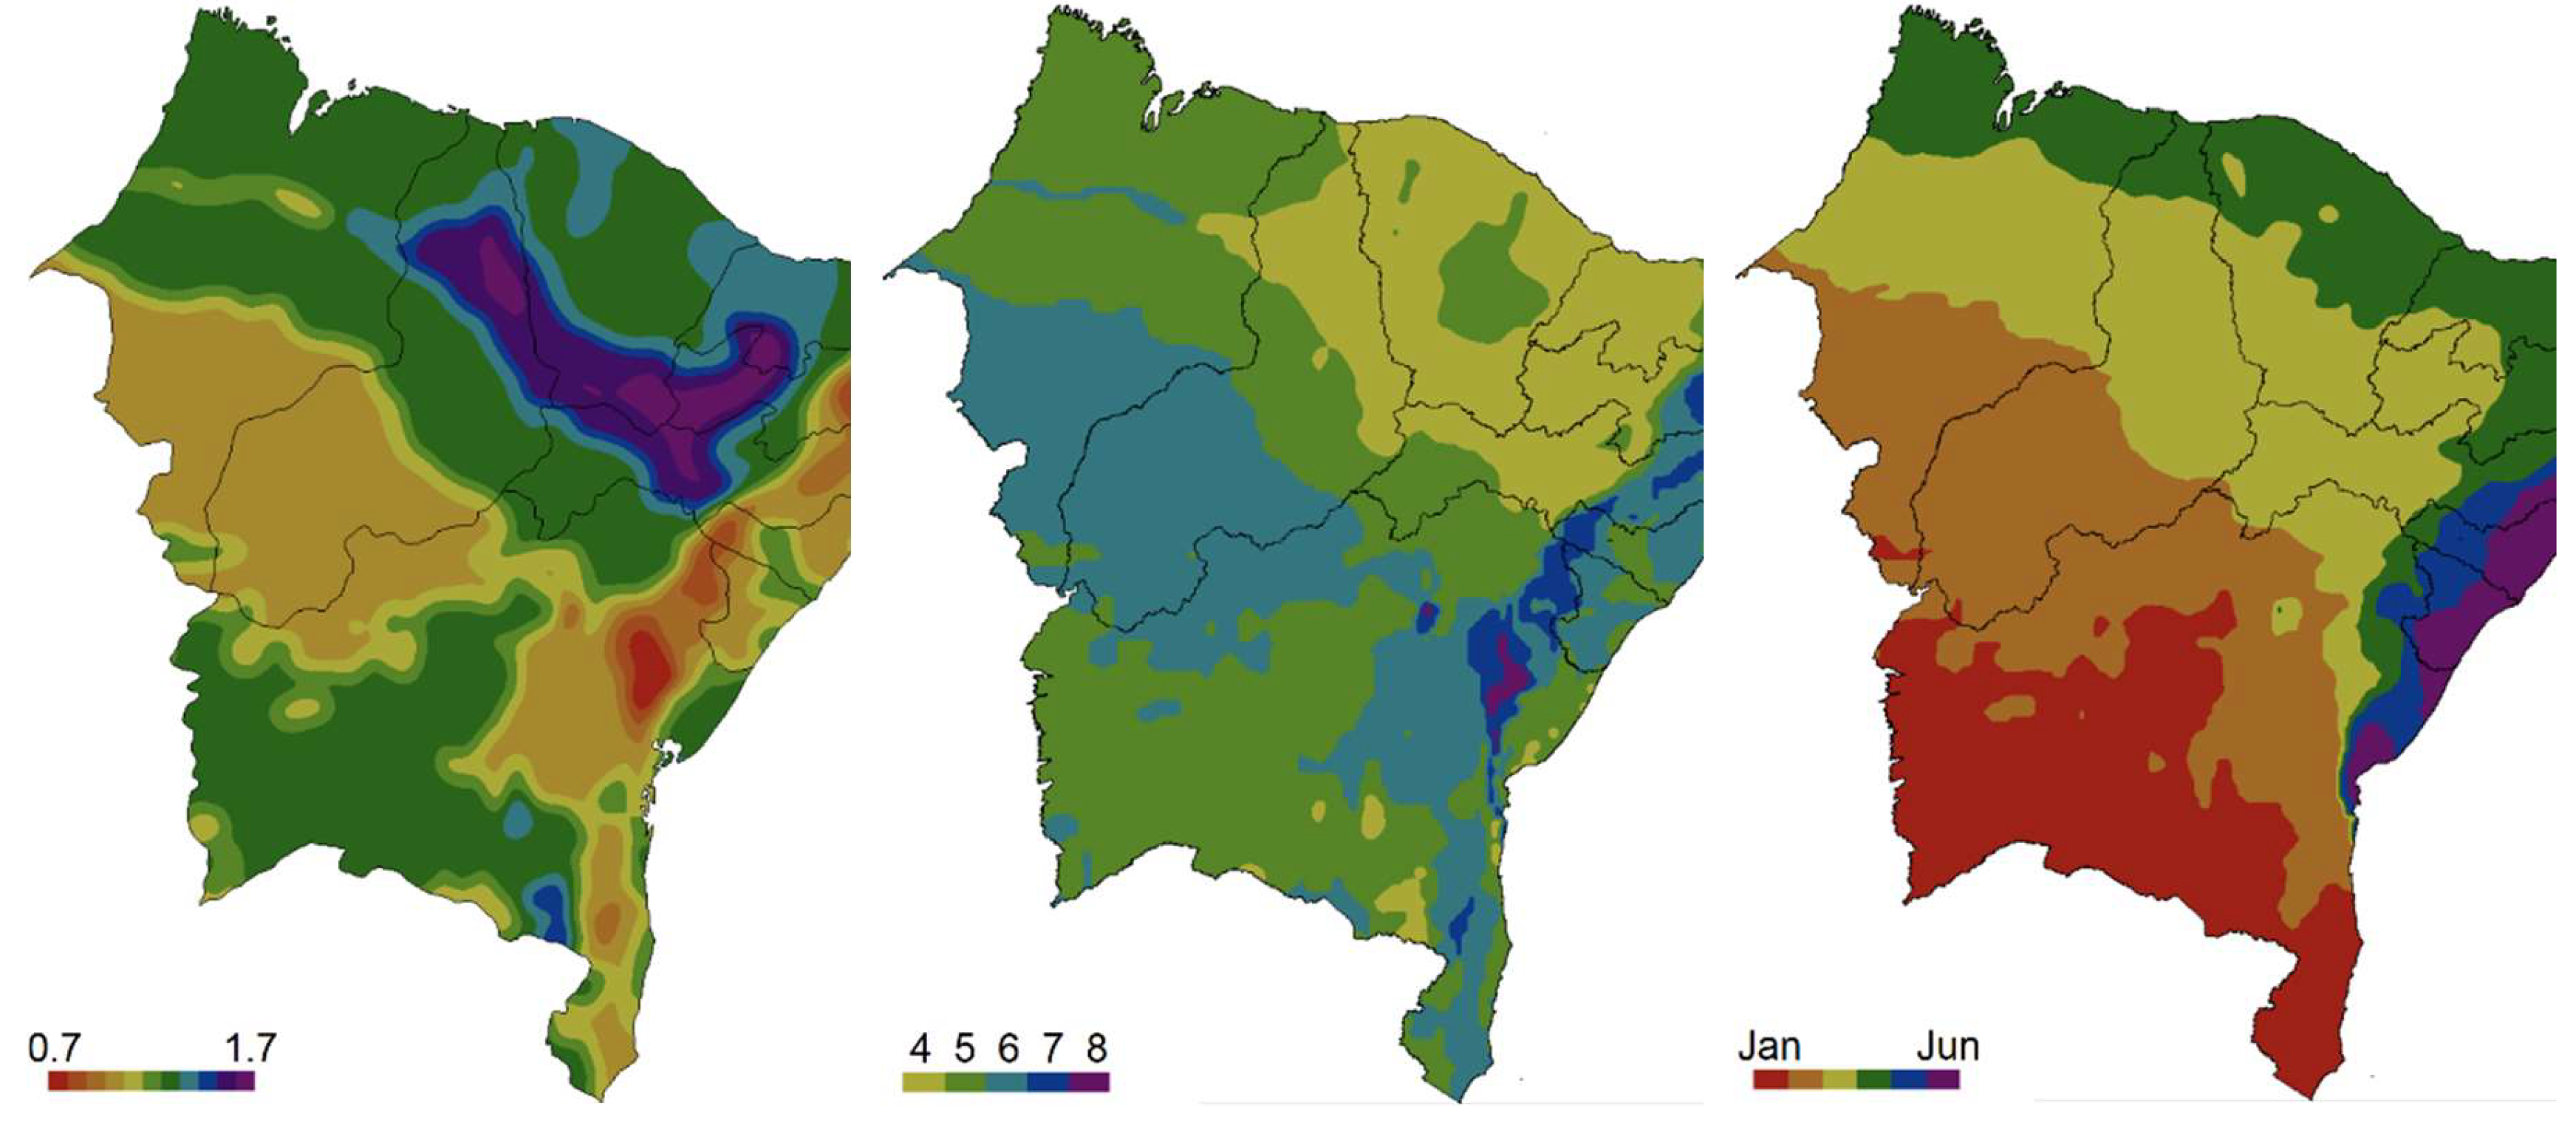
Figure 6.
Software displaying the map of 1794 municipalities of the Brazilian NE, together with the control dialog box.
Figure 6.
Software displaying the map of 1794 municipalities of the Brazilian NE, together with the control dialog box.
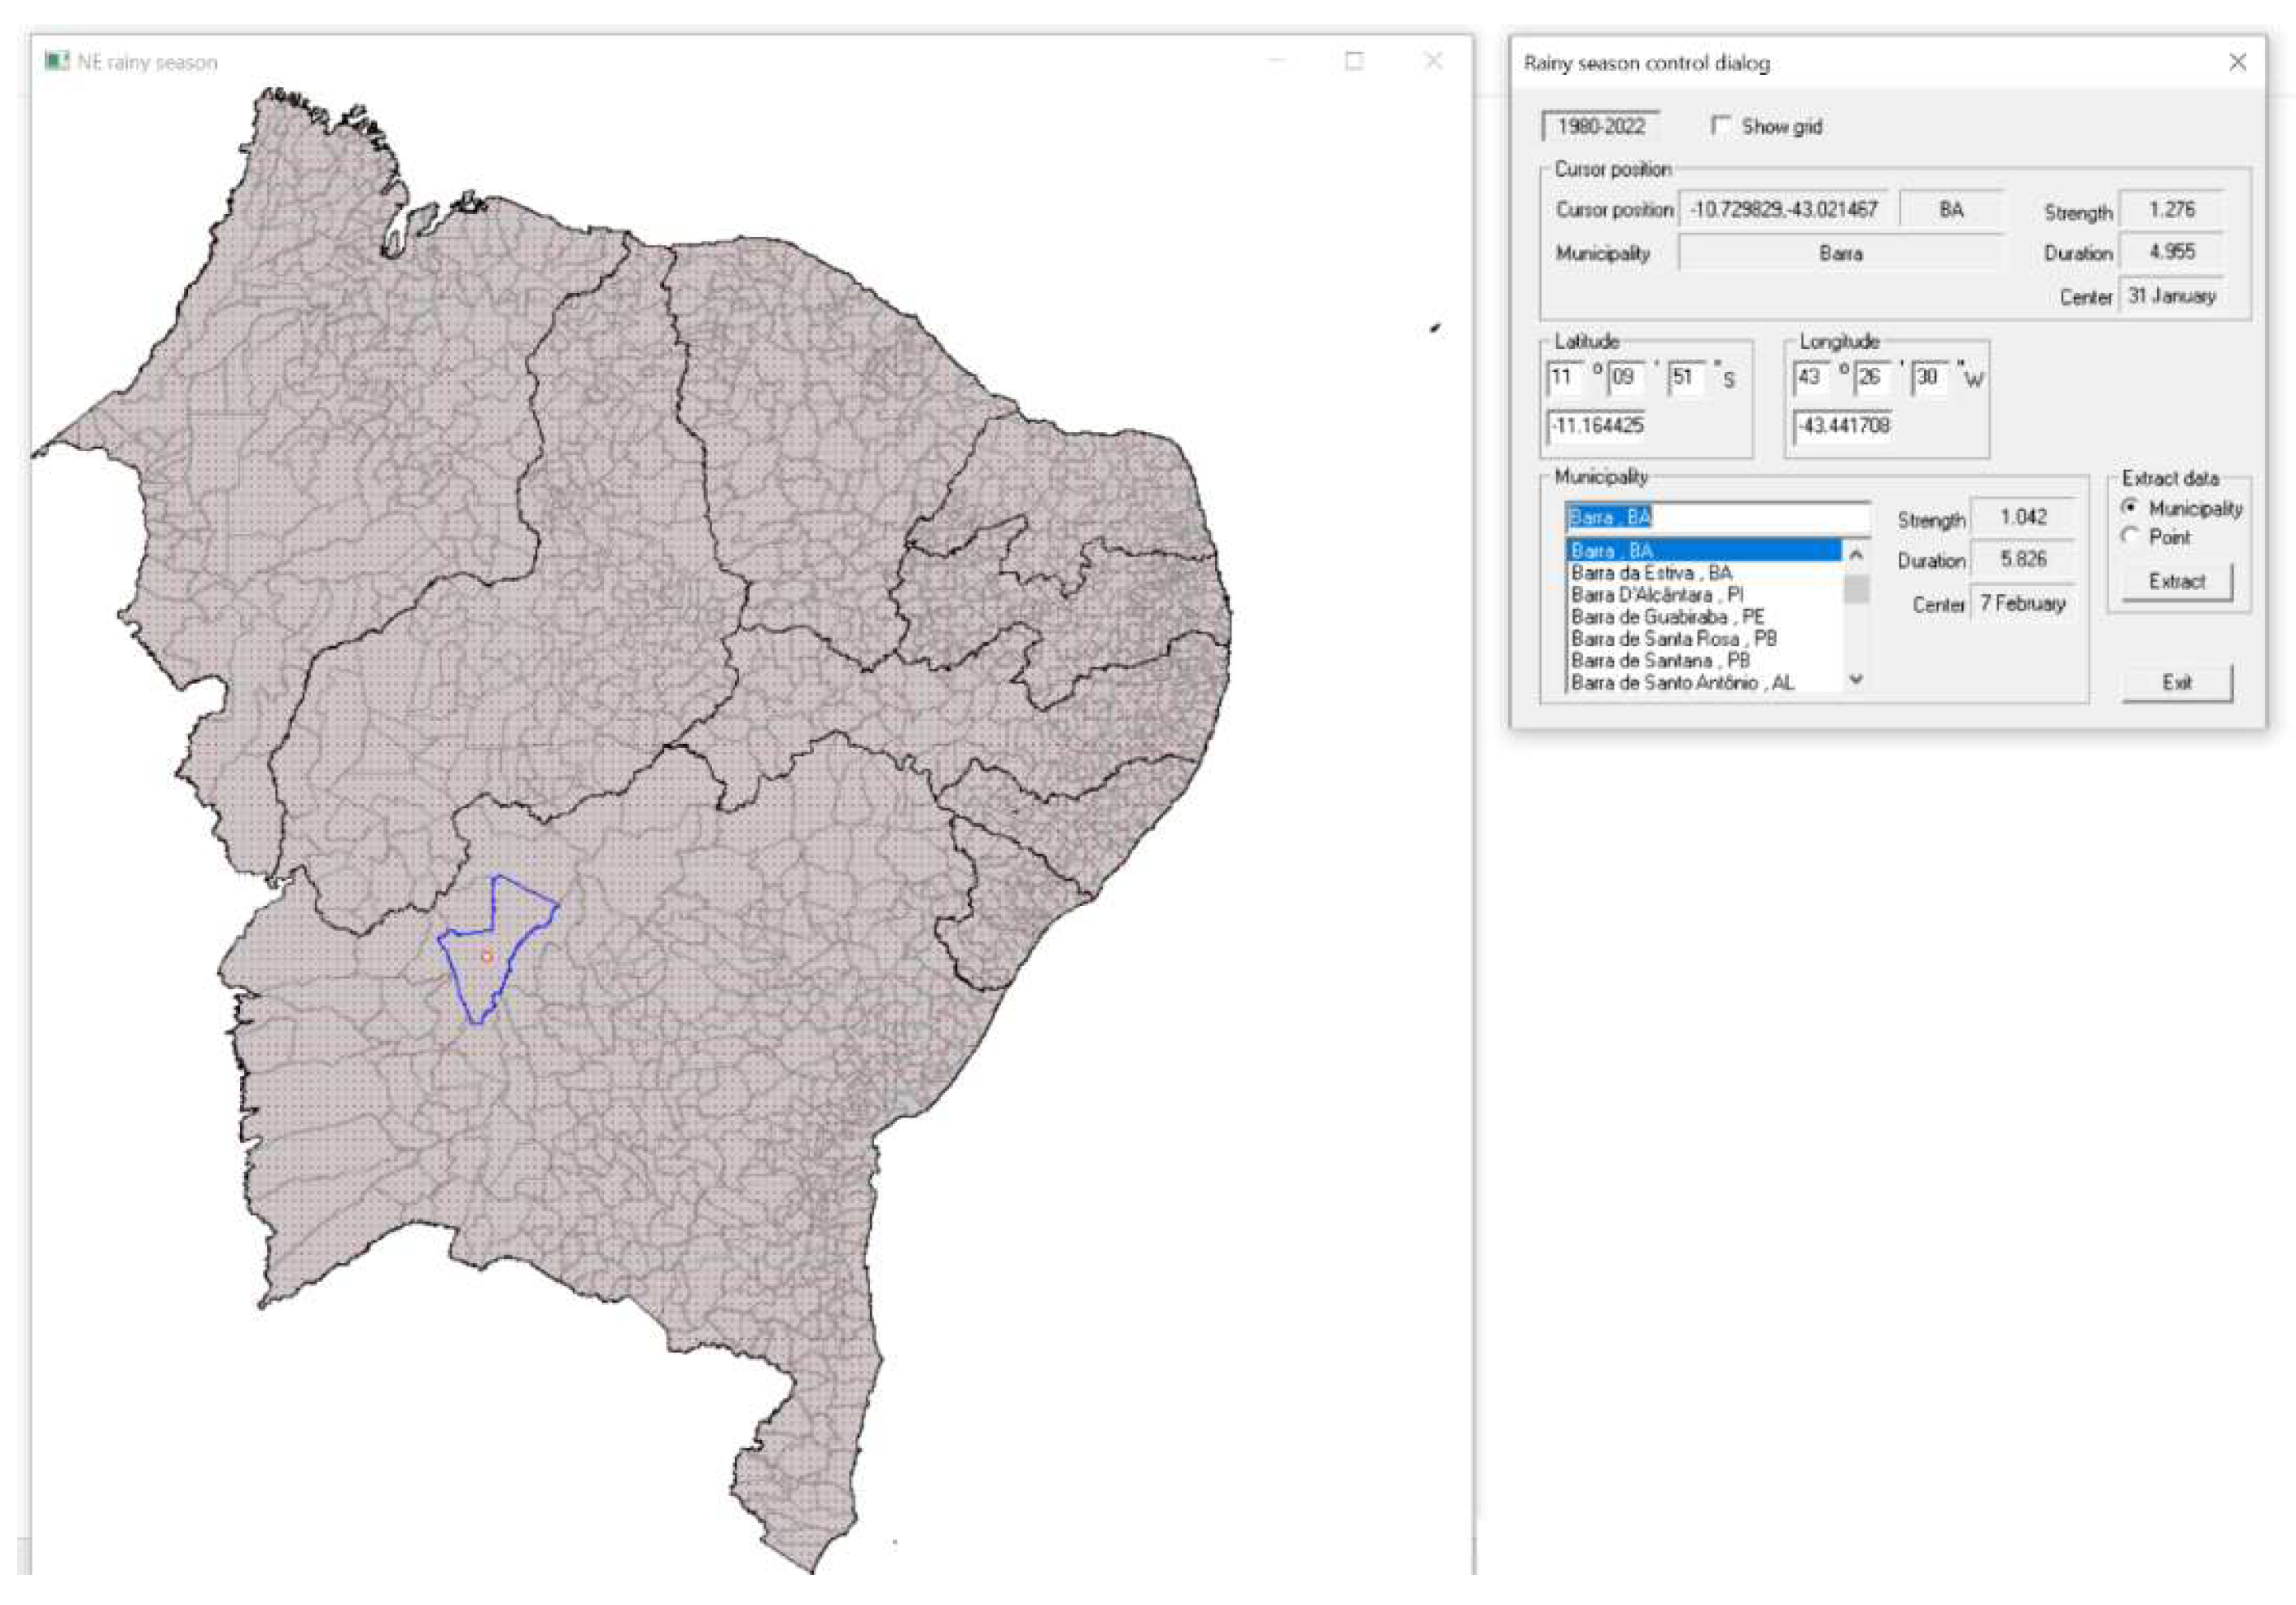

Table 1.
Rainy season estimated from the 1980-2022 data for the nine capitals of the NE states. The one before last column lists the duration of the rainy season in months calculated using the current modified RE approach (MRE), and the original RE method in parenthesis.
Table 1.
Rainy season estimated from the 1980-2022 data for the nine capitals of the NE states. The one before last column lists the duration of the rainy season in months calculated using the current modified RE approach (MRE), and the original RE method in parenthesis.
| Code | Name | State | Latitude | Longitude | Area(km2) | Strength | Duration MRE (RE) | Center |
|---|---|---|---|---|---|---|---|---|
| Maceió | AL | -9.584 | -35.683 | 509.32 | 1.284 | 4.93 (10.8) | 1-Jul | |
| 2927408 | Salvador | BA | -12.927 | -38.408 | 693.442 | 1.285 | 4.92 (11.2) | 1-Jun |
| 2304400 | Fortaleza | CE | -3.765 | -38.563 | 312.353 | 1.324 | 4.79 (7.91) | 7-Apr |
| 2111300 | São Luís | MA | -2.585 | -44.256 | 583.063 | 1.296 | 4.88 (8.38) | 5-Apr |
| 2507507 | João Pessoa | PB | -7.165 | -34.879 | 210.044 | 1.013 | 5.95 (10.9) | 20-May |
| 2611606 | Recife | PE | -8.028 | -34.959 | 218.843 | 1.267 | 4.98 (11.1) | 4-Jun |
| 2211001 | Teresina | PI | -5.381 | -42.802 | 1391.293 | 1.595 | 3.97 (7.07) | 18-Mar |
| 2408102 | Natal | RN | -5.804 | -35.212 | 167.401 | 1.02 | 5.92 (10.4) | 14-May |
| 2800308 | Aracaju | SE | -10.948 | -37.095 | 182.163 | 1.277 | 4.95 (11.0) | 28-Jun |
Disclaimer/Publisher’s Note: The statements, opinions and data contained in all publications are solely those of the individual author(s) and contributor(s) and not of MDPI and/or the editor(s). MDPI and/or the editor(s) disclaim responsibility for any injury to people or property resulting from any ideas, methods, instructions or products referred to in the content. |
© 2024 by the authors. Licensee MDPI, Basel, Switzerland. This article is an open access article distributed under the terms and conditions of the Creative Commons Attribution (CC BY) license (http://creativecommons.org/licenses/by/4.0/).
Copyright: This open access article is published under a Creative Commons CC BY 4.0 license, which permit the free download, distribution, and reuse, provided that the author and preprint are cited in any reuse.


