1. Introduction
The dissolved organic carbon (DOC) present in water bodies [
1] mainly originate from the metabolites of living organisms, plant residues, and animal feces. They are highly soluble, and are known to have important effects on biological ecosystems and on the quality of water bodies [
2]. A close relationship exists between the DOC and carbon cycling, peaking, and neutrality. By monitoring and studying the DOC present in water bodies, the carbon cycling and transformation processes taking place in these water bodies can be understood more clearly. Moreover, the DOC content provides a measure of the degree of pollution in a water body from which the carbon stocks can be estimated, thus providing support for global carbon neutrality and environmental protection [
3,
4].
The main methods employed to detect the DOC content in water are based on chemical and spectral analyses. However, the chemical analysis method is not suitable for use in large-scale environmental protection monitoring because of its complicated testing methods, long measurement times, slow detection speeds, complex equipment maintenance requirements, the inability to carry out real-time detection, and the creation of secondary pollution [
5,
6,
7,
8,
9]. Spectral approaches, such ultraviolet (UV) absorption spectrometry and fluorescence spectrometry, are relatively new in the context of DOC detection. These techniques are particularly advantageous in terms of their non-destructive and non-selective nature, high sensitivity, rapid detection times, and their ability to by employed in multivariate analysis [
10,
11,
12,
13,
14]. However, the use of single or individual spectroscopic methods is undesirable in the context of DOC detection. For example, UV absorption spectroscopy is prone to ultraviolet interference problems, resulting in a reduced measurement accuracy [
15]. In addition, fluorescence spectroscopy is a relatively unstable technique, being easily affected by environmental factors, and being prone to self-absorption, internal filtration effects, and fluorescence bursts, which ultimately lead to a decrease in the fluorescence intensity [
16].
The combination of different spectroscopic methods has therefore been examined to reflect the varying characteristics of water bodies. For instance, UV absorption spectroscopy reflects the UV absorption characteristics of the organic or inorganic matter present in the water body, whilst fluorescence spectroscopy reflects the fluorescence effect of any organic matter present in the water body. Notably, the two methods provide details regarding different and non-interchangeable physical characteristics of the water body [
17]. To date, a number of researchers have applied multi-source spectral fusion techniques in various fields. For example, Dupuy et al. used the data matrices obtained by near-infrared and mid-infrared spectroscopy to establish partial least-squares regression models for fatty acids and triglycerides [
18]. In another study, Martelo-Vidal et al. combined UV-vis and NIR spectroscopic approaches to successfully determine the contents of ethanol, glucose, glycerol, tartrate, malic acid, acetic acid, and lactic acid in aqueous solutions using an artificial neural network [
19]. Furthermore, Hur et al. analyzed various water quality parameters, such as the biological oxygen demand, chemical oxygen demand, and total nitrogen content of urban river water using three-dimensional fluorescence spectroscopy and UV spectroscopy. Consequently, they demonstrated that the UV
220, C
3, and C
1 fluorescence peaks exhibited high correlation coefficients for the BOD, COD, and TN parameters, respectively [
20]. Although these studies promote the development of multi-source spectral fusion techniques, the majority are limited to the fusion of individual wavelengths in the UV absorption spectra with low-resolution fluorescence spectral data, which have a low information usage rate in the spectral data.
Convolutional neural networks (CNN) have many advantages in the construction of prediction models for spectral datasets, such as a high learning ability, a strong adaptability, and a high prediction accuracy. However, a number of challenges are associated with CNN, such as high data requirements, high computational resource consumption, and a poor interpretability [
21]. Principal component analysis (PCA) has the advantages of a significant dimensionality reduction, the ability to remove redundant information, an enhanced computational efficiency, a reduction in noise interference, the ability to carry out visual analysis, and an independent orthogonality when extracting the main features of spectral data. Consequently, it is able to fully reveal the hidden features and structures of spectral data [
22].
The use of multispectral fusion analysis in the detection of DOC in seawater is relatively rare; therefore, this study combined PCA and CNN (PCA-CNN) to construct a detection model, and fully exploited the data in the UV absorption and fluorescence spectra to accurately determine the DOC content in seawater samples. To better demonstrate the effectiveness of this detection system, the Bayesian correction method was used to minimize the influence of impurities such as particles and pigments, which strongly affect the DOC content of seawater [
23].
2. Materials and Methods
2.1. Samples and Chemical Data Collection
Potassium hydrogen phthalate was purchased from Sinopharm Chemical Reagent Co., Ltd. in Shanghai, China, with a purity of more than 99.8%, potassium humic acid and fulvic acid were purchased from Hefei BASF Biotechnology Co., Ltd. in Hefei, China, with a purity of more than 98%, and tryptophan and tyrosine were purchased from Dulai Biological Co., Ltd in Nanjing, China, with a purity of more than 99%. The actual seawater samples were collected in five sea areas of Qingdao, China. Two samples were collected in each area, giving a total of 10 seawater samples. The coordinates for the collection sites were as follows: 120.33°E, 36.26°N; 120.47°E, 36.09°N; 120.22°E, 36.11°N; 120.18°E, 36.35°N; and 120.15°E, 36.18°N.
The DOC concentrations was determined using a total organic carbon analyzer (TOC-VCPH, Shimadzu, Japan).
2.2. Spectral Data Acquisition
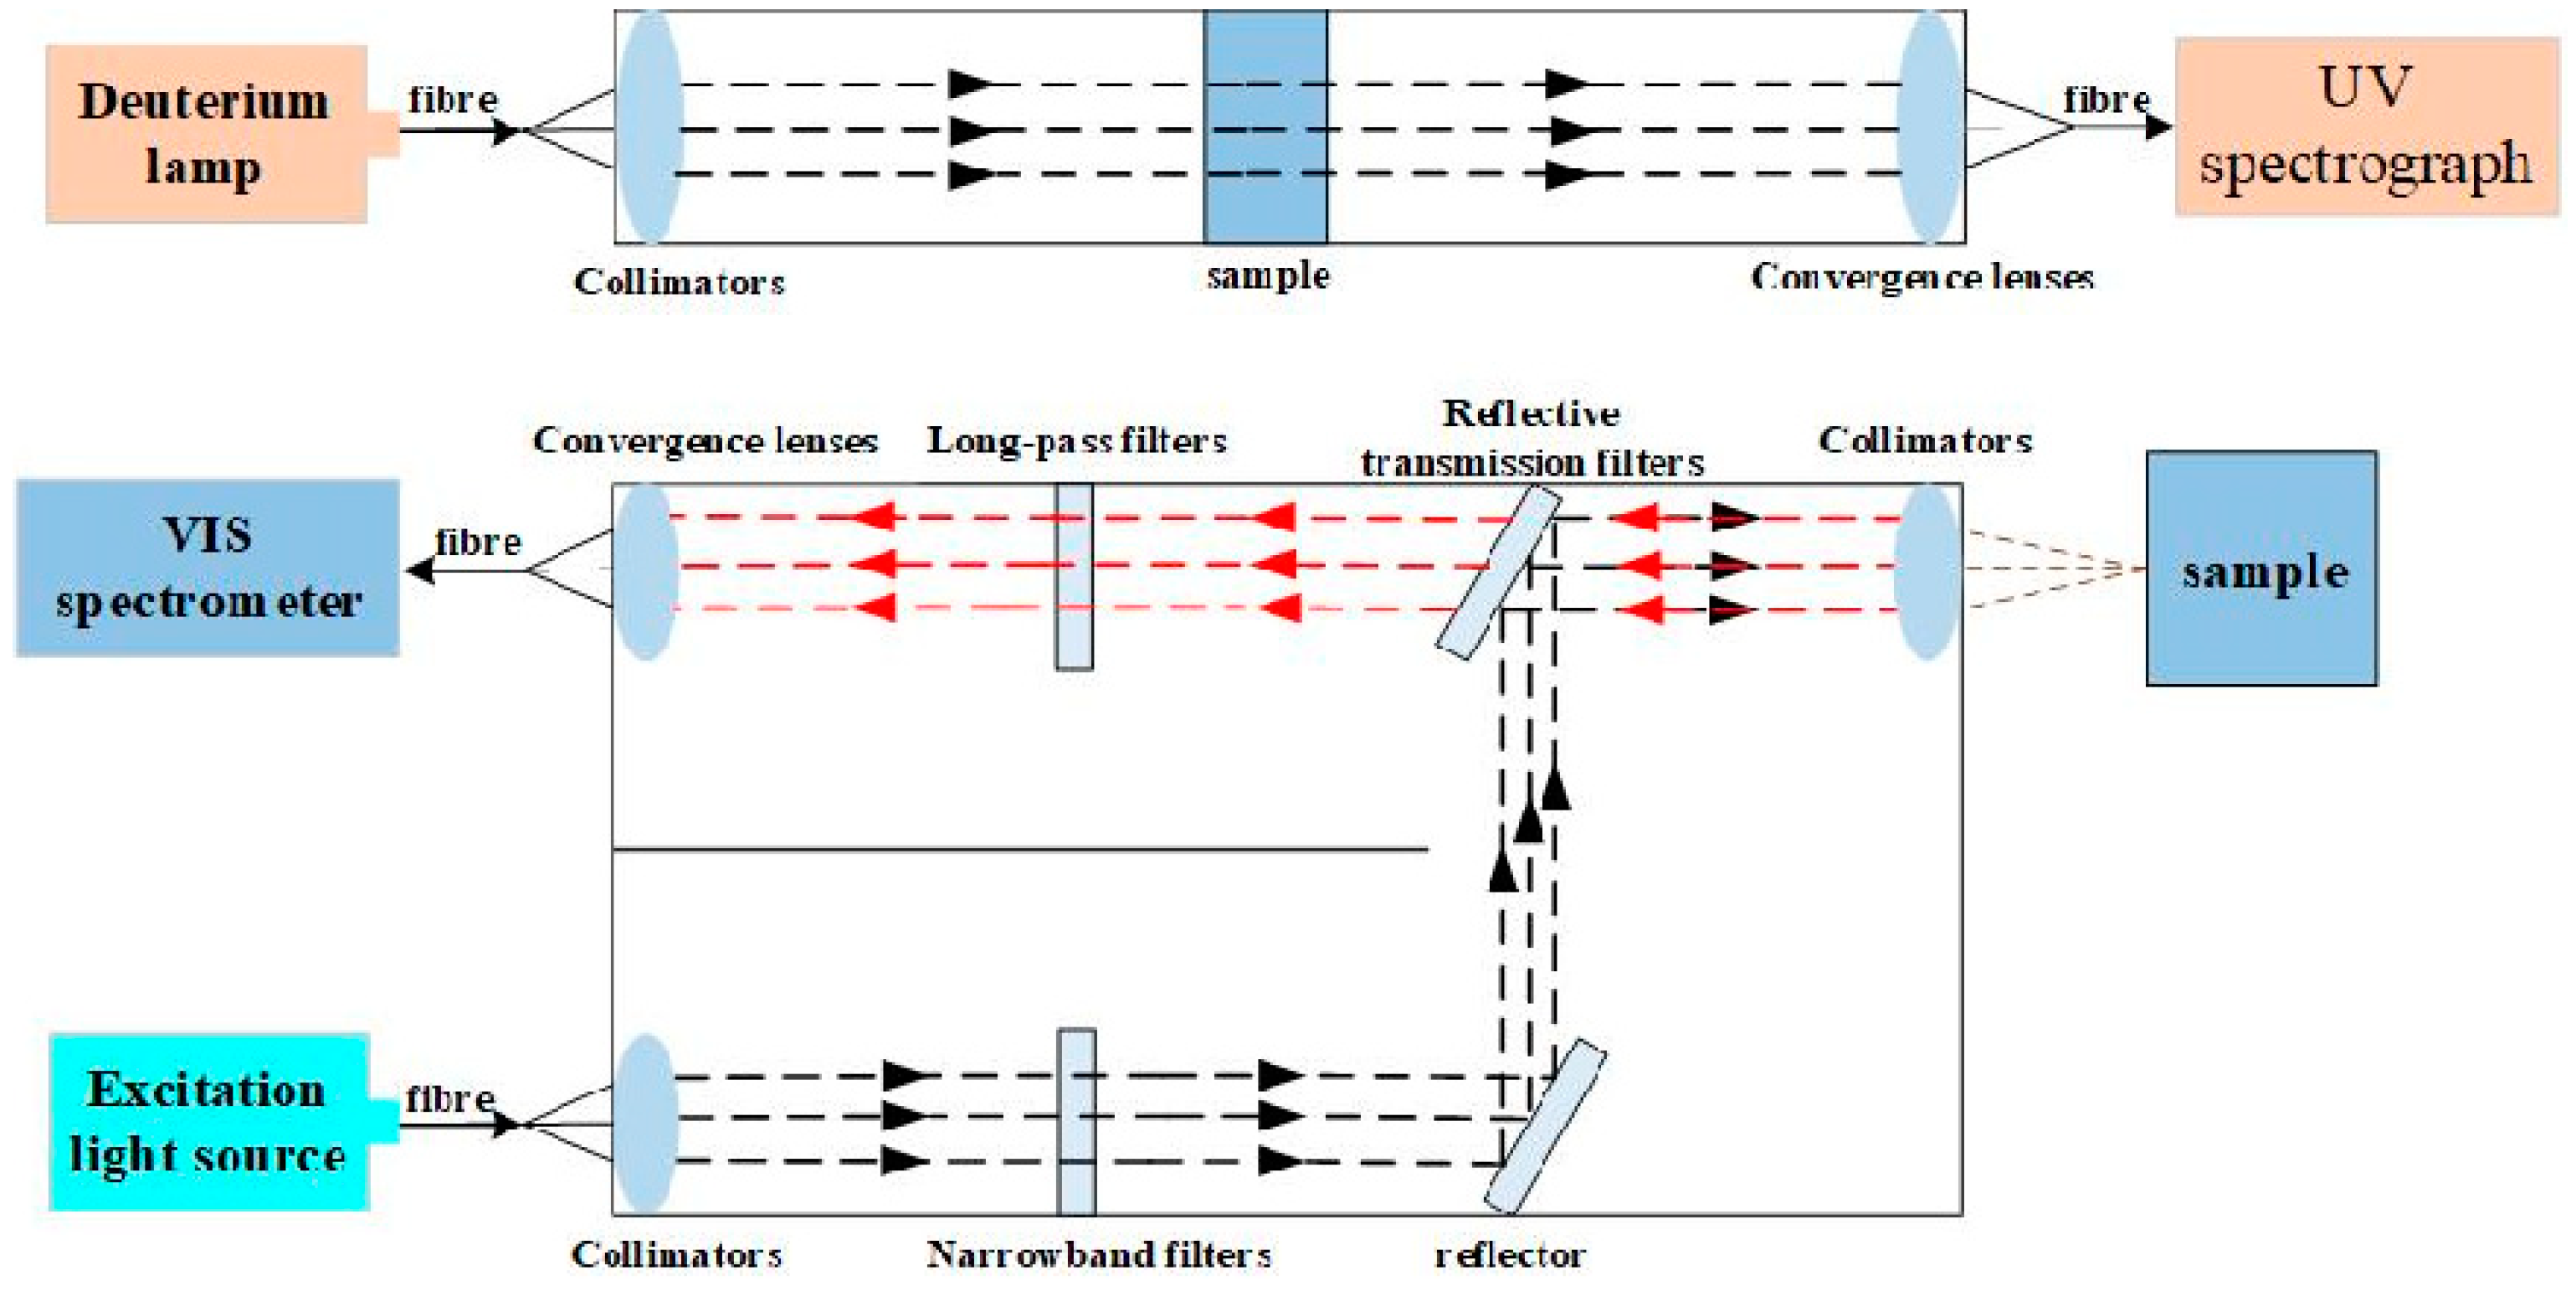
The instrument employed for analyzing the DOC concentration of seawater consisted of two parts. One part is the UV detection system, containing a deuterium light source (FiberLight DTM 6/10, Heraeus, China), a quartz cuvette (40 mm × 10 mm), and UV spectrometer (Ocean ST-UV, Ocean Optical, U.S.) with a detection range of 185–650 nm and resolution of 13 nm. The second component for acquisition of the fluorescence spectra consisted of an excitation light source (semiconductor laser with a wavelength of 405 nm and a power of 4 mW), a quartz cuvette (50 mm × 50 mm), and a fluorescence spectrometer (Ocean ST-VIS, Ocean Optical, U.S.) with a detection range of 350–810 nm and a resolution of 6.3 nm. The devise related to sample configuration include a pure water system (EQ 7000, Milli-Q, Germany) for ultrapure water, and vacuum pump (VP-15L, JOANLAB, China) for seawater filtration.
A schematic representation of the spectral acquisition process is outlined in
Figure 1. The upper half shows a schematic diagram of the UV spectral acquisition approach, wherein the light emitted by the deuterium lamp was reflected against a collimator mirror and allowed to flow into the sample. The light was then processed by a convergence lenses and passed into the UV absorption spectrometer to record the UV spectral data. The lower half shows a schematic diagram of the fluorescence spectral acquisition approach, wherein the light emitted by the laser is processed through the collimator, flows to the narrowband filter, and then flows through the reflector, the reflective transmission filter, and the convergence lenses into the sample. Subsequently, the excited fluorescence passes through the collimator, reflective transmission filter, long-pass filter, and the convergence lenses again, prior to entering the fluorescence spectrometer to obtain the spectral data. In this study, fluorescence spectra were collected using laser-induced fluorescence (LIF), a highly sensitive and non-destructive active optical detection technique that uses a laser as an excitation light source to rapidly obtain high-quality fluorescence spectra [
24].
2.3. Data Analysis
The accurate measurement of the DOC content in seawater is crucial in the field of marine and environmental monitoring for assessing water quality and ecological health. In this study, the application of the combined PCA-CNN and Bayesian correction model improves the effectiveness of the detection of DOC in seawater, thus providing more reliable data for water quality monitoring and ecological research.
2.3.1. PCA-CNN Detection Model
PCA-CNN is a deep learning model that combines PCA with a CNN. PCA is a method used for data degradation and feature extraction, extracting data features under the premise of minimizing information loss to reduce the computational workload [
25]. The basic principle of a CNN is based on the use of convolutional, pooling, and fully connected layer components to learn the complex relationship between the DOC concentration and the spectral features, ultimately aiming to improve the accuracy of prediction [
26]. PCA-CNN combines PCA and CNN by initially extracting the DOC features using PCA dimensionality reduction, and subsequently feeding these features into the CNN for further feature extraction and classification. The specific procedure of PCA-CNN is as follows:
First, UV absorption spectral data XU and fluorescence spectral data XF were collected for the DOC samples, as well as the DOC sample concentration Y.
Then PCA was performed on the UV absorption spectral data and fluorescence spectral data, respectively, to extract the principal components [
27]. The steps of PCA were as follows:
Standardised data,according to Equation (1):
where
and
are the normalised data,
and
are the mean values of the UV absorption and fluorescence data,
and
are their standard deviations.
Calculate the covariance matrix [
28], according to Equation (2):
Eigenvalue decomposition of the covariance matrix to obtain eigenvalues and eigenvectors, according to Equation (3):
Map the raw data into the principal component space [
29], according to Equation (4):
where
and
are the dimensionality reduced data, and
and
are the eigenvector matrices of the UV and fluorescence data, respectively, according to Equation (5):
Then the principal components of the data from the UV absorption spectrum
and the fluorescence spectrum
are combined into a feature matrix
,to be used as input to the CNN, according to Equation (6):
Finally, the DOC detection model is constructed using the merged principal component data
as the convolutional neural network (CNN) input. The processing flow of the CNN consists of the following main parts [
30]:
Convolutional layer: features are extracted by convolutional operations, according to Equation (7):
where
denotes the convolution kernel.
Activation layer: an activation function is applied to introduce nonlinear features, according to Equation (8):
Pooling Layer: reduces the dimensionality of features through pooling operations, according to Equation (9):
Fully connected layer: features are spread and final predictions are made, DOC concentrations are calculated by weights and biases [
31], according to Equation (10):
where
is the DOC concentration predicted by the model,
is the weight of the fully connected layer,
is the input feature, and
is the bias.
The model extracts meaningful principal component features by reducing the dimensionality of the raw spectral data using PCA, and learns the complex relationship between the features and DOC concentration through further processing by CNN. This process not only improves the computational efficiency, but also helps the model to better understand and generalise the data structure, thus improving the accuracy of DOC concentration detection. Eventually, the DOC concentration in seawater can be predicted using the trained model with the output .
2.3.2. Bayesian Correction Model
Typically, collected seawater samples must be filtered through a 45 nm membrane to remove particulates and suspended matter, leaving a water sample containing only dissolved organic carbon [
32]. However, in the absence of filtration when using optical sensors, detection of the DOC content is affected by impurities, such as particulate and pigmented matter, thereby rendering the detection results inaccurate. To solve this problem, a Bayesian correction model was employed to correct the DOC content predicted by the PCA-CNN model based on the principle of Bayesian statistics. This approach combines the observed data with prior knowledge to update the posterior distribution of the model prediction and obtain a more accurate estimation of the DOC content for the unfiltered seawater [
33]. This method can provide more reliable correction results whilst considering parameter uncertainty, thereby improving the accuracy and reliability of the model prediction, and better adapting to the requirements of seawater DOC detection under different conditions. The specific procedure for Bayesian correction is as follows:
Firstly, the prior distribution is defined, and the true content
of DOC is taken as the prior knowledge, which is assumed to follow a normal distribution, denoted as
[
34], according to Equation (11):
where
is the mean of the predicted values and
is the standard deviation.
The next step is to construct a likelihood function. Since DOC measurements are affected by impurities, the relationship between PCA-CNN measurements
and the true concentration
can be expressed by a likelihood function. Assuming that the measurement error follows a normal distribution due to the presence of particulate matter in seawater, the likelihood function
can be written, according to Equation (12):
where
is the standard deviation of the measurement error, reflecting the extent to which impurities interfere with the detection.
According to Bayes' theorem, we can compute the posterior distribution
[
35], according to Equation (13):
where
is the marginal likelihood, which can be obtained by integrating over all possible
, according to Equation (14).
Finally, based on the posterior distribution
, we can make an estimate about the true concentration
. We usually compute the expectation of the posterior distribution
to obtain the corrected concentration
, according to Equation (15):
Through the above process, the PCA-CNN model is effectively combined with the Bayesian correction model, which improves the detection accuracy and reliability of DOC content in unfiltered seawater samples. This approach better copes with the uncertainty due to impurities and provides more accurate estimation of DOC content.
2.3.3. Modelling Evaluation
The performance of the PCA-CNN model was evaluated using the coefficient of determination R2, root mean square error (RMSE), mean square error (MSE), Mean Bias Error (MBE) and the mean absolute error (MAE). A larger R2 value indicates higher model stability, while a smaller RMSE, MSE, MAE indicates greater accuracy. MBE values close to zero indicate that the model predictions are relatively accurate with no significant bias. Data processing was performed using MATLAB 2020a and Origin 2018 software.
3. Results
3.1. Data Acquisition
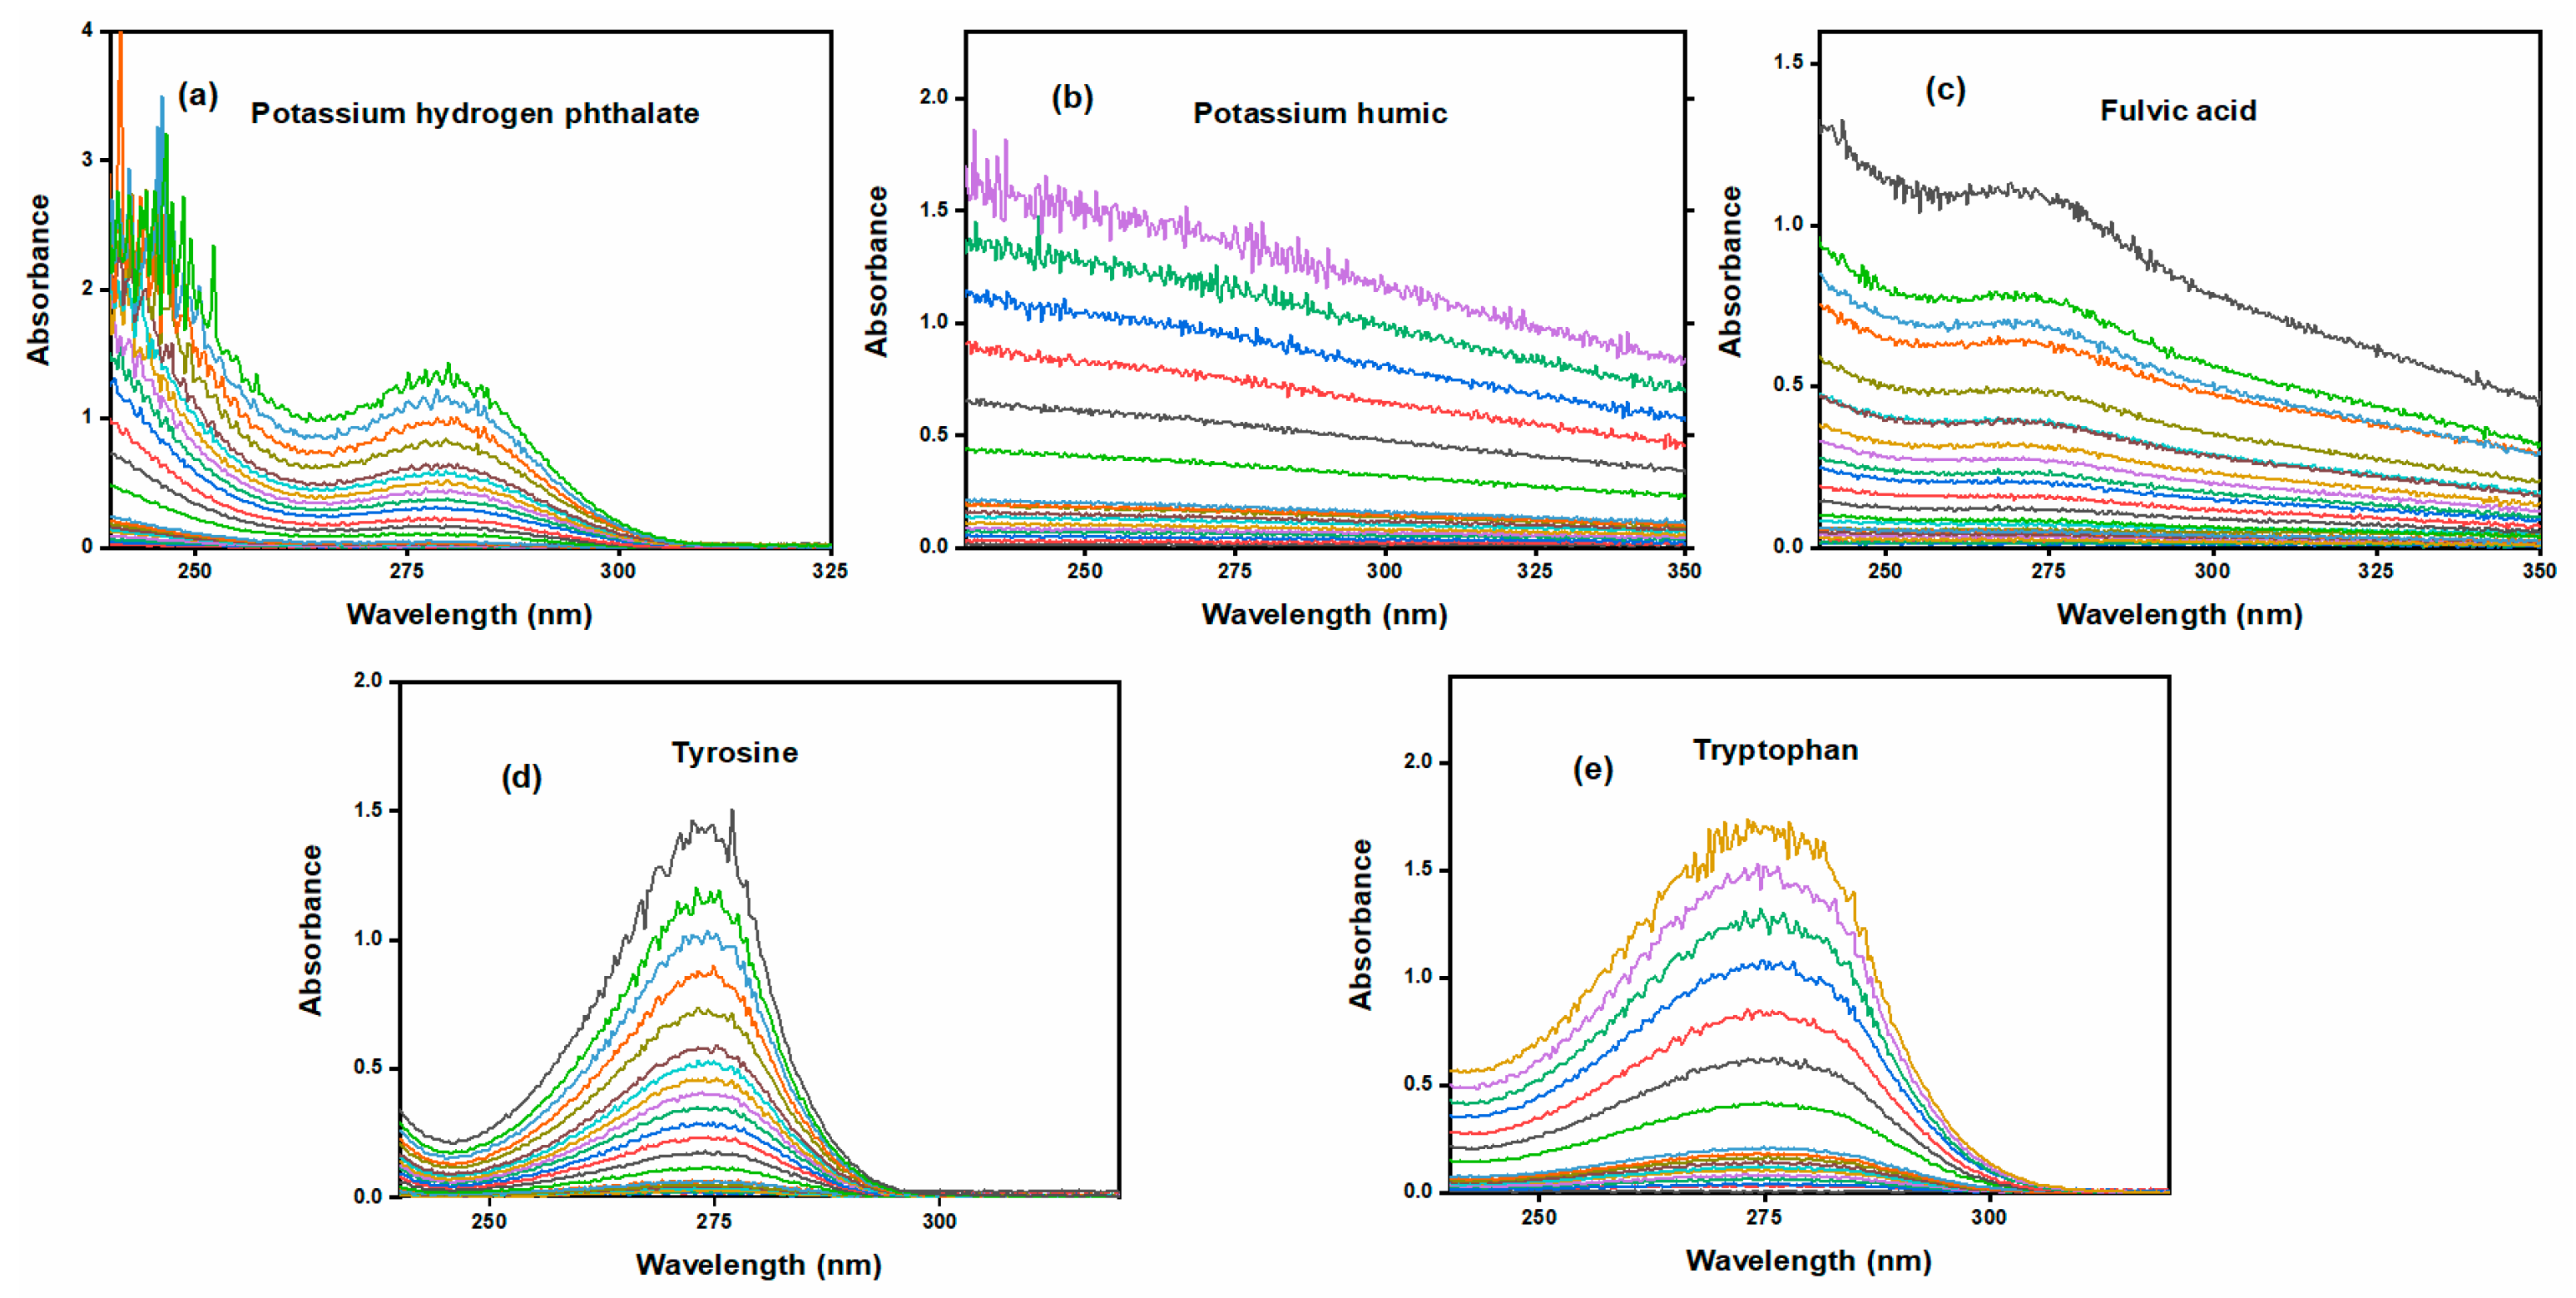
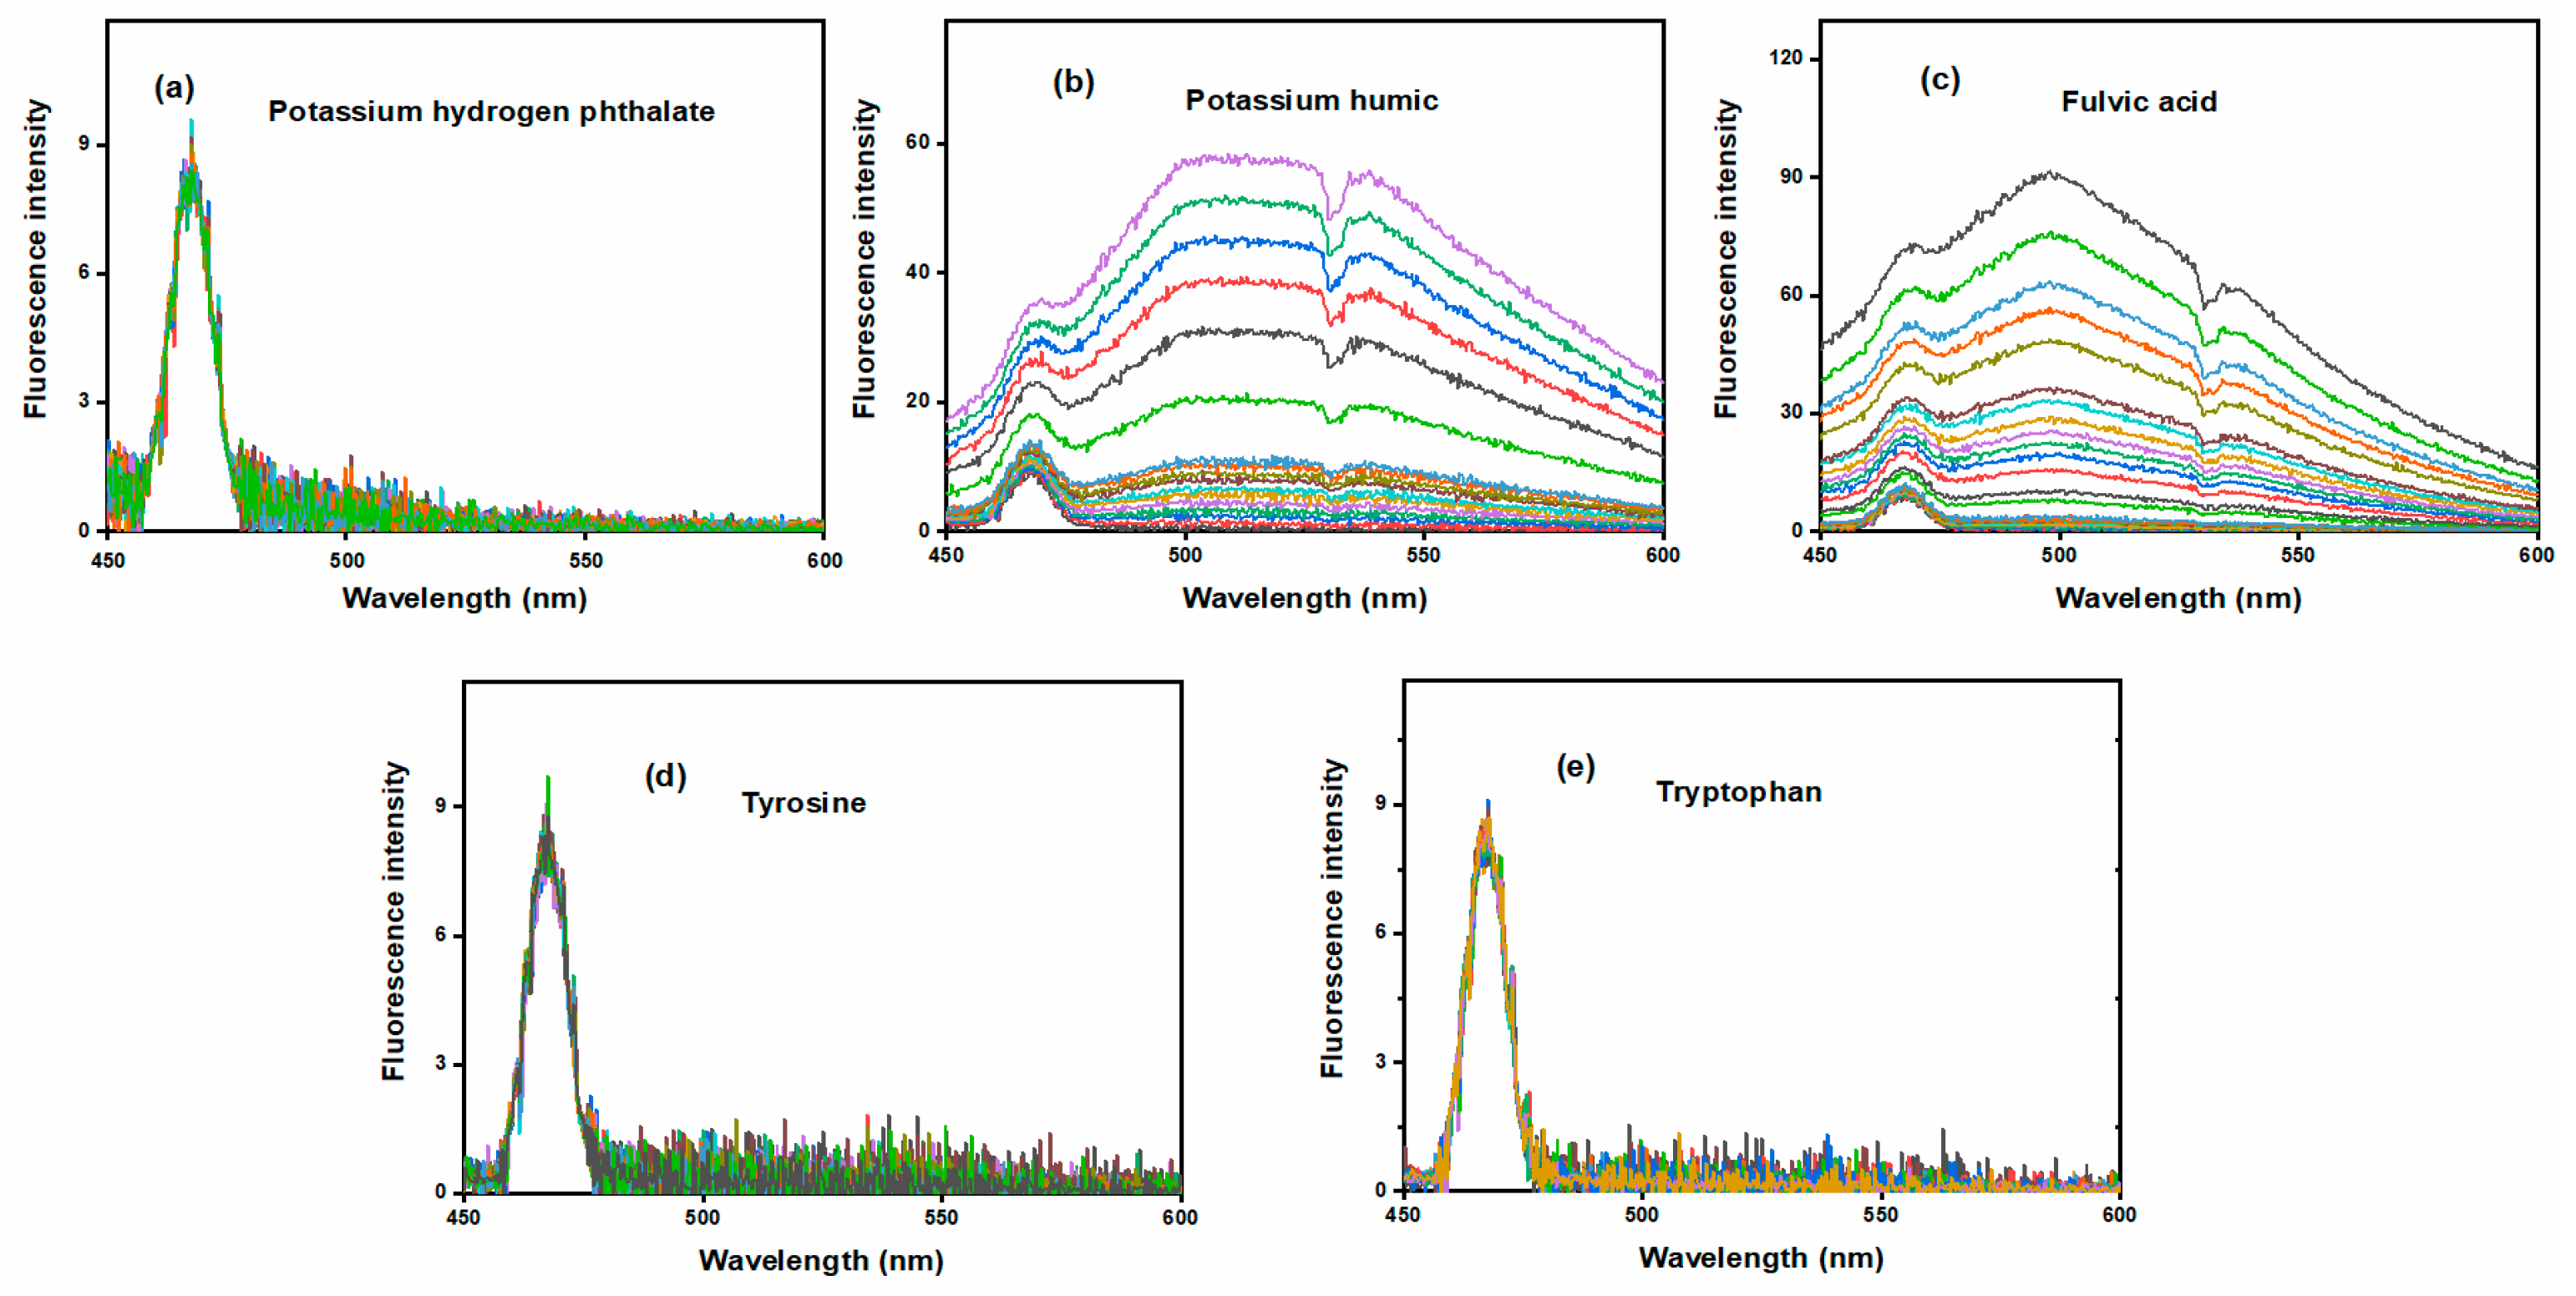
The DOC consists of a mixture of organic acids, sugars, proteins, amino acids, humic substances, and other organic matter. To create an accurate DOC model, a variety of sample solutions were prepared and the data were collected separately. These samples contained DOC components such as potassium hydrogen phthalate, potassium humate, fulvic acid, tryptophan, and tyrosine, and the fluorescence and UV properties varied between samples [
36]. It was expected that the incorporation of these data into a dataset could reflect the DOC state in seawater.
Each sample was diluted with ultrapure water to give a 100 mg/L (mg carbon per liter) solution, which was further diluted into a solution with a concentration gradient of 0-25 mg/L. Part of the spectral data were removed owing to sample characteristics, such as the easy distortion of the spectral data of high-concentration potassium humate solution, and 109 sample solutions were configured.
UV absorption spectroscopy was used to measure the various sample solutions, with 10 single scans being collected for each sample to obtain average values. Three measurements were carried out for each group of samples to avoid errors. In addition, shading was performed throughout the measurement process in order to avoid the influence of ambient light on the test results and to ensure the consistency of the acquisition environment.
LIF was also used to measure the various sample solutions. For this purpose, an integration time of 100 ms was employed during the measurement process, and 10 single scans were recorded in each case to obtain the average value. Three measurements were carried out for each group of samples to avoid errors. To ensure the consistency of the collection environment, the entire measurement set-up was covered with a special aluminum plate to avoid the production of fluorescence by other compounds during collection, which could ultimately affect the measurement results.
The ultraviolet and fluorescence spectra of each sample are shown in
Figure 2 and
Figure 3, respectively. Samples with higher concentrations exhibit stronger absorbance and fluorescence intensity.
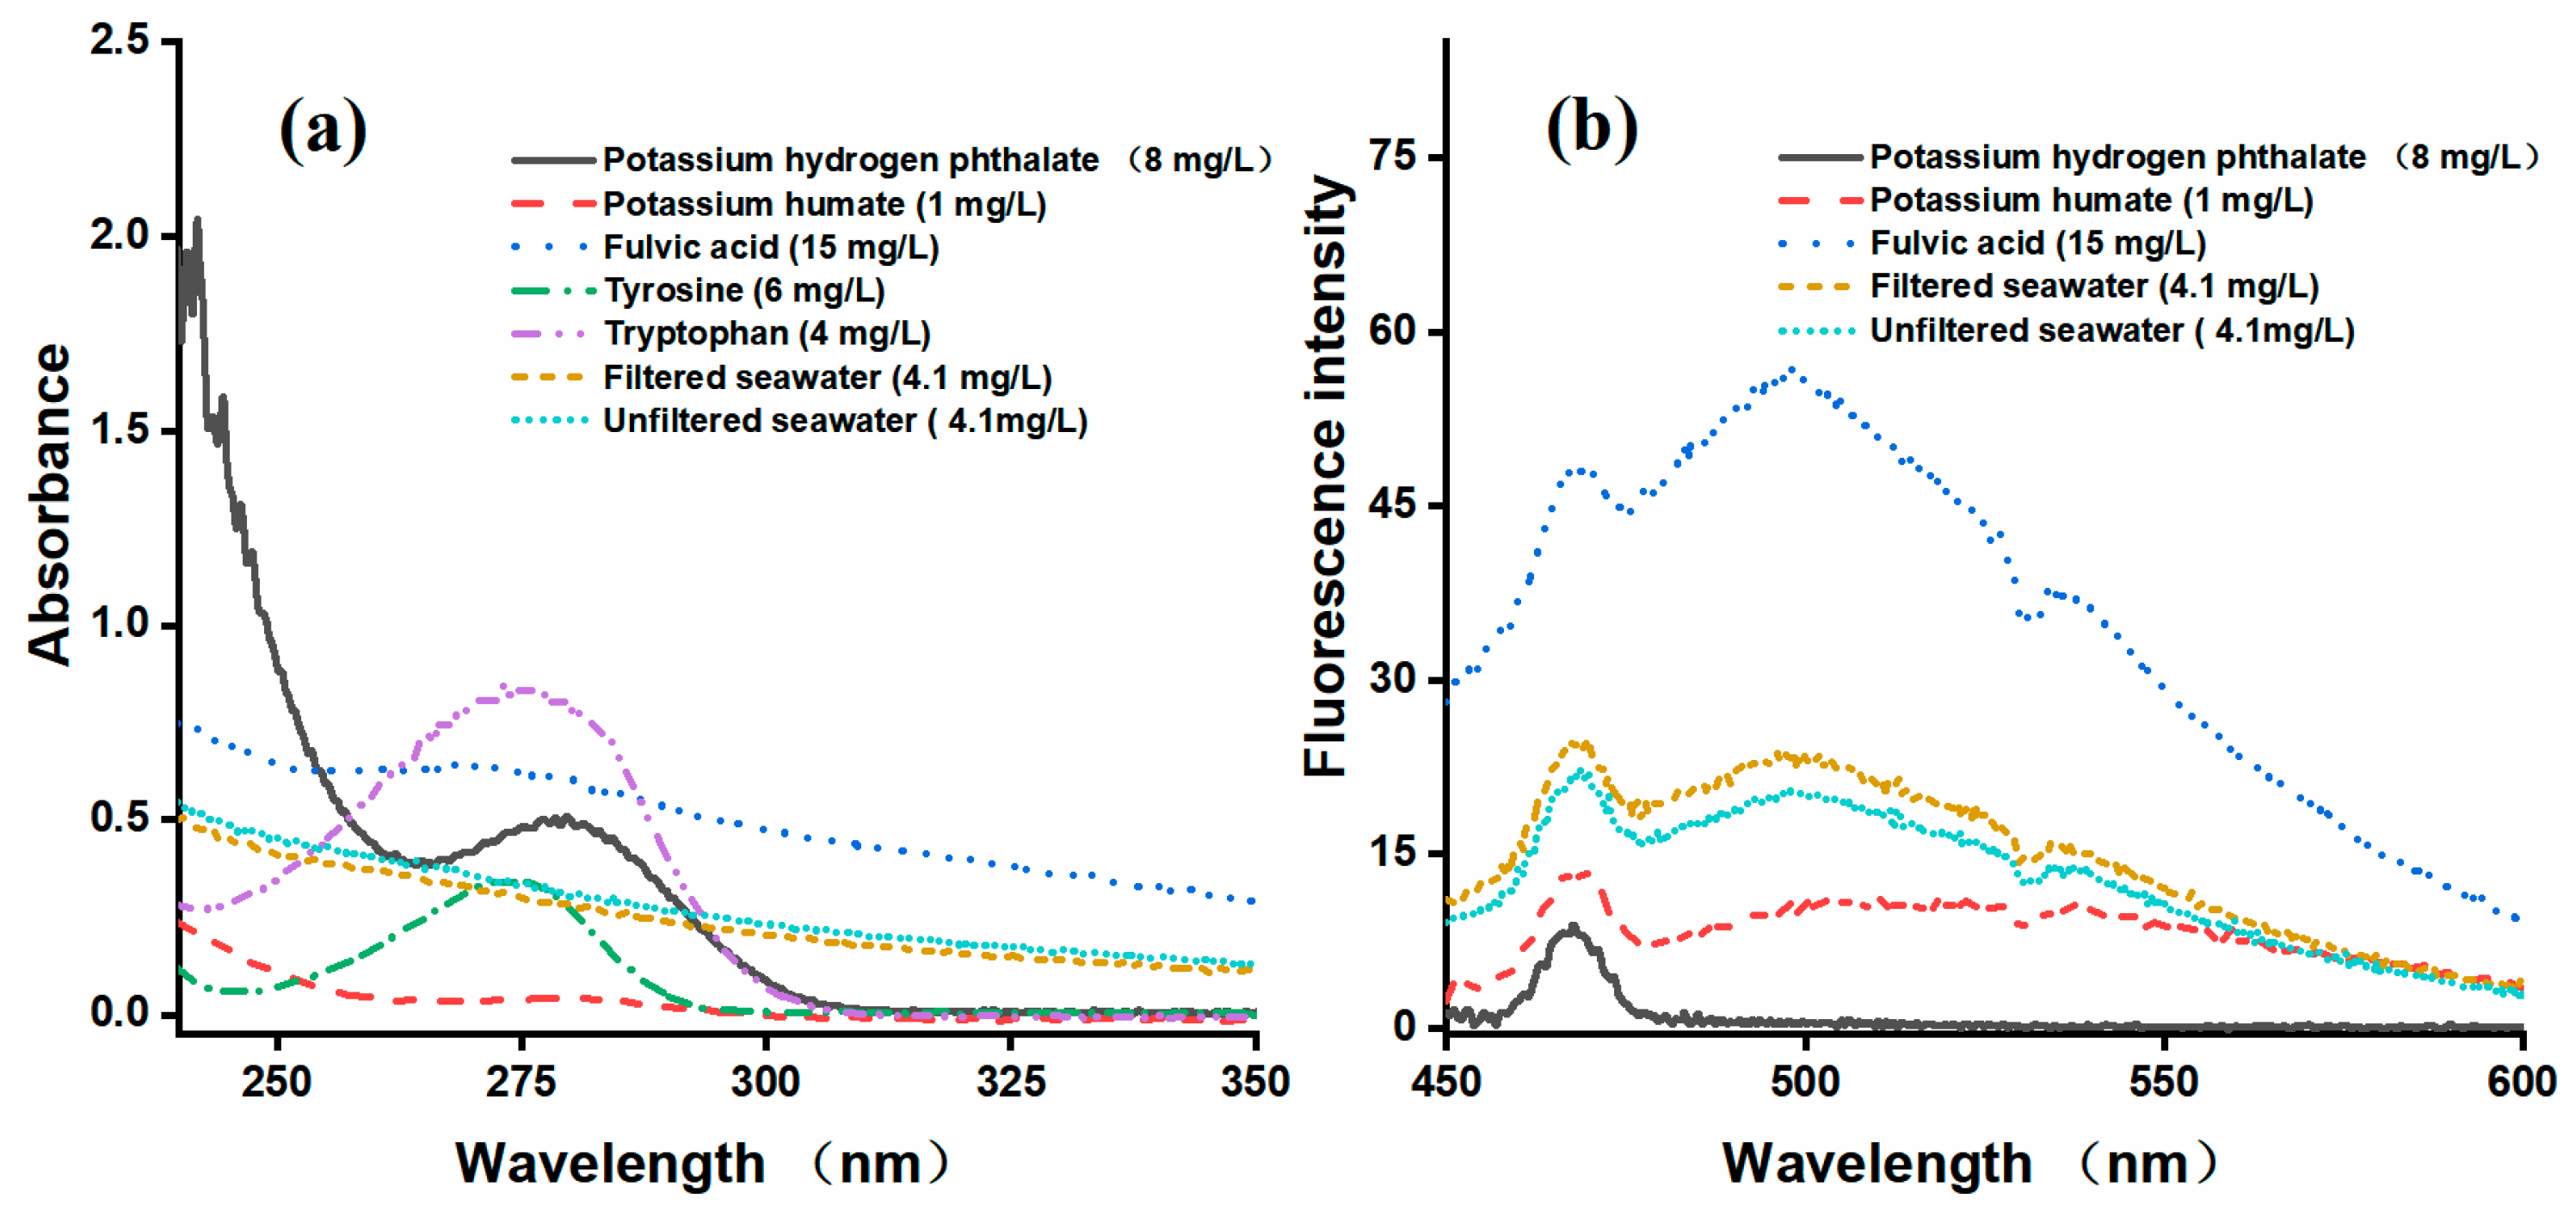
All samples were measured simultaneously using the UV and LIF approaches to avoid the influence of environmental factors and time differences. A selection of spectral data plots are shown in
Figure 4a,b. More specifically,
Figure 4(a) shows the UV absorption spectra of various laboratory samples, the filtered seawater, and the unfiltered seawater, while
Figure 4(b) shows their corresponding fluorescence spectra. Potassium hydrogen phthalate, tryptophan, and tyrosine exhibited no fluorescence and their spectra overlapped. To enhance clarity, only the spectral curve of potassium hydrogen phthalate remains in the fluorescent fraction.
3.2. Data Analysis
For the purpose of this study, the analytical process was separated into three main parts. Firstly, PCA was used to extract the UV absorption and fluorescence spectroscopy data of all samples separately. The features of the same samples were then fused to form a new dataset, and the DOC detection model was constructed using a CNN. Finally, Bayesian correction was applied to the predicted seawater data to obtain the accurate DOC concentrations.
3.2.1. Principal Component Analysis for Feature Extraction
PCA is a commonly used data dimension reduction technique based on the transformation of raw data into a set of linearly irrelevant principal components through linear transformation. These components are arranged in order of a decreasing variance size, retaining the most important information in the data [
37]. In the context of spectral data, PCA can help extract the main components that best represent any data changes, thereby enabling data dimension reduction and feature extraction. As shown in
Figure 4a, the UV data fluctuated significantly from 250 to 300 nm, and from
Figure 4b, it can be seen that the fluorescence data fluctuated between 500 and 570 nm. Therefore, these wavelength ranges were selected as the datasets for constructing the DOC detection model. Each sample in the UV dataset contained 151 data points, while each sample in the fluorescence dataset contained 227 data points.
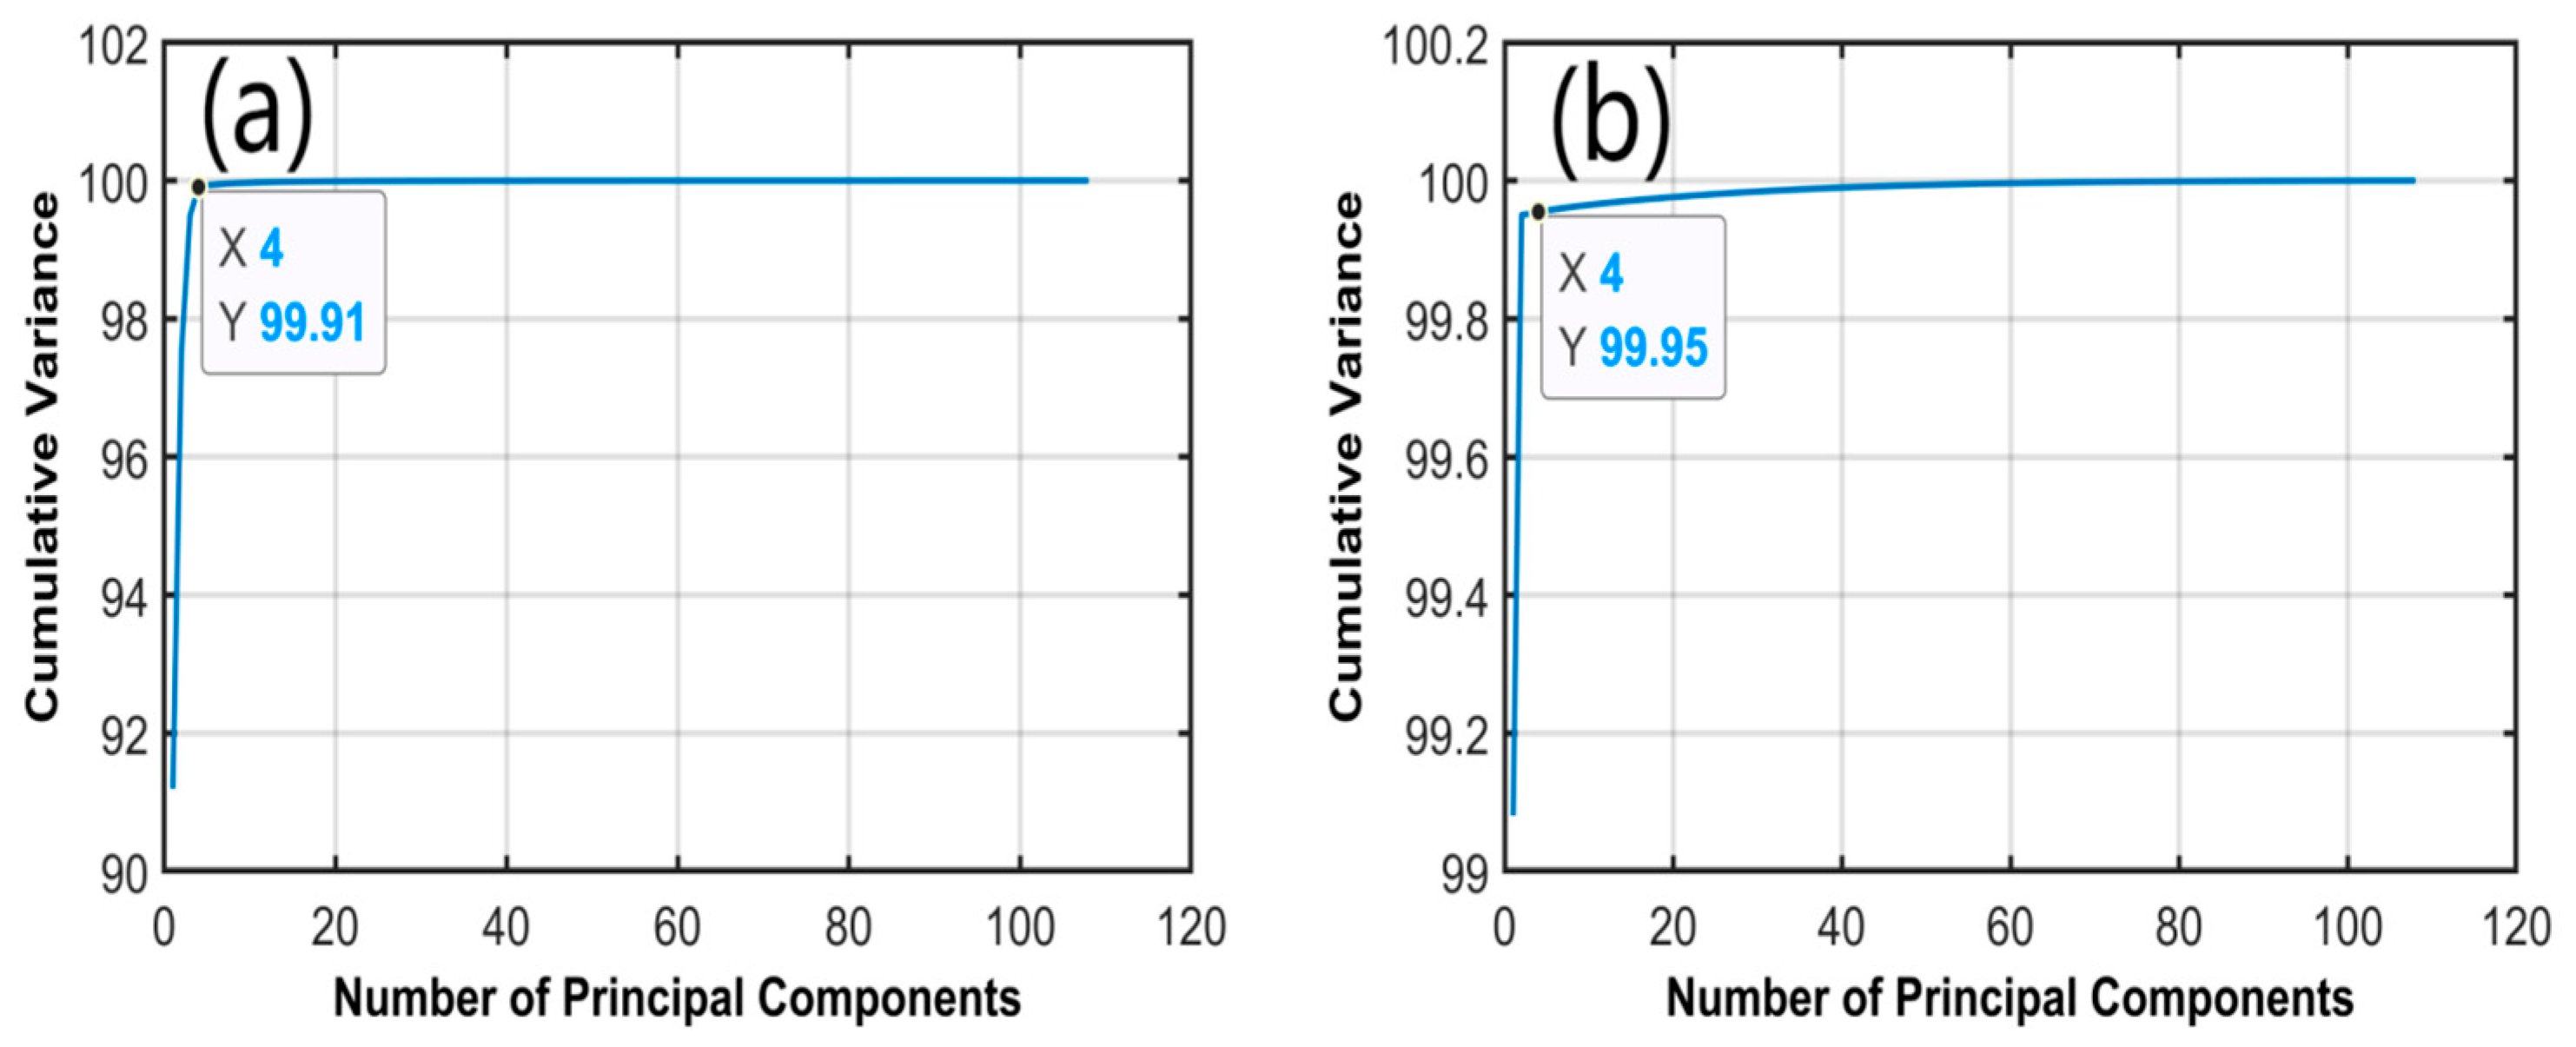
Following data selection, PCA was performed on the fluorescence and UV absorption data, ranking the feature vectors according to the size of the variance, and extracting the most important features from the data. The first four features of the fluorescence data and the first four features of the UV absorption data were extracted as inputs to the CNN. The cumulative variance of the first four features in the fluorescence and UV absorption data was 99.91% and 99.95%, respectively (
Figure 5a,b). These values are expected to sufficiently retain the main information from the original data.
3.2.2. PCA-CNN Detection Model
The dimensions of the fluorescence and UV absorption spectra treated with PCA were 109 × 4 and 109 × 4, respectively. Two sets of data were combined as the input data for the CNN, and the total size of the input data was 109 × 8. The output data were the corresponding concentrations, with a size of 109 × 1. Following data preparation, a convolution model was built and the parameters were set. The model was then trained and the simulation was predicted.
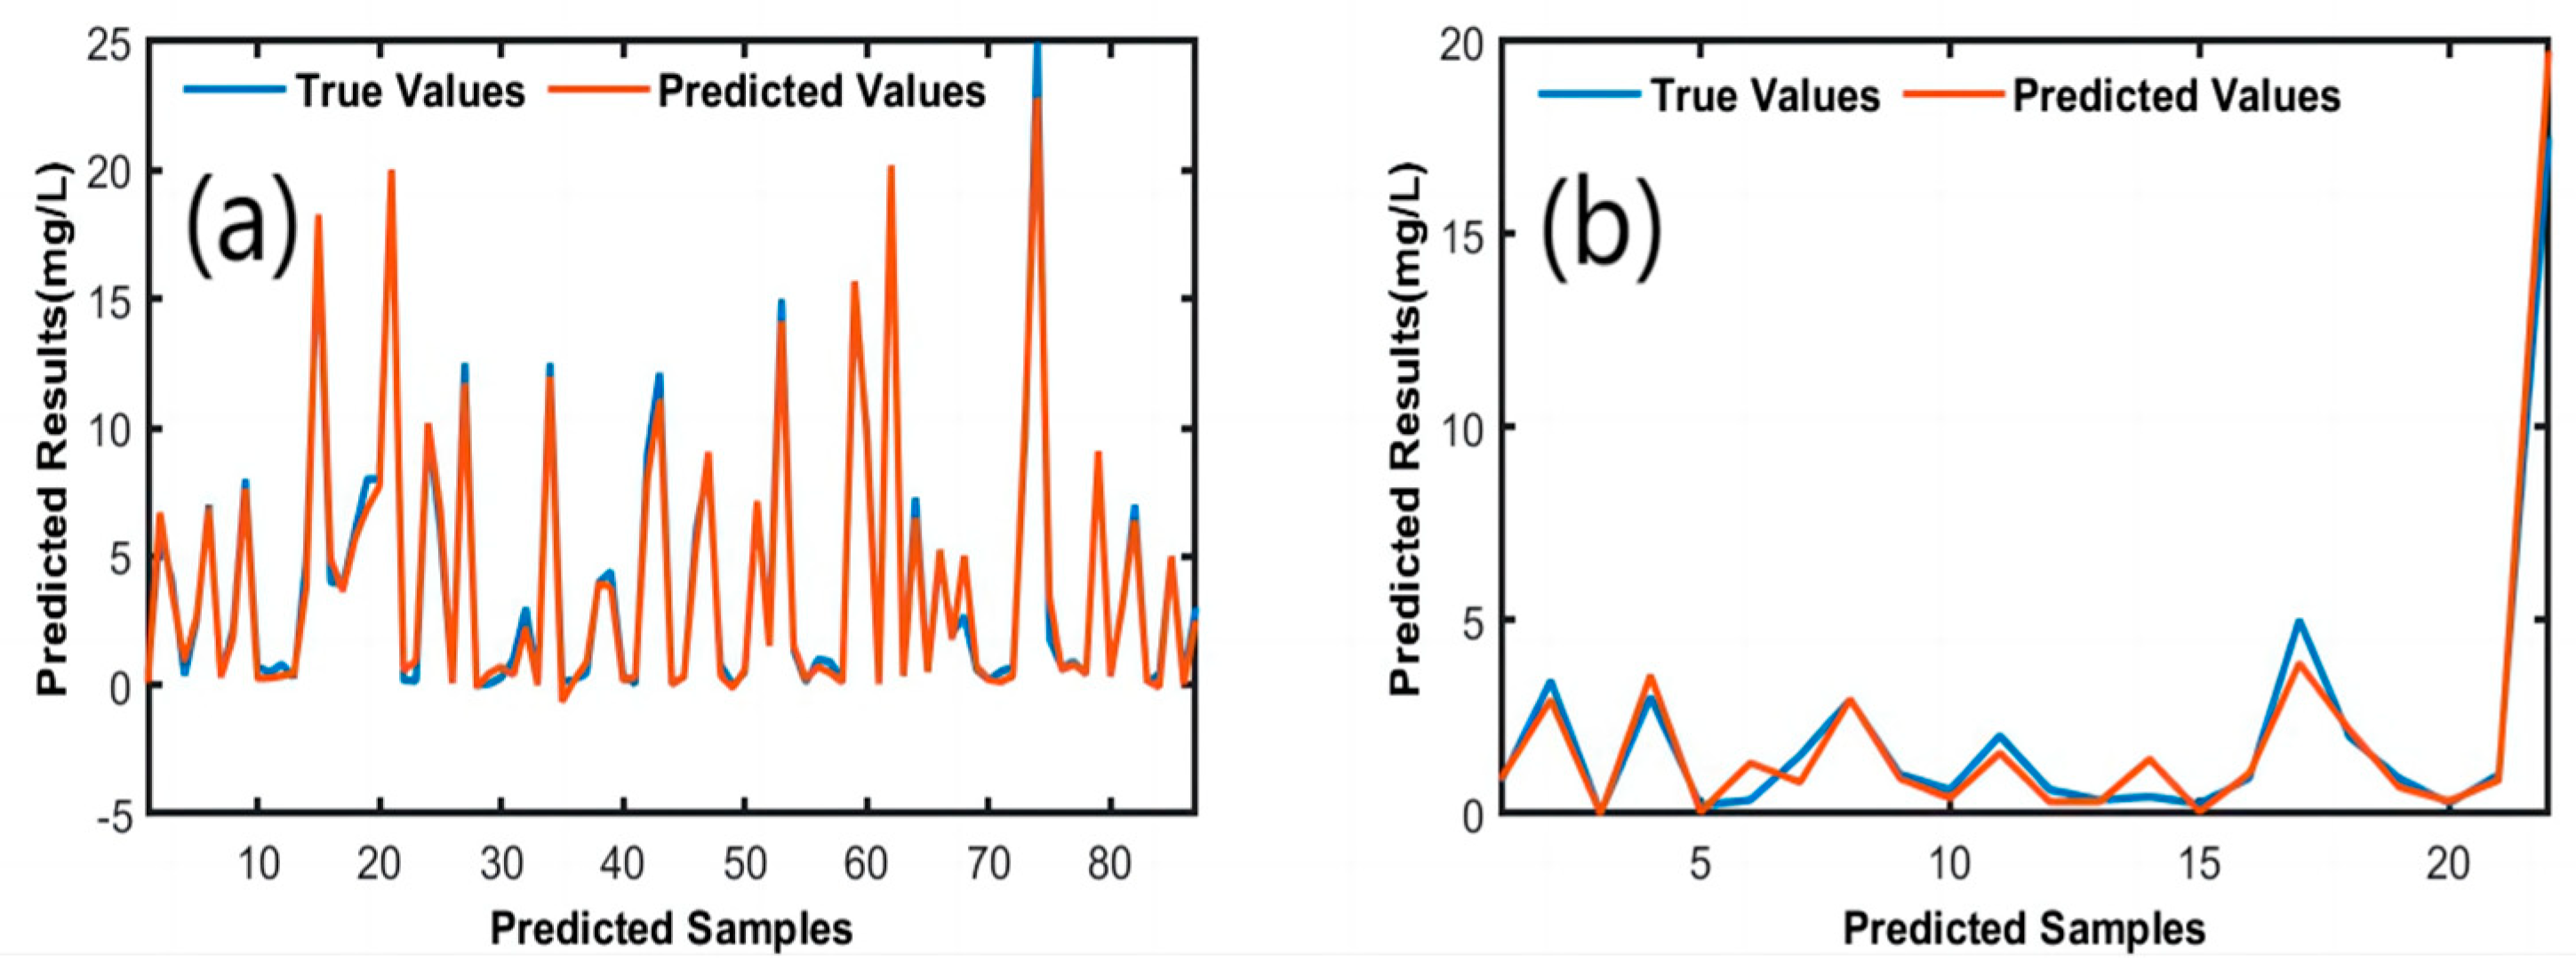
The R
2, RMSE, MSE, MBE, MAE values of the simulation training and test sets were (0.98755, 0.59335, 0.35207, -0.09002, 0.31264 and 0.96573, 0.66587, 0.44338, 0.04306, 0.42799, respectively) demonstrate the ability of the model to accurately predict the DOC concentration (
Figure 6a,b).
3.2.3. Seawater Testing
Ten sets of collected seawater samples were used to validate the accuracy and practicality of the PCA-CNN detection model. The concentrations of the filtered seawater samples and a selection of laboratory configuration samples were tested using a carbon analyzer. The laboratory samples were used to construct standard curves and to determine the accuracy of the detection model for measuring the seawater samples.
The seawater validation experiments were performed twice. The first time, five sets of filtered seawater samples were used to verify the practicability of the model, and the second time, five sets of filtered seawater samples were used to verify the accuracy of the model. After several experimental validations, a stable and reliable DOC-detection model was developed. During validation, the true concentration of the sample is compared with the predicted concentration. The true concentration was the actual concentration obtained using the total organic carbon analyzer, while the predicted value was the concentration predicted by the PAC-CNN model. The first seawater validation experiments reveal a strong linear correlation between the predicted and actual values. The associated R
2 value of 0.9731 (
Figure 7a) indicates the high accuracy of the predictive model. A second seawater test was conducted to assess the generalizability of the model. These validation experiments also reveal a strong linear correlation between the predicted and measured values, with an R2 value of 0.9698 (
Figure 7b), further confirming the reliability and accuracy of the model for detecting DOC in seawater.
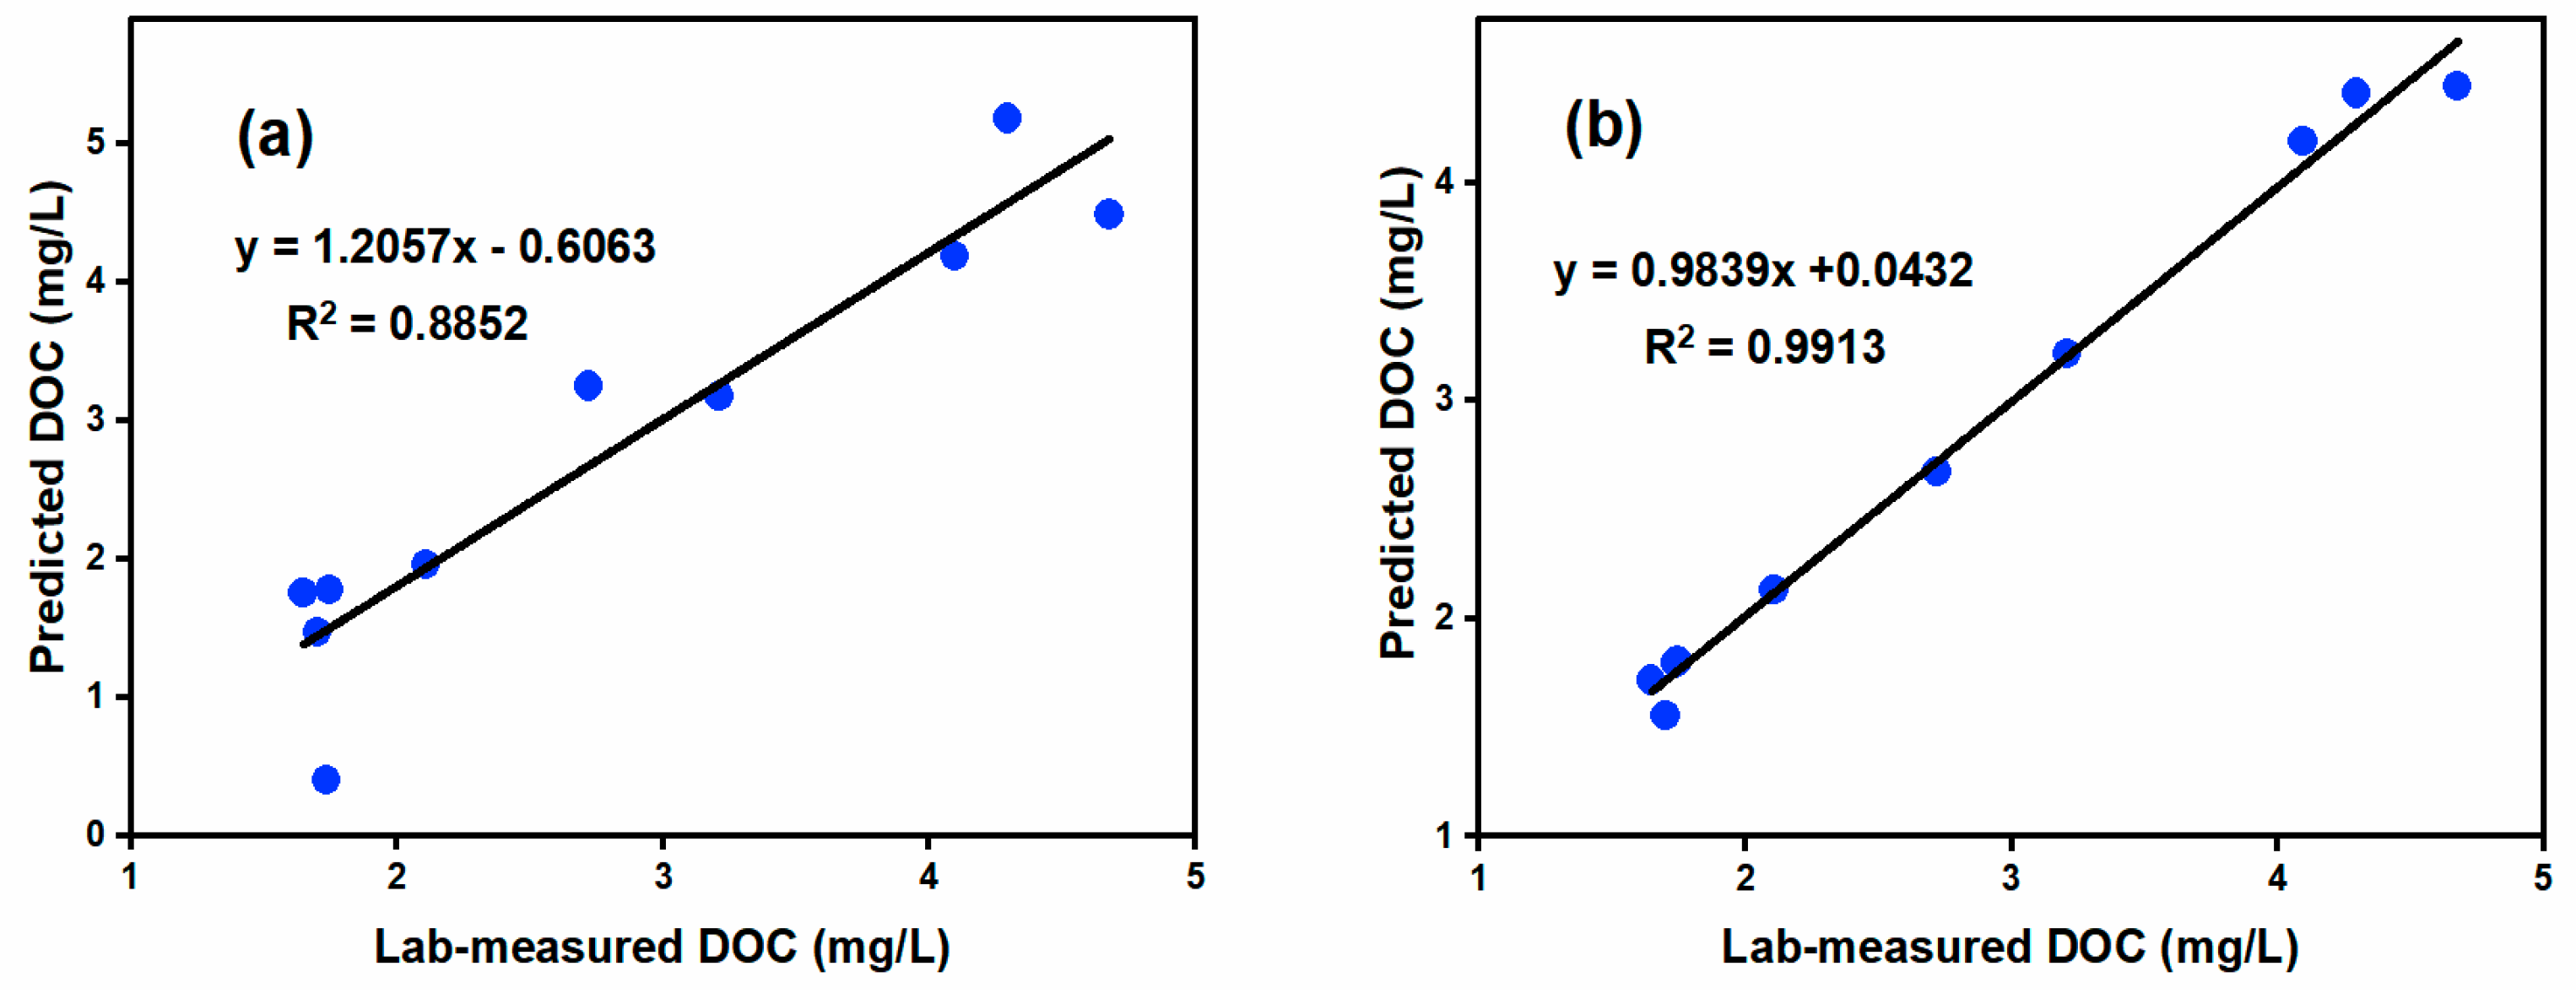
The above experiments were performed for the filtered seawater; however, considering that filtration would not be carried out using the actual optical sensor, the prediction model was used to detect the spectral data for unfiltered seawater. As presented in
Figure 8a, the experimental results indicate that there is a significant error between the predicted and actual values. The prediction accuracy decreased giving an R
2 value of 0.8852. This was clearly attributed to the presence of impurities, such as particulate matter and pigmented matter, in the unfiltered seawater, leading to inaccurate prediction results.
3.2.4. Bayesian Correction Model
To reduce or even eliminate the impact of such impurities, a Bayesian correction model was used to improve the prediction accuracy. This correction was performed twice using the first five and last five sets of seawater samples, which were used to determine the practicability and the accuracy of the model, respectively. Comparisons before and after the two seawater corrections are presented in
Table 1 and
Table 2. It can be seen from the comparison of the prediction errors that the accuracy of the predicted data shows a large improvement after correction. The correction significantly reduced the overall mean absolute error (MAE) from 15.33% to 3.24%, and the individual absolute errors were within 9%, representing a significant improvement in accuracy. With the exception of one highly contaminated sample, the detected organic carbon contents in all water samples were within 5 % error. The overall fitting results are presented in
Figure 8b, the experimental results reveal a strong linear correlation between the predicted and actual values. From
Figure 8, it can be seen that the R
2 value increased from 0.8852 to 0.9913, indicating a more accurate prediction after correction. This result further demonstrates the utility of the Bayesian correction method in improving the accuracy of DOC concentration prediction in seawater.
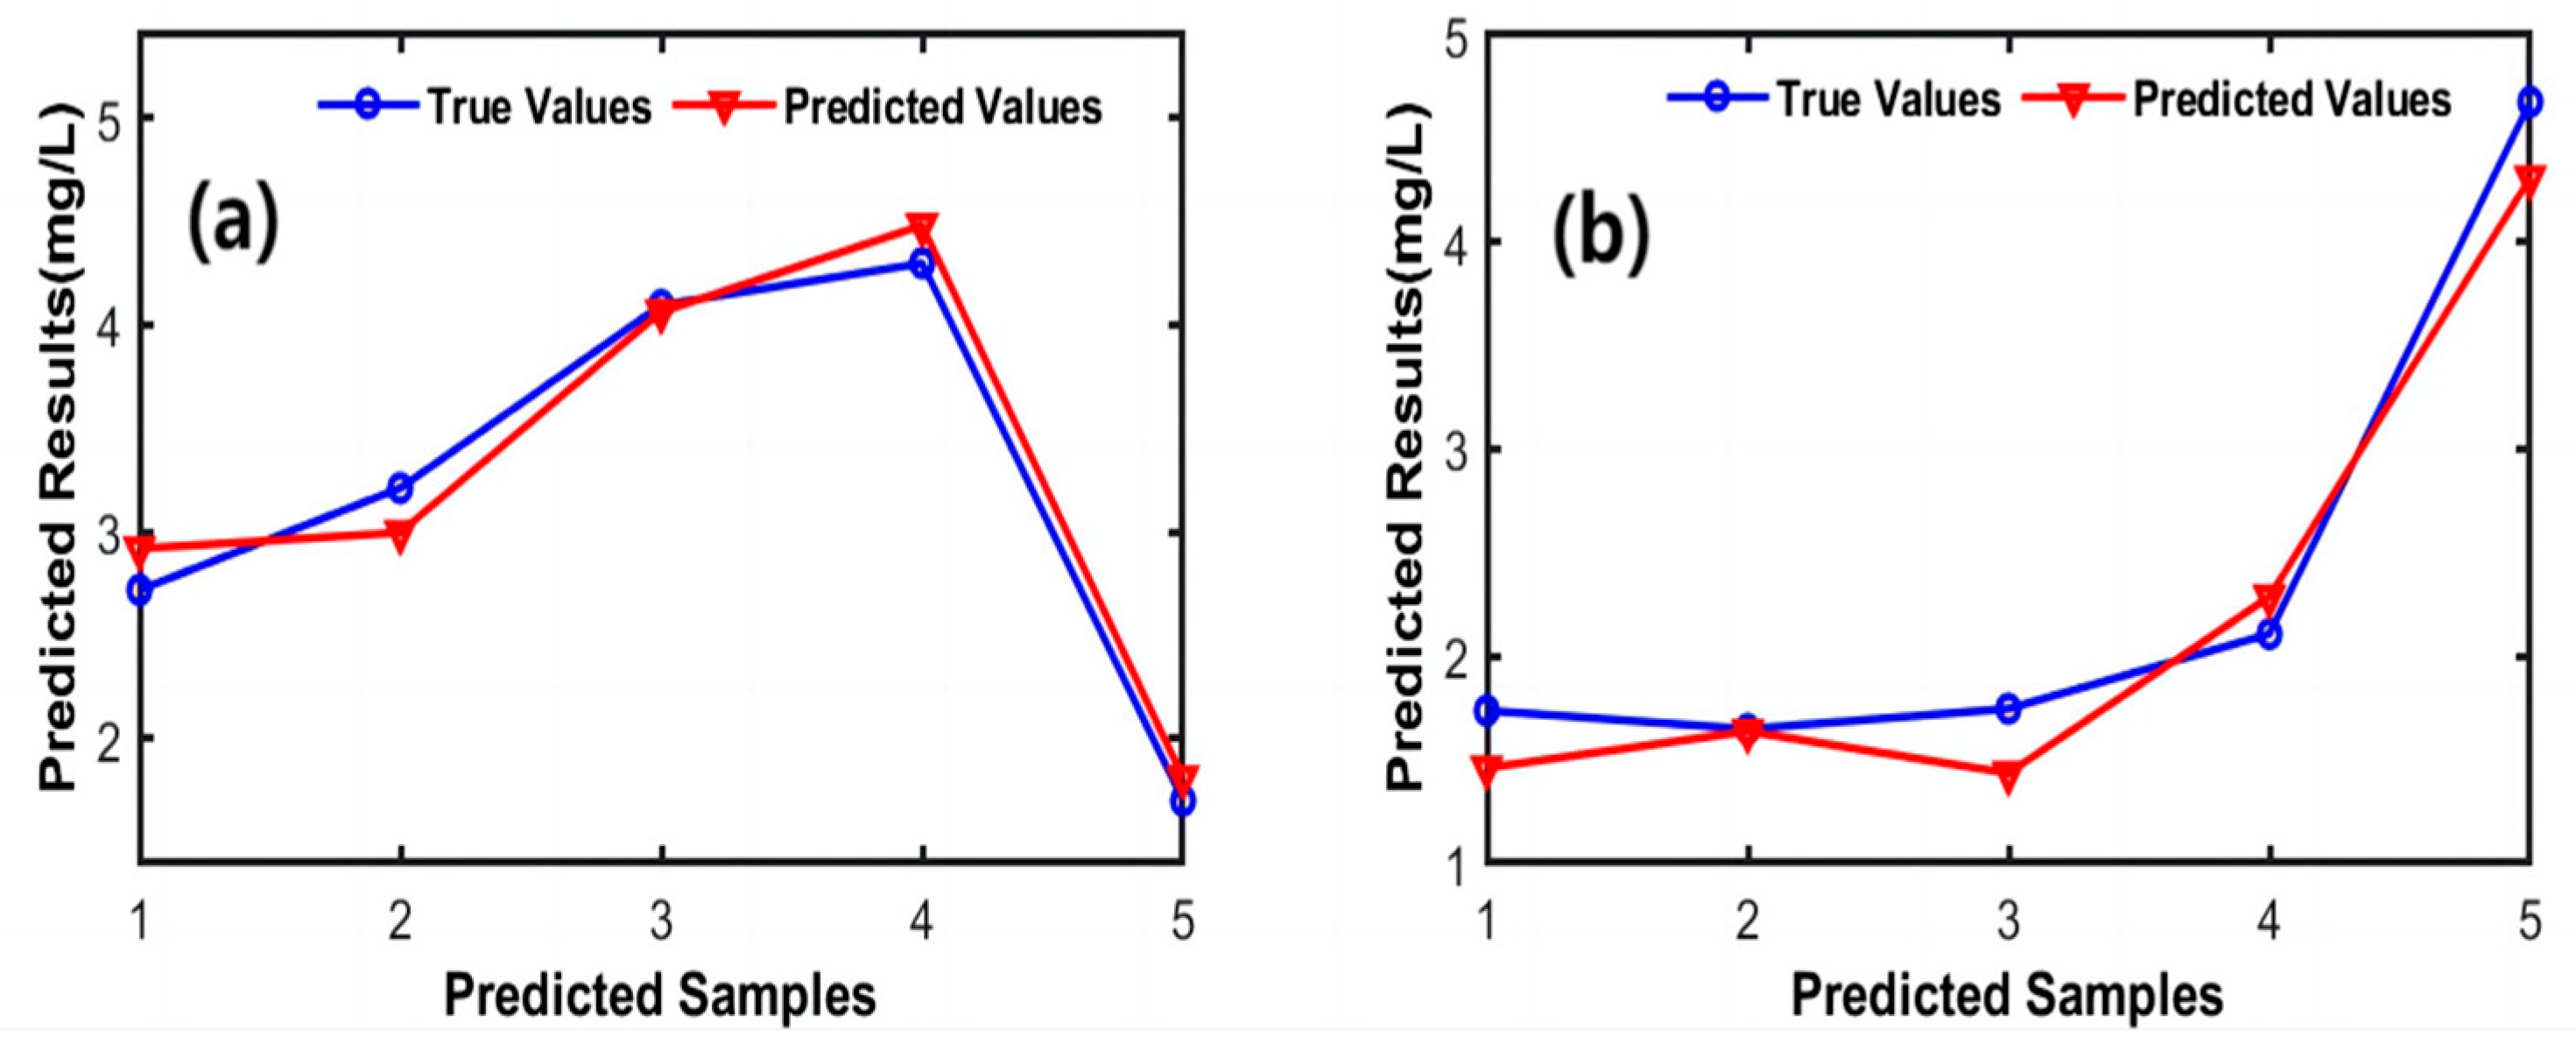
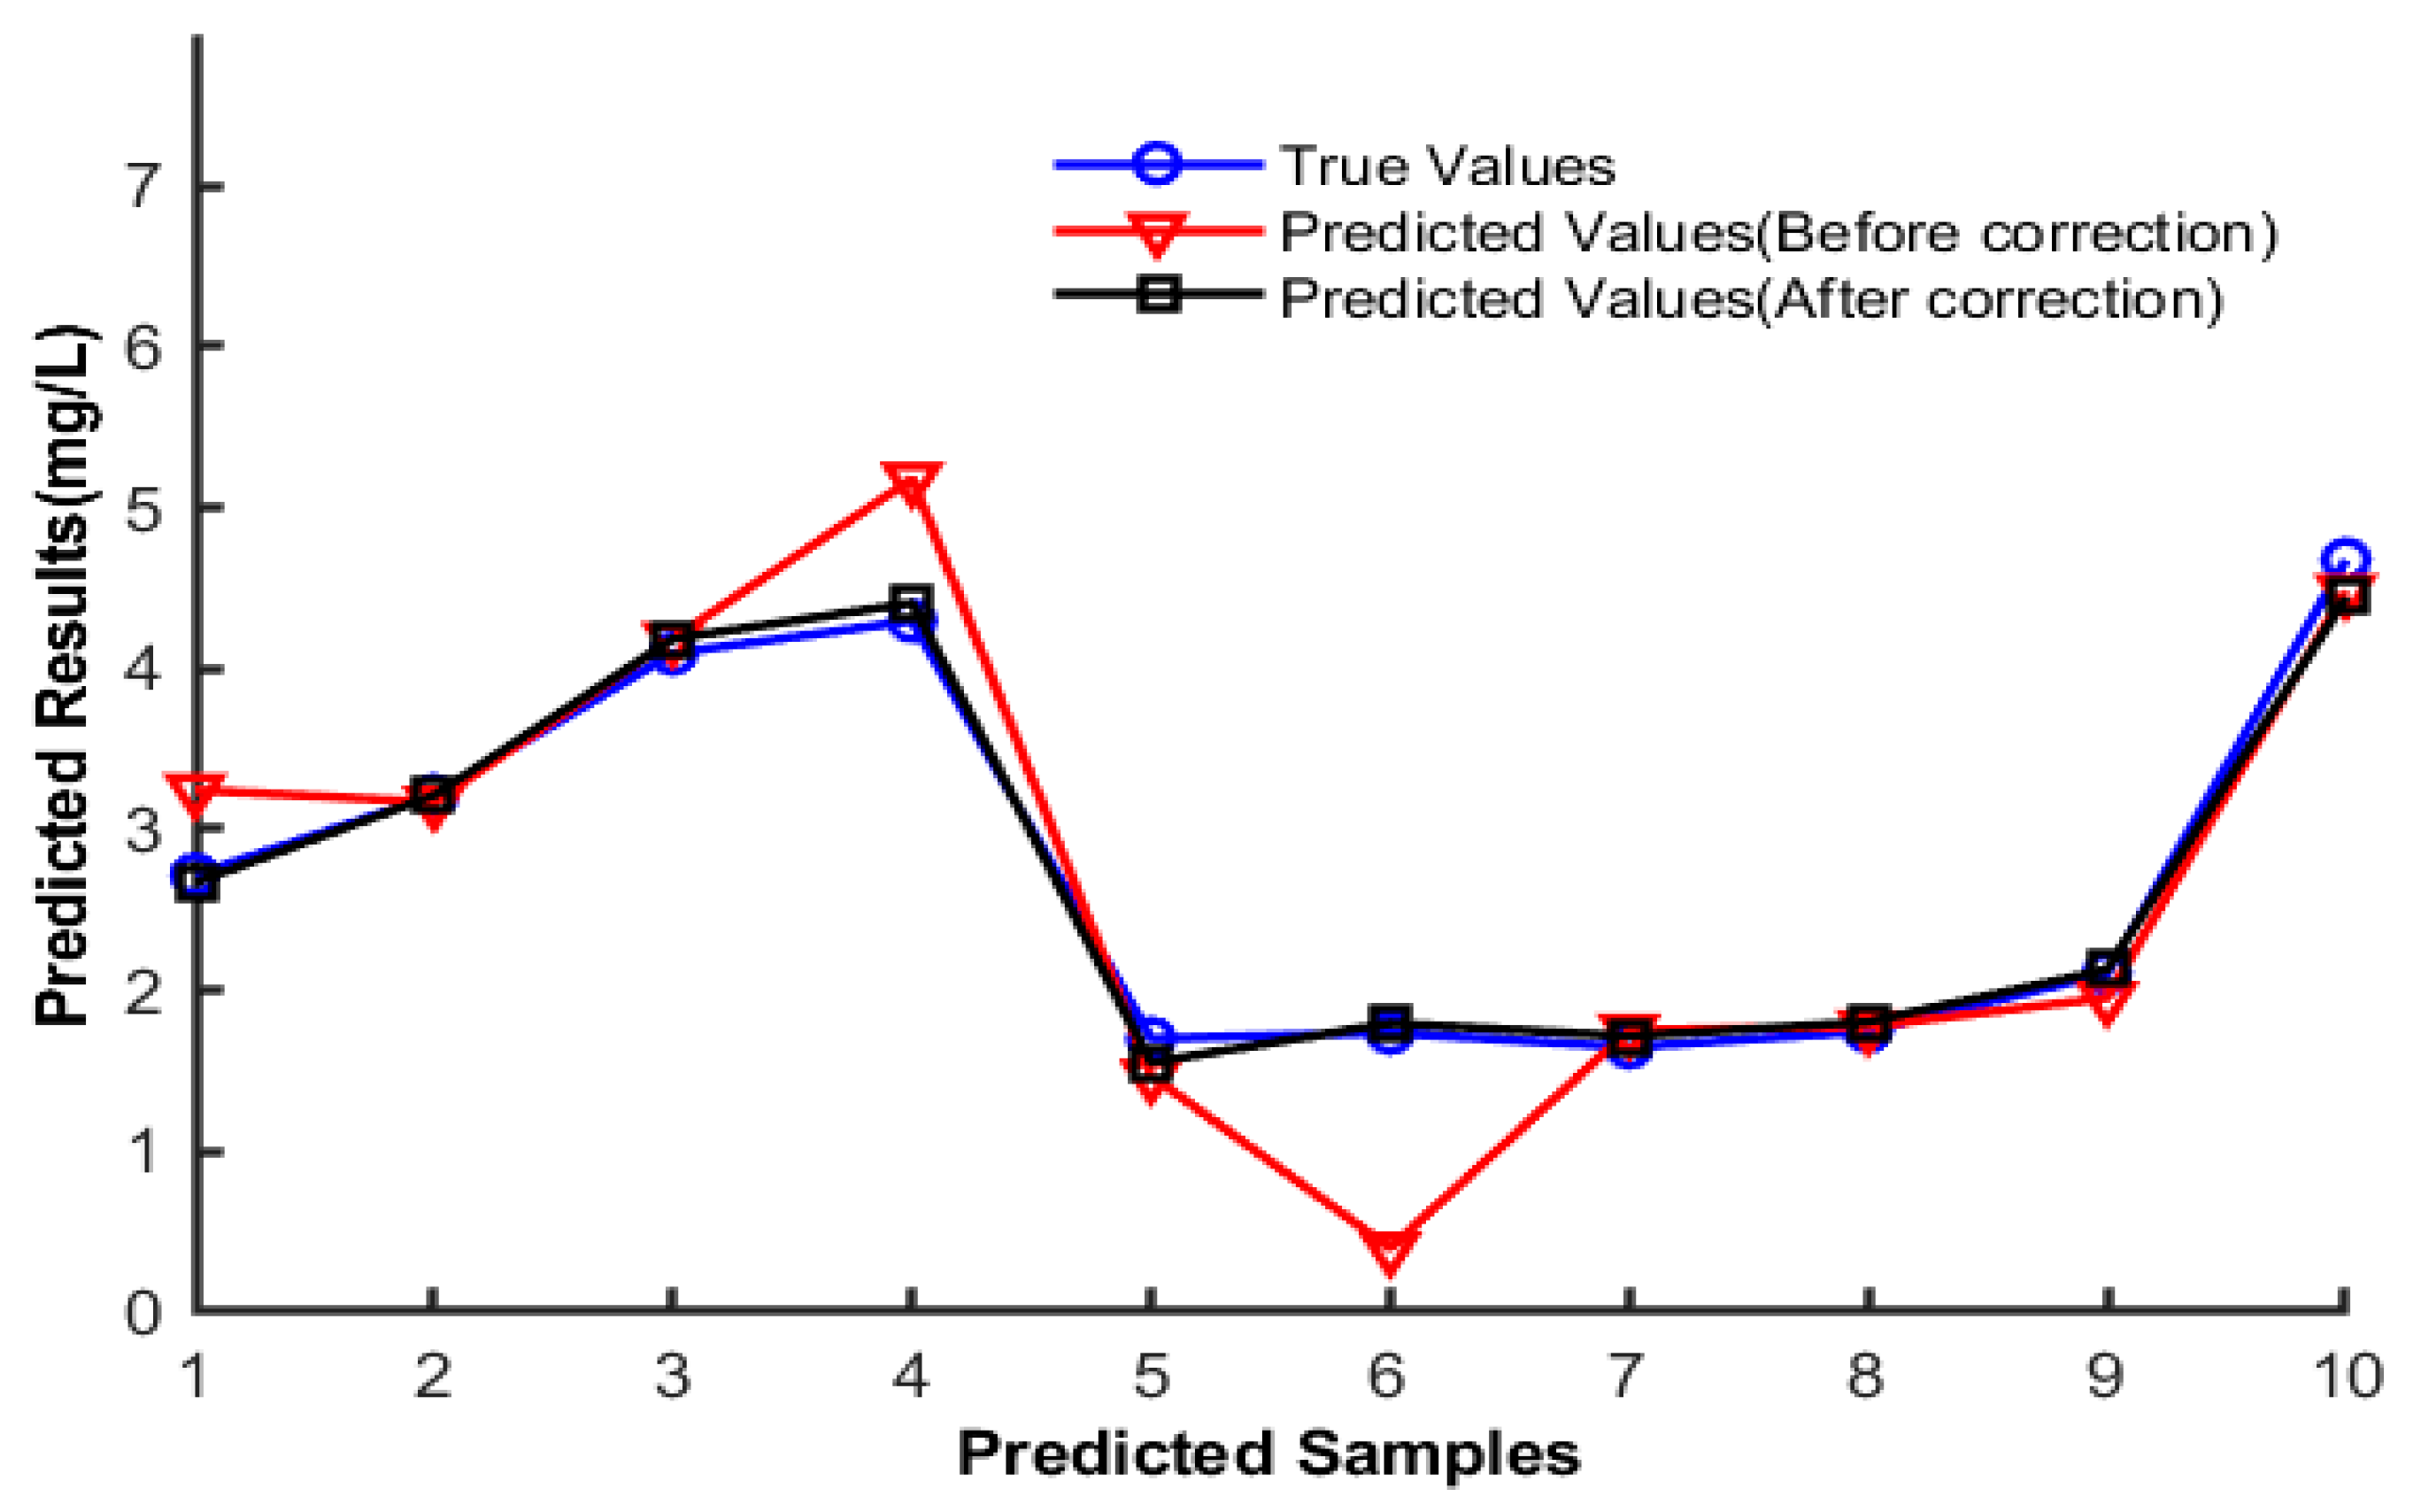
Figure 9 illustrates the relationship between the true values and those predicted before correction and after correction. The predicted values before correction, particularly those of samples 4 and 6, deviate significantly from the true values, suggesting that the uncorrected model is affected by impurities in the seawater, leading to inaccurate detection. Bayesian correction significantly enhances the agreement between the predicted and true values, especially in the case of sample 2, in which the values predicted by the corrected model were closer to the true values. This indicates that Bayesian correction effectively reduces interference from impurities, thereby improving the accuracy of the model.
4. Conclusions
A multi-source spectral fusion technique that combines principal component analysis and a convolutional neural network (PCA-CNN) was developed to detect dissolved organic carbon (DOC) in seawater. This method extracts the main components of the ultraviolet (UV) absorption spectra and the fluorescence spectra by PCA and fuses the main components of the two spectra as the input of the CNN to construct a prediction model that realizes the extraction and fusion of spectral information. The correlation coefficients (R2) of the model training and test sets were 0.98755 and 0.96573, respectively. Similarly high R2 values of 0.9698 and 0.8852 were obtained for the filtered and unfiltered seawater, respectively, using the developed method. Thus, to reduce the influence of impurities, such as particulate matter and pigments, the predicted data were corrected using the Bayesian correction method, and the corrected R2 value for DOC detection was 0.9913. The overall mean absolute error (MAE) of the method was significantly reduced from 15.33% to 3.24% by Bayesian correction, while the individual absolute errors remained within 9%. These results demonstrate that the developed method can accurately predict the DOC content of seawater. This method is advantageous in that the PCA dimensionality reduction process improves the computational efficiency, the CNN model automatically learns the spectral features and improves the prediction accuracy, the fusion of multi-source spectra provides additional information to improve the detection reliability, and the Bayesian correction method overcomes the influence of impurities in seawater to improve the detection accuracy. The results of this study provide a novel method for the detection and monitoring of DOC in seawater that can be used for environmental monitoring and scientific research. Further refinement of the method is expected to broaden its application prospects.
Supplementary Materials
The following supporting information can be downloaded at: Preprints.org.
Author Contributions
All authors contributed to the study’s conception and design. Materials preparation, Data Collection, and Data Analysis were performed by X.C., F.X., Y.W., H. M., Y.Z., Y. L., X.K., J.W., Q.S., P.F., Y.L., N.W. Writing – First Draft: F.X. All authors commented on previous versions of the manuscript. All authors read and approved the final manuscript
Funding
This work was supported by the Major Innovation Project for the Science Education Industry Integration Pilot Project of Qilu University of Technology (Shandong Academy of Sciences) (Grant No. 2023HYZX01); Qingdao Natural Science Foundation (Grant No. 23-2-1-211-zyyd-jch ); Major Innovation Project for the Science Education Industry Integration Pilot Project of Qilu University of Technology (Shandong Academy of Sciences) (Grant No.2023JBZ02); Major Innovation Project for the Science Education Industry Integration Pilot Project of Qilu University of Technology (Shandong Academy of Sciences) (Grant No.2023JBZ03); Key Research and Development Plan of Shandong Province (Grant No. SDZLYSTD2022); Key Research and Development Plan of Shandong Province (Grant No. 2021CXGC010705); Scientific and Technological Innovation projects for Laoshan Laboratory (Grant No. LSKJ202204603); Scientific and Technological Innovation projects for Laoshan Laboratory (Grant No. LSKJ202204700 ); The National Key R&D Program of China (Grant No. 2021YFB3901300).
Conflicts of Interest
The authors declare no conflicts of interest. The funders had no role in the design of the study; in the collection, analyses, or interpretation of data; in the writing of the manuscript; or in the decision to publish the results.
References
- Dai, M.; Yin, Z.; Meng, F.; Liu, Q.; Cai, W.-J. Spatial distribution of riverine DOC inputs to the ocean: an updated global synthesis. COSUST, 2012, 4, 170–178. [Google Scholar] [CrossRef]
- Kim, Y. C.; Cramer, J. A.; Booksh, K. S. Investigation of a fiber optic surface plasmon spectroscopy in conjunction with conductivity as an in situ method for simultaneously monitoring changes in dissolved organic carbon and salinity in coastal waters. Analyst, 2011, 136, 4350–4356. [Google Scholar] [CrossRef] [PubMed]
- Pan, D.; Liu, Q.; Bai, Y. Review and suggestions for estimating particulate organic carbon and dissolved organic carbon inventories in the ocean using remote sensing data. AOS, 2014, 33, 1–10. [Google Scholar] [CrossRef]
- Sharp, J. H.; Carlson, C. A.; Peltzer, E. T.; Castle-Ward, D. M.; Savidge, K. B.; Rinker, K. R. Final dissolved organic carbon broad community intercalibration and preliminary use of DOC reference materials. Mar. Chem., 2002, 77, 239–253. [Google Scholar] [CrossRef]
- Wangersky P., J. Dissolved organic carbon methods: a critical review. Marine Chemistry, 1993, 41, 61–74. [Google Scholar] [CrossRef]
- Sharp, J. H.; Carlson, C. A.; Peltzer, E. T.; Castle-Ward, D. M.; Savidge, K. B.; Rinker, K. R. Final dissolved organic carbon broad community intercalibration and preliminary use of DOC reference materials. Marine Chemistry, 2002, 77, 239–253. [Google Scholar] [CrossRef]
- Maestre S. E., Mora J., Hernandis V.& Todolí J. L. A system for the direct determination of the nonvolatile organic carbon, dissolved organic carbon, and inorganic carbon in water samples through inductively coupled plasma atomic emission spectrometry. Analytical Chemistry, 75, 111-117.
- Spyres G., Nimmo M., Worsfold P. J., Achterberg E. P.& Miller A. E. J. Determination of dissolved organic carbon in seawater using high temperature catalytic oxidation techniques. Trac Trends in Analytical Chemistry, 19, 498-506.
- Yoon, G.; Park, S.; Yang, H.; Tsang, D. C.; Alessi, D. S.; Baek, K. Selection criteria for oxidation method in total organic carbon measurement. Chemosphere 2018, 199, 453–458. [Google Scholar] [CrossRef]
- Carter, H. T.; Tipping, E.; Koprivnjak, J.; Miller, M. P.; Cookson, B.; Hamilton-Taylor, J. Freshwater DOM quantity and quality from a two-component model of UV absorbance. Water Research, 2012, 46, 4532–4542. [Google Scholar] [CrossRef]
- Avagyan, A.; Runkle, B. R.; Kutzbach, L. Application of high-resolution spectral absorbance measurements to determine dissolved organic carbon concentration in remote areas. Journal of Hydrology, 2014, 517, 435–446. [Google Scholar] [CrossRef]
- Baker, A.; Spencer, R. G. Characterization of dissolved organic matter from source to sea using fluorescence and absorbance spectroscopy. Science of the Total Environment, 2004, 333, 217–232. [Google Scholar] [CrossRef]
- Wallage, Z. E.; Holden, J. Spatial and temporal variability in the relationship between water colour and dissolved organic carbon in blanket peat pore waters. Science of the Total Environment, 2010, 408, 6235–6242. [Google Scholar] [CrossRef] [PubMed]
- Kröckel, L.; Schwotzer, G.; Lehmann, H.; Wieduwilt, T. Spectral optical monitoring of nitrate in inland and seawater with miniaturized optical components. Water Res., 2011, 45, 1423–1431. [Google Scholar] [CrossRef] [PubMed]
- Li, J.; Tong, Y.; Guan, L.; Wu, W.; Li, D. A turbidity compensation method for COD measurements by UV–vis spectroscopy. Optik, 2019, 186, 129–136. [Google Scholar] [CrossRef]
- Yao, Y.; Li, Y.-Z.; Guo, X.-J.; Huang, T.; Gao, P. P.; Zhang, Y. P.; Yuan, F. Changes and characteristics of dissolved organic matter in a constructed wetland system using fluorescence spectroscopy. Environ. Sci. Pollut. Res. Int., 2016, 23, 12237–12245. [Google Scholar] [CrossRef] [PubMed]
- Li, G.; Yifei, T.; Jingwei, L.; Wu, S. Online COD measurement based on multi-source spectral feature-level fusion model. IOP Conf. Ser. Earth Environ. Sci., 2021, 781, 032022. [Google Scholar] [CrossRef]
- Dupuy, N.; Galtier, O.; Ollivier, D.; Vanloot, P.; Artaud, J. Comparison between NIR, MIR, concatenated NIR and MIR analysis and hierarchical PLS model. Application to virgin olive oil analysis. Anal. Chim. Acta, 2010, 666, 23–31. [Google Scholar]
- Martelo-Vidal, M. J.; Vázquez, M. Application of artificial neural networks coupled to UV–VIS–NIR spectroscopy for the rapid quantification of wine compounds in aqueous mixtures. CyTA – J. Food, 2015, 13, 32–39. [Google Scholar] [CrossRef]
- Hur, J.; Cho, J. Prediction of BOD, COD, and total nitrogen concentrations in a typical urban river using a fluorescence excitation-emission matrix with PARAFAC and UV absorption indices. Sensors, 2012, 12, 972–986. [Google Scholar] [CrossRef]
- Zhonghao, X. The study of advantages and applications of convolutional neural networks in computer vision tasks. ICIAAI, 2023. [CrossRef]
- Mahsa, M.; Mohammadreza, K. K. Application of robust principal component analysis–multivariate adaptive regression splines for the determination of °API gravity in crude oil samples using ATR-FTIR spectroscopy. Arab. J. Chem., 2023, 16.
- Rossat, D.; Baroth, J.; Briffaut, M.; Dufour, F.; Monteil, A.; Masson, B.; Michel-Ponnelle, S. Bayesian inference with correction of model bias for Thermo-hydro-mechanical models of large concrete structures. Eng. Struct., 2023, 278, 115433. [Google Scholar] [CrossRef]
- Yan, P.; Li, G.; Wang, W.; Zhao, Y. Qualitative and quantitative detection of microplastics in soil based on LIF technology combined with OOA-ELM/SPA-PLS. Microchem. J., 2024, 201, 110632. [Google Scholar] [CrossRef]
- Monedero, R. D.; Mezher, M. A.; Colomé, C. X.; Forné, J.; Soriano, M. Efficient k-anonymous microaggregation of multivariate numerical data via principal component analysis. Inf. Sci., 2019, 503, 417–443. [Google Scholar] [CrossRef]
- Zhou, H.; Sun, Q. Research on principle and application of convolutional neural networks. IOP Conf. Ser.: Earth Environ. Sci., 2020, 440, 042055. [Google Scholar] [CrossRef]
- Shukla S, Deo S B, Nemichand, et al. Spatially Resolved Fibre-Optic Probe for Cervical Precancer Detection Using Fluorescence Spectroscopy and PCA-ANN-Based Classification Algorithm: An In Vitro Study. Journal of biophotonics, 2024, e202400284.
- Barrera G J L, Zamora M A S, Carrazana N C J, et al. Chemometric analysis using infrared spectroscopy and PCA-LDA for early diagnosis of Fusariumoxysporum in tomato. Journal of Plant Diseases and Protection, 2024, (prepublish):1-18.
- Shao, Z.; Mei, X.; Liu, T.; et al. Trend Prediction and Operation Alarm Model Based on PCA-Based MTL and AM for the Operating Parameters of a Water Pumping Station. Sensors 2024, 24, 5416–5416. [Google Scholar] [CrossRef] [PubMed]
- Huynh C T, Hoang D N, Pham Q Q, et al. Electromechanical admittance-based automatic damage assessment in plate structures via one-dimensional CNN-based deep learning models. Frontiers of Structural and Civil Engineering, 2024, (prepublish):1-22.
- Nam J, Chang I, Lim S J, et al.Multispectral pattern camouflage materials based on PU/Al-flake composite: A CNN-based evaluation. Applied Surface Science, 2025, 680161436-161436.
- Belyaev, N.; Fedulov, V. Y.; Kravchishina, M.; Shchuka, S. A. Organic carbon content in dissolved and particulate forms in kara sea water. Oceanology, 2024, 64, 181–236. [Google Scholar] [CrossRef]
- Cáceres Guido, P.; Humberto Pavan, C.; Otamendi, E.; Bramuglia, G. F. Principles of Bayesian statistics and its relationship with applied pharmacokinetics [Principios de estadística Bayesiana y su relación con la farmacocinética aplicada]. Rev. Chilena Ped., 2020, 91, 838–839. [Google Scholar]
- Ferrari L, Manzi G, Micheletti A, et al. Correction: Pandemic data quality modelling: a Bayesian approach in the Italian case. Quality & Quantity, 2024, (prepublish):1-3.
- Benjamin, S. V. V. D.; Koen, B.; et al. Efficient Bayesian calibration of aerodynamic wind turbine models using surrogate modeling. Wind Energy Science, 2022, 7, 759–781. [Google Scholar]
- Hewen, N.; Mengxue, C.; Shichang, K.; Tanuj, S.; Huili, Q.; Wanni, G.; Shihai, H.; Fu, Z. A review of physicochemical properties of dissolved organic carbon and its impact over mountain glaciers. Journal of Mountain Science, 2024, 21, 1–19. [Google Scholar]
- Wenwu, T.; Jianjun, Z.; Xing, L.; Ziwen, Y.; Ke, X.; Li, W.; Haijun, L.; Guang, L.; Peng, G. Dissolved Oxygen Prediction Based on PCA-LSTM. Journal of Physics, 2022, 2337.
|
Disclaimer/Publisher’s Note: The statements, opinions and data contained in all publications are solely those of the individual author(s) and contributor(s) and not of MDPI and/or the editor(s). MDPI and/or the editor(s) disclaim responsibility for any injury to people or property resulting from any ideas, methods, instructions or products referred to in the content. |
© 2024 by the authors. Licensee MDPI, Basel, Switzerland. This article is an open access article distributed under the terms and conditions of the Creative Commons Attribution (CC BY) license (http://creativecommons.org/licenses/by/4.0/).