
Submitted:
08 November 2024
Posted:
12 November 2024
You are already at the latest version
Abstract
The sludge generated out of marble processing has become a significant environmental hazard for all the major marble mining and processing countries. The benefits to utilize the marble dust (MD) as partial cement replacement, while on one hand reduces the requirements for dumping landfill, that is potential air and water pollution hazard; on the other hand, it reduces the usage of cement, with high carbon footprints. The study reviews the crucial properties of concrete impacted by the inclusion of MD and develops a composite mix with optimal MD content using the response surface methodology. The influence of MD/Cement ratio, Water/Cementitious material ratio and parameter indicating important constitutive element in MD i.e. CaO/MD ratio on the compressive strength were analyzed. Increasing the MD/Cement ratio from 0.564 to 0.667 reduced the compressive strength by approximately 16%. As expected, the Water/Cementitious ratio had a greater influence on compressive strength compared to MD/Cement ratio.
Keywords:
Marble dust
; Marble sludge
; Surface response method
; Optimization
; green concrete
1. Introduction
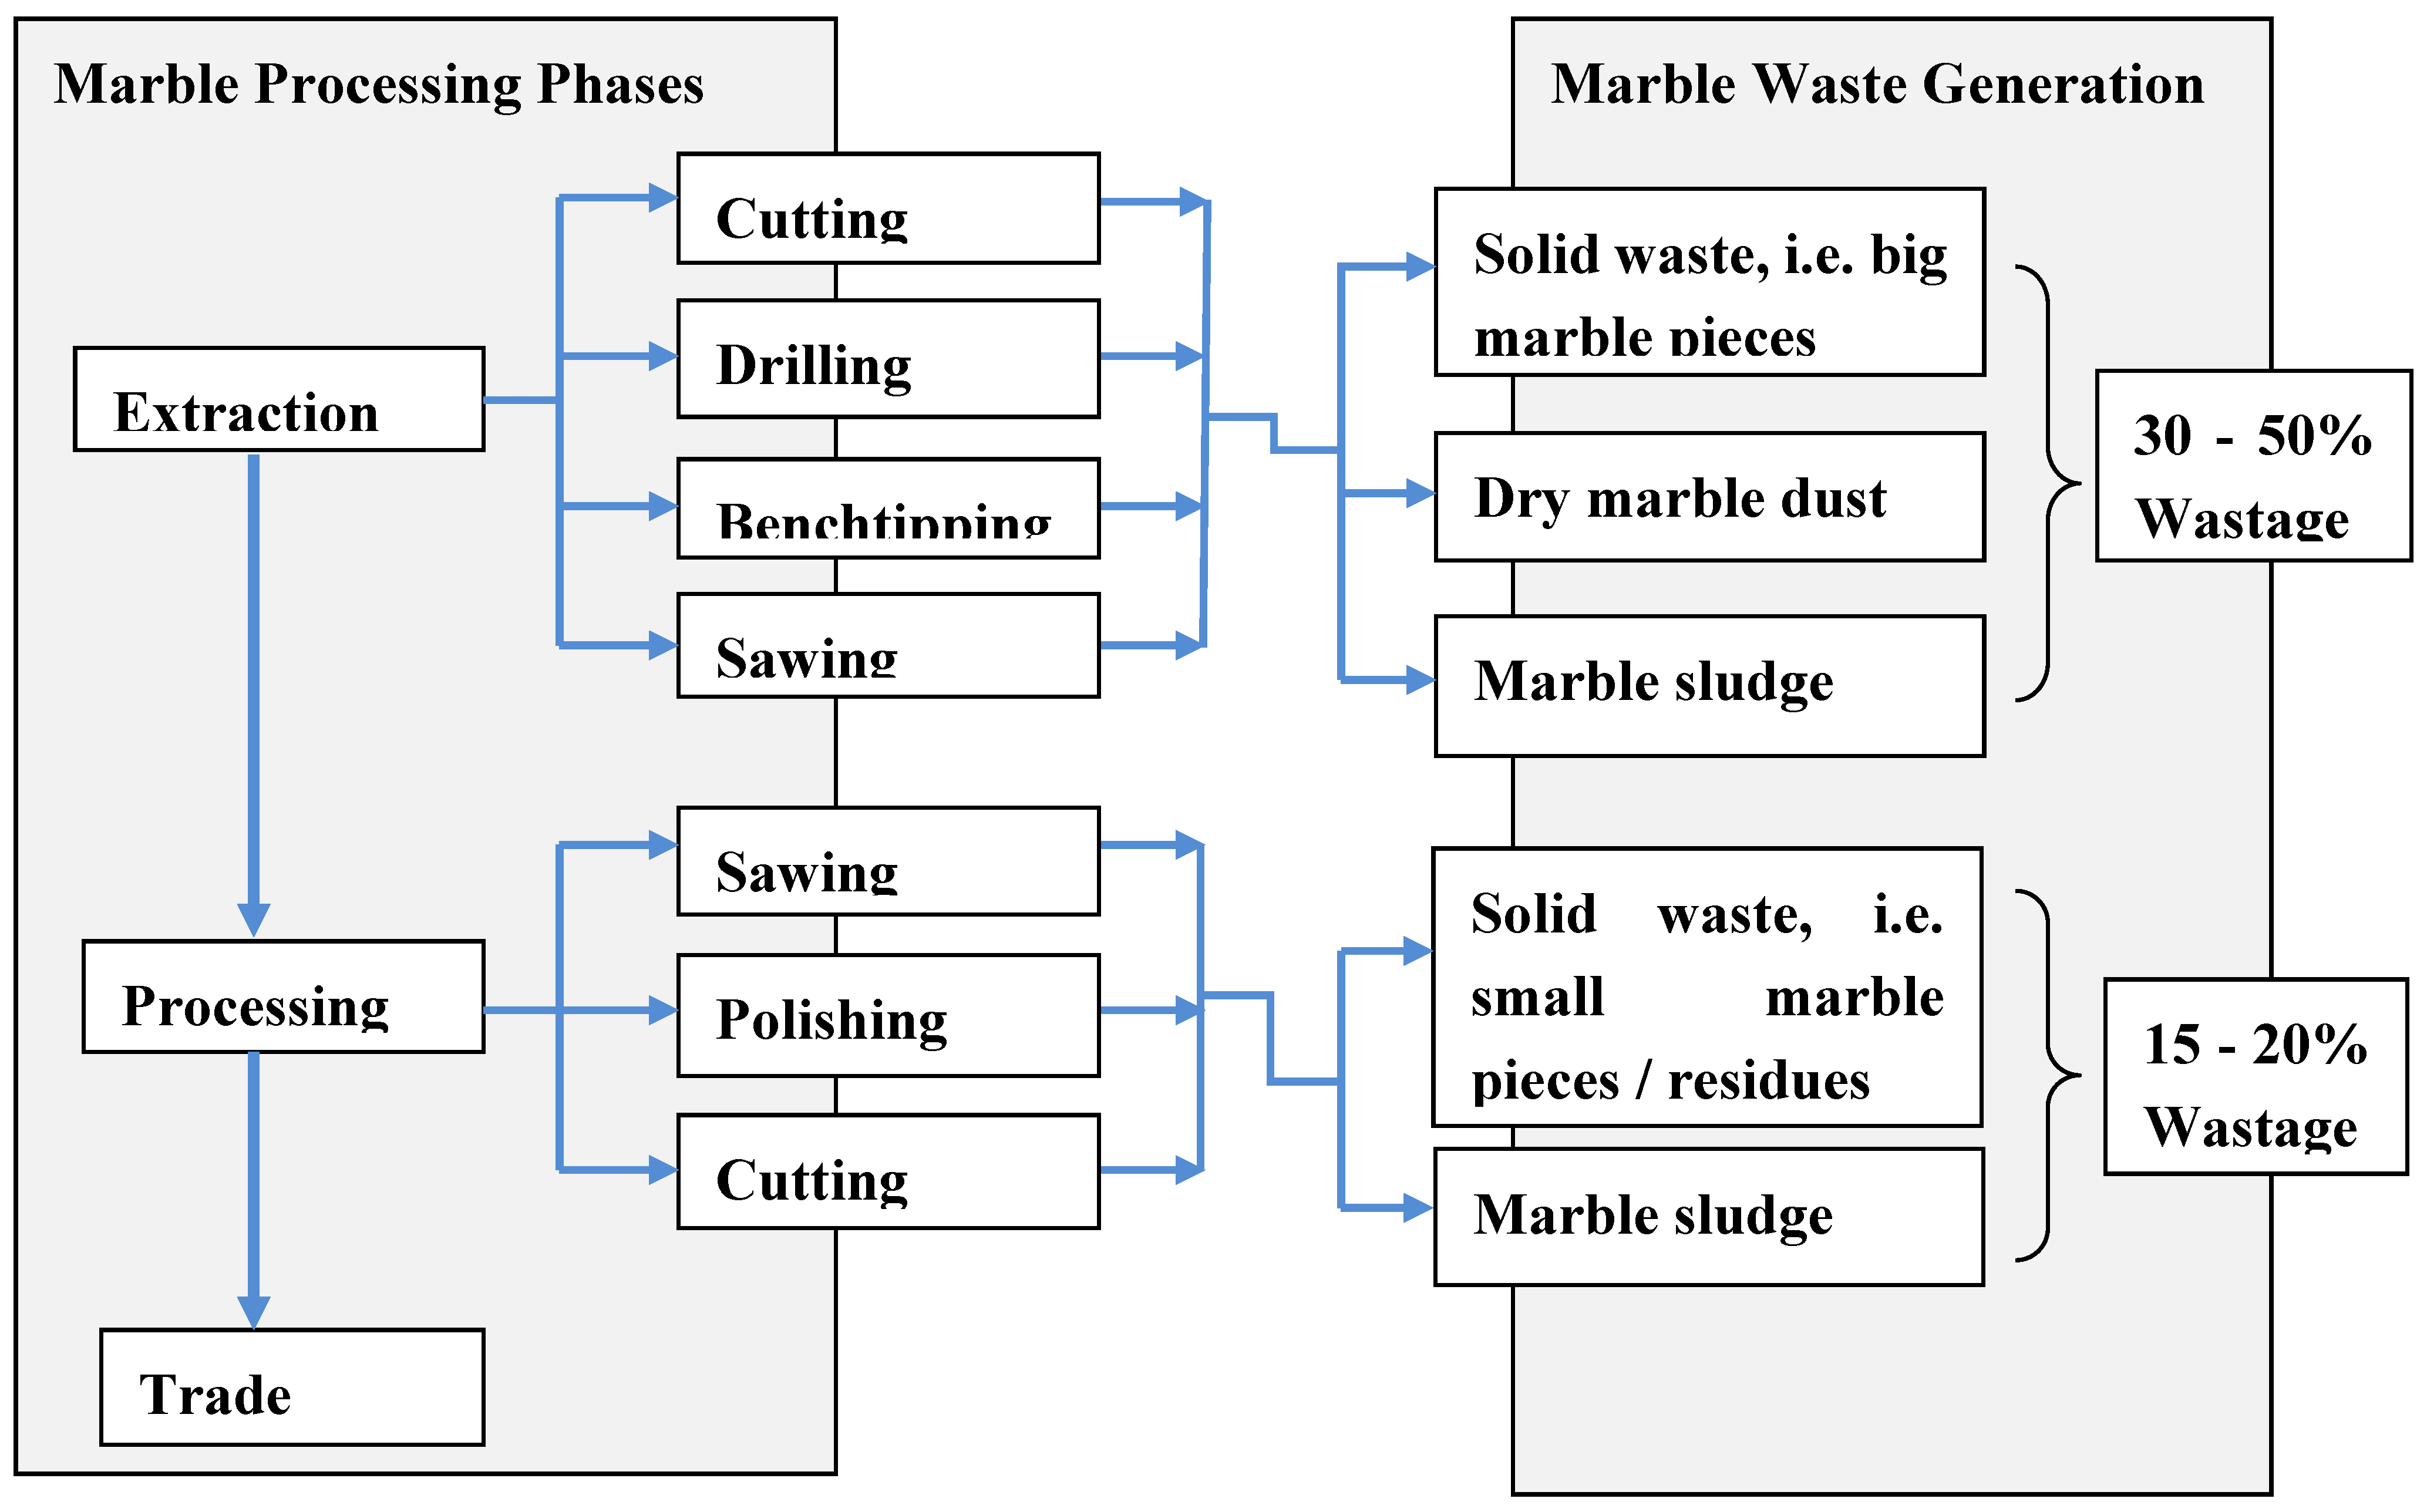
The total annual global marble quarrying production is approximately 325 million tons. Millions of tons of waste generated at marble quarry or sizing / finishing industry are generally left unutilized in the construction industry [1]. The range of this marble waste generated has been quoted as 40% [2] to as high as 80% [3]. This huge unattended waste, which is 20 to 30 % of marble block, becomes very fine dust and has over the time evolved into one of the growing environmental problems around the world, especially areas adjacent to quarry and construction sites [2]. Countries like Turkey, United States, Germany, Egypt, India, France, Portugal, Saudi Arabia etc. are highly effected because of high stone usage [4]. Notwithstanding the enormous growth in unattended marble waste, countries including Italy and Turkey are forced to limit marble production due to the damages caused by the excess waste, which is 1 million tons per year [5].
During the cutting process, the dust of the marble which mixes with water becomes too big to stock and consequentially imparts detrimental effect to the environment. Approximately 1 ton of marble stone processing in vertical/horizontal cutter or gang-saw generates 1 ton of marble powder slurry which contains nearly 35–45% water content [6,7]. The environmental problems are created due to the process of sawing and shaping of marble due to the presence of high calcium oxide content (Figure 1). Marble Waste produced in the mining, processing and polishing stages need to be inactivated properly without polluting the environment. It is imperative to determine an optimal method to utilize the ever-increasing waste marble stocks. The most suitable inactivating method nowadays is recycling as it provides with some advantages such as protecting the natural resources, energy saving, contributing to economy, decreasing the waste materials and investing for the future. One of the logical means for reduction of the waste marble masses calls for utilizing them in building industry itself [8,9,10].
Normally, the hydration of the cement remains incomplete in concretes with lower water/cement ratio (w/c ratio <0.38), due to insufficiency in pore space for deposition of hydration products [11]. Therefore, in these concretes a substantial portion of cement, which possesses high carbon footprints, is potentially wasted and serves only as an inert reinforcing material. Consequentially, many research studies have suggested to substitute the unhydrated cement with inert filler waste by-products like marble dust (MD) to produce sustainable, ecofriendly economic concrete.
Attempts have been made in the past to find and assess the possibilities of using waste marble powder in mortars and concretes in the past. Several studies have shown that natural pozzolana have been widely used as a substitute for Portland cement in many applications because of its advantageous properties which include cost-reduction, reduction in heat evolution, decreased permeability and increased chemical resistance [17,18,19,20]. This study is undertaken to review the progress that has been made in utilization of MD as partial replacement for cement in concrete. Based on historical data, it analyzes its merits, demerits when used as partial replacement of cement in concrete and also suggest an optimization solution through regressive analysis based on surface response method.
Figure 1.
Shows the process and percentage of waste produced in the marble industry.
2. Marble Dust and Its Impact on Concrete
2.1. Physical and Chemical Properties
The usage of cementitious material heavily depends on its physical and chemical properties, which impact its performance both as fresh paste and in hardened state. The physical properties such as particle shape, surface texture, surface porosity and rate of super-plasticizer adsorption, surface energy (zeta potential), finest fraction content, Blaine fineness and particle size distribution play an important role in shaping its rheological characteristics. However, there are no accepted standards for gauging the effects of these factors individually due to the complex influence of the combination of these factors [12]. Marble, a fine to very fine grained re-crystallized metamorphosed rocks which is hard, compact and capable of taking shining polish. SEM images show that the MD particles are not uniform in size not in shape [13]. MD had very high Blaine fineness value of about 1500 m2 /kg, with 90% particle passage through 50 μm sieves and 50% through 7 μm. Due to high specific surface area MD, its addition as mineral in mortars and concretes should impart more cohesiveness [14].
Chemically, marbles predominantly are composed of calcite, dolomite or serpentine minerals. Quartz, muscovite, tremolite, actinolite, micro line, chert, talc, garnet, osterite and biotite are the major mineral impurities whereas SiO2, limonite, Fe2O3, manganese, 3H2O and FeS2 (pyrite) are the major chemical impurities associated with marble [15]. Corinaldesi et al. [2], in its characterization of MD through thermal analysis found that 66% of calcium carbonate, CaCO3. Due to the decomposition endothermic reaction of calcite, a sharp weight loss from about 730 to 900℃ was accompanied with strong heat absorption. Ergun [16] indicated that the main component of MD is calcia. The amount of potassium oxide alkali was found to be lower in MD (0.21%) than in PC (0.73%). Gesoglu et al. [17] in its chemical analysis of different pozallans found semblance in composition of limestone filler and MD, with CaO content almost equivalent to that of cement; however, the loss of ignition in both the pozolans was found considerably high. Table 1 presents the chemical and physical properties of MD in contrast with different other supplementary cementitious materials.

Table 1.
Properties of different supplementary cementitious materials.
| Parameters | OPC | Fly ash | MD | Limestone filler | GGBFS |
|---|---|---|---|---|---|
| CaO (%) | 63.6 | 4.24 | 52.45 | 55.07 | 44.8 |
| SiO2 (%) | 19.49 | 56.2 | 1.29 | 0.22 | 34.4 |
| Al2O3 (%) | 4.54 | 20.17 | 0.39 | 0.18 | 9 |
| Fe2O3 (%) | 3.38 | 6.69 | 0.78 | 0.44 | 2.58 |
| MgO (%) | 2.63 | 1.92 | 0.54 | 0.34 | 4.43 |
| SO3 (%) | 2.84 | 0.49 | - | - | 2.26 |
| K2O (%) | 0.58 | 1.89 | 0.11 | 0.11 | 0.5 |
| Na2O (%) | 0.13 | 0.58 | - | - | 0.62 |
| LOI (%) | 2.99 | 1.78 | 43.9 | 42.86 | 1.32 |
| Specific gravity | 3.13 | 2.25 | 2.71 | 2.68 | 2.79 |
| Blaine fineness (cm2/g) | 3387 | 2870 | 5190 | 3990 | 6000 |
2.2. Influence on Rheological and Durability Properties
The heat of hydration and drying shrinkage of a concrete are largely dependent on the water/cementitious ratio, both being higher at higher ratio. The reduction in paste demand due to a higher packing density of the aggregate would for the same workability allow the use of a smaller paste volume at fixed water/cementitious ratio or a lower water/cementitious ratio at the same paste volume, either of which would significantly improve the dimensional stability and durability of the concrete. The research studies from Alyamac and Ince [18] as well as Topcu et al. [19] reported that MD incorporation in self-compacted concrete had no effect on its workability in fresh form. However, Aruntas et al. [20], Gesog˘lu et al. [17], highlighted the negative impact of MD on workability. The studies attributed the reduction to the angular particle shape of the MD, that increases the viscosity of the mortar and also the higher surface area of micro fines the water demand of mixes increase and thus result in lower strength and high drying shrinkage. It is for this reason ASTM C33 limits the amount of fine particles less than 75μm to 5% for concrete subject to abrasion and 7% for other concretes. Belaidi et al. [21] on a contrary, in its study on SCC observed that the use of both pozallans and MD as a partial replacement of cement has no negative effects on its workability. In fact, in ternary systems, the use of MP content (5–30%) along with natural pozallan material enhanced the rheological properties of both mortar and concrete. The enhancement is mainly attributed to the ball bearing effect of fine particles that enhance the plastic properties of the paste.
Gesoglu et al. [17], in its study on feasibility of using MD and limestone filler (LF) in SCCs at water–binder ratio of 0.35 observed that while on one hand inclusion of both fillers decreased chloride ion penetration all mixes, it also enhanced its electrical resistivity to a considerable extend due to its filler effect. Further the study found enhancement of electrical resistivity independent of the inclusion of fly ash in mixes. Kashyap et al. [22] reported 26, 20 and 57% reduction in water absorption, carbonation depth and permeability of concrete blended with 2% of nano silica and 5% of marble dust with a water binder ratio of 0.4. Taji et al. [23] in its study observed that using 10% granite dust and 10% MD as cement replacement increases the corrosion resistance capability of steel reinforcement in concrete. Similarly, Ghorbani et al. [24] reported significantly higher potential and corrosive resistance of concrete specimens with 20% MD as cement replacement due to the improved microstructure of concrete matrix caused by the micro-filler action and bond enhancing capability of the MD particles, which reduces the porosity, pore diameters and air content and increased the internal surface area of the cement matrix.
Singh et al. [25] in its study on MD incorporated concrete concluded that up to 15% replacement, an enhanced physical strength and durability of concrete block was observed. Further it was observed that MD helped in generating effective dense mix with increase in duration. Furthermore, the permeability of water was found to decrease with curing duration with maximum decrease found in 15% replacement. Khodabakhshian et al. [26] reported that incorporation of MD over 10% as partial replacement of cement predominantly resulted in decrease in durability of concrete, however within 10% of replacement satisfactory results were obtained. In another study Singh et al. [27] reported that partial replacement of cement with MD renders good results in terms of mechanical and durability properties when W/CM ratio is between 0.35 to 0.4. However, for higher W/CM ratios the optimum replacement ratio is below 10%. Further the study also observed that addition of MD generates denser medium with reduced penetration over long term. Talah et al. [28] suggested that partial substation of MD up to 15% can improve oxygen and chloride resistance of high performance concrete.
Demirel and Alyamaç [4] while reporting the effectiveness of filler material MD reduced the porosity, found considerable decrease in sorptivity coefficient with increase in MD. In comparison to limestone and cement based concrete, Binci et al. [29] reported that 15% MD replacement showed better resistance to sulfate and water ingression and the penetration depth of water was directly affected by the proposition of MD that decreased as the MD was increased from 5 to 15%. The enhancement in sulfate and water resistance was attributed to the densifying effect of MD and the relatively minimal leaching effect of sulfate solution in concrete specimens with MD. It was concluded that from durability perspective 15% partial replacement of cement and 25 to 50% sand replacement was found to render satisfactory results. With respect to carbonation depth which is related to the porosity of concrete, Gameiro et al. [30] reported that inclusion of MD reduced carbonation values similar to chloride mitigation coefficient. For a replacement ratio of 50% or more, due to roughness of aggregates, porosity is increased, resulting in porous network that undermines the MD lower water absorption property. For a 100% replacement ratio the mitigation coefficient falls by 25.9%.
2.3. Influence on Compressive Strength
Within reasonable proposition, the use of MD as mineral addition for mortars and concretes, especially for SCC, in the presence of a superplasticizing admixture provided maximum 28 days’ compressive strength at the same workability level, comparable to that of control mix (2, 19). Ergun [16] reported significant enhancement in compressive strength in concrete mixes with 5% MD as cement replacement and a relatively lower strength in mixes with MD content of 10%. The increase in compressive strength attributed to the pore-filling effect of ultra-fine particles filling voids between the aggregates in the concrete matrix and also the binding property of MD due to hydration of calcite and C3A. The combined use of MD and superplasticizing compensated the high water demand of MD. The reduction in compressive strength at a replacement ratio of 10% is due to the dilution of the pozzolanic reactions due to reduction cementing content. Furthermore, the concrete mixes with 5% MD showed 5% increase in the flexural strength compared to 12% increase in the compressive strength under same conditions after 90 days curing.
Martínez-Barrera et al. [31] reported significant influence of marble-particle sizes and the applied radiation dose (as a combination) on the compressive properties and the dynamic elastic modulus of polymer concretes. While the medium sized particles provided enhanced compressive properties, the higher number of dispersed marble particles per unit volume provided increased crack resistance. Binici et al. [32] reported significant enhancement in compressive strength and abrasion resistance of concrete with the increase in incorporated with MD content. The incorporated MD particles provide suitable nucleus for hydration and catalyse the hydration resulting in enhancement of mechanical properties. Rai et al. [33], reported enhancement of 5 to 10% in compressive strength with the increase in the waste marble granules (at each curing age), due to the cementitious and lower fineness properties of MD. However, a slight reduction in compressive strength was observed when the marble content was increased from 15 to 20%. In another study, Bheel et al.. [34] reported a maximum enhancement of 6.38 MPa, 67.66 MPa, and 4.88 MPa, in compressive, flexural, and splitting tensile strength for concrete incorporated with a blend of 5% MD and 5% calcined clay, respectively. Similarly, other research studies reported decent enhancement in compressive and splitting tensile strengths in concrete within the cement replacement ratio of 10% [35,36,37,38]. All the studies attributed the enhancement mainly to the fineness of MD that resulted in improved density and microstructure concrete.
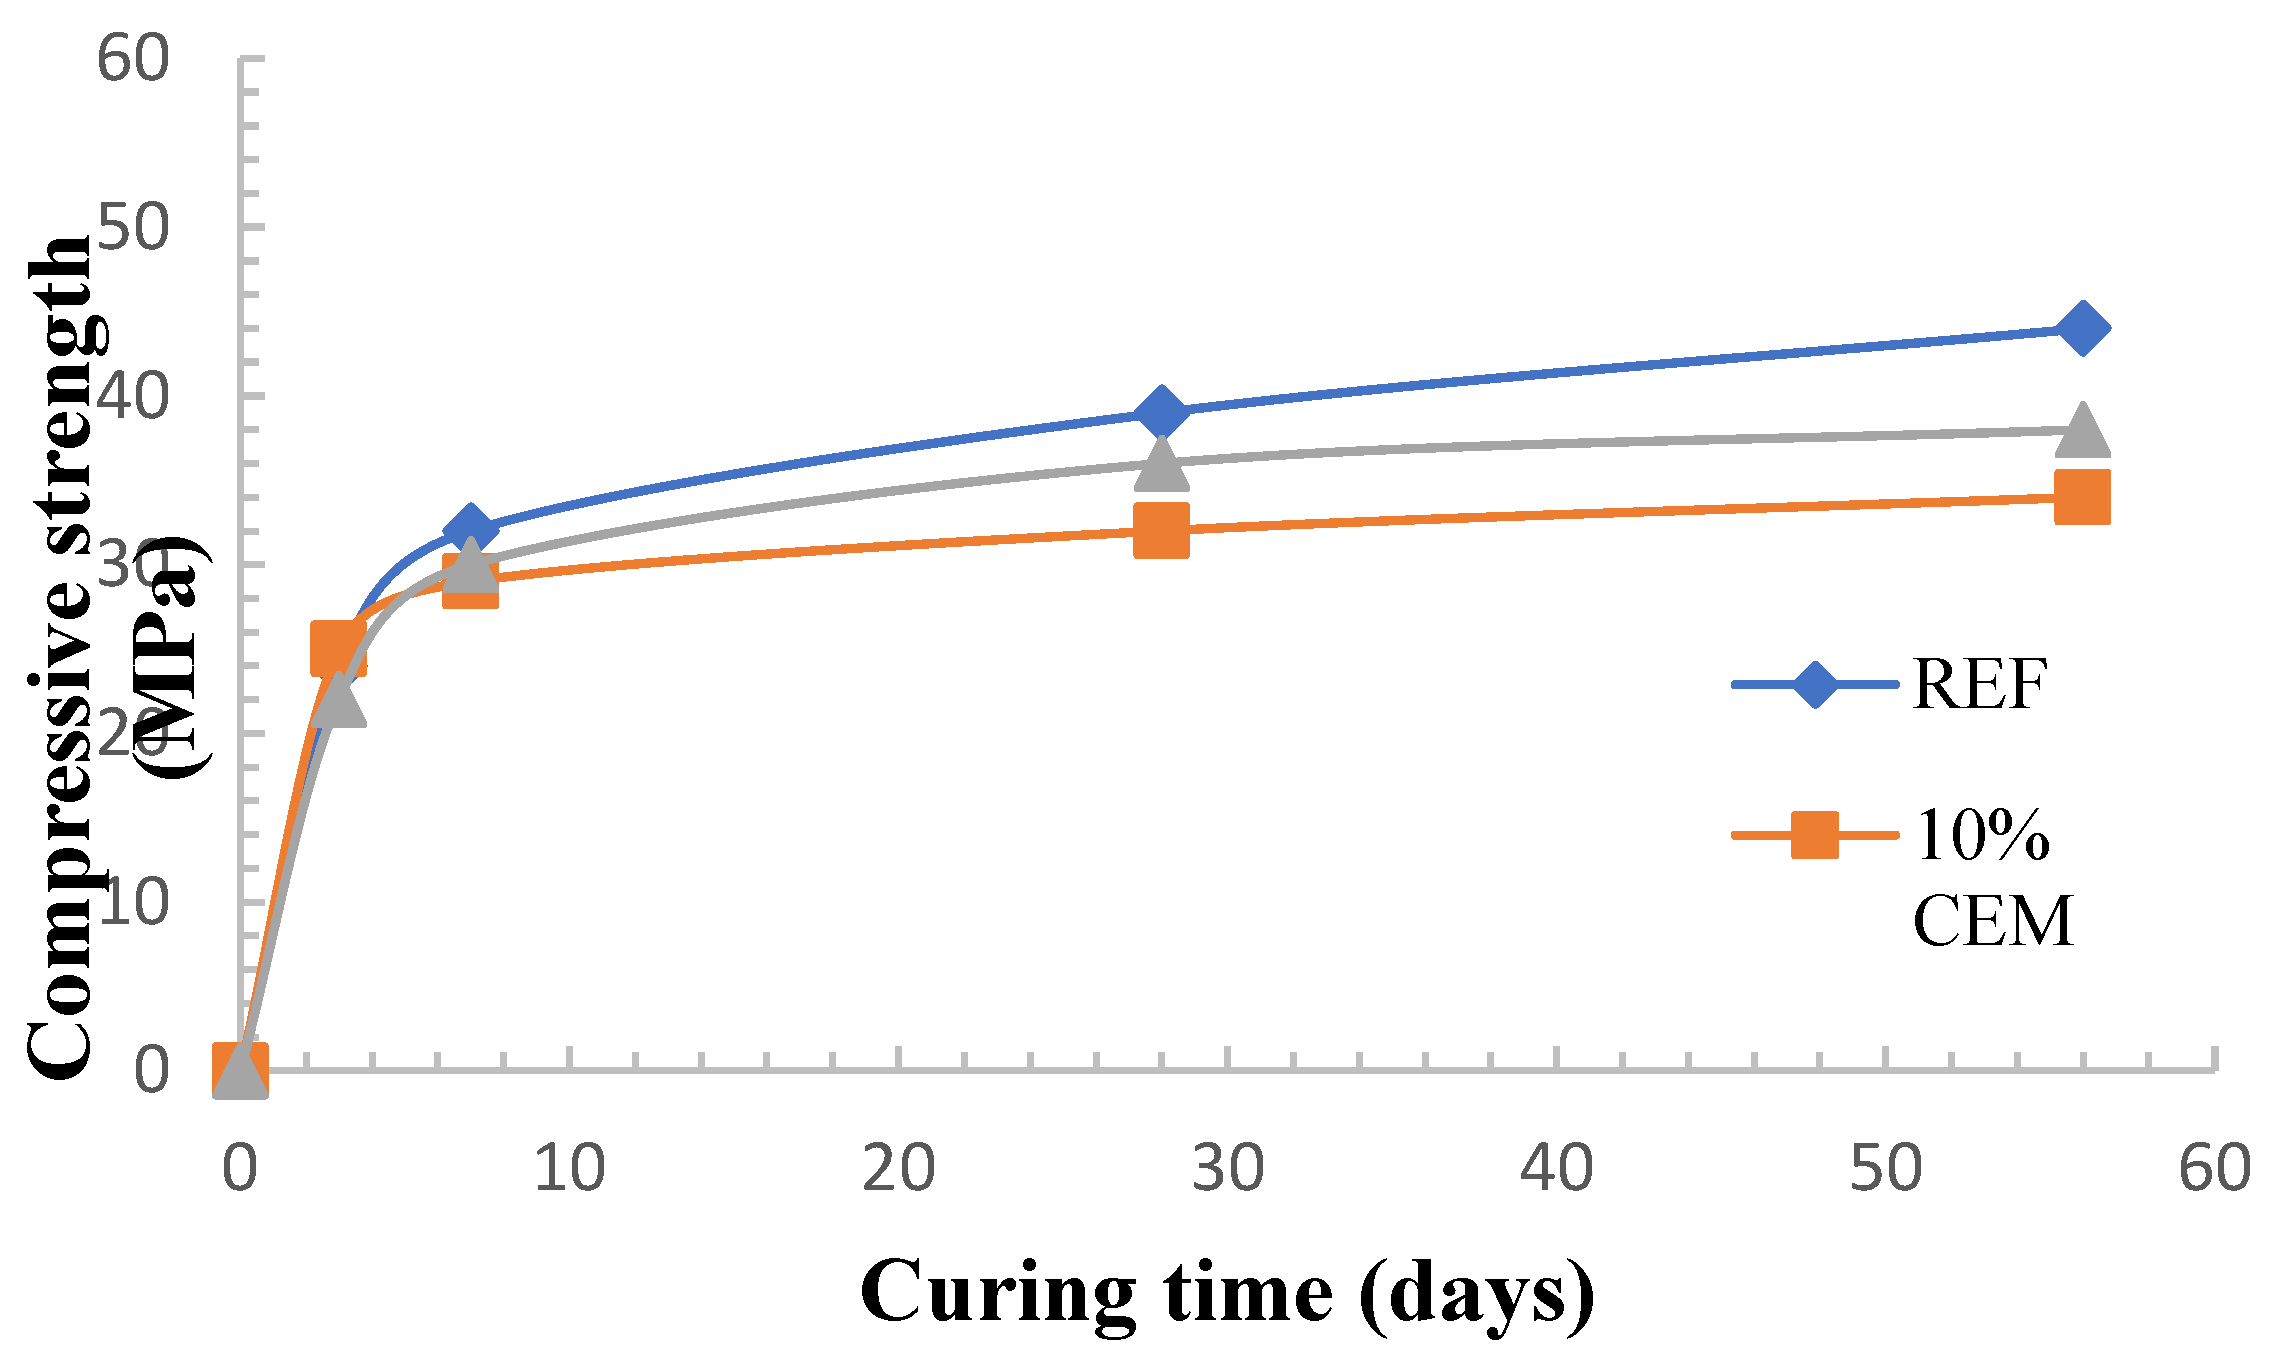
On a contrary, Corinaldesi et al. [2] reported about 10–20% reduction in 28 and 56 days’ compressive strength in mixes with 10% replacement of either cement or fine aggregates. However, compared to cement replacement that showed 10% reduction, the replacement of cement resulted in 20% reduction in compressive strength. MD while acting as inert material showed a filler effect (particularly at early ages), played no role in the hydration process (Figure 2). A mixture made of water, marble powder, and hydrated lime (Ca(OH)2), didn’t solidify even after 28 days of sealed air-free curing. The study also reported synergetic effect of MD and superplasticizing admixture in enhancing the filler effect, wherein the superplasticizer compensates for high water demand of MD. Belaidi et al. [21] also reported reduction in compressive strength due to inclusion of natural pozzolan and MD, due to the relatively slow development of strength. The maximum 28 days’ compressive strength was obtained in binary mixes with 5% of pozzolan and 5% pozolan with 5% MD in ternary mixes.
Figure 2.
Compressive strengths Vs. curing time for cement mortars (2).
3. Analytical Assessment
Thorough study was carried out to understand the usability of MD of varying chemical configuration in concrete and its impact vis-a-vis its proposition, water /cementitious material ratio (water/Cementitious ratio), cement / aggregate ratio (Cement/Agg ratio) and admixture/cement ratio (Admixture/cement ratio) on the overall compressive strength of concrete. In this regard, a detailed data-centric research of various relevant studies was undertaken to analyze the impact MD has on concrete as cement replacement. Table 2 summaries necessary information regarding various studies undertaken in the past. Based on the historical data, a statistical approach was adopted to explore the relationship between various variables and its responses. A very effective tool Response Surface Method (RSM) was employed to understand the criticality of various factors and to maximize the utility of MD by optimization of operational factors.
Table 2.
Historical data of concrete with MD mixes and results.
| Study | MD / Cement ratio | CaO/MD ratio | SiO2/MD ratio | Water/ Cementitious ratio | Cement/ Agg ratio | Admixture / Cement ratio | Compressive strength (Mpa) |
|---|---|---|---|---|---|---|---|
| [39] | 0 | 0 | 0 | 0.38 | 0.24 | 0.015 | 47.8 |
| 0.05 | 0.42 | 0.44 | 0.38 | 0.23 | 0.016 | 47 | |
| 0.11 | 0.42 | 0.44 | 0.38 | 0.22 | 0.017 | 46.1 | |
| 0.18 | 0.42 | 0.44 | 0.38 | 0.21 | 0.021 | 38.8 | |
| 0.25 | 0.42 | 0.44 | 0.38 | 0.19 | 0.023 | 36.2 | |
| 0.33 | 0.42 | 0.44 | 0.38 | 0.18 | 0.024 | 35.1 | |
| [40] | 0 | 0 | 0 | 0.54 | 0.2 | 0 | 39.2 |
| 0.05 | 0.64 | 0.19 | 0.55 | 0.19 | 0 | 37.3 | |
| 0.11 | 0.64 | 0.19 | 0.55 | 0.18 | 0 | 34.1 | |
| 0.25 | 0.64 | 0.19 | 0.54 | 0.16 | 0 | 28 | |
| 0 | 0 | 0 | 0.48 | 0.19 | 0.01 | 47.1 | |
| 0.05 | 0.64 | 0.19 | 0.49 | 0.18 | 0.011 | 43.7 | |
| 0.11 | 0.64 | 0.19 | 0.48 | 0.17 | 0.011 | 43.2 | |
| 0.25 | 0.64 | 0.19 | 0.48 | 0.15 | 0.013 | 34.4 | |
| [41] | 0 | 0 | 0 | 0.45 | 0.23 | 0.01 | 34.6 |
| 0.03 | 0.43 | 0.14 | 0.45 | 0.22 | 0.01 | 38 | |
| 0.05 | 0.43 | 0.14 | 0.45 | 0.22 | 0.011 | 43.1 | |
| 0.08 | 0.43 | 0.14 | 0.45 | 0.21 | 0.011 | 37.5 | |
| 0.11 | 0.43 | 0.14 | 0.45 | 0.21 | 0.011 | 27.8 | |
| 0.14 | 0.43 | 0.14 | 0.45 | 0.2 | 0.011 | 27.4 | |
| 0.18 | 0.43 | 0.14 | 0.45 | 0.2 | 0.012 | 26.8 | |
| 0.21 | 0.43 | 0.14 | 0.45 | 0.19 | 0.012 | 26.6 | |
| 0.25 | 0.43 | 0.14 | 0.45 | 0.18 | 0.013 | 25.6 | |
| [42] | 0 | 0 | 0 | 0.4 | 0.22 | 0.011 | 48.3 |
| 0.05 | 0.83 | 0.01 | 0.4 | 0.21 | 0.013 | 52 | |
| 0.08 | 0.83 | 0.01 | 0.4 | 0.2 | 0.015 | 53.5 | |
| 0.11 | 0.83 | 0.01 | 0.4 | 0.2 | 0.016 | 54 | |
| 0.18 | 0.83 | 0.01 | 0.4 | 0.19 | 0.017 | 48.2 | |
| 0 | 0 | 0 | 0.5 | 0.23 | 0.002 | 40 | |
| 0.05 | 0.83 | 0.01 | 0.5 | 0.22 | 0.003 | 37 | |
| 0.08 | 0.83 | 0.01 | 0.5 | 0.22 | 0.003 | 38.2 | |
| 0.11 | 0.83 | 0.01 | 0.5 | 0.21 | 0.004 | 37.5 | |
| 0.18 | 0.83 | 0.01 | 0.5 | 0.2 | 0.004 | 34.7 | |
| [43] | 0 | 0 | 0 | 0.48 | 0.19 | 0 | 34 |
| 0.11 | 0.55 | 0 | 0.49 | 0.17 | 0 | 34.5 | |
| 0.25 | 0.55 | 0 | 0.51 | 0.15 | 0 | 36 | |
| 0.43 | 0.55 | 0 | 0.53 | 0.13 | 0 | 28 | |
| 0.67 | 0.55 | 0 | 0.55 | 0.12 | 0 | 26 | |
| [27] | 0 | 0 | 0 | 0.35 | 0.21 | 0.002 | 40 |
| 0.11 | 0.29 | 0.04 | 0.35 | 0.19 | 0.003 | 41 | |
| 0.18 | 0.29 | 0.04 | 0.35 | 0.18 | 0.003 | 42 | |
| 0.25 | 0.29 | 0.04 | 0.35 | 0.17 | 0.004 | 36.5 | |
| 0.33 | 0.29 | 0.04 | 0.35 | 0.16 | 0.004 | 35 | |
| 0 | 0 | 0 | 0.4 | 0.2 | 0.002 | 32 | |
| 0.11 | 0.29 | 0.04 | 0.4 | 0.18 | 0.002 | 33 | |
| 0.18 | 0.29 | 0.04 | 0.4 | 0.17 | 0.003 | 34.3 | |
| 0.25 | 0.29 | 0.04 | 0.4 | 0.16 | 0.003 | 27.5 | |
| 0.33 | 0.29 | 0.04 | 0.4 | 0.15 | 0.003 | 27 | |
| 0 | 0 | 0 | 0.45 | 0.17 | 0.001 | 24.6 | |
| 0.11 | 0.29 | 0.04 | 0.45 | 0.15 | 0.001 | 24.7 | |
| 0.18 | 0.29 | 0.04 | 0.45 | 0.15 | 0.002 | 24.6 | |
| 0.25 | 0.29 | 0.04 | 0.45 | 0.14 | 0.002 | 22 | |
| 0.33 | 0.29 | 0.04 | 0.45 | 0.13 | 0.003 | 21.7 | |
| [44] | 0 | 0 | 0 | 0.47 | 0.24 | 0 | 39.2 |
| 0.05 | 0.4 | 0.28 | 0.47 | 0.22 | 0 | 34.4 | |
| 0.11 | 0.4 | 0.28 | 0.47 | 0.21 | 0 | 38.2 | |
| 0.18 | 0.4 | 0.28 | 0.47 | 0.2 | 0 | 30.3 | |
| 0.25 | 0.4 | 0.28 | 0.47 | 0.19 | 0 | 30 | |
| [45] | 0 | 0 | 0 | 0.4 | 0.21 | 0 | 34 |
| 0.04 | 0.5 | 0.18 | 0.4 | 0.2 | 0 | 35 | |
| 0.09 | 0.5 | 0.18 | 0.4 | 0.19 | 0 | 36 | |
| 0.14 | 0.5 | 0.18 | 0.4 | 0.18 | 0 | 37 | |
| [46] | 0 | 0 | 0 | 0.46 | 0.22 | 0 | 46.2 |
| 0.05 | 0.5 | 0.18 | 0.46 | 0.21 | 0 | 46.5 | |
| 0.11 | 0.5 | 0.18 | 0.46 | 0.2 | 0 | 47.6 | |
| 0.18 | 0.5 | 0.18 | 0.46 | 0.18 | 0 | 46.3 | |
| 0.25 | 0.5 | 0.18 | 0.46 | 0.17 | 0 | 45.8 |
3.1. Response Surface Methodology
Response surface methodology (RSM) consists of a group of mathematical and statistical techniques used in the development of an adequate functional relationship between a response of interest, y, and a number of associated input variables (factors) denoted by x1, x2, ..., xk. In general, such a relationship is unknown but can be approximated by a low-degree polynomial model of the form.
where x = (x1, x2, ..., xk), f(x) is a vector function of p elements that consists of powers and cross- products of powers of x1, x2, ..., xk up to a certain degree denoted by d (≥ 1), β is a vector of p unknown constant coefficients referred to as parameters, and ϵ is a random experimental error assumed to have a zero mean [7].
y = f (x)β + ϵ (1)
In addition to the 4 main variables MD/Cement ratio, Water/Cementitious ratio, CaO/MD ratio and SiO2/MD ratio, the study for the sake of uniformity, also takes into account the impact of factors like Cement/Agg ratio and Admixture/Cement ratio (wherever used) on the compressive strength of various historical concrete mixes (Table 3). The main reasoning behind choosing these variables as parameters is their criticality in imparting compressive strength in concrete.
Table 3.
Factors and their range of variance.
| Factors | Range of variance | ||||||
|---|---|---|---|---|---|---|---|
| Name | Units | Code | Minimum | Maximum | Mean | Std. Dev. | |
| MD/Cement Ratio | ratio | A | 0 | 0.667 | 0.1367 | 0.1237 | |
| Cement/Agg ratio | ratio | B | 0.1167 | 0.242 | 0.1902 | 0.0275 | |
| Water/Cementitious ratio | ratio | C | 0.35 | 0.550 | 0.4440 | 0.0537 | |
| Admixture/Cement ratio | ratio | D | 0 | 0.024 | 0.0058 | 0.0066 | |
| CaO/MD | ratio | E | 0 | 0.832 | 0.3998 | 0.2533 | |
| SiO2/MD | ratio | F | 0 | 0.441 | 0.1099 | 0.1283 | |
3.1.1. Rsm Model for Md Concrete
In this study, an RSM model with a total of 67 set points (historical data from various researches) was constructed. A commercially available software Design-Expert was used to analyze and optimize the historical data set. Since compressive strength is the most primary and significant acceptance criterion, so 28 days’ compressive strength is considered as single response for development of RSM model. A polynomial model is established for the said response with the factors mentioned earlier. Subsequently t-test was conducted to remove insignificant terms and a model was developed on the remaining terms. Analysis of variance ANOVA, was used to determine the statistical influence of variables in the given data set. P-value and F-value were determined to verify the model adequacy (Table 4).
Table 4.
ANOVA results of model.
| Reduced 2FI model | ||||||
|---|---|---|---|---|---|---|
| Response : Compressive strength | ||||||
| Source | Sum of Squares | df | Mean Square | F-value | p-value | |
| Model | 2024.26 | 6 | 337.38 | 9.3 | < 0.0001 | significant |
For model validation, F and P values were compared. F-value of 9.30 was obtained for the only response i.e. compressive strength, which indicates that the model is pretty significant. There is only 0.01% chance that such a large value could occur due to noise. Further the analysis reveals that P-value of all the factors is below the threshold value of 0.05, which validates their importance and contribution for model improvement. During estimation, the model term with P-value higher than 0.15 were removed as insignificant terms, but most of the terms are found to be significant. Finally, an equation with actual factors is evolved for prediction of response (compressive strength) for given levels of each factor. Since the intercept is not at the center of the design space, so this equation cannot be used to determine relative impact of factors. The levels for each factor need to be specified in original units as detailed in (Table 5). Further when the factors are orthogonal the VIFs are 1; VIFs greater than 1 indicate multi-collinearity, the higher the VIF the more severe the correlation of factors. As a rough rule, VIFs less than 10 are tolerable, which is what is obtained as coefficient results.
Table 5.
Response prediction for given levels of each factor.
| Response : 28 days Compressive strength | |||
|---|---|---|---|
| Model terms | Coeff Estimate | p-value | VIF |
| A-MD/Cement ratio | -7.08 | 0.0433 | 2.94 |
| B-Cement/Agg. ratio | 6.5 | 0.0239 | 2.75 |
| C-Water/Cementitious ratio | -3.13 | 0.0409 | 1.17 |
| E-CaO/MD | 5.21 | 0.0003 | 1.26 |
| F-SiO2/MD | -1.33 | 0.1289 | 1.21 |
| BC | -7.3 | 0.0266 | 1.12 |
The model equation is given as,
Compressive strength:
(fc) = -64.8-21.23A+627B+177.35C+12.53E-6.01F-1163.18BC
Where,
A - MD/Cement ratio, B - Cement/Aggregate ratio, C - Water/ Cementitious ratio, E - CaO/MD ratio, F - SiO2/MD ratio
3.2. Results and Discussion
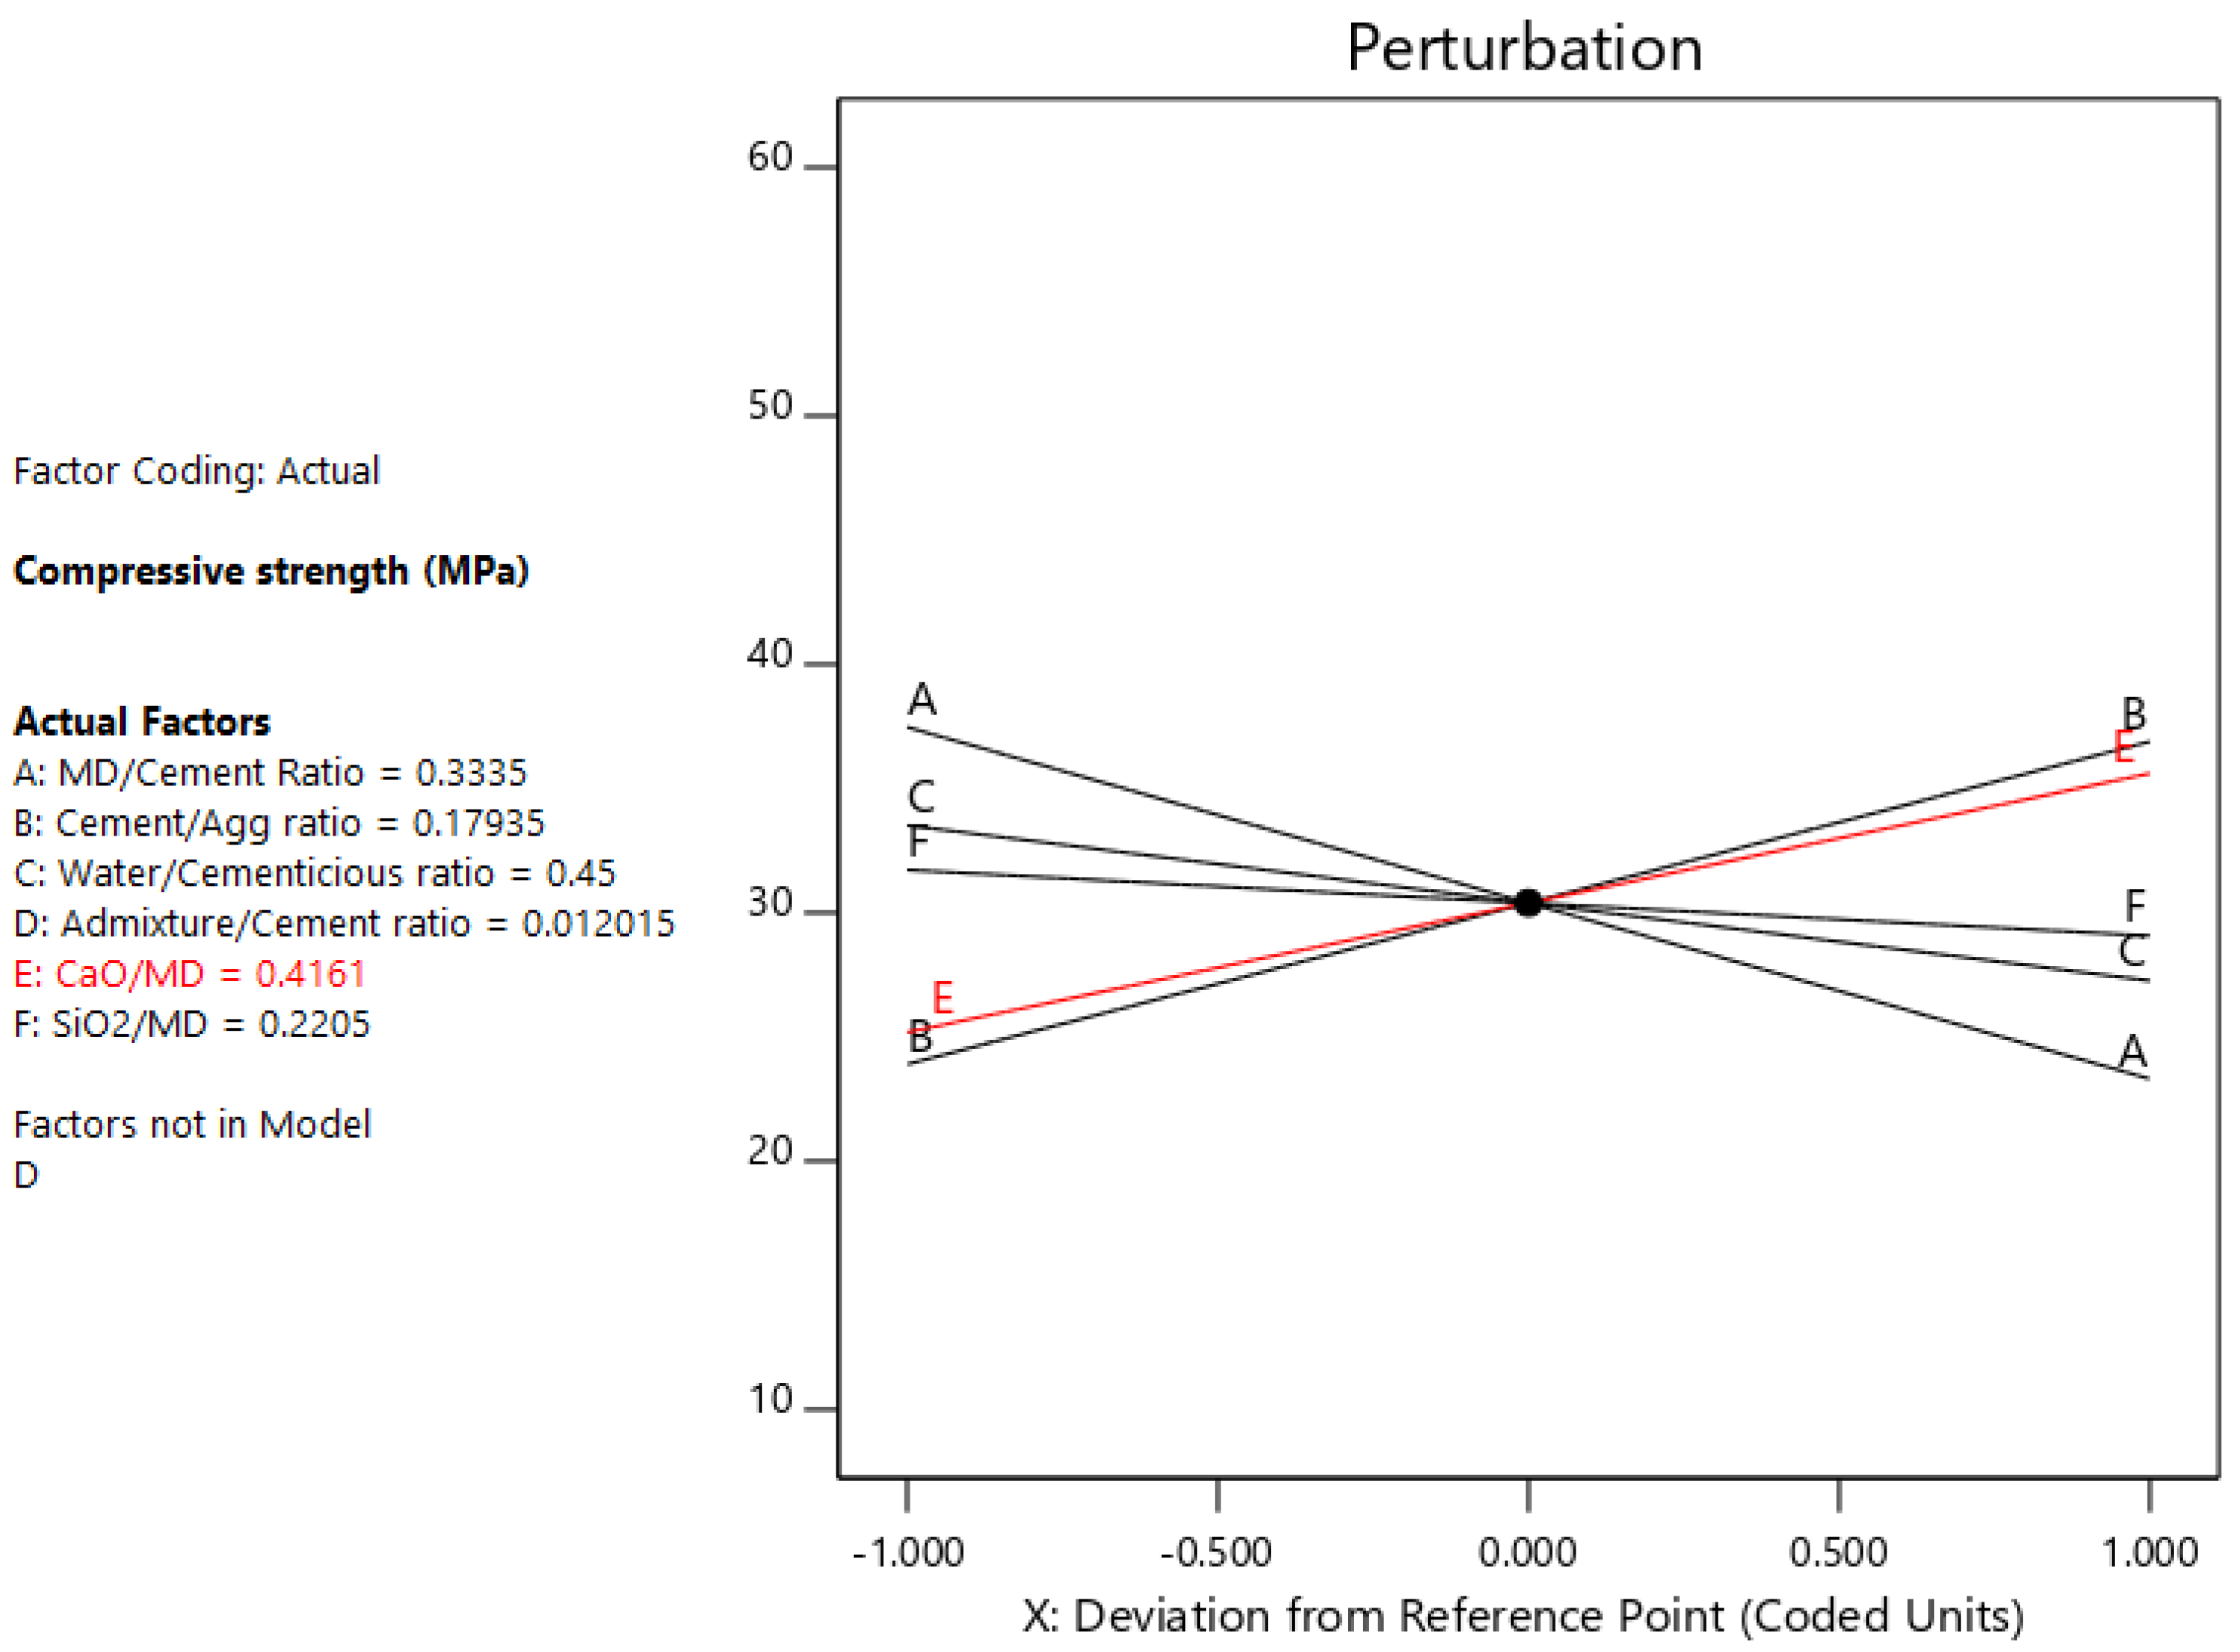
Besides being reflective on concrete quality control, process of mix, placing, compacting, curing, the definitive co-relation of 28-day compressive strength with porosity & durability makes it the most important parameter in testing on concrete [11,29]. In the data analysis, the response, 28 days’ compressive strength, varied from 21.7 MPa to 54 MPa (Table 2). The impact of MD/Cement ratio, Water/Cementitious ratio and parameter indicating important constitutive element in MD i.e. CaO/MD on the compressive strength is demonstrated graphically in Figure 3 and Figure 4. As per the analysis of variance ANOVA, a linear relationship exists between compressive strength & MD/Cement ratio, Water/Cementitious ratio and CaO/MD ratio. A reasonable compressive strength of around 35 MPa can be achieved for a range of acceptable MD/C, CaO/MD & Water/Cementitious ratios. The graph indicates that MD as high as 25% to 30% can be used for acceptable strength and Water/Cementitious ratio.
Figure 5 shows trace plot in which its quite evident that increase in MD/Cement ratio decreases the compressive strength. As far as the constitutive elements of MD are concerned, the influence of SiO2 is found to be very minimal while as CaO concentration in MD was found to have substantial impact on compressive strength. The trace Plot shows the mercurial rise of compressive strength with the increase in lime CaO concentration in waste MD. The probable reason for this increase is perhaps its contribution for the deficient CaO content of replaced cement and therefore full participation in formation of silicates and aluminates of calcium.
Figure 3.
3D response surface plot showing the influence of MD/Cement ratio and Water/ cementitious ratio interaction on compressive strength.
Figure 3.
3D response surface plot showing the influence of MD/Cement ratio and Water/ cementitious ratio interaction on compressive strength.
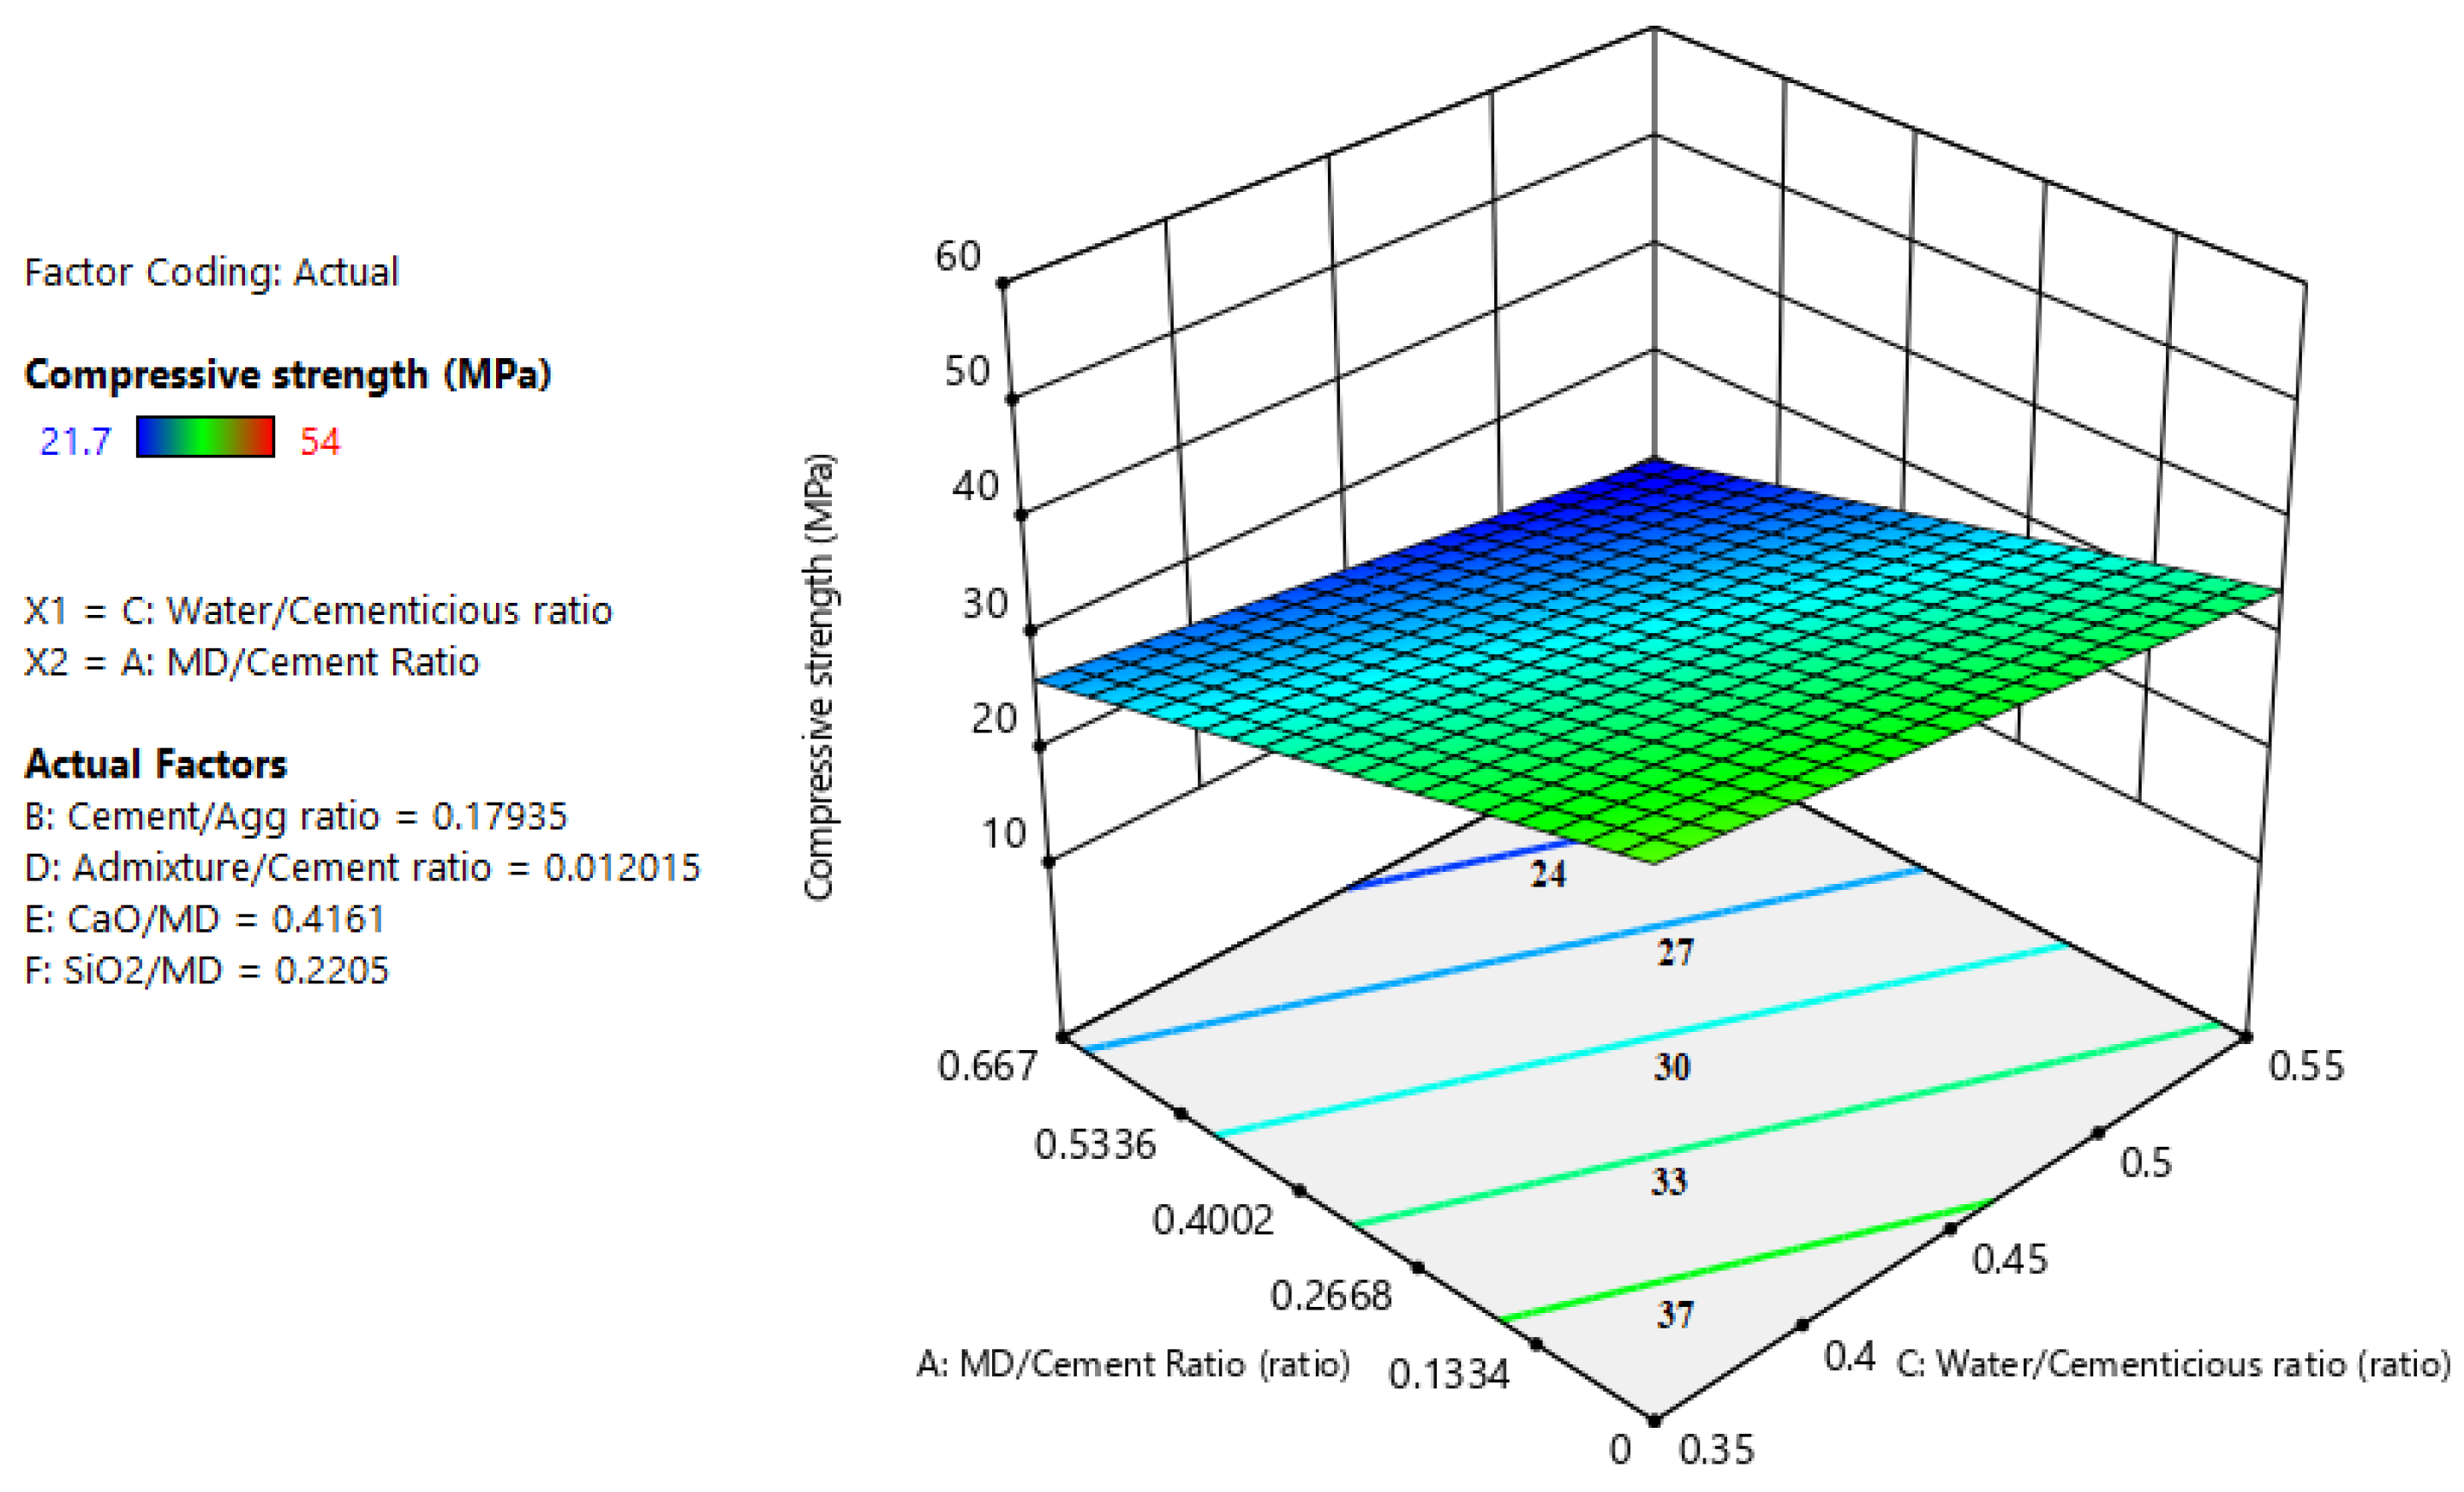
Figure 4.
3D response surface plot showing the influence of MD/Cement ratio and CaO/ MD ratio interaction on compressive strength.
Figure 4.
3D response surface plot showing the influence of MD/Cement ratio and CaO/ MD ratio interaction on compressive strength.
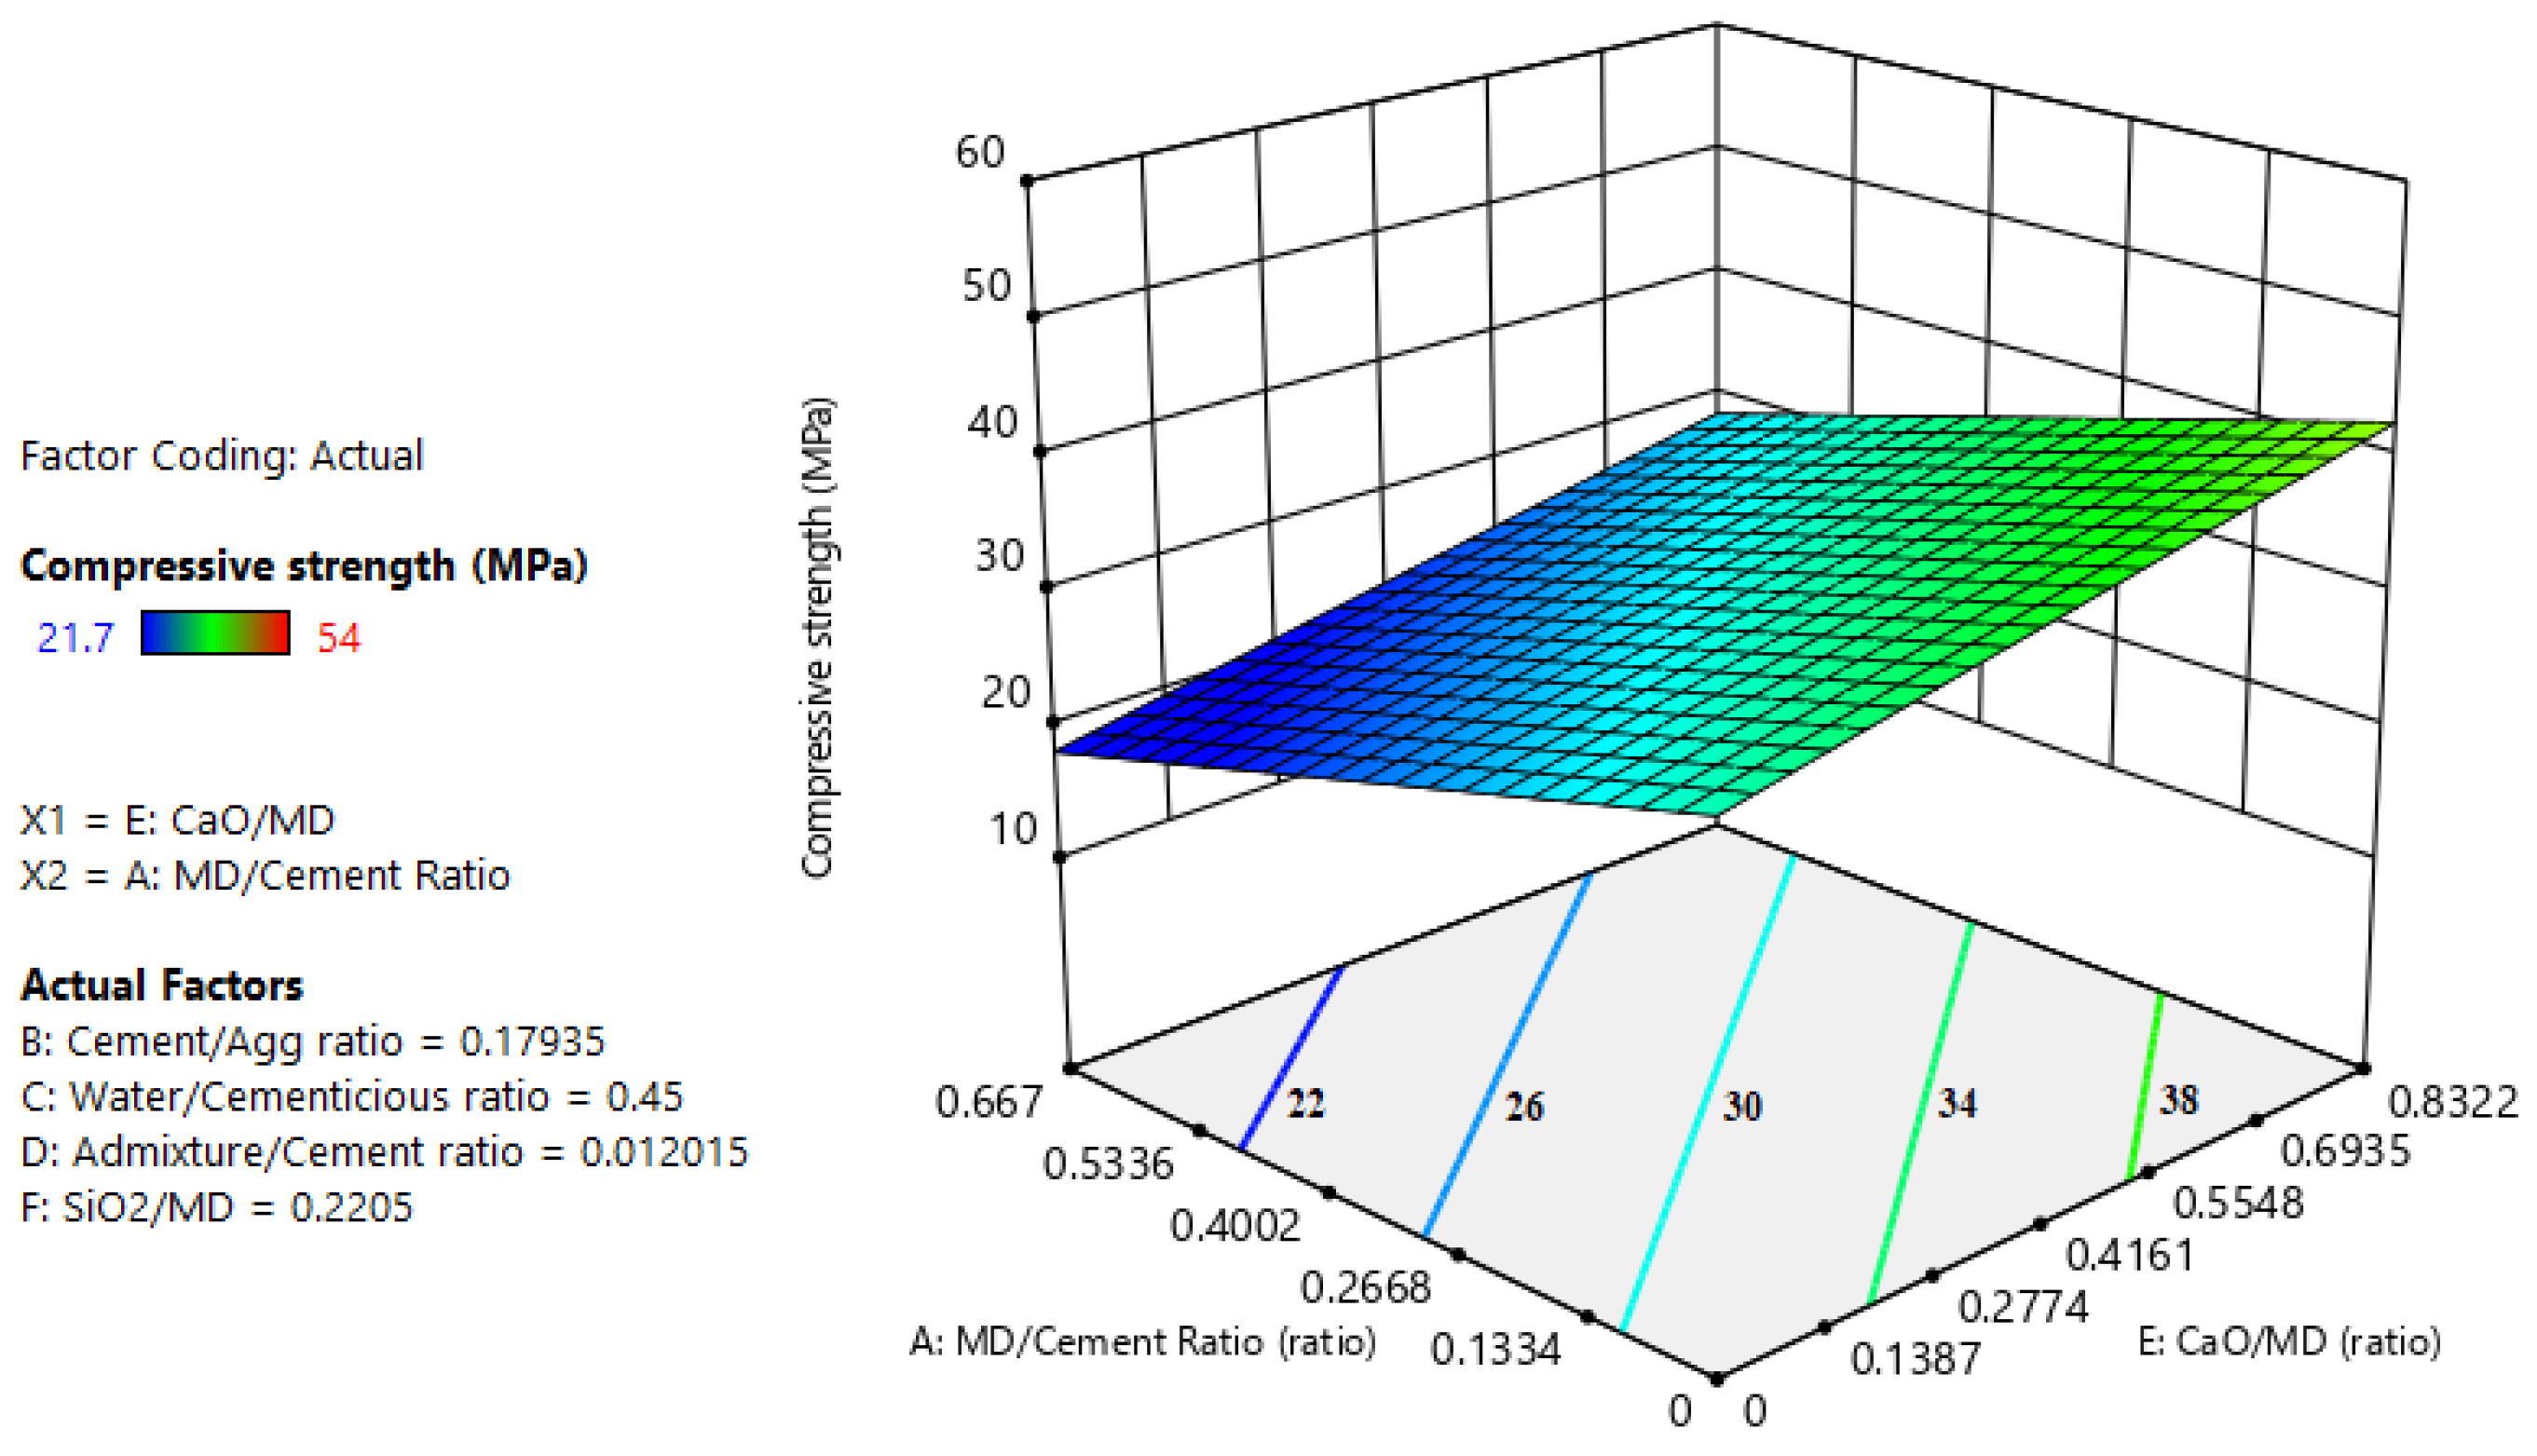
Figure 5.
Trace plot of compressive strength.
3.2.1. Parametric Optimization of Model
A parametric optimization technique is adopted to achieve an eco-friendly concrete mix which has the highest amount of marble powder. The process includes synchronous adjustment of different variables and response to achieve targeted results. The study used Derringer's desirability function for multi-objective optimization and involves transformation of predicted response, yi, to a dimensionless partial desirability function, di, which includes the researcher’s priorities and desires when building the optimization procedure.
di = 1, yi ≥ B
di = 1, A < yi < B
di = 0, yi ≤ A
Further, di can be defined when the response is to be minimized/ maximized or if there is a target value for the response. In Eq. (3), A and B are, respectively, the upper and the lower limits obtained for the response i, and wti is the weight. di ranges between 0, for a completely undesired response, and 1, for a fully desired response.
The impact of MD on compressive strength of concrete depends on numerous parameters, however based on the model analysis, this study adopted and limited itself to 5 important factors which were deemed as the most important ones. In order to meet the objective of maximized MD utilization and development of eco-friendly sustainable concrete mixture, parameters are set within the range of acceptable limits. The optimization includes defining all parameters as "in range" and while as MD/Cement ratio defined as "maximum". The w/c ratio is defined in the range of 0.35 and 0.5 and CaO/MD and SiO2/MD ratios were kept within the most prevalent range of 0.25 to 0.45 and 0.1 and 0.25 respectively. The critical response of compressive strength was defined in the range of 35 to 45 MPa, which is an acceptable range for a reasonable utility concrete (Table 6). The desirability zone is guided by the predefined parameters that are set and can be seen in Figure 6. The desirability function of 1 is achieved with all set parameters i.e. maximized utilized marble dust (Table 6).
3.2.2. Validation and Observation
To validate the accuracy of the optimized solution, tests were conducted in the laboratory to compare the confirmatory trial mixes with the analytical solution. Three test samples were developed, the results of which are given in Table 8. The absolute relative deviation, ARD were calculated to access the variance if any [48]. The results indicate that experimental results are consistent with the analytical results. The average ARD value is 7.07% and the maximum ARD value is 9.62 which is below 10% and hence acceptable. This shows the efficacy of response surface methodology in determining the effect of variables and optimum usage of waste MD in development of eco-friendly sustainable concrete. Further, with the help of the model equation it is possible to vary different parameters like MD content, cement content, W/CM ratio or the CaO content in MD to attain the desired strength within a reasonable range. Furthermore, the increased utilization of MD shall ensure lesser carbon footprints and productive immobilization of hazardous waste.
4. Conclusions
The by-product in the marble industry in the form of marble dust is producing enormous waste with disposal problem. Immobilization of this waste for producing a sustainable concrete with lesser carbon footprints provides a win-win opportunity. The paper accesses the scope for usability of waste marble dust power as a partial replacement for cement in concrete. Both literature and analytical review was undertaken to access its usability in conventional concrete. A model through response surface methodology and an optimizational solution was presented to further the case of utility of marble dust in concrete. The following main conclusions of the present study are highlighted as under;
- i.
- Even though the MD particles are not uniform in shape and size, it usually possesses very high Blaine fineness value of approximately 1500-1560 m2 /kg, with 85 - 90% particle passage through 50 μm sieves and 45-50% through 7 μm. Chemically, marbles predominantly are composed of calcite, dolomite or serpentine minerals.
- ii.
- Most of the studies have associated MD with the reduction in workability and high drying shrinkage which is mainly attributed to the angular particle shape of the MD and higher surface area of micro fines.
- iii.
- Most of the studies conclude higher physical strength and durability of concrete with the inclusion of MD in optimal range. The effectiveness of filler material MD reduced the porosity, and sorptivity coefficient with increase in MD.
- iv.
- The development of 2FI regression model using RSM analysis the dependence of various factors like the MD/Cement ratio, W/Cementitious ratio, Cement/Agg ratio, CaO/MD ratio and SiO2/MD ratio on the compressive strength of MD admixtured concrete. The incorporation of these factors are further supported by ANOVA results, wherein baring Admixture/Cement ratio, all other parameters considered were found to be statically significant with low P-value.
- v.
- The w/c ratio is defined in the range of 0.35 and 0.5 and CaO/MD and SiO2/MD ratios were kept within the most prevalent range of 0.25 to 0.45 and 0.1 and 0.25 respectively. The critical response of compressive strength was defined in the range of 35 to 45 MPa, which is an acceptable range for a reasonable utility concrete.
- vi.
- Increasing the MD/Cement ratio from 0.564 to 0.667 reduced the compressive strength by approximately 16%. As expected, the Water/Cementitious ratio had a greater influence on compressive strength compared to MD/Cement ratio.
Acknowledgments
The authors would like to acknowledge the support of the Alfaisal University, Riyadh, Saudi. Arabia and King Abdulaziz University, Jeddah, Saudi Arabia for carrying out this study.
Authors’ contributions
RD made contributions to the analysis of the data and drafting of the manuscript. KZF made contributions in conceptualizing, analyzing, and drafting the manuscript. ASS contributed to the revision of the manuscript and analysis of data. ABA made contributions to the accumulation of historical data and general literature review. All authors read and approved the final manuscript.
Funding
This investigation was supported by the Alfaisal University, Riyadh, Saudi Arabia.
Availability of data and materials
All data generated or analyzed during this study are included in this published article.
Ethics approval and consent to participate
Not applicable.
Consent for publication
Not applicable.
Competing interests
No competing interests exits in the submission of this manuscript, and manuscript is approved by all authors for publication. The author declare that the work described was original research that has not been published previously, and not under consideration for publication elsewhere, in whole or in part.
References
- Khorshed E.A.E., Safaa E-N.A., Samia E-G.S., Ahmed A.M.B. and Amani A.S., (2022). “Occupational ocular health problems among marble workers at Shaq El Tho'ban industrial area in Egypt.” Environmental Science and Pollution Research. 29 (25): 37445–37457.
- Corinaldesi, V.; Moriconi, G.; Naik, T.R. Characterization of marble powder for its use in mortar and concrete. Constr. Build. Mater. 2009, 24, 113–117. [CrossRef]
- Hebhoub, H.; Aoun, H.; Belachia, M.; Houari, H.; Ghorbel, E. Use of waste marble aggregates in concrete. Constr. Build. Mater. 2010, 25, 1167–1171. [CrossRef]
- Demirel B. and Alyamaç K.E., (2018). “In: Waste Marble Powder/dust. Waste and Supplementary Cementitious Materials in Concrete.” Characterisation, Properties and Applications, A Volume.Woodhead Publishing Series in Civil and Structural Engineering, 181-197.
- Uygunoğlu, T.; Topcu, I.B.; Gencel, O.; Brostow, W. The effect of fly ash content and types of aggregates on the properties of pre-fabricated concrete interlocking blocks (PCIBs). Constr. Build. Mater. 2011, 30, 180–187. [CrossRef]
- Aukour F.J., (2009). “Incorporation of marble sludge in industrial building eco-blocks or cement bricks formulation.” Jordan J. Civ. Eng. 3 (1) 58–65.
- Singh, M.; Choudhary, K.; Srivastava, A.; Sangwan, K.S.; Bhunia, D. A study on environmental and economic impacts of using waste marble powder in concrete. J. Build. Eng. 2017, 13, 87–95. [CrossRef]
- Oza, R.B.; Kangda, M.Z.; Agrawal, M.R.; Vakharia, P.R.; Solanki, D.M. Marble dust as a binding material in concrete: A review. Mater. Today: Proc. 2022, 60, 421–430. [CrossRef]
- Ashish, D.K. Feasibility of waste marble powder in concrete as partial substitution of cement and sand amalgam for sustainable growth. J. Build. Eng. 2018, 15, 236–242. [CrossRef]
- Kore S.D., Vyas A. and Kabeer S.A.K.I., (2020). “A brief review on sustainable utilization of marble waste in concrete.” International journal of sustainable engineering Vol. 13 (4) 264-279.
- Neville A.M., (2011). “Properties of Concret”, fifth ed., Pearson Education Limited Publications.
- Felekoğlu, B.; Tosun, K.; Baradan, B.; Altun, A.; Uyulgan, B. The effect of fly ash and limestone fillers on the viscosity and compressive strength of self-compacting repair mortars. Cem. Concr. Res. 2006, 36, 1719–1726. [CrossRef]
- Awad A.H. and Abdellatif M.H., (2019). “Assessment of mechanical and physical properties of LDPE reinforced with marble dust.” Composites Part B 173 106948.
- Corinaldesi V., Moriconi G. and Naik T.R., (2005) “Characterstics of marble powder for its use in mortar and concrete.” NMET/ACI International symposium on sustainable development of cement and concrete, October 5¬7, Toronto, Canada. [CrossRef]
- Arel H.S., (2016). “Recyclability of waste marble in concrete production.” Journal of Cleaner Production 131 179-188.
- Ergün, A. Effects of the usage of diatomite and waste marble powder as partial replacement of cement on the mechanical properties of concrete. Constr. Build. Mater. 2010, 25, 806–812. [CrossRef]
- Gesog˘lu M., Guneyisi E., Kocabag˘M.E., Bayram V. and Mermerdas K., (2012). “Fresh and hardened characteristics of self-compacting concretes made with combined use of marble powder, limestone filler, and fly ash.” Construction and Building Materials 37 160–170.
- Alyamac K.E. and Ince R., (2009). “A preliminary concrete mix design for SCC with marble powders.” Construction and Building Materials 23 1201–1210.
- Topcu I.B., Bilir T. and Uygunog˘lu T., (2009). “Effect of waste marble dust content as filler on properties of self-compacting concrete.” Construction and Building Materials 23 1947–1953.
- Aruntas H.Y., Dayı M., Tekin I., Birgul R. and Simsek O., (2007). “Effects of marble powder on the properties of self-compacting concretes.” In: Proceeding of second national symposium on chemical admixtures use in structures, Ankara, 161–72.
- Belaidi, A.; Azzouz, L.; Kadri, E.; Kenai, S. Effect of natural pozzolana and marble powder on the properties of self-compacting concrete. Constr. Build. Mater. 2012, 31, 251–257. [CrossRef]
- Kashyap, V.S.; Sancheti, G.; Yadav, J.S. Durability and microstructural behavior of Nano silica-marble dust concrete. Clean. Mater. 2022, 7. [CrossRef]
- Taji I., Ghorbani S., de Brito J., Tam V.W.Y., Sharifi S., Davoodi A. and Tavakkolizadeh M.R., (2019). “Application of statistical analysis to evaluate the corrosion resistance of steel rebars embedded in concrete with marble and granite waste dust.” Journal of Cleaner Production 210 837-846.
- Ghorbani, S.; Taji, I.; Tavakkolizadeh, M.; Davodi, A.; de Brito, J. Improving corrosion resistance of steel rebars in concrete with marble and granite waste dust as partial cement replacement. Constr. Build. Mater. 2018, 185, 110–119. [CrossRef]
- Singh, M.; Srivastava, A.; Bhunia, D. Long term strength and durability parameters of hardened concrete on partially replacing cement by dried waste marble powder slurry. Constr. Build. Mater. 2019, 198, 553–569. [CrossRef]
- Khodabakhshian, A.; Ghalehnovi, M.; de Brito, J.; Shamsabadi, E.A. Durability performance of structural concrete containing silica fume and marble industry waste powder. J. Clean. Prod. 2018, 170, 42–60. [CrossRef]
- Singh, M.; Srivastava, A.; Bhunia, D. An investigation on effect of partial replacement of cement by waste marble slurry. Constr. Build. Mater. 2017, 134, 471–488. [CrossRef]
- Talah, A.; Kharchi, F.; Chaid, R. Influence of Marble Powder on High Performance Concrete Behavior. Procedia Eng. 2015, 114, 685–690. [CrossRef]
- Binici, H.; Shah, T.; Aksogan, O.; Kaplan, H. Durability of concrete made with granite and marble as recycle aggregates. J. Mech. Work. Technol. 2008, 208, 299–308. [CrossRef]
- Gameiro, F.; de Brito, J.; da Silva, D.C. Durability performance of structural concrete containing fine aggregates from waste generated by marble quarrying industry. Eng. Struct. 2013, 59, 654–662. [CrossRef]
- Martínez-Barrera, G.; Menchaca-Campos, C.; Gencel, O. Polyester polymer concrete: Effect of the marble particle sizes and high gamma radiation doses. Constr. Build. Mater. 2013, 41, 204–208. [CrossRef]
- Binici, H., Kaplan, H. and Yilmaz, S., (2007). “Influence of marble and limestone dusts as additives on some mechanical properties of concrete.” Sci. Res. Essay 2 (9), 372-379.
- Rai B., Khan N.H., Abhishek K.R.., Tabin R.S. and Duggal S.K., (2011). “Influence of marble powder/granules in concrete mix.” Int. J. Civ. Struct. Eng. 1 (4), 827–834 ISSN: 0976- 4399.
- Bheel, N.; Benjeddou, O.; Almujibah, H.R.; Abbasi, S.A.; Sohu, S.; Ahmad, M.; Sabri, M.M.S. Effect of calcined clay and marble dust powder as cementitious material on the mechanical properties and embodied carbon of high strength concrete by using RSM-based modelling. Heliyon 2023, 9, e15029. [CrossRef]
- Dhanalakshmi, A.; Hameed, M.S. Strength Properties of Concrete Using Marble Dust Powder. EAJMR: East Asian J. Multidiscip. Res. 2022, 1, 2521–2530. [CrossRef]
- Poloju K.K., Shill A., Zahid A.R.A.B. and Al S.R.S., (2020). “Determınatıon of strength properties of concrete with marble powder.” Int. J. Adv. Sci. Technol. 29 4004–4008.
- Sharma, A.K.; Mishra, N.; Chaudhary, L. Effect of adding marble-dust particles (MDP) as a partial cement replacement in concrete mix. Mater. Today: Proc. 2023. [CrossRef]
- Shukla, A.; Gupta, N.; Gupta, A. Development of green concrete using waste marble dust. Mater. Today: Proc. 2020, 26, 2590–2594. [CrossRef]
- Rana, A.; Kalla, P.; Csetenyi, L.J. Sustainable use of marble slurry in concrete. J. Clean. Prod. 2015, 94, 304–311. [CrossRef]
- Rodrigues, R.; de Brito, J.; Sardinha, M. Mechanical properties of structural concrete containing very fine aggregates from marble cutting sludge. Constr. Build. Mater. 2015, 77, 349–356. [CrossRef]
- Soliman N.M., (2013). “Effect of using Marble Powder in Concrete Mixes on the Behavior and Strength of R.C. Slabs.” International Journal of Current Engineering and Technology, Vol.3, No.5.
- Aliabdo A.A., Elmoaty A.A.M., Elmoaty A. and Auda E.M., (2014). “Re-use of waste marble dust in the production of cement and concrete.” Construction and Building Materials 50 28–41.
- Mashaly, A.O.; El-Kaliouby, B.A.; Shalaby, B.N.; Gohary, A.M.E..; Rashwan, M.A. Effects of marble sludge incorporation on the properties of cement composites and concrete paving blocks. J. Clean. Prod. 2016, 112, 731–741. [CrossRef]
- Vaidevi, C., (2013). “Study on marble dust as partial replacement of cement in concrete.” Indian journal of engineering, 4(9), 14-16,.
- Singh J. and Bansal R.S., (2015). “Partial replacement of cement with waste marble powder with M25 grade.” International Journal of Technical Research and Applications, Volume 3, Issue 2.
- Rao B.K., (2016). “Study on Marble Powder as Partial Replacement of Cement in Normal Compacting Concrete.” IOSR Journal of Mechanical and Civil Engineering, Volume 13, Issue 4 01-05.
- Khuri, A.I.; Mukhopadhyay, S. Response surface methodology. WIREs Comput. Stat. 2010, 2, 128–149. [CrossRef]
- Fatemi, S.; Varkani, M.K.; Ranjbar, Z.; Bastani, S. Optimization of the water-based road-marking paint by experimental design, mixture method. Prog. Org. Coatings 2006, 55, 337–344. [CrossRef]
Figure 6.
Variation of desirability function for the multi-objective optimization on the Water/Cementitious ratio and MD/Cement ratio.
Figure 6.
Variation of desirability function for the multi-objective optimization on the Water/Cementitious ratio and MD/Cement ratio.
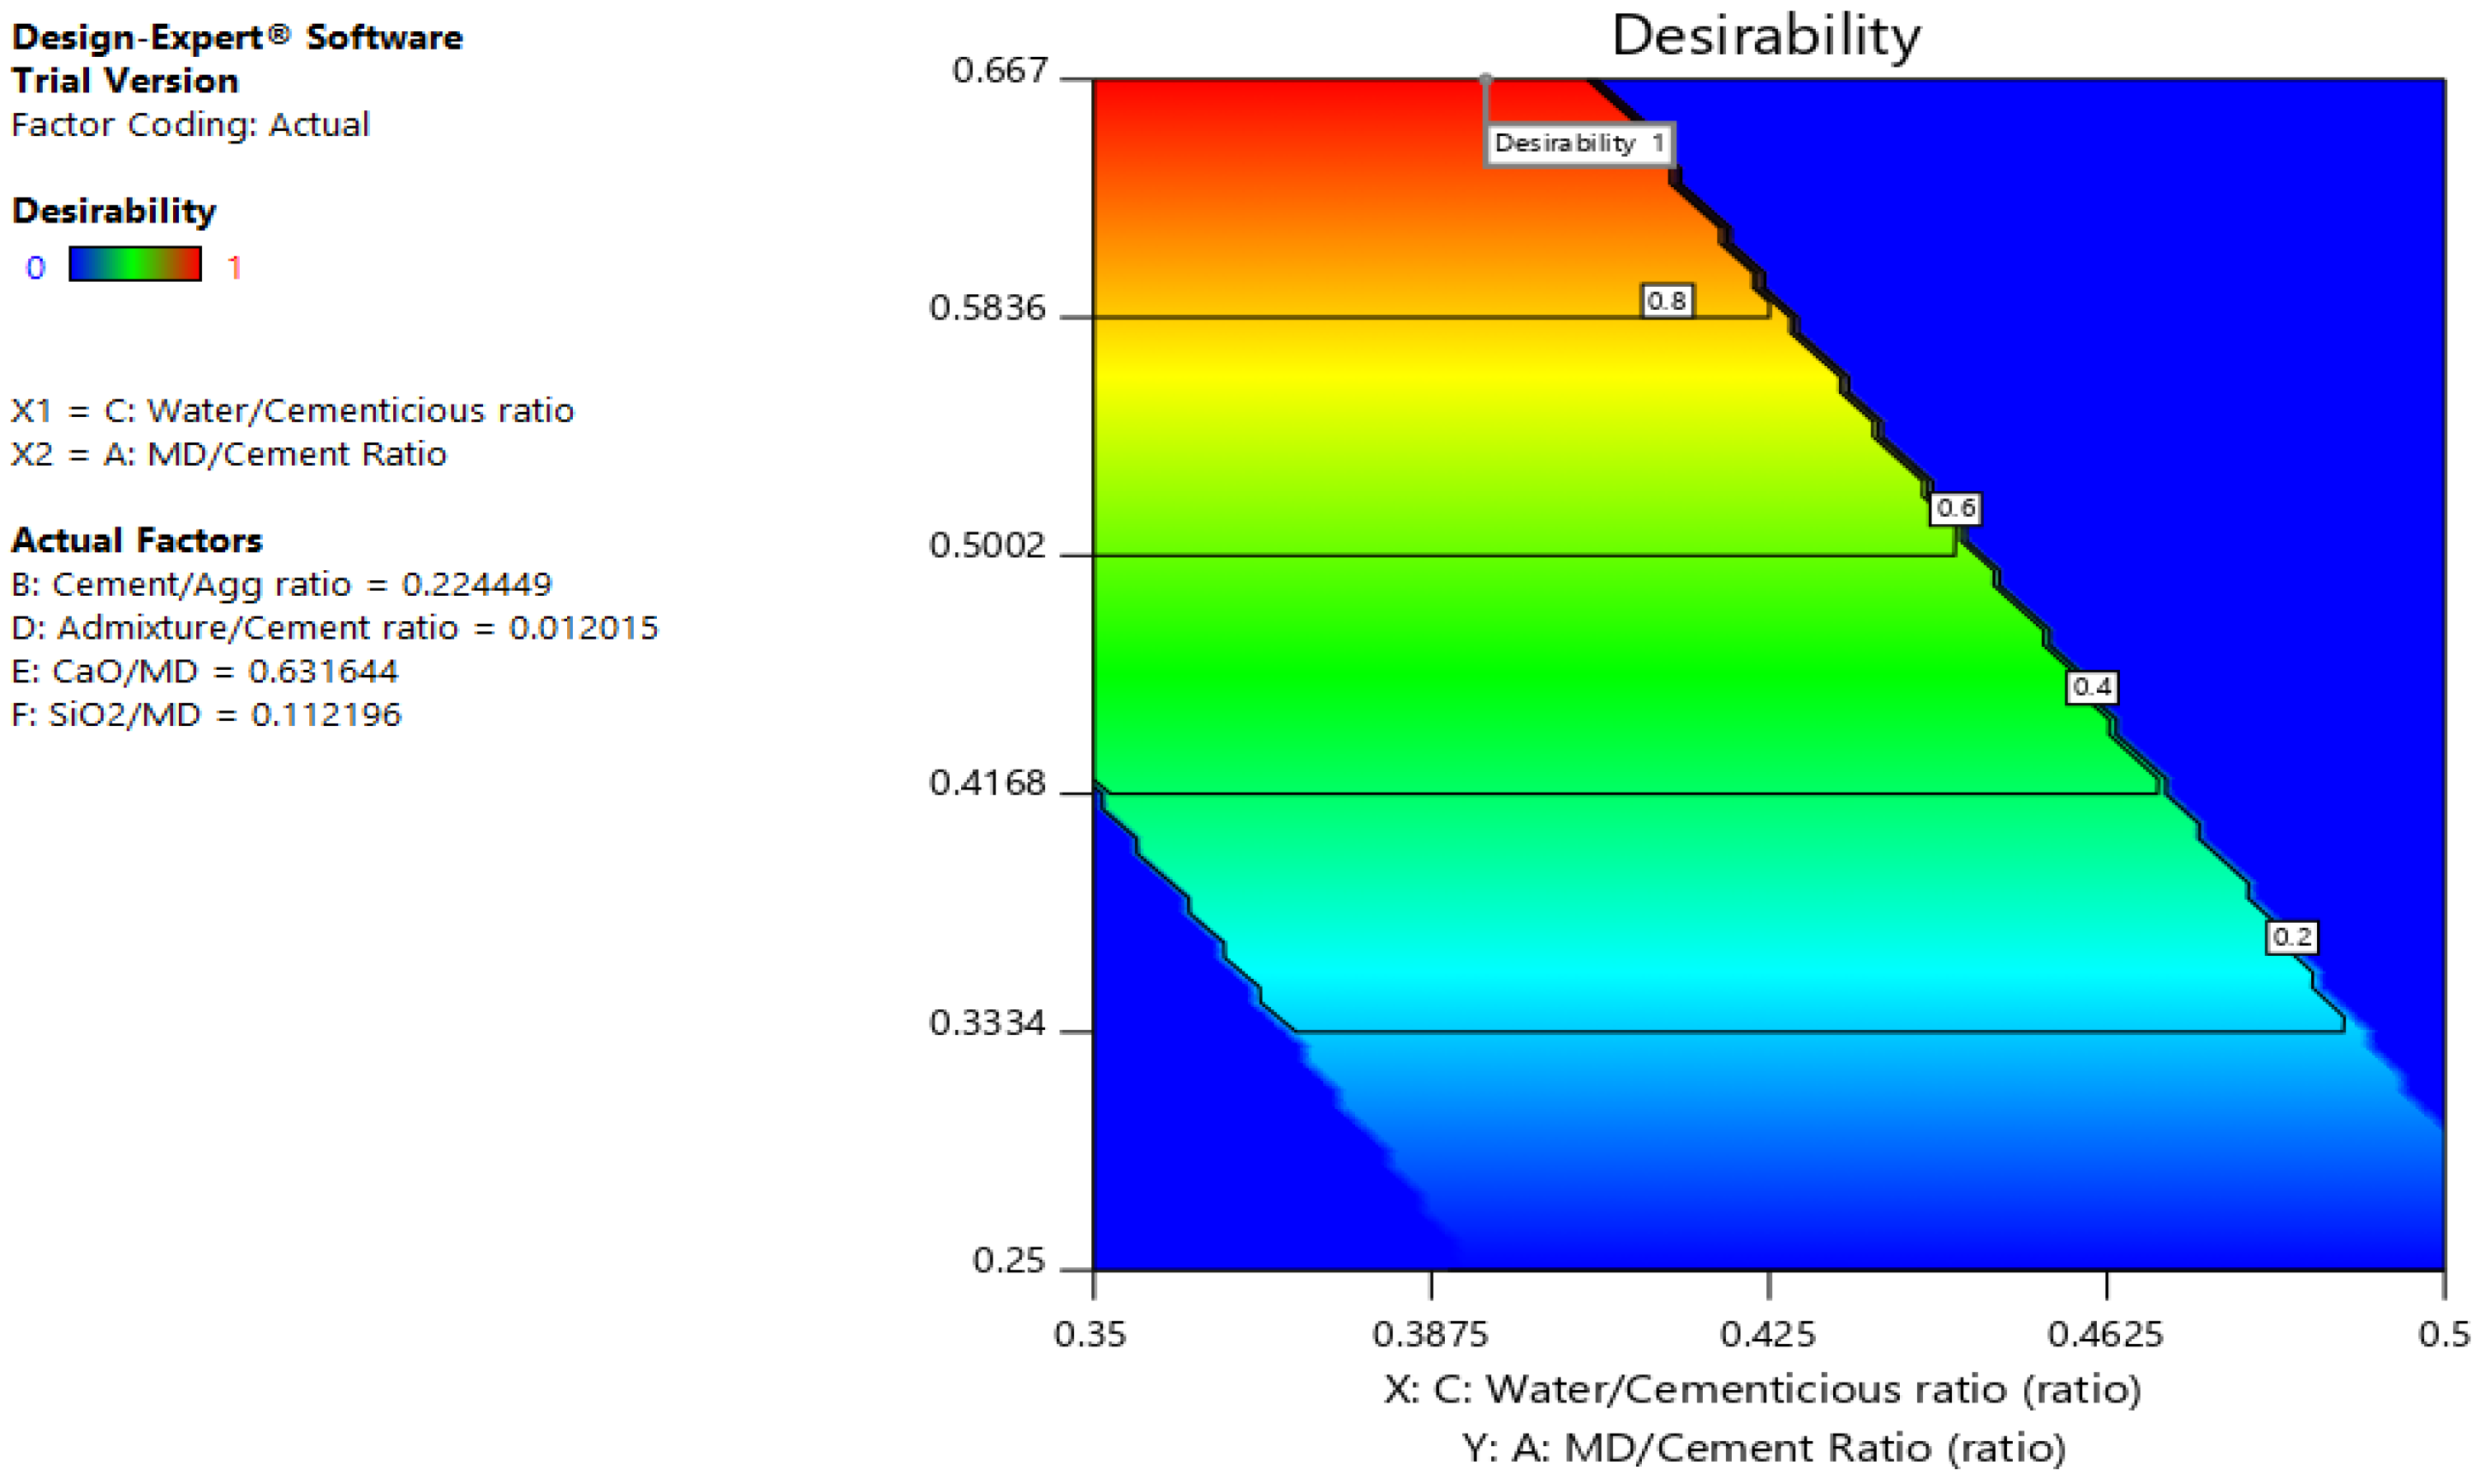
Table 6.
Optimization of the individual responses for MD incorporated green concrete.
| Name | Goal | Lower Limit | Upper Limit | Lower Weight | Upper Weight | Importance |
|---|---|---|---|---|---|---|
| A:MD/Cement Ratio | maximize | 0.25 | 0.667 | 1 | 1 | 3 |
| B: Cement/Agg. ratio | is in range | 0.1166 | 0.2421 | 1 | 1 | 3 |
| C:Water/Cementitious ratio | is in range | 0.35 | 0.5 | 1 | 1 | 3 |
| E:CaO/MD | is in range | 0.25 | 0.45 | 1 | 1 | 3 |
| F:SiO2/MD | is in range | 0.10 | 0.25 | 1 | 1 | 3 |
| Compressive strength | is in range | 35 | 45 | 1 | 1 | 3 |
Table 7.
Optimum mixtures for the specific criterions.
| Sno. | MD/ Cement Ratio | Cement/ Agg ratio | Water/ Cementitious ratio | CaO/ MD ratio | SiO2/ MD ratio | Compressive strength | Desirability | |
|---|---|---|---|---|---|---|---|---|
| 1 | 0.667 | 0.219 | 0.352 | 0.439 | 0.116 | 35.991 | 1 | |
| 2 | 0.667 | 0.242 | 0.38 | 0.443 | 0.1 | 38.186 | 1 | Selected |
| 3 | 0.667 | 0.236 | 0.375 | 0.371 | 0.102 | 36.719 | 1 | |
| 4 | 0.667 | 0.238 | 0.35 | 0.447 | 0.106 | 40.389 | 1 | |
| 5 | 0.667 | 0.242 | 0.407 | 0.448 | 0.123 | 35.208 | 1 | |
| 6 | 0.665 | 0.241 | 0.35 | 0.45 | 0.1 | 41.217 | 0.995 | |
| 7 | 0.651 | 0.242 | 0.414 | 0.45 | 0.113 | 35 | 0.963 | |
| 8 | 0.64 | 0.242 | 0.35 | 0.25 | 0.152 | 39.002 | 0.936 | |
| 10 | 0.603 | 0.209 | 0.358 | 0.45 | 0.1 | 35 | 0.846 | |
| 11 | 0.587 | 0.242 | 0.368 | 0.25 | 0.1 | 38.742 | 0.809 | |
| 12 | 0.586 | 0.241 | 0.393 | 0.25 | 0.25 | 35 | 0.806 | |
| 13 | 0.564 | 0.242 | 0.35 | 0.45 | 0.245 | 42.704 | 0.752 |
Table 8.
Experimental measurements Vs predicted model responses.
| Mix | MD/ Cement Ratio | Cement/ Agg ratio | Water/ Cementitious ratio | CaO/ MD ratio | SiO2/ MD ratio | Compressive strength Analytical (MPa) | Compressive Strength Experimental (MPa) | ARD (%) |
|---|---|---|---|---|---|---|---|---|
| M1 | 0.667 | 0.242 | 0.38 | 0.443 | 0.1 | 38.14 | 35.7 | -6.8 |
| M2 | 0.603 | 0.209 | 0.358 | 0.45 | 0.1 | 35.3 | 32.2 | -9.62 |
| M3 | 0.586 | 0.241 | 0.393 | 0.25 | 0.25 | 35.1 | 33.5 | -4.77 |
Disclaimer/Publisher’s Note: The statements, opinions and data contained in all publications are solely those of the individual author(s) and contributor(s) and not of MDPI and/or the editor(s). MDPI and/or the editor(s) disclaim responsibility for any injury to people or property resulting from any ideas, methods, instructions or products referred to in the content. |
© 2024 by the authors. Licensee MDPI, Basel, Switzerland. This article is an open access article distributed under the terms and conditions of the Creative Commons Attribution (CC BY) license (http://creativecommons.org/licenses/by/4.0/).
Copyright: This open access article is published under a Creative Commons CC BY 4.0 license, which permit the free download, distribution, and reuse, provided that the author and preprint are cited in any reuse.


