
Submitted:
10 November 2024
Posted:
11 November 2024
You are already at the latest version
Abstract
Organosilica films with a silicon oxide network and terminal methyl groups are widely used for various applications, including microelectronics. Most of them require high hydrophobicity and good mechanical properties, which is a challenge because Si–CH3 blocks some directions of the metal–oxide network. Here, we discuss an alternate way to prepare organosilica films in which the methyl group is changed to dimethyl. The films were deposited by the sol–gel technique using a non-ionic surfactant to provide porosity. The precursor content was varied to compare the films with different contents of Si–CH3 and Si(–CH3)2. The characterization of the films includes FTIR, ellipsometric porosimetry, PFQNM AFM, wetting contact angle, and dielectric constant. We found that the use of precursors containing dimethyl groups leads to an increase in Si–O–Si network connectivity and hence a higher Young's modulus value compared to films containing the same amount of methyl groups. However, the lower thermal stability of the dimethyl bonds leads to some deterioration of hydrophobic behavior and related properties. These new results extend the knowledge of organic-inorganic hybrid materials and provide new approaches for their applications.
Keywords:
organosilica films
; terminal dimethyl
; DEDMS
; porous films
; water contact angle
; Young's modulus
; adsorption ellipsometric porosimetry
1. Introduction
Organic-inorganic hybrid films are widely used in many fields, from biomedicine to electronics, as they combine the properties of both inorganic and organic materials [1,2,3,4]. Sol–gel chemistry offers a unique approach to obtaining organic-inorganic hybrids with different compositions by using several precursors that react with each other to form a metal oxide network and link organic chains [5]. One of the best-known and most important materials for various applications is organically modified silicates (ORMOSILs) or organosilica glasses (OSG) [6,7,8,9]. These materials, based on a silicon-oxygen network, offer good thermal and chemical stability, adhesion, mechanical, optical, and electrical properties. Their good compatibility with materials and processes used in microelectronics allows for their use in semiconductor manufacturing [10].
One of the most important microelectronic applications is as an insulator in the interconnection of integrated circuits. Silicon dioxide has been used for this purpose for many decades due to its excellent dielectric properties. Continuous advancements in speed and reductions in the size of microelectronic devices are driven by the introduction of innovative technologies and materials with enhanced properties. However, as the density of components increases, issues related to crosstalk in transistor structures emerge. Addressing this challenge requires a comprehensive approach, particularly the implementation of new conductors with lower resistance and insulating layers with reduced dielectric constants. For these reasons, silicon dioxide was replaced firstly on organosilica and subsequently on porous organosilica. These materials, which have a lower permittivity than SiO2, are referred to as low-k dielectrics [11].
The inverse relationship between Young's modulus and the porosity of the material, which in turn affects mechanical strength, remains a significant challenge. High values of Young's modulus (more than 5 GPa [12]) are essential for the successful implementation of porous dielectrics in integrated circuit (IC) manufacturing [13]. Another significant issue associated with the porous structure is the adsorption of moisture, which subsequently deteriorates the dielectric properties of the material [14,15]. Therefore, to enhance hydrophobicity, it is essential to modify materials using various precursors that contain chemical groups capable of imparting high hydrophobicity. The most effective modification method involves the use of precursors with terminal methyl (–CH₃) groups. The modification of the pore surface by Si–CH₃ leads to increased silicate hydrophobicity and a reduction in the dielectric constant (k) [13,16,17,18].
Copolymers derived from tetraethoxysilane (TEOS) and methyltriethoxysilane (MTEOS) have gained significant popularity in sol–gel synthesis. The incorporation of the MTEOS precursor into the copolymer composition enhances hydrophobicity and decreases the dielectric constant [19]. This effect can be attributed to the presence of a terminal methyl group in the precursor molecule. Surface hydrophobicity depends on the number of introduced Si–CH3 bonds and residual Si–OH bonds present on the surface [20]. To achieve sufficient hydrophobicity, the content of MTEOS must be increased. However, an increase in the methyl-containing precursor leads to a reduction in the connectivity of the Si–O–Si network and consequently to a reduction in mechanical properties [21]. For this reason, it is challenging to strike a balance between hydrophobicity and film strength when using these two precursors. Consequently, there is a need to explore alternative methods for producing organosilica glasses.
In this study, we aimed to replace MTEOS, which contains a single terminal group, with diethoxydimethylsilane (DEDMS), which features two terminal methyl groups attached to a single silicon atom (a terminal dimethyl group). Several research groups have reported that the DEDMS precursor exhibits high hydrophobicity due to the presence of these two terminal methyl groups [22,23]. DEDMS-based copolymers are widely used in hybrid materials, including bulk materials, to improve hydrophobicity [24,25,26]. However, the properties of organosilica films produced from precursors containing terminal dimethyl groups have not been extensively investigated. The objective of this research is to provide a comprehensive and detailed analysis of organosilica films with varying concentrations of methyl and dimethyl groups. This analysis will involve a comparative examination of the chemical composition, microstructure, hydrophobic characteristics, mechanical properties, and electrical properties of the materials.
2. Materials and Methods
The thin film samples were prepared from film-forming solutions using the sol–gel method. Two copolymers were selected for experiments. The first copolymer was synthesized from tetraethoxysilane (TEOS, 99.999%, Sigma-Aldrich, St. Louis, MI, USA) and methyltriethoxysilane (MTEOS, 99%, Sigma-Aldrich, St. Louis, MI, USA). Hydrolysis and copolymerization of TEOS and MTEOS should result in a silicon oxide network with terminal methyl groups, as the Si–CH3 bond is not hydrolyzed. The synthesis of the second copolymer was also based on TEOS, but instead of MTEOS, a precursor with two terminal methyl groups, namely diethoxydimethylsilane (DEDMS, 97%, Acros Organics, Geel, Belgium), was added. Accordingly, this copolymer should contain dimethyl instead of methyl groups. Precursor molecules are illustrated in Figure 1. The solutions also differed in the number of methyl groups per silicon atom. The CH3/Si ratio was 0.2, 0.6, and 1.0 for both solutions containing MTEOS (series ‘y’) and those with DEDMS (series ‘w’). Thus, the solution with a CH3/Si ratio of 1 was prepared using either MTEOS or a 1:1 molar ratio of TEOS to DEDMS (see Table 1).
After maintaining the temperature at 60 °C for 180 min, the solutions were diluted with an alcohol mixture to achieve concentrations of ~1.2 wt% silicon, resulting in films with thicknesses ranging from 90 to 160 nm. The sacrificial surfactant Brij® L4 (molecular weight 362, Sigma-Aldrich, St. Louis, MI, USA) was added at a concentration of 45 wt% relative to the mass of the solid phase to induce porosity in these copolymer films via evaporation-induced self-assembly (EISA) [27].
The films were spin-coated onto monocrystalline silicon wafers with resistivities of both 0.005 and 12 Ω∙cm, using a rotation speed of 2500 rpm. Subsequently, they were soft-baked on a hot plate at 150 °C for 30 min, followed by heat treatment in a furnace at 400 °C for 30 min in air.
The thickness (d) and refractive index (RI, n) at λ = 632.8 nm of the films were measured using spectral ellipsometry (SE) with an SE 850 ellipsometer (Sentech, Berlin, Germany) at a beam incidence angle of 70° over a wavelength range of 320–800 nm. The calculations were performed within the framework of the three-layer Cauchy model: air/film/silicon. Based on the known thickness values obtained after low-temperature drying and after annealing at 400 °C, the film shrinkage (Δd) during heat treatment was calculated using the following formula:
where d1 is the thickness of the soft-baked film, and d2 is the thickness after the heat treatment at 400 °C.
The infrared (IR) spectra were recorded using a Nicolet 6700 Fourier-transform infrared (FTIR) spectrometer (Thermo Electron Corporation, Waltham, MA, USA) in transmission mode, with a resolution of 4 cm⁻¹ and a minimum of 64 scans. To minimize noise in the spectra caused by the atmosphere, the spectrometer was intensively purged with dry, pure nitrogen. This purging process was conducted for at least 50 min, with an increased flow rate during the first half hour, ~50 standard cubic feet per hour (scfh), compared to the normal rate of 30 scfh.
The RI is used to calculate the relative or full porosity within the framework of the Lorentz–Lorenz model. In this model, the relative volume fraction of pores in the film is determined using the following expression [28,29]:
where neff is the RI of the porous film; nmat is the RI of the dense silicate film, equal to 1.46.
The open porosity, which is accessible to adsorbate molecules, and the pore radius distribution were evaluated using ellipsometric porosimetry (EP). In the porosimetry setup, the partial pressure of the adsorptive is precisely controlled to regulate the composition of the vapor–gas mixture delivered to the sample through a specialized nozzle, employing a custom-developed program. One component of the vapor–gas mixture is dry nitrogen. The second component is also dry nitrogen, which functions as a carrier gas that passes through a thermo-stabilized bubbler containing liquid isopropyl alcohol (IPA), which is utilized as the adsorbate. The degree of filling of the open porous structure of the films with condensed adsorbate was calculated using the modified Lorentz–Lorenz equation [28,29]:
where neff is the RI of the porous film, partially or completely filled with adsorbate molecules, np is the RI of the film before adsorption (empty pores), and nads is the RI of the liquid adsorbate (1.377 for IPA). The pore size was determined by analyzing the gradual filling (adsorption) and emptying (desorption) curves, using the Kelvin and the Dubinin–Radushkevich formulas for meso- and micropore size distribution, respectively. The radius obtained from adsorption isotherms corresponds to the size of the internal cavities, while the radius derived from desorption isotherms reflects the interconnections among these cavities and the external environment.
Young's modulus is a fundamental mechanical property used to evaluate the elastic strength of a film. The values of Young's modulus are determined based on deformations induced by adsorption or desorption, exhibiting a more pronounced dependence. The Young's modulus values (E) are calculated by approximating several points from the experimental curve that describes the change in film thickness (d) as a function of the partial pressure (P/P0) of adsorbate vapors, using [30]:
where d0 represents the initial film thickness prior to the desorption process, specifically at P/P0 = 1. By fitting the experimental data points of the deformation isotherm to a logarithmic function (Equation (4)), we derive the coefficient (κ), which is then used to calculate Young's modulus [30]:
where R is the gas constant, T is the temperature in Kelvin, and VL is the molar volume of the adsorbate. This method enables the estimation of Young's modulus values for micro- and mesoporous films, reaching up to 5–8 GPa.
The mechanical properties of the films were also evaluated using the PeakForce Quantitative Nanomechanics (PFQNM) semi-contact mode with a Dimension Icon atomic force microscope (Bruker, Billerica, MA, USA). AFM studies in the PFQNM mode were conducted under ambient conditions using RTESPA525 silicon probes, which have a stiffness constant of k = 200 N/m and a probe tip radius of R = 8 nm, in accordance with refs. [31,32].
To investigate the surface hydrophobicity, a method for measuring the contact angle with water (WCA) was employed. For this purpose, a DSA25B WCA device (KRÜSS, Hamburg, Germany) was utilized. The WCA values were calculated as the average of at least three points, with ten photographs taken at each point. The measurements were conducted at room temperature (~23 °C). Data processing was conducted using KRÜSS ADVANCE version 1.13.0.21301.
The permittivity (k) was determined from the measured capacitance data using the formula for a parallel-plate capacitor. This measurement was performed using a mercury probe (MDC 802B-150) with a contact diameter of ~790 µm and an MDC CSM/Win Semiconductor measurement system (Materials Development Corporation, Andover, MA, USA) that contains a 4284A LCR meter (Agilent, Santa Clara, CA, USA). The metal-insulator-semiconductor structure was formed by positioning a mercury point electrode on a film deposited on highly doped silicon samples. The permittivity was calculated based on the frequency dependence of the capacitance measured at zero bias voltage, within a frequency range from 1 kHz to 1 MHz.
3. Results and Discussions
Table 1 presents the names of the samples, their compositions, and the results obtained from SE measurements: thickness (d), RI (n) after a soft bake on a hot plate at 150 °C for 30 min, and after annealing in a furnace at 400 °C for 30 min. Additionally, it includes calculated film shrinkage (Δd) and full porosity (Vfull). The crosslinking coefficient is defined as the number of Si–O–Si bonds present at specific precursor ratios, expressed by the formula:
where mY and mZ represent the mole fractions of the methyl-containing precursors (MTEOS or DEDMS) and TEOS, respectively; YO and ZO denote the number of oxygen atoms, while YSi and ZSi indicate the number of silicon atoms in the corresponding precursors. A higher value of x indicates a more extensively cross-linked system, which is expected to enhance the elastic stiffness of the film material. For example, silicon dioxide has the chemical formula SiO₂, which indicates that the value of x is equal to 2.

Table 1.
Calculated compositional parameters and results obtained from spectral ellipsometry of porous organosilica films prepared from tetraethoxysilane (TEOS) mixed with either methyltriethoxysilane (MTEOS) or diethoxydimethylsilane (DEDMS).
Table 1.
Calculated compositional parameters and results obtained from spectral ellipsometry of porous organosilica films prepared from tetraethoxysilane (TEOS) mixed with either methyltriethoxysilane (MTEOS) or diethoxydimethylsilane (DEDMS).
| Sample name |
TEOS/ MTEOS ratio |
TEOS/ DEDMS ratio |
TEOS mole fraction |
CH3/ Si ratio |
Cross- linking coefficient x in SiOx |
Soft bake 150 °С, 30 min |
Heat treatment 400 °С, 30 min |
||||
|---|---|---|---|---|---|---|---|---|---|---|---|
|
d (nm) [±2] |
n [±0.005] |
d (nm) [±2] |
n [±0.005] |
Δd (%) [±2] |
Vfull (%) [±2] |
||||||
| 02y | 80/20 | - | 0.8 | 0.2 | 1.9 | 116 | 1.398 | 101 | 1.239 | 13 | 45 |
| 02w | - | 90/10 | 0.9 | 149 | 1.308 | 129 | 1.253 | 13 | 42 | ||
| 06y | 40/60 | - | 0.4 | 0.6 | 1.7 | 105 | 1.374 | 97 | 1.243 | 8 | 44 |
| 06w | - | 70/30 | 0.7 | 105 | 1.417 | 94 | 1.275 | 10 | 37 | ||
| 10y | 0/100 | - | 0 | 1 | 1.5 | 96 | 1.413 | 91 | 1.285 | 5 | 35 |
| 10w | - | 50/50 | 0.5 | 102 | 1.444 | 93 | 1.304 | 9 | 31 | ||
In this Table: d—thickness, n—refractive index, Δd—shrinkage, Vfull—full porosity. The initial digits in the sample names (02, 06, 10) represent the number of methyl groups per silicon atom: 0.2, 0.6, and 1.0, respectively. The designation ’y’ denotes the MTEOS–TEOS copolymer, while ’w’ indicates the DEDMS–TEOS copolymer. The second and third columns display the ratios of TEOS to the methyl-containing precursors, which determine the composition of the films. The fifth column illustrates the ratios of methyl groups to silicon atoms. The crosslinking coefficient is determined by the number of Si–O–Si bonds present at specific precursor ratios, as outlined in Equation (6). Higher values of this coefficient indicate a more crosslinked system.
As illustrated in Table 1, both series of samples demonstrate a decrease in the RI as the annealing temperature increases from 150 °C to 400 °C. This phenomenon can be attributed to the thermal degradation of the porogen and the subsequent formation of a porous structure within the films. In addition, the samples from the ‘y’ series exhibit higher relative porosity values compared to the samples from the ‘w’ series, which can be attributed to the significant thermal shrinkage observed in the latter.
From Figure 2, it can be seen that although calculations indicate the same number of methyl groups per silicon atom in both the ’y’ and ’w’ series, the ’w’ samples have a lower number of methyl groups (peak at 1280–1265 cm⁻¹). This discrepancy may be attributed to the lower thermal stability of dimethyl groups. In the case of CH3/Si = 0.2, sample ‘w’ exhibits a more pronounced peak at a position of ~3500 cm⁻¹ and contains a higher amount of hydrogen-bonded surface silanols, along with adsorbed water, compared to sample ‘y’. The narrow peak at ~3750 cm–1 is attributed to the peak associated with isolated –OH groups that are not involved in water adsorption or interactions with each other [33,34]. Their appearance also indicates a strong correlation with Si–OH at ~950 cm–1, while the methyl group transforms to Si–OH during thermal destruction [35,36]. It is also worth noting the broadening of the Si(–CH3)1,2 peak, which may indicate partial destruction of the Si(–CH3)2 group (~1265 cm–1) [37,38] during heat treatment at 400 °C. The asymmetry of the Si(–CH3)1,2 peak (refer to the inset in Figure 2) indicates that some Si atoms have only a single methyl group (~1275 cm–1) [37,38] after annealing.
The higher quantity of uncondensed residual silanol groups in the dimethyl samples can be attributed to the lower functionality of the DEDMS precursor, which contains two ethoxy (–OEt) functional groups, in contrast to MTEOS, which has three OEt groups available for polycondensation.
The peak associated with the presence of Si–CH3 and/or Si(–CH3)2 at ~1270 cm–1 is not clearly distinguishable [39]. It seems that there should be a similar relative amount of these groups, adjusted for the number of Si–O–Si bonds, but there are about 1.6 times fewer methyl groups in the ‘w’ series samples. The most plausible explanation for this discrepancy is the broadening of this peak in the ‘w’ series spectra, coupled with the strengthening of the cage component, which is also shifted to the region of higher wavenumbers. Such overlapping of bands often leads to a decrease in the reliability of direct area under the curve (AUC) determination, typically resulting in an underestimation of the values obtained for the less pronounced peak. This is indirectly supported by the lack of noticeable differences in the region of C–H group vibrations at 3000–2900 cm–1 (see Table 4).
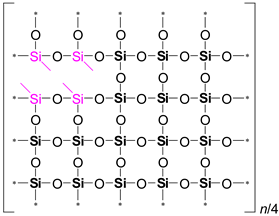
It is evident from Table 2 that the ratio of the Network/Cage absorption intensities is significantly higher for the ’w’ series samples. The network component is characterized by a long Si–O–Si chain (SiO2, i.e., x = 2; see Figure 3a) and is located within the range of 1100–1050 cm−1. A networked suboxide consists of a long chain of Si–O–Si with terminal groups, specifically SiOx, where 1 < x < 2 (see Figure 3b). This structure is observed within the range of 1000 to 1050 cm–1. In contrast, the cage component is associated with a short chain of Si–O–Si (see Figure 3c) and is situated within the range of 1250–1100 cm−1. The Network/Cage ratio provides an indirect assessment of the mechanical strength of the structure: higher values indicate a stronger structure [41,42,43]. This finding correlates well with the Young's modulus values obtained through porosimetry and PFQNM AFM, as will be demonstrated later in this paper. This increase can be attributed to the greater amount of the TEOS precursor used, which promotes crosslinking. However, this also results in a side effect: increased shrinkage. Note that in the case of CH3/Si = 0.2, this effect is less pronounced due to the higher concentration of residual silanol groups. These terminal silanol groups also contribute to an increase in the networked suboxide component, resulting in a slight rightward shift (red shift) in the position of the maximum of the Si–O–Si band, as well as broadening it.
The pore structure characteristics of the two copolymer films show a difference. As shown in Figure 4a, at a low precursor to TEOS ratio, the ‘y’ and ’w’ series samples exhibit fairly similar pore radius distributions, with a slightly larger average pore radius for the ’y’ samples, which may be attributed to an increased value of open porosity [44]. As the concentration of the TEOS precursor in the copolymers decreases, the differences in pore radius distributions between the ‘y’ and ’w’ series samples become increasingly pronounced. Specifically, the ’w’ series samples, which contain dimethyl groups, exhibit pores with a smaller radius. This phenomenon can be attributed to an increased crosslinking density, and it becomes more pronounced as the CH3/Si ratio increases. As is known from ref. [30], a more crosslinked system is indicated by a less steep thickness isotherm (see the bottom line of Figure 4). Consequently, the ‘w’ series samples exhibit a higher Young's modulus value compared to the ’y’ series. It is also important to note that, in the case of CH3/Si = 0.6, the ’w’ series samples continue to exhibit a bimodal distribution, while the ’y’ series samples lose their microporous structure. This loss may be attributed to smaller pores merging into larger ones, resulting in an increase in the average pore radius. More detailed data obtained from porosimetry are presented in Table 3.
Despite the results obtained in non-porous copolymer films with similar compositions [23], which indicate a decrease in hardness and Young's modulus when replacing MTEOS with DEDMS, our EP results present a contrasting perspective. Moreover, this dynamic is evident across the entire range of ratios related to the TEOS precursor.
Table 4.
AFM Young's modulus data for porous organosilica films prepared from tetraethoxysilane (TEOS) mixed with either methyltriethoxysilane (MTEOS)—designated as series ‘y’—or with diethoxydimethylsilane (DEDMS)—designated as series ‘w’.
Table 4.
AFM Young's modulus data for porous organosilica films prepared from tetraethoxysilane (TEOS) mixed with either methyltriethoxysilane (MTEOS)—designated as series ‘y’—or with diethoxydimethylsilane (DEDMS)—designated as series ‘w’.
| CH3/Siratio | AFM Young's modulus (GPa) [±0.5] |
|
|---|---|---|
| Series ‘y’ | Series ‘w’ | |
| 0.2 | 7.5 | 8.9 |
| 0.6 | 4.2 | 4.5 |
| 1.0 | 2.2 | 2.1 |
Table 4 shows that the PFQNM AFM measurements confirm an increase in Young's modulus for samples with terminal dimethyl groups. However, this increase is counterbalanced by significant measurement errors, especially in samples with low Young's modulus values (CH3/Si = 1.0). To illustrate the differences in Young's modulus and the Network/Cage ratios, corresponding simulations were conducted and are presented in Table 5.
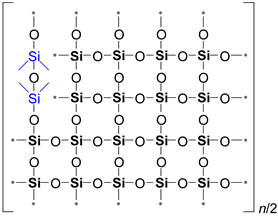
Looking at Table 5, we observe that as the MTEOS content increases relative to the TEOS precursor, the ratio of fully crosslinked silicon atoms to the total number of silicon atoms (ψ) goes down. This trend ultimately leads to the complete disappearance of these atoms when only MTEOS is used. In the ‘w’ series samples, the presence of two methyl groups attached to silicon also results in a decrease in the number of fully crosslinked Si atoms as the concentration of the DEDMS precursor increases. However, the DEDMS precursor retains more of these atoms than the ‘y’ series does. Thus, the increased number of these atoms correlates positively with the higher Young's modulus values observed in the ‘w’ series samples. In reality, the crosslinking coefficient x does not accurately represent the degree of crosslinking, which is determined solely by the precursor responsible for generating fully crosslinked silicon atoms within the film; that is, the mole fraction of TEOS ≡ ψ.
Contact angle measurements are illustrated in Figure 5. The ’w’ samples, which had the dimethyl group, showed lower levels of hydrophobicity. This is likely due to the decreased number of methyl groups in the films that underwent heat treatment. It is also important to note that at a concentration of 100 mol% MTEOS, the film becomes hydrophobic, as its contact angle exceeds 90° [45]. In contrast, a film composed of 100 mol% DEDMS has a contact angle that is at the threshold of hydrophobicity. Angle values for: 02y—34.8°±0.4°, 06y—75.4°±0.6°, 10y—112.2°±1.7°, 02w—38.5°±3°, 06w—62.2°±1.3°, and 10w—89.5°±1°.
The dielectric constant increases in porous organosilica films when water is absorbed because water has a very high permittivity (k ≈ 81). Figure 6 shows the dependence of the dielectric constant versus CH3/Si content in copolymer films. An increase in the amount of methyl content leads to a decrease in the dielectric constant for both series. A higher amount of methyl groups and lower silanol content in the ‘y’ series lead to lower values of the dielectric constant. Figure 6b shows the relationship between permittivity and full porosity as described by the Clausius–Mossotti equation for SiO2. Samples 02w, 02y, and 06w are above the conventional boundary as they have a high concentration of surface silanols. The effect of water adsorption is most pronounced in the films prepared from pure TEOS, which exhibit higher leakage currents and capacitance that strongly depend on frequency. For this reason, the dielectric constant can have unusually high values, with k > 8 [46], compared to 2.3 for 40% porous SiO2 (see Figure 6b).
Therefore, the distribution and number of methyl groups within porous organosilica films can significantly impact the structure, including pore size, as well as surface chemistry, elastic properties, and dielectric constant. This provides a potential avenue for the development of films with tailored properties for diverse applications.
4. Conclusions
Organosilica films are versatile materials with a wide range of applications, including electronics, optics, catalysis, drug delivery, and many others. In the field of electronics, porous organosilica films are used as a material with a low dielectric constant. Most applications require high hydrophobicity, as water adsorption degrades film properties. The most common way to provide hydrophobicity is to protect the film surface with methyl groups. However, this leads to a reduction in the connectivity of the silicon-oxygen network and, as a result, to a degradation of the mechanical properties of the films. To find an optimal balance between these properties, we compare porous organosilica films containing methyl and dimethyl groups attached to the silicon atom.
In sol–gel synthesis, a hybrid organic-inorganic material is produced using two components: one is silicon alkoxide TEOS, which forms only a Si–O–Si network, while the other is a methyl-modified alkoxide, MTEOS, which contains Si–CH3 bonds that do not undergo hydrolysis and remain in the final material. This set of experiments is referred to as the ’y’ series. To prepare films containing Si(–CH3)2 bonds, we used diethoxydimethylsilane (DEDMS) instead of MTEOS, which is used in the ’w’ series. The film composition was varied by adjusting the ratio of the two components, quantified as the number of methyl groups per silicon atom: 0.2, 0.6, and 1.0. The non-ionic surfactant Brij® was used to provide porosity by self-assembly. The study included characterization by FTIR, spectral ellipsometry, ellipsometric porosimetry, PFQNM AFM method, water contact angle, and dielectric constant.
The study revealed that, despite both the ‘y’ and ‘w’ series samples having the same ratio of methyl groups to silicon atoms, the ’y’ series films exhibit a greater number of methyl groups. This finding is supported by the FTIR spectra. Dimethyl groups are susceptible to thermal destruction, which subsequently impacts the processes of secondary condensation and crosslinking. Additional crosslinking influences the porous structure by strengthening the pore walls, as evidenced by the increased Young's modulus values of films derived from the DEDMS precursor, which increased by ~1 GPa.
The porosimetry study indicates that the ’w’ series samples exhibit a smaller average pore size compared to the ’y’ series samples. This observation is consistent with the observed decrease in open porosity. The reduced average pore size can also be attributed to increased crosslinking that occurs during the thermal destruction of dimethyl groups.
An important observation is the higher concentration of silanol groups in the ’w’ series samples, which influences water adsorption and subsequently leads to increased dielectric constant values. Additionally, the lower dielectric constant values can be attributed to reduced porosity. The combination of factors, including an increased number of Si–OH groups, a reduced number of methyl groups, and lower open and total porosity values compared to the ’y’ series samples, results in decreased hydrophobicity of the samples derived from the precursor with the terminal dimethyl group, as confirmed by WCA measurements.
A speculative model of the crosslinking behavior of MTEOS–TEOS and DEDMS–TEOS copolymer films indicates that, at equivalent ratios of methyl groups to silicon atoms, films derived from the DEDMS precursor exhibit a higher degree of crosslinking. This observation correlates with the Young's modulus values obtained through both ellipsometric porosimetry and AFM methods. It is also indirectly supported by quantitative FTIR analysis, specifically the Si–O–Si broadband.
Thus, the copolymer films containing dimethyl groups provide a higher degree of crosslinking and, therefore, higher mechanical properties than films containing the same amount of methyl groups. However, the lower thermal stability of the dimethyl bonds leads to a decrease in hydrophobic behavior and related properties, such as the dielectric constant. These data will increase our knowledge about organic-inorganic hybrid films and their structural and physical properties. The choice between these two components for practical applications depends on the requirements of the particular application.
Author Contributions
Conceptualization, K.V.; Methodology, A.V. and D.S.; Validation, A.V. and K.V.; Formal Analysis, D.V.; Investigation, A.V., D.V. and D.S.; Resources, D.S.; Data Curation, A.V., D.V. and D.S.; Writing—Original Draft Preparation, D.V.; Writing—Review and Editing, A.V. and K.V.; Visualization, A.V., D.V. and D.S.; Supervision, K.V. and A.S.; Project Administration, K.V.; Funding Acquisition, A.S. All authors have read and agreed to the published version of the manuscript.
Funding
This work was supported by the Russian Science Foundation [grant number 23-79-30016] for the methodology of investigation and characterization of OSG low-k film properties using ellipsometry, porosimetry, FTIR, WCA techniques (A.V., D.V., K.V. and A.S.). D.S. expresses his gratitude to the Ministry of Science and Higher Education of the Russian Federation [project number FSFZ-2023-0005] for financial support in the preparation of OSG low-k films.
Data Availability Statement
Data are contained within the article. The raw data presented in this study are available on request from the authors.
Conflicts of Interest
The authors declare that they have no known competing financial interests or personal relationships that could have appeared to influence the work reported in this paper.
References
- Barrino, F. Hybrid Organic–Inorganic Materials Prepared by Sol–Gel and Sol–Gel-Coating Method for Biomedical Use: Study and Synthetic Review of Synthesis and Properties. Coatings 2024, 14(4), 425. [CrossRef]
- Singh, S.; Chen, H.; Shahrokhi, S.; Wang, L.P.; Lin, C.-H.; Hu, L.; Guan, X.; Tricoli, A.; Xu, Z.J.; Wu, T. Hybrid Organic–Inorganic Materials and Composites for Photoelectrochemical Water Splitting. ACS Energy Lett. 2020, 5(5), 1487–1497. [CrossRef]
- Arya, M.; Heera, S.; Meenu, P.; Deepa, K.G. Organic-inorganic hybrid materials and architectures in optoelectronic devices: Recent advancements. Chem. Phys. Mater. 2024, 3(3), 252–272. [CrossRef]
- Mir, S.H.; Nagahara, L.A.; Thundat, T.; Mokarian-Tabari, P.; Furukawa, H.; Khosla, A. Review—Organic-Inorganic Hybrid Functional Materials: An Integrated Platform for Applied Technologies. J. Electrochem. Soc. 2018, 165, B3137. [CrossRef]
- Owens, G.J.; Singh, R.K.; Foroutan, F.; Alqaysi, M.; Han, C.-M.; Mahapatra, C.; Kim, H.-W.; Knowles, J.C. Sol–gel based materials for biomedical applications. Progress in Materials Science 2016, 77, 1–79. [CrossRef]
- Mackenzie, J.D.; Bescher, E.P. Structures, Properties and Potential Applications of Ormosils. J. Sol-Gel Sci. Technol. 1998, 13, 371–377. [CrossRef]
- Pagliaro, M.; Ciriminna, R.; Wong, M.; Man, C.; Campestrini, S. Better Chemistry through Ceramics: The Physical Bases of the Outstanding Chemistry of ORMOSIL. J. Phys. Chem. B 2006, 110(5), 1976–1988. [CrossRef]
- Palmisano, G.; Bourhis, E.L.; Ciriminna, R.; Tranchida, D.; Pagliaro, M. ORMOSIL Thin Films: Tuning Mechanical Properties via a Nanochemistry Approach. Langmuir 2006, 22(26), 11158–11162. [CrossRef]
- Poddighe, M.; Innocenzi, P. Hydrophobic Thin Films from Sol–Gel Processing: A Critical Review. Materials 2021, 14(22), 6799. [CrossRef]
- Madayag, A.C.; Zhou, Z. Optimization of spin-on-glass process for multilevel metal interconnects. In Proceedings of the Fourteenth Biennial University/Government/Industry Microelectronics Symposium (Cat. No. 01CH37197), Richmond, VA, USA, 20–20 June 2001, pp. 136–139. [CrossRef]
- Voort, P.; Esquivel, D.; Canck, E.; Goethals, F.; Driessche, I.; Romero-Slguero, F. Periodic mesoporous organosilicas: from simple to complex bridges; a comprehensive overview of functions, morphologies and applications. Chem. Soc. Rev. 2013, 42, 3913–3955. [CrossRef]
- Choi, H.; Kim, T.; Kim, T.; Moon, S.; Yoo, S.; Parale, V.G.; Dhavale, R.P.; Kang, K.; Sohn, H.; Park, H.-H. Ultralow dielectric cross-linked silica aerogel nanocomposite films for interconnect technology. Appl. Mater. Today 2022, 28, 101536. [CrossRef]
- Nenashev, R.; Wang, Y.; Liu, C.; Kotova, N.; Vorotilov, K.; Zhang, J.; Wei, S.; Seregin, D.; Vishnevskiy, A.; Leu, J.; Baklanov, M.; Effect of Bridging and Terminal Alkyl Groups on Structural and Mechanical Properties of Porous Organosilicate Films. ECS J. Solid State Sci. Technol. 2017, 6, N182–N188. [CrossRef]
- Komandin, G.A.; Nozdrin, V.S.; Spektor, I.E.; Porodinkov O.E.; Seregin, D.S.; Visnevskiy, A.S.; Vorotilov, K.A.; Sigov, A.S. Dielectric contribution of the IR absorption bands of porous organosilicate glass thin films on a platinum sublayer. J. Phys. D. 2021, 54(21), 215304(1–8). [CrossRef]
- Vishnevskiy, A.S.; Vorotyntsev, D.A.; Seregin D.S.; Vorotilov, K.A. Effect of surface hydrophobisation on the properties of a microporous phenylene-bridged organosilicate film. J. Non-Cryst. Solids 2022, 576, 121258. [CrossRef]
- Liu, C.; Qi, Q.; Seregin, D.S.; Vishnevskiy, A.S.; Wang, Y.; Wei, S.; Zhang, J.; Vorotilov, K.A.; Dultsev, F.N.; Baklanov, M.R. Effect of terminal methyl groups concentration on properties of organosilicate glass low dielectric constant films. Jpn. J. Appl. Phys. 2018, 57, 07MC01. [CrossRef]
- Vishnevskiy, A.S.; Seregin D.S.; Vorotilov, K.A.; Sigov, A.S.; Mogilnikov, K.P.; Baklanov, M.R. Effect of water content on the structural properties of porous methyl-modified silicate film. J. Sol-Gel Sci. Technol. 2019, 92, 273–281. [CrossRef]
- Marsik, P.; Urbamowicz, A.M.; Verdonck, P.; De Roest, D.; Sprey, H.; Baklanov, M.R. Effect of ultraviolet curing wavelength on low-k dielectric material properties and plasma damage resistance. Thin Solid Films 2011, 519, 3619–3626. [CrossRef]
- Rios, X.; Moruones, P.; Echeverría, J.C.; Luquín, A.; Laguna, M.; Garrido, J.J. Characterisation of hybrid xerogels synthesised in acid media using methyltriethoxysilane (MTEOS) and tetraethoxysilane (TEOS) as precursors. Adsorption 2011, 17, 583–589. [CrossRef]
- Cre´pin, C.; Dubois, V.; Goldfarb, F.; Chaput, F.; Boilot, J.P.; A site-selective spectroscopy of naphthalene and quinoline in TEOS/MTEOS xerogels. Phys. Chem. Chem. Phys. 2005, 7(9), 1933–8. [CrossRef]
- Burkey, D.D.; Gleason, K.K. Structure and mechanical properties of thin films deposited from 1,3,5-trimethyl-1,3,5-trivinylcyclotrisiloxane and water. J. Appl. Phys. 2003, 93, 5143–5150. [CrossRef]
- Morales-Florez, V.; Piñero, M.; Braza, V.; Mar Mesa, M.; Esquivias, L.; Rosa-Fox, N. et al. Absorption capacity, kinetics and mechanical behaviour in dry and wet states of hydrophobic DEDMS/TEOS-based silica aerogels. J. Sol-Gel Sci. Technol. 2017, 81, 600–610. [CrossRef]
- Pellegrini C. Development of Multifunctional Hybrid Coatings (MechanicallyResistant and Hydrophobic) Using Methyltrimethoxysilane–Diethoxydimethylsilane–Tetraethoxysilane Mixed Systems. Materials 2024, 17, 368. [CrossRef]
- Petcu, C.; Purcar, V.; Ianchiş, R.; Spătaru, C.-I.; Nicolae, C.A.; Stroescu, H.; Atanase, L.-I.; Frone, A.N.; Trică, B.; Donescu, D. et al. Synthesis and characterization of polymer-silica hybrid latexes and sol-gel-derived films. Appl. Surf. Sci. 2016, 389, 666–672. [CrossRef]
- Han, Y.; Wu, Y.; Zhang, H.; Huang, S.; Wu, S.; Liang, Z. A three-dimensional network modifier (dimethyldiethoxysilane) makes ZrO2-SiO2 aerogel with excellent thermal insulation performance and high-temperature stability. Colloids Surf. A 2023, 671, 131716. [CrossRef]
- Reyes-Peces, M.; Amaya-Dolores, B.; Morales-Flórez, V.; Santos, D.; Mar Mesa, M.; Esquivias, L.; Rosa-Fox, N.; Piñero, M. Effect of the drying procedure on hybrid sono-aereogels for organic solvent remediation. Bol. Soc. Esp. Ceram. Vidr. 2024, 63, 11–22. [CrossRef]
- Lu, Y.; Fan, H.; Doke, N.; Loy, D.A.; Assink, R.A.; LaVan, D.A.; Brinker, C.J. Evaporation-Induced Self-Assembly of Hybrid Bridged Silsesquioxane Film and Particulate Mesophases with Integral Organic Functionality. J. Am. Chem. Soc. 2000, 122, 5258– 5261. [CrossRef]
- Baklanov, M.R.; Mogilnikov, K.P.; Polovinkin, V.G.; Dultsev, F.N. Determination of pore size distribution in thin films by ellipsometric porosimetry. J. Vac. Sci. Technol. B 2000, 18(3), 1385–1391. [CrossRef]
- Baklanov, M.R.; Mogilnikov, K.P.; Vishnevskiy, A.S. Challenges in porosity characterization of thin films: Cross-evaluation of different techniques. J. Vac. Sci. Technol. A 2023, 41(5), 050802. [CrossRef]
- Mogilnikov, K.P.; Baklanov M.R. Determination of Young’s Modulus of Porous Low-k Films by Ellipsometric Porosimetry. Electrochem. Solid-State Lett. 2002, 5, F29−F32. [CrossRef]
- Ovchinnikov, I.S.; Vishnevskiy, A.S.; Seregin, D.S.; Rezvanov, A.A.; Schneider, D.; Sigov, A.S.; Vorotilov, K.A.; Baklanov M.R. Evaluation of Mechanical Properties of Porous OSG Films by PFQNM AFM and Benchmarking with Traditional Instrumentation. Langmuir 2020, 36(32), 9377–9387. [CrossRef]
- Ovchinnikov, I.; Orlov, G.; Seregin, D.; Vishnevskiy, A.; Vorotilov, K.; Sigov, A. Mechanical properties of nanoporous organo silicate glass films for the use in integrated circuits interconnects. AIP Conf. Proc. 2020, 2308, 050003(1–6). [CrossRef]
- Seo, J.; Kim, J.H.; Lee, M.; Moon, J.; Yi, D.K.; Paik, U. Size-dependent interactions of silica nanoparticles with a flat silica surface. J. Colloid Interface Sci. 2016, 483, 177–184. [CrossRef]
- Guo, X.; Jakes, J.E.; Nichols, M.T.; Banna, S.; Nishi, Y.; Shohet, J.L. The effect of water uptake on the mechanical properties of low-k organosilicate glass. J. Appl. Phys. 2013, 114, 084103. [CrossRef]
- Rao, A.P.; Rao, A.V.; Pajonk, G.M. Hydrophobic and physical properties of the ambient pressure dried silica aerogels with sodium silicate precursor using various surface modification agents. Appl. Surf. Sci. 2007, 253, 6032–6040. [CrossRef]
- Darmawan, A.; Utari, R.; Saputra, R.E.; Suhartana; Astuti, Y. Synthesis and Characterization of Hydrophobic Silica Thin Layer Derived from Methyltrimethoxysilane (MTMS). IOP Conf. Ser.: Mater. Sci. Eng. 2018, 299, 012041. [CrossRef]
- Smith, A.L. Infrared spectra-structure correlations for organosilicon compounds. Spectrochimica Acta 1960, 16, 87–105. [CrossRef]
- Lopaev, D.V.; Zotovich, A.I.; Zyryanov, S.M.; Bogdanova, M.A.; Rakhimova, T.V.; Mankelevich, Y.A.; Novikova, N.N.; Seregin, D.S.; Vishnevskiy, A.S.; Vorotilov, K.A.; et al. Effect of H atoms and UV wideband radiation on cured low-k OSG films. J. Phys. D: Appl. Phys. 2022, 55, 255206. [CrossRef]
- Maex, K.; Baklanov, M.R.; Shamiryan, D.; Lacopi, F.; Brongersma, S.H.; Yanovitskaya Z.S. Low dielectric constant materials for microelectronics. J. Appl. Phys. 2003, 93, 8793–8841. [CrossRef]
- Chen, G.; Zhou, S.; Gu, G.; Wu L. Acrylic-Based Polyurethane/Silica Hybrids Prepared by Acid-Catalyzed Sol–Gel Process: Structure and Mechanical Properties. Macromol. Chem. Phys. 2005, 206, 885–892. [CrossRef]
- Grill, A.; Neumayer, D.A. Structure of low dielectric constant to extreme low dielectric constant SiCOH films: Fourier transform infrared spectroscopy characterization. J. Appl. Phys. 2003, 94(10), 6697. [CrossRef]
- Che, M.-L.; Chuang, S.; Leu, J. The Mechanical Property, Microstructure, and Pore Geometry of a Methyltrimethoxysilane Modified Silica Zeolite (MSZ) Film. J. Electrochem. Soc. 2012, 159, G23–G28. [CrossRef]
- Fei, F.; Qiang, C.; Zhongwei, L.; Fuping, L.; Solodovnyk A. The Application of Nano-SiOx Coatings as Migration Resistance Layer by Plasma Enhanced Chemical Vapor Deposition. Plasma Chem. Plasma Process 2012, 14(2), 152–156. [CrossRef]
- Michalak, D.J.; Blackwell, J.M.; Torres, J.M.; Sengupta, A.; Kreno, L.E.; Clarke, J.S.; Pantuso D. Porosity scaling strategies for low-k films. J. Mater. Res. 2015, 30, 3363–3385. [CrossRef]
- Jeevahan, J.; Chandrasekaran, M.; Britto Joseph, G.; Durairaj, R.B.; Mageshwaran G.J. Superhydrophobic surfaces: a review on fundamentals, applications, and challenges. J. Coat. Technol. Res. 2018, 15, 231–250. [CrossRef]
- Yu, S.; Wong, T. K. S.; X. Hu, X.; Yong, M. S. Dielectric and Mechanical Properties of Surface Modified Organosilicate Films. J. Sol-Gel Sci. Technol. 2005, 35, 69–75. [CrossRef]
Figure 1.
Structure of molecules: a) tetraethoxysilane (TEOS), b) methyltriethoxysilane (MTEOS), c) diethoxydimethylsilane (DEDMS).
Figure 1.
Structure of molecules: a) tetraethoxysilane (TEOS), b) methyltriethoxysilane (MTEOS), c) diethoxydimethylsilane (DEDMS).
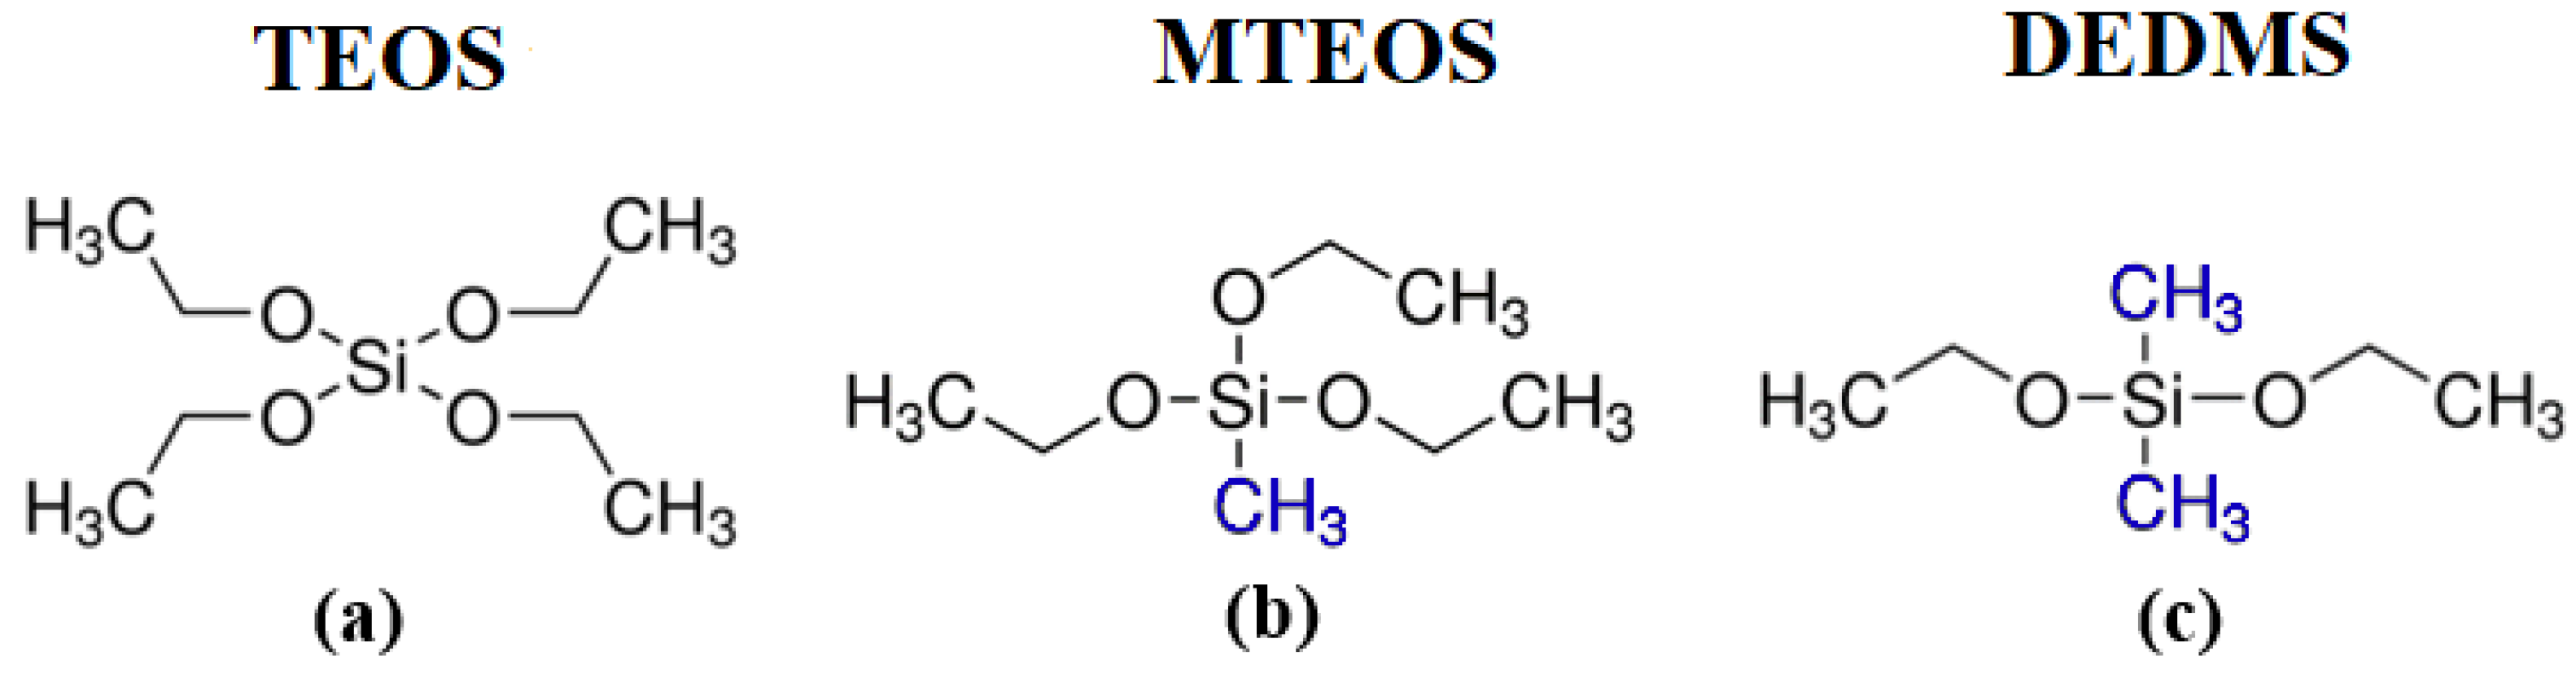
Figure 2.
FTIR spectra of the MTEOS–TEOS (samples ’y’) and DEDMS–TEOS (samples ’w’) films. The inset displays the Si–CH3 peak normalized for thickness and open porosity. The initial digits in the sample names (02, 06, 10) represent the number of methyl groups per silicon atom: 0.2, 0.6, and 1.0, respectively. In this context, MTEOS—methyltriethoxysilane, TEOS—tetraethoxysilane, DEDMS—diethoxydimethylsilane.
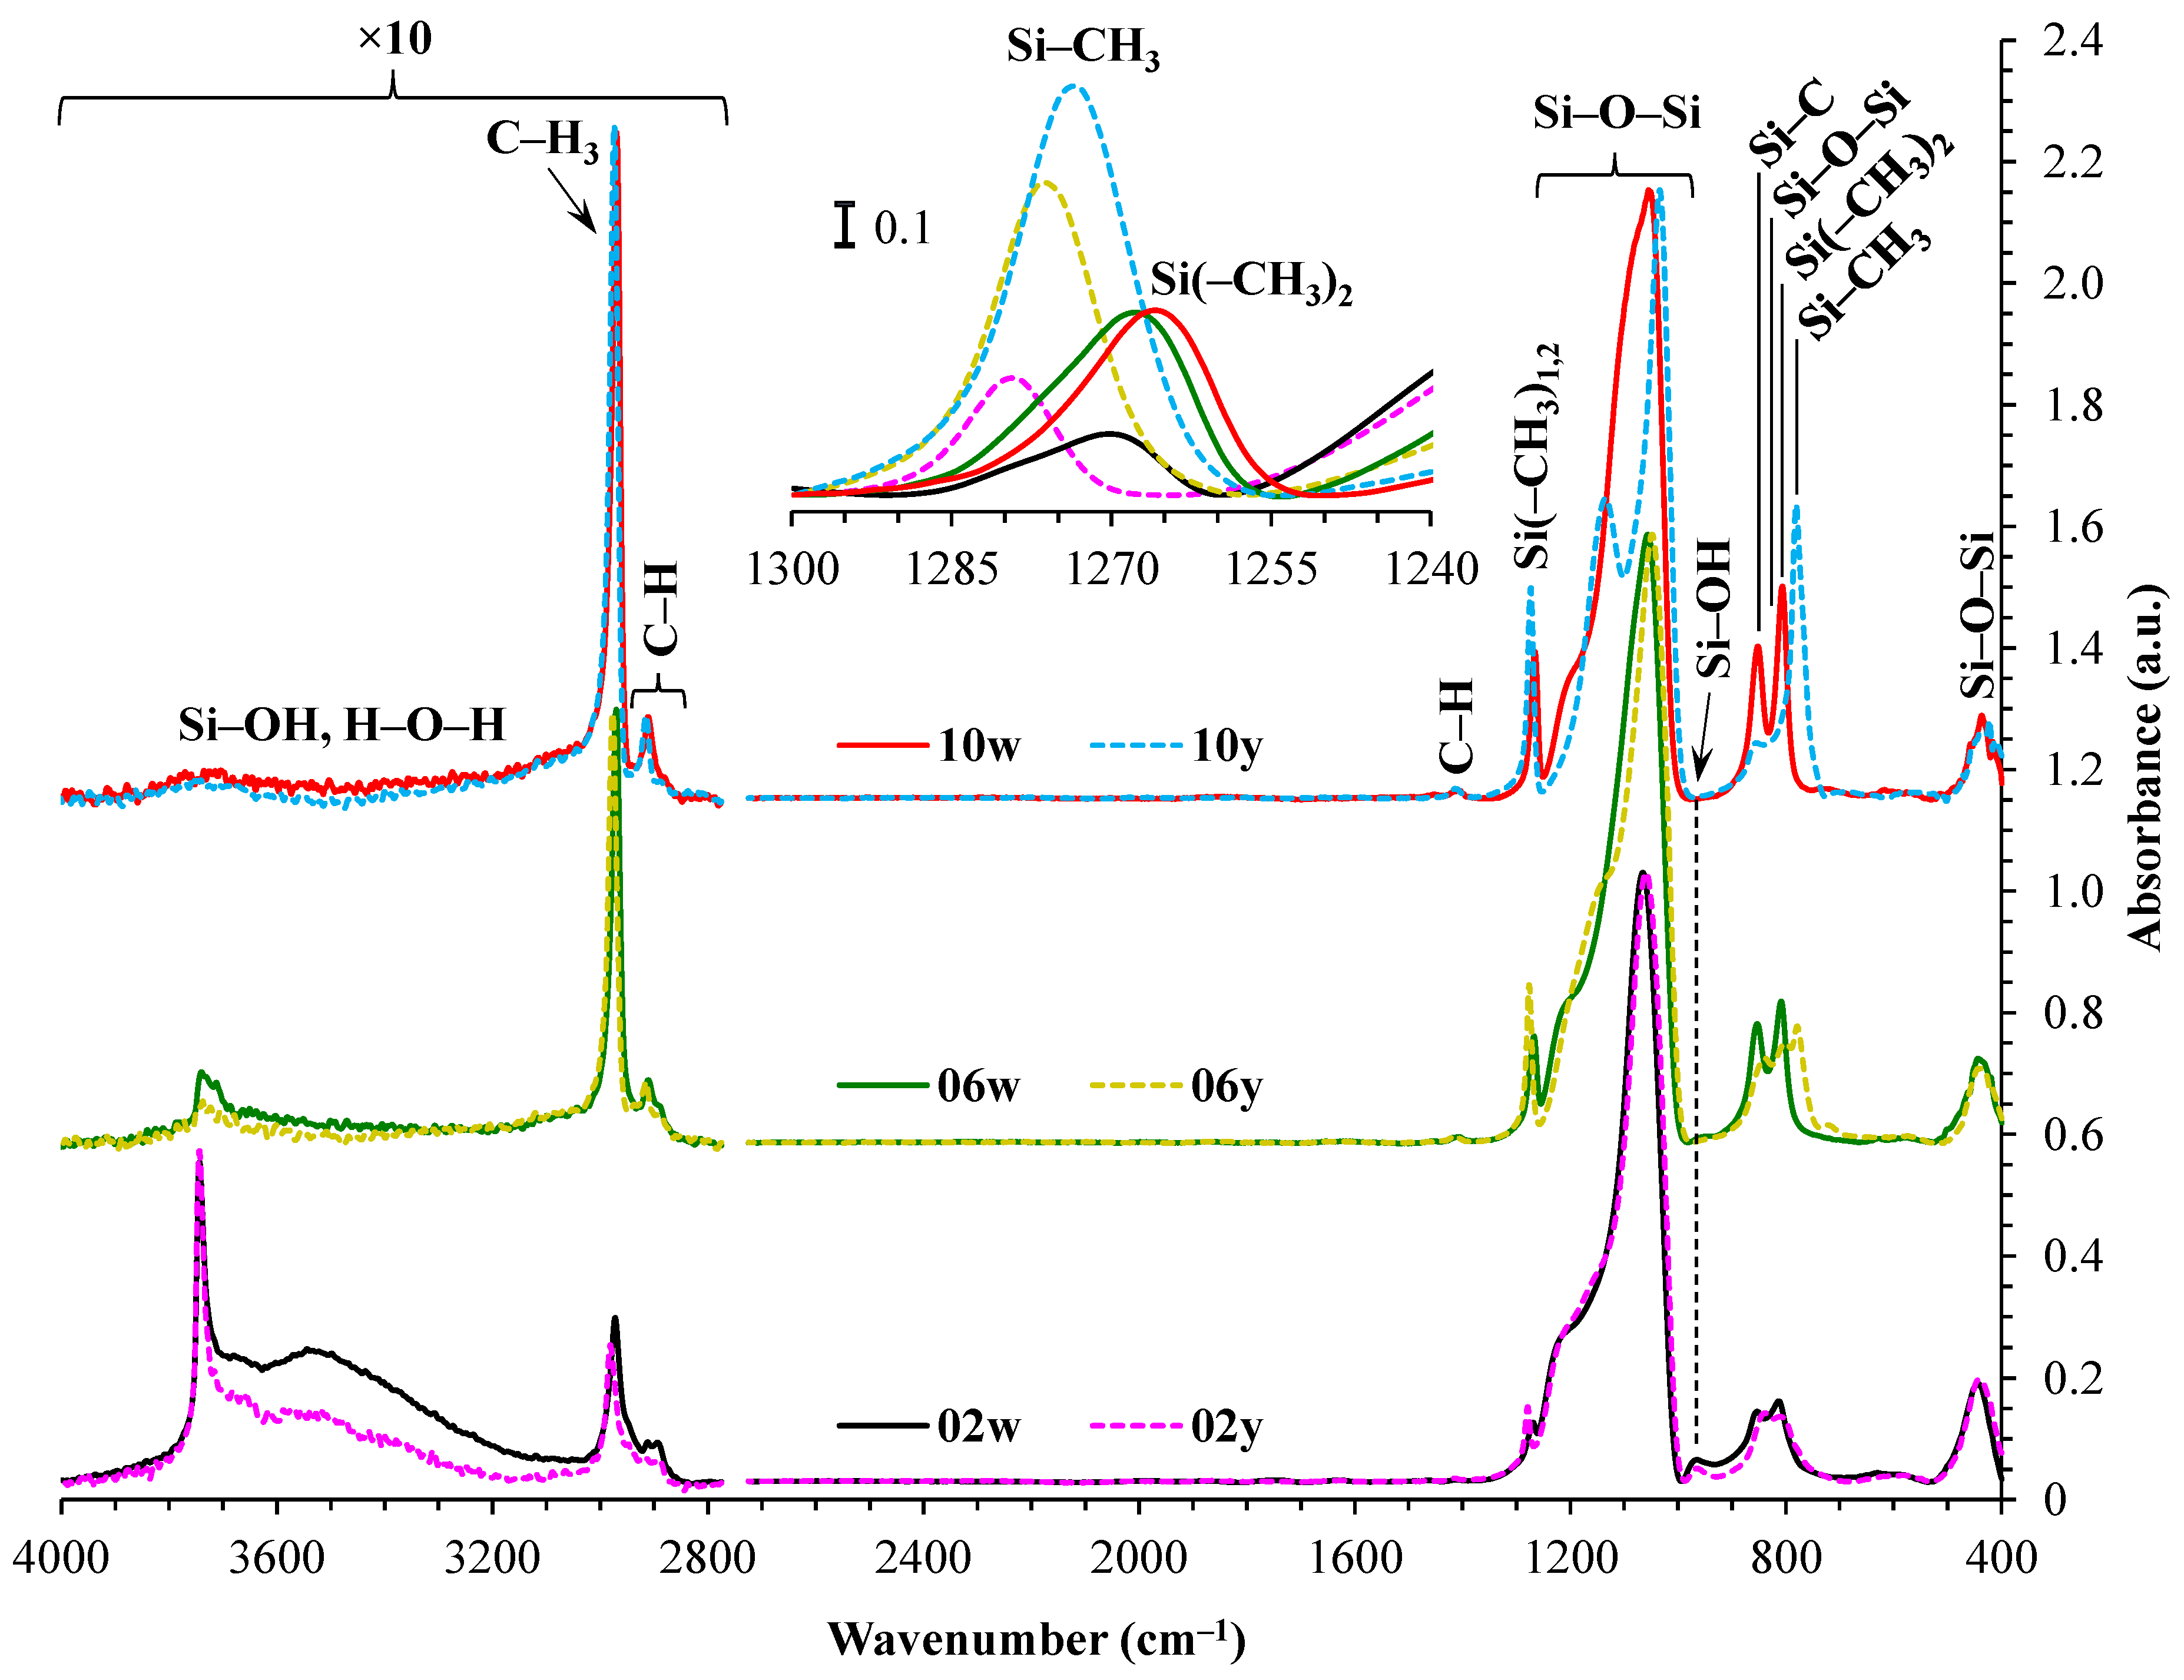
Figure 3.
Components of a broad Si–O–Si band, which includes the network (a), networked suboxide (b), and cage (c) structures, observed in the range of 1300 to 1000 cm⁻¹ (d) in the cage-normalized FTIR spectra of the MTEOS–TEOS (samples ’y’) and DEDMS–TEOS (samples ’w’) films. The initial digits in the sample names (02, 06, 10) represent the number of methyl groups per silicon atom: 0.2, 0.6, and 1.0, respectively. In this context, MTEOS—methyltriethoxysilane, TEOS—tetraethoxysilane, and DEDMS—diethoxydimethylsilane. Sections (a)–(c) have been partially redrawn from ref. [40].
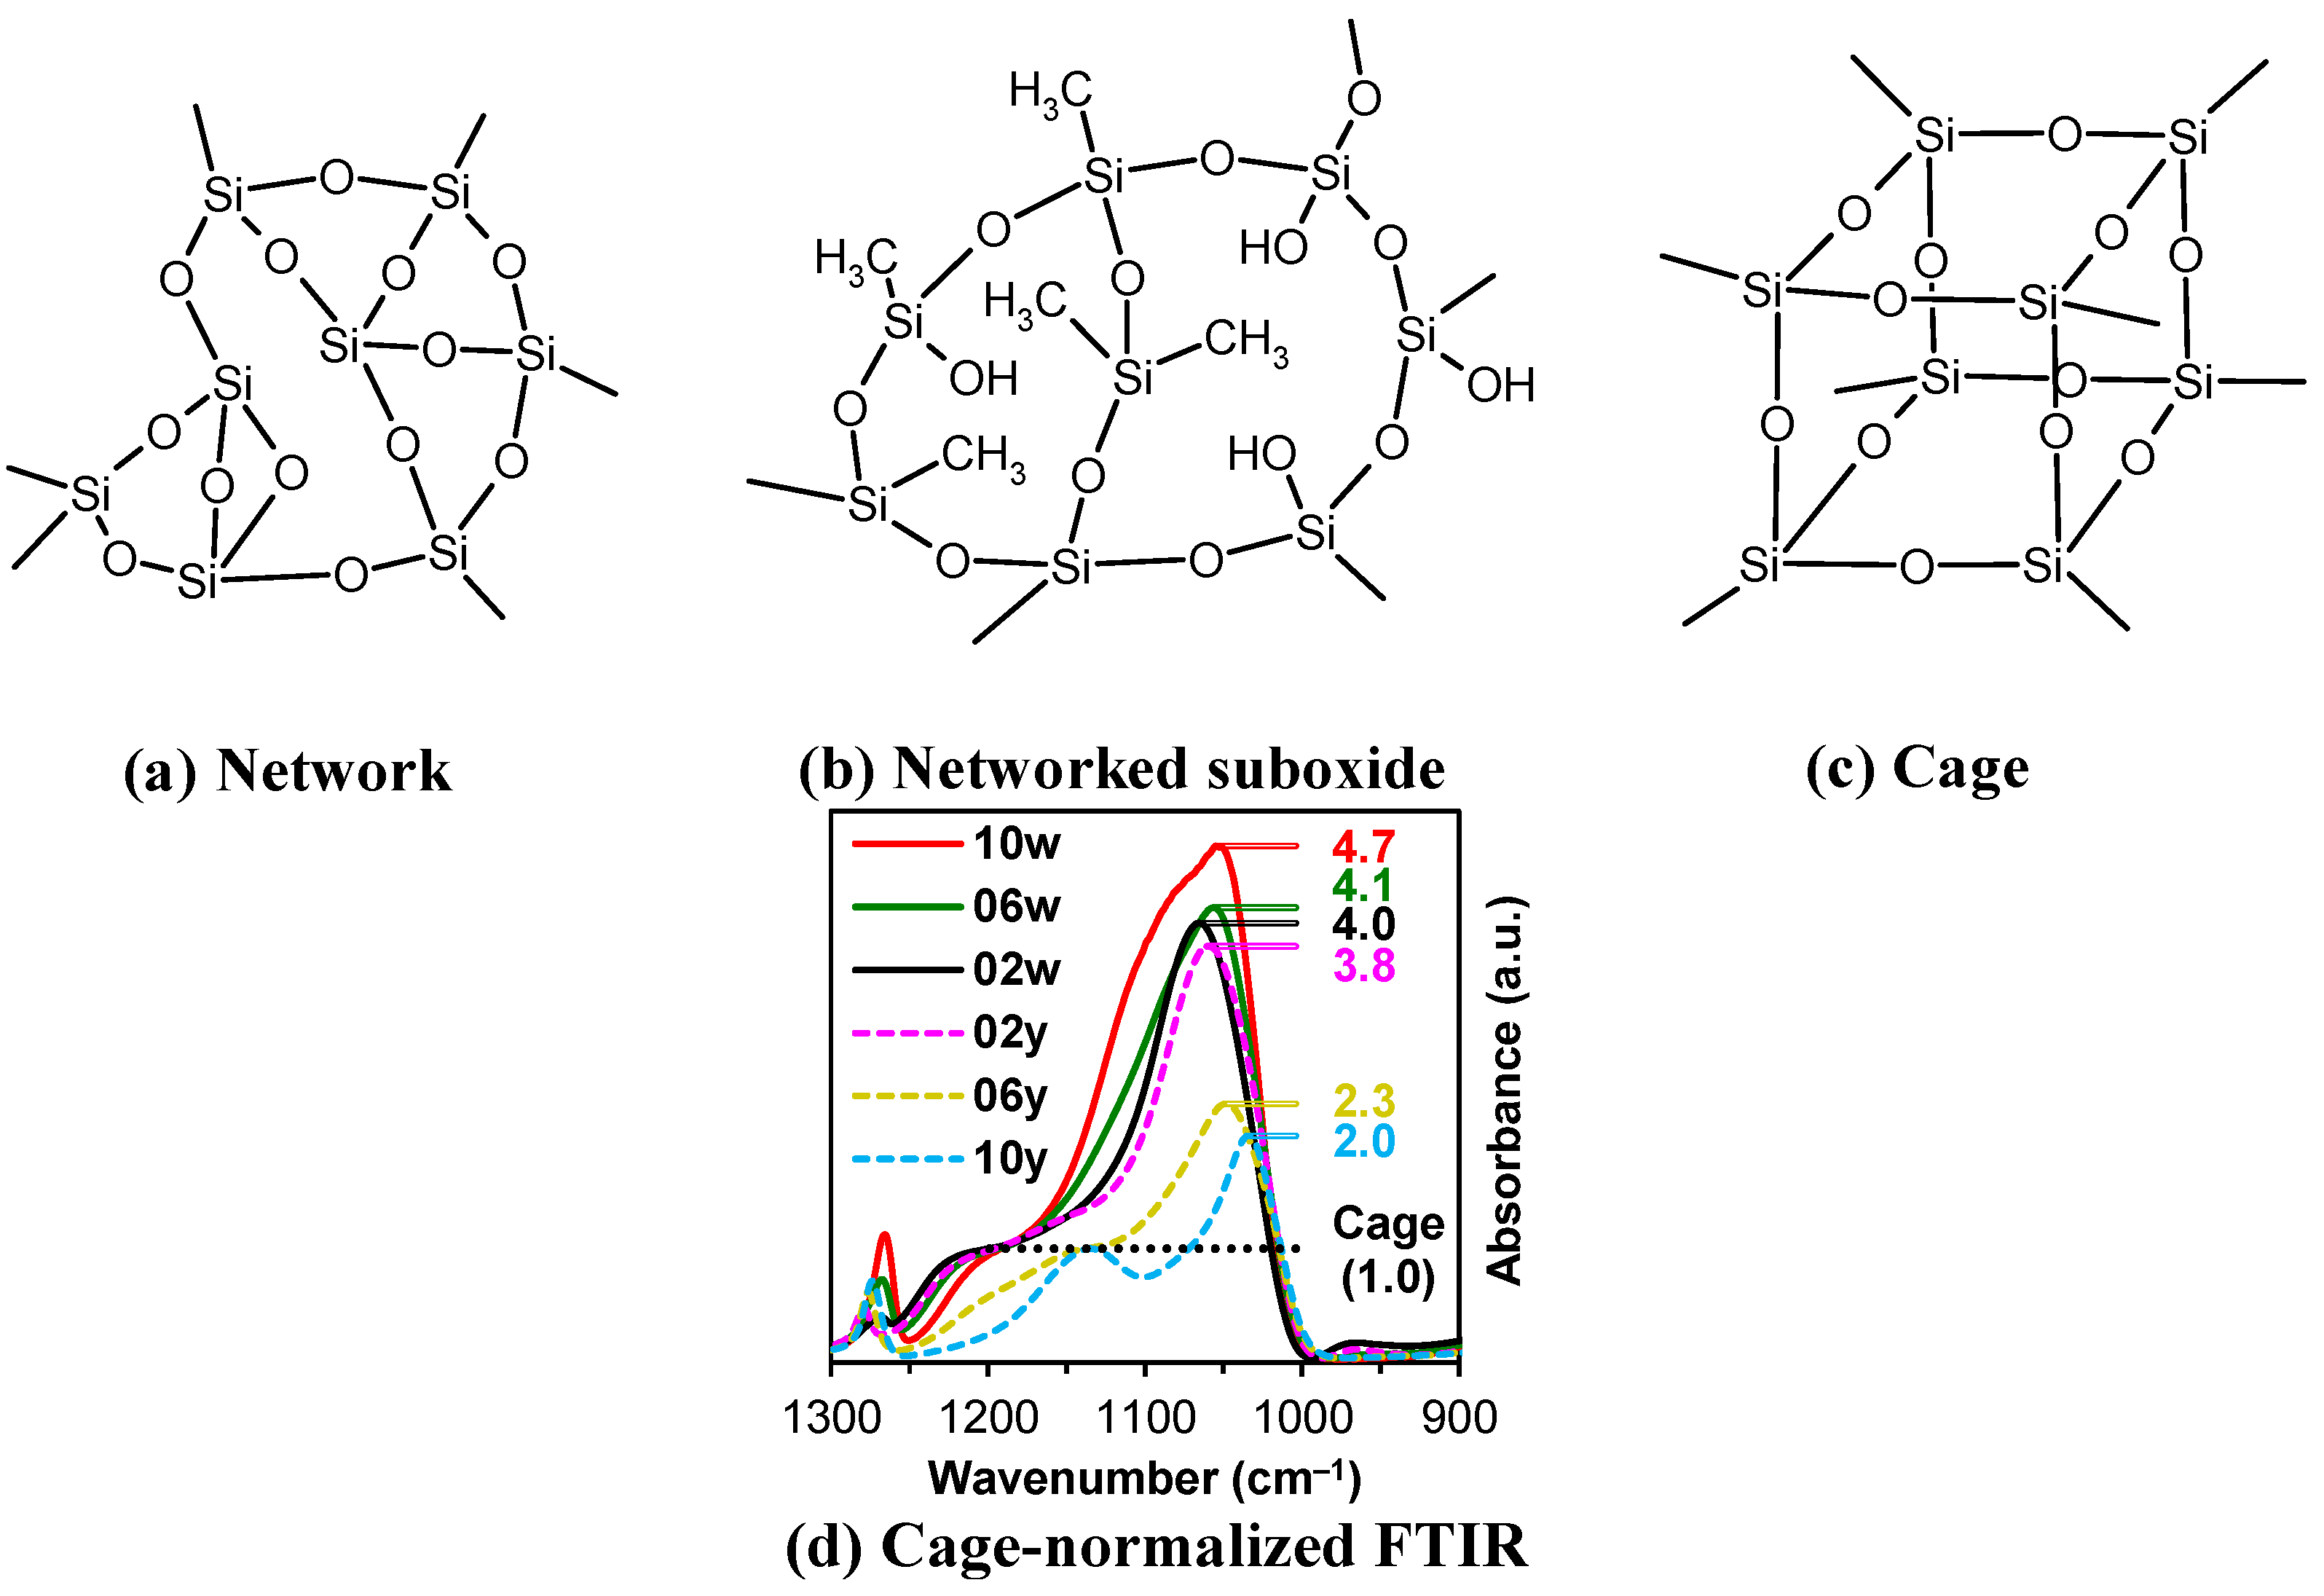
Figure 4.
Isotherms of adsorption (Ads) and desorption (Des) as a function of the partial pressure P/P0 of the vapor–gas mixture, which indicates the degree of pore filling with adsorbate (isopropyl alcohol, top line), the corresponding pore radius distribution (middle line), and the change in thickness during desorption (bottom line) for samples with varying numbers of methyl groups per silicon atom (CH3/Si) of 0.2 (a), 0.6 (b), and 1.0 (c). The series ‘y’ and ‘w’ represent porous organosilica films prepared from tetraethoxysilane (TEOS) mixed with either methyltriethoxysilane (MTEOS) or diethoxydimethylsilane (DEDMS), respectively. In the bottom line, markers represent experimental data points of the deformation isotherm (Des branch), which is modeled using a logarithmic function (Equation (4)), as indicated by the dashed lines.
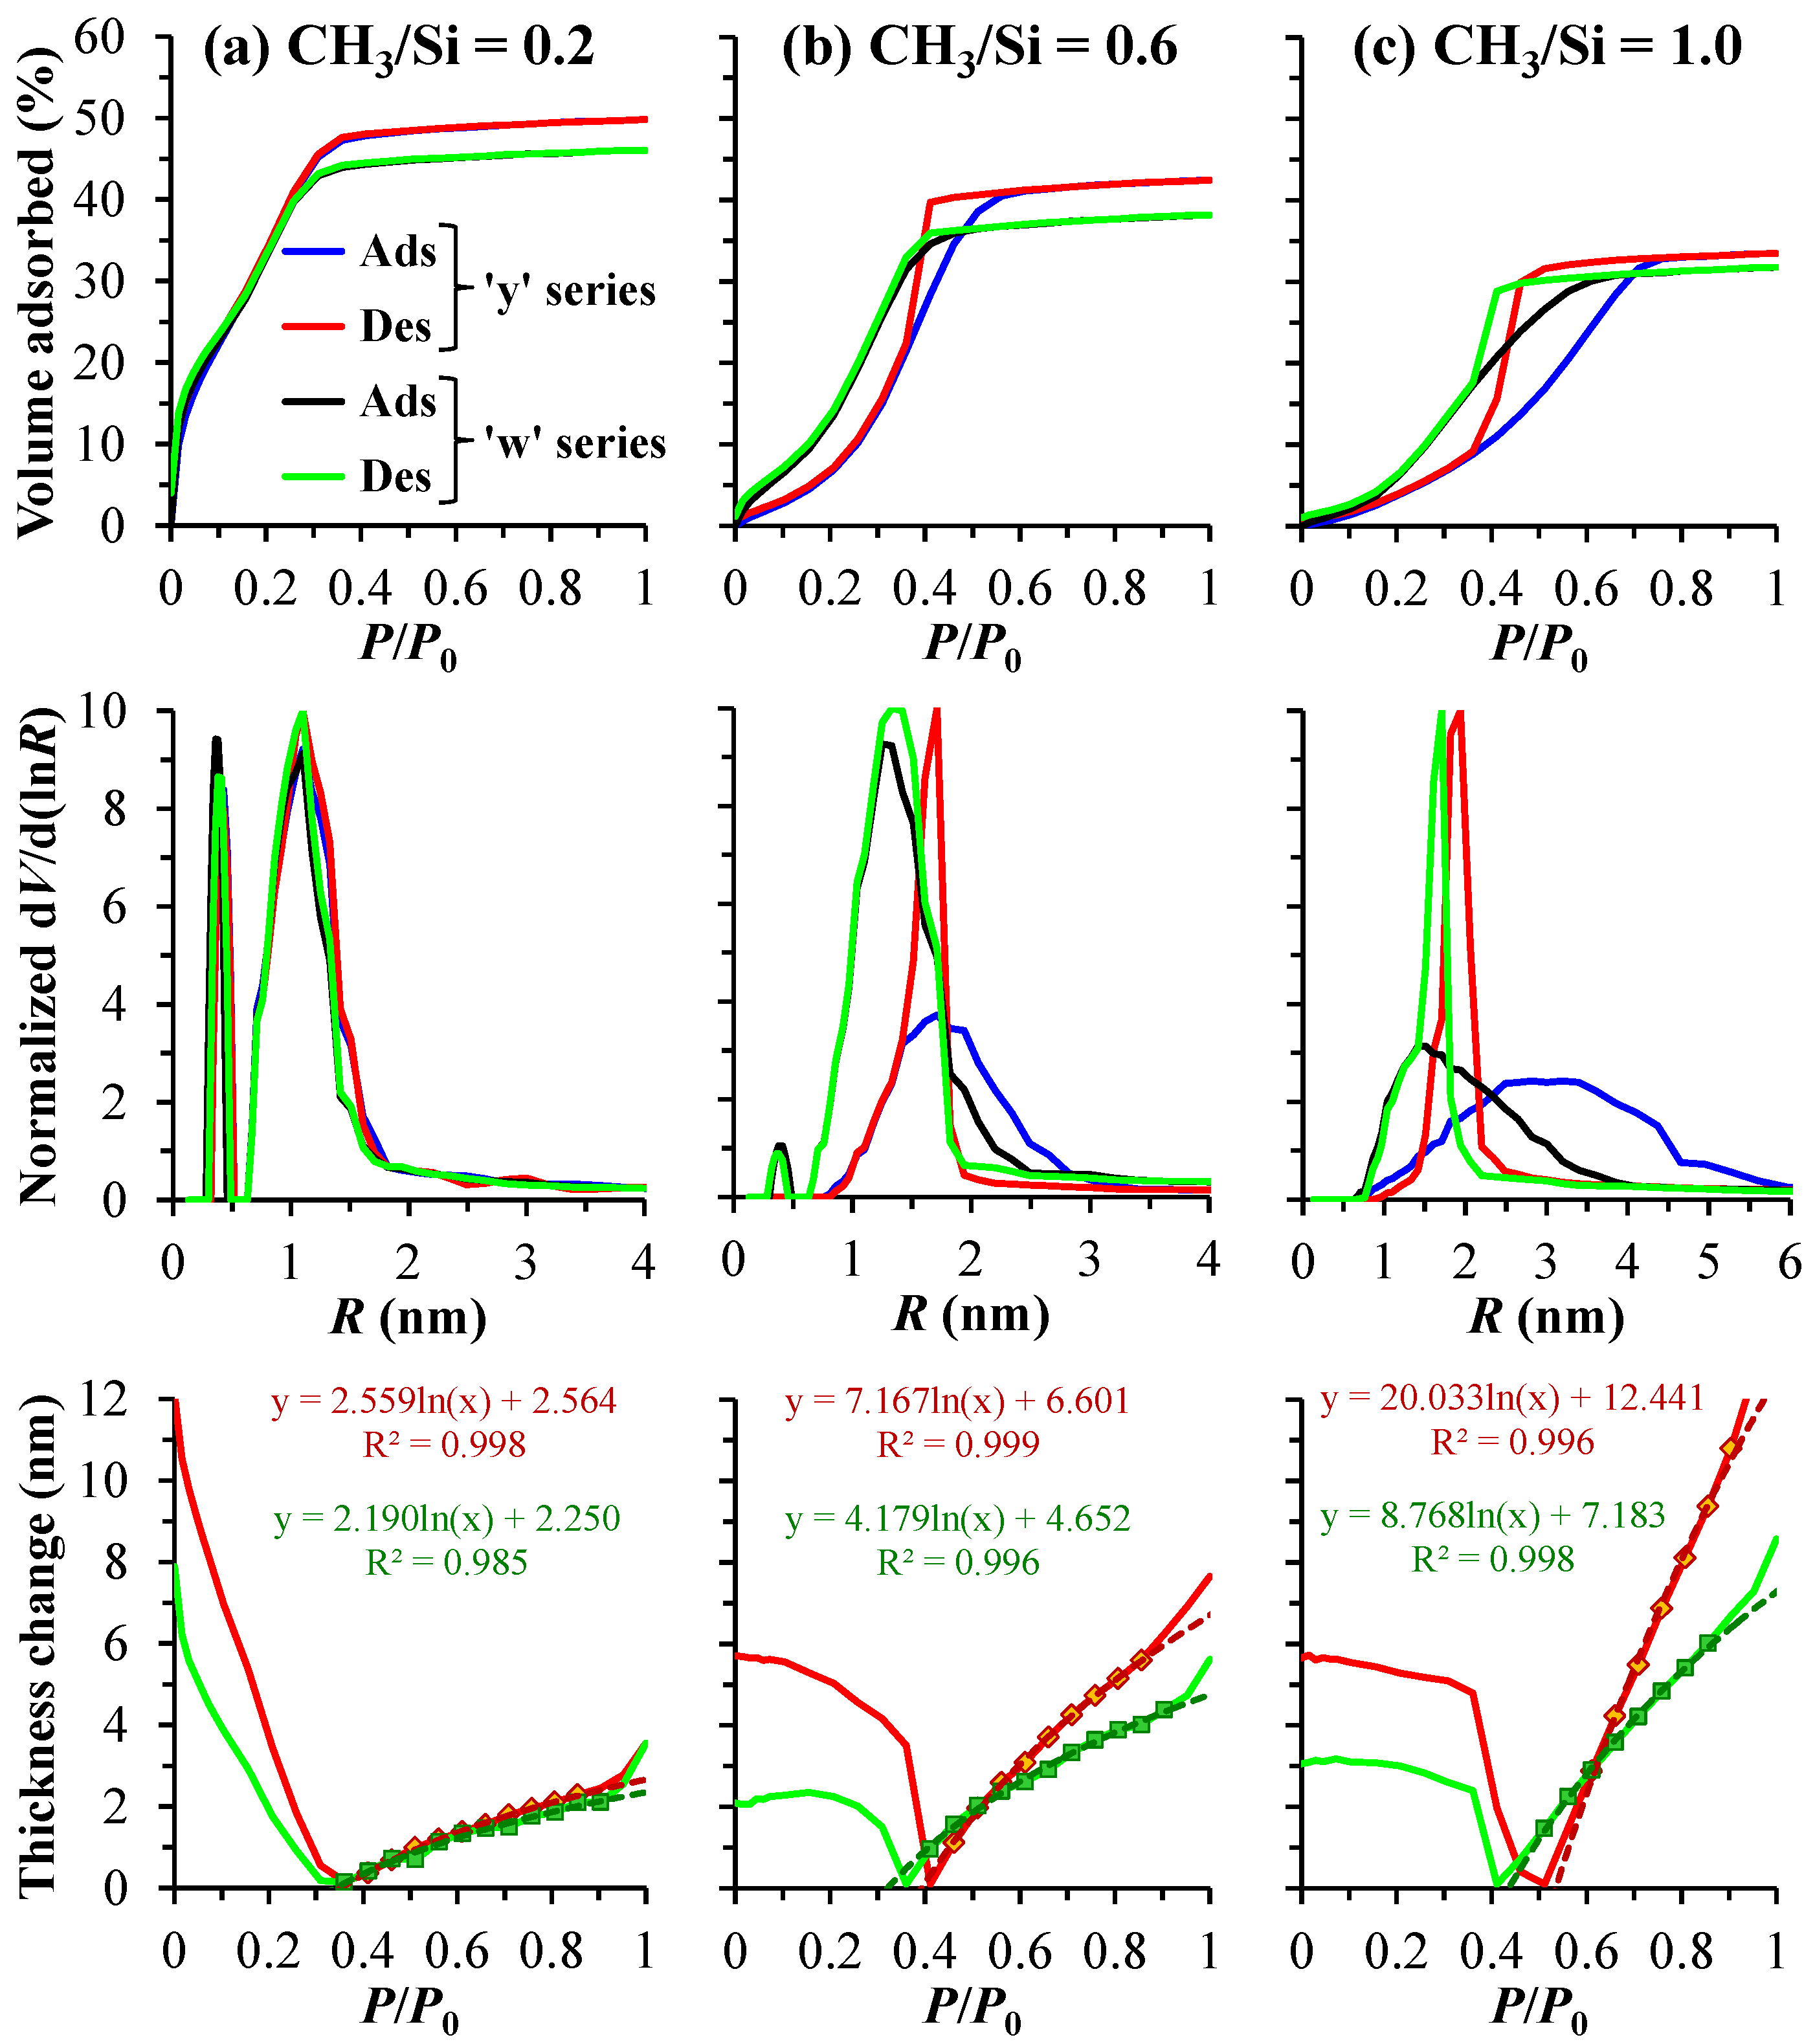
Figure 5.
WCA images of porous organosilica films prepared from tetraethoxysilane (TEOS) mixed with either methyltriethoxysilane (MTEOS) (top line) or diethoxydimethylsilane (DEDMS) (bottom line). The initial digits in the sample names (02, 06, 10) represent the number of methyl groups per silicon atom: 0.2, 0.6, and 1.0, respectively. The designation ’y’ denotes the MTEOS–TEOS copolymer, while ’w’ indicates the DEDMS–TEOS copolymer.
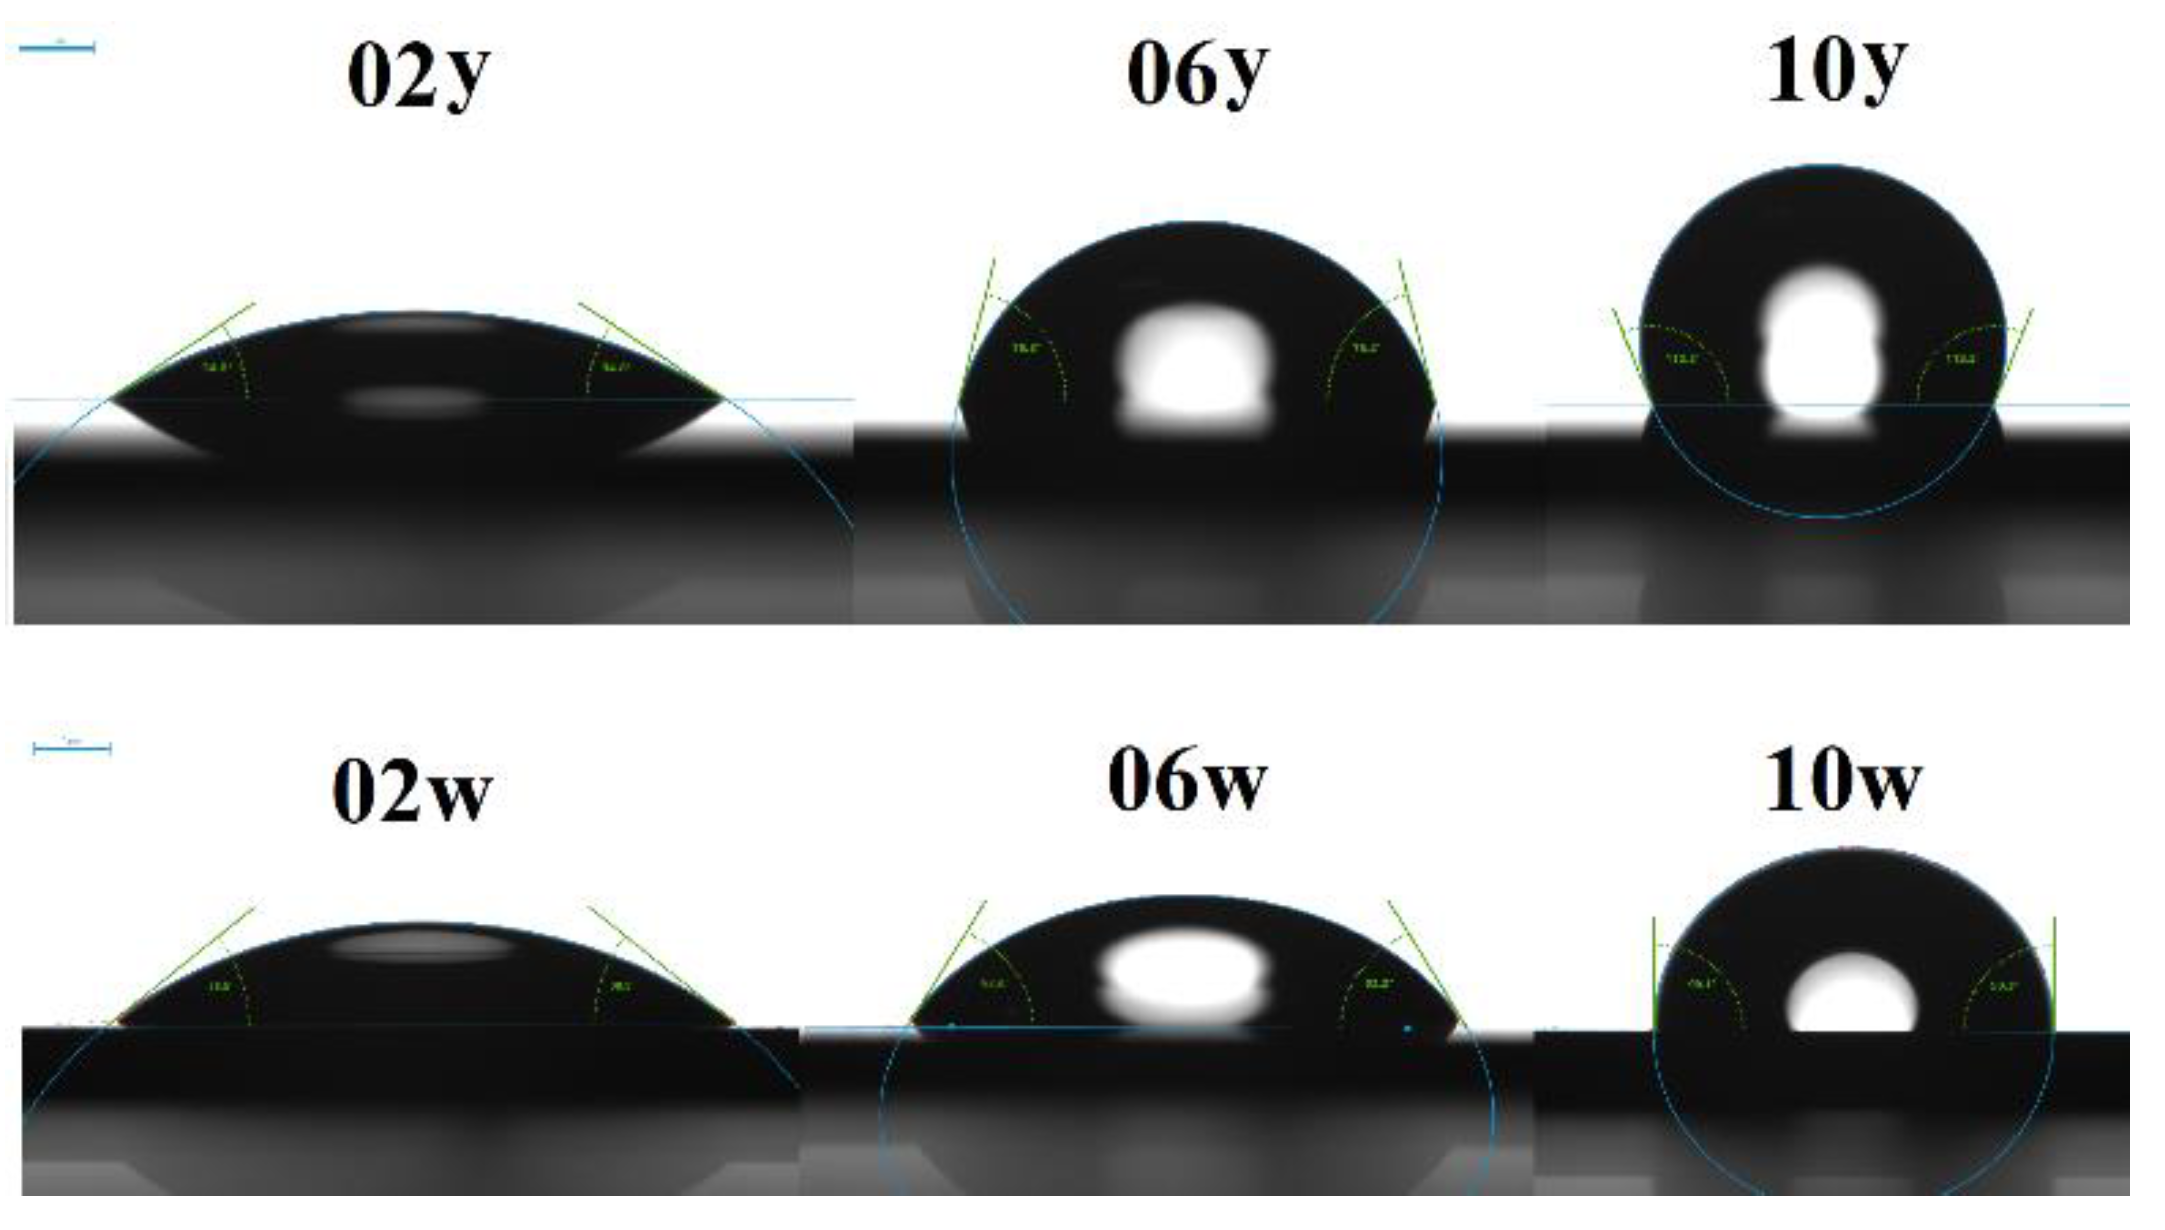
Figure 6.
Relationship between the dielectric constant (k) and the number of methyl groups per silicon atom (CH3/Si) (a), as well as the relationship between k and full porosity (b). The latter is compared with data plotted according to the Clausius–Mossotti equation [39] for SiO2. The initial digits in the sample names (02, 06, 10) represent the number of methyl groups per silicon atom: 0.2, 0.6, and 1.0, respectively. The designation ’y’ denotes the MTEOS–TEOS copolymer, while ’w’ indicates the DEDMS–TEOS copolymer. In this context, MTEOS—methyltriethoxysilane, TEOS—tetraethoxysilane, DEDMS—diethoxydimethylsilane.
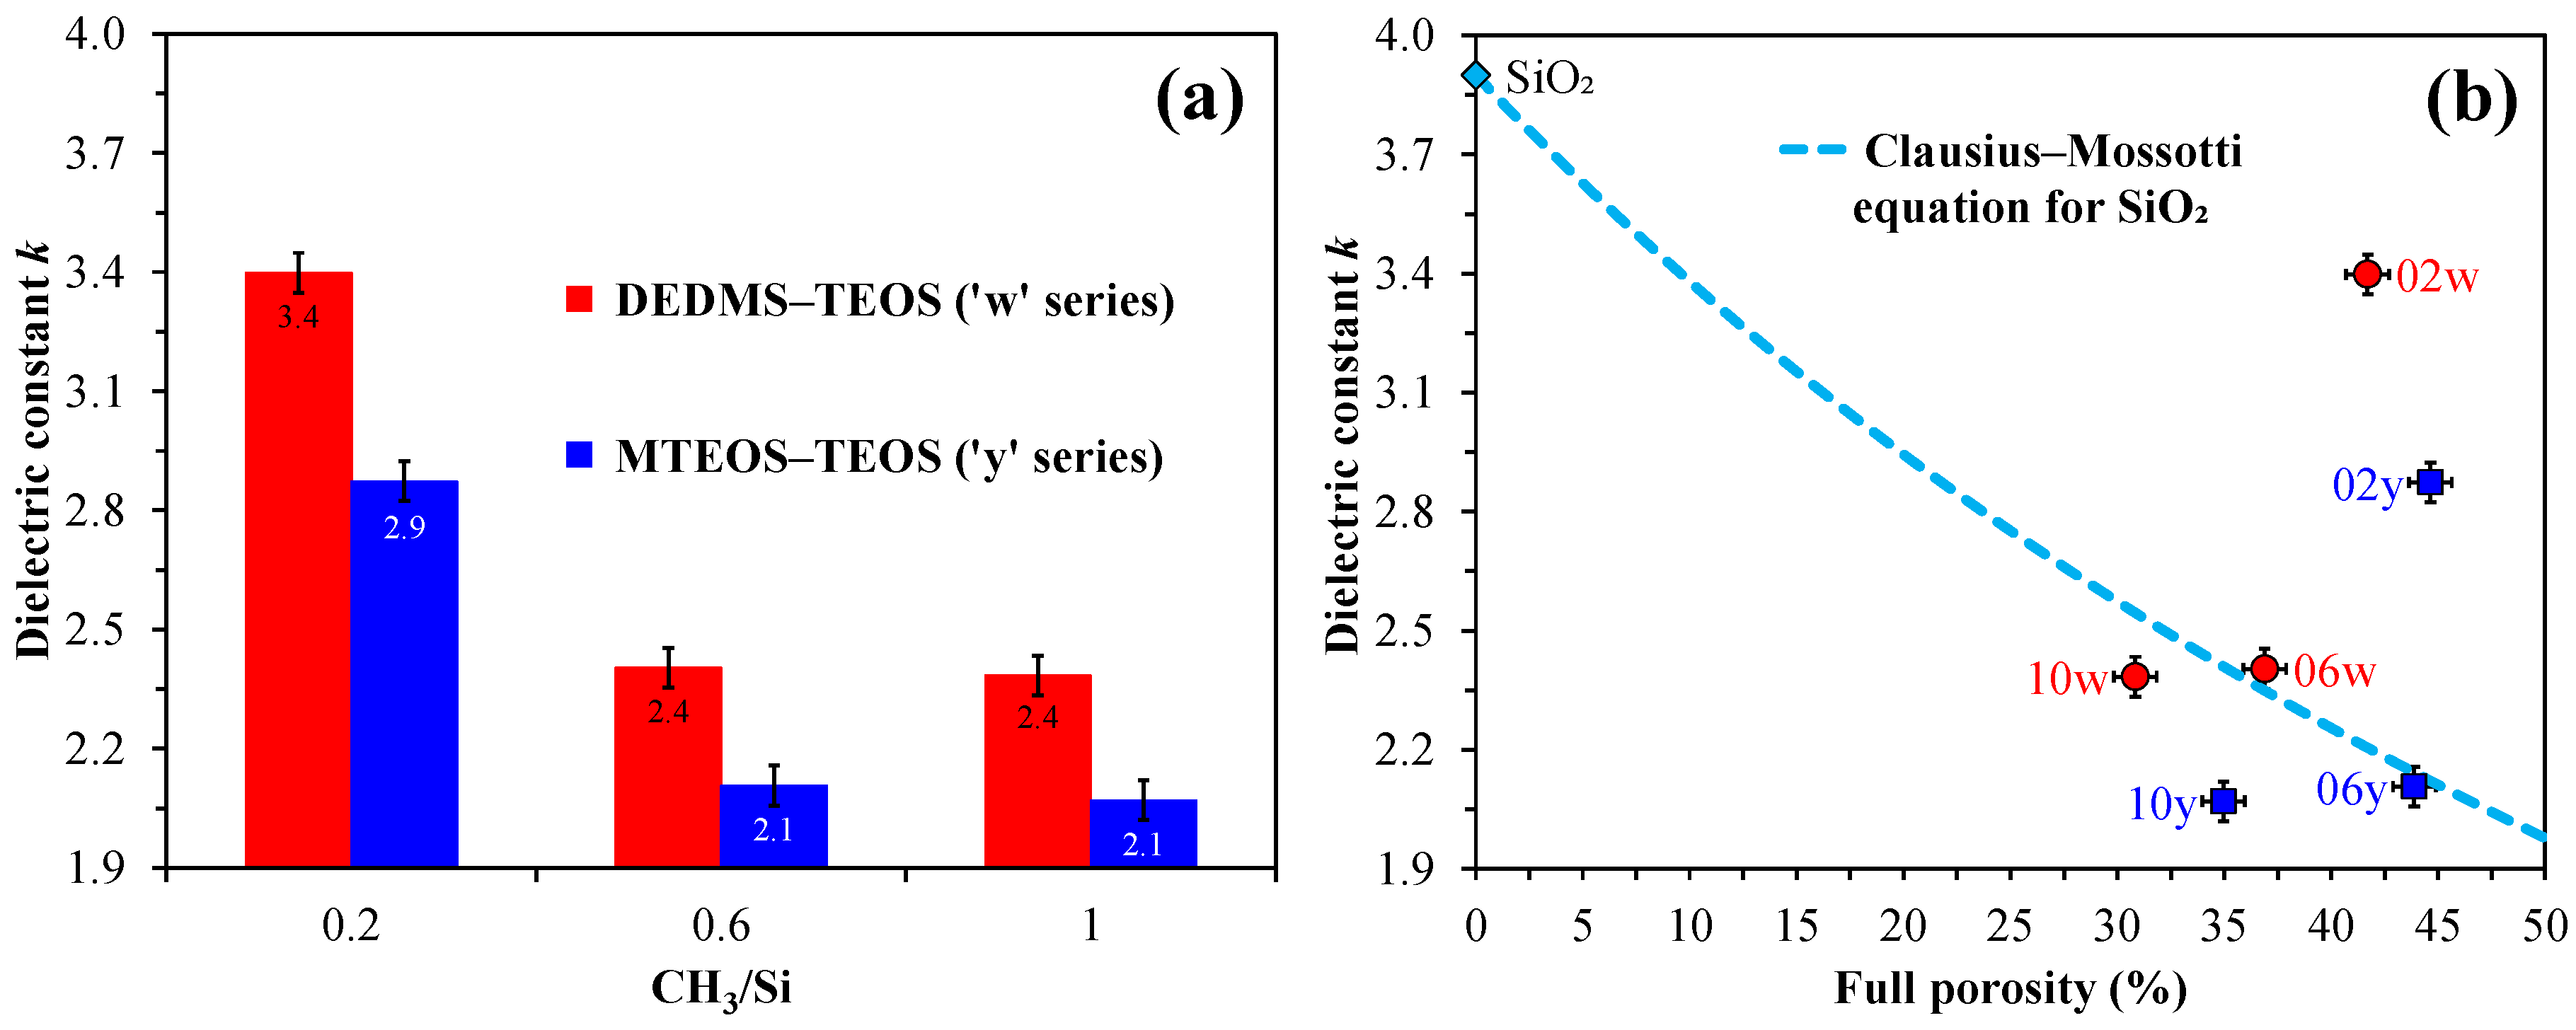
Table 2.
Quantitative analysis of FTIR spectra of porous organosilica films prepared from tetraethoxysilane (TEOS) mixed with either methyltriethoxysilane (MTEOS) or diethoxydimethylsilane (DEDMS).
Table 2.
Quantitative analysis of FTIR spectra of porous organosilica films prepared from tetraethoxysilane (TEOS) mixed with either methyltriethoxysilane (MTEOS) or diethoxydimethylsilane (DEDMS).
| Sample name |
Area under the absorption peak/band, related to the broad band Si–O–Si (×100) |
Network/Cage ratio |
||||
|---|---|---|---|---|---|---|
| Si–OH, H–O–H |
C–H | C–H3 | Si(–CH3)1,2 | Si–OH | ||
| 02y | 5.14 | 0.93 | 0.33 | 0.70 | 0.44 | 3.8 |
| 02w | 9.57 | 1.02 | 0.37 | 0.37 | 0.75 | 4.0 |
| 06y | 0.64 | 2.02 | 1.23 | 2.91 | 0.02 | 2.3 |
| 06w | 1.22 | 2.08 | 1.23 | 1.65 | 0.09 | 4.1 |
| 10y | 0.54 | 3.53 | 2.34 | 5.75 | - | 2.0 |
| 10w | 0.55 | 3.14 | 1.88 | 2.91 | 0.01 | 4.7 |
The initial digits in the sample names (02, 06, 10) represent the number of methyl groups per silicon atom: 0.2, 0.6, and 1.0, respectively. The designation ’y’ denotes the MTEOS–TEOS copolymer, while ’w’ indicates the DEDMS–TEOS copolymer.
Table 3.
Main porosimetric parameters of porous organosilica films prepared from tetraethoxysilane (TEOS) mixed with either methyltriethoxysilane (MTEOS)—designated as series ‘y’—or diethoxydimethylsilane (DEDMS)—designated as series ‘w’.
Table 3.
Main porosimetric parameters of porous organosilica films prepared from tetraethoxysilane (TEOS) mixed with either methyltriethoxysilane (MTEOS)—designated as series ‘y’—or diethoxydimethylsilane (DEDMS)—designated as series ‘w’.
| Sample name |
d (nm) [±2] |
n [±0.005] |
ns [±0.005] |
Vopen (%) [±2] |
Vfull (%) [±2] |
Rads | Rdes | ⟨Rads⟩ | ΔmRads | EP YM (GPa) [±0.3] |
|
|---|---|---|---|---|---|---|---|---|---|---|---|
| (nm) [±0.1] |
|||||||||||
| 02y | 465 | 1.221 | 1.472 | 50 | 49 | 0.4/1.1 | 0.4/1.1 | 0.9 | 0.6 | 5.7 | |
| 02w | 453 | 1.238 | 1.471 | 46 | 46 | 0.4/1.1 | 0.4/1.1 | 0.8 | 0.6 | 6.6 | |
| 06y | 558 | 1.238 | 1.436 | 42 | 46 | 1.7 | 1.7 | 1.7 | 1.1 | 2.5 | |
| 06w | 547 | 1.261 | 1.444 | 38 | 41 | 0.4/1.3 | 0.4/1.3 | 1.3 | 0.7 | 4.2 | |
| 10y | 507 | 1.269 | 1.421 | 34 | 39 | 2.8 | 1.9 | 2.7 | 2.8 | 0.8 | |
| 10w | 402 | 1.282 | 1.431 | 32 | 36 | 1.5 | 1.7 | 1.6 | 1.7 | 1.5 | |
In this Table: d—thickness, n—refractive index, ns—skeleton refractive index, Vopen—open porosity, Vfull—full porosity, Rads—pore radius during adsorption, Rdes—pore radius during desorption, ⟨Rads⟩—average pore radius during adsorption, ΔmRads—half-width of the pore radius distribution during adsorption, EP YM—Young's modulus evaluated by EP. The initial digits in the sample name (02, 06, 10) represent the number of methyl groups per silicon atom: 0.2, 0.6, and 1.0, respectively.
Table 5.
Idealized speculative model of crosslinking for porous organosilica films prepared from tetraethoxysilane (TEOS) mixed with either methyltriethoxysilane (MTEOS)—designated as series ‘y’—or with diethoxydimethylsilane (DEDMS)—designated as series ‘w’—which vary in the number of methyl groups per silicon atom (CH3/Si ratio).
| CH3/Si ratio |
Series ‘y’ | Series ‘w’ |
|---|---|---|
| 0.2 |
 ψ = 16/20 = 0.8 |
 ψ = 18/20 = 0.9 |
| 0.6 |
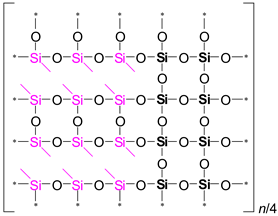 ψ = 8/20 = 0.4 |
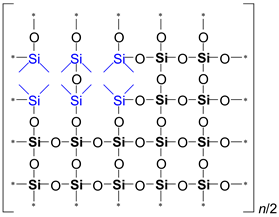 ψ = 14/20 = 0.7 |
| 1.0 |
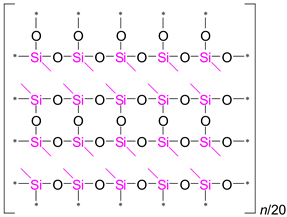 ψ = 0/20 = 0 |
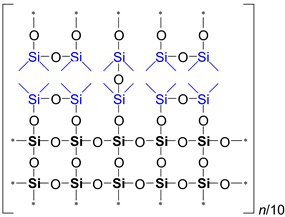 ψ = 10/20 = 0.5 |
In this Table: the ratio of fully crosslinked Si atoms to the total number of Si atoms is represented by ψ. Si–CH₃ bonds are illustrated in pink, while Si(–CH₃)₂ bonds are depicted in blue.
Disclaimer/Publisher’s Note: The statements, opinions and data contained in all publications are solely those of the individual author(s) and contributor(s) and not of MDPI and/or the editor(s). MDPI and/or the editor(s) disclaim responsibility for any injury to people or property resulting from any ideas, methods, instructions or products referred to in the content. |
© 2024 by the authors. Licensee MDPI, Basel, Switzerland. This article is an open access article distributed under the terms and conditions of the Creative Commons Attribution (CC BY) license (http://creativecommons.org/licenses/by/4.0/).
Copyright: This open access article is published under a Creative Commons CC BY 4.0 license, which permit the free download, distribution, and reuse, provided that the author and preprint are cited in any reuse.


