
Submitted:
07 November 2024
Posted:
08 November 2024
You are already at the latest version
Abstract
This study aims to explore the effect of microstructural parameters on notch fatigue damage behavior of the TC21 alloy. Different levels of lamellar microstructures were achieved through distinct aging temperatures of 550, 600, and 650 °C. The findings reveal that increasing aging temperature primarily contributes to the augmentation of α colony (αc) thickness, grain boundaries α phase (GBα) thickness, and α fine (αfine) size, alongside a reduction in α lath (αlath) thickness and αfine content. The notch alters stress distribution and relaxation effects at the root, enhancing notched tensile strength while weakening plasticity. Moreover, the increased thickness of GBα emerges as a critical factor leading to the increase area of intergranular cleavage fracture. It is noteworthy that more thickness αlath and smaller αfine facilitate deformation coordination and enhance dislocation accumulation at the interface, leading to a higher propensity for microvoids and microcracks to propagate along the interface. Conversely, at elevated aging temperatures, thinner αlath and larger αfine are more susceptible to fracture, resulting in the liberation of dislocations at the interface. The reduction in αlath thickness is crucial for triggering the initiation of multi-system dislocations at the interface, which promotes the development of persistent slip bands (PSBs) and dislocation nets within αlath. This phenomenon induces inhomogeneous plastic deformation and localized hardening, fostering the formation of microvoids and microcracks.
Keywords:
TC21 alloy
; multilevel lamellar microstructure
; notch tensile and high cycle fatigue
; damage evolution mechanism
1. Introduction
With the rapid advancement of the modern aviation industry, increased demands for reliability and safety of aerospace components have emerged [1]. Titanium alloys with high strength and toughness, renowned for their exceptional specific strength, and favorable fatigue properties, play a crucial role in modern industries [2,3,4]. Despite the superior properties of advanced titanium alloy, the majority of components in service exhibit irregularities such as keyways or notches that significantly reduce material longevity and premature component failure [5]. Importantly, there is a relative lack of data on the notch damage behavior of titanium alloys, thereby limiting their broader application within the aerospace sector.
In recent years, the design concept of aviation materials has changed from conventional static strength and lightweight priorities towards a focus on safety-life, damage-safety, until the modern damage tolerance-high life [3,6]. Consequently, investigations into the notch fatigue phenomenon of titanium alloys have garnered increasing interest. As is well known, the notch will alter the stress state of the component and result in local stress concentration, thereby affecting the performance of the component. Therefore, conducting systematic studies on notch fatigue behavior holds significant academic value and practical significance [7,8,9]. For instance, Yu et al. [10] introduced the theory of notch structural stress (TNSS) as a novel approach to predict the overall fatigue life of notched structures. Meanwhile, Haritos et al. [11] highlighted the diverse nature of factors influencing the notch fatigue properties of Ti-6Al-4V alloy, emphasizing the nature of these assessments. Yuri et al. [12] examined the impact of temperature on the notch fatigue behavior of Ti-5Al-2.5Sn ELI alloy, revealing an increase in the alloy's fatigue limit with decreasing temperature. Specifically, at a temperature of 4 K and stress concentration factor (Kt) of 3.0, the fatigue performance of the notch sample at low temperatures improved with a reduction in the initial fatigue crack's size. Additionally, Wu et al. [13] demonstrated that the significant influence of microstructure and notch effects on the notch fatigue properties of Ti-7Mo-3Nb-3Cr-3Al metastable β titanium alloy. Moreover, Zhang et al. [14] found that the notch fatigue limit of Ti-55531 alloy decreased with the increase of the stress concentration coefficient. It is crucial to emphasize that crack initiation plays a pivotal role in HCF, accounting for over 80% of the total fatigue life [15,16]. Various microstructural factors, including crystallographic orientation, elastic anisotropy, slip characteristics, grain size, and adjacent microstructure, have been identified as significant contributors to the localization of cyclic strain and crack initiation in titanium alloys [17,18,19]. Despite the ongoing research concerning fatigue damage behavior in titanium alloys, existing studies primarily focus on enhancing the fatigue properties of these alloys through structural design and microstructure regulation [20,21]. However, there is a lack of investigations into the microscopic mechanisms governing the initiation and propagation of notch fatigue cracks, especially in titanium alloys. Notably, there is a significant knowledge gap regarding the impact of various microstructural parameters on the notch fatigue characteristics of the TC21 alloy [22]. The study of notch fatigue in titanium alloys, which is a critical form of failure, has garnered substantial interest across relevant disciplines. By delving into the mechanisms behind the formation of fatigue microvoids and microcracks, as well as understanding their influencing factors and their impact on fatigue life, we can not only enhance the reliability and safety of titanium alloy materials but also gain crucial insights for their design and optimization in engineering applications.
It is worth noting that in the TC21 alloy with a multi-level lamellar microstructure, different levels of microstructure control various stages of fatigue damage. Additionally, the fracture morphology covers a portion of the fatigue microvoids and influences the initiation and expansion of microcracks after fatigue fracture. Considering these factors, both stop fatigue test method and high-cycle fatigue test results were employed, with selected cycles at numbers 4×10⁶ and 8×10⁶. This study analyzes the process of microstructure evolution in TC21 alloy and clarifies the relationship between fatigue crack initiation or propagation and different microstructure. The results can provide fundamental data for reliability design and structural optimization of titanium alloy components.
2. Experimental Materials and Methods
2.1. Materials and Treatment Process
The raw material was TC21 alloy provided by Chinese Western Superconducting Technologies Co., Ltd. The exact chemical composition of the alloy is given in Table 1, and its microstructure comprises α phase (α-Ti) and β phase (β-Ti) (Figure 1a,b). The β transition temperature, determined via metallographic analysis, was measured to be 945 ± 5 °C.
2.2. Heat Treatment Process and Fatigue Properties Testing
Round rods, measuring 79 mm in length and 12 mm in diameter, obtained from the original forged rods, were subjected to heat treatment in a high-temperature tube furnace. The initial step involved heating the sample to 1010 °C for 0.5 h (solid solution treatment), followed by a rapid transfer to another preheated furnace set at 800 °C for 2 h before air-cooling it to room temperature. Subsequently, the samples underwent aging treatment by heating it successively in the furnace at temperatures of 550, 600, and 650 °C for a duration of 5 h each, followed by air cooling [22]. Round rod specimens subjected to heat treatment were specifically designed and processed according to the ASTM standard E8M for notch tensile testing. Machining specifications at the notch can be referenced in Figure 2. These specimens then underwent notch tensile tests using an MTS 810 universal tester with an extensometer to maintain a controlled rate of 0.5 mm/min. Additionally, three replicate tests were conducted at each groups to ensure the accuracy of the results.
The fatigue samples were meticulously prepared following the guidelines stipulated in HB 5287-1996, with the sample size diagram provided below for reference (Figure 2). Prior to conducting tests on the QBG-100 high-frequency tester with a fatigue test frequency of f=100 Hz and a sine wave input, all samples underwent precise processing using an optical thread grinder to minimize any potential influence of machining marks on the fatigue test outcomes [14]. Subsequently, surface defects were eliminated using 2000-5000 mesh sandpaper to reduce experimental inaccuracies. Following this procedure, all specimens underwent microscopic examination to verify the absence of scratches or imperfections. For this research, interrupted fatigue cycles of 4×10⁶ cycles and 8×10⁶ cycles (with applied stress values slightly below the fatigue limit) were utilized to investigate the impact of microscopic structure and fatigue cycles on the initiation and propagation of TC21 alloy fractures. To reveal the evolutionary mechanism of notch fatigue damage under varying fatigue cycles, the samples subjected to an aging temperature of 550 ℃, with stress levels of σ= 240 MPa and fatigue cycles of N = 4×10⁶ and N = 8×10⁶, are denoted as A1 and A2, respectively. Similarly, specimens aged at 600 ℃, with stress levels of σ = 280 MPa and fatigue cycles of N = 4×10⁶ and N = 8×10⁶, are designated as B1 and B2, correspondingly. Finally, samples aged at 650 ℃, with stress levels of σ = 230 MPa and fatigue cycles of N = 4×10⁶ and N = 8×10⁶, are labeled as C1 and C2, respectively.
2.3. Microstructure Characterization
The microstructure, tensile fracture morphology and fracture profile were analyzed using various techniques such as optical microscopy (OM, Leica DMI5000M), scanning electron microscopy (SEM, SUPRA40) and atomic force microscopy (AFM, Bruker Dimension ICON) . Quantitative measurements of α phase dimensions and content of specimens after different processes were performed using Image Pro Plus 8.0 (IPP 8.0) analysis software. To ensure statistical accuracy, a minimum of 10 images per state were quantitatively analyzed. After completing the fatigue testing, use a wire cutting machine to vertically section the fatigued sample at the notch root. Then, after polishing and corrosion, the deformation area was observed under SEM equipment (Figure 3). Furthermore, the features of the microstructure deformation close to the crack initiation region of the specimens were characterized via transmission electron microscopy (TEM, FEI Tecnai G2 F20), to study the microstructural deformation mechanism. The TEM foils were first mechanically ground to a thickness of ~0.08 mm and then further thinned using a Gatan 691 ion thinning instrument. The inclination angles of the three thinning stages were 8°, 5°, and 3°, and the working voltages were 5.3, 4.5, and 3.6 keV, respectively.
3. Results and Discussions
3.1. Effect of Aging Temperature on Multi-Level Microstructures of TC21 Alloy
The microstructure at three different aging temperatures is shown in Figure 4, which consists of α fine lamellae precipitated in the β phase and parallel arranged α laths within the α colonies [23]. To enhance statistical analysis and distinguish between phases, we utilized Image-pro-plus 8.0 to replace the background colors for the β phase (blue region) and α phase (red region), as illustrated in Figure 4d–f. The statistical results demonstrate that with increasing aging temperature, both the aging of αfine and α colonies intensify, while the thickness of α lath decreases but its content increases. Conversely, the volume fraction of αfine gradually diminishes. Furthermore, an elevated aging temperature leads to thickening of GBα, increased microstructure heterogeneity, incomplete precipitation of a significant number of β phase into αfine resulting in uneven areas formation [24,25].
3.2. Effect of Aging Temperature on on the Notch Tensile Properties of TC21 Alloy
The stress-strain curve for the notch tensile samples subjected to three distinct aging temperatures is displayed in Figure 5. Strength and plasticity data for these samples are summarized in Table 2. The figure indicates an initial rise followed by a subsequent decline in notch strength with increasing aging temperature. Specifically, the ultimate tensile strength (UTS) at an aging temperature of 600 °C was 4.4% higher than that at 550 °C and 4.6% higher than that at 650 °C. Furthermore, there was no significant difference in UTS between samples aged at 550 °C and those aged at 650 °C, with just a marginal variance of only 0.19% between them. It is noteworthy that the notch alters the stress distribution at the notch root compared to a smooth sample. This modification induces local plastic deformation at the notch root, expanding the plastic deformation zone and leading to stress relaxation, thereby enhancing the alloy's strength [8,26]. Simultaneously, the notch brings about a change in stress distribution at the root, resulting in decreased plasticity and an elevated risk of brittle fracture in the alloy. Following prior experimental investigations, the notch high cycles fatigue experiments were conducted to determine the ultimate fatigue strengths of the TC21 alloy with various MLMs. The results revealed values of 240, 280, and 230 MPa, respectively. Aligning with the trend observed in tensile strength. The corresponding values of its σ-1(107)/UTS ratios were calculated as 0.152, 0.170, and 0.146, respectively. The general consensus suggests that a higher ratio of fatigue strength to tensile strength signifies superior overall fatigue performance of the alloy.
Figure 6 shows the surface morphology characteristics of the notch tensile fracture of the samples after different aging treatment. At the aging temperature of 550 °C, a large number of dimples and a small number of cleavage faces are distributed on the fracture surface of the sample (Figure 6a–c). This indicates that the notch tensile fracture mechanism with the aging temperature of 550 °C is dominated by the typical mixed fracture mode, and mainly ductile fracture of dimple polymerization type. Remarkably, it is observed that the width of GBα increases with the aging temperature. The fracture along the crystal formed by interface cracking dominates sample fracture. Specifically, for samples with aging temperature of 600 °C, the fracture surface exhibits an increased presence of cleavage facets areas, with enlarged cleavage fracture area compared to samples aged at 550°C. Similarly, Ti-55531 alloy aging temperature of 650 °C, a significant amount of GBα cracking results in extensive regional cleavage fracture along the crystal, accompanied by a minor distribution of toughness fractures on the fracture surface [27].
In conclusion, it is evident that as the aging temperature increases, the fracture mechanism of the alloy progressively transitions from ductile to brittle. Additionally, a higher aging temperature leads to a decrease in both the size of localized dimples and the formation of tear ridges on the cleavage surface. Previous research has indicated that tear ridge formation is associated with significant plastic deformation of the α phase in titanium alloy [28]. Our current investigation demonstrates an inverse relationship between tear ridge depth/length and α lath thickness, suggesting minimal plastic deformation at lower aging temperatures. Conversely, at higher aging temperatures, intense plastic deformation causes local tearing and pronounced tear ridge formation.
3.3. Microvoids and Microcracks Features below the Main Crack Initiation Region
Figure 7 indicates microvoids and microcracks at the notch root of the samples A1 and A2. It can be seen that α colonies at the notch root of sample A1 exhibits minimal deformation, with a deformed width of approximately 35 μm (Figure 7a). This phenomenon can be attributed to the reduced size of αc at lower aging temperatures and its superior ability to coordinate deformation coherently in the initial cyclic deformation stages, thereby mitigating local plastic deformation. Further investigation revealed that numerous microvoids and microcracks originated at interfaces such as αfine/βr and αlath/βtrans interfaces (Figure 7b,c). These defects expanded from the notch root towards the center under sustained cyclic deformation influence.
As the cyclic loading continues, the deformation of α colony at the notch root intensifies, resulting in an approximate deformed width of 57 μm and an enlarged locally deformed area shifting towards the center (Figure 7d). Numerous micro-voids and micro-cracks emerge from the deformed α colonies, while fatigue micro-voids and micro-cracks propagate and interconnect along the αlath/βtrans interface with prolonged cyclic loading, exhibiting a continuous distribution pattern (Figure 7e). Additionally, certain regions of the β phase show limited micro-voids and torsional deformation, indicating their involvement in cyclic deformation (Figure 7f). Notably, interactions between micro-voids and micro-cracks lead to progressive migration of long cracks from the surface towards the center. Sample A2 demonstrates more pronounced fatigue damage compared to sample A1.
Figure 8 shows the micro-voids and micro-cracks at the notch root of the samples B1 and B2. During the initial stages of cyclic deformation, micro-voids and micro-cracks primarily initiated within the deformed α colonies at the notch root, resulting in a deformation area width of approximately 62 μm for α colonies (Figure 8a). Subsequent analysis identified that the predominant origin of micro-voids and micro-cracks is at the αlath/βtrans interface as well as at the GBα (Figure 8b). A minor fraction of the micro-cracks extended along the αlath/βtrans interface for a certain distance before progressing through the αfine, ultimately causing fracture in the αfine subsequent to twisting deformation (Figure 8c). As the cyclic loading continues, the α colonies at the notch root undergoes severe kinking, resulting in a kinked α colonies width of approximately 74 μm (Figure 8d). The deformed area diminishes with proximity to the center from the surface. Micro-voids and micro-cracks emerge within the heavily twisted α colonies, exhibiting a continuous distribution pattern characterized by micro-void accumulation preceding micro-crack formation (Figure 8e,f). Additionally, a limited number of microvoids are observed in the deformed β phase, where their interconnection drives localized plastic deformation, fostering further fatigue crack initiation [29].
Figure 9 displays the micro-voids and micro-cracks characteristics at the notch root of the samples C1 and C2. In sample C1, the αc and GBα at the notch root exhibited significant twisting, resulting in an increased deformed length of 84 μm (Figure 9a). Some regions displayed distinct "striped" structures due to torsional deformation, with micro-voids and micro-cracks originating within the αc under substantial torsional stress (Figure 9b). Areas subjected to torsional deformation were particularly prone to the formation of micro-voids and micro-cracks (Figure 9c). As the number of cycles increases, the deformation area at the root of the notch expands. Numerous secondary cracks emerge at the notch root, with micro-voids connecting at the GBα, leading to the formation of micro-cracks (Figure 9d). Additionally, a multitude of micro-voids and micro-cracks propagate and merge along the highly deformed α lath length at the corners of twist deformation, ultimately resulting in βr fracture (Figure 9c–f). Consequently, lengthy cracks along GBα collaborate with cracks extending through α lath to contribute to fatigue failure, with a predominance of mixed fracture mode in the fatigue failure process.
3.4. Dislocation Structures in NHCF Specimens of TC21 Alloy with MLMs
In order to further reveal the influence of different microstructural parameters and cyclic cycles on the evolution of fatigue damage in multi-level lamellar microstructure of TC21 alloy. Figure 10, Figure 11 and Figure 12 show the dislocation characteristics of sample A1 to samples C2, respectively. It is well known that in titanium alloy α phase is soft compared to β phase, the cyclic deformation mainly depends on α phase, which is manifested by the large amount of stacking and entanglement at the α/β interface [30,31]. Figure 10 exhibits the dislocation features below the crack initiation region of the notch root of samples A1 and A2. In specimen A1, a substantial concentration of high-density dislocations is observed within the αfine lamellar structure, while a comparatively smaller number of dislocations accumulate at the αlath/βtrans interface (Figure 10A1-a to Figure 10A1-c). This disparity implies that, for samples with lower aging temperatures, dislocations are more likely to cluster and tangle within the small, densely distributed αfine lamellae, leading to twist deformation of the αfine.
Geometric phase analysis (GPA) [32] of high-resolution transmission electron diffraction (SAED) on torsion-deformed αfine indicates a heightened dislocation density and strain at the αfine/βr interface compared to within the αfine themselves (Figure 10A1-d to Figure 10A1-k). Consequently, micro-voids and micro-cracks are prone to nucleate and propagate preferentially at the αfine/βr interface, consistent with the observations in Figure 7. In the A2 samples, entangled dislocations are not confined solely to the αfine lamellae. A significant number of high-density dislocations also accumulate at the αlath/βtrans interface. This accumulation leads to localized stress concentration and the formation of a ladder-like structure at the interface (Figure 10A2-a to Figure 10A2-c). Additionally, sections of the αfine lamellae characterized by high-density dislocation aggregates were observed to formation twins, further facilitating plastic deformation. Subsequent analysis revealed that the strain at the twins interface surpassed that at the non-twins interface due to discernible dislocation and strain fields present at the twins interface, resulting in localized strain escalation [33,34]. Nonetheless, as strain builds up, twins interface increases the strain energy of αfine and reduces its elastic limit, making it more susceptible to deformation and cracking (Figure 10A2-d to Figure 10A2-i). This observation reveals a possibility of a novel fracture mode within the αfine lamellae stemming from fractures occurring at twins interfaces under lower aging temperatures.
Figure 11 shows the dislocation structure features below the crack initiation region of the notch root of samples B1 and B2. Under higher cyclic loads, the B1 sample exhibits the formation of numerous parallel dislocation lines at the αlath/βtrans interface. These dislocation lines subsequently evolve into persistent slip bands (PSBs), facilitating extrusion and intrusion phenomena, thereby diminishing the interface's ability to impede dislocation motion [35]. Moreover, it also induces local stress concentration, resulting in the genesis of micro-cracks and ladder-like structures (Figure 11B1-a to Figure 11B1-c). Notably, certain αfine lamellae exhibit pronounced twist deformations with an atomic spacing of 0.228 nm inside the αfine, exceeding that of the αfine illustrated in Figure 10A1-f (0.211 nm). The widened atomic spacing implies reduced atomic packing density detrimental to microstructure stability and coordinated deformation capabilities, making the microstructure more prone to significant deformation under stress [36].
Additionally, GPA analysis identifies regions of dislocation pileups and high strain at the αfine/βr radial interface predisposing them to preferential formation of micro-voids and micro-cracks (Figure 11B1-d to Figure 11B1-i). In sample B2, a significant accumulation of high-density dislocations occurs at the αlath/βtrans interface, resulting in more pronounced parallel dislocation lines. Over successive fatigue cycles, these dislocations gradually propagate into the αlath, leading to the formation of persistent slip bands (PSBs) within the αlath (Figure 11B2-a to Figure 11B2-d). The emergence of PSBs reduces the hindering effect on dislocations and increases their density within the αlath. Additionally, GPA analysis reveals higher strain levels at the interface of PSBs compared to non-PSB regions, indicating continued vulnerability to stress concentration at this interface (Figure 11B2f-i). The decreased thickness of αlath triggers activation of various dislocation systems at the αlath/βtrans interface (Figure 11B2-d to Figure 11B2-i), subsequently propagating internally to form dislocation net within the αlath. This not only weakens obstruction by dislocations within the αlath but also promotes ladder-like structures formation. Importantly, twist deformation in the αfine is intensified, generating numerous "zigzag structures" where stress-induced micro-voids and micro-cracks of interface are more likely to occur.
Figure 12 displays the dislocation structure features below the crack initiation region of the notch root of samples C1 and C2. Raising the aging temperature decreases the thickness of αlath and the content of αfine. However, this reduction in αlath thickness shortens the distance for dislocation slip, facilitating dislocation movement within the αlath. In sample C1, numerous dislocations are observed entering the αlath at various angles relative to the αlath/βtrans interface after accumulation (Figure 12C1-a to Figure 12C1-c). Different dislocation systems become active at the αlath/βtrans interface, intertwining within the αlath and causing local stress concentrations that result in micro-voids and micro-cracks. As the aging temperature increases, larger size twisted "Zigzag structures" with stacking faults form among some of the αfine. GPA analysis reveals a continued presence of dislocation pileups and high strain at stacking fault interfaces as well as non-stacking fault interfaces, making them susceptible to fatigue damage (Figure 12C2-d to Figure 12C2-i). In sample C2, there is an increase in deformation and fracture degrees of the αlath which leads to a profusion of PSBs at their interface, generating widespread ladder-like structures (Figure 12C2-a to Figure 12C2-f). Furthermore, parallel walls formed by dislocations occur within these αlath inducing local hardening while compromising resistance against micro-voids and micro-cracks formation. The abundant presence of αfine nanoparticles also contributes to fatigue micro-crack development within them.
In conclusion, notable similarities emerge in terms of notch root location and characteristics of dislocation structure in TC21 alloy under different aging temperatures. For example, dislocations preferentially pile up and generate at interfaces before gradually extending into αlath during fatigue. Samples with lower aging temperatures show significant occurrences of tangled dislocations within smaller αfine which induce local stress concentration (Figure 10 and Figure 11). This stress triggers twin formation as a mechanism to alleviate stress. However, there may be strain disparity between twin interfaces and non-twin interfaces leading to cracks on twin interfaces. Furthermore, while dislocations tend to accumulate at αlath/βtrans interface they do not extend within αlath. The reduced thickness of the αlath makes the αlath/βtrans interface vulnerable, especially under higher cyclic loads, which initiates various dislocation systems and increases the generation of cross PSBs within the interior of the αlath.
The intrusion and extrusion of PSBs weaken the hindrance to dislocations at αlath/βtrans interfaces, promoting a ladder-like deformation structure at the interface and exacerbating fatigue crack formation [37,38]. Similarly, for samples with aging temperature of 650 °C, the αlath exhibits reduced thickness and accumulates a significant number of dislocations at the interface. Subsequent influx of dislocations into the αlath initiates local hardening, facilitating formation and entanglement of dislocation walls within it. This process contributes to micro-crack formation within the αlath, leading to irreversible deformation, localized breakage, and intensified micro-crack formation in αfine (Figure 12).
3.5. The Slip Behavior of Dislocations within the αlath of TC21alloy with MLMs
The impact of α lath internal dislocation slip line activation on fatigue damage under various microstructure was further detected through characterization and observation of the step height of αlath inner slip lines in the irreversible cyclic plastic deformation region at the crack initiation stage of samples A2 and C2 using AFM [39,40]. Figure 13 presents 2D and 3D images illustrating the αlath internal slip lines in the local plastic deformation area of A2 (Figure 13a–c) and C2 (Figure 13d–f). For samples with lower aging temperatures, where the α lath thickness is greater and the dislocation slip distance is comparatively longer, there are restrictions on the generation of dislocation slip lines. As a result, observed dislocation slip lines within the αlath at 550°C are relatively sparse and less prominent, with an average step height of approximately 1.912 nm (Figure 13c). In contrast, for samples with higher aging temperatures, the slip lines become more concentrated and pronounced, resulting in an average step height of about 5.225 nm (Figure 13f).
Previous studies [40,41] have indicated that the Burgers vector for α dislocations in titanium alloys is 0.295 nm, suggesting that a single dislocation motion can yield a step height around 0.295 nm. Therefore, it can be inferred that formation of step heights measuring 1.912 nm or 5.225 nm requires approximately seven or eighteen dislocation motions respectively. This suggests that a thinner αlath is more likely to initiate dislocation and induce greater local strain at the interface [41,42]. Consequently, at lower aging temperatures, the thick αlath exhibits enhanced dislocation hindrance compared to the thinner αlath, leading to the extension of micro-voids and micro-cracks along the boundary under cyclic stress. Conversely, for samples with higher aging temperatures, the heightened internal strain in the αlath results in the generation of micro-voids and micro-cracks, facilitating crack propagation through it.
4. Conclusions
- The width of αc and GBα, the size of αfine, and the content of αlath increase as aging temperature increases, while the thickness of αlath and the content of αfine decrease. The notched tensile strengths of the TC21 alloy were determined to be 1580, 1650, and 1577 MPa with an increase in aging temperature, while the corresponding notched fatigue strengths were 240, 280, and 230 MPa respectively.
- The notch alters the stress distribution at the root, resulting in localized plastic deformation and stress relaxation at the notch root, which enhances the strength of the alloy but also exacerbates brittle fracture occurrence. The increase in grain boundaries is the primary driving factor for fracture propagation along the GBα.
- When the αlath is thicker and the αfine is smaller, micro-voids and micro-cracks primarily form along the twist deformed interfaces of αlath/βtrans and αfine/βr, gradually spreading along these interfaces. As the sizes of GB α and αfine increase and the thickness of α lath decreases, micro-voids and micro-cracks emerge not only at the αlath/βtrans interface under twist deformation but also within GB α, characterized by relatively large localized plastic deformation regions. These micro-voids and micro-cracks propagate along the αlath/βtrans interface or penetrate through the αlath, creating lengthy zigzag cracks that eventually result in specimen fracture.
- The deformation and fracture behavior of αfine is influenced by their size. Larger αfine release dislocations upon fracture, which decreases the density of dislocations accumulated at the αfine/βr interface. Conversely, a thicker αlath allows for the buildup and propagation of dislocations along the αlath/βr interface, resulting in the formation of numerous micro-voids that coalesce along the interface, creating micro-cracks. In contrast, a thinner αlath initiates different dislocation systems at the αlath/βtrans interface. These dislocations propagate into the interior of the αlath at an angle to the interface, forming PSBs and dislocation walls within the αlath, intensifying local hardening and promoting the development of micro-voids and micro-cracks.
Author Contributions
Conceptualization, X.Z. and C.H.; methodology, X.L.; software, X.L.; validation, X.Z., X.L. and C.H.; formal analysis, X.Z. and X.L.; investigation, X.Z. and Q.W.; resources, Q.W. and F.Z.; data curation, F.Z.; writing—original draft preparation, X.Z.; writing—review and editing, X.L. and C.H.; visualization, F.Z.; supervision, C.H.; project administration, C.H. and F.Z.; funding acquisition, Q.W. All authors have read and agreed to the published version of the manuscript.
Funding
This research was funded by the National Natural Science Foundation of China (Nos. 52061005 and 52261025), the Science and Technology Program of Guizhou Province (Nos. YQK [2024]181,[2023]009, [2021]310, ZK [2022]326, and [2022]005), Youth Science and Technology Talent Growth Project of Guizhou Province (No. KY [2022]169).
Acknowledgments
We thank Dr. Xuehao Zheng from ZKKF (Beijing) Science & Technology Company for supporting of TEM analysis.
Conflicts of Interest
The authors declare no conflicts of interest.
References
- Zhu, Y.; Zhang, K.; Meng, Z.; Zhang, K.; Hodgson, P.; Birbilis, N.; Weyland, M.; Fraser, H.L.; Lim, S.C.V.; Peng, H.; Yang, R.; Wang, H.; Huang, A. Ultrastrong nanotwinned titanium alloys through additive manufacturing. Nat. Mater. 2022, 21, 1258–1262. [Google Scholar] [CrossRef] [PubMed]
- Wang, K.; Wu, M.; Yan, Z.; Li, D.; Xin, R.; Liu, Q. Dynamic restoration and deformation heterogeneity during hot deformation of a duplex-structure TC21 titanium alloy. Mater. Sci. Eng. A. 2018, 712, 440–452. [Google Scholar] [CrossRef]
- Zhao, Q.; Sun, Q.; Xin, S.; Chen, Y.; Wu, C.; Wang, H.; Xu, J.; Wan, M.; Zeng, W.; Zhao, Y. High-strength titanium alloys for aerospace engineering applications: A review on melting-forging process. Mater. Sci. Eng. A. 2022, 845, 143260. [Google Scholar] [CrossRef]
- Zhang, P.; Zeng, W.; Ma, H.; Zhang, F.; Xu, L.; Liang, X.; Zhao, Y. Research on tensile anisotropy of Ti-22Al-25Nb alloy isothermally forged in B2 phase region related with texture and variant selection. Mater. Charact. 2023, 201, 112899. [Google Scholar] [CrossRef]
- Polyakov, A.V.; Raab, G.I.; Semenova, I.P.; Valiev, R.Z. Notched fatigue and impact toughness. Mater. Lett. 2021, 302, 130366. [Google Scholar] [CrossRef]
- Zhang, D.; Qiu, D.; Gibson, M.A.; Zheng, Y.; Fraser, H.L.; StJohn, D.H.; Easton, M.A. Additive manufacturing of ultrafine-grained high-strength titanium alloys. Nature 2019, 576, 91–95. [Google Scholar] [CrossRef]
- Jena, S.K.; Gupta, S.K.; Arora, P.; Chattopadhyay, J. Fatigue experiments and life predictions of notched C-Mn steel tubes. Int. J. Fatigue 2023, 165, 1075027. [Google Scholar]
- Cavuoto, R.; Lenarda, P.; Msseroni, D.; Paggi, M.; Bigoni, D. Failure through crack propagation in components with holes and notches: An experimental assessment of the phase field model. Int. J. Solids Struct. 2022, 257, 111798. [Google Scholar] [CrossRef]
- Santiago, A.M.; Vázquez, J.; Navarro, C.; Domínguez, J. Fatigue behavior of notched and unnotched AM Scalmalloy specimens subjected to different surface treatments. Int. J. Fatigue 2024, 181, 108146. [Google Scholar]
- Yu, Y.; Liu, Y.; Jiang, W.; Pei, X.; Wang, P.; Dong, P.; Wang, B.; Xie, X. Notch structural stress theory: Part II predicting total fatigue lives of notched structuresInternational. Int. J. Fatigue. 2024, 182, 108201. [Google Scholar] [CrossRef]
- Haritos, G.K.; Nicholas, T.; Lanning, D.B. Notch size effects in HCF behavior of Ti-6Al-4V. Int. J. Fatigue. 1999, 21, 643–652. [Google Scholar] [CrossRef]
- Yuri, T.; Ono, Y.; Ogata, T. Effects of surface roughness and notch on fatigue properties for Ti–5Al–2. 5Sn ELI alloy at cryogenic temperatures. Sci. Technol. Adv. Mat 2003, 4, 291–299. [Google Scholar]
- Wu, Z.; Kou, H.; Chen, N.; Zhang, M.; Hua, K.; Fan, J.; Tang, B.; Li, J. Duality of the fatigue behavior and failure mechanism in notched specimens of Ti-7Mo-3Nb-3Cr-3Al alloy. J. Mater. Sci. Technol. 2020, 50, 204–214. [Google Scholar] [CrossRef]
- Zhang, Z.; Huang, C.; Xu, Z.; Yang, J.; Long, S.; Tan, C.; Wan, M.; Liu, D.; Ji, S.; Zeng, W. Influence of notch root radius on high cycle fatigue properties and fatigue crack initiation behavior of Ti-55531 alloy with a multilevel lamellar microstructure. J. Mater. Res. Technol. 2023, 24, 6293–6311. [Google Scholar] [CrossRef]
- Liu, Y.; Deng, C.; Gong, B.; He, Y.; Wang, D. Fatigue limit prediction of notched plates using the zero-point effective notch stress method. Int. J. Fatigue. 2021, 151, 106392. [Google Scholar] [CrossRef]
- Beber, V.C.; Schneider, B. Fatigue of structural adhesives under stress concentrations: Notch effect on fatigue strength, crack initiation and damage evolution. Int. J. Fatigue 2020, 140, 105824. [Google Scholar] [CrossRef]
- Nie, B.; Zhao, Z.; Ouyang, Y.; Chen, D.; Chen, H.; Sun, H.; Liu, S. Effect of low cycle fatigue predamage on very high cycle fatigue behavior of TC21 titanium alloy. Materials 2017, 10, 1384. [Google Scholar] [CrossRef] [PubMed]
- Tan, C.; Li, X.; Sun, Q.; Xiao, L.; Zhao, Y.; Sun, J. Effect of α-phase morphology on low-cycle fatigue behavior of TC21 alloy. Int. J. Fatigue. 2015, 75, 1–9. [Google Scholar] [CrossRef]
- Hémery, S.; Stinville, J.C.; Wang, F.; Charpagne, M.A.; Emigh, M.G.; Pollock, T.M.; Valle, V. Strain localization and fatigue crack formation at (0001) twist boundaries in titanium alloys. Acta. Mater. 2021, 219, 117227. [Google Scholar] [CrossRef]
- Luo, X.; Dang, N.; Wang, X. The effect of laser shock peening, shot peening and their combination on the microstructure and fatigue properties of Ti-6Al-4V titanium alloy. Int. J. Fatigue 2021, 153, 106465. [Google Scholar] [CrossRef]
- Nie, B.; Chen, D.; Zhao, Z.; Zhang, J.; Meng, Y.; Gao, G. Notch effect on the fatigue behavior of a TC21 titanium alloy in very high cycle regime. Appl. Sci. 2018, 8, 1614. [Google Scholar] [CrossRef]
- Ye, X.; Wan, M.; Huang, C.; Lei, M.; Jian, S.; Zhang, Y.; Xu, D.; Huang, F. Effect of aging temperature on mechanical properties of TC21 alloy with multi-level lamellar microstructure, Mater. Sci. Eng. A. 2022, 840, 142825. [Google Scholar] [CrossRef]
- Li, C.; Huang, L.; Li, C.; Hui, S.; Yu, Y.; Zhao, M.; Guo, S.; Li, J. Research progress on hot deformation behavior of high-strength beta titanium alloy: Flow behavior and constitutive model. Rare. Metals 2022, 41, 1434–1455. [Google Scholar] [CrossRef]
- Tan, C.; Sun, Q.; Zhang, G. Role of microstructure in plastic deformation and crack propagation behaviour of an α/β titanium alloy. Vaccum 2021, 183, 109848. [Google Scholar] [CrossRef]
- Shao, H.; Shan, D.; Zhao, Y.; Ge, P.; Zeng, W. Accordance between fracture toughness and strength difference in TC21 titanium alloy with equiaxed microstructure. Mater. Sci. Eng. A 2016, 664, 10–16. [Google Scholar] [CrossRef]
- Hu, X.; Jia, X.; Bao, Z.; Song, Y. Effect of notch geometry on the fatigue strength and critical distance of TC4 titanium alloy. J. Mech. Sci. Technol. 2017, 31, 4727–4737. [Google Scholar] [CrossRef]
- Lin, Y.; Jiang, X.; Shuai, C.; Zhao, C.; He, D.; Chen, M.; Chen, C. Effects of initial microstructures on hot tensile deformation behaviors and fracture characteristics of Ti-6Al-4V alloy. Mater. Sci. Eng. A. 2018, 711, 293–302. [Google Scholar] [CrossRef]
- Long, W.; Ou, M.; Mao, X.; Liang, Y. In situ deformation behavior of TC21 titanium alloy with different alpha morphologies (equiaxed/lamellar). Rare. Metals 2021, 40, 1173–1181. [Google Scholar] [CrossRef]
- Ren, W.; Nicholas, T. Notch size effects on high cycle fatigue limit stress of Udimet 720. Mater. Sci. Eng. A. 2003, 357, 141–152. [Google Scholar] [CrossRef]
- Yang, Q.; Ma, M.; Tan, Y.; Xiang, S.; Zhao, F.; Liang, Y. Microstructure and texture evolution of TB8 titanium alloys during hot compression. Rare. Metals 2021, 40, 2917–2926. [Google Scholar] [CrossRef]
- Jha, S.K.; Szczepanski, C.J.; John, R.; Larsen, M. Deformation heterogeneities and their role in life-limiting fatigue failures in a two-phase titanium alloy. Acta. Mater. 2015, 82, 378–395. [Google Scholar] [CrossRef]
- Dai, X.; Xie, H.; Wang, H.; Li, C.; Liu, Z.; Wu, L. The geometric phase analysis method based on the local high resolution discrete Fourier transform for deformation measurement. Meas. Sci. Technol. 2014, 25, 025402. [Google Scholar] [CrossRef]
- Eftink, B.P.; Li, A.; Szlufarska, I.; Mara, N.A.; Robertson, I.M. Deformation response of AgCu interfaces investigated by in situ and ex situ TEM straining and MD simulations. Acta. Mater. 2017, 138, 212–223. [Google Scholar] [CrossRef]
- Chen, J.S.; Liu, Y.; McCabe, R.J.; Wang, J.; Tomé, C.N. Quantifying elastic strain near coherent twin interface in magnesium with nanometric resolution. Mater. Character. 2020, 160, 110082. [Google Scholar] [CrossRef]
- Murzinova, M.A.; Zherebtsov, S.V.; Klimenko, D.N.; Semiatin, S.L. The effect of β stabilizers on the structure and energy of α/β interfaces in titanium alloys. Metall. Mater. Trans. A. 2021, 52, 1689–1698. [Google Scholar] [CrossRef]
- Yang, K.; Zhong, B.; Huang, Q.; He, C.; Huang, Z.; Wang, Q.; Liu, Y. Stress ratio effect on notched fatigue behavior of a Ti-8Al-1Mo-1V alloy in the very high cycle fatigue regime. Int. J. Fatigue 2018, 116, 80–89. [Google Scholar] [CrossRef]
- He, C.; Li, X.; Liu, Y.; Wang, C.; Zhang, H.; Li, L.; Wang, Q.; Shao, X.; Chen, Q. Localized dislocation interactions within slip bands and crack initiation in Mg-10Gd-3Y-0. 3Zr. Int. J. Fatigue. 2021, 150, 106302. [Google Scholar] [CrossRef]
- Hémery, S.; Dang, V.T.; Signor, L.; Villechaise, P. Influence of microtexture on early plastic slip activity in Ti-6Al-4 V polycrystals. Metall. Mater. Trans. A 2018, 49, 2048–2056. [Google Scholar] [CrossRef]
- Bailey, G.W.; Dimlich, R.V.W.; Alexander, K.B.; McCarthy, J.J.; Pretlow, T.P.; Okerstrom, S.; Geng, W.; Kramer, D.; Gerberich, W. Slip Band Analysis by Scanning Electron Microscopy (SEM) and Atomic Force Microscopy (AFM). Microsc. Microanal. 1997, 3, 1273–1274. [Google Scholar]
- Huang, F.; Huang, C.; Zeng, H.; Yang, J.; Wang, T.; Wan, M.; Liu, D.; Ji, S.; Zeng, W. Deformation and fracture mechanisms of Ti-55531 alloy with a bimodal microstructure under the pre-tension plus torsion composite loading. J. Mater. Res. Technol. 2023, 26, 7425–7443. [Google Scholar] [CrossRef]
- Lunt, D.; Busolo, T.; Xu, X.; da Fonseca, J.Q.; Preuss, M. Effect of nanoscale α2 precipitation on strain localisation in a two-phase Ti-alloy. Acta. Mater. 2017, 129, 72–82. [Google Scholar] [CrossRef]
- Zhang, H.; Liu, Z.; Wen, H.; Xie, H.; Liu, C. Subset geometric phase analysis method for deformation evaluation of HRTEM images. Ultramicroscopy 2016, 171, 34–42. [Google Scholar] [CrossRef] [PubMed]
Figure 1.
Original microstructure of TC21 alloy (a) SEM image and (b) TEM image.
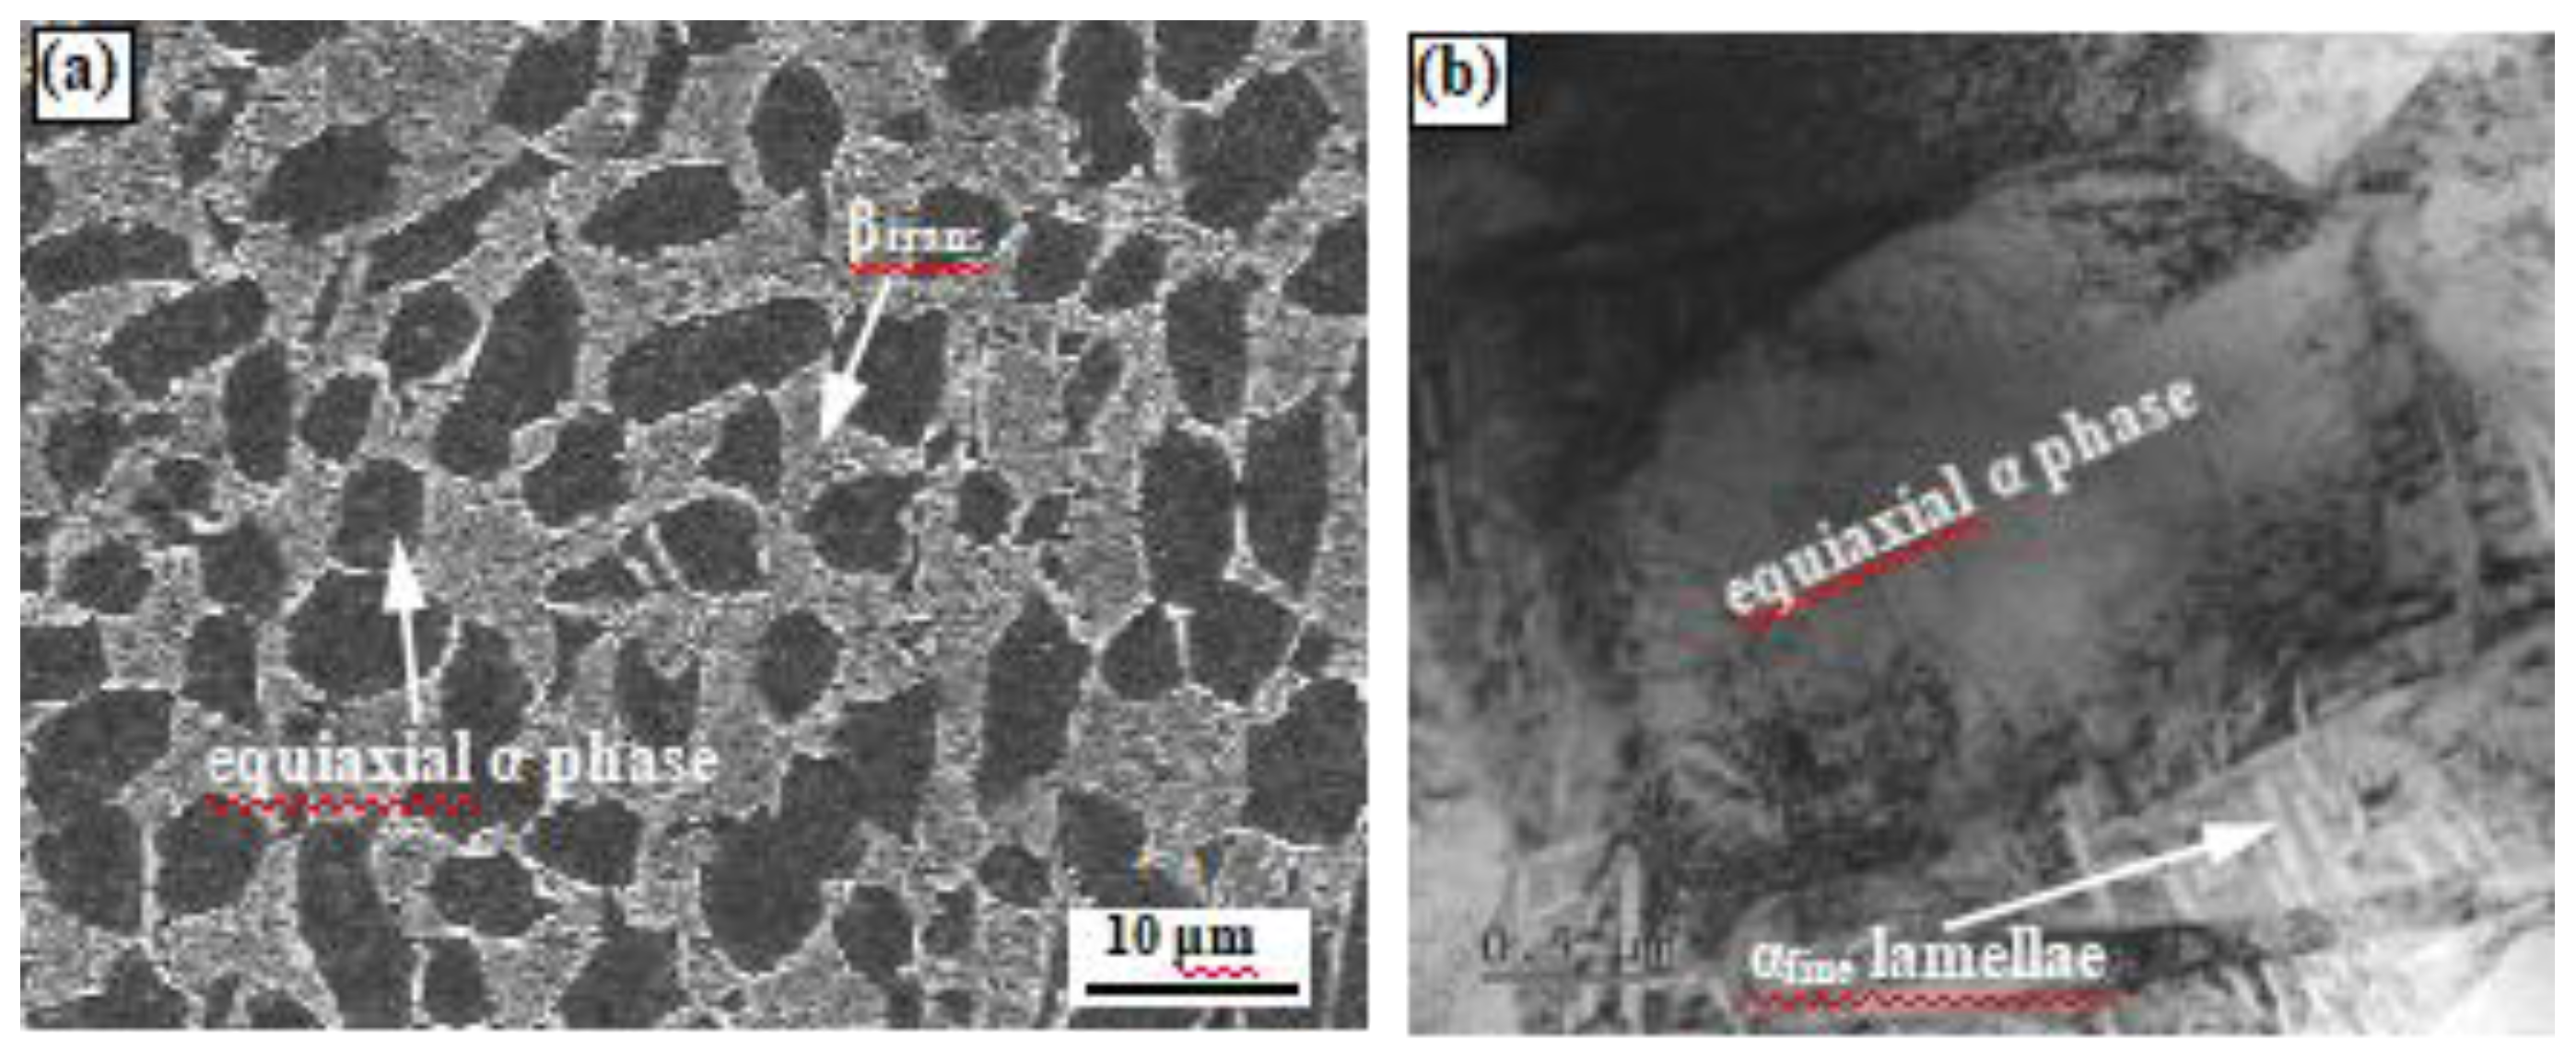
Figure 2.
(a) Geometry of notch tensile and high cycle fatigue specimen [12]; (b) 3D model images; (c) real sample.
Figure 2.
(a) Geometry of notch tensile and high cycle fatigue specimen [12]; (b) 3D model images; (c) real sample.
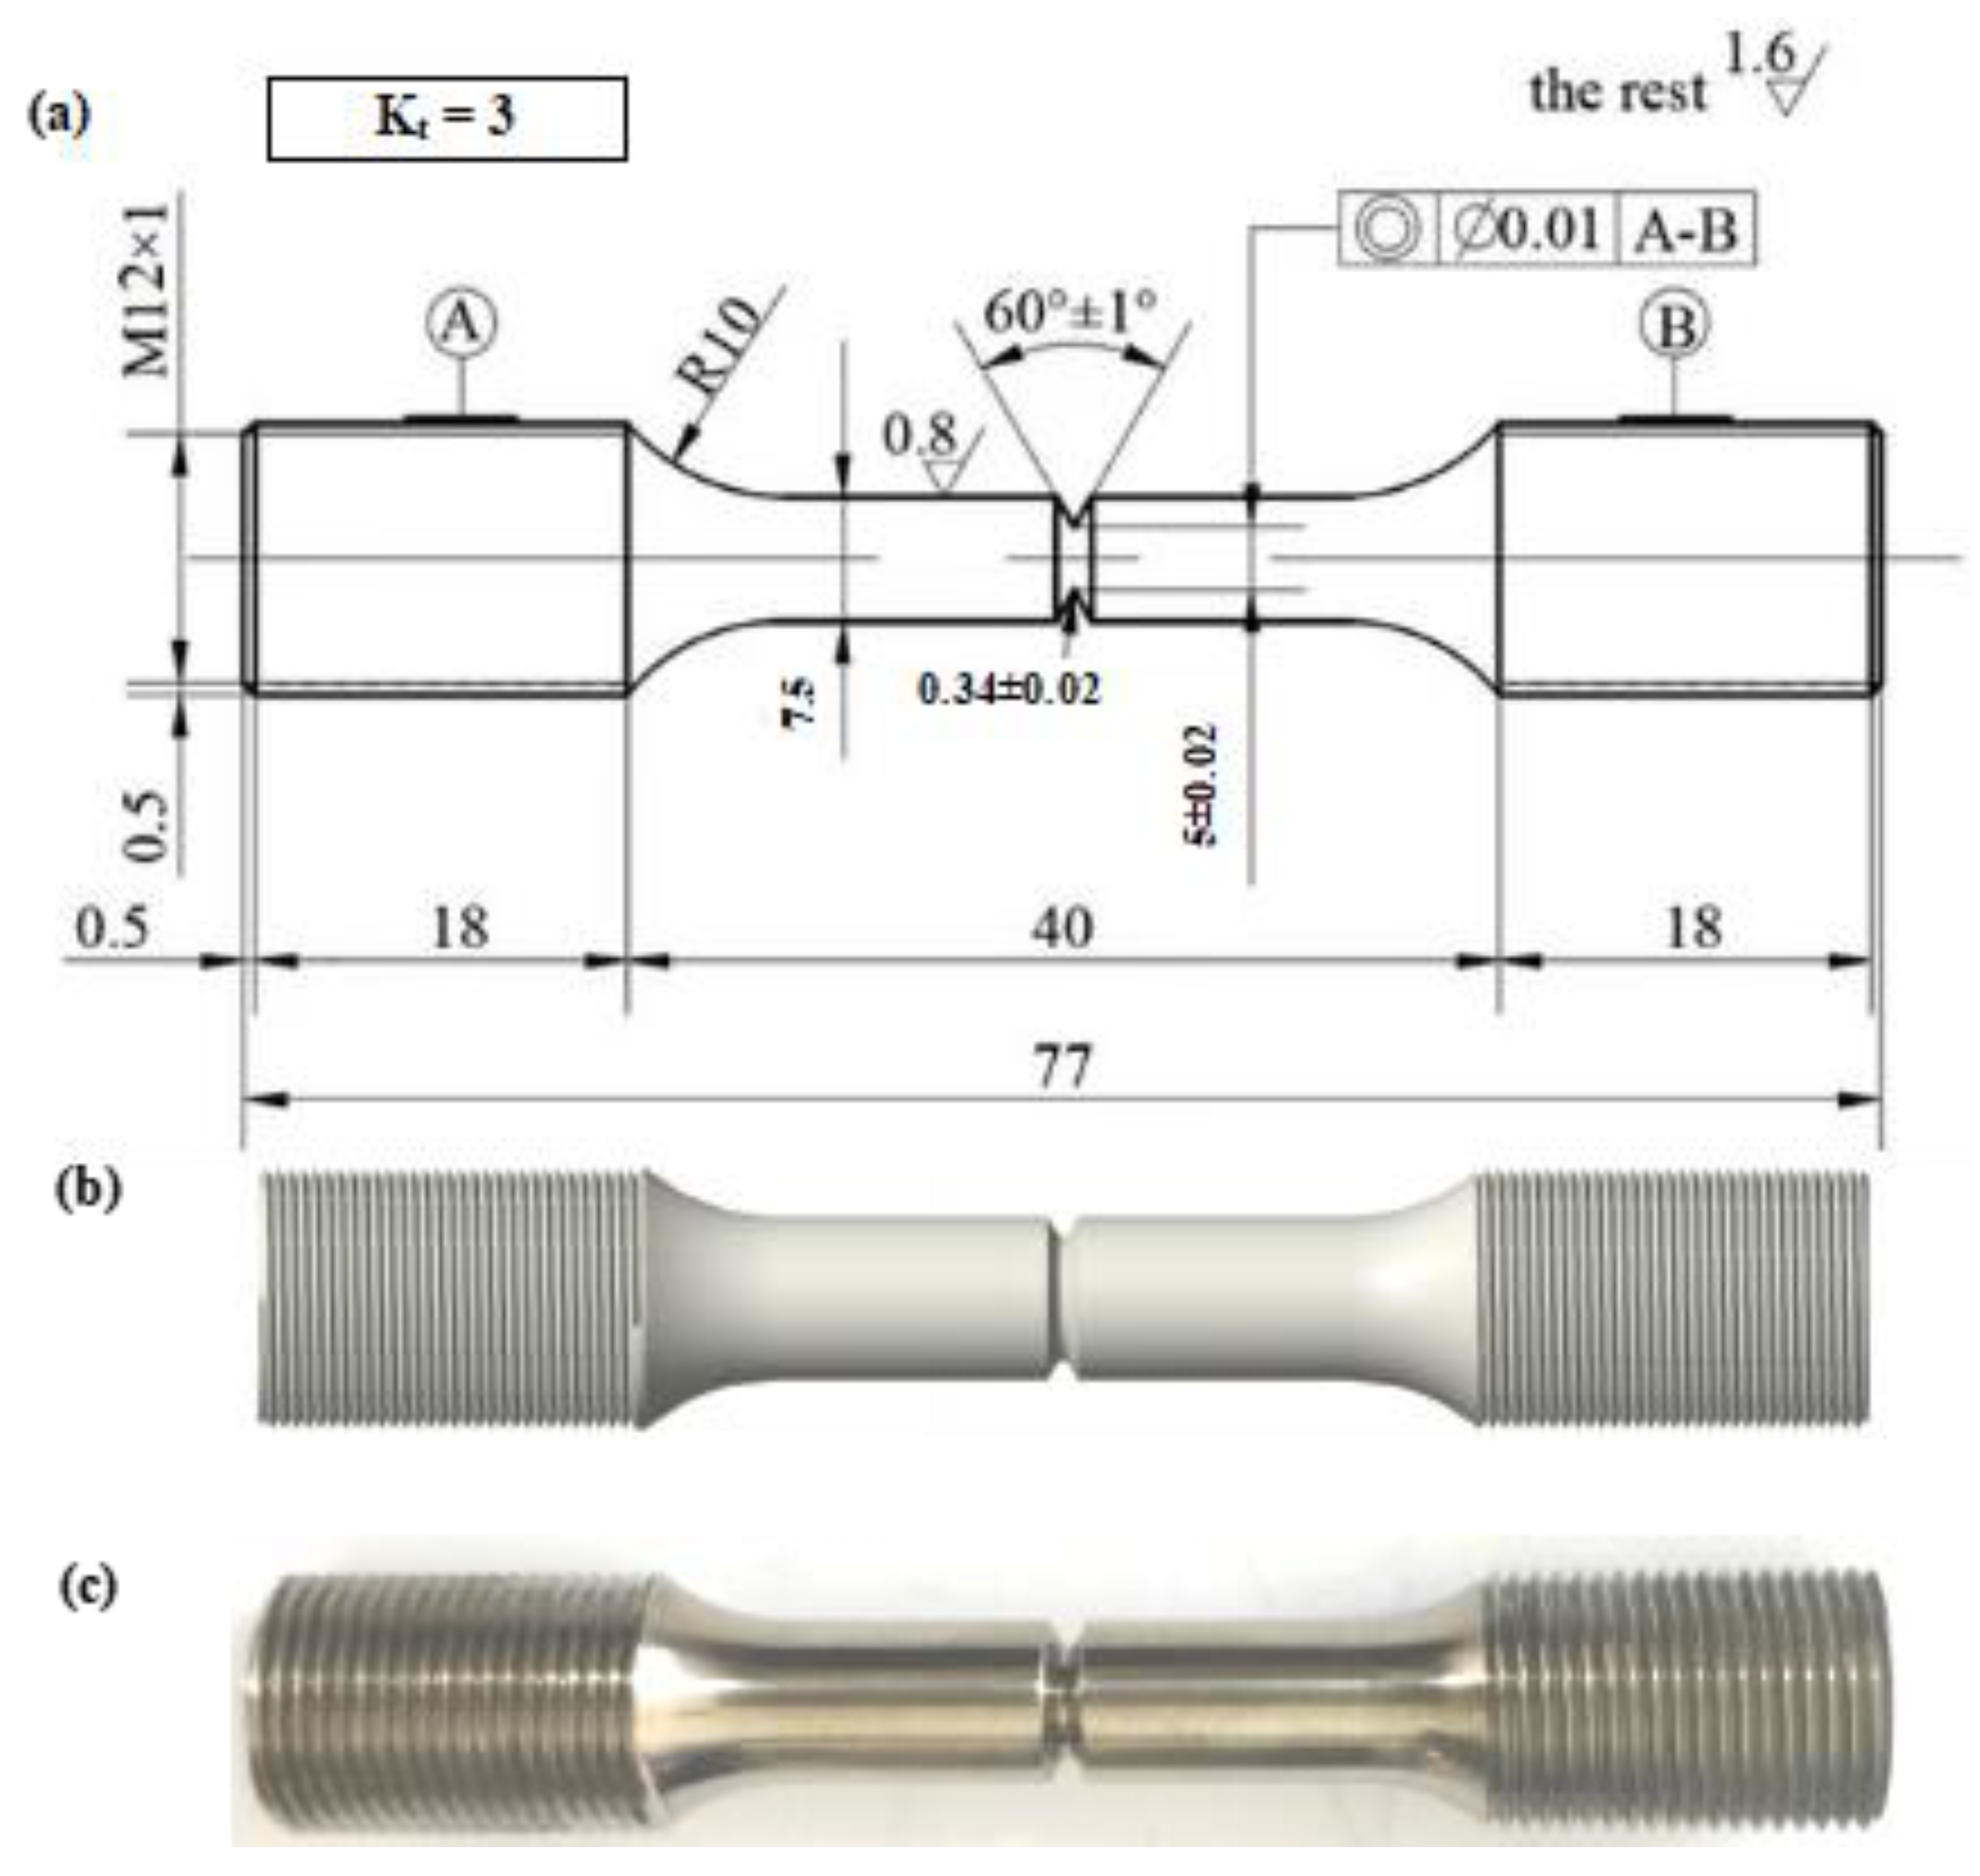
Figure 3.
Schematic illustration for (a) SEM observation of microvoids, microcracks and deformation characteristics and (b) TEM observation of microstructural features below the primary fatigue crack initiation site.
Figure 3.
Schematic illustration for (a) SEM observation of microvoids, microcracks and deformation characteristics and (b) TEM observation of microstructural features below the primary fatigue crack initiation site.
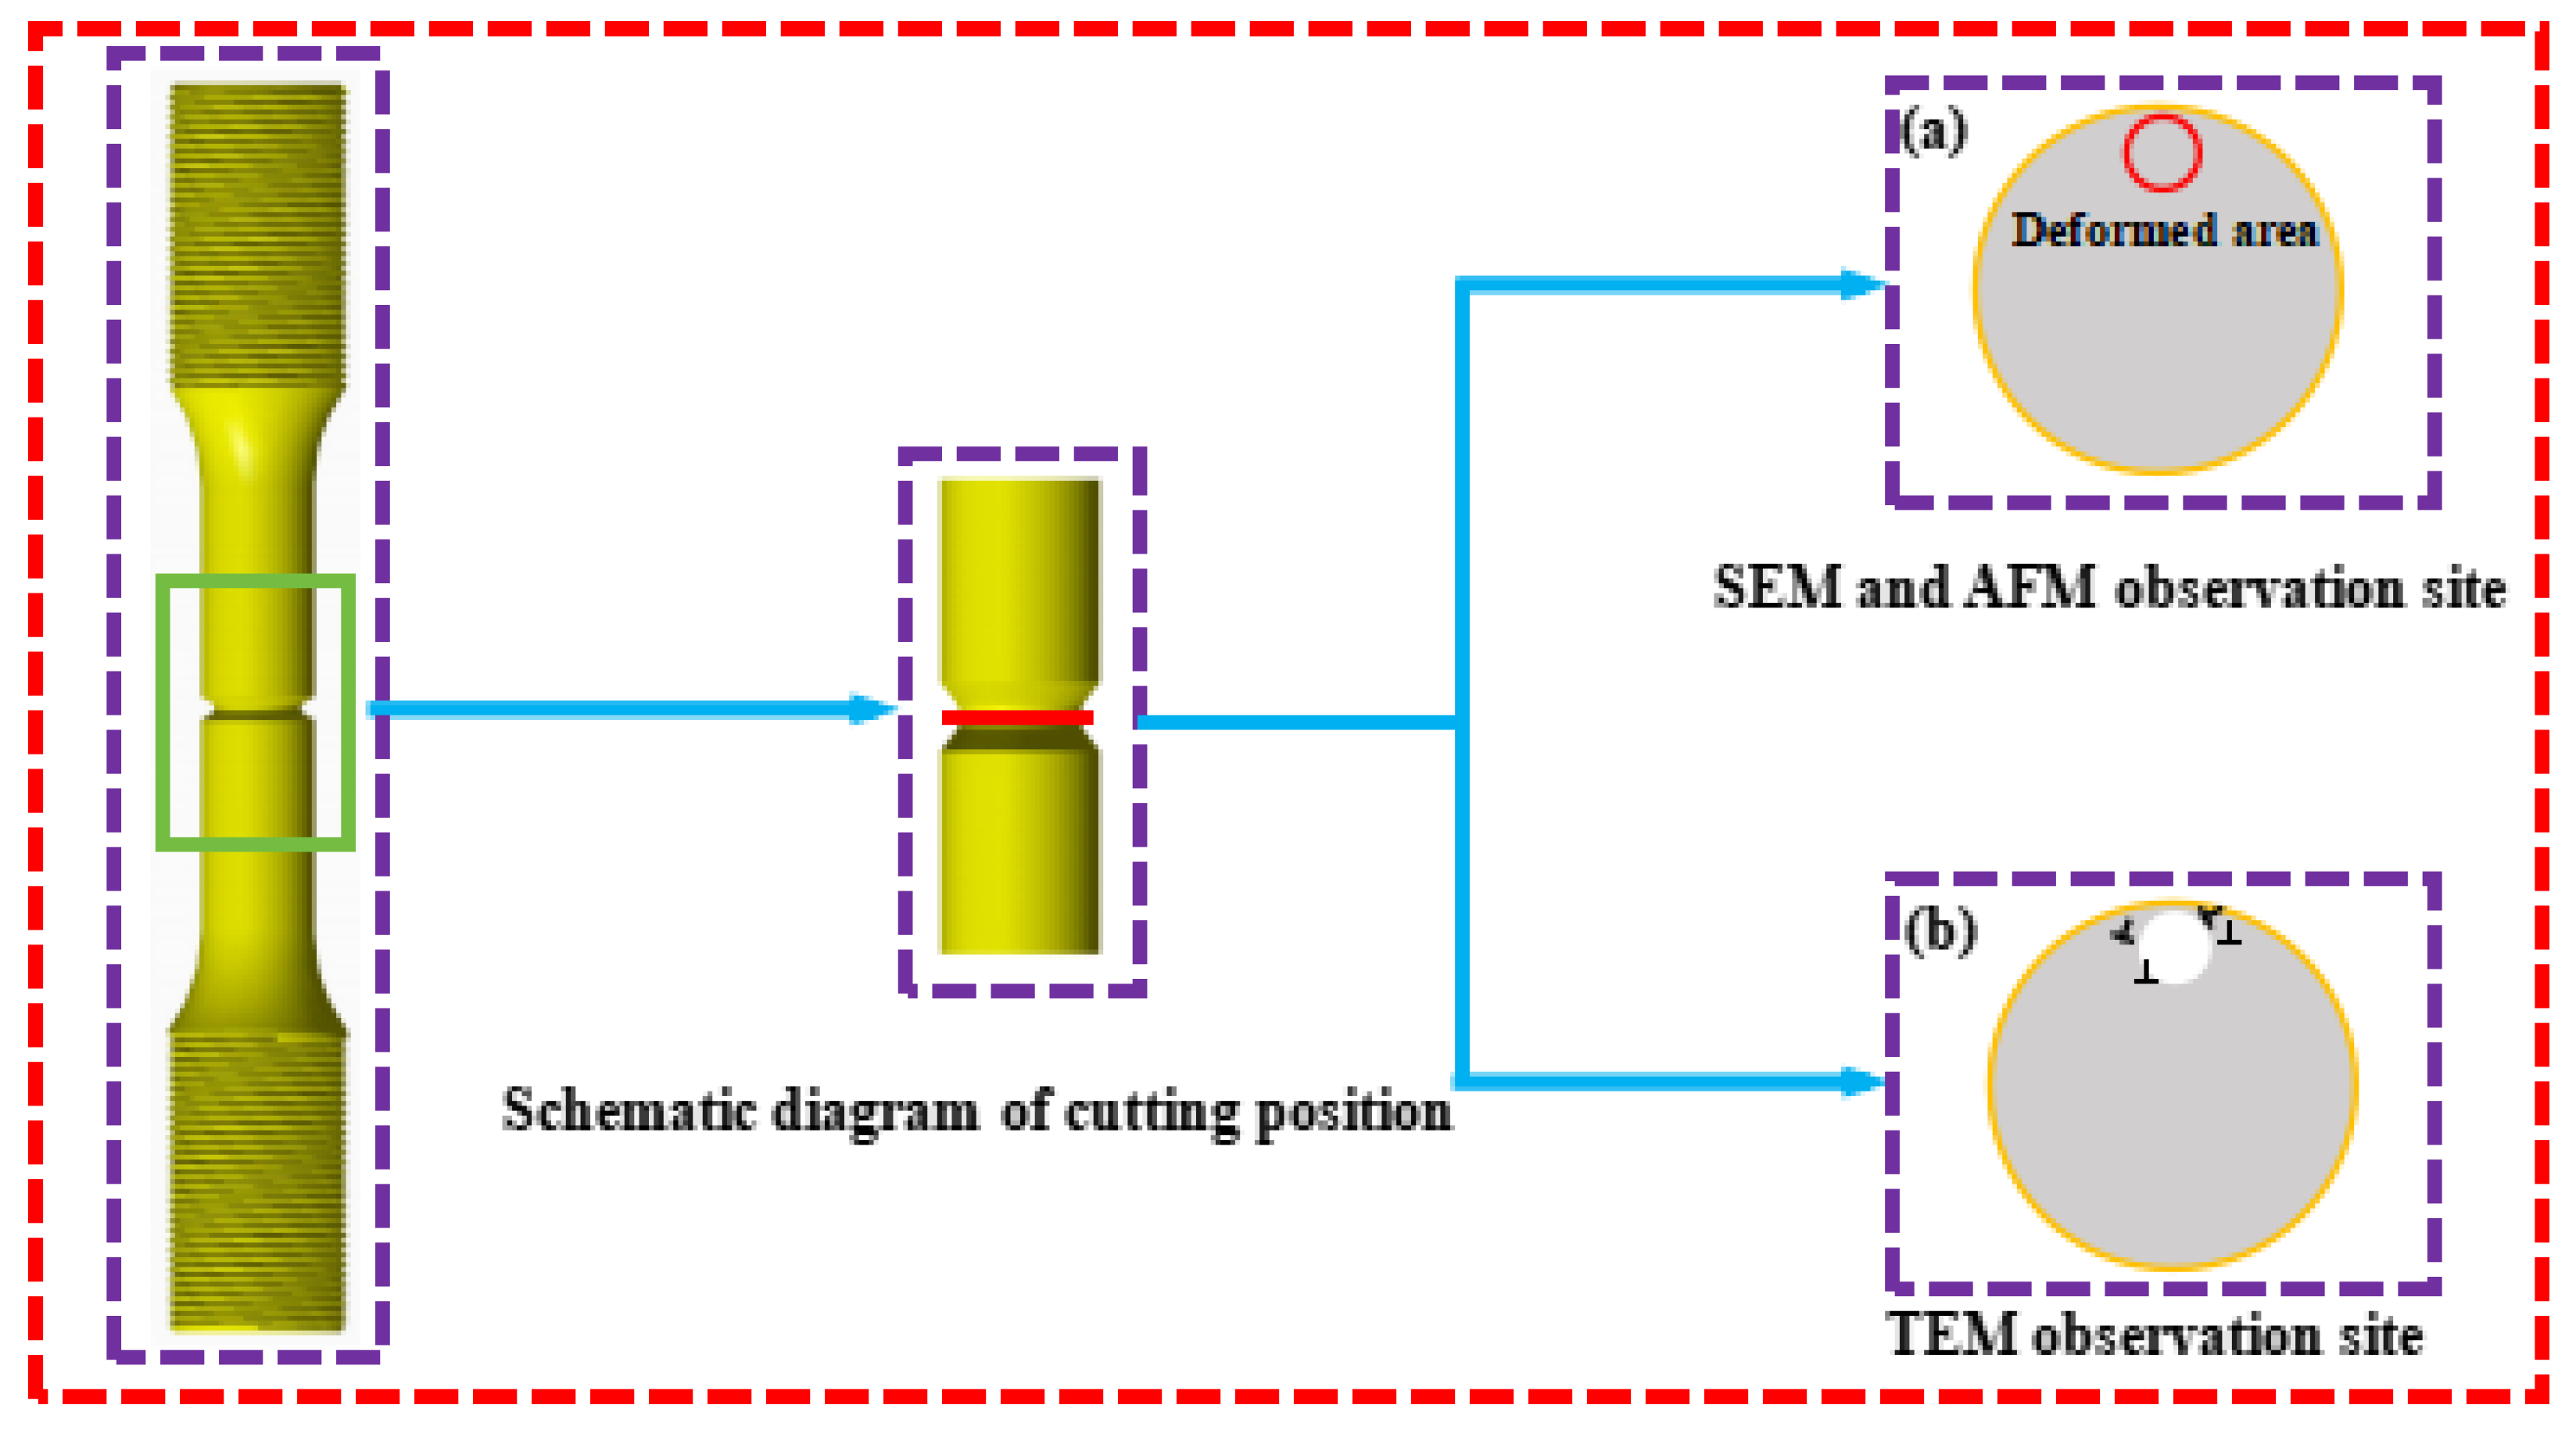
Figure 4.
Microstructure of TC21 alloy after 1010 ℃/ 0.5 h solid solution, 800 ℃/ 2 h/ AC annealing and different temperatures: (a), (d) and (g) 550 ℃, (b), (e) and (h) 600 ℃, (c), (f) and (i) 650 ℃ aging for 5 h/ AC; (a-f) SEM images; (g-i) TEM images.
Figure 4.
Microstructure of TC21 alloy after 1010 ℃/ 0.5 h solid solution, 800 ℃/ 2 h/ AC annealing and different temperatures: (a), (d) and (g) 550 ℃, (b), (e) and (h) 600 ℃, (c), (f) and (i) 650 ℃ aging for 5 h/ AC; (a-f) SEM images; (g-i) TEM images.
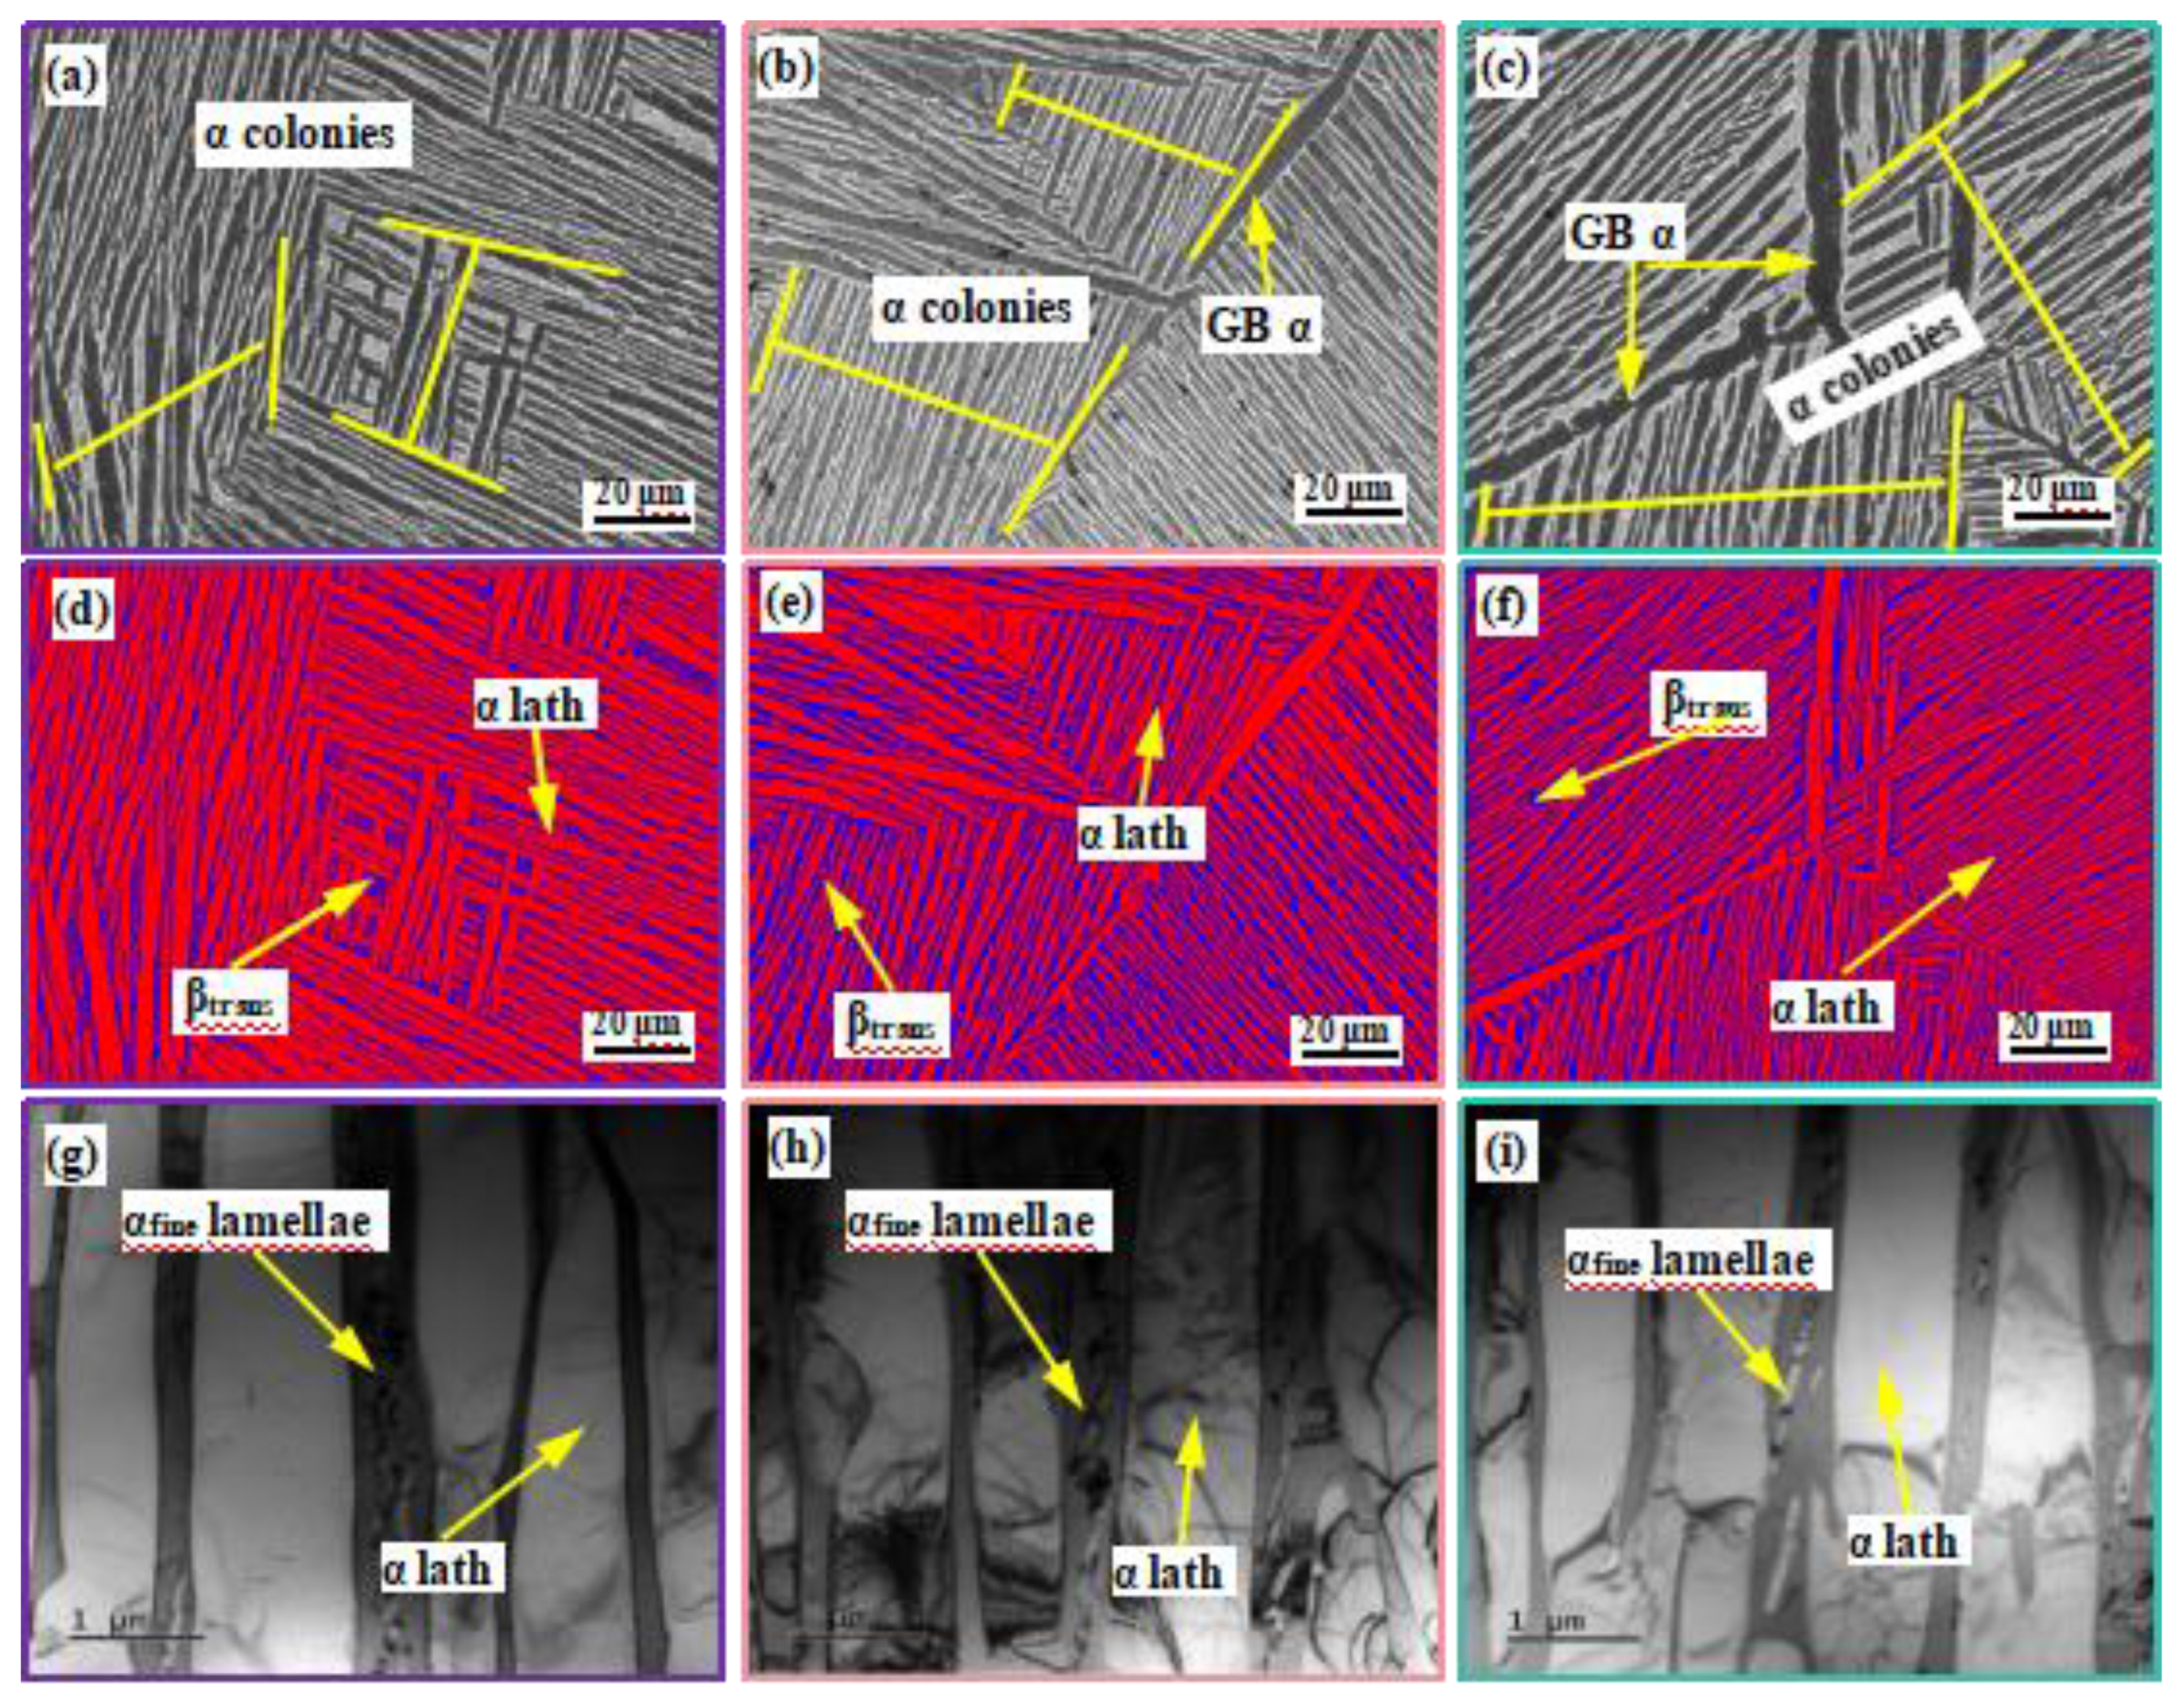
Figure 5.
Notch tensile properties under different aging temperatures of stress-strain curves.
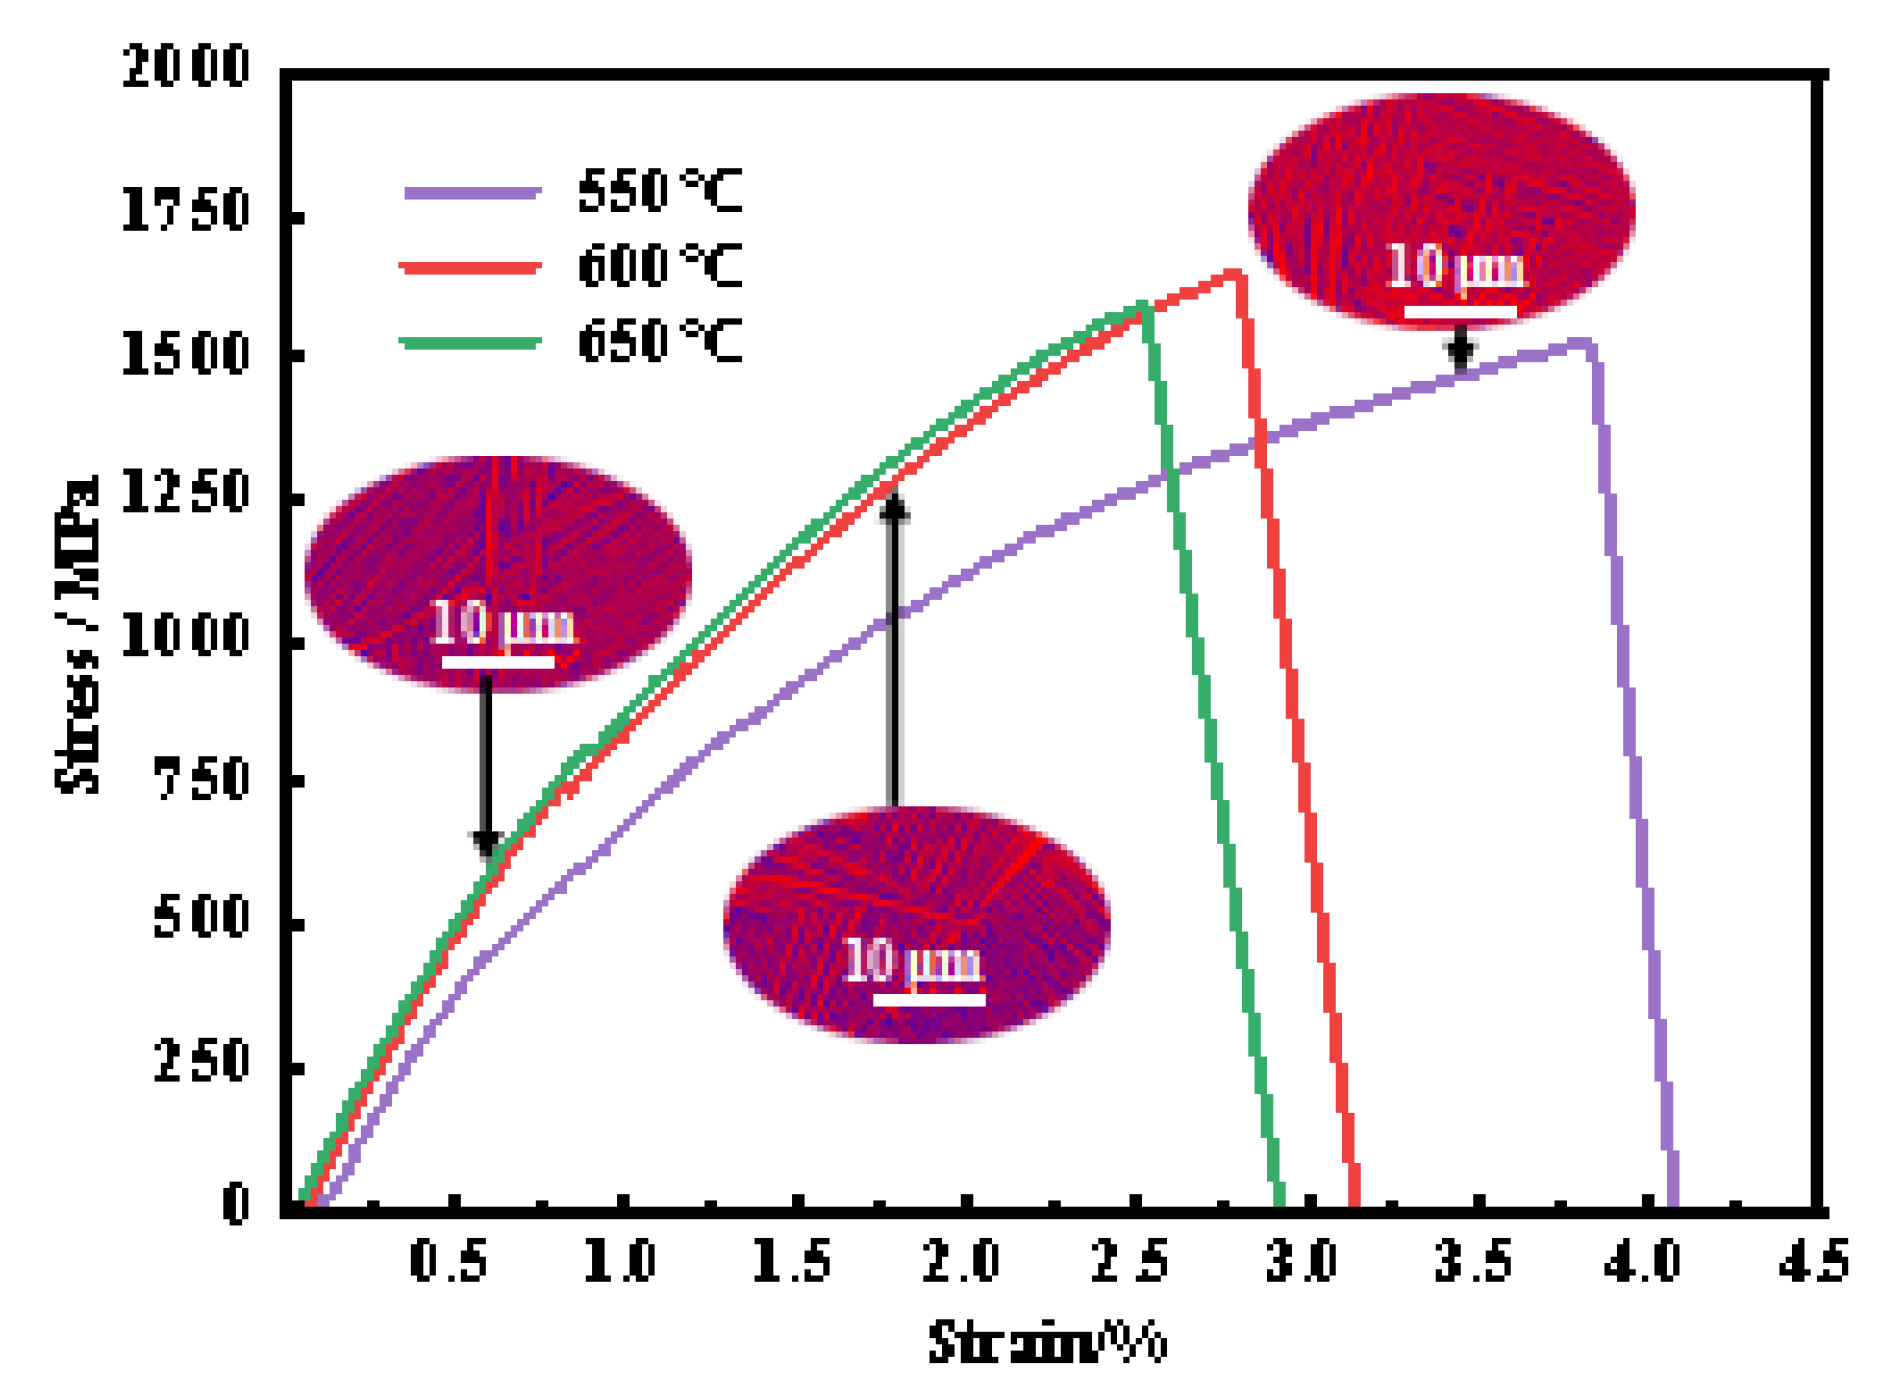
Figure 6.
Notch tensile fracture surfaces of TC21 alloys at aging temperatures of 550 ℃ (a-c), 600 ℃ (d-f) and 650 ℃ (g-i): (a, d, g) low magnification of fracture, (b, e, h) tearing ridges and secondary crack; (d) dimples.
Figure 6.
Notch tensile fracture surfaces of TC21 alloys at aging temperatures of 550 ℃ (a-c), 600 ℃ (d-f) and 650 ℃ (g-i): (a, d, g) low magnification of fracture, (b, e, h) tearing ridges and secondary crack; (d) dimples.
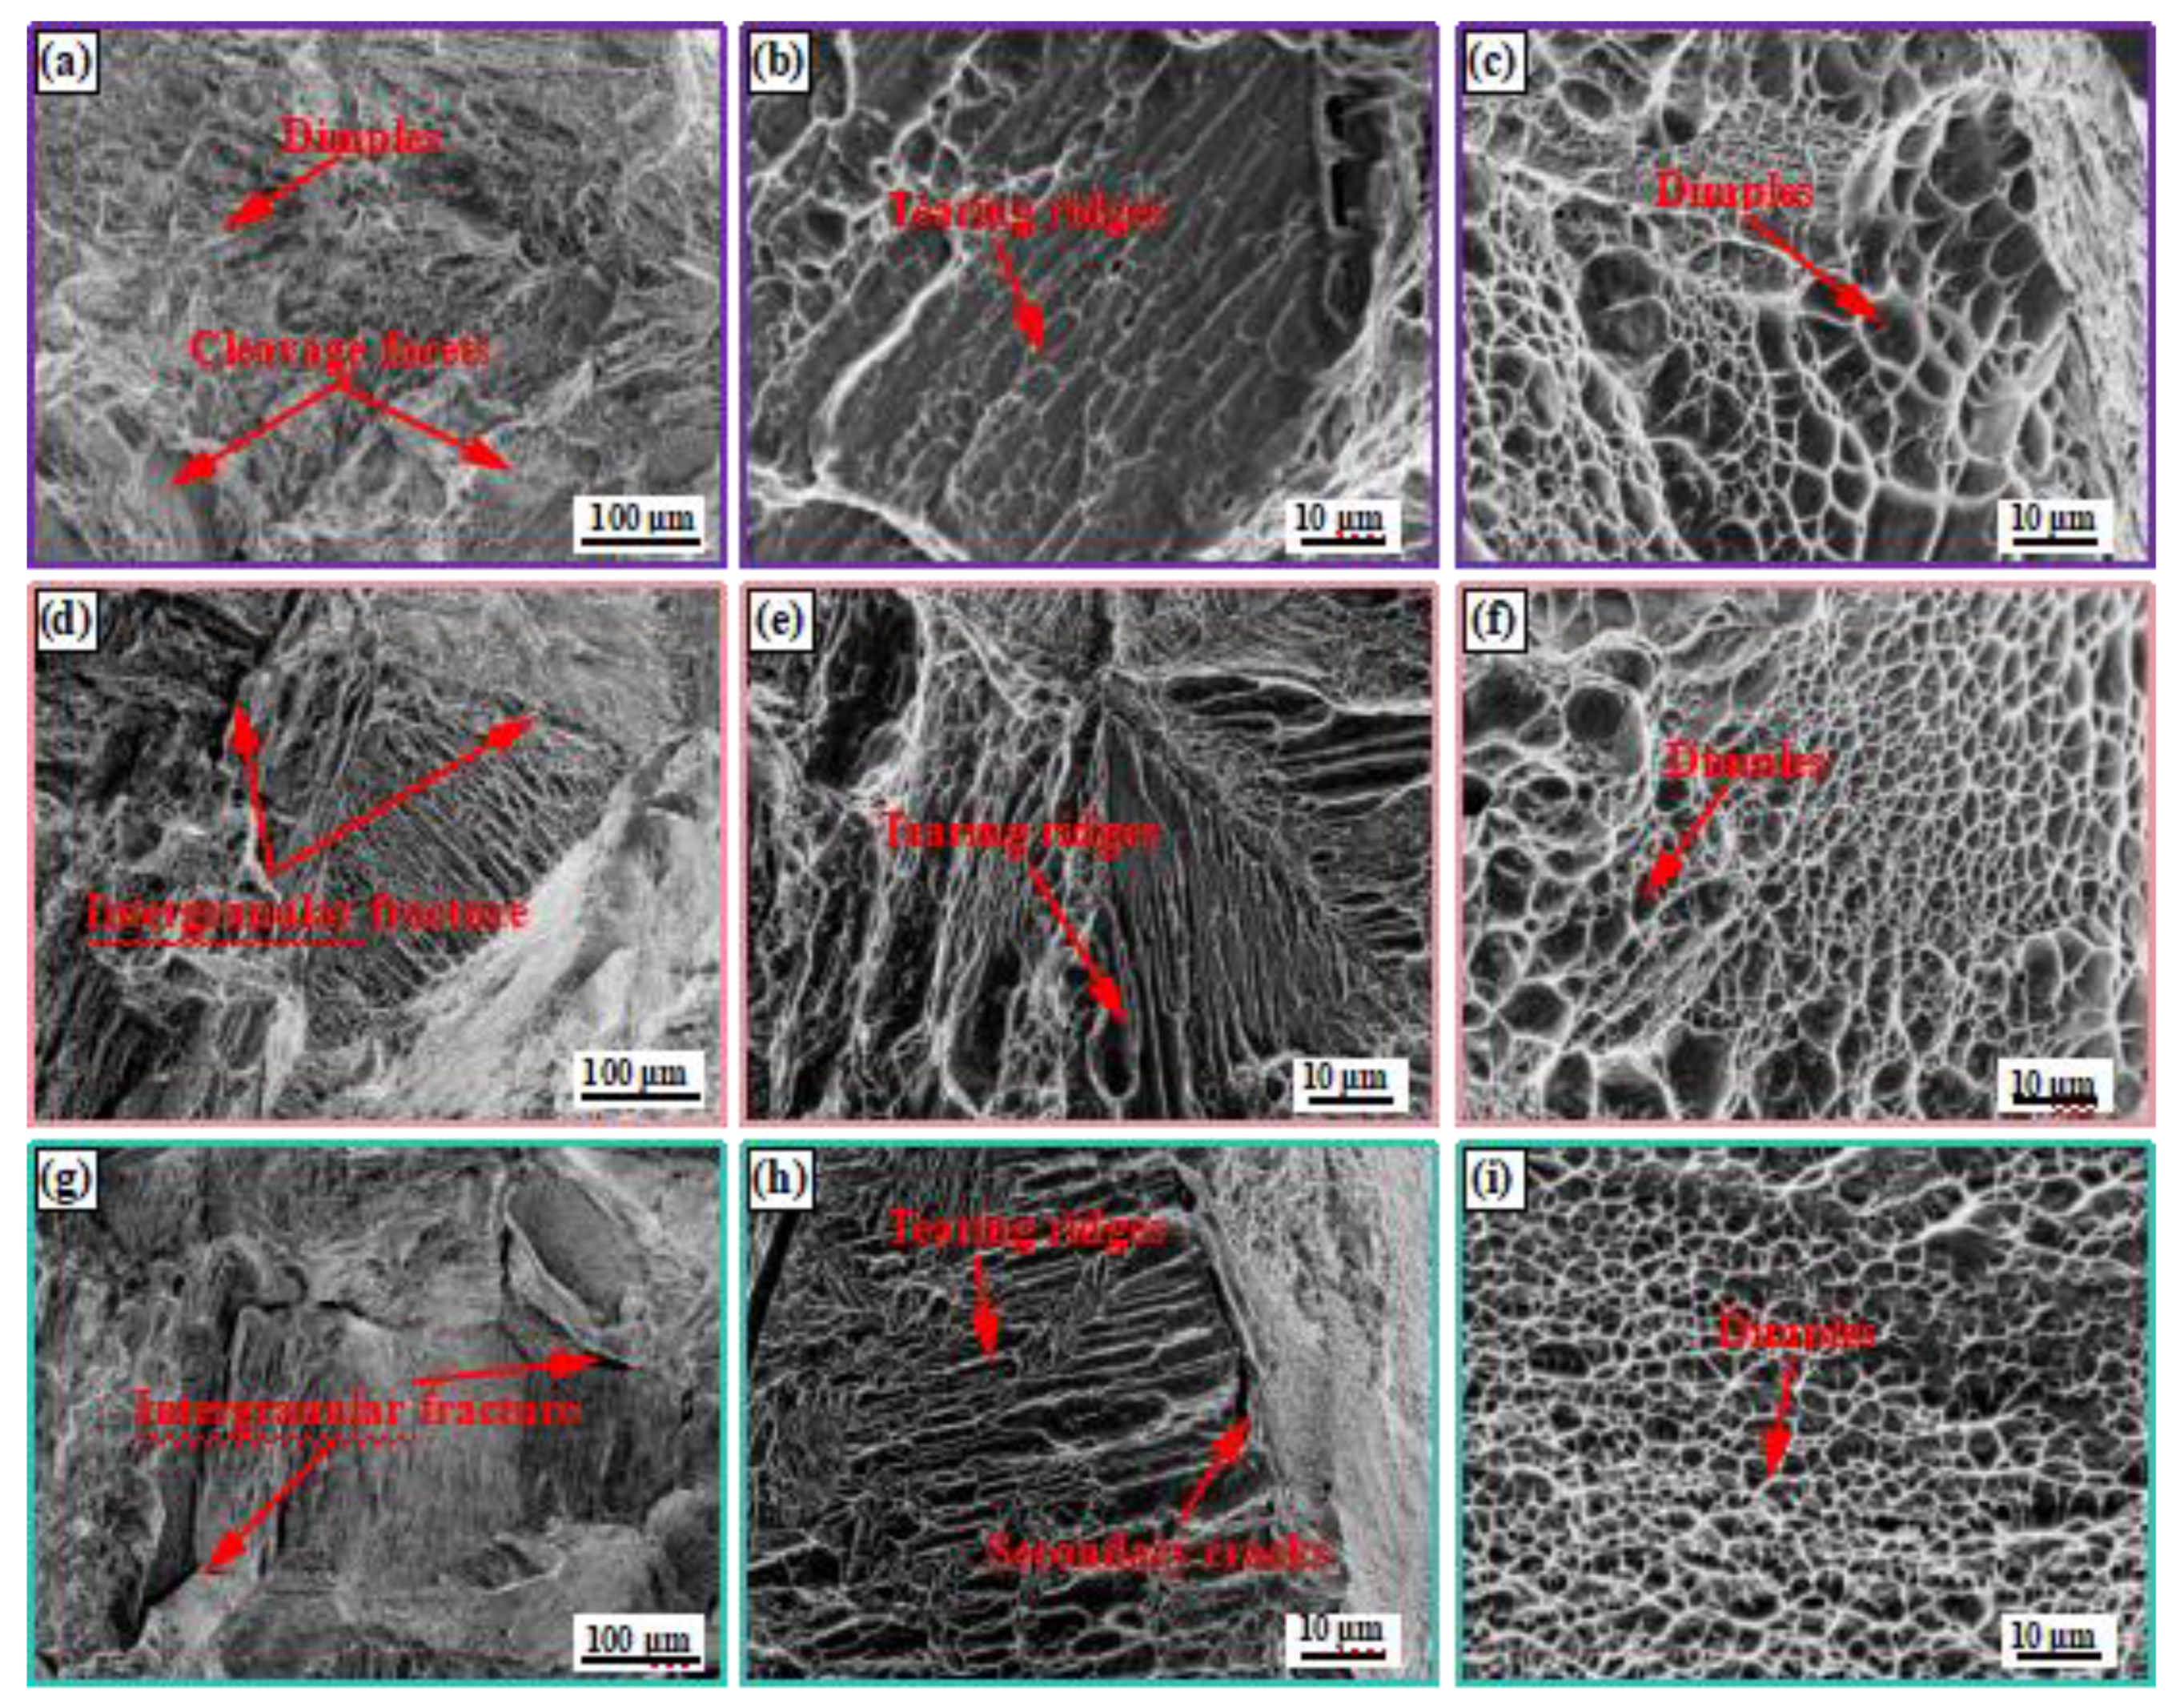
Figure 7.
The micro-voids and micro-cracks characteristics underneath the main crack initiation site of specimens A1 (a-c) and A2 (d-f): (a) micro-voids and micro-cracks initiated at the torsional deformed α colony; (b) micro-voids and micro-cracks pileups at αlath/βtrans interface and within the βtrans; (c) micro-voids nucleated at αfine plates; (d) micro-voids and micro-cracks initiated at the α colony at notch root; (e) micro-voids and micro-cracks nucleated at αlath/βtrans interface and along the interfaces; (f) micro-cracks nucleated at the αlath and within the torsional deformed αfine.
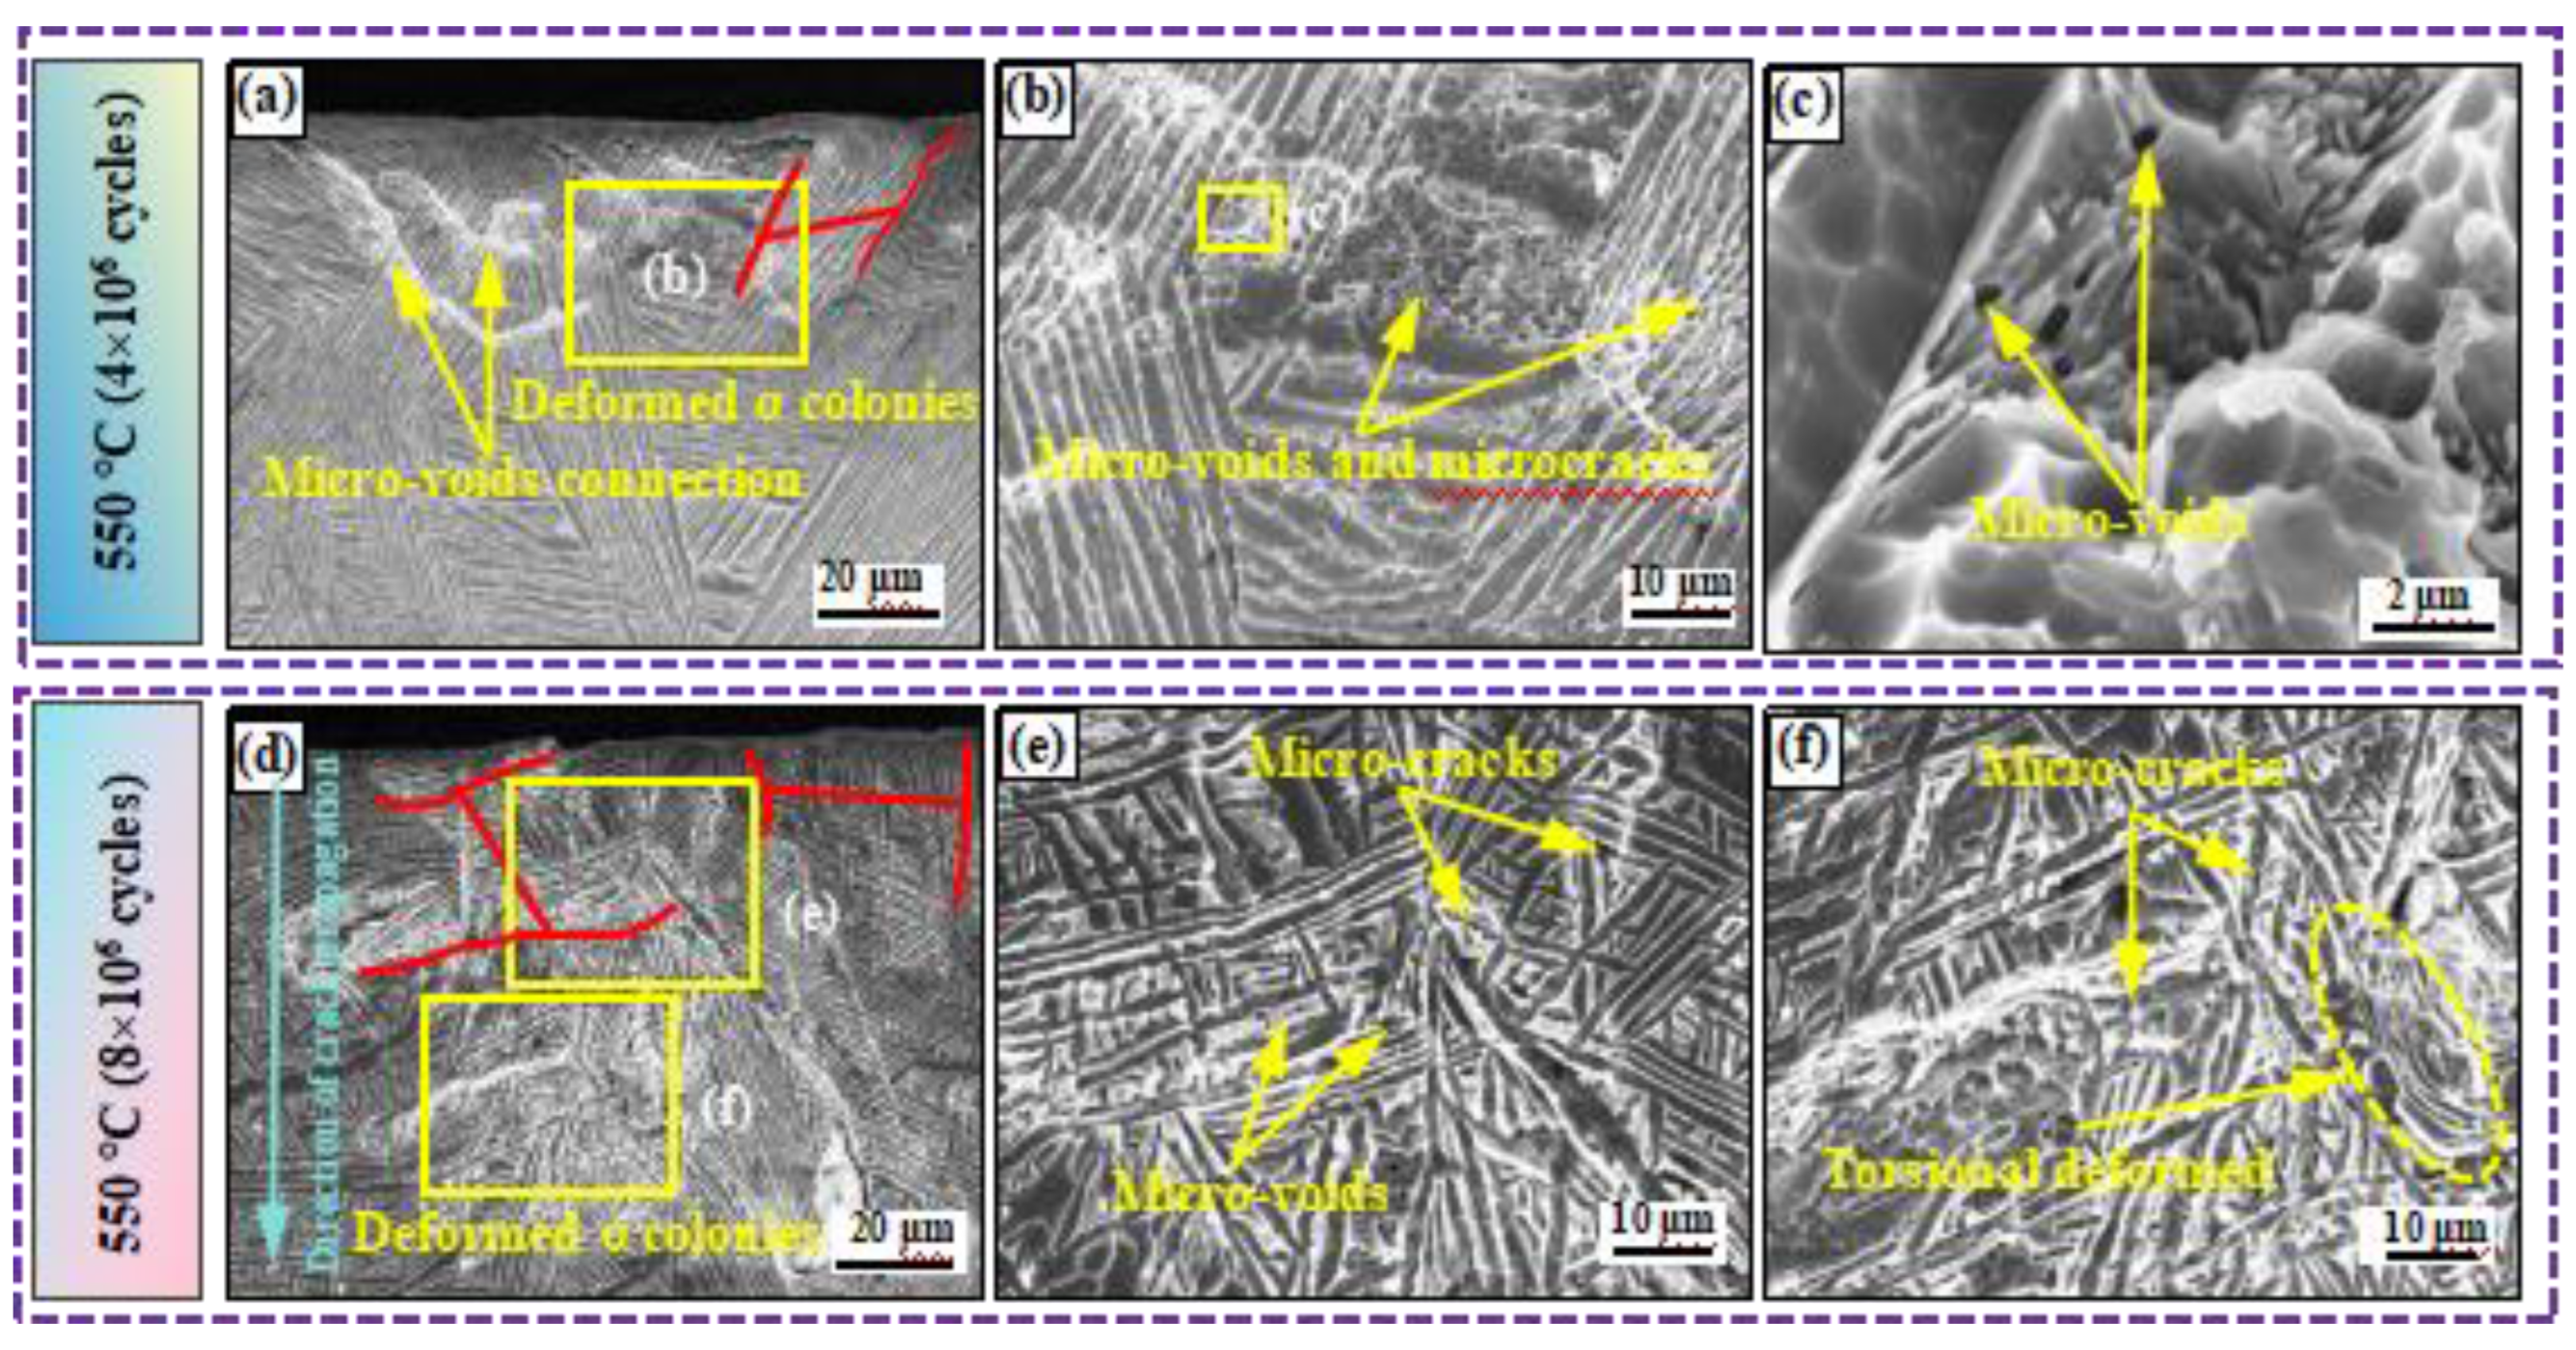
Figure 8.
The micro-voids and micro-cracks characteristics underneath the main crack initiation site of specimens B1 (a-c) and B2 (d-f): (a) micro-voids and micro-cracks initiated at the torsional deformed α colony; (b) micro-voids and secondary cracks formed at αlath/βtrans interface and GBα; (c) micro-cracks nucleated at the GBα; (d) micro-voids and micro-cracks initiated at the α colony at notch root; (e) micro-voids and micro-cracks nucleated at αlath/βtrans interface and αfine/βr interface; (f) micro-cracks nucleated at the αlath and within the torsional deformed βr.

Figure 9.
The micro-voids and micro-cracks characteristics underneath the main crack initiation site of specimens C1 (a-c) and C2 (d-f): (a) micro-voids and micro-cracks initiated at the torsional deformed α colonies; (b) torsional deformed α colony; (c) micro-voids nucleated at α laths; (d) micro-voids and micro-cracks initiated at the deformed α colony at notch root; (e) micro-voids and micro-cracks nucleated at αlath/βtrans interface and αfine/βr interface; (f) micro-cracks and slip lines nucleated within the αfine and βr.
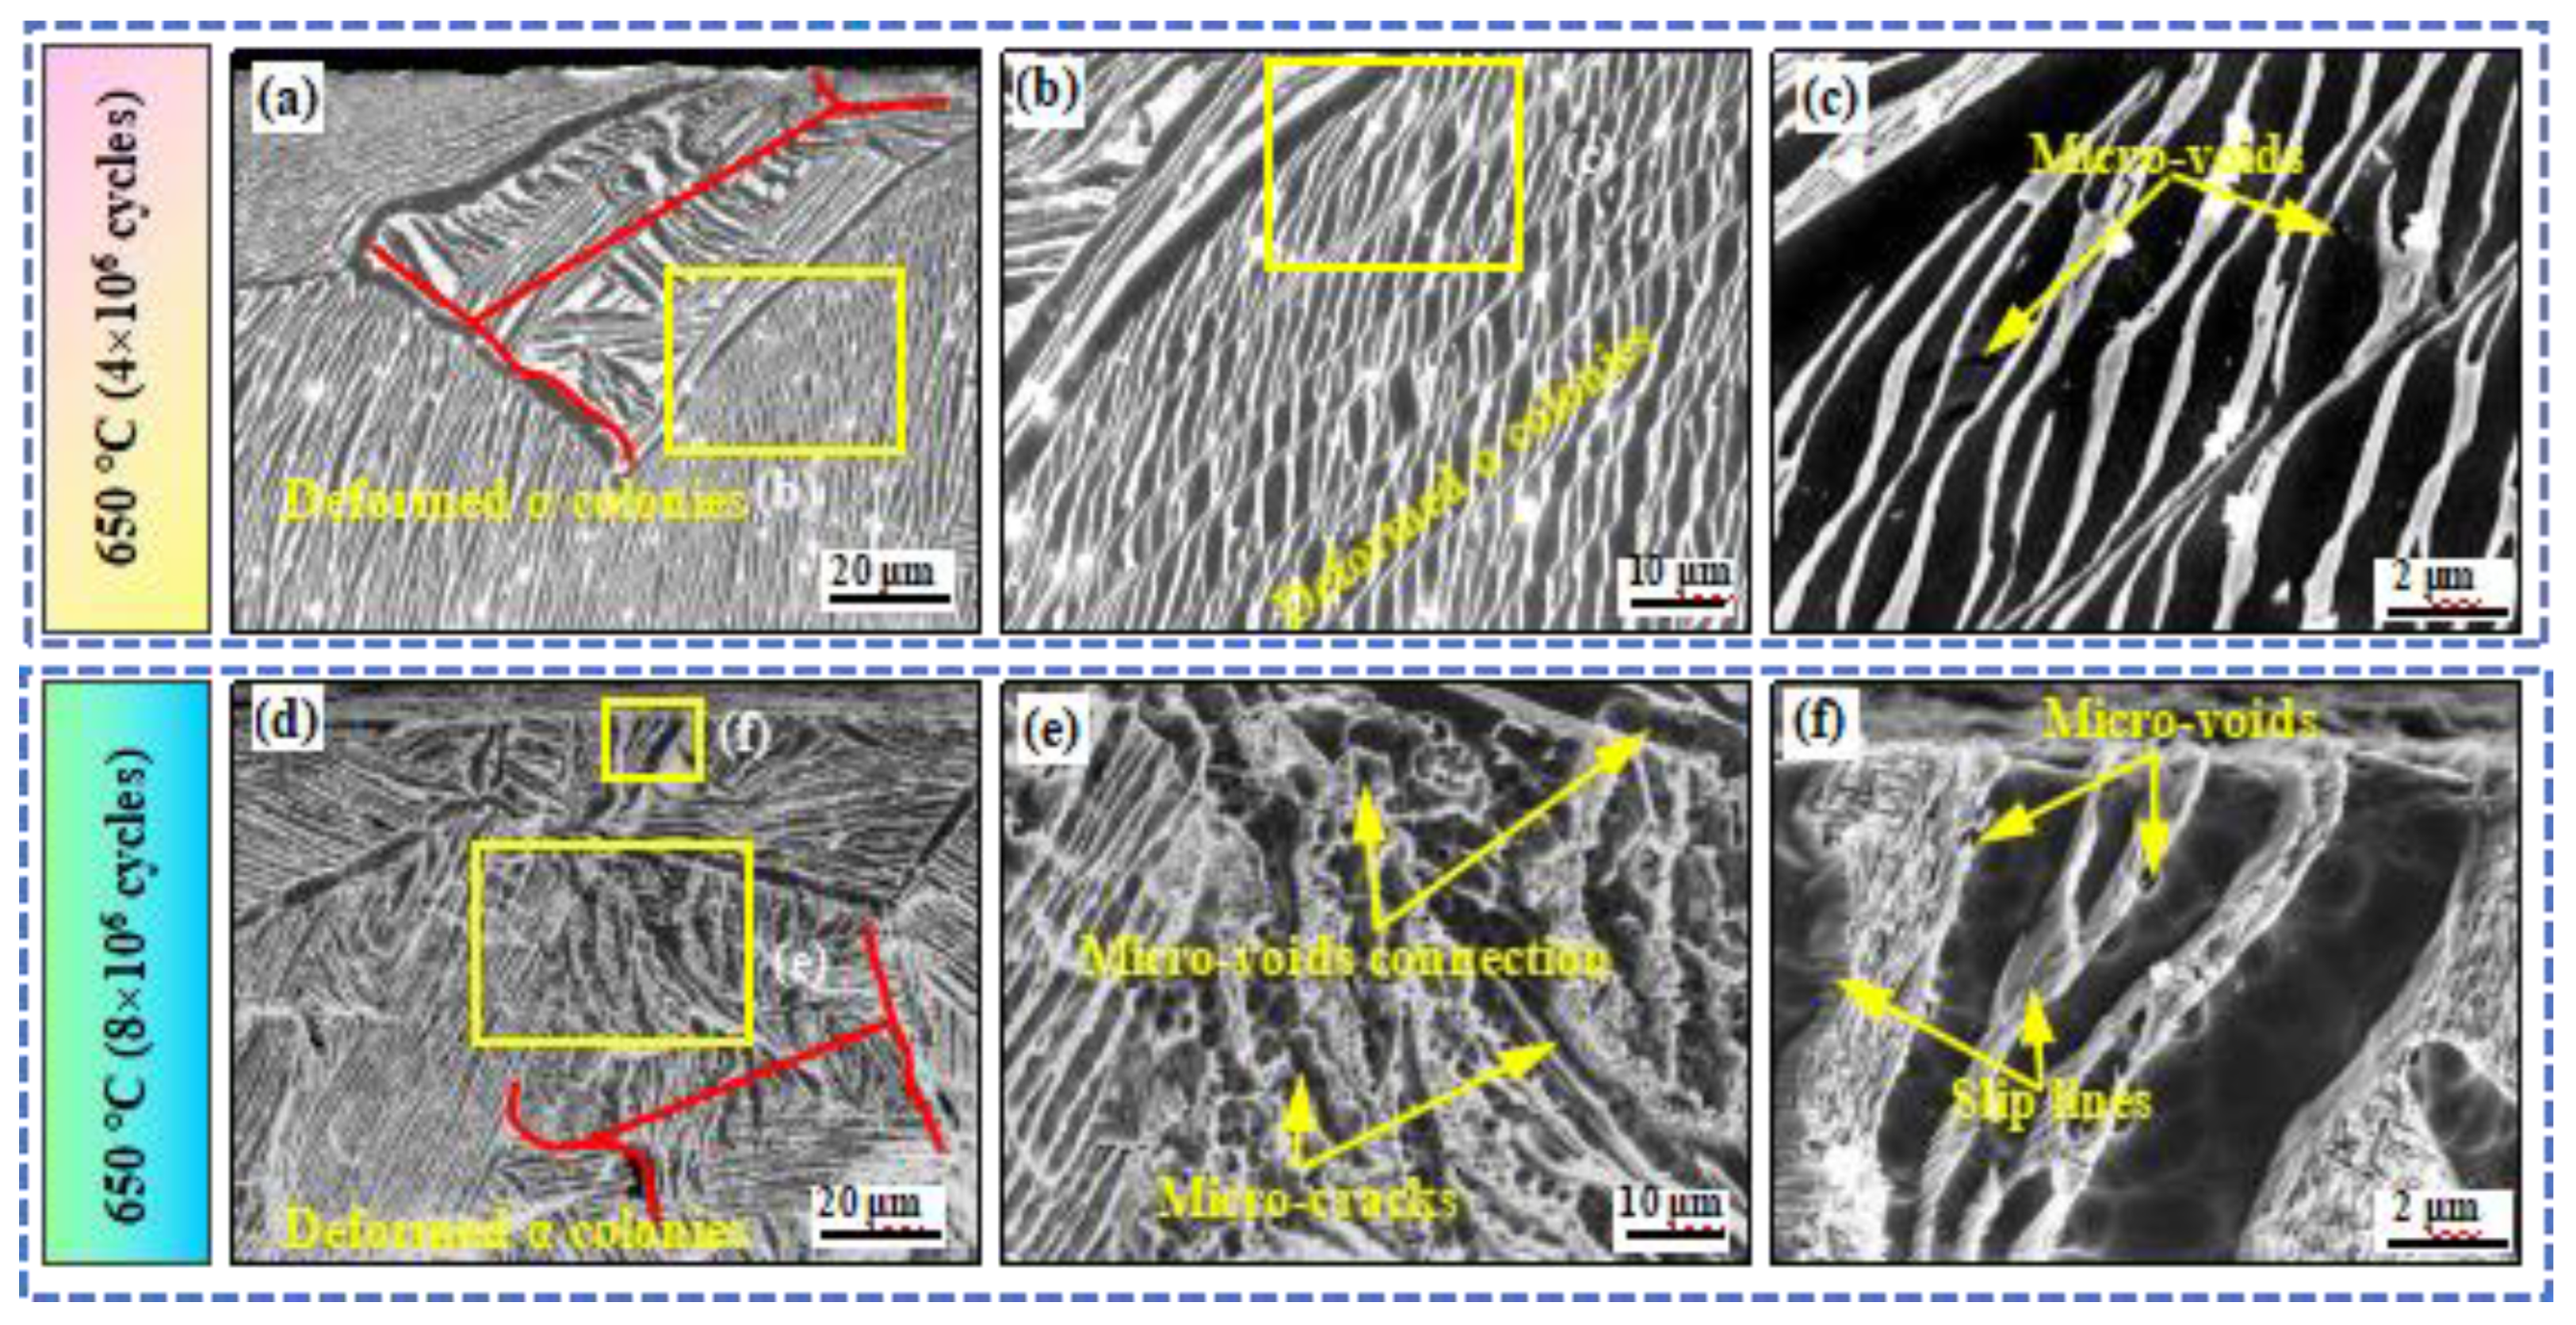
Figure 10.
The TEM images of fatigue crack initiation region of the interrupted specimen A1(σ =240 MPa, N=4×10⁶ cycles ) and A2 (σ =240 MPa, N=8×10⁶ cycles): (A1-a to A1-c ) high density dislocations formed in the αfine/βtrans interface; (A1-d to A1-h) the high resolution transmission electron diffraction (SAED), fast fourier transform (FFT) patterns and atoms spacing of (d); (A1-i to A1-k) geometric phase analysis (GPA) of (A1-d); (A2-a to A2-b) high density dislocations formed in the αfine/βtrans interface; (A2-c) ladder like structures formed in the αlath/βtrans interface; (A2-d to A2-f) twins formed and SAED in the αfine; (A2-g- to A2-i) the GPA of (A2-d).

Figure 11.
The TEM images of fatigue crack initiation region of the interrupted specimen B1(σ=280 MPa, N=4×10⁶ cycles ) and B2 (σ=280 MPa, N=8×10⁶ cycles): (B1-a to B1-c) slip lines and ladder-like structure formed in the αlath/βtrans interface; (B1-d) deformed αfine and dislocation tangles formed in the αfine/βtrans interface; (B1-e and B1-f) the SAED and FFT) patterns of (B1-d); (B1-g to B1-i) GPA of (B1-d); (B2-a to B2-b) persistent slip bands (PSBs) and dislocation net formed within the αlath; (B2-c) zigzag structure formed in the αfine; (B2-d to B2-f) the SAED and FFT in the PSBs; (B2-g- to B2-i) the GPA of (B2-d).
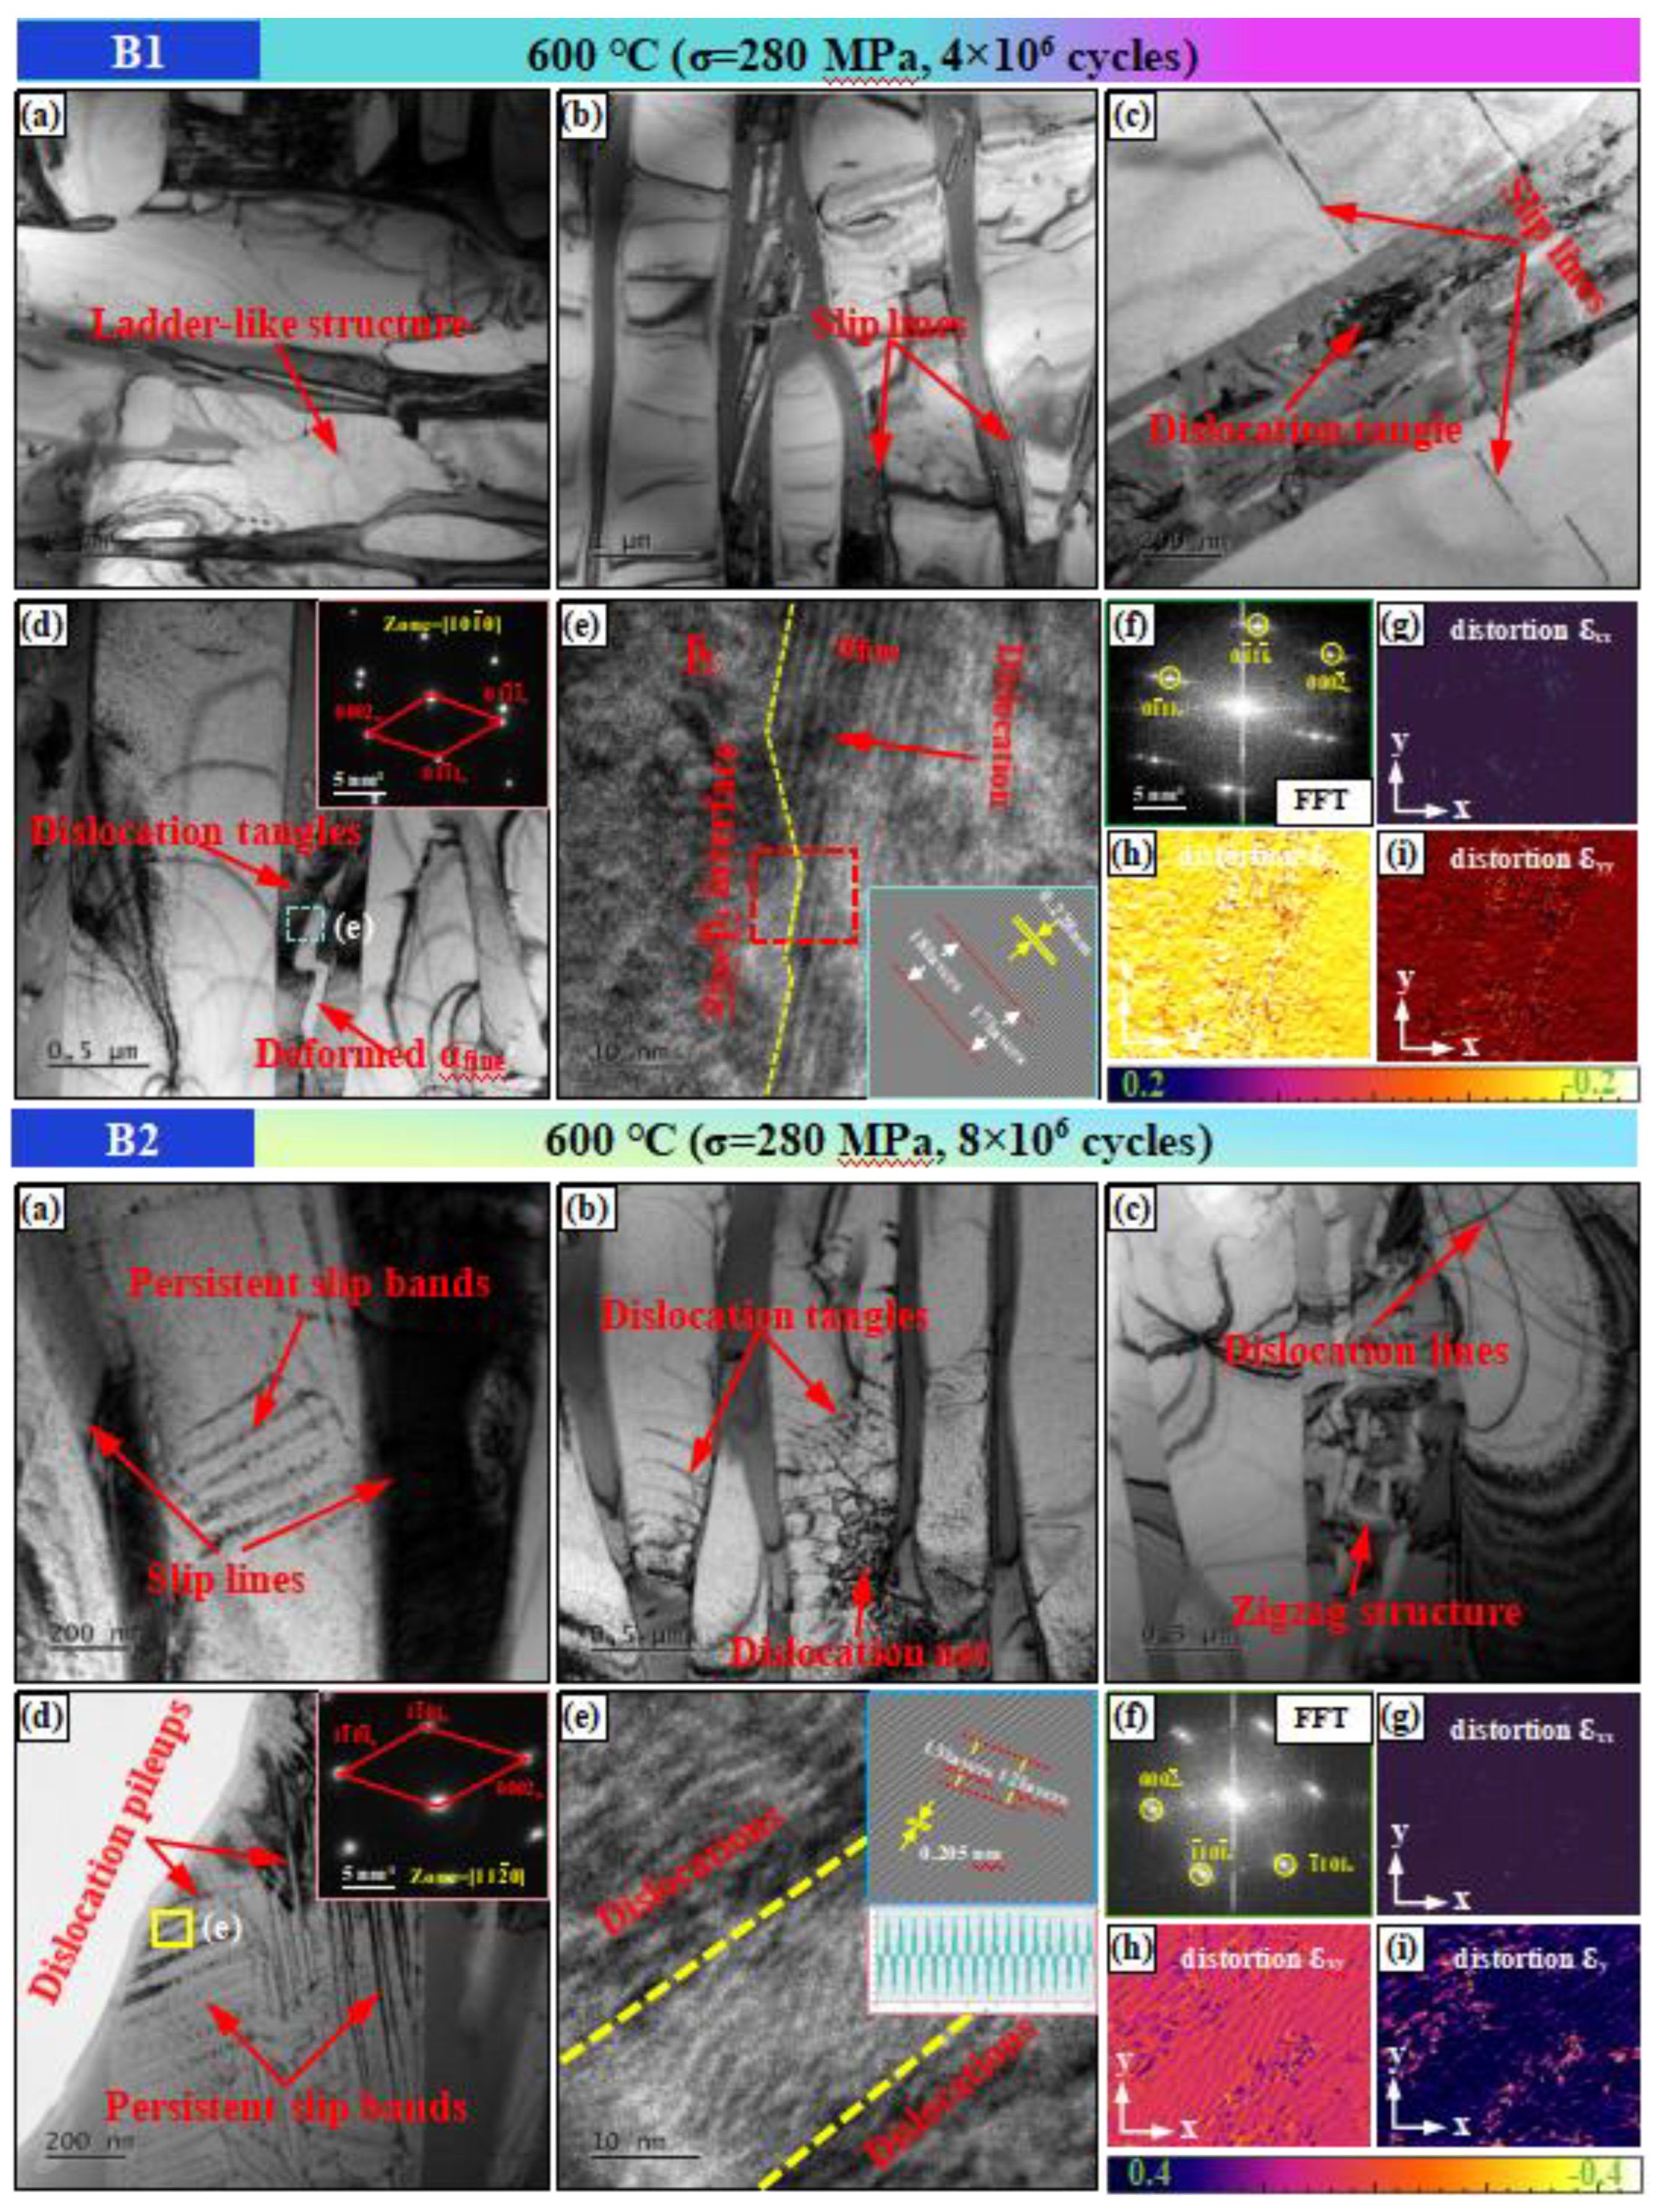
Figure 12.
The TEM images of fatigue crack initiation region of the interrupted specimen C1(σ =230 MPa, N=4×10⁶ cycles ) and C2 (σ =230 MPa, N=8×10⁶ cycles): (C1-a to C1-c ) dislocations tangles and pinning within the αlath; (C1-d) zigzag structure formed in the αfine; (C1-e) the stacking faults and SAED within the αfine; (C1-f) the FFT patterns of (C1-e); (C1-g to C1-i) GPA of (C1-e); (C2-a to C2-c) ladder-like structure and slip lines formed in the αfine/βtrans interface; (C2-D) dislocation walls formed within the αlath; (C2-e) dislocation lines formed within the αlath; (C2-f) deformed αfine and dislocation lines formed within the αlath.
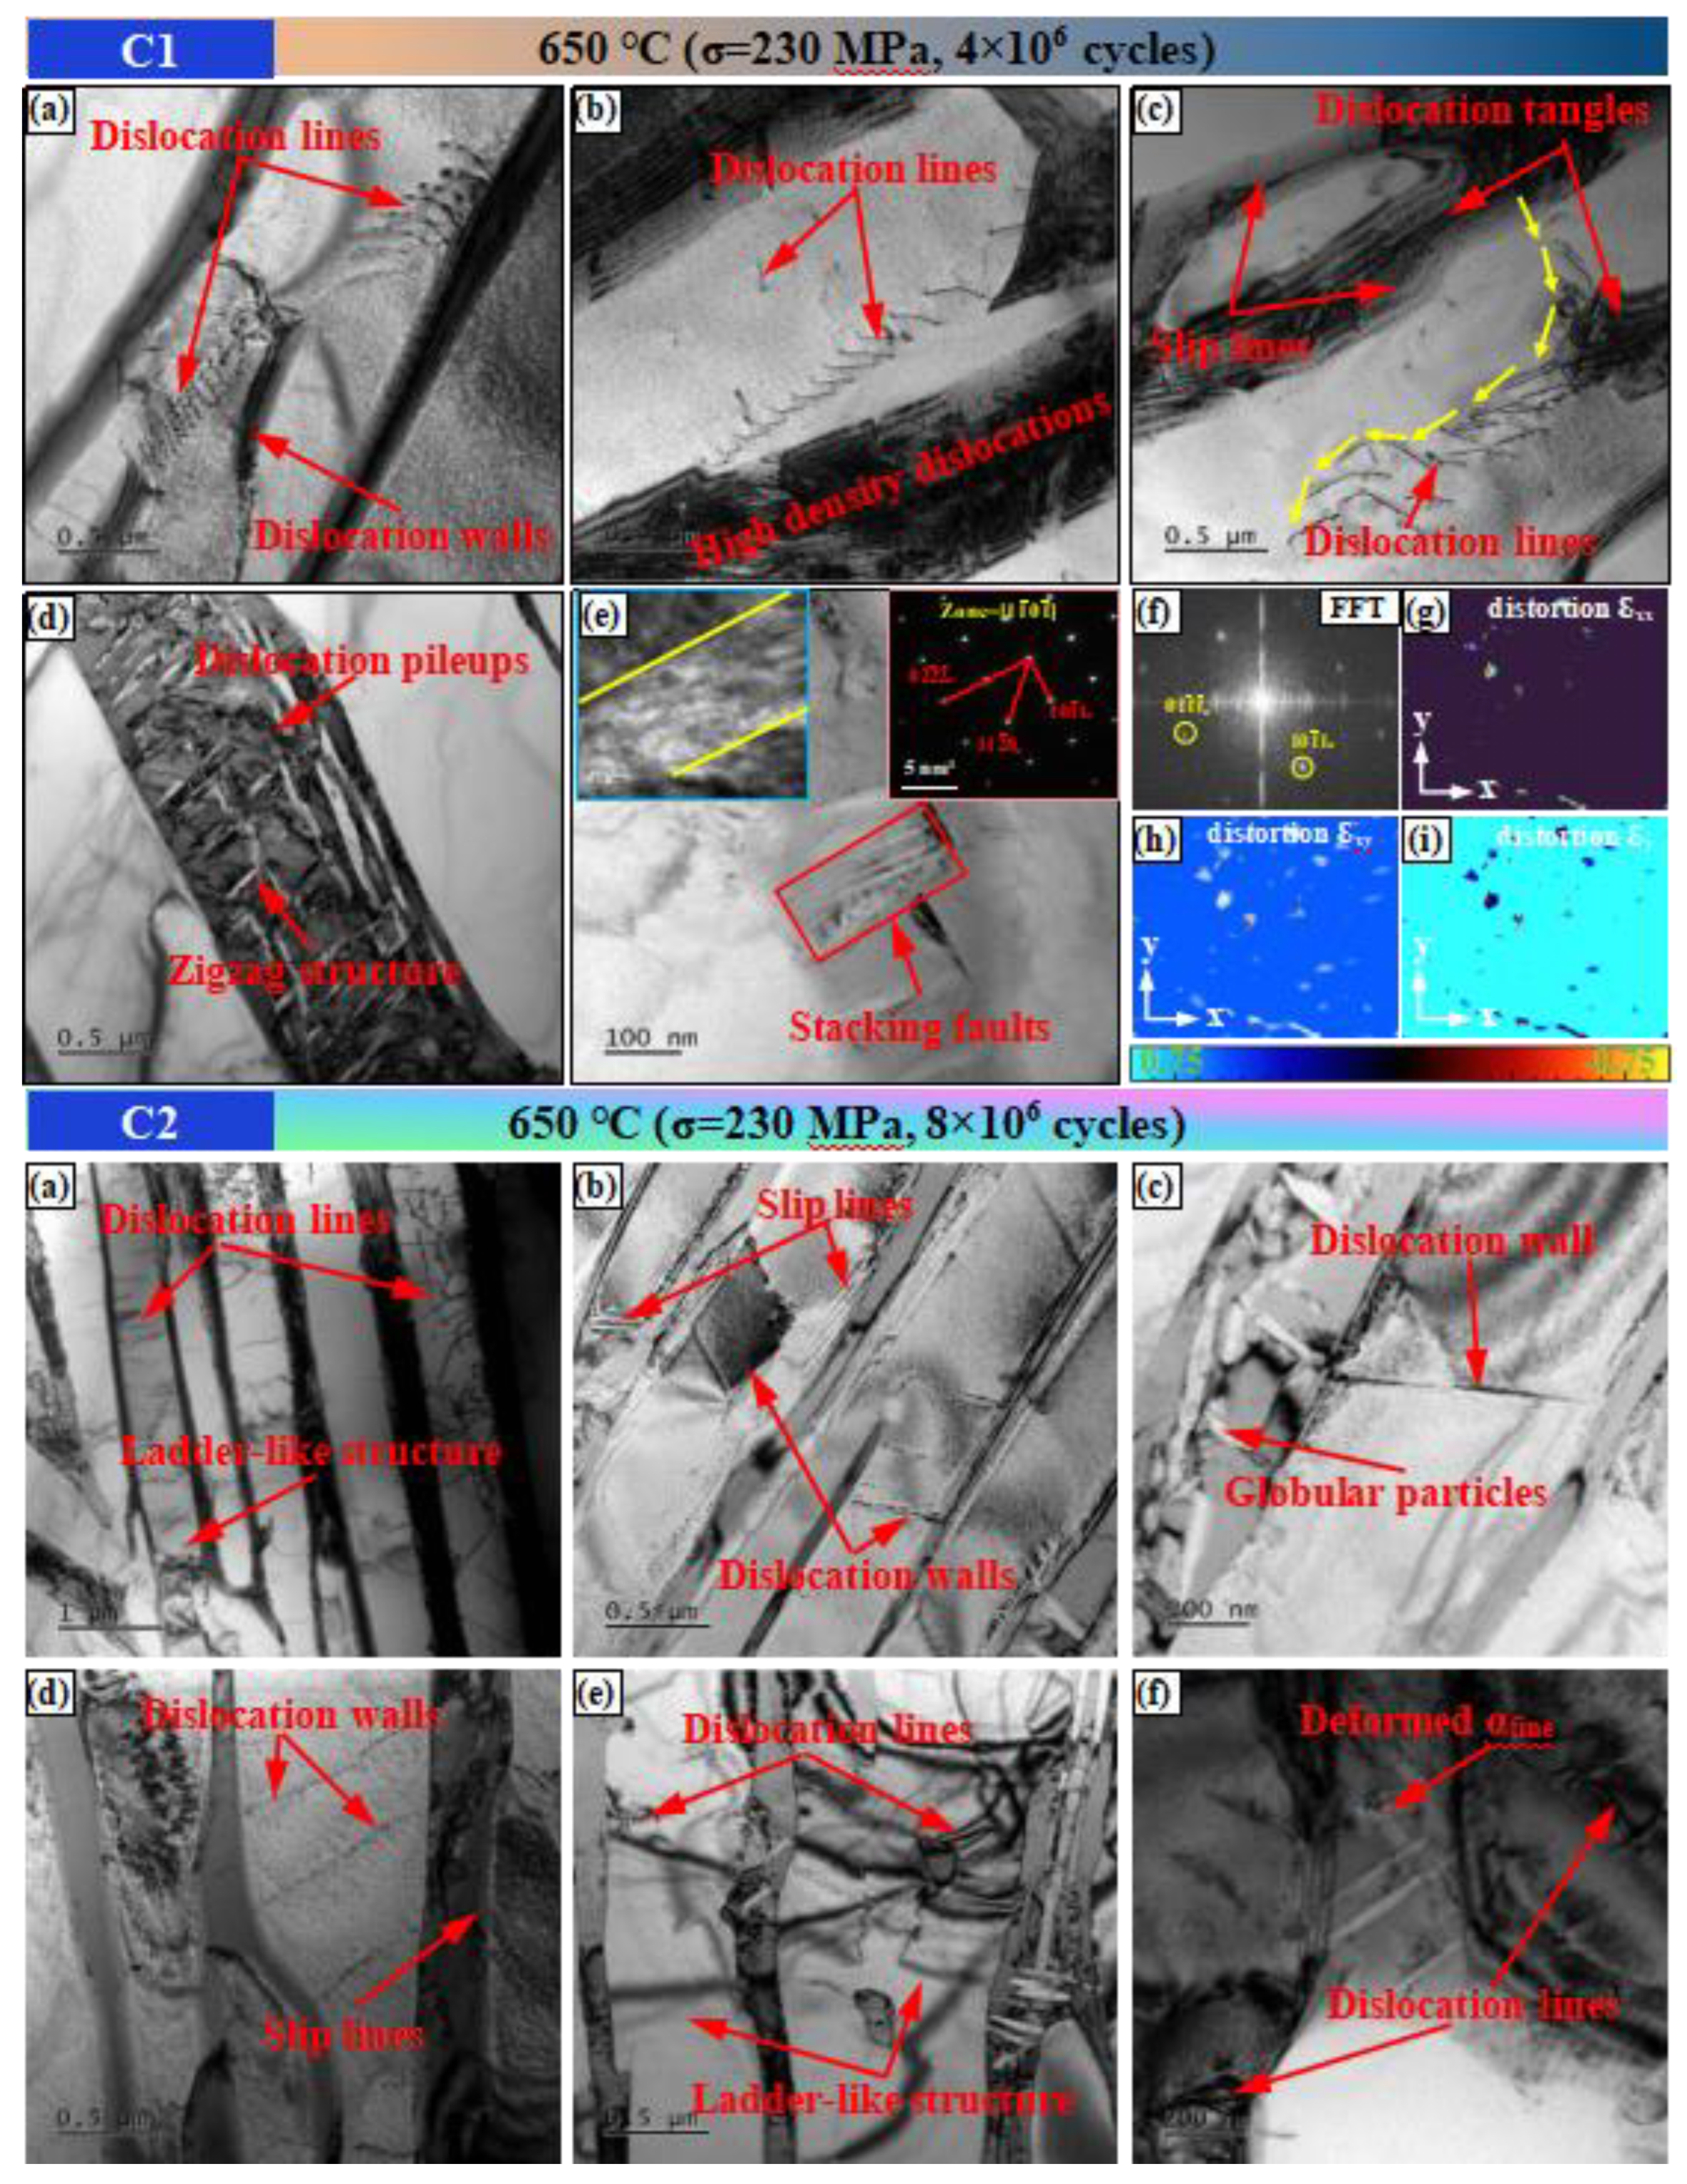
Figure 13.
AFM images showing slip steps at aging temperatures 550 ℃ (a-c) and 650 ℃ (d-f) within αlath: (a and d) 2D AFM images; (b and e) 3D AFM images showing the detail of slip steps formed inner αlath and at αlath/βtrans interface; (c and f) the height of slip steps in (a and d).
Figure 13.
AFM images showing slip steps at aging temperatures 550 ℃ (a-c) and 650 ℃ (d-f) within αlath: (a and d) 2D AFM images; (b and e) 3D AFM images showing the detail of slip steps formed inner αlath and at αlath/βtrans interface; (c and f) the height of slip steps in (a and d).
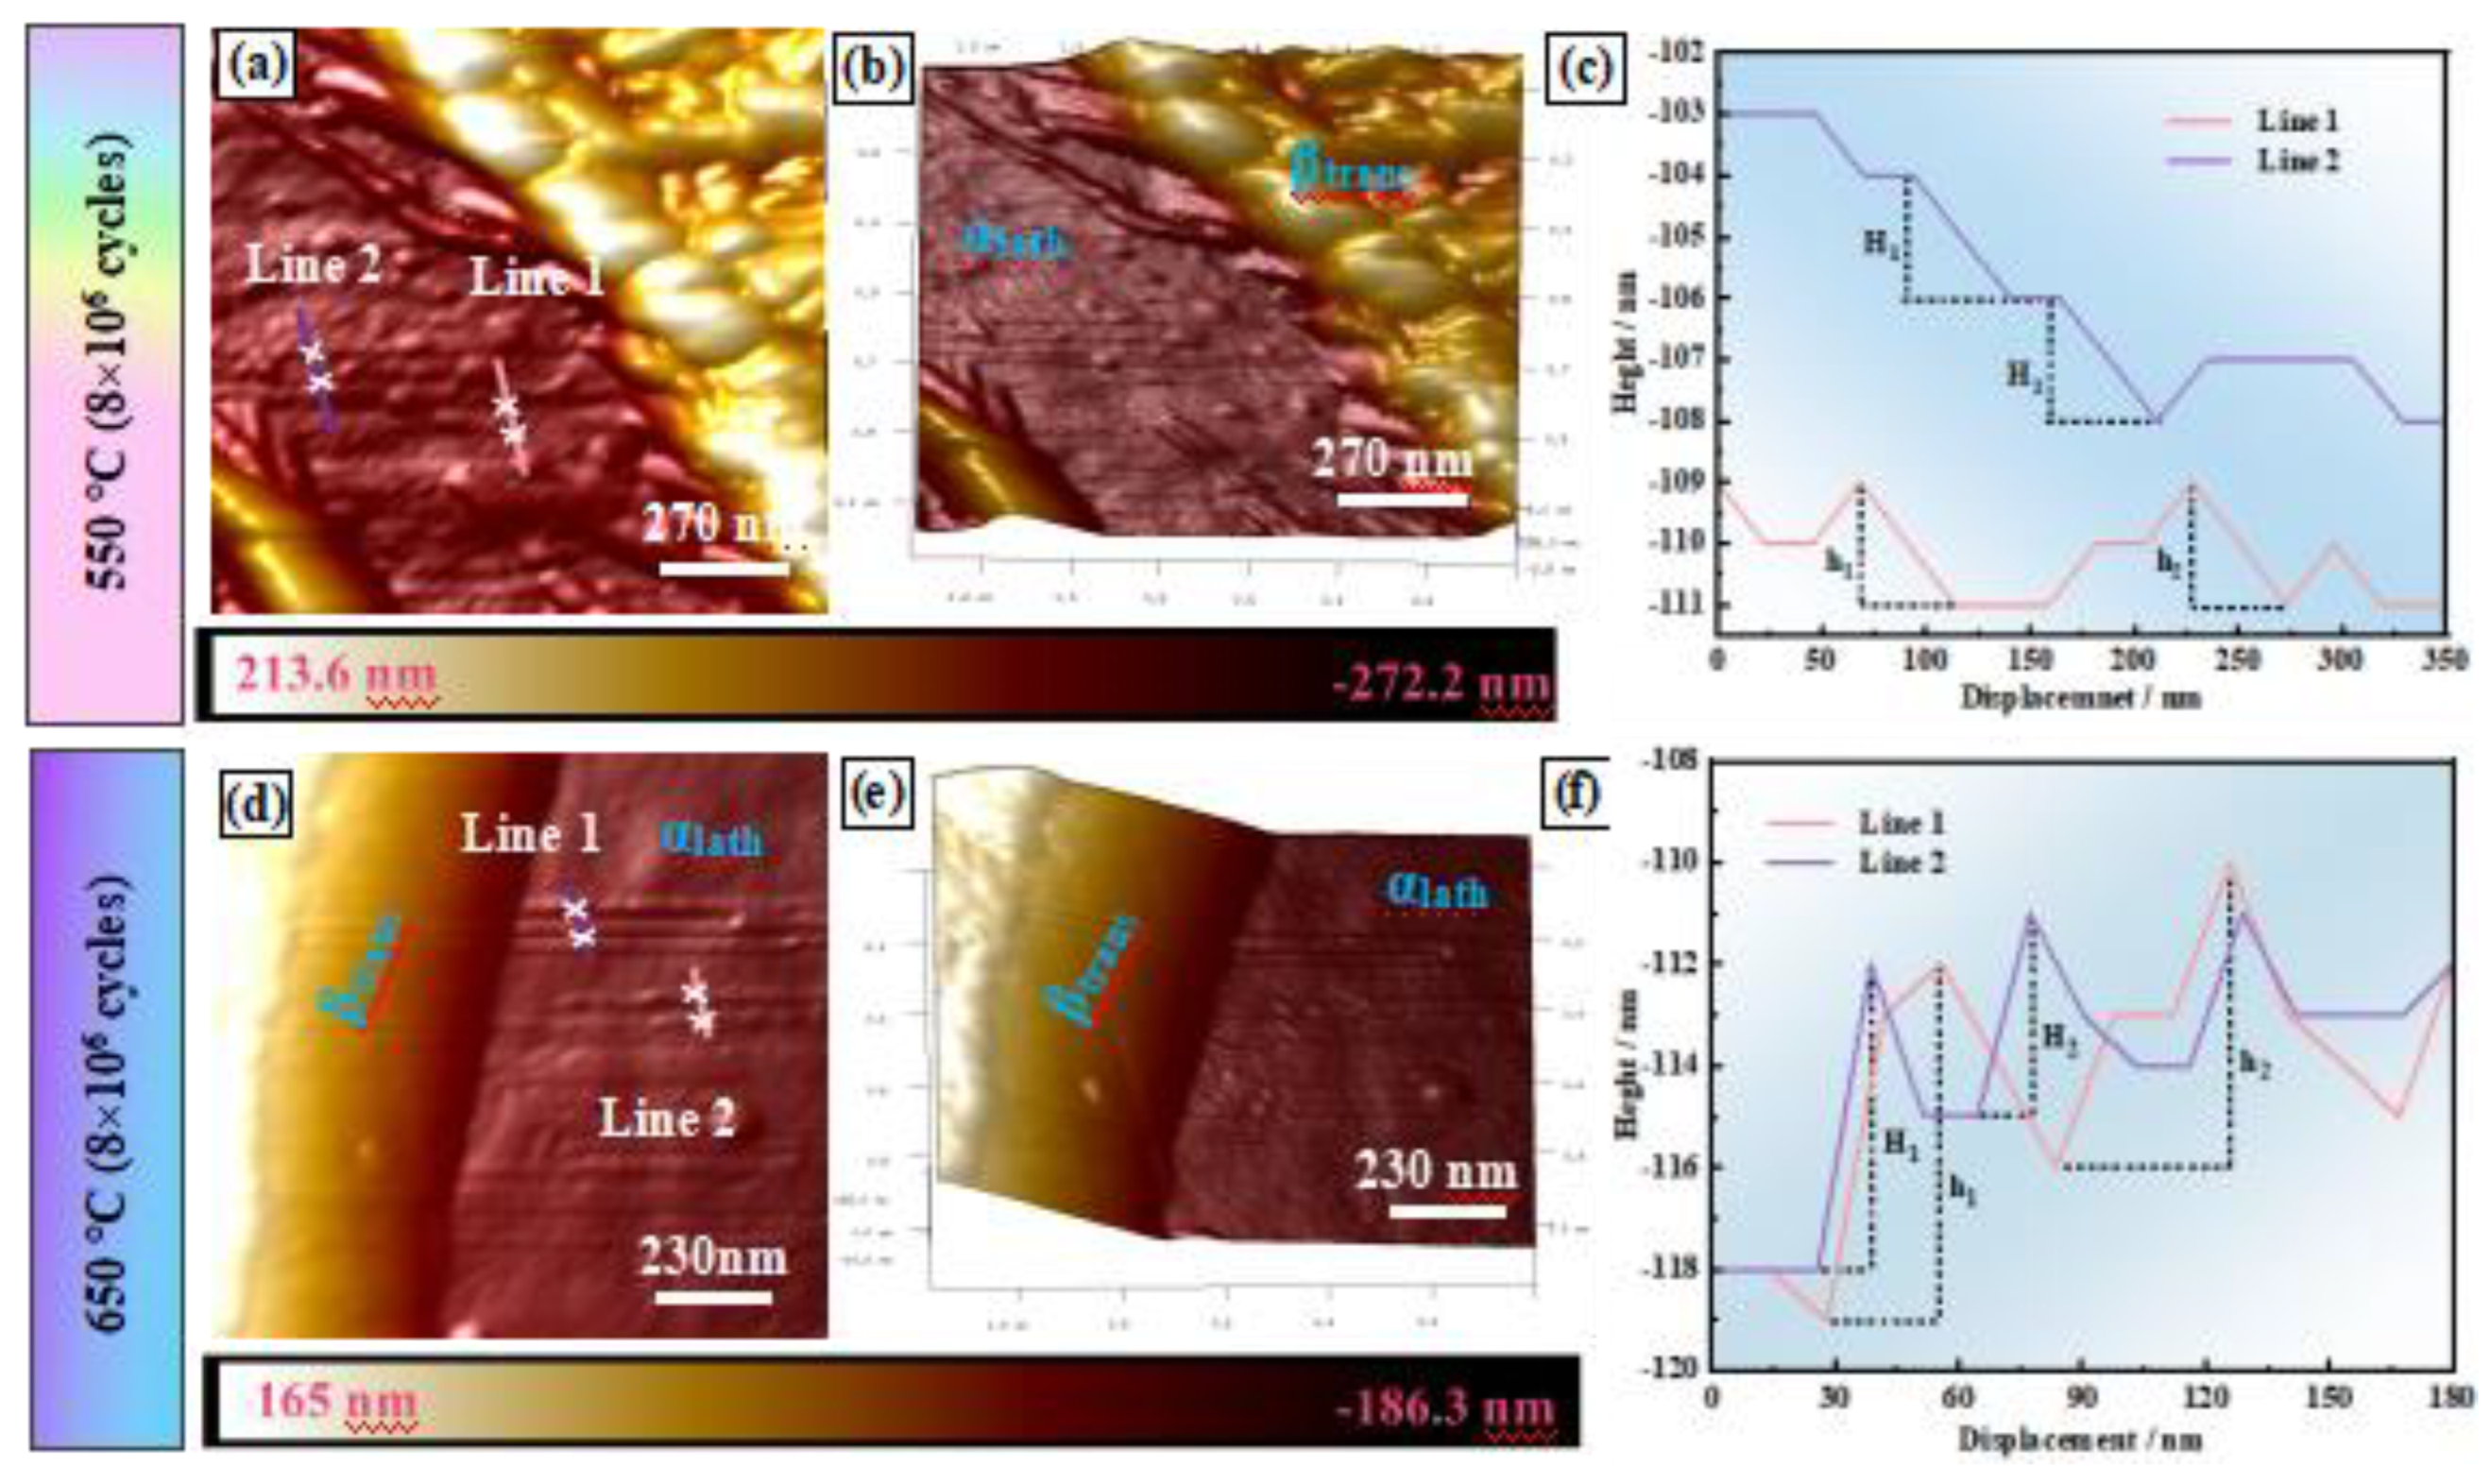

Table 1.
Chemical compositions of TC21 alloy (wt %).
| Elements | Al | Zr | Mo | Nb | V | Zn | Si | Ni | Ti |
|---|---|---|---|---|---|---|---|---|---|
| Content (%) | 5.91 | 2.44 | 3.27 | 2.22 | 0.12 | 0.12 | 0.11 | 0.1 | Bal. |
Table 2.
Correlation between notch tensile properties and fatigue properties of TC21 alloy with multilevel lamellar microstructures.
Table 2.
Correlation between notch tensile properties and fatigue properties of TC21 alloy with multilevel lamellar microstructures.
| Aging temperatures | UTS/MPa | YS/MPa | EL/% | σ-1(107)/MPa | σ-1(107)/UTS | σ-1(107)/YS |
|---|---|---|---|---|---|---|
| 550 ℃ | 1580±5 | 1067±2 | 2.32±0.4 | 240 | 0.152 | 0.225 |
| 600 ℃ | 1650±3 | 1099±5 | 1.52±0.5 | 280 | 0.170 | 0.255 |
| 650 ℃ | 1577±2 | 1095±3 | 1.80±0.3 | 230 | 0.146 | 0.210 |
Disclaimer/Publisher’s Note: The statements, opinions and data contained in all publications are solely those of the individual author(s) and contributor(s) and not of MDPI and/or the editor(s). MDPI and/or the editor(s) disclaim responsibility for any injury to people or property resulting from any ideas, methods, instructions or products referred to in the content. |
© 2024 by the authors. Licensee MDPI, Basel, Switzerland. This article is an open access article distributed under the terms and conditions of the Creative Commons Attribution (CC BY) license (http://creativecommons.org/licenses/by/4.0/).
Copyright: This open access article is published under a Creative Commons CC BY 4.0 license, which permit the free download, distribution, and reuse, provided that the author and preprint are cited in any reuse.


