
Submitted:
06 November 2024
Posted:
07 November 2024
You are already at the latest version
Abstract
Chronic inflammation and oxidative stress play significant roles in the development of various diseases like diabetes, cancer, and cardiovascular diseases. This study aimed to explore the po-tential therapeutic benefits of Annona crassiflora (Araticum-do-Cerrado) leaves, specifically fo-cusing on their anti-inflammatory, antioxidant, and anti-glycation properties. To achieve this, a hydroethanolic extract of the plant’s leaves (EHAC) was prepared and subjected to phytochemical analysis and in vitro tests to evaluate its effects. The tests included assessing its impact on fibro-blast cytotoxicity, anti-inflammatory capabilities (phagocytosis and macrophage spreading), an-tioxidant activity (DPPH and lipid peroxidation), and anti-glycation activity. The results indicated that EHAC contains high levels of phenolic compounds, including rutin and quercetin. The ex-tract demonstrated strong anti-inflammatory activity by significantly inhibiting phagocytosis and macrophage spreading. Furthermore, it exhibited high antioxidant capacity by inhibiting lipid peroxidation and scavenging free radicals. Additionally, it showed notable anti-glycation activity by completely inhibiting the formation of AGEs at the tested concentrations. The cell viability remained above 95% at concentrations up to 800 µg/mL. In conclusion, EHAC has significant therapeutic potential, and further research is warranted for its development as a phytotherapeu-tic, with the aim of preserving the biodiversity of the Brazilian Cerrado.
Keywords:
Araticum-do-Cerrado
; secondary metabolites
; inflammation
1. Introduction
The production of free radicals is a physiological process that continuously occurs in human body cells and contributes to important biological functions [1]. Different processes and metabolic pathways regulate their production, and they act as mediators in both extra- and intracellular signaling. However, excessive production of free radicals can cause oxidative damage. Oxidative stress is characterized by the intracellular accumulation of reactive oxygen and nitrogen compounds, which are referred to as reactive oxygen species (ROS) and reactive nitrogen species (RNS). These species normally occur in cells due to an imbalance in the redox system caused by the excessive accumulation of reactive species, mainly ROS, and the depletion of antioxidants (AOX), or both [2].
Redox imbalance plays a role in the development and progression of various diseases, including cardiovascular complications (such as atherosclerosis and hypertension), cystic fibrosis, cancer, type 2 diabetes, nephropathies, schizophrenia, Parkinson's disease, and Alzheimer's disease [3]. These conditions are characterized by chronic inflammation and oxidative stress, which are essential factors in their development. When cells are exposed to ROS and their redox status is altered, it triggers the transcription of inflammatory genes and transcription factors regulated by redox-sensitive mechanisms [4].
Recently, it has been discovered that oxidative stress also contributes to the creation of advanced glycation end products (AGEs) [5]. It is known that the formation of AGEs happens more quickly in a hyperglycemic environment. Hence, oxidative stress, ROS, and AGEs are strongly linked to diabetes mellitus and its complications. As a result, research into natural products' antioxidant and anti-glycation properties is becoming increasingly promising, as they are believed to have fewer adverse effects [6].
In the search for treatments to prevent or treat the damage caused by oxidative stress and inflammation in chronic diseases, secondary metabolites - bioactive compounds produced by plants and marine organisms - have shown great promise. These compounds exhibit various biological activities and have a wide range of applications. Secondary metabolites have been used as biopesticides, herbicides, cosmetics, and food additives and have significantly contributed to improving human health [7]. They have also been utilized in developing pharmaceutical products, with around 50% of all drugs currently in clinical trials being plant-derived [8].
Recent studies have shown that these metabolites can act through multiple mechanisms. These mechanisms include the inhibition of ROS, modulation of inflammatory pathways such as NF-κB, and suppression of the formation of AGEs. These processes play a central role in the progression of diseases like diabetes and atherosclerosis. Therefore, these compounds offer new possibilities for therapies for challenging chronic diseases [9,10,11].
The Araticum-do-Cerrado (Annona crassiflora), also known as marolo and cabeça-de-negro, is a plant from the Brazilian Cerrado. It is notable for its antioxidant and anti-inflammatory activities. Various parts of the plant, such as the pulp, bark, fruit, leaves, seeds, stem, and root, contain different bioactive compounds, including phenolics, alkaloids, annonaceous acetogenins, carotenoids, tocols, and phytosterols [12]. In traditional medicine, Annona crassiflora is used topically to treat scalp parasites and an oral infusion made from its leaves is used to treat inflammatory and painful conditions resulting from wounds, snake bites, diarrhea, malaria, and rheumatism [13]. Furthermore, in vivo and in vitro toxicological studies with the ethanolic extract of this species' leaves confirmed the absence of mutation or genotoxicity [14,15].
The phytochemical compounds found in extracts and fractions of araticum fruits have been found to play a role in various biological activities, including antioxidant, anti-inflammatory, anti-Alzheimer, anticancer, antidiabetic, anti-obesity, antidyslipidemic, antinociceptive, hepatoprotective, wound healing, as well as antibacterial and insecticidal actions [16]. Therefore, due to the presence of various bioactive compounds in this species and their associations with biological properties, it is important to consider the therapeutic potential of Annona crassiflora leaves [12]. Further studies should be conducted to confirm these potential biological effects in humans and to ensure consumer safety and well-being.
The Brazilian Cerrado has a rich biodiversity with significant therapeutic potential. However, the species A. crassiflora, characteristic of this biome, is being uncontrolledly extracted due to its prevalence in areas favored by agro-pastoral activities, leading to its lack of preservation [17]. Thus, the present study aims to develop a new herbal treatment for diseases related to oxidative stress and inflammation. The study conducted a preliminary analysis of the hydroethanolic extract of Annona crassiflora leaves (EHAC) and evaluated its phytochemical, toxicological, and pharmacological profile, including its cytotoxicity and pharmacological activities, including anti-inflammatory, antioxidant, and anti-glycation properties. These studies aim to promote sustainable development and the preservation of the Cerrado, a critical Brazilian biome.
2. Materials and Methods
2.1. Plant Material
The leaves of A. crassiflora M. were collected in Assis, São Paulo, Brazil (latitude: 22º39'42" S, longitude: 50º24'44" W, altitude: 546 m), where the species occurs natively. This collection was made in collaboration with researchers from the São Paulo State Forest Institute, located in Assis, SP. The identification and deposition of the specimens were carried out at the herbarium of the Assis Ecological Station. The collected material was cleaned and then dried in a circulating air oven at approximately 40°C. Finally, the leaves were ground in a knife mill.
2.2. Preparation of the Extract
The hydroalcoholic extract of Annona crassiflora (EHAC) was prepared using a ratio of 10 grams of dried leaf material per 100 milliliters of a 70% ethyl alcohol solution in distilled water. The mixture was agitated for 90 minutes and then left to undergo static maceration in the absence of light for 7 days. After this process, the extract was filtered and transferred to a rotary evaporator to completely remove the solvent. Finally, it was placed in a drying oven at 40 °C until a constant weight was achieved.
2.3. Phytochemical Characterization by Spectrophotometry
The extract was analyzed at the concentrations diluted in water: 100, 200, 400, and 800 μg/mL. For statistical purposes, all tests were performed in quadruplicate.
2.3.1. Quantitative Determination of Total Phenols
The Folin-Ciocalteau method was carried out according to the procedure outlined by Khodaie et al. to determine the total phenolic compounds, using gallic acid as the reference standard. For each extracted sample (0.5 mL at various concentrations), 5 mL of distilled water and 0.25 mL of the Folin-Ciocalteau reagent (which includes molybdate, tungstate, and phosphoric acid) were added. Then, after 3 minutes, 1 mL of a saturated 10% Na₂CO₃ solution was added, and the mixture was then allowed to stand for 1 hour. The absorbance was measured at a wavelength of 725 nm using a UV-Vis spectrophotometer.
2.3.2. Quantitative Determination of Flavonoids
The dosage of flavonoids in the extracts was determined using a modified version of the methodology by Zhishen et al. [19]. A 0.5 mL aliquot of the extract solution at varying concentrations was mixed with 1.5 mL of absolute ethanol and 0.1 mL of 10% AlCl3. Following this, 0.1 mL of CH3COONa was added, and the total volume was brought to 5.0 mL by adding 2.8 mL of distilled water. The mixtures were then homogenized and stored in the dark for 30 minutes. Finally, the absorbance was measured at 425 nm, using quercetin as a comparison standard.
2.3.3. Phytochemical Characterization by High-Performance Liquid Chromatography (HPLC)
The phytochemical characterization of the EHAC was performed by high-performance liquid chromatography (HPLC) according to the method developed by Luo et al. with modifications [20]. The analyses were performed on a Luna® C18 reverse-phase column (Phenomenex, 250 x 4.6 mm, 5 μm) at 35 °C. The mobile phase consisted of solvent (A) aqueous 0.1% formic acid and solvent (B) 0.1% formic acid in acetonitrile. Solvent gradient program: 0-3 min (80% A), 3-6 min (80-65% A), 6-11 min (65% A), 11-14 min (65-30% A), 14-19 min (30% A), 19-21 min (30-80% A), 21-24 min (80% A). The flow rate was 1 mL min⁻¹. The detector was set to 254 nm. The experiments were conducted using an online JASCO system with a diode array detector (JASCO, Easton, MD, USA). The peaks were determined by comparison with authentic flavonoid standards (Sigma-Aldrich). The flavonoids (10 mM) were dissolved in DMSO and diluted in water to 0.01 mM. The injection volume was 20 μL.
2.4. Evaluation of In Vitro Cytotoxicity by MTT [3-(4, 5-dimethylthiazol-2-yl)-2,5-diphenyltetrazolium bromide]
The assay was performed according to the protocol described by Tsuboy et al. [21], which consisted of three stages: first, normal murine fibroblasts (NIH/3T3 lineage) were cultured in adherent cell-treated culture flasks with Sigma's DMEM® high glucose culture medium and incubated in an incubator at 37 °C, 5% CO2. Next, trypsin was added to the fibroblast culture and centrifuged, using phenol-free supplemented RPMI 1640 culture medium to dissolve the formed cell pellet. The cell suspension was counted in a Neubauer chamber and diluted to obtain a concentration of 3300 cells per mL. After that, 100 microliters of the cell suspension were distributed in two 96-well ELISA plates for adherent cultures; additionally, 10 microliters of the extracts combined at different concentrations were also distributed. Finally, after 24 hours, the supernatant from each well of one of the plates was removed, and 10 microliters of MTT solution (CAS 298-93-1; Sigma Aldrich - 5g of MTT; 1 mL of PBS) was added and incubated for 4 hours. After this period, the supernatant was again removed, and 50 microliters of sterile DMSO were added to each well to solubilize the formazan crystals, followed by another 10 minutes of incubation under the previous conditions. After this time, homogenization was performed, and the reading was taken in an ELISA spectrophotometer at a wavelength of 540 nm. Finally, the same procedure was performed for the second plate after 48 hours of incubation. The cell viability index was calculated using the equation from Huang et al. [22]:
Equation 1. Percentage of cell viability
In this equation:
absA is the average absorbance value of the sample.
absB is the average absorbance value of the blank.
absCN is the average absorbance value of the negative control.
2.5. Anti-Inflammatory Activity
For the anti-inflammatory assay, 100, 200, 400, and 800 μg/mL concentrations were used. The negative control consisted of only cells; the positive control was dexamethasone at 100 μg/mL.
2.5.1. Phagocytosis
The analysis was conducted according to Della Libera et al. and Azedo et al., with minor modifications [23,24]. After the macrophage adhered to the coverslip in each well of the plates (each well containing 6 × 10³ cells), the wells were washed with PBS. Then 130 μL of DMEM® high glucose medium, 40 μL of the doses of the extract mentioned in 3.6, and 30 μL of Zymosan solution (2 × 10⁷ particles per mg) were added. Three wells were maintained with only the adhered macrophages without stimulation. The plate was incubated for 2 hours in a 5% CO₂ incubator at 36 °C. Subsequently, the wells were washed three times with PBS, and the macrophages were fixed in 2.5% glutaraldehyde. After that, the coverslips were stained with Wright’s stain to make permanent slides. Once the slides were prepared, they were read under an optical microscope at 400x magnification, counting 100 cells. This test was performed in triplicate. To calculate the inhibition of phagocytosis, Equation 2 was used:
Equation 2. Percentage of phagocytosis inhibition.
Where:
E0 is the average number of cells that phagocytosed particles in the control group.
ET is the average number of cells phagocytosed particles in the treated groups.
2.5.2. Spreading
The method described by Sampaio, Curi, and Cury [25] was employed for the macrophage spreading. This experiment was conducted in triplicate. After the adhesion of the macrophages on the slides, 10 μL of the EHAC concentrations were added along with the DMEM® high glucose medium, with three slides containing only the adhered macrophages without stimulation. The slides were incubated for 1 hour in the incubator. Subsequently, the slides were washed, and the macrophages were fixed with 2.5% glutaraldehyde; the slides were stained with Wright's stain to prepare permanent slides. Once the slides were ready, they were examined under an optical microscope at 400x magnification, counting 100 cells. To calculate the inhibition of spreading, Equation 3 was used:
Equation 3. Percentage of spreading inhibition.
Where:
E0 is the average number of spread cells in the control group.
ET is the average number of spread cells in the treated groups.
2.6. Antioxidant Activity
Four concentrations of EHAC were used: 100, 200, 400, and 800 µg/mL. The negative control consisted solely of the solvent (water), while the positive control used was Quercetin at 300 µg/mL.
2.6.1. Inhibition of Lipoperoxidation
4.0 mL of egg yolk homogenate (10% w/v) in 0.1 M phosphate buffer (pH 7.4) was sonicated and then homogenized with 0.4 mL of the extract at various concentrations. Lipid peroxidation was induced by the addition of 0.4 mL of FeSO₄ solution (0.17 M). The reactions were conducted for 30 minutes at 37 °C. After cooling, the samples (2 mL) were centrifuged with 2 mL of 15% trichloroacetic acid (TCA) at 1200 g for 10 minutes. An aliquot of 2 mL of the supernatant was mixed with 2 mL of thiobarbituric acid (TBA) (0.67%) and heated at 95 °C for 60 minutes. Finally, the final solution was cooled with ice water. Once it reached room temperature, absorbance was measured using a spectrophotometer at 532 nm [26]. The results were expressed as a percentage of lipid peroxidation inhibition and were calculated according to Equation 4:
Equation 4. Percentage of Lipoperoxidation Inhibition.
Where:
absA is the average absorbance value of the sample.
absCN is the average absorbance value of the negative control.
2.6.2. DPPH (2,2-diphenyl-1-picrylhydrazyl Radical Scavenging)
Based on the treatments mentioned in Section 2.5, in triplicate and a dark environment, an aliquot of 0.1 mL from each dilution of the extract was transferred to test tubes containing 3.9 mL of DPPH radical (0.06 mM) and homogenized using a tube shaker. A control solution (control of methanol, acetone, and water) was used, consisting of 0.1 mL with 3.9 mL of DPPH radical and homogenized. Afterward, the absorbance of the samples was measured using a spectrophotometer at 517 nm [27]. The antioxidant activity was calculated using Equation 5:
Equation 5. Percentage of Antioxidant Activity.
Where:
absA is the average absorbance value of the sample.
absCN is the average absorbance value of the negative control.
2.7. Antiglycation Activity
Four concentrations of EHAC (100, 200, 400, and 800 µg/mL) were used. Only the solvent (water) was utilized as a negative control, and Quercetin at 200 µg/mL was employed as a positive control.
2.7.1. Bovine Serum Albumin (BSA)/Glucose System
The glycation of proteins by glucose was assessed using the method of Starowicz and Zieliński with adaptations [28]. In a total reaction volume of 2.5 mL for glycation, 0.5 mL of the different dilutions of the extracts in absolute alcohol at the concentrations defined in Section 2.7 were included, along with 20 mg/mL of BSA, 500 mM of glucose, 0.02% (w/v) sodium azide, and phosphate buffer (100 mM, pH 7.4). After incubation at 37 °C for three weeks, the amount of formed fluorescent AGEs was determined using a fluorescence spectrometer, with an excitation wavelength of 330 nm and an emission wavelength of 410 nm. The percentage of inhibition of AGEs formation was calculated using Equation 6:
Equation 6. Percentage of Glycation Inhibition
Where:
flA is the mean fluorescence intensity of the sample with glucose.
flB is the mean fluorescence intensity of the sample without glucose.
flC is the mean fluorescence intensity of the control with glucose.
flCB is the mean fluorescence intensity of the control without glucose.
2.7.2. BSA/MGO System
In the MGO-mediated protein glycation (methylglyoxal, an intracellular glycating agent), dilutions of the extract solutions in absolute alcohol at the concentrations previously defined in item 2.7 were incubated with 20 mg/mL of BSA, 1 M MGO, and 0.02% (w/v) sodium azide in phosphate buffer (10 mM, pH 7.4) at 37°C for one week. The total formation of fluorescent AGEs was determined by the percentage of inhibition of AGEs formation for each extract dilution and calculated using Equation 6.
2.8. Statistical Analysis
Statistical analyses were performed using the BioEstat 5.0 software. For all tests, the significance level was set at 5%. The data were subjected to one-way ANOVA, with treatment as the independent factor. When appropriate, multiple comparisons were made using Tukey’s test.
3. Results
3.1. Phytochemical Characterization
Table 1 presents the phytochemical results obtained from the spectrophotometric analyses of EHAC, expressed in grams of standard equivalents per 100 grams of dry extract.
Subsequently, the presence of eight flavonoids was investigated in the EHAC. Thus, Figure 1A shows the retention times of the eight flavonoid standards used in the study, while Figure 1B displays the chromatographic profile of the EHAC. Based on the analysis of the graph, a significant presence of rutin and quercetin was identified in the EHAC.
3.2. Cell Viability
The results of the assay evaluating the viability of fibroblast cells treated with various concentrations of EHAC are presented in Figure 3. This figure clearly shows that only the positive control (Tween 80 at 2%) and EHAC at 1600 µg/mL exhibited a significant difference (p < 0.05) compared to the negative control. At 100, 200, 400, 800, and 1600 µg/mL concentrations, EHAC demonstrated the following percentages of cell viability: 95.49%, 100%, 100%, 100%, and 60.46%, respectively. The cytotoxic concentration of 50% (IC50) for EHAC was determined to be 2300 µg/mL, which indicates the concentration at which the extract can cause 50% lysis or death of fibroblast cells.
3.3. Anti-Inflammatory Activity
Figure 4A illustrates the evaluation of the anti-inflammatory activity of EHAC at concentrations of 100, 200, 400, and 800 µg/mL. These concentrations resulted in 55.76%, 72.33%, 88.99%, and 92.33% inhibition of phagocytosis, respectively. Figure 4B indicates that the inhibition of spreading was 56.77%, 65%, 79.76%, and 88.55% at the same respective concentrations. This demonstrates a progressive anti-inflammatory effect of the treatments. It is also important to note that in both tests, dexamethasone (the positive control) and all concentrations of EHAC showed significant differences from the negative control (p < 0.05).
3.4. Antioxidant Activity
The lipid peroxidation inhibition test indicates that the positive control displayed 90.91% antioxidant activity (Figure 5A). In contrast, EHAC at concentrations of 100, 200, 400, and 800 µg/mL showed antioxidant activities of 93.82%, 94.73%, 98.81%, and 99.23%, respectively. In Figure 5B, EHAC demonstrated complete scavenging of DPPH radicals at all tested concentrations, achieving 100% antioxidant activity.
3.5. Antiglycant Activity
The results from both systems (Figure 6) indicate that EHAC exhibited 100% antiglycant activity at all analyzed concentrations, demonstrating efficacy comparable to or exceeding that of the positive control (quercetin at 300 μg/mL). Additionally, all treatments showed significant differences compared to the negative control (p < 0.05).
4. Discussion
The phytochemical analysis of EHAC using spectrophotometry revealed a high concentration of phenolic compounds and flavonoids, which is consistent with previous research. Avila et al. conducted a study on the chemopreventive effects of Annona crassiflora against pre-neoplastic lesions induced by the carcinogen 1,2-dimethylhydrazine (DMH) in the colon of Wistar rats. They correlated these effects with the antioxidant activity of Annona crassiflora and the levels of phenolic compounds and bioactive amines. Their findings showed a high total phenolic content of 9.16 mg GAE/g, with chlorogenic acid (1.86 µg/g) and epicatechin (0.99 µg/g) as the predominant compounds, as well as a total flavonoid content of 7.26 mg CE/g [29]. Ramos et al. evaluated the bioaccessibility of bioactive compounds in different parts of the araticum fruit (peel, pulp, and seeds) and found varying total phenolic content: 480.81 to 1007.62 mg GAE/100 g for pulp, 837.53 to 1926.56 mg GAE/100 g for peel, and 358.28 to 1186.07 mg GAE/100 g for seeds [30]. Additionally, Arruda et al. discovered a high amount of total phenolic compounds in araticum pulp, measuring 2.62 g GAE/100 g, and a total flavonoid content of 1.79 g CE/100 g. They noted that flavonoids accounted for about 68% of the total phenolic content [31]. The analysis of EHAC by HPLC revealed a significant presence of the flavonoids rutin and quercetin. The presence of quercetin in Annona crassiflora was first identified by Lage et al. when analyzing the hydroalcoholic fraction of the leaves using high-performance liquid chromatography with a diode array detector. The flavonoids quercetin and rutin were also identified by Ferraz et al. when analyzing the aqueous extract of Annona crassiflora leaves by HPLC coupled with mass spectrometry [32,33].
The MTT assay results indicated that EHAC significantly reduced cell viability only at a concentration of 1600 µg/mL. Additionally, Silva et al. reported that extracts from different parts of Annona crassiflora may have cytotoxic activities, but establishing a safety profile for its use depends on the dose and the type of cells being analyzed [34,35].
In order to evaluate the anti-inflammatory activity in vitro, we conducted phagocytosis and spreading tests to analyze the macrophage response to stimulation with EHAC. Macrophages originate from hematopoietic stem cells and are the most specialized cells in the immune system. When located in tissues, they are referred to as macrophages and perform phagocytic functions as part of the first line of defense in innate immunity [36]. The phagocytosis assay uses a potent macrophage activator, zymosan, which is found in the cell wall of Saccharomyces cerevisiae yeast. In this in vitro test, zymosan particles induce phagocytosis, a process that leads to the release of lysosomal enzymes, reactive oxygen species, arachidonic acid, and TNF-α [37]. Spreading, on the other hand, is generally described as a frustrated attempt at phagocytosis. However, since there is no substance or microorganism to be phagocytosed, spreading is merely a manifestation of a responsive cell that can adhere to the surface and extend microvilli [23]. The data obtained from the two tests conducted to analyze anti-inflammatory activity using EHAC, particularly at a concentration of 800 μg/mL, demonstrated effective results that were comparable to those obtained with dexamethasone. Similarly, the findings reported by da Costa Oliveira et al. [38] indicated that in an in vivo evaluation, the hydroalcoholic fraction of Annona crassiflora leaves, when administered orally to mice, exhibited significant anti-inflammatory activity.
By correlating the data obtained from phagocytosis and spreading tests with phytochemical information, it can be suggested that the anti-inflammatory activity of EHAC is linked to the presence of quercetin in this plant. Quercetin has been shown to inhibit the activity of myeloid cells, including macrophages. Generally, this flavonoid promotes the negative regulation of macrophages, thereby reducing the release of pro-inflammatory cytokines [39]. Moreover, the anti-inflammatory effects of quercetin were confirmed by Li et al. [40], who reported its regulatory capacity in hepatic macrophages of mice. Additionally, a study conducted by Tsai et al. [41] demonstrated that RAW 264 macrophages treated with quercetin had their activity modulated, leading to a reduction in inflammatory responses and a decrease in the expression of pro-inflammatory cytokines and nitric oxide production. The in vitro anti-inflammatory effects of rutin have also been observed in macrophages and neutrophils, where this flavonoid significantly decreased the expression of pro-inflammatory cytokines [42].
The first test conducted in analyzing the in vitro antioxidant capacity of EHAC was the inhibition of lipid peroxidation. Lipid peroxidation can cause significant damage to cell membranes, affecting their structure and impairing fluidity and permeability. When lipid peroxidation occurs, toxic products like malondialdehyde (MDA) are formed, which can disrupt biological functions and potentially promote cardiovascular diseases, inflammatory processes, and cancer. In the tests for lipid peroxidation inhibition and DPPH scavenging, the results obtained with EHAC demonstrated effective antioxidant activity, comparable to that of quercetin, which was used as a standard. These findings are consistent with those reported by Silva et al., who utilized a 70% hydroethanolic extract of Annona crassiflora leaves. Their study showed notably high antioxidant activity percentages across all analyzed concentrations, with the 400 µg/mL concentration scavenging approximately 100% of the DPPH radicals in vitro.
Quercetin is known for its significant antioxidant properties, as it can neutralize free radicals [45]. Given the high concentration of quercetin in EHAC, it is likely that this flavonoid contributes to the extract's antioxidant activity. Supporting this idea, an in vivo study showed that quercetin can help reduce oxidative stress in individuals with diabetes mellitus [46]. Additionally, Moretti et al. explored its antioxidant effects through tests on lipid peroxidation inhibition [47]. Another flavonoid present in EHAC is rutin, which has also been recognized for its potent antioxidant capabilities. Silva et al. conducted a literature review detailing various studies that demonstrate how rutin can significantly reduce DPPH and ABTS (2,2'-azinobis-3-ethylbenzothiazoline-6-sulfonic acid) radicals. Furthermore, research on rutin revealed its effectiveness in significantly reducing oxidative lesions [44].
In both evaluated systems, EHAC demonstrated maximum inhibition of glycation at all concentrations. Glycated proteins, which are byproducts of inflammation, form through a non-enzymatic reaction between reducing sugars and amino groups in proteins [48]. One of the most damaging products of this process is advanced glycation end-products, which have significant negative effects on the body [49]. This type of non-enzymatic reaction leads to the accumulation of glycation products, a buildup that is associated with various pathological conditions, including diabetes mellitus [50]. While there are no existing reports on the antiglycation activity of Annona crassiflora leaves, Batista [38] analyzed the ethanolic extract of the fruit peel of this plant. The study found that the extract effectively inhibited protein glycation in both BSA-fructose and BSA-methylglyoxal models, achieving exceptional results in inhibiting glycation in the BSA-fructose case.
5. Conclusions
The study shows that EHAC contains a high concentration of phenolic compounds, particularly the flavonoids quercetin and rutin. The cytotoxicity test revealed that cell viability remained above 95% at 800 µg/mL concentrations. Additionally, the extract demonstrated effective anti-inflammatory, antioxidant, and anti-glycating activities. Therefore, it can be concluded:
- (1)
- EHAC shows promise as an extract for creating a new plant-based therapeutic treatment for diseases associated with oxidative stress and inflammation. As a result, additional studies will be carried out to verify these effects in living organisms.
- (2)
- The development of a phytotherapeutic product based on EHAC, by adding value to a plant species from the Cerrado, may contribute to sustainable development and the preservation of this important Brazilian biome, which is currently facing intensive deforestation.
Author Contributions
Conceptualization, L.d.S, L.A.C.d.S, G.P.C. and J.A.R.F.; development methodologies, L.A.C.d.S., J.A.R.F, J.M.R. and J.T.R.P; software, L.T.S.d.C; writing—original draft preparation, L.A.C.d.S., J.T.R.P and N.A.Z; writing—review, L.d.S and V.F.X; project administration, L.d.S. All authors have read and agreed to the published version of the manuscript.
Funding
J.A.R.F. was financially supported by the
Coordination for the Improvement of Higher Education Personnel (CAPES – Brazil - 888 87.827298/2023-00
), L.T.S.d.C was financially supported by the
Coordination for the Improvement of Higher Education Personnel (CAPES – Brazil - 88887.817409-2023-00). L.d.S, A.M.d.S., M. J. B., M. P.M. Marques and
D.B.B. the CAPES Print Unesp Project: Exploring Multidisciplinary Approaches for the Development of Phytotherapeutic Products, (Grant - A1266B4).
Institutional Review Board Statement
Not Applicable.
Data Availability Statement
All data is in this article.
Conflicts of Interest
The authors declare no conflicts of interest.
References
- Martemucci, G.; Costagliola, C.; Mariano, M.; D'Andrea, L.; Napolitano, P.; D'Alessandro, A.G. Free Radical Properties, Source and Targets, Antioxidant Consumption and Health. Oxygen 2022, 2, 48–78. [Google Scholar] [CrossRef]
- Forrester, S.J.; Kikuchi, D.S.; Hernandes, M.S.; Xu, Q.; Griendling, K.K. Reactive Oxygen Species in Metabolic and Inflammatory Signaling. Circ. Res. 2018, 122, 877–902. [Google Scholar] [CrossRef] [PubMed]
- Dehghan Shahreza, F. Oxidative Stress, Free Radicals, Kidney Disease and Plant Antioxidants. Immunopathol. Persa 2016, 3, e11. [Google Scholar] [CrossRef]
- Hussain, T.; Tan, B.; Yin, Y.; Blachier, F.; Tossou, M.C.B.; Rahu, N. Oxidative Stress and Inflammation: What Polyphenols Can Do for Us? Oxid. Med. Cell. Longev. 2016, 2016, 7432797. [Google Scholar] [CrossRef]
- Nowotny, K.; Jung, T.; Höhn, A.; Weber, D.; Grune, T. Advanced Glycation End Products and Oxidative Stress in Type 2 Diabetes Mellitus. Biomolecules 2015, 5, 194–222. [Google Scholar] [CrossRef]
- Justino, A.B.; Franco, R.R.; Silva, H.C.G.; Saraiva, A.L.; Sousa, R.M.F.; Espindola, F.S. Procyanidins of Annona Crassiflora Fruit Peel Inhibited Glycation, Lipid Peroxidation and Protein-Bound Carbonyls, with Protective Effects on Glycated Catalase. Sci. Rep. 2019, 9, 19183. [Google Scholar] [CrossRef]
- Rocha, J.D.; Carneiro, F.M.; Fernandes, A.S.; Morais, J.M.; Borges, L.L.; Chen-Chen, L.; Almeida, L.M.; Bailão, E.F.L.C. Toxic Potential of Cerrado Plants on Different Organisms. Int. J. Mol. Sci. 2022, 23, 3413. [Google Scholar] [CrossRef]
- Shakya, P.; Marslin, G.; Siram, K.; Beerhues, L.; Franklin, G. Elicitation as a Tool to Improve the Profiles of High-Value Secondary Metabolites and Pharmacological Properties of Hypericum perforatum. J. Pharm. Pharmacol. 2019, 71, 70–82. [Google Scholar] [CrossRef]
- Muscolo, A.; Mariateresa, O.; Torello, G.; Russo, M. Oxidative Stress: The Role of Antioxidant Phytochemicals in the Prevention and Treatment of Diseases. Int. J. Mol. Sci. 2024, 25, 3264. [Google Scholar] [CrossRef]
- Silva, J.M.; Nobre, M.S.C.; Albino, S.L.; Lócio, L.L.; Nascimento, A.P.S.; Scotti, L.; Scotti, M.T.; Oshiro-Junior, J.A.; Lima, M.C.A.; Mendonça-Junior, F.J.B. Secondary Metabolites with Antioxidant Activities for the Putative Treatment of Amyotrophic Lateral Sclerosis (ALS): Experimental Evidences. Oxid. Med. Cell. Longev. 2020, 2020, 5642029. [Google Scholar] [CrossRef]
- Gomes, T.M.; Sousa, P.; Campos, C.; Perestrelo, R.; Câmara, J.S. Secondary Bioactive Metabolites from Foods of Plant Origin as Theravention Agents against Neurodegenerative Disorders. Foods 2024, 13, 2289. [Google Scholar] [CrossRef]
- Arruda, H.S.; Pastore, G.M. Araticum (Annona Crassiflora Mart.) as a Source of Nutrients and Bioactive Compounds for Food and Non-Food Purposes: A Comprehensive Review. Food Res. Int. 2019, 123, 450–480. [Google Scholar] [CrossRef] [PubMed]
- Da Costa Oliveira, C.; De Matos, N.A.; De Carvalho Veloso, C.; Lage, G.A.; Pimenta, L.P.S.; Duarte, I.D.G.; Romero, T.R.L.; Klein, A.; De Castro Perez, A. Anti-Inflammatory and Antinociceptive Properties of the Hydroalcoholic Fractions from the Leaves of Annona Crassiflora Mart. in Mice. Inflammopharmacology 2019, 27, 397–408. [Google Scholar] [CrossRef] [PubMed]
- Vilar, J.B.; Ferri, P.H.; Chen-Chen, L. Genotoxicity Investigation of Araticum (Annona Crassiflora Mart., 1841, Annonaceae) Using SOS-Inductest and Ames Test. Braz. J. Biol. 2011, 71, 197–202. [Google Scholar] [CrossRef] [PubMed]
- Vilar, J.B.; Ferreira, F.L.; Ferri, P.H.; Guillo, L.A.; Chen Chen, L. Assessment of the Mutagenic, Antimutagenic and Cytotoxic Activities of Ethanolic Extract of Araticum (Annona Crassiflora Mart. 1841) by Micronucleus Test in Mice. Braz. J. Biol. 2008, 68, 141–147. [Google Scholar] [CrossRef] [PubMed]
- Arruda, H.S.; Borsoi, F.T.; Andrade, A.C.; Pastore, G.M.; Marostica Junior, M.R. Scientific Advances in the Last Decade on the Recovery, Characterization, and Functionality of Bioactive Compounds from the Araticum Fruit (Annona crassiflora Mart.). Plants 2023, 12, 1536. [Google Scholar] [CrossRef]
- Bailão, E.; Devilla, I.; Da Conceição, E.; Borges, L. Bioactive Compounds Found in Brazilian Cerrado Fruits. Int. J. Mol. Sci. 2015, 16, 23760–23783. [Google Scholar] [CrossRef]
- Khodaie, L.; Bamdad, S.; Delazar, A.; Nazemiyeh, H. Antioxidant, Total Phenol and Flavonoid Contents of Two Pedicularis L. Species from Eastern Azarbaijan, Iran. BioImpacts 2012, 2, 43–48. [Google Scholar] [CrossRef]
- Zhishen, J.; Mengcheng, T.; Jianming, W. The Determination of Flavonoid Contents in Mulberry and Their Scavenging Effects on Superoxide Radicals. Food Chem. 1999, 64, 555–559. [Google Scholar] [CrossRef]
- Luo, X.; Tang, A.; Pi, L.; Xiao, L.; Ao, X.; Pu, Y.; Wang, R. Determination of Kynurenine in Serum by High-Performance Liquid Chromatography with on-Column Fluorescence Derivatization. Clin. Chim. Acta 2008, 389, 186–188. [Google Scholar] [CrossRef]
- Tsuboy, M.S.; Marcarini, J.C.; Luiz, R.C.; Barros, I.B.; Ferreira, D.T.; Ribeiro, L.R.; Mantovani, M.S. In Vitro Evaluation of the Genotoxic Activity and Apoptosis Induction of the Extracts of Roots and Leaves from the Medicinal Plant Coccoloba Mollis (Polygonaceae). J. Med. Food 2010, 13, 503–508. [Google Scholar] [CrossRef] [PubMed]
- Huang, Y.-H. Antitumor Efficacy of Lidamycin on Hepatoma and Active Moiety of Its Molecule. World J. Gastroenterol. 2005, 11, 3980. [Google Scholar] [CrossRef] [PubMed]
- Della Libera, A.M.M.P.; Birgel, E.H.; Kitamura, S.S.; Rosenfeld, A.M.F.; Mori, E.; Gomes, C.D.O.M.-S.; Araújo, W.P.D. Macrófagos Lácteos de Búfalas Hígidas: Avaliações da Fagocitose, Espraiamento e Liberação de H2O2. Braz. J. Vet. Res. Anim. Sci. 2006, 43, 412–419. [Google Scholar] [CrossRef]
- Azedo, M.R.; Blagitz, M.G.; Souza, F.N.; Benesi, F.J.; Della Libera, A.M.M.P. Avaliação Funcional de Monócitos de Bovinos Naturalmente Infectados pelo Vírus da Leucose Bovina. Arq. Bras. Med. Vet. Zootec. 2011, 63, 1131–1140. [Google Scholar] [CrossRef]
- Sampaio, S.C.; Sousa-e-Silva, M.C.C.; Borelli, P.; Curi, R.; Cury, Y. Crotalus durissus terrificus snake venom regulates macrophage metabolism and function. J. Leukoc. Biol. 2001, 70, 551–558. [Google Scholar] [CrossRef]
- Nascimento Júnior, B.J.; Santos, A.M.T.; Souza, A.T.; Santos, E.O.; Xavier, M.R.; Mendes, R.L.; Amorim, E.L.C. Estudo da ação da romã (Punica granatum L.) na cicatrização de úlceras induzidas por queimadura em dorso de língua de ratos Wistar (Rattus norvegicus). Rev. Bras. Plantas Med. 2016, 18, 423–432. [Google Scholar] [CrossRef]
- Garcia, E.J.; Oldoni, T.L.C.; Alencar, S.M.; Reis, A.; Loguercio, A.D.; Grande, R.H.M. Antioxidant activity by DPPH assay of potential solutions to be applied on bleached teeth. Braz. Dent. J. 2012, 23, 22–27. [Google Scholar] [CrossRef]
- Starowicz, M.; Zieliński, H. Inhibition of advanced glycation end-product formation by high antioxidant-leveled spices commonly used in European cuisine. Antioxidants 2019, 8, 100. [Google Scholar] [CrossRef]
- Ávila, P.F.; Todescato, A.P.; Santos, M.d.M.C.d.; Ramos, L.F.; Menon, I.C.; Carvalho, M.O.; Vale-Oliveira, M.d.; Custódio, F.B.; Gloria, M.B.A.; Dala-Paula, B.M. Anonna crassiflora suppresses colonic carcinogenesis through its antioxidant effects, bioactive amines, and phenol content in rats. Food Res. Int. 2024, 175, 113666. [Google Scholar] [CrossRef]
- Ramos, A.L.C.C.; Minighin, E.C.; Soares, I.I.C.; Ferreira, R.M.d.S.B.; Sousa, I.M.N.d.; Augusti, R.; Labanca, R.A.; Araújo, R.L.B.d.; Melo, J.O.F. Evaluation of the total phenolic content, antioxidative capacity, and chemical fingerprint of Annona crassiflora Mart. Bioaccessible molecules. Food Res. Int. 2023, 165, 112514. [Google Scholar] [CrossRef]
- Arruda, H.S.; Pereira, G.A.; Pastore, G.M. Brazilian Cerrado fruit araticum (Annona crassiflora Mart.) as a potential source of natural antioxidant compounds. Int. Food Res. J. 2018, 25, 2005–2012. [Google Scholar]
- Lage, G.A.; Medeiros, F.D.S.; Furtado, W.D.L.; Takahashi, J.A.; Filho, J.D.D.S.; Pimenta, L.P.S. The first report on flavonoid isolation from Annona crassiflora Mart. Nat. Prod. Res. 2014, 28, 808–811. [Google Scholar] [CrossRef] [PubMed]
- Ferraz, C.R.; Silva, D.B.; Prado, L.C.D.S.; Canabrava, H.A.N.; Bispo-da-Silva, L.B. Antidiarrhoeic effect and dereplication of the aqueous extract of Annona crassiflora (Annonaceae). Nat. Prod. Res. 2019, 33, 563–567. [Google Scholar] [CrossRef] [PubMed]
- Nugraha, A.S.; Damayanti, Y.D.; Wangchuk, P.; Keller, P.A. Anti-Infective and Anti-Cancer Properties of the Annona Species: Their Ethnomedicinal Uses, Alkaloid Diversity, and Pharmacological Activities. Molecules. 2019, 24, 4419. [Google Scholar] [CrossRef]
- Silva, J.J.D.; Cerdeira, C.D.; Chavasco, J.M.; Cintra, A.B.P.; Silva, C.B.P.D.; Mendonça, A.N.D.; Ishikawa, T.; Boriollo, M.F.G.; Chavasco, J.K. In vitro screening antibacterial activity of Bidens pilosa Linné and Annona crassiflora Mart. against oxacillin resistant Staphylococcus aureus (ORSA) from the aerial environment at the dental clinic. Rev. Inst. Med. Trop. S. Paulo 2014, 56, 333–340. [Google Scholar] [CrossRef]
- Mota, L.A.M.; Roberto-Neto, J.; Monteiro, V.G.; Lobato, C.S.S.; De Oliveira, M.A.; da Cunha, M.; D’Ávila, H.; Seabra, S.H.; Bozza, P.T.; DaMatta, R.A. Culture of mouse peritoneal macrophages with mouse serum induces lipid bodies that associate with the parasitophorous vacuole and decrease their microbicidal capacity against Toxoplasma gondii. Mem. Inst. Oswaldo Cruz 2014, 109, 767–774. [Google Scholar] [CrossRef]
- Underhill, D.M. Macrophage recognition of zymosan particles. J. Endotoxin Res. 2003, 9, 176–180. [Google Scholar] [CrossRef]
- Da Costa Oliveira, C.; De Matos, N.A.; De Carvalho Veloso, C.; Lage, G.A.; Pimenta, L.P.S.; Duarte, I.D.G.; Romero, T.R.L.; Klein, A.; De Castro Perez, A. Anti-inflammatory and antinociceptive properties of the hydroalcoholic fractions from the leaves of Annona crassiflora Mart. in mice. Inflammopharmacol. 2019, 27, 397–408. [Google Scholar] [CrossRef]
- González, R.; Ballester, I.; López-Posadas, R.; Suárez, M.D.; Zarzuelo, A.; Martínez-Augustin, O.; Medina, F.S.D. Effects of flavonoids and other polyphenols on inflammation. Crit. Rev. Food Sci. Nutr. 2011, 51, 331–362. [Google Scholar] [CrossRef]
- Li, X.; Jin, Q.; Yao, Q.; Xu, B.; Li, L.; Zhang, S.; Tu, C. The flavonoid quercetin ameliorates liver inflammation and fibrosis by regulating hepatic macrophages activation and polarization in mice. Front. Pharmacol. 2018, 9, 72. [Google Scholar] [CrossRef]
- Tsai, C.-F.; Chen, G.-W.; Chen, Y.-C.; Shen, C.-K.; Lu, D.-Y.; Yang, L.-Y.; Chen, J.-H.; Yeh, W.-L. Regulatory effects of quercetin on M1/M2 macrophage polarization and oxidative/antioxidative balance. Nutrients 2021, 14, 67. [Google Scholar] [CrossRef] [PubMed]
- Nassiri-Asl, M.; Nikfarjam, B.A.; Adineh, M.; Hajiali, F. Treatment with Rutin - A Therapeutic Strategy for Neutrophil-Mediated Inflammatory and Autoimmune Diseases. J. Pharmacopuncture 2017, 20, 52–56. [Google Scholar] [CrossRef] [PubMed]
- Nonato, E.F. Capacidade Antioxidante in Vitro e Efeito Hepatoprotetor de Umbu (Spondias Tuberosa Arr. Cam.) Em Resposta Ao Estresse Oxidativo Induzido Por Tetracloreto de Carbono, Universidade Federal de Sergipe, 2017.
- Silva, M.A.D.; Silva, G.A.D.; Marques, M.J.; Bastos, R.G.; Silva, A.F.D.; Rosa, C.P.; Espuri, P.F. Triagem Fitoquímica, Atividade Antioxidante e Leishmanicida Do Extrato Hidroetanólico 70% (v/v) e Das Frações Obtidas de (Annona Crassiflora Mart.). Rev. Fitos 2017, 10, 505–517. [Google Scholar] [CrossRef]
- Boots, A.W.; Haenen, G.R.M.M.; Bast, A. Health Effects of Quercetin: From Antioxidant to Nutraceutical. Eur. J. Pharmacol. 2008, 585, 325–337. [Google Scholar] [CrossRef]
- Maciel, R.M.; Costa, M.M.; Martins, D.B.; França, R.T.; Schmatz, R.; Graça, D.L.; Duarte, M.M.M.F.; Danesi, C.C.; Mazzanti, C.M.; Schetinger, M.R.C.; Paim, F.C.; Palma, H.E.; Abdala, F.H.; Stefanello, N.; Zimpel, C.K.; Felin, D.V.; Lopes, S.T.A. Antioxidant and Anti-Inflammatory Effects of Quercetin in Functional and Morphological Alterations in Streptozotocin-Induced Diabetic Rats. Res. Vet. Sci. 2013, 95, 389–397. [Google Scholar] [CrossRef]
- Moretti, E.; Mazzi, L.; Terzuoli, G.; Bonechi, C.; Iacoponi, F.; Martini, S.; Rossi, C.; Collodel, G. Effect of Quercetin, Rutin, Naringenin and Epicatechin on Lipid Peroxidation Induced in Human Sperm. Reprod. Toxicol. 2012, 34, 651–657. [Google Scholar] [CrossRef]
- Laguerre, M.; Lecomte, J.; Villeneuve, P. Evaluation of the Ability of Antioxidants to Counteract Lipid Oxidation: Existing Methods, New Trends and Challenges. Prog. Lipid Res. 2007, 46, 244–282. [Google Scholar] [CrossRef]
- Batista, J.P.C. Frações Enriquecidas Com Proantocianidinas Da Casca Do Fruto Da Annona Crassiflora Com Propriedades Antioxidante e Antiglicante e Potencial Inibitório Contra Hidrolases Glicosídicas. Master's Thesis, Universidade Federal de Goiás, Goiânia, Brazil, 2019. [Google Scholar]
- Khan, I.; Ahmad, H.; Ahmad, B. Anti-Glycation and Anti-Oxidation Properties of Capsicum Frutescens and Curcuma Longa Fruits: Possible Role in Prevention of Diabetic Complication. Pak. J. Pharm. Sci. 2014, 27, 1359–1362. [Google Scholar]
Figure 1.
A) Retention times of the eight flavonoid standards used in this study, which are: quercetin (1); rutin (2); morina (3); kaempferol (4); isorhamnetin (5); fisetin (6); chrysin (7) and catechin (8). B) Fingerprint of the EHAC obtained by high-performance liquid chromatography according to the conditions presented in the methodology. 1 – Quercetin; 2 – Rutin.
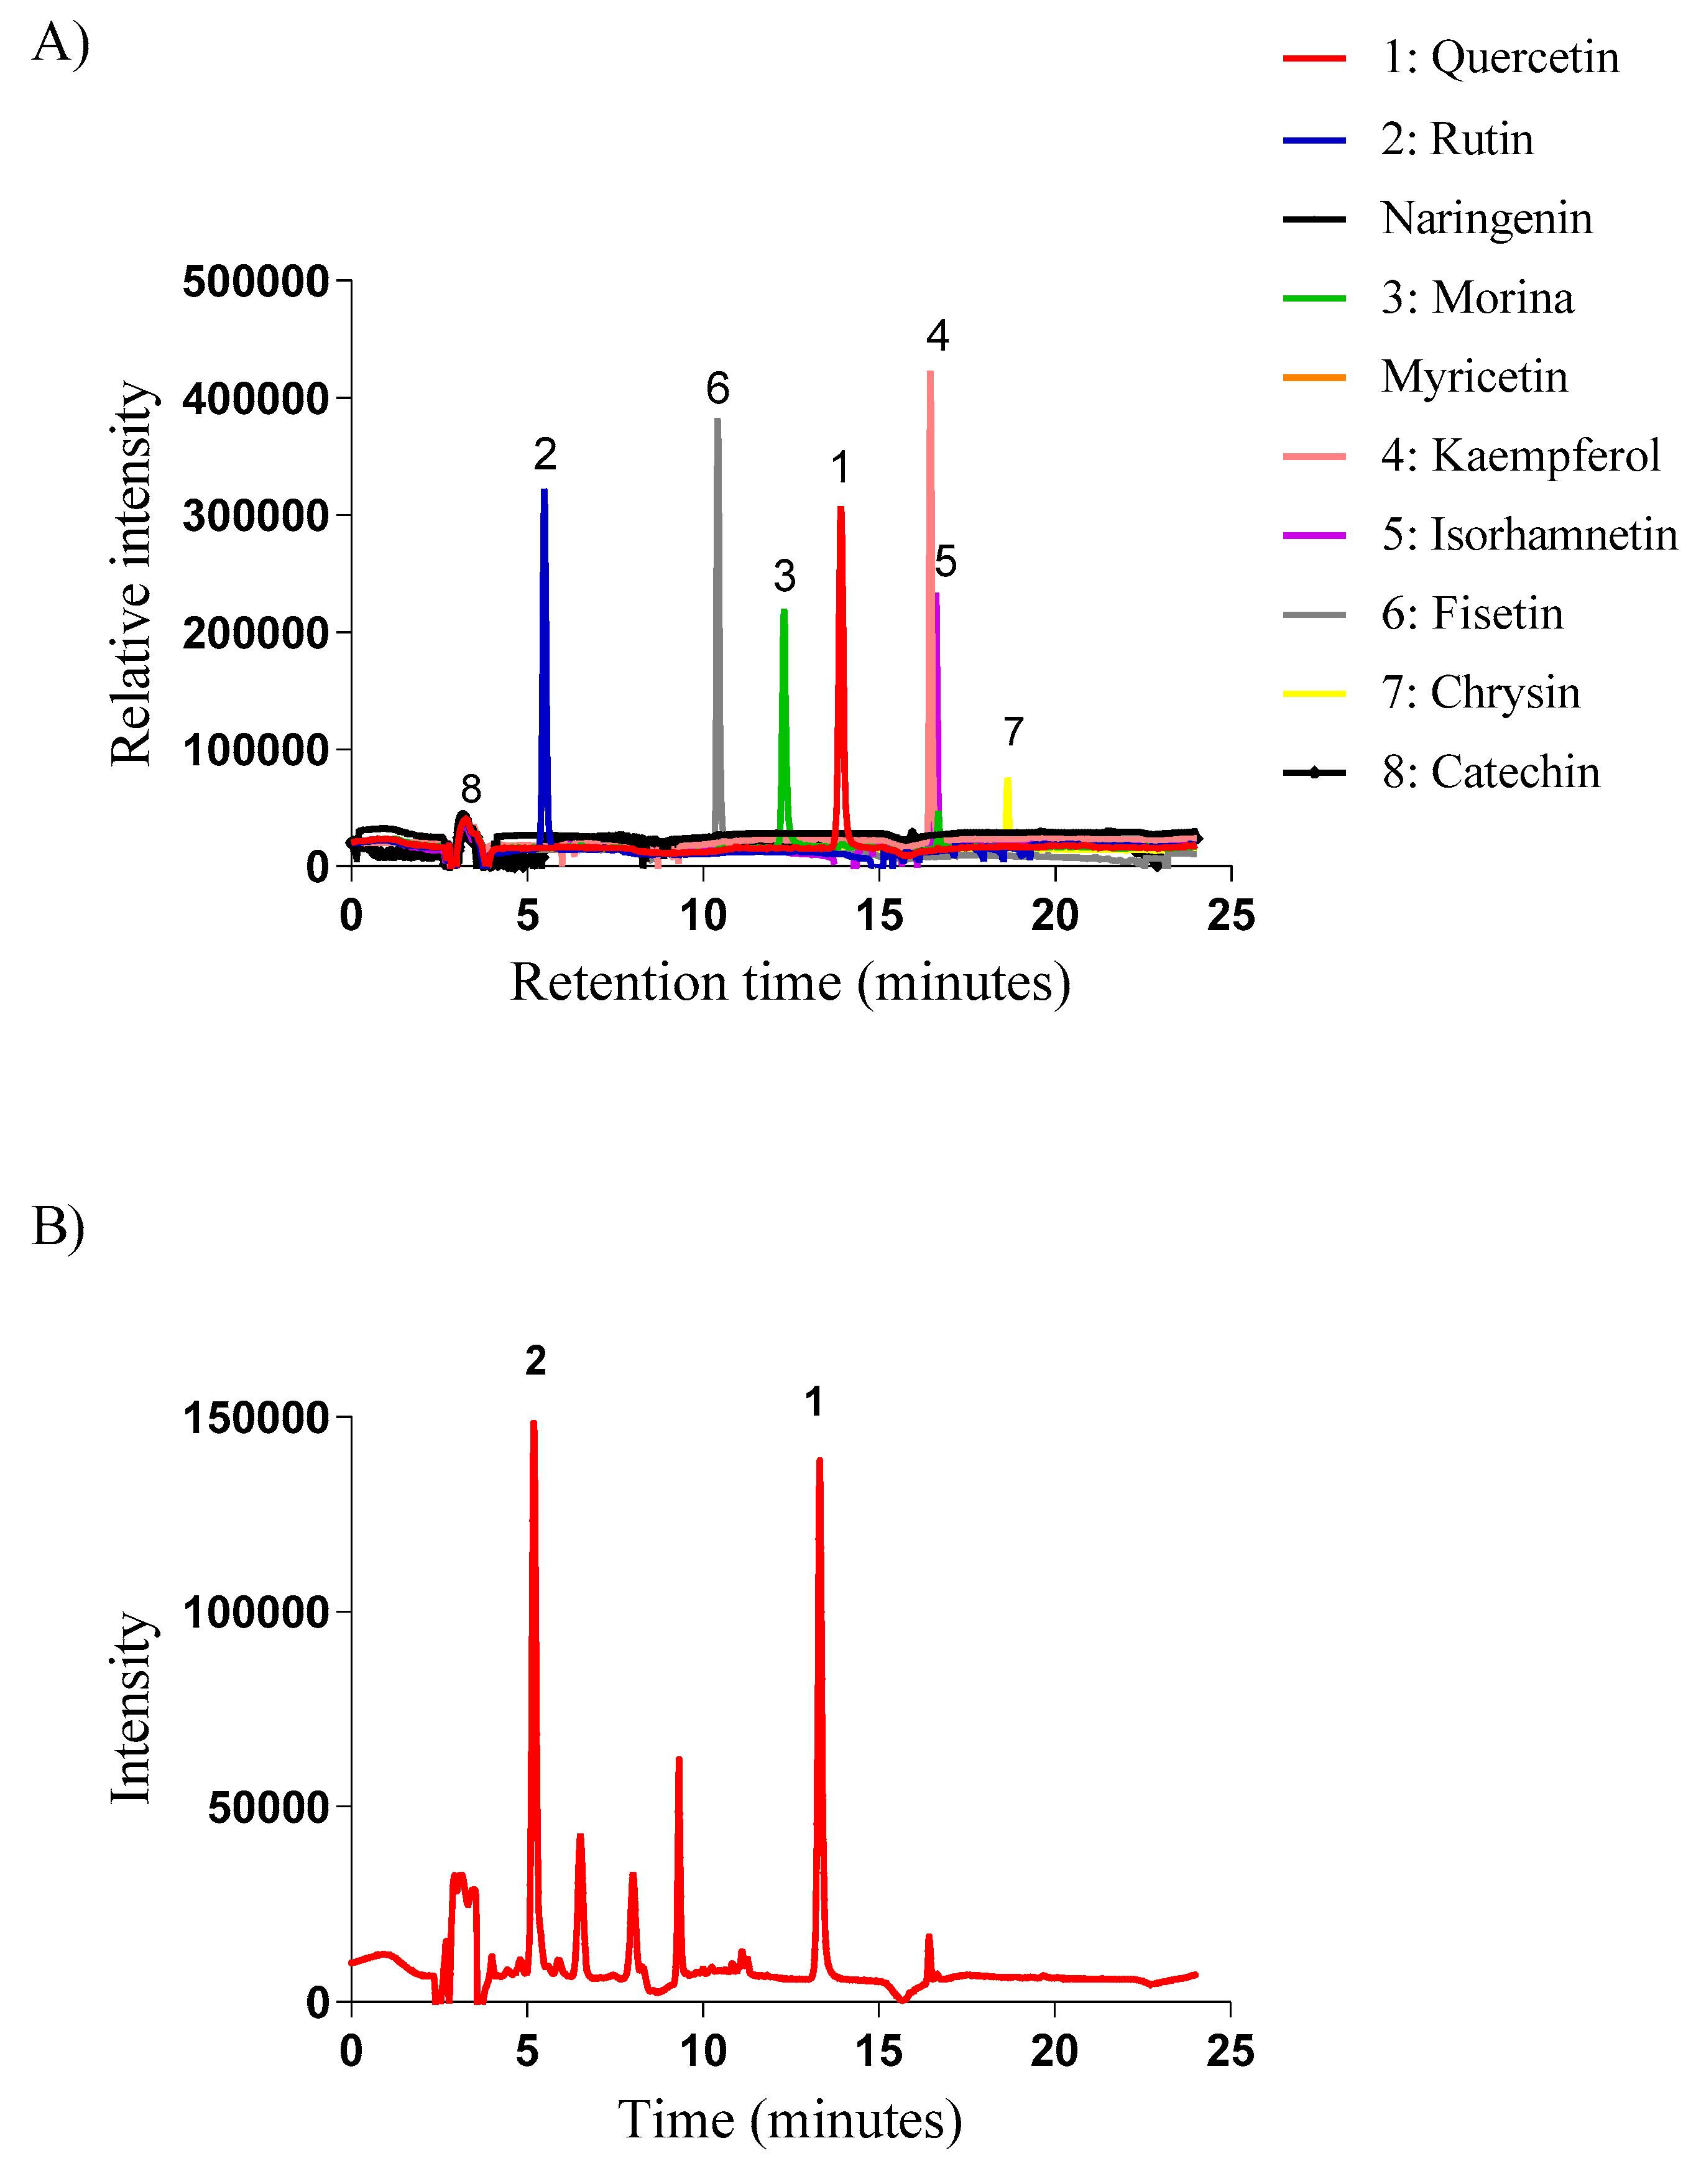
Figure 3.
Mean ± SD of percentage values referring to the cell viability rate in NIH 3T3 fibroblasts at the evaluation time of 24 hours after the following treatments: saline solution - negative control (NC); Tween 80 at 2% - positive control (PC); hydroalcoholic extract of Annona crassiflora (EHAC) at concentrations of 100, 200, 400, 800, and 1600 μg/mL. The asterisk (*) indicates a significant difference (p<0.05) compared to the PC group.
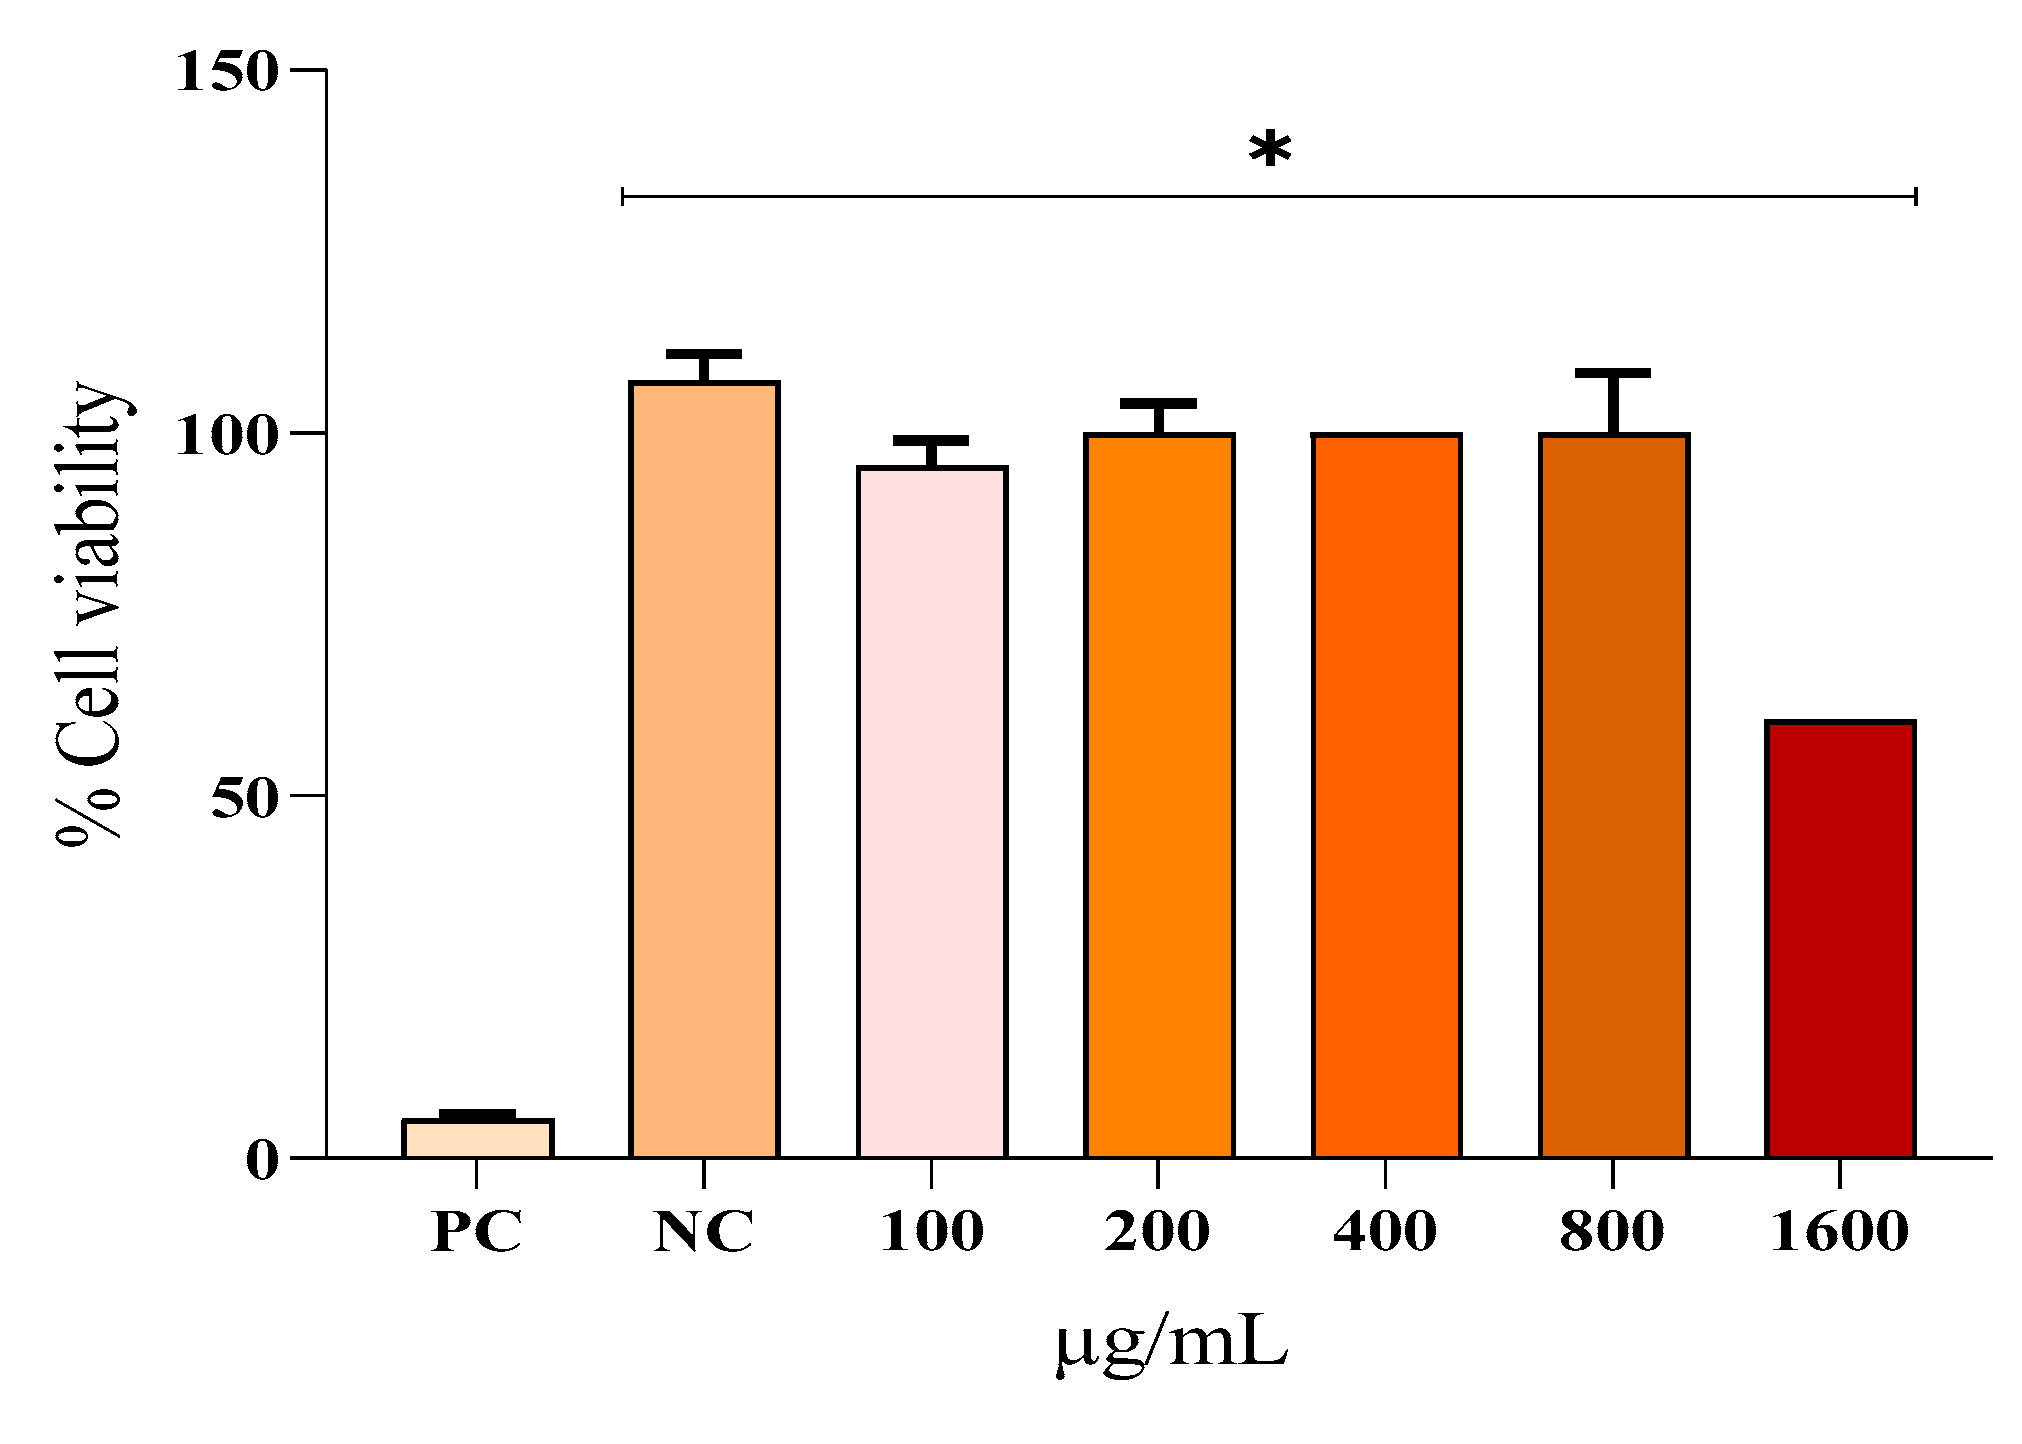
Figure 4.
Mean percentage ± standard deviation (% inhibition of phagocytosis (A) and % inhibition of spreading) after the following treatments: saline solution - negative control (NC); dexamethasone 100 µg/mL; hydroalcoholic extract of Annona crassiflora (EHAC) at concentrations of 100, 200, 400, and 800 µg/mL. One-way ANOVA followed by Tukey's post-hoc test. The asterisk (*) indicates a significant difference (p<0.05) from the NC.
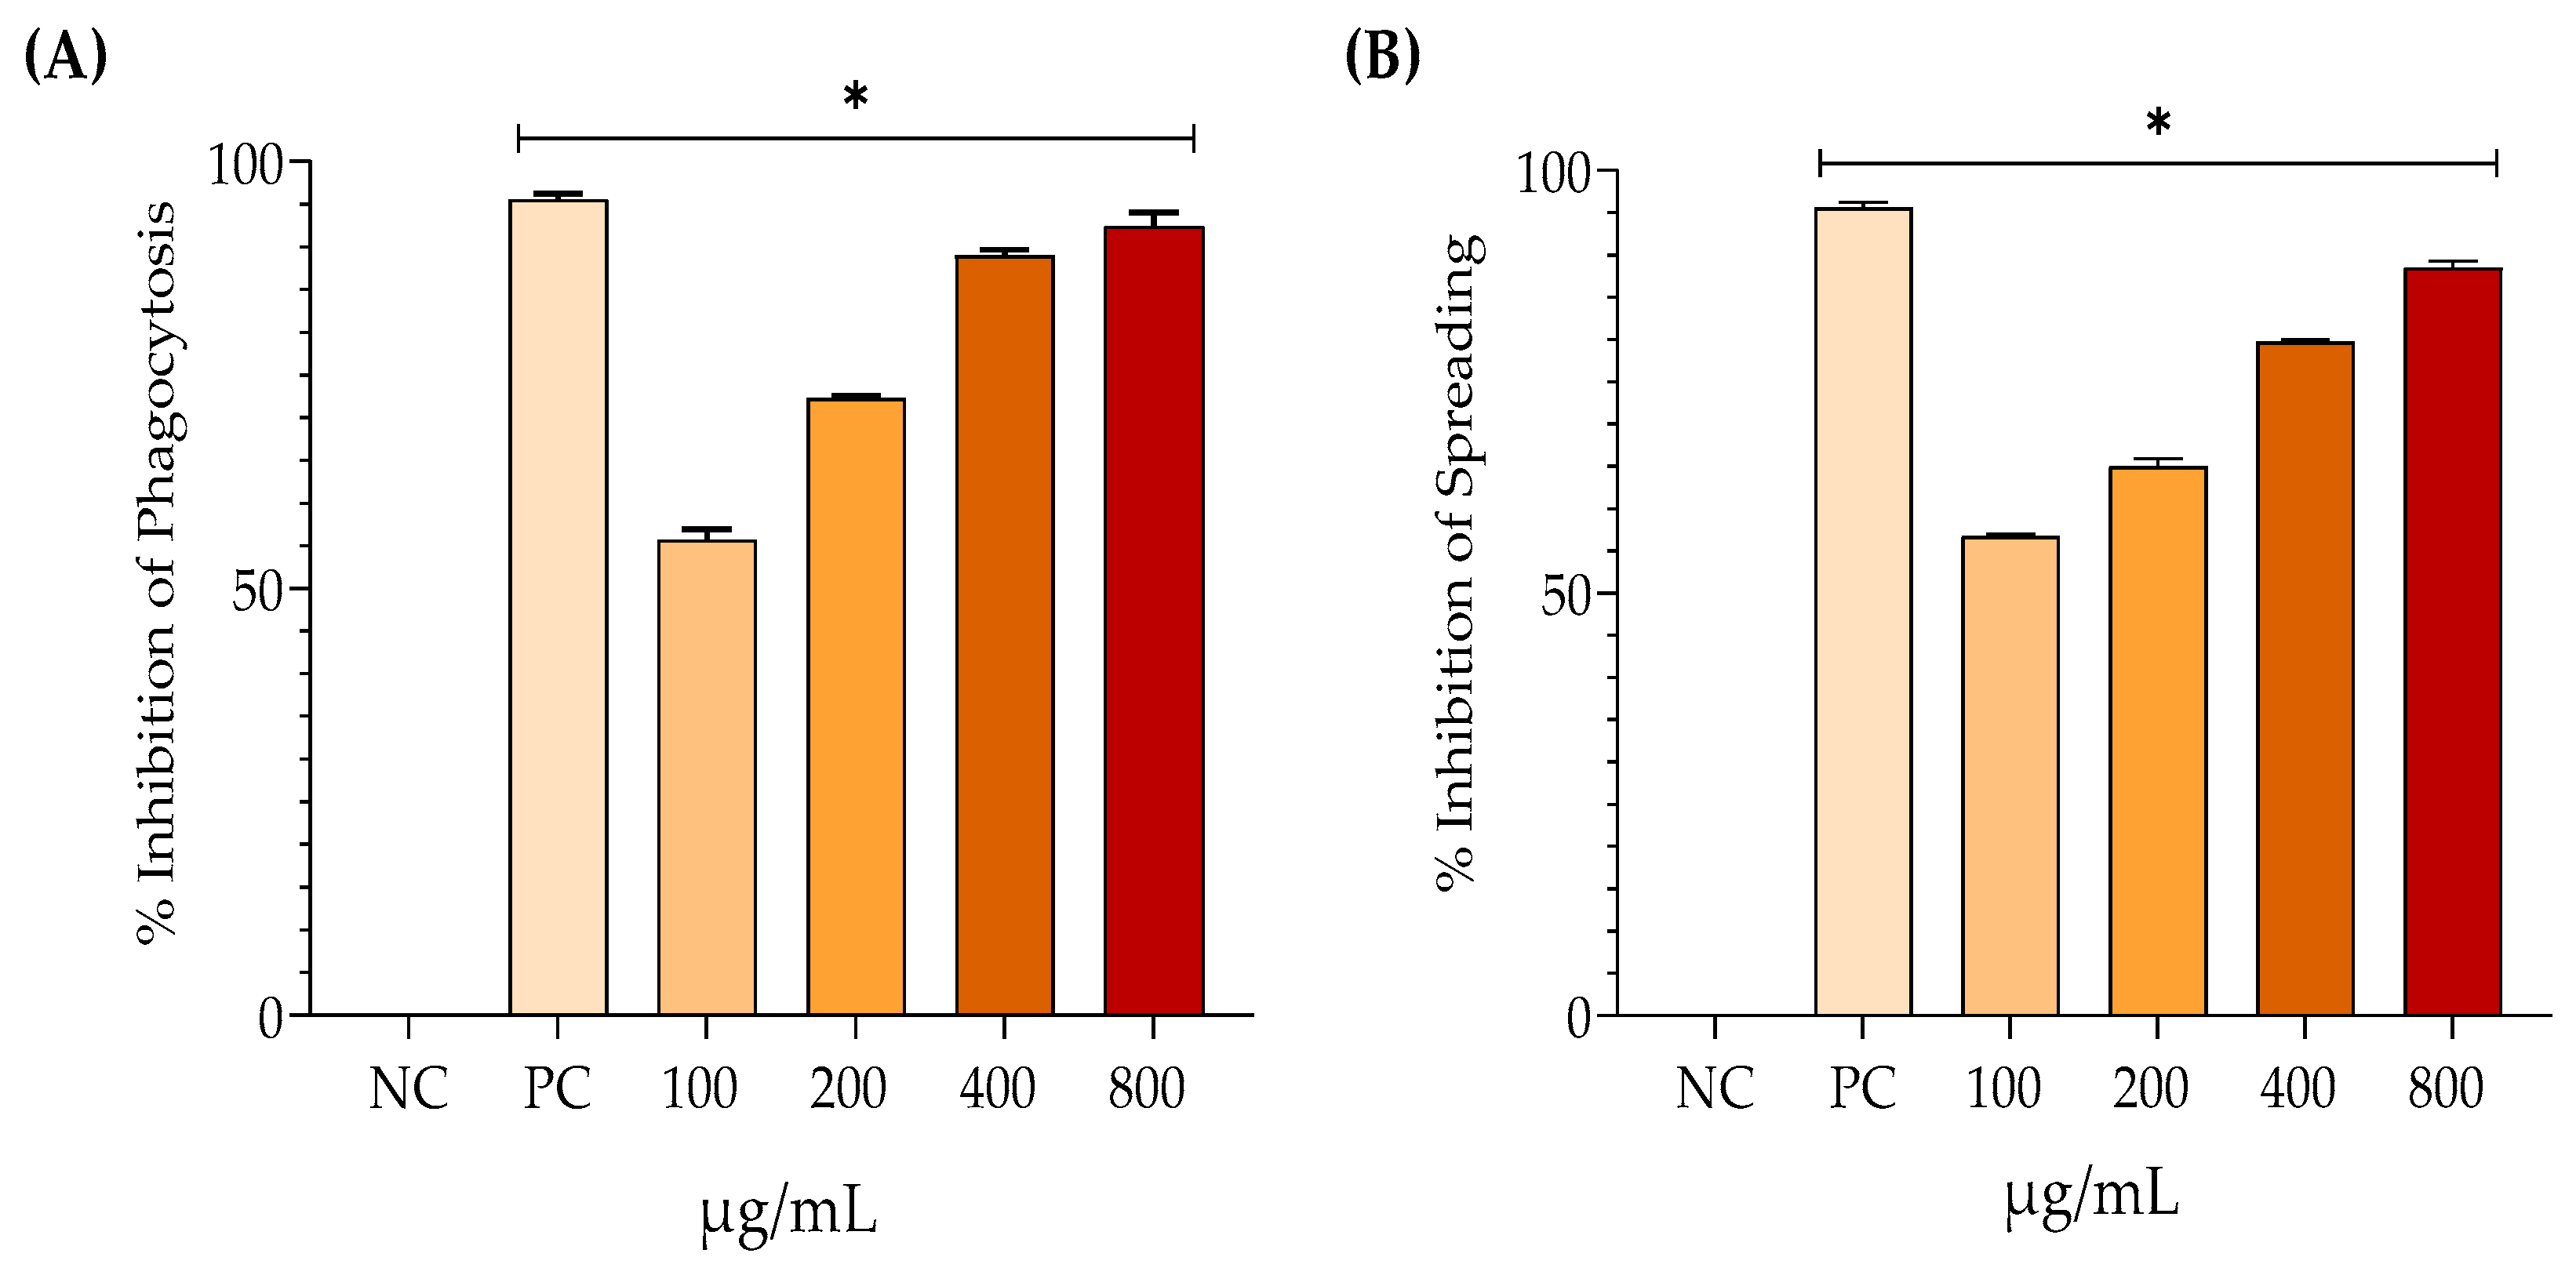
Figure 5.
Mean ± SD of the percentage values for antioxidant activity through DPPH (A) and percentage inhibition of lipid peroxidation (B) after the following treatments: quercetin 300 μg/mL – positive control (PC); hydroalcoholic extract of Annona crassiflora (EHAC) at concentrations of 100, 200, 400, and 800 μg/mL. One-way ANOVA followed by Tukey's post-hoc test. The asterisk (*) indicates a significant difference (p < 0.05) from the negative control (NC).
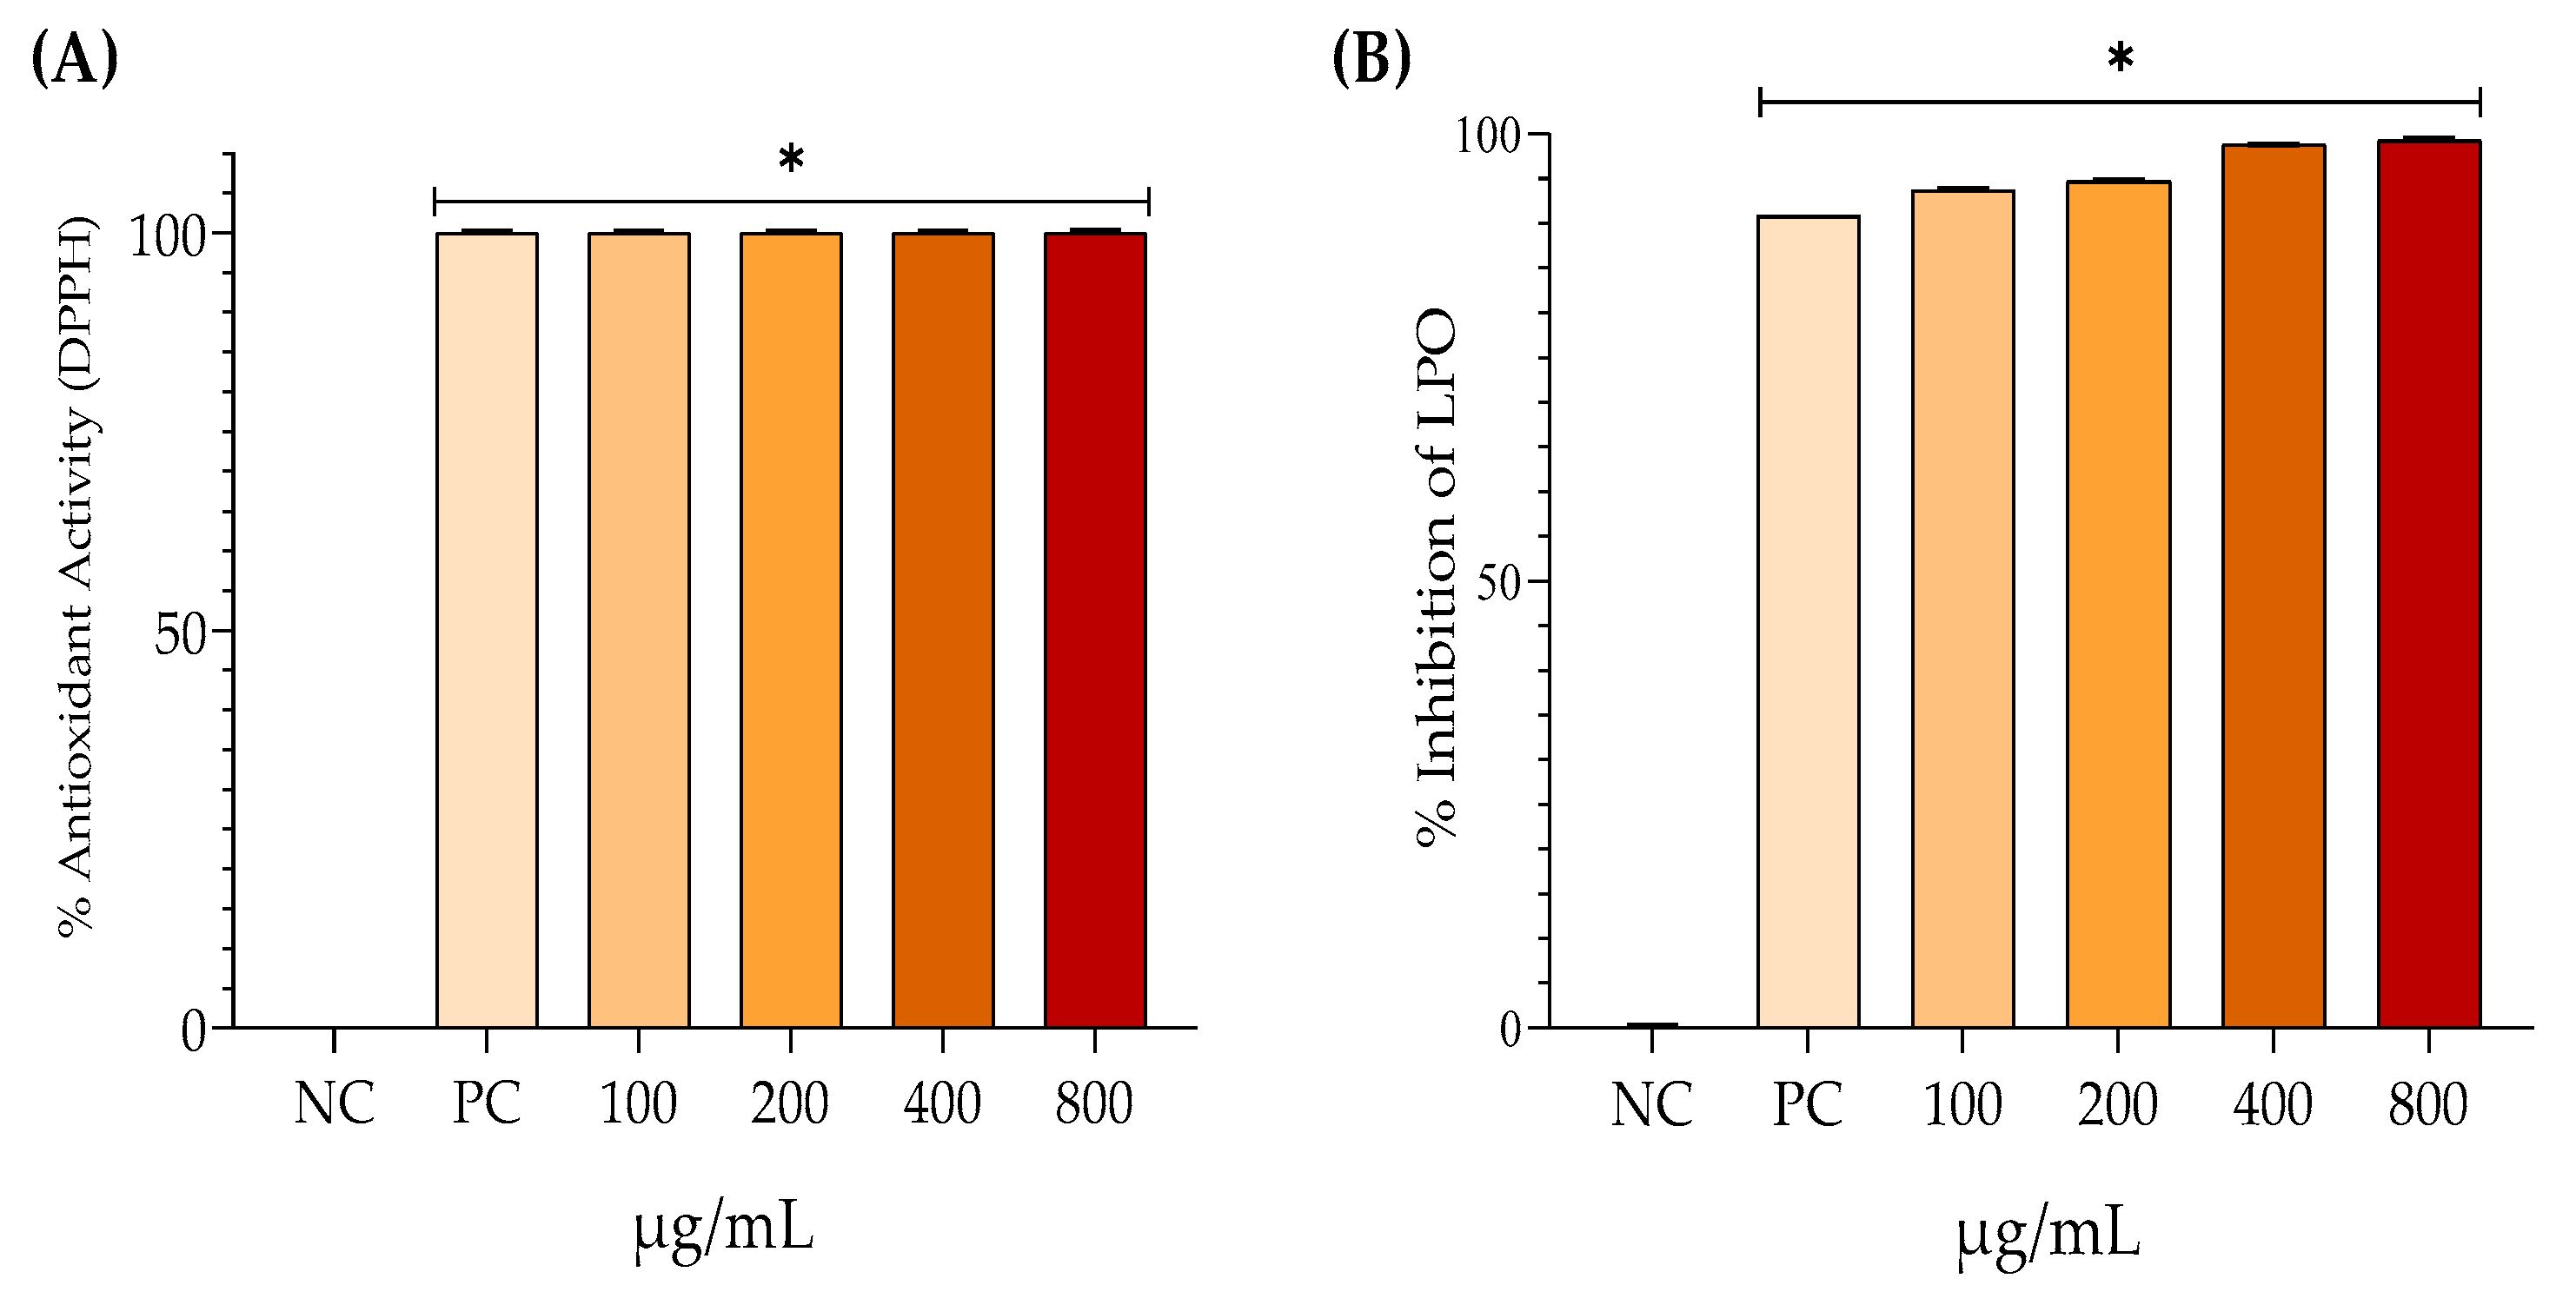
Figure 6.
Mean ± SD values for antiglycant activity (%) evaluated through the BSA/GLUCOSE (A) and BSA/MGO (B) systems after the following treatments: quercetin 300 μg/mL – positive control (PC); hydroalcoholic extract of Annona crassiflora (EHAC) at concentrations of 100, 200, 400, and 800 μg/mL. One-way ANOVA followed by Tukey's post-hoc test. The asterisk (*) indicates a significant difference (p < 0.05) from the NC.
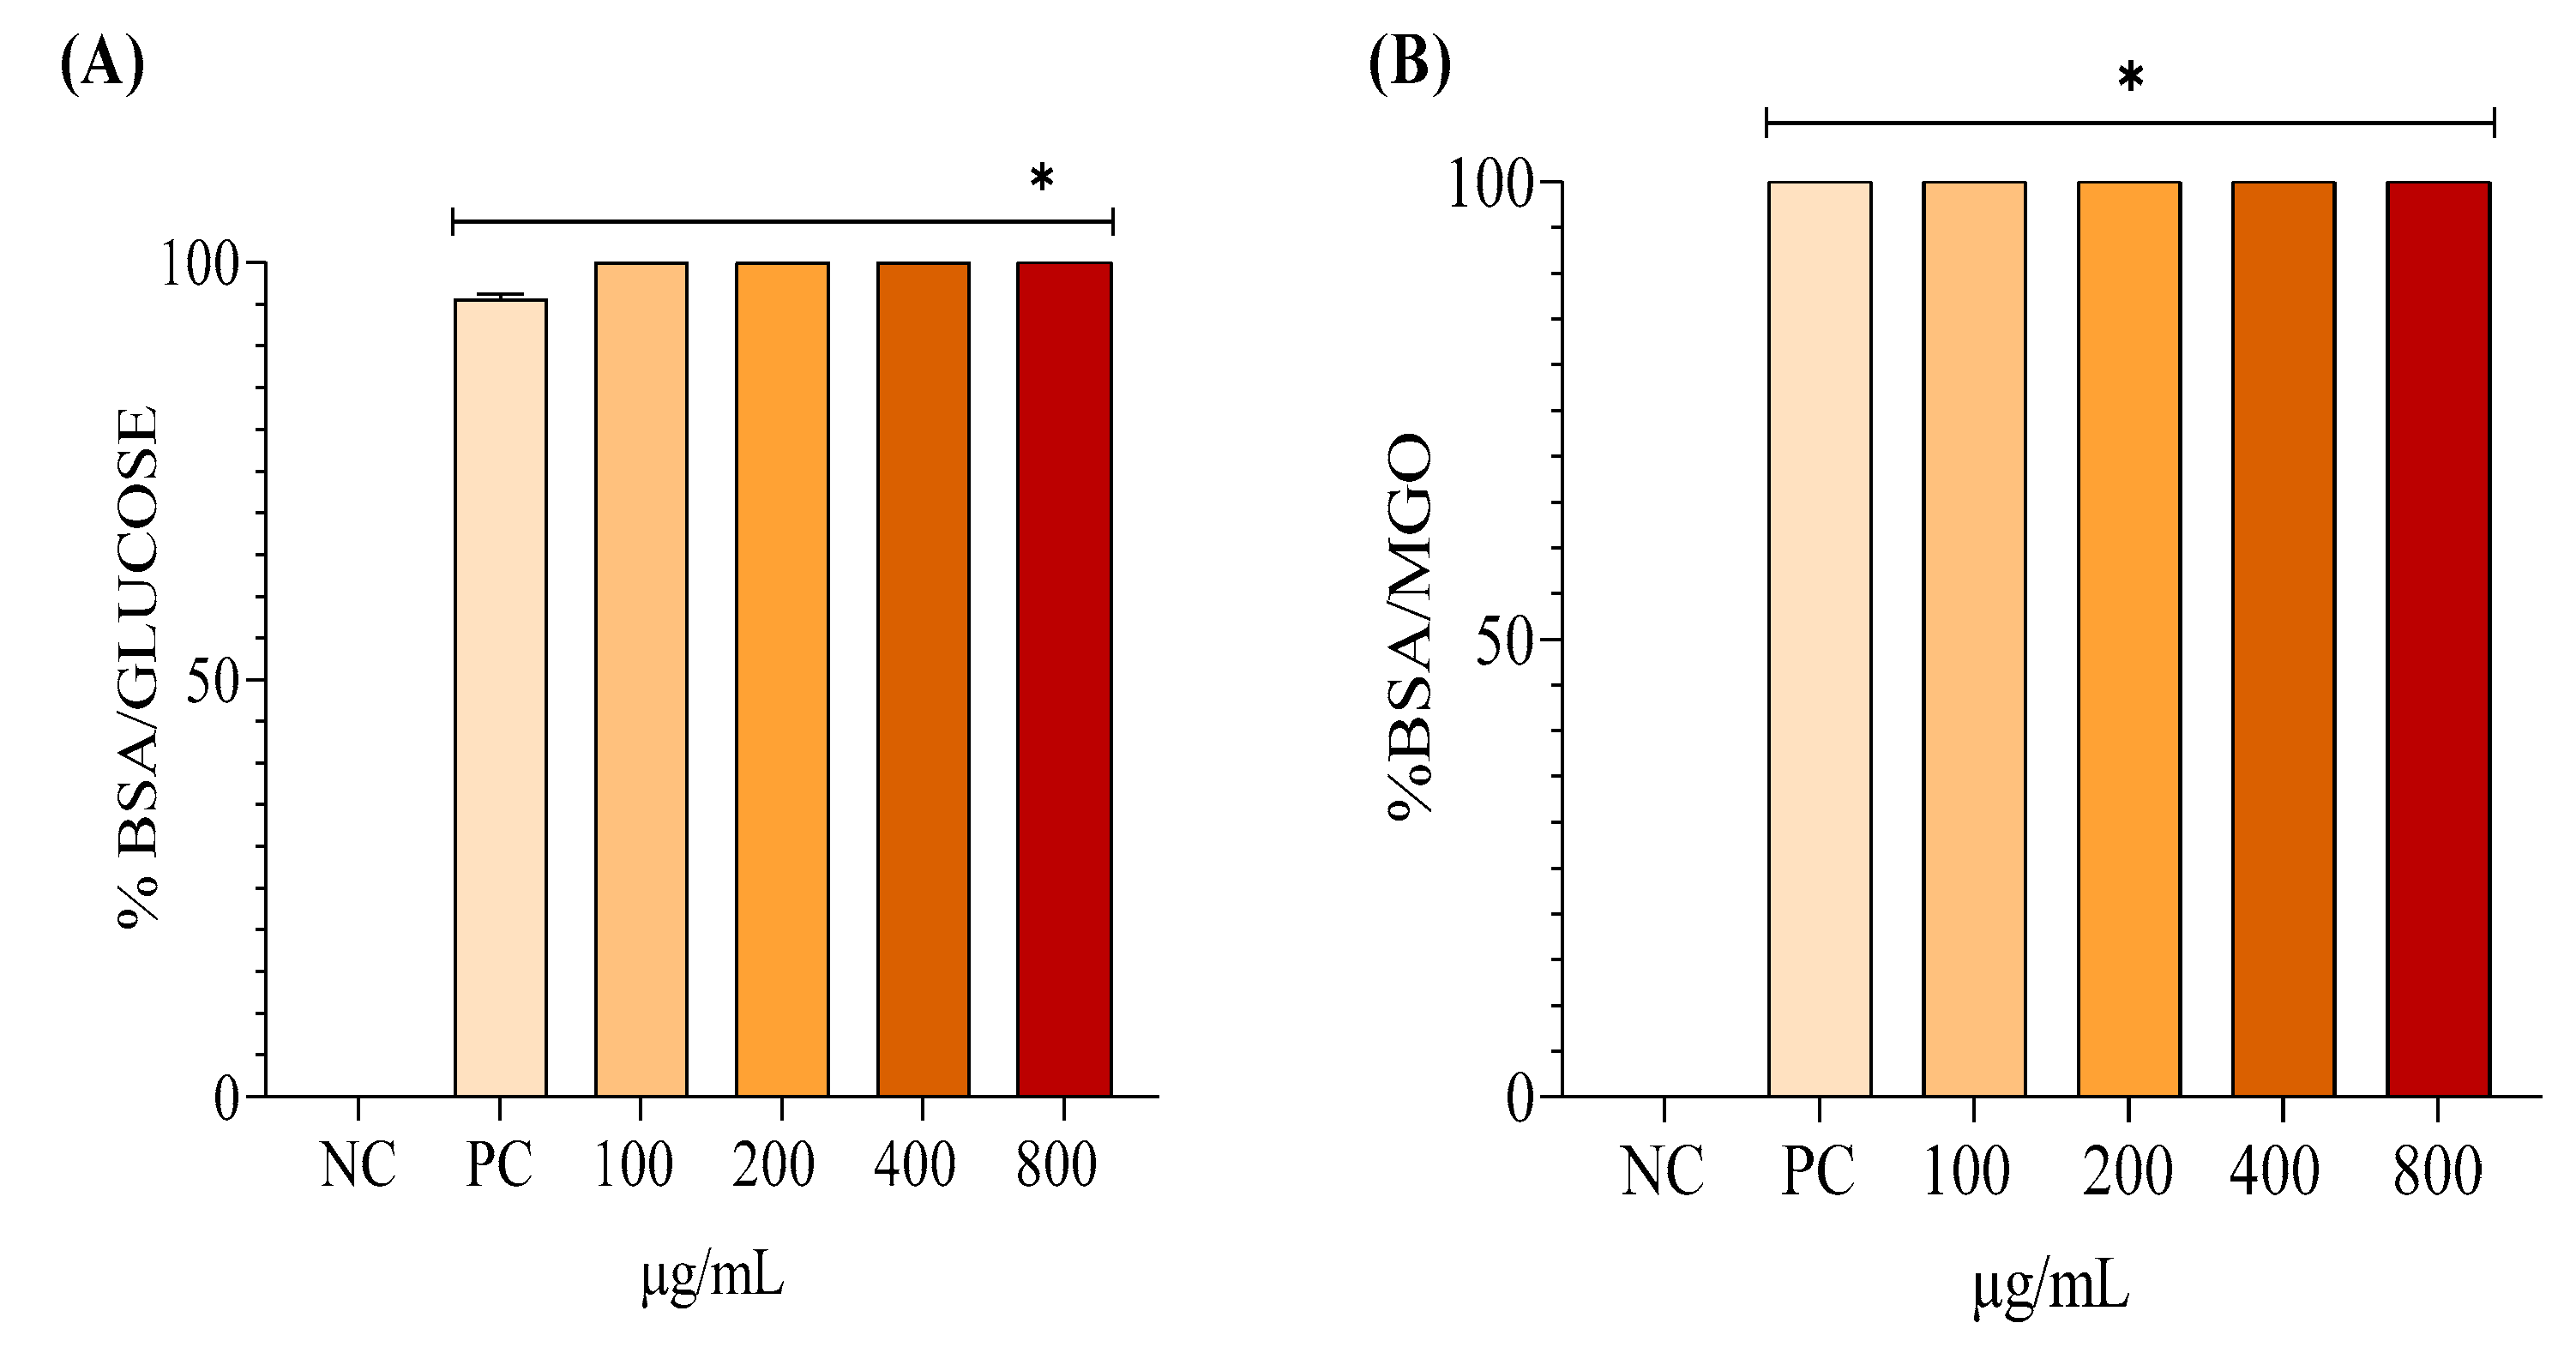

Table 1.
Mean ± SD of secondary metabolites present in the hydroalcoholic extract of Annona crassiflora leaves. GAE - gallic acid equivalent in g/100 g of dry extract; QE - quercetin equivalent in g/100 g of dry extract.
Table 1.
Mean ± SD of secondary metabolites present in the hydroalcoholic extract of Annona crassiflora leaves. GAE - gallic acid equivalent in g/100 g of dry extract; QE - quercetin equivalent in g/100 g of dry extract.
| Secondary Metabolites | Quantity |
| Total phenols | 23.08 ± 1.58 EAG |
| Flavonoids | 2.27 ± 0.08 EAQ |
Disclaimer/Publisher’s Note: The statements, opinions and data contained in all publications are solely those of the individual author(s) and contributor(s) and not of MDPI and/or the editor(s). MDPI and/or the editor(s) disclaim responsibility for any injury to people or property resulting from any ideas, methods, instructions or products referred to in the content. |
© 2024 by the authors. Licensee MDPI, Basel, Switzerland. This article is an open access article distributed under the terms and conditions of the Creative Commons Attribution (CC BY) license (http://creativecommons.org/licenses/by/4.0/).
Copyright: This open access article is published under a Creative Commons CC BY 4.0 license, which permit the free download, distribution, and reuse, provided that the author and preprint are cited in any reuse.


