
Submitted:
05 November 2024
Posted:
06 November 2024
You are already at the latest version
Abstract
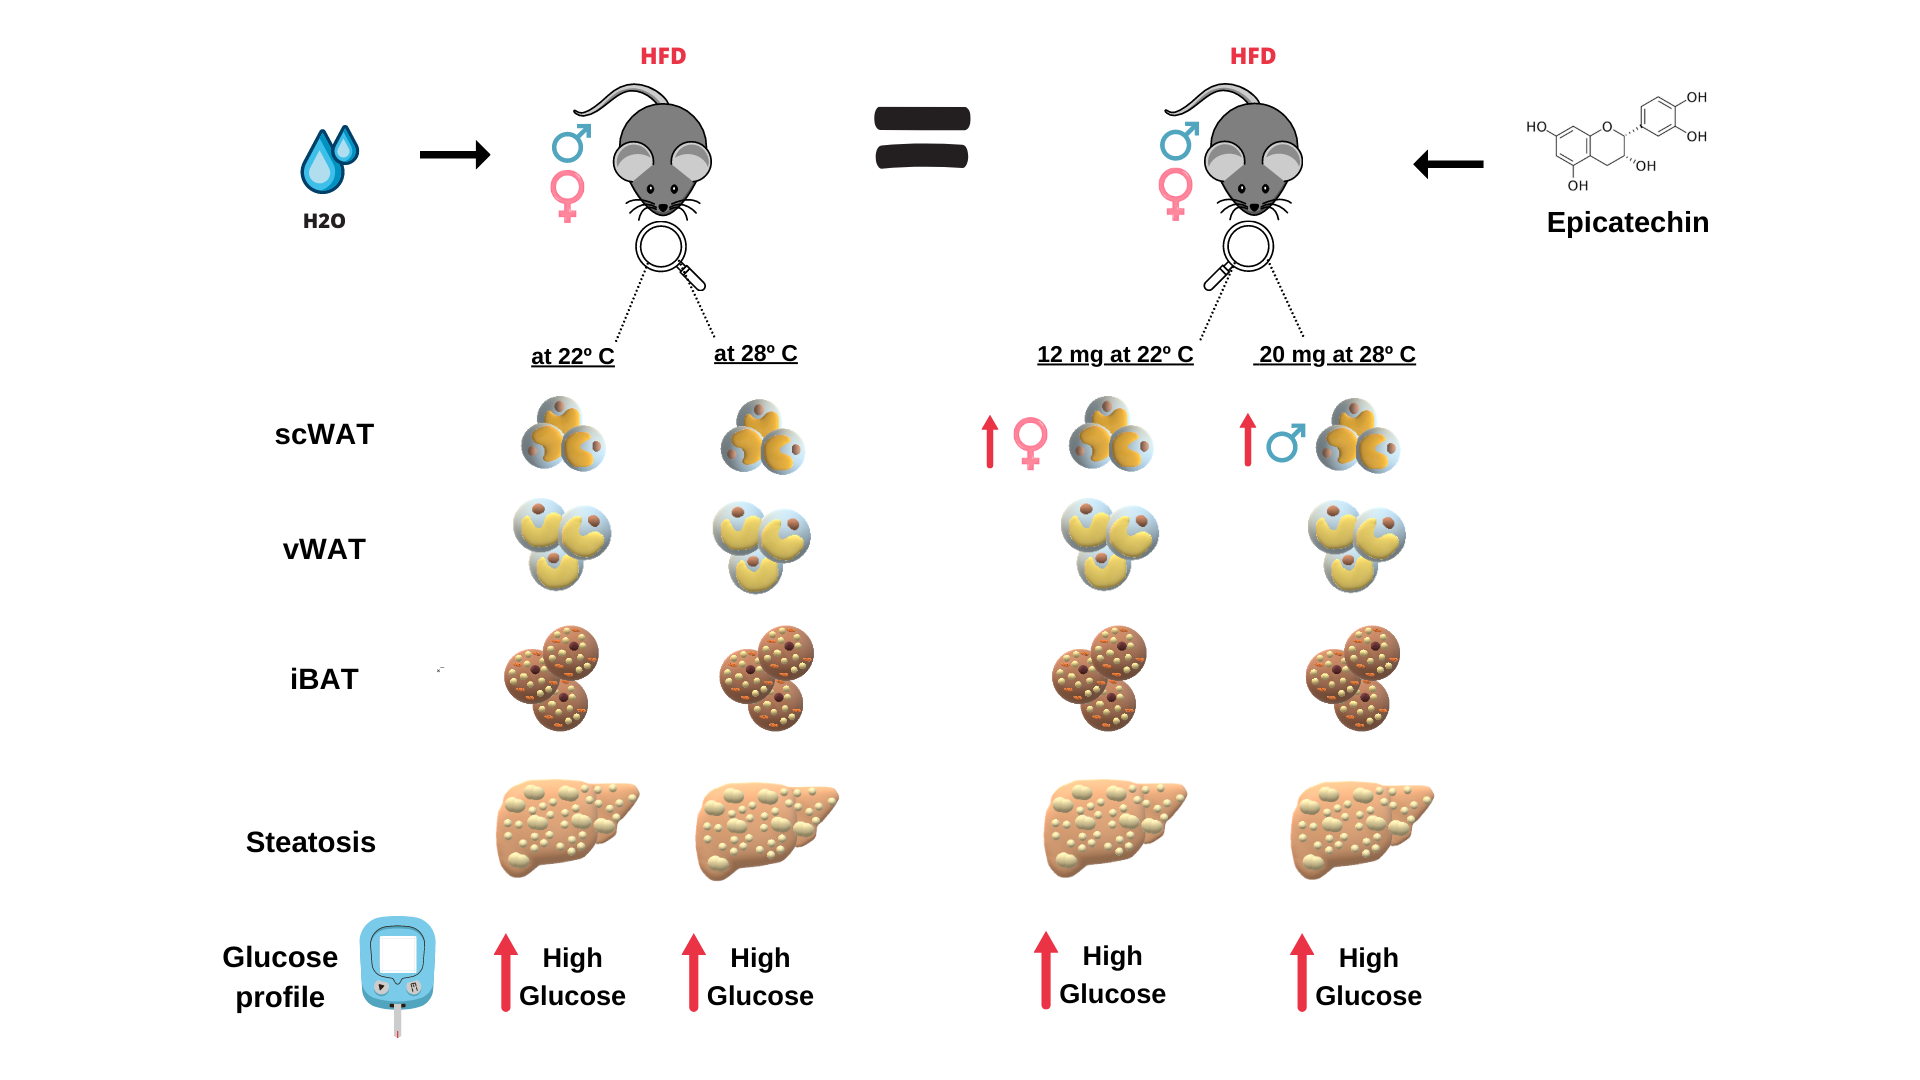
Recent reports have highlighted the potential anti-obesity effects of epicatechin (EC) in regulating metabolism. Most studies have primarily used rodent models housed at standard temperatures (ST) 22°C ± 2°C. However, these mice may experience chronic cold exposure at ST, which can influence energy metabolism. Housing mice at thermoneutrality (TN) 28°C ± 2°C could provide a more accurate representation of human temperature conditions. Additionally, many studies focus solely on male animals, overlooking the significance of considering sex differences in the investigation of physiological and metabolic dysregulation. In our trial, we used both male and female C57Bl/6 mice, including lean and obese individuals. The mice were treated with either 12 mg or 20 mg of EC/kg of body weight (administered by gavage) over 12 weeks, five days a week, and were housed at either ST or TN. Contrary to previous reports, we found no anti-obesity effects from EC in either male or female mice at both doses. The mice exhibited similar weight gain, adipose tissue sizes, biochemical profiles, and liver fat accumulation when compared to obese, untreated animals. Furthermore, obese male mice supplemented with 20 mg of EC and housed at TN showed increased subcutaneous white adipose tissue (scWAT) weight and worsened glucose tolerance compared to their non-EC-treated counterparts. In conclusion, epicatechin administered by gavage did not improve obesity, liver steatosis, or insulin resistance in either male or female obese mice housed at ST or TN. This suggests that the route of administration and the EC dosage could influence its anti-obesity effects.
Keywords:
Epicatechin
; polyphenols
; obesity
; thermoneutrality
; sex-dysmorphism
1. Introduction
Epicatechin (EC) is a type of polyphenolic compound that belongs to the flavan-3-ol class of flavonoids. It is primarily found in both green and black tea (Camellia sinensis), as well as in smaller concentrations in apples, oranges, pears, black grapes, blackberries, cherries, raspberries, hazelnuts, pecans, and red wine. Cacao has the highest epicatechin content, followed by broad bean pod (1). The chemical structure of epicatechin includes three hydrocarbon rings with six hydroxyl groups at different positions, which gives it important antioxidant activity (2). In vitro studies have shown that EC has antioxidant activity due to its ability to scavenge free radicals through multiple hydroxyl groups attached to phenolic groups. Additionally, EC has been studied for its various biological functions, including anti-proliferative, anti-inflammatory, antimicrobial, cardioprotective, anti-diabetic, anti-aging, and neuroprotective activities (3). Translation of these mechanisms into in vivo conditions in animal or human models is poorly available, but research in this area is ongoing (2).
Also, there is evidence suggesting that epicatechin may have anti-obesity effects (4). EC has been found to promote the appearance of “brown-like cells”. While brown adipose tissue (BAT) dissipates energy in the form of heat, white adipose tissue (WAT) accumulates fat. Thus, WAT beiging is considered a beneficial shift from an unhealthy to a metabolically “healthier” tissue. Both in mice fed a high-fat diet and in human adipocytes, EC supplementation upregulated genes involved in thermogenesis and fatty acid oxidation and mitigated WAT inflammation (4). Some studies have shown that the consumption of epicatechin-rich green tea is believed to increase metabolism in vivo and that the metabolic effects of epicatechin-rich green tea are related to weight loss (5-6). However, it is important to note that the exact mechanism by which epicatechin influences weight loss is still not clear, and further research is needed to fully understand its effects on obesity.
Our group has been studying the mechanisms by which green tea containing several catechins including EC promotes its anti-obesity effects (7–9). In some of the group’s studies, we have showed that EC has a greater binding capacity with PPARg and -a transcription factors (9) (10), which could be one of the mechanisms by which we observed a smaller amount of adipose tissue in obese mice and improvement in hepatic steatosis in mice supplemented with green tea. So, in the present study, we aimed to evaluate the ability of the flavonoid EC, isolated from green tea, in reducing obesity in mice fed with high-fat diet. We have evaluated the anti-obesity effect of EC in mice, distinguishing between male and female sexes and keeping them at thermoneutrality (TN). Thermoneutrality is the temperature of animals between 28 ± 2°C, which according to recent reports (11-12) may be the ideal temperature to translate the results obtained in mice to humans. Additionally, we have used EC administration by gavage, in contrast to previous studies, that have added EC to the animal’s feed. The dose of EC used was the same as in previous studies (20 mg/kg of body weight) although our protocol was a little longer than previously used (12 weeks). Overall, in this descriptive study we are showing that EC in both male and female mice kept at 28°C, at a dose of 20 mg/kg BW did not prevent body weight gain, and liver lipid accumulation while EC has increased WAT of obese mice worsting fasting glycemia and insulin resistance without signals of hepatic toxicity. Similar results were found in male and female mice kept at 22° using EC at 12mg/kg BW. We are herein contrasting previous studies that have shown the anti-obesity effects of EC. We are showing that the temperature at which the animals are kept, the route of EC administration, and the time of supplementation can significantly interfere with the outcome of the anti-obesity effects of EC and should be considered in future experiments.
2. Results
- Epicatechin did not prevent body weight gain in male and female mice housed at TN
Various studies have highlighted the anti-obesity effects of EC administration in mice and have sought to clarify the mechanisms behind these effects (13). Body weight (BW) was assessed weekly in both male and female mice supplemented with EC, which were kept at thermoneutrality (TN). The results showed no significant difference in body weight between the mice that received EC and those fed a standard chow diet or a high-fat diet (HFD), indicating that EC did not have an anti-obesity effect (Figure 1A). Although all animals started the experiment with the same weight, at the end of 16 weeks, both male and female mice from HFD and HFD+EC groups presented similar weight values (Figure 1B-C). Likewise, results from BW gain show that although HFD-fed groups presented increased mass when compared to chow-diet-fed mice, no differences were observed within the groups fed the same diet and supplemented or not with EC in both sexes (Figure 1D) confirming no EC effects in promoting BW loss. Food intake measured in grams was decreased in HFD group when compared to chow-fed male mice, while female mice fed a HFD and supplemented with EC showed an increase in food intake when compared to male animals from the same group (Figure 1E). Concerning kilocalories (kcal), food intake was increased in animals fed a HFD in both sexes when compared to chow-fed ones and higher in HFD+EC female than in male group (Figure 1F). The food efficiency coefficient (FEC) was evaluated to show if EC could be altering the efficiency of food ingested. FEC was higher in male and female mice fed an HFD when compared to chow-fed groups (Figure 1G). Also, it was calculated the weight gain by caloric consumption (WGCC) and again, both male and female mice presented higher values of WGCC in HFD-fed mice when compared to chow-fed ones (Figure 1H), with no positive effects of EC.
To evaluate if EC given at a dose of 20mg/Kg of BW could be toxic in some way we decided to supplement male and female mice with EC at 12 mg/Kg BW and keep mice at 22°C, trying to confirm the anti-obesity effect previously reported. However, again it was found that EC did not promote BW loss in male and female mice, thus promoting BW gain in male mice fed an HFD (Figure S1 A-C). That result suggests that the route of supplementation or a total period of 12 weeks could affect the EC effects against obesity in our model. Furthermore, food intake in kcal was increased in male mice fed an HFD and supplemented with EC when compared to the other experimental groups (Table S1). Female mice presented increased food intake in HFD-fed mice than in chow-fed ones, but decreased food intake in chow-fed and HFD+EC groups when compared to male animals (Table S1).
- Epicatechin did not mitigate tissue size while favoring scWAT deposition
Measurement of the relative size of the tissues among the groups confirmed the previous BW results showing HFD promoted an increase in all fat depots (vWAt, scWAT, and iBAT) when compared to chow-fed animals both in male and female mice (Figure 2A-C), with no reducing effects of EC. Those results reflected in an increased adiposity index in mice fed an HFD and no effects of EC (Figure 2D). Surprisingly, EC increased the relative weight of vWAT in male mice fed a chow diet (Figure 2A) while scWAT of HFD-fed male mice supplemented with EC was even higher than HFD group (Figure 2B). iBAT presented a higher relative weight in males when compared to female mice fed an HFD as well as it was increased by HFD in male mice when compared to chow-fed animals, with no differences among groups in female animals, denoting a sex effect in iBAT tissue size (Figure 2C). Concerning the weight of muscles, it was not observed differences among groups when weighting soleus, but a sex-difference was noticed between HFD+EC groups, with female-presenting heavier soleus muscle when compared to male mice (Figure 2E). No sex-differences were noticed by weighting gastrocnemius, although HFD-fed mice presented lower values when compared to chow-fed animals in both sexes (Figure 2F). Relative brain weight did not show differences among groups in male mice; however, it was decreased in HFD-fed animals when compared to the control group in female mice. Moreover, control group and HFD+EC group presented heavier brains in female when compared to male mice (Figure 2G). Liver-relative weight was lighter in female HFD-fed when compared to male HFD-fed mice and female chow-diet fed mice (Figure 2H), highlighting a gender effect.
Supplementing mice with a reduced dose of EC (12 mg/kg BW) and housing the animals at 22°C did not promote beneficial effects either. iBAT relative weight was higher in mice fed a HFD and supplemented with EC when compared to the control-male animals. As for female mice, both HFD-fed groups presented heavier iBAT when compared to chow-fed animals. However, both vWAT and scWAT of HFD-fed animals presented higher relative weight values when compared to chow-fed mice of both sexes; moreover, scWAT fat depot in HFD+EC female mice was even heavier than the HFD female group and the HFD+EC male group. Adiposity index reflected these results, being higher in HFD-fed animals than in chow-fed ones (Figure S2 A-D). Relative liver weight was lower in HFD-fed animals than chow-fed ones in both sexes and even lower when comparing HFD-fed groups in female to male mice (Figure S2 E). Relative hypothalamus weight although did not present differences among groups of the same sex, exhibited a heavier weight in EC-supplemented chow-fed animals and HFD groups in female rather than male mice (Figure S2 F). As for gastrocnemius, relative weight was not different between sexes, but both male and female presented lower values of this muscle in HFD-fed animals when compared to chow-fed ones (Figure S2 G). Likewise, relative soleus weight did not present sex-differences, although lower values were noticed in HFD-fed groups when compared to EC-supplemented chow-fed female mice.
- Epicatechin did not improve the glycemic profile of obese mice
Results from rodent model studies show an amelioration in insulin sensitivity promoted by EC, through its potential effect in regulating glucose metabolism (14). However, at TN, EC administration did not exhibit any efficacy in ameliorating insulin resistance in male and female HFD-fed mice, as both groups presented very similar levels of glycemia after insulin administration during ITT (Figure 3A-B). Moreover, the area under the curve of ITT shows no evidence of an EC effect in animals fed a chow diet or between animals fed an HFD (Figure 3C). After glucose administration for GTT, it was observed higher glucose levels in male mice fed an HFD and supplemented EC when compared to the control and HFD groups (Figure 3D) as well as the same group of female mice (Figure 3E-F). Similar results were seen in mice supplemented with 12mg/Kg of EC and kept at 22°C after GTT and ITT, with higher plasma glucose levels induced by HFD and no beneficial effect of EC in both, male and female mice (Figure S1 D-I).
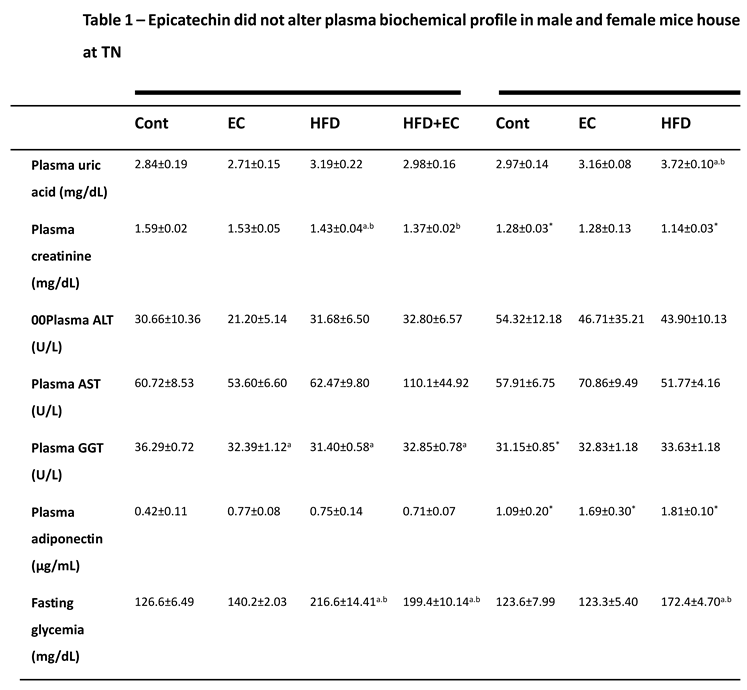
- Epicatechin did not alter plasma biochemical profile in male and female mice housed at TN
Exposing animals to a HFD and a housing condition of TN may exacerbate some features of obesity and thus, promote hepatic damage (15). By carrying out a plasmatic characterization in animals, it was observed higher levels of uric acid in female rather than male mice between groups fed a HFD and supplemented EC. Besides, although no differences among groups were noticed in male animals, HFD increased the levels of uric acid in female mice when compared to the control group (Table 1). Plasmatic creatinine assay surprisingly exhibited lower levels in male mice fed a HFD when compared to chow-fed animals, but when compared to the same HFD-fed groups, it was higher than in female mice. Besides, HFD plus EC group presented lower levels of creatinine when compared to HFD and chow-fed animals in female mice (Table 1). Plasmatic ALT did not show any differences among groups or sexes in mice; however, AST measurement revealed lower levels in the group fed a HFD and supplemented with EC when compared to chow-fed EC-supplemented animals (Table 1). Plasma Gamma-GT levels were decreased in HFD-fed and chow-fed EC-supplemented animals, when compared to the control group in male mice, while no differences among groups were found in female animals (Table 1). By supplementing animals with a lower dose of EC (12mg/kg) and housing them at 22°C, it was not observed differences among groups in male mice concerning ALT and AST, although lower values of ALT were noticed in chow-fed female when compared to male animals. Thus, HFD+EC female group presented increased levels of AST and gamma-GT when compared to chow-fed EC-supplemented animals (Table 1).
Obesity usually promotes adiponectin reduction while this adipokine affects positively liver metabolism having an important anti-inflammatory effect (16). We measured adiponectin plasma levels to evaluate if EC could have pro-obesity effects by reducing adiponectin plasma levels. Surprisingly, adiponectin presented higher levels in females when compared to male mice, besides an increase in the HFD+EC group being observed when compared to the control group in female animals (Table 1). EC as shown in different studies may alter glycemic profile to a more insulin-sensitive state, however, in both doses administrated to animals (12 and 20mg/kg) housed at TN or a standard temperature, there was no evidence of an improvement in fasting glycemia promoted by EC, as this parameter was similar to the HFD group (Table S1). Also, no sex-dependent effects were noticed (Table 1). Plasma triglycerides (TG) content was measured in animals supplemented with 12mg/Kg of EC and was observed an increase in the HFD group when compared to EC-supplemented male animals. On the other hand, the female HFD+EC group presented higher TG content when compared to chow-fed animals (Table S1). Plasma cholesterol levels were higher in male and female mice fed an HFD when compared to the control group (Table S1) with no positive effects of EC.
- Liver lipid accumulation was not prevented by EC supplementation
As obesity may lead to ectopic fat deposition, the liver is the first target that can be impaired in this scenario (17). Histological sections of liver tissue revealed that HFD-fed animals accused increased fat deposition when compared to chow-fed animals in both sexes while male mice presented greater fat accumulation within hepatocytes when compared to female animals, highlighting a sex effect in liver fat accumulation induced by HFD (Figure 4A). Macrovesicular steatosis analysis indicated greater content in HFD-fed animals when compared to chow-fed groups in male mice, while no group-differences were noticed in female animals (Figure 4B). Accordingly, microvesicular steatosis were highly presented in HFD-fed animals when compared to chow-fed ones, now in both analyzed sexes, but greater in male chow-fed EC-supplemented and HFD groups when compared to the same female groups (Figure 4C). Hepatocellular hypertrophy was greater in HFD-fed EC-supplemented animals when compared chow-fed animals in both sexes (Figure 4D). By performing the NAFLD activity score, achieved by the sum of all three previously described parameters, it is further demonstrated that EC did not reduce the fat liver accumulation induced by HFD in female and male animals (Figure 4B), suggesting that in green tea extract, EC is probably not responsible for the beneficial effects of reducing liver steatosis.
- Epicatechin administration did not affect energy expenditure in male and female mice housed at standard temperature
While many reports highlight the energy expenditure promoted by administering green tea, isolated epicatechin (EC) at a dose of 12 mg/kg did not induce energy expenditure in animals housed at 22°C. Furthermore, there were no significant differences in VO2 or VCO2 intensity among the groups during the 24-hour evaluation period for either sex (refer to Figure S2 I-L), suggesting that EC does not have beneficial effects on reducing obesity. In terms of heat intensity, female animals in the high-fat diet (HFD) group exhibited higher heat levels compared to those in the control and EC groups. However, no differences were observed among the male mice across the groups (refer to Figure S2 M-N).
3. Discussion
While previous studies have highlighted the promising effects of epicatechin in enhancing lipid metabolism and combating obesity (2–6), our current research presents a different narrative. It is vital to clarify that this study serves as a descriptive report, not delving into the mechanisms behind our primary findings. Still, we propose a potential explanation for the obesogenic effects of epicatechin (EC). In our experiments, we observed that both male and female mice, whether housed at standard temperature (ST) or in thermoneutral conditions (TN), exhibited similar weight gain when treated with either 12 or 20 mg/kg of EC through intragastric gavage. This consistent outcome after 16 weeks suggests that the route of EC administration plays a crucial role in its effectiveness against obesity, irrespective of dose, temperature, or sex. Furthermore, we found that none of these variables—dose, temperature, or sex—resulted in any improvement in insulin resistance due to high-fat diet-induced obesity, as shown by the insulin tolerance test (ITT). Alarmingly, glucose tolerance decreased further in male obese mice receiving EC while housed in TN, evidenced by the glucose tolerance test (GTT). These results not only emphasize the importance of how EC is administered but also reveal that the method can counteract or even undermine its supposed benefits in regulating insulin and glucose pathways. This calls for a reevaluation of how we view epicatechin’s role in obesity management.
Overweight and obesity have become alarming health issues worldwide in the last decades, mainly due to the comorbidities related to excessive body weight, such as insulin resistance, type II diabetes mellitus (T2DM), hypertension and cardiovascular diseases, non-alcoholic fatty liver disease (NAFLD), depression, anxiety, memory impairment and cancer, among others (18,19). In this regard and considering the limited treatment options for obesity, much effort has been driven in order to find bioactive compounds from natural sources that could potentially treat diseases of metabolic-dysregulation course. Flavan-3-ol (−)-epicatechin has shown significant improvement in obesity-related disorders, as shown by the studies of Cremonini et al., 2016, Bettaieb et al., 2016 and Sano et al., 2017 (20–22), which used dietary EC supplementation to treat mice fed a high-fat diet (HFD) and evidenced anti-obesity and anti-inflammatory effects and insulin sensitivity improvement through modulations of inflammatory and oxidative stress markers and of key enzymes of the insulin pathway. In both studies from Cremonini et al. and Bettaieb et al., male mice were fed a HFD supplemented with EC at a dose of 20mg/kg during a 15-week trial, while Sano et al. fed male mice a HFD supplemented with 200mg/kg of EC over 12 weeks, being all experiments conducted at ST. It is important to highlight that route of administration of EC in our study was distinctive from these authors.
Litterio et al., 2015 (23) by using EC-supplemented high-fructose-fed male rats have shown blood pressure lowering through an increase of nitric oxide synthase (NOS) promoted by 20mg/kg of EC, preventing hypertension progress after an 8-week treatment. In addition, Hid et al.,2020 (24) using the same dose of 20mg/kg added to the HFD of male mice for 15 weeks, observed an increase of uncoupling protein 1 (UCP1) levels promoted by EC, which ultimately prevented the whitening of perivascular adipose tissue in the thoracic aorta, plus mitigated the increase of plasma cholesterol and glucose. EC beneficial effects were also evaluated in the nervous system in a study from Kang et al., 2020 (25). The authors have shown that feeding male mice a HFD during a 13-week period and supplementing animals with EC at a dose of 20mg/kg of body weight at ST, improved short-term recognition memory by preventing neuroinflammation and endotoxemia. Another study from Kang et al.,2022 (26), has also evidenced anxiety related-behaviour mitigation and gut microbiota modulations of EC (2 or 20mg/kg during a 24-week trial) in obese mice, in a dose-dependent manner. All studies previously mentioned have utilized EC added to the diet in order to test its potential beneficial effects, reinforcing that our contrasting results could be a result of the route of EC supplementation.
Non-alcoholic fatty liver disease (NAFLD) is a liver disorder characterized by massive deposition of triglycerides (TG) within hepatocytes and is also closely related to obesity, as one of its main comorbidities. It encompasses the stage of steatosis and non-alcoholic steatohepatitis (NASH) and may even progress to cirrhosis, an irreversible stage of liver damage (27). Hidalgo et al., 2020 (28) has shown that the EC-treatment at a dose of 1mg/kg given by gavage during 9 weeks in a NASH-model of male mice housed at ST and fed a Paygen-type diet+fructose 30%, decreased the plasma content of TG and low-density lipoprotein (LDL) and the activity of ALT and alkaline phosphatase (ALKP), in addition to promoting smaller lipid droplets in hepatocytes and decreased collagen deposition and inflammation in hepatic tissue. Cheng et al.,2017 (29) by supplementing by gavage male rats along 12 weeks with EC at doses of 10, 20 and 40mg/kg has also shown liver steatosis and biochemical profile improvement in treated animals, through a possible regulation of lipid metabolism pathways. Conversely, when analysing liver histology of animals housed at TN, we observed a clear similarity of the hepatic phenotype of treated and untreated animals, with HFD-fed showing greater fat deposition in relation to chow-fed mice, but once again no protective effects of EC were evidenced. Furthermore, in plasma, EC did not promote positive modulation of enzymes related to liver damage, such as ALT, AST and GGT, at all temperatures, sexes and doses analysed. Considering that EC-obesogenic effects could involve a decrease in adiponectin plasma levels, we also measured adiponectin in the plasma of mice. Adiponectin roles are associated with various metabolic pathways regulation, such as lipid and carbohydrate metabolism, insulin sensitization, plus exerting an anti-inflammatory action, which ultimately may improve obesogenic deleterious outcomes, as preventing liver steatosis and insulin resistance (16). Surprisingly, at TN, it was observed an increase in plasma adiponectin level in obese female mice treated with EC, an isolated positive finding, but with little or no effect on the general physiological condition of the animals.
Ultimately, the lack of positive effects and even the promotion of some deleterious conditions evidenced in EC-treated animals remained independent of dose and were seem in both male and female mice, regardless of animals’ housing temperature. On the other hand, we do not rule out the hypothesis that possibly lower EC doses may promote beneficial effects in the context of obesity and/or insulin resistance, but we emphasize that the route of administration by gavage used herein may be determinant in the observation of such contrasting effects and, as such, should be taken into account in studies involving animal models supplemented with EC. Further investigation is necessary to confirm the main findings of our study as well as to elucidate the mechanisms underlying them.
4. Materials and Methods
Animals and Epicatechin supplementation
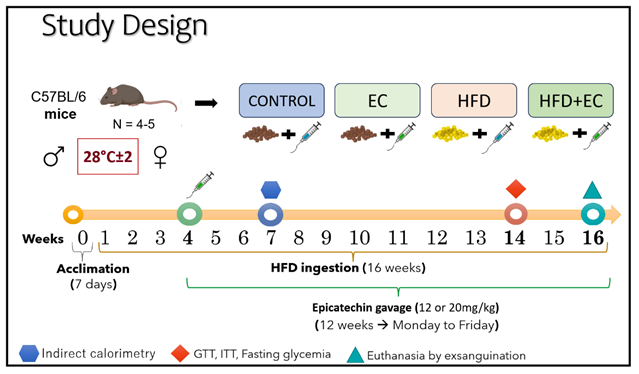
Two-month-old male and female C57Bl/6 mice were obtained from the University of São Paulo (USP, Brazil). Mice were kept either at a standard temperature (ST - 22±2°C) or at thermoneutrality (TN - 28±2°C), under a lightening cycle of 12/12 hours and had access to food and water ad libitum during all the experimental period of 16 weeks. The experimental protocol was carried out twice with a total of 10 animals per group (4-5 mice/group in each independent protocol). The number of mice/groups was based on studies showing that 6 animals/group has sufficient statistical strength [24]. For each analysis conducted mice were randomly chosen (the N used is indicated in the legends of the figures). Mice were divided into the following groups: (I) Control - Cont (standard chow diet + gavage with water); (II) EC (standard chow diet + gavage with EC), (III) High-fat diet (HFD + gavage with water); and (IV) HFD+EC (HFD + gavage with EC), for both male and female mice. After 1 week of acclimation and 4 weeks of obesity induction, the animals started being supplemented with the aqueous extract of EC at a dose of 12 or 20 mg/kg of body weight (BW), which was daily administrated by gavage during 12 weeks between 5:30-6:00h p.m (Study design). The dose of EC in the present study was previously used in mouse model (13). Epicatechin, 90% pure from Camellia sinensis, purchased from PHD Innovation Expertise (Sao Paulo, Brazil) was daily weighed and freshly prepared using tap water heated at 70°C for 5 minutes and shaken to homogenization in a vortex. Mouse standard chow diet consisted of 22% protein, 43.5% of carbohydrates, and 4% lipids (2.88kcal/g). HFD (Prag Soluções, Sao Paulo, Brazil) was composed of 15.18% protein, 24.63% carbohydrates, and 57.20% lipids (5.35cal/g).
All procedures in the present study followed the ethical principles of animal experimentation as indicated by the Ethics Committee for animal experimentation 001_2021 at Cruzeiro do Sul University.
Fasting Glycemia, Glucose Tolerance Test (GTT) and Insulin Tolerance Test (ITT)
One week before euthanasia, animals were subjected to 8 hours of fasting before undergoing a glucose tolerance test (GTT) by monitoring plasma glucose after intraperitoneal glucose administration (1g glucose/kg of body weight). Two days later, in the same week, an insulin tolerance test (ITT) was performed on animals after 6h of fasting by measuring plasma glucose concentration after intraperitoneal administration of insulin (Humulin R, Lilly, 0.5 IU/kg body weight). Both assays were performed at room temperature as described in our previous study [24].
Indirect calorimetry
Whole-body oxygen consumption was evaluated with an open-circuit indirect calorimetry system (Columbus Instruments, Ohio, USA, Oximax model). Mice were acclimatized for 24 h in individual cages under a light/dark 12 h cycle, with free access to water and food in respiration chambers, and data were recorded for 24 h at 22°C housing temperature.
Food Efficiency Coefficient and Weight Gain by Caloric Consumption
It was measured the Food efficiency coefficient (FEC) and Weight gain by caloric consumption (WGCC). FEC was obtained as a relation between weight gain by amount of food consumed: FEC= (Final Weight−Initial Weight)/Total Food ingested in the period in grams), while WGCC was calculated as the result of Final Weight−Initial Weight/total kcal ingested.
Evaluation of liver histology
Once the experimental protocol was over, animals were euthanized by exsanguination under rapid anaesthesia by inhalation of isoflurane between 9:00k and 12:00h a.m. at room temperature. Blood samples from heart chambers were punctured and drawn into heparinized tubes and centrifuged for 10 minutes at 1200×g, and plasma was stored at −80°C, until the subsequent analysis. Livers were harvested, weighed, and stored at –80°C.
For histological analyses the hepatic tissue was freshly fixed in 4% phosphate-buffered paraformaldehyde for 24h. Fixed samples were dehydrated by sequentially increased ethanol concentrations, cleared in xylene, and then embedded in paraffin wax. The embedded samples were cut into 5µm sections and stained with hematoxylin and eosin (H&E). For analysis of the histological sections, the NAFLD activity score (NAS) was used in order to determine the level of steatosis by analysing the amount of hepatocellular vesicular steatosis (macrovesicular and microvesicular steatosis) and hepatocellular hypertrophy using a 40x magnification, analysing at least ten different fields and ranking them according to the severity of the steatosis. Inflammation was analysed by counting inflammatory foci per field, on at least 5 different fields, considering 5 or more immune cells in a cluster as a foci and using a 100x magnification [29].
The relative weight of subcutaneous WAT (scWAT), visceral WAT (vWAT), iBAT (interscapular brown adipose tissue), soleus, gastrocnemius, brain (hypothalamus), and liver tissues were presented as the result of the weight of the tissue divided by final body weight of each animal. This strategy was used to compare the effects between male with female mice considering that male mice are heavier than female ones. Adiposity index was obtained by the sum of all fat depots (vWAT, scWAt and iBAT) from the same mouse. Cholesterol and triglyceride contents in plasma were measured with enzymatic kits (Bioclin, MG, Brazil) and expressed as mg cholesterol or triglyceride per dL. The level of adiponectin was determined using an ELISA-based method in accordance with the manufacturer’s instructions (R&D System, USA). GGT- Gamma-glutamyl transferase, AST- aspartate aminotransferase, and ALT- alanine aminotransferase plasma levels were measured with enzymatic kits (Labtest, MG, Brazil) and expressed as mU/mL. Uric acid and creatinine plasma levels were measured with enzymatic kits (Labtest, MG, Brazil) and expressed as mg/dL.
Statistical analysis
Results are given as mean ± standard error of the mean (SEM). The Shapiro-Wilk and Levene tests were used to verify the normality and variance of the data, respectively, assuming a p<0.05. For the statistical analysis of the tests, the One-Way ANOVA test was used between the groups, using Tukey as a post-test (p<0.05), and in the analysis between the respective groups in the standard and thermoneutral temperatures, the t test was performed. All statistical analyses were performed using the Graph Pad Prism software for Windows (GraphPad Software, San Diego, CA, USA).
Supplementary Materials
The following supporting information can be downloaded at the website of this paper posted on Preprints.org. Figure S1: Male and female mice housed at ST and supplemented with EC at 12mg/kg of BW do not show body weight or glycemic profile alterations. ; Figure S2: Supplementing male and female mice with EC at 12 mg/kg of BW did not promote tissue weight loss or energy expenditure improvements.
Author Contributions
Victória Silva, Celso Pereira Batista Sousa-Filho and Rosemari Otton contributed to the study conception and design. Material preparation, data collection and analysis were performed by Victória Silva, Celso Pereira Batista Sousa-Filho, and Caroline de Paula França. The first draft of the manuscript was written by Victória Silva and Rosemari Otton and all authors commented on previous versions of the manuscript. All authors read and approved the final version of the manuscript.
Funding
This research was supported by the São Paulo Research Foundation (FAPESP, processes no. 2019/10616-5 and 2021/08498-4), Coordenação de Aperfeiçoamento de Pessoal de Nível Superior (CAPES)—Finance Code 001, Conselho Nacional de Desenvolvimento Científico e Tecnológico (CNPq) – Finance Code 302986/2021-9, and Cruzeiro do Sul University.
Institutional Review Board Statement
All mice were treated humanely with regard to prevention and alleviation of suffering, in compliance with Brazil law. The study was approved by the Research Ethics Committee on the Use of Animals of the Cruzeiro do Sul University (CEUA Universidade Cruzeiro do Sul nº 001/2021).
Data Availability Statement
Data will be available under the request.
Conflicts of Interest
All authors of the present manuscript declare that there is no actual or potential conflict of interest including any financial, personal, or other relationships with other people or organizations that could inappropriately influence or be perceived to influence our work.
References
- Ze Xu, J.; Venus Yeung, S.Y.; Chang, Q.; Huang, Y.; Chen Z-Y. Comparison of antioxidant activity and bioavailability of tea epicatechins with their epimers. Br J Nutr. 2004, 91, 873–881. [Google Scholar] [CrossRef] [PubMed]
- Cremonini, E.; Iglesias, D.E.; Kang, J.; Lombardo, G.E.; Mostofinejad, Z.; Wang, Z.; et al. (−)-Epicatechin and the comorbidities of obesity. Arch Biochem Biophys. 2020, 690. [Google Scholar] [CrossRef] [PubMed]
- Si, H.; Wang, X.; Zhang, L.; Parnell, L.D.; Admed, B.; LeRoith, T.; et al. Dietary epicatechin improves survival and delays skeletal muscle degeneration in aged mice. FASEB Journal 2019, 33, 965–977. [Google Scholar] [CrossRef] [PubMed]
- Varela, C.E.; Rodriguez, A.; Romero-Valdovinos, M.; Mendoza-Lorenzo, P.; Mansour, C.; Ceballos, G.; et al. Browning effects of (-)-epicatechin on adipocytes and white adipose tissue. Eur J Pharmacol. 2017, 811, 48–59. [Google Scholar] [CrossRef]
- Abdulkhaleq, L.A.; Assi, M.A.; Noor MHM, Abdullah, R. ; Saad, M.Z.; Taufiq-Yap YH. Therapeutic uses of epicatechin in diabetes and cancer. Vet World [Internet] 2017, 10, 869 Available from: /pmc/articles/PMC5591471/ [cited 2023 Aug 14]. [Google Scholar]
- Prakash, M.; Basavaraj B, V. , Chidambara Murthy KN. Biological functions of epicatechin: Plant cell to human cell health. J Funct Foods [Internet] 2019, 52, 14–24 Available from:. [Google Scholar] [CrossRef]
- Otton, R.; Bolin, A.P.; Ferreira, L.T.; Marinovic, M.P.; Rocha ALS, Mori MA. Polyphenol-rich green tea extract improves adipose tissue metabolism by down-regulating miR-335 expression and mitigating insulin resistance and inflammation. J Nutr Biochem. 2018, 57, 170–179. [Google Scholar] [CrossRef]
- Ferreira, L.T.; de Sousa Filho CPB, Marinovic, M. P.; Rodrigues, A.C.; Otton R. Green tea polyphenols positively impact hepatic metabolism of adiponectin-knockout lean mice. J Funct Foods 2020, 64, 103679. [Google Scholar] [CrossRef]
- Bolin, A.P. ; Sousa-Filho CPB, dos Santos GTN, Ferreira, L.T.; de Andrade PBM, Figueira ACM, et al. Adipogenic commitment induced by green tea polyphenols remodel adipocytes to a thermogenic phenotype. J Nutr Biochem. [CrossRef]
- Marinovic, M.P.; Pereira, C.; Sousa-Filho, B.; Aparecida, F.; Batista, H.; Mendonca Avelino, T.; et al. Green tea extract increases adiponectin and PPAR a; levels to improve hepatic steatosis. J Nutr Biochem. 2022, 103, 108957. [Google Scholar] [CrossRef]
- Keijer, J.; Li, M.; Speakman, JR. What is the best housing temperature to translate mouse experiments to humans? Mol Metab. 2019, 25, 168–176. [Google Scholar] [CrossRef]
- Fischer, A.W.; Cannon, B.; Nedergaard, J. Optimal housing temperatures for mice to mimic the thermal environment of humans: An experimental study. Mol Metab. 2018, 7, 161–170. [Google Scholar] [CrossRef]
- Cremonini, E.; Bettaieb, A.; Haj, F.G.; Fraga, C.G.; Oteiza, PI. (−)-Epicatechin improves insulin sensitivity in high fat diet-fed mice☆. 2017.
- Cremonini, E.; Fraga, C.G.; Oteiza, PI. (–)-Epicatechin in the control of glucose homeostasis: Involvement of redox-regulated mechanisms. Free Radic Biol Med. 2019, 130, 478–488. [Google Scholar] [CrossRef] [PubMed]
- Silva, V.; Faria HOF, Sousa-Filho CPB, de Alvarenga JFR, Fiamoncini, J. ; Otton R. Thermoneutrality or standard temperature: is there an ideal housing temperature to study the antisteatotic effects of green tea in obese mice? J Nutr Biochem. 2023, 120, 109411. [Google Scholar] [CrossRef] [PubMed]
- Thi Mong Diep Nguyen. Adiponectin: Role in Physiology and Pathophysiology. <i>Int J Prev Med</i>. 2020, 8. Thi Mong Diep Nguyen. Adiponectin: Role in Physiology and Pathophysiology. Int J Prev Med. [CrossRef]
- Van De Wier, B.; Koek, G.H.; Bast, A.; Haenen GRMM. The potential of flavonoids in the treatment of non-alcoholic fatty liver disease. Crit Rev Food Sci Nutr. 2017, 57, 834–855. [Google Scholar] [CrossRef] [PubMed]
- Upadhyay, J.; Farr, O.; Perakakis, N.; Ghaly, W.; Mantzoros, C. Obesity as a Disease. Med Clin [Internet] 2018, 102, 13–33 Available from: http://wwwmedicaltheclinicscom/article/S0025712517301281/fulltext [cited 2022 Nov 28]. [Google Scholar] [CrossRef]
- Chooi, Y.C.; Ding, C.; Magkos, F. The epidemiology of obesity. Metabolism 2019, 92, 6–10. [Google Scholar] [CrossRef]
- Cremonini, E.; Bettaieb, A.; Haj, F.G.; Fraga, C.G.; Oteiza, PI. (-)-Epicatechin improves insulin sensitivity in high fat diet-fed mice. Arch Biochem Biophys. 2016, 599, 13–21. [Google Scholar] [CrossRef]
- Bettaieb, A.; Cremonini, E.; Kang, H.; Kang, J.; Haj, F.G.; Oteiza, PI. Anti-inflammatory actions of (−)-epicatechin in the adipose tissue of obese mice. Int J Biochem Cell Biol. 2016, 81, 383–392. [Google Scholar] [CrossRef]
- Sano, T.; Nagayasu, S.; Suzuki, S.; Iwashita, M.; Yamashita, A.; Shinjo, T.; et al. Epicatechin downregulates adipose tissue CCL19 expression and thereby ameliorates diet-induced obesity and insulin resistance. Nutr Metab Cardiovasc Dis. 2017, 27, 249–259. [Google Scholar] [CrossRef]
- Litterio, M.C.; Vazquez Prieto, M.A.; Adamo, A.M.; Elesgaray, R.; Oteiza, P.I.; Galleano, M.; et al. (−)-Epicatechin reduces blood pressure increase in high-fructose-fed rats: effects on the determinants of nitric oxide bioavailability. J Nutr Biochem. 2015, 26, 745–751. [Google Scholar] [CrossRef]
- Hid, E.J.; Fischerman, L.; Piotrkowski, B.; Litterio, M.C.; Fraga, C.G.; Galleano, M. (−)-Epicatechin protects thoracic aortic perivascular adipose tissue from whitening in high-fat fed mice. Food Funct [Internet] 2020, 11, 5944–5954 Available from: https://pubsrscorg/en/content/articlehtml/2020/fo/d0fo01148g [cited 2023 Aug 15]. [Google Scholar] [CrossRef] [PubMed]
- Kang, J.; Wang, Z.; Oteiza, PI. (−)-Epicatechin mitigates high fat diet-induced neuroinflammation and altered behavior in mice. Food Funct [Internet] 2020, 11, 5065–5076 Available from: https://pubsrscorg/en/content/articlehtml/2020/fo/d0fo00486c [cited 2023 Aug 15]. [Google Scholar] [CrossRef] [PubMed]
- Kang, J.; Wang, Z.; Cremonini, E.; Le Gall, G.; Pontifex, M.G.; Muller, M.; et al. (-)-Epicatechin mitigates anxiety-related behavior in a mouse model of high fat diet-induced obesity. J Nutr Biochem. 2022, 110, 109158. [Google Scholar] [CrossRef] [PubMed]
- Cobbina, E.; Akhlaghi, F. Non-Alcoholic Fatty Liver Disease (NAFLD) - Pathogenesis, Classification, and Effect on Drug Metabolizing Enzymes and Transporters. Drug Metab Rev [Internet] 2017, 49, 197 Available from: /pmc/articles/PMC5576152/ [cited 2021 Nov 23]. [Google Scholar] [CrossRef]
- Hidalgo, I.; Nájera, N.; Meaney, E.; Pérez-Durán, J.; Valdespino-Vazquez, Y.; Villarreal, F.; et al. Effects of (−)-epicatechin on the time course of the expression of perilipins in a diet-induced model of nonalcoholic steatohepatitis. J Nutr Biochem. 2020, 77, 108296. [Google Scholar] [CrossRef] [PubMed]
- Cheng, H.; Xu, N.; Zhao, W.; Su, J.; Liang, M.; Xie, Z.; et al. (-)-Epicatechin regulates blood lipids and attenuates hepatic steatosis in rats fed high-fat diet. Mol Nutr Food Res [Internet]. 2017, 61, 1700303 Available from: https://onlinelibrarywileycom/doi/full/101002/mnfr201700303 [cited 2023 Aug 15]. [Google Scholar] [CrossRef]
Figure 1.
Male and female C57BL/6 mice were housed at thermoneutrality and supplemented with 20mg/kg of EC by gavage (n = 4-5 animals per group). (A) Male and female body weight evaluation (grams) during 16 weeks of the experiment. (B) Weight of male and (C) female mice at the experiment’s beginning and end. (D) Male and female total body weight gain in grams. (E) Male and female food intake evaluation in grams per animal per day. (F) Male and female food intake evaluation in kcal per animal per day. (G) Male and female food efficiency coefficient (FEC). (H) Male and female weight gain by caloric consumption (WGCC). Results are presented as mean ± SEM. ANOVA one-way and Student’s t-test were used for all the statistical analyses. For ANOVA one-way, a = statistical difference compared to the Cont group, b = statistical difference compared to the EC group, and c = statistical difference compared to the HFD group, respectively, p<0.05. For t-test analyses between sexes, the p values are indicated in the Figure.
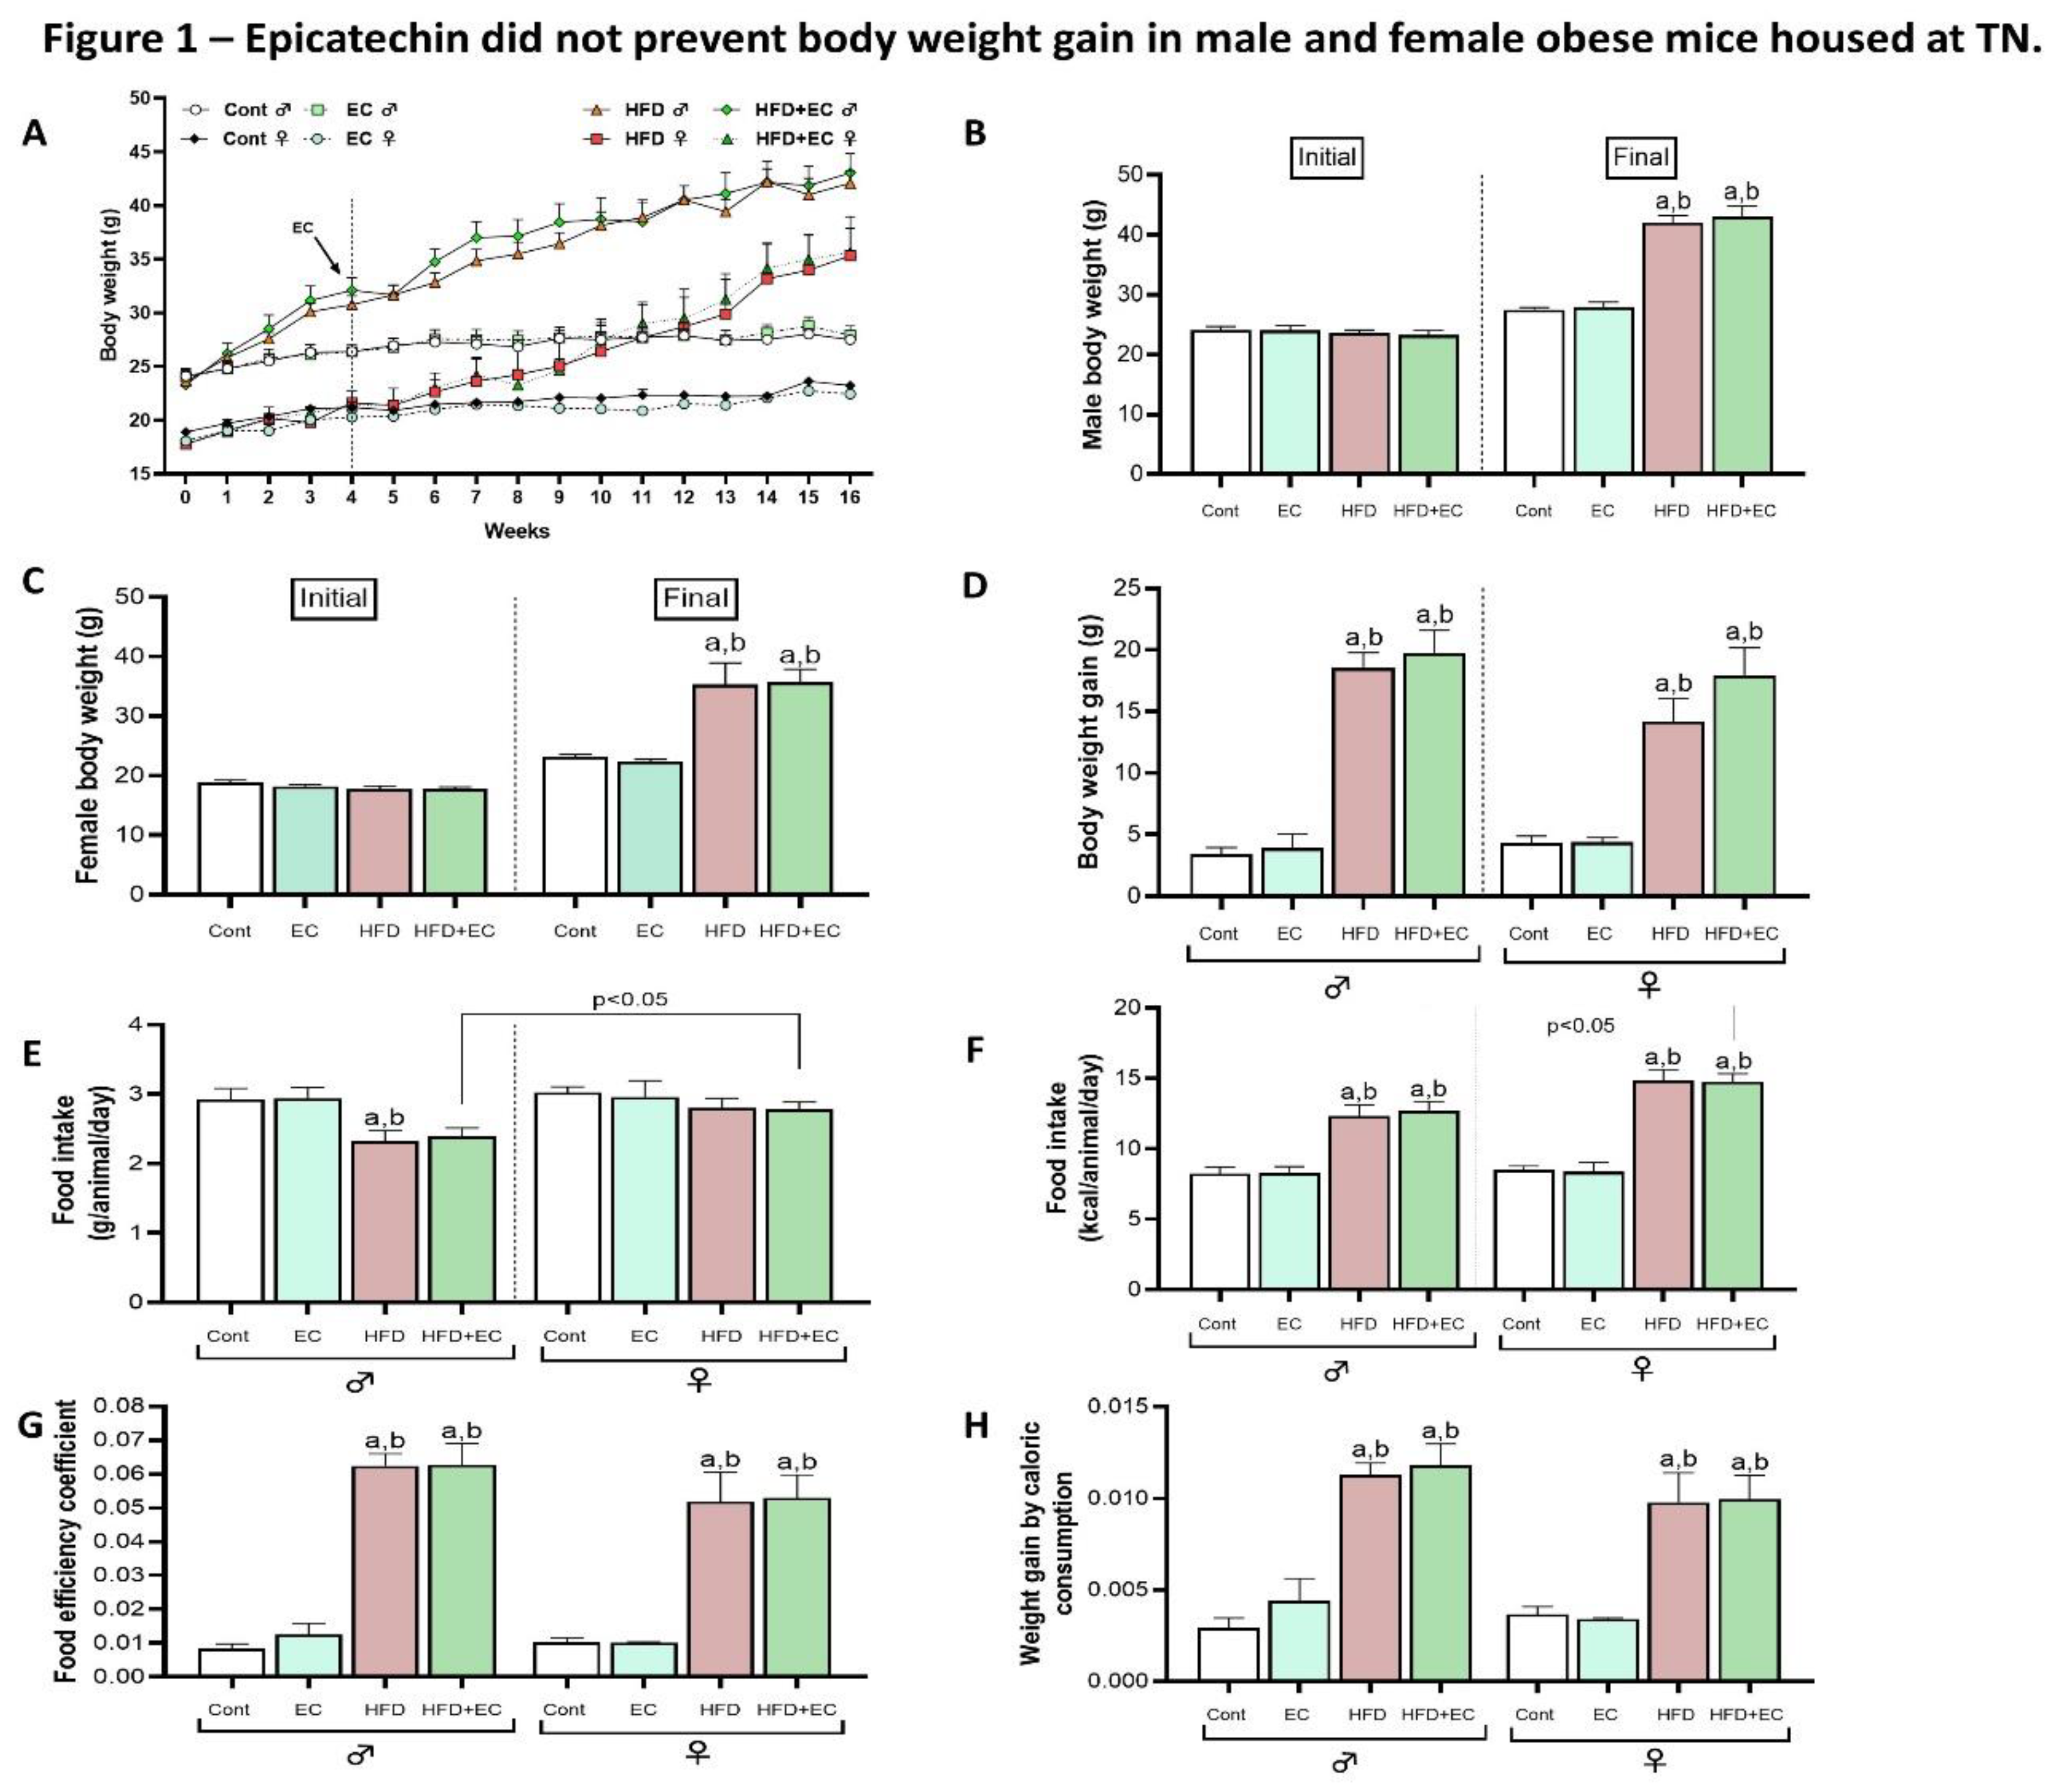
Figure 2.
Male and female relative weight of harvested tissues (n=4-5 animals per group). (A) Relative vWAT weight represented as the ration of vWAT to body weight. (B) Relative scWAT weight represented as the ration of scWAT to body weight. (C) iBAT weight represented as the ration of iBAT to body weight. (D) Adiposity index as the sum of vWAT, scWAT and iBAT weights. (E) Relative soleus weight represented as the ration of soleus to body weight. (F) Relative gastrocnemius weight represented as the ration of gastrocnemius to body weight. (G) Relative brain weight represented as the ration of brain to body weight. (H) Relative liver weight represented as the ration of liver to body weight. Results are presented as mean ± SEM. ANOVA one-way and Student’s t-test were used for all the statistical analysis. For ANOVA one-way, a = statistical difference compared to the Cont group, b = statistical difference compared to the EC group and c = statistical difference compared to the HFD group, respectively, with p<0.05. For t-test analyses between sexes, the p values are indicated in the figure.
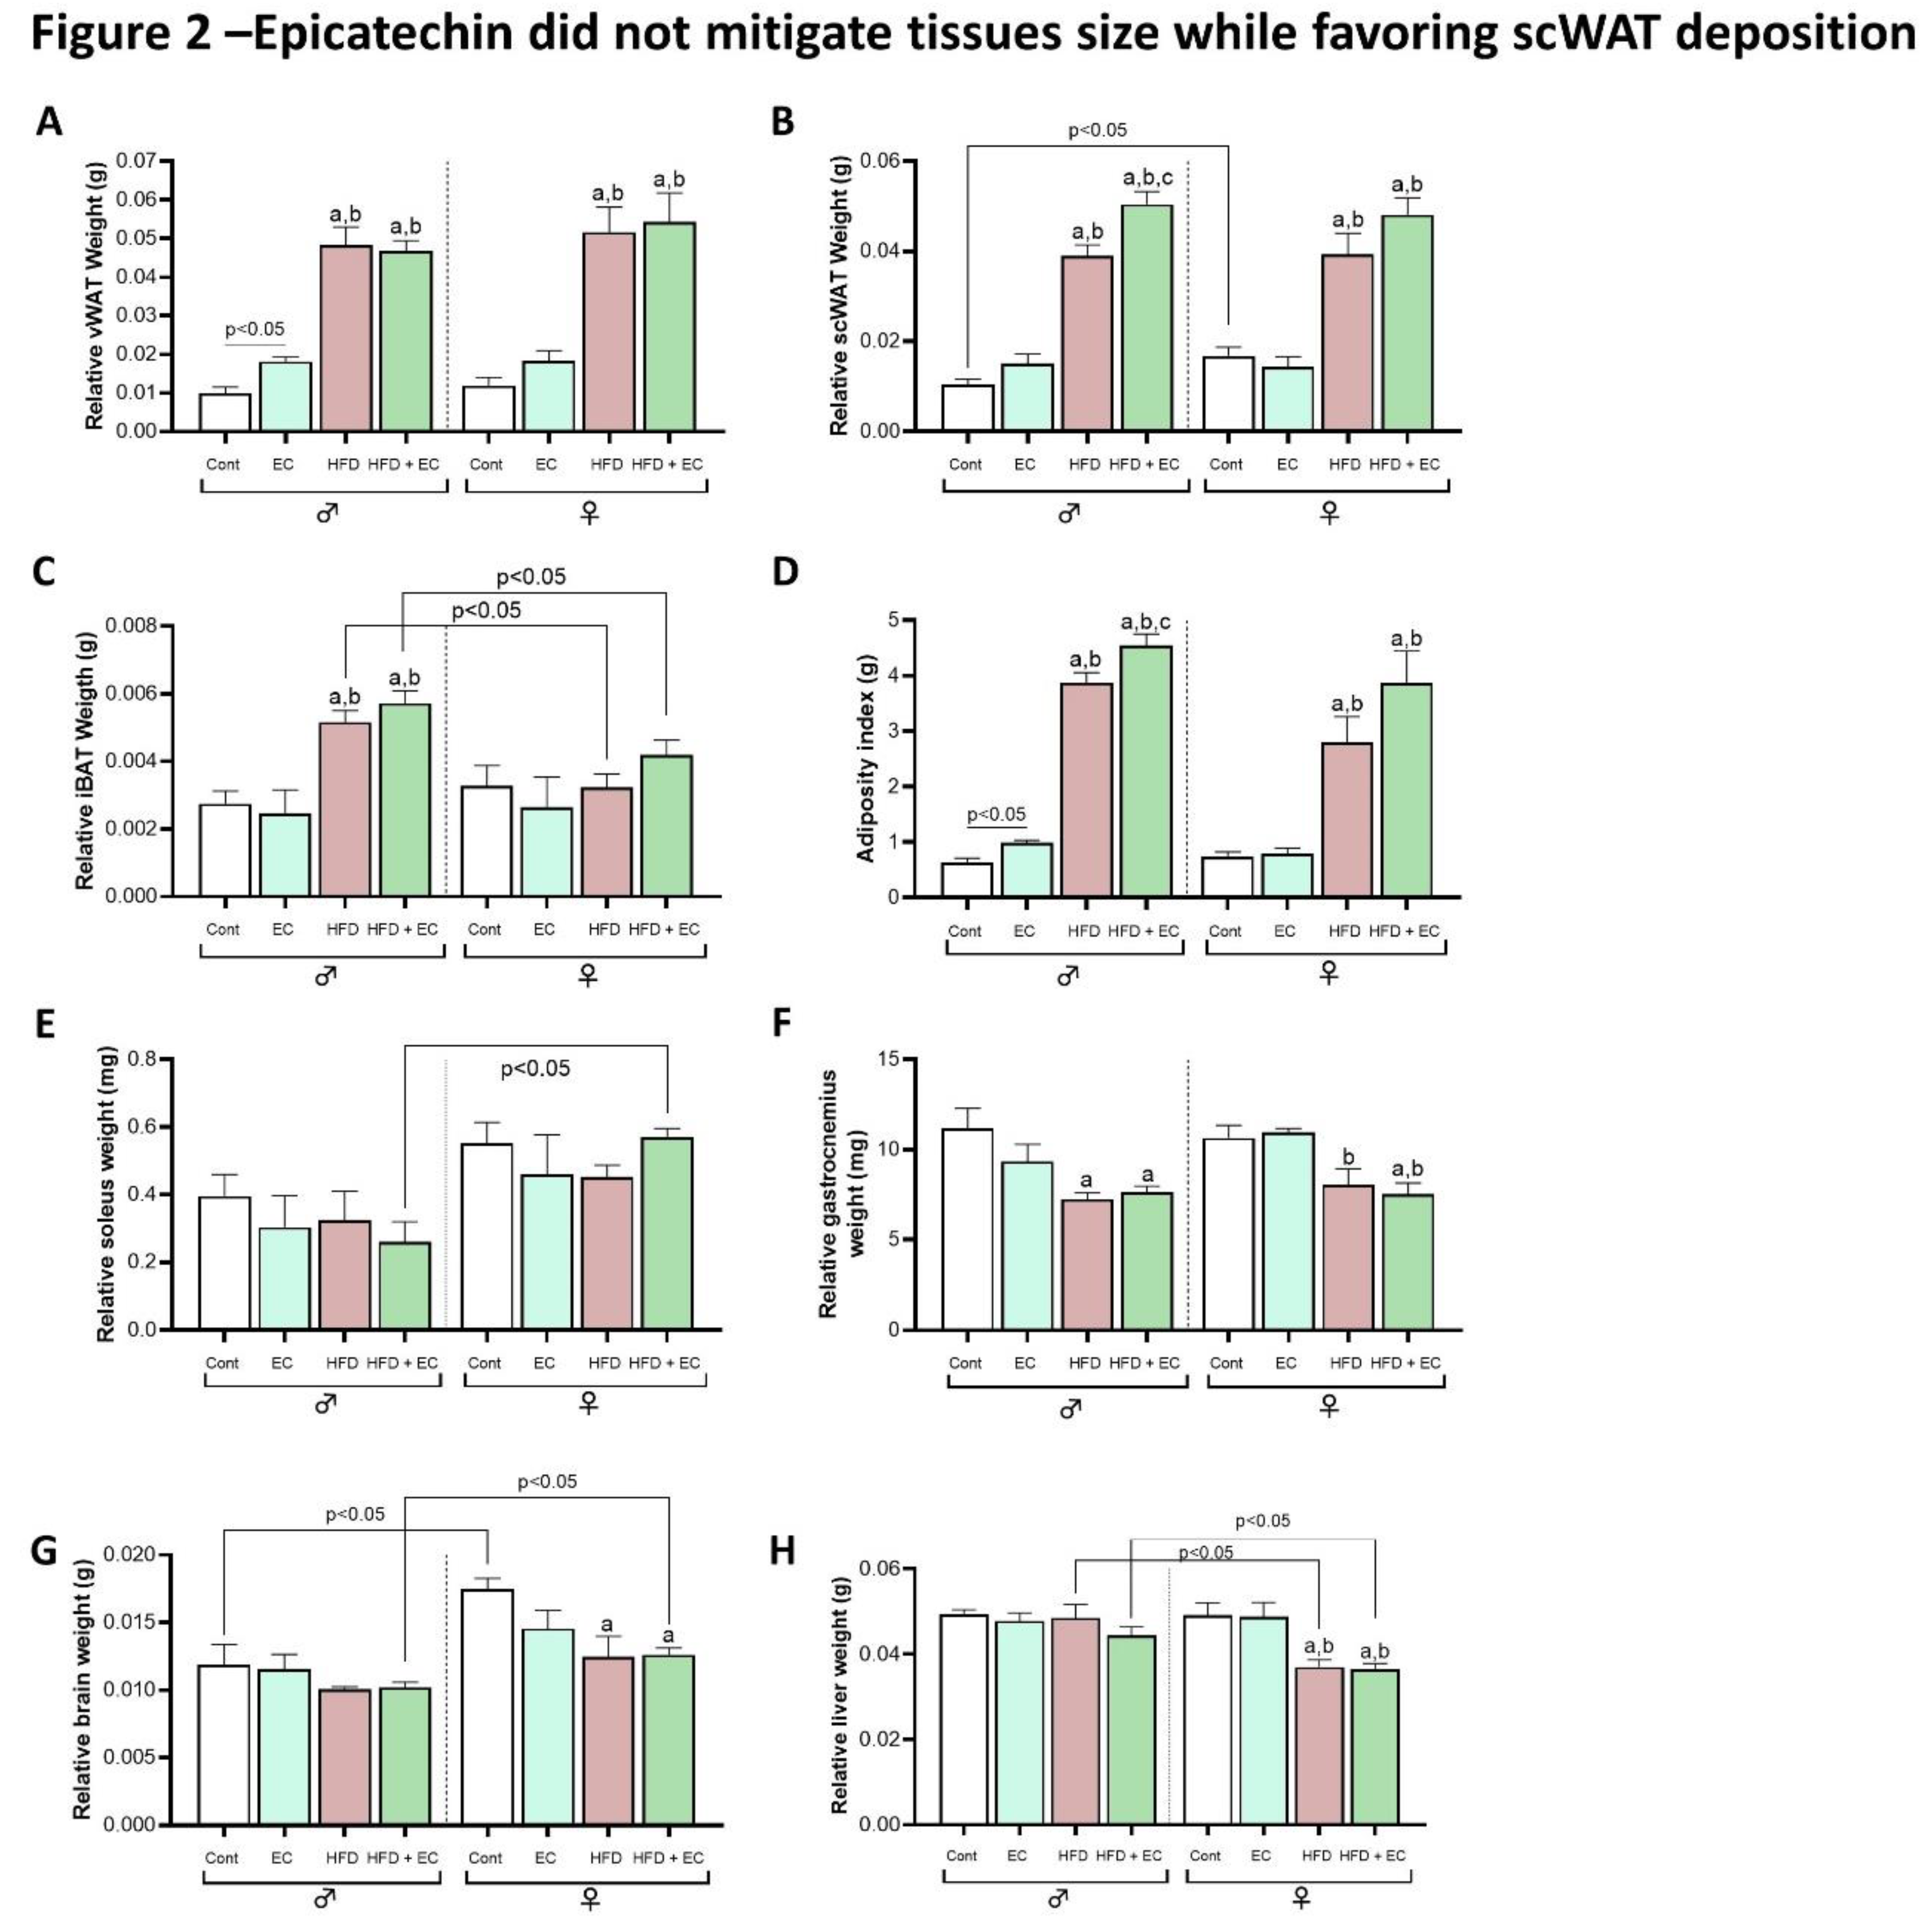
Figure 3.
Male and female mice glycemic profile. (A) Male insulin tolerance test (ITT). (B) Female ITT. (C) Male and female ITT area under curve (AUC). (D) Male glucose tolerance test (GTT). (E) Female GTT. (F) Male and female GTT area under curve (AUC). Results are presented as mean ± SEM. ANOVA one-way and Student’s t-test were used for all the statistical analysis. For ANOVA one-way, a = statistical difference compared to the Cont group, b = statistical difference compared to the EC group and c = statistical difference compared to the HFD group, respectively, with p<0.05. For t-test analyses between sexes, the p values are indicated in the figure.
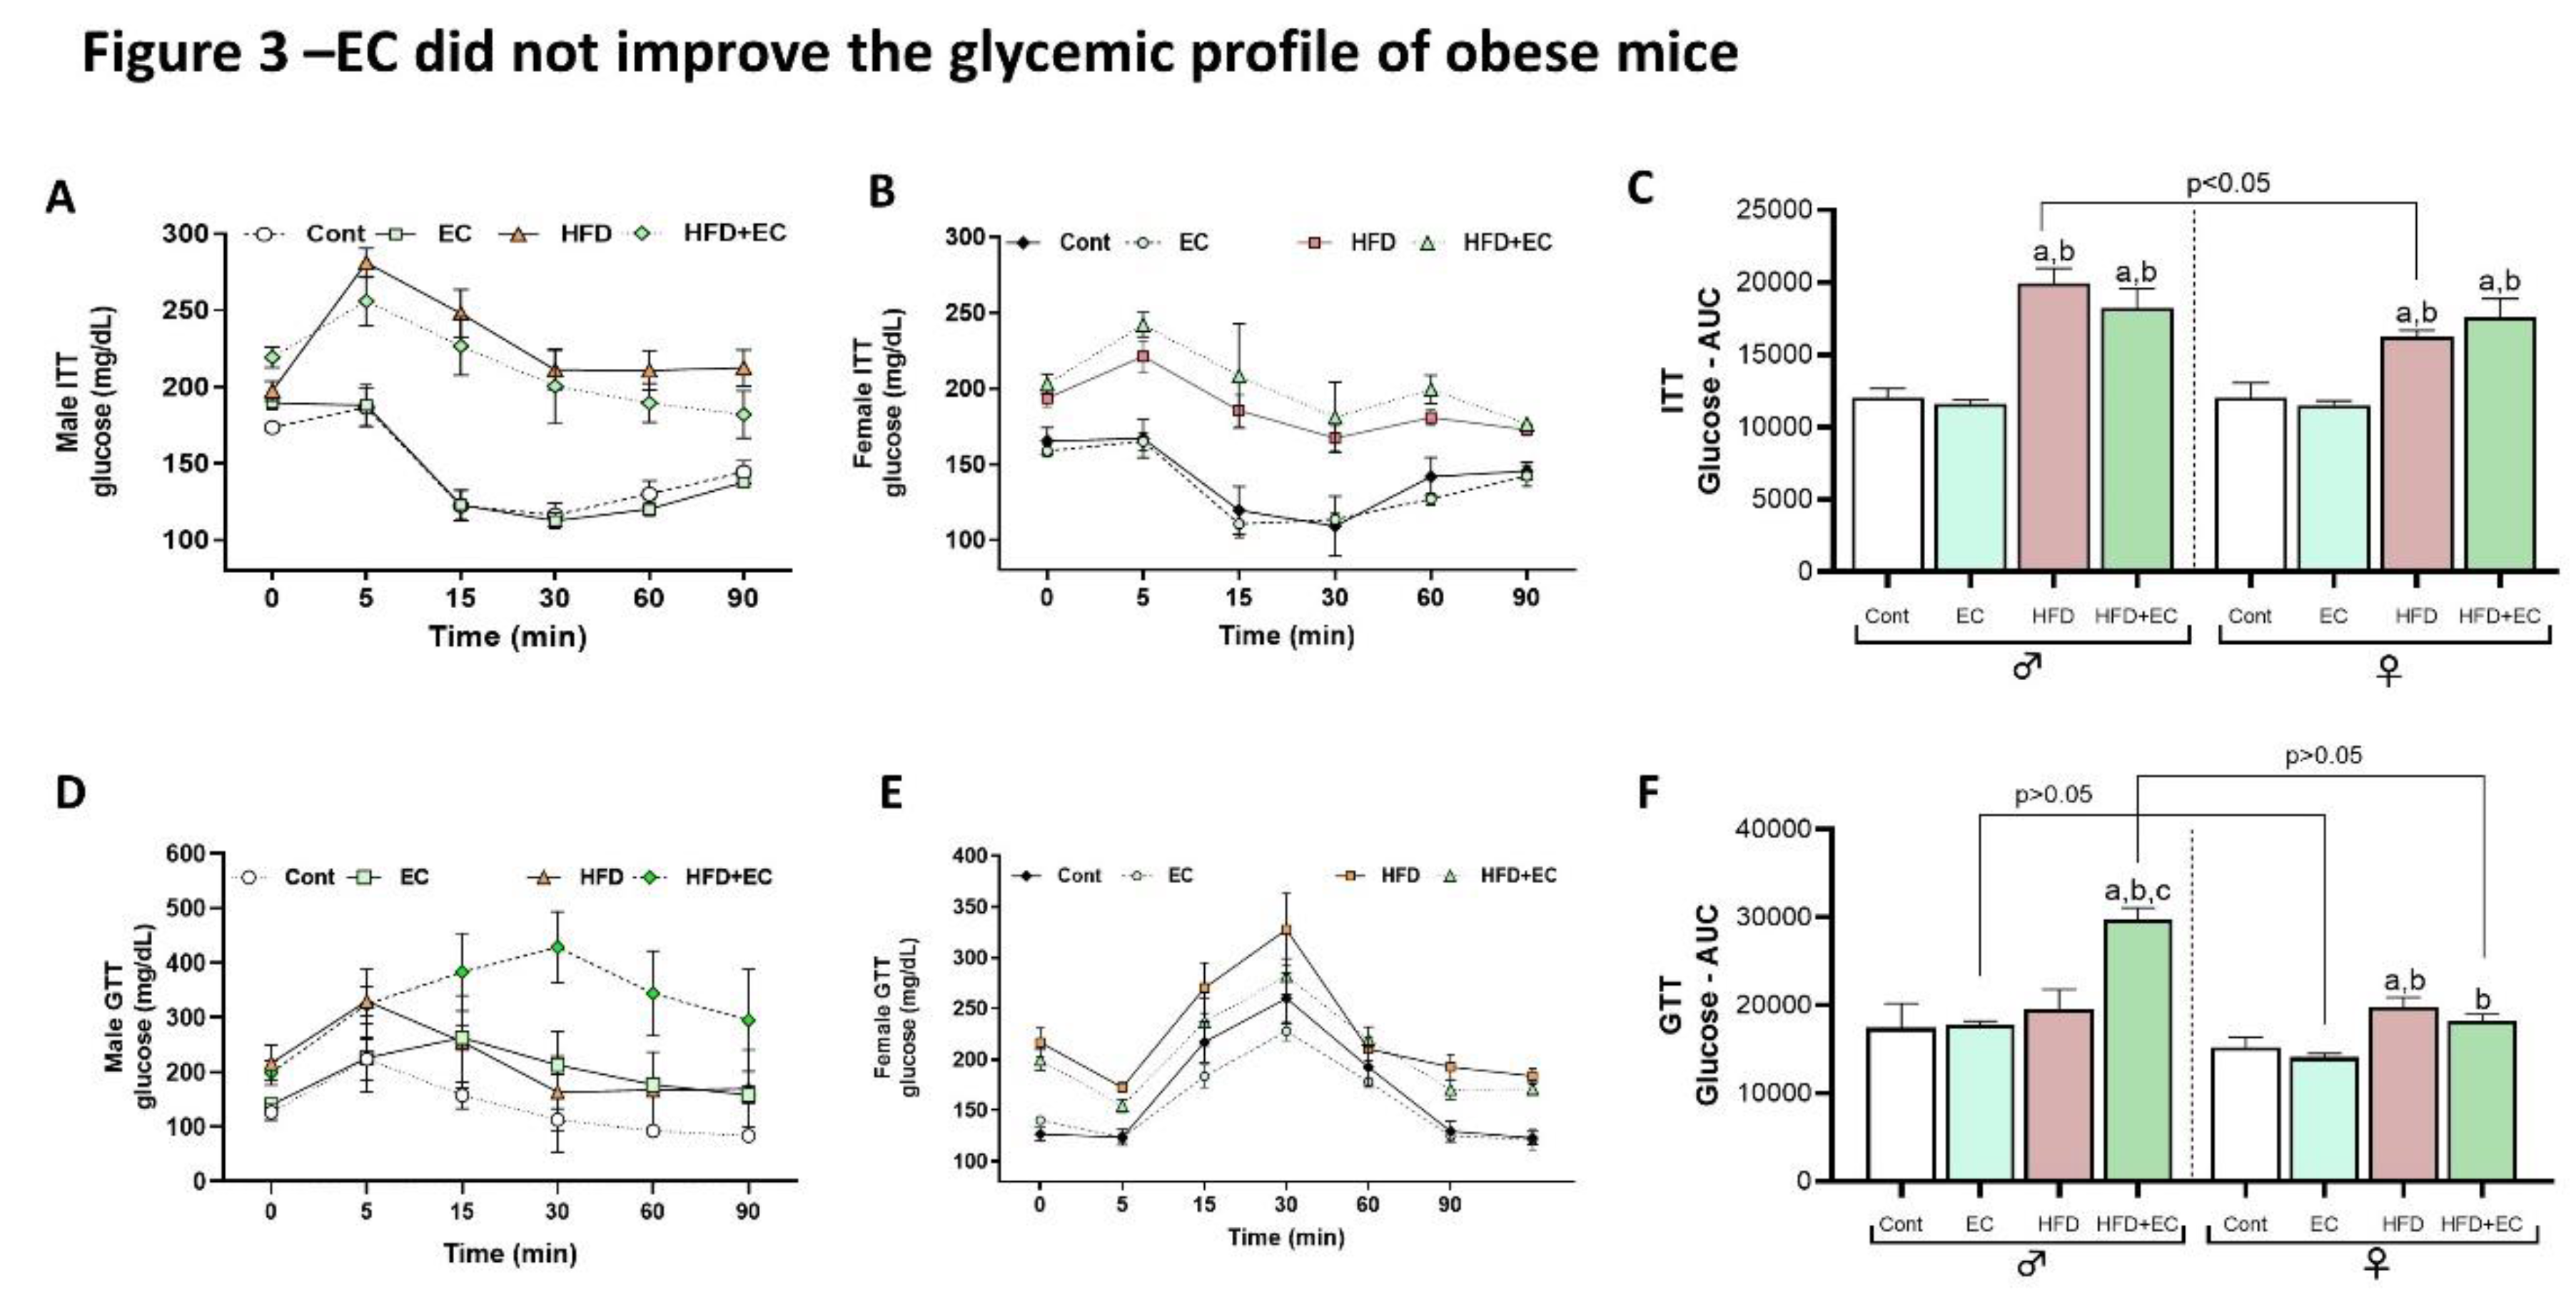
Figure 4.
Male and female mice liver histology evaluation (n = 4 animals per group). (A) Representative liver histology by H&E staining at 10x and 40x magnification. (B) Macrovesicular steatosis score. (C) Microvesicular steatosis score). (D) Hepatocellular hypertrophy score. (E) NAFLD activity score. Results are presented as mean ± SEM. ANOVA one-way and Student’s t-test were used for all the statistical analysis. For ANOVA one-way, a = statistical difference compared to the Cont group, b = statistical difference compared to the EC group and c = statistical difference compared to the HFD group, respectively, with p<0.05. For t-test analyses between sexes, the p values are indicated in the figure.
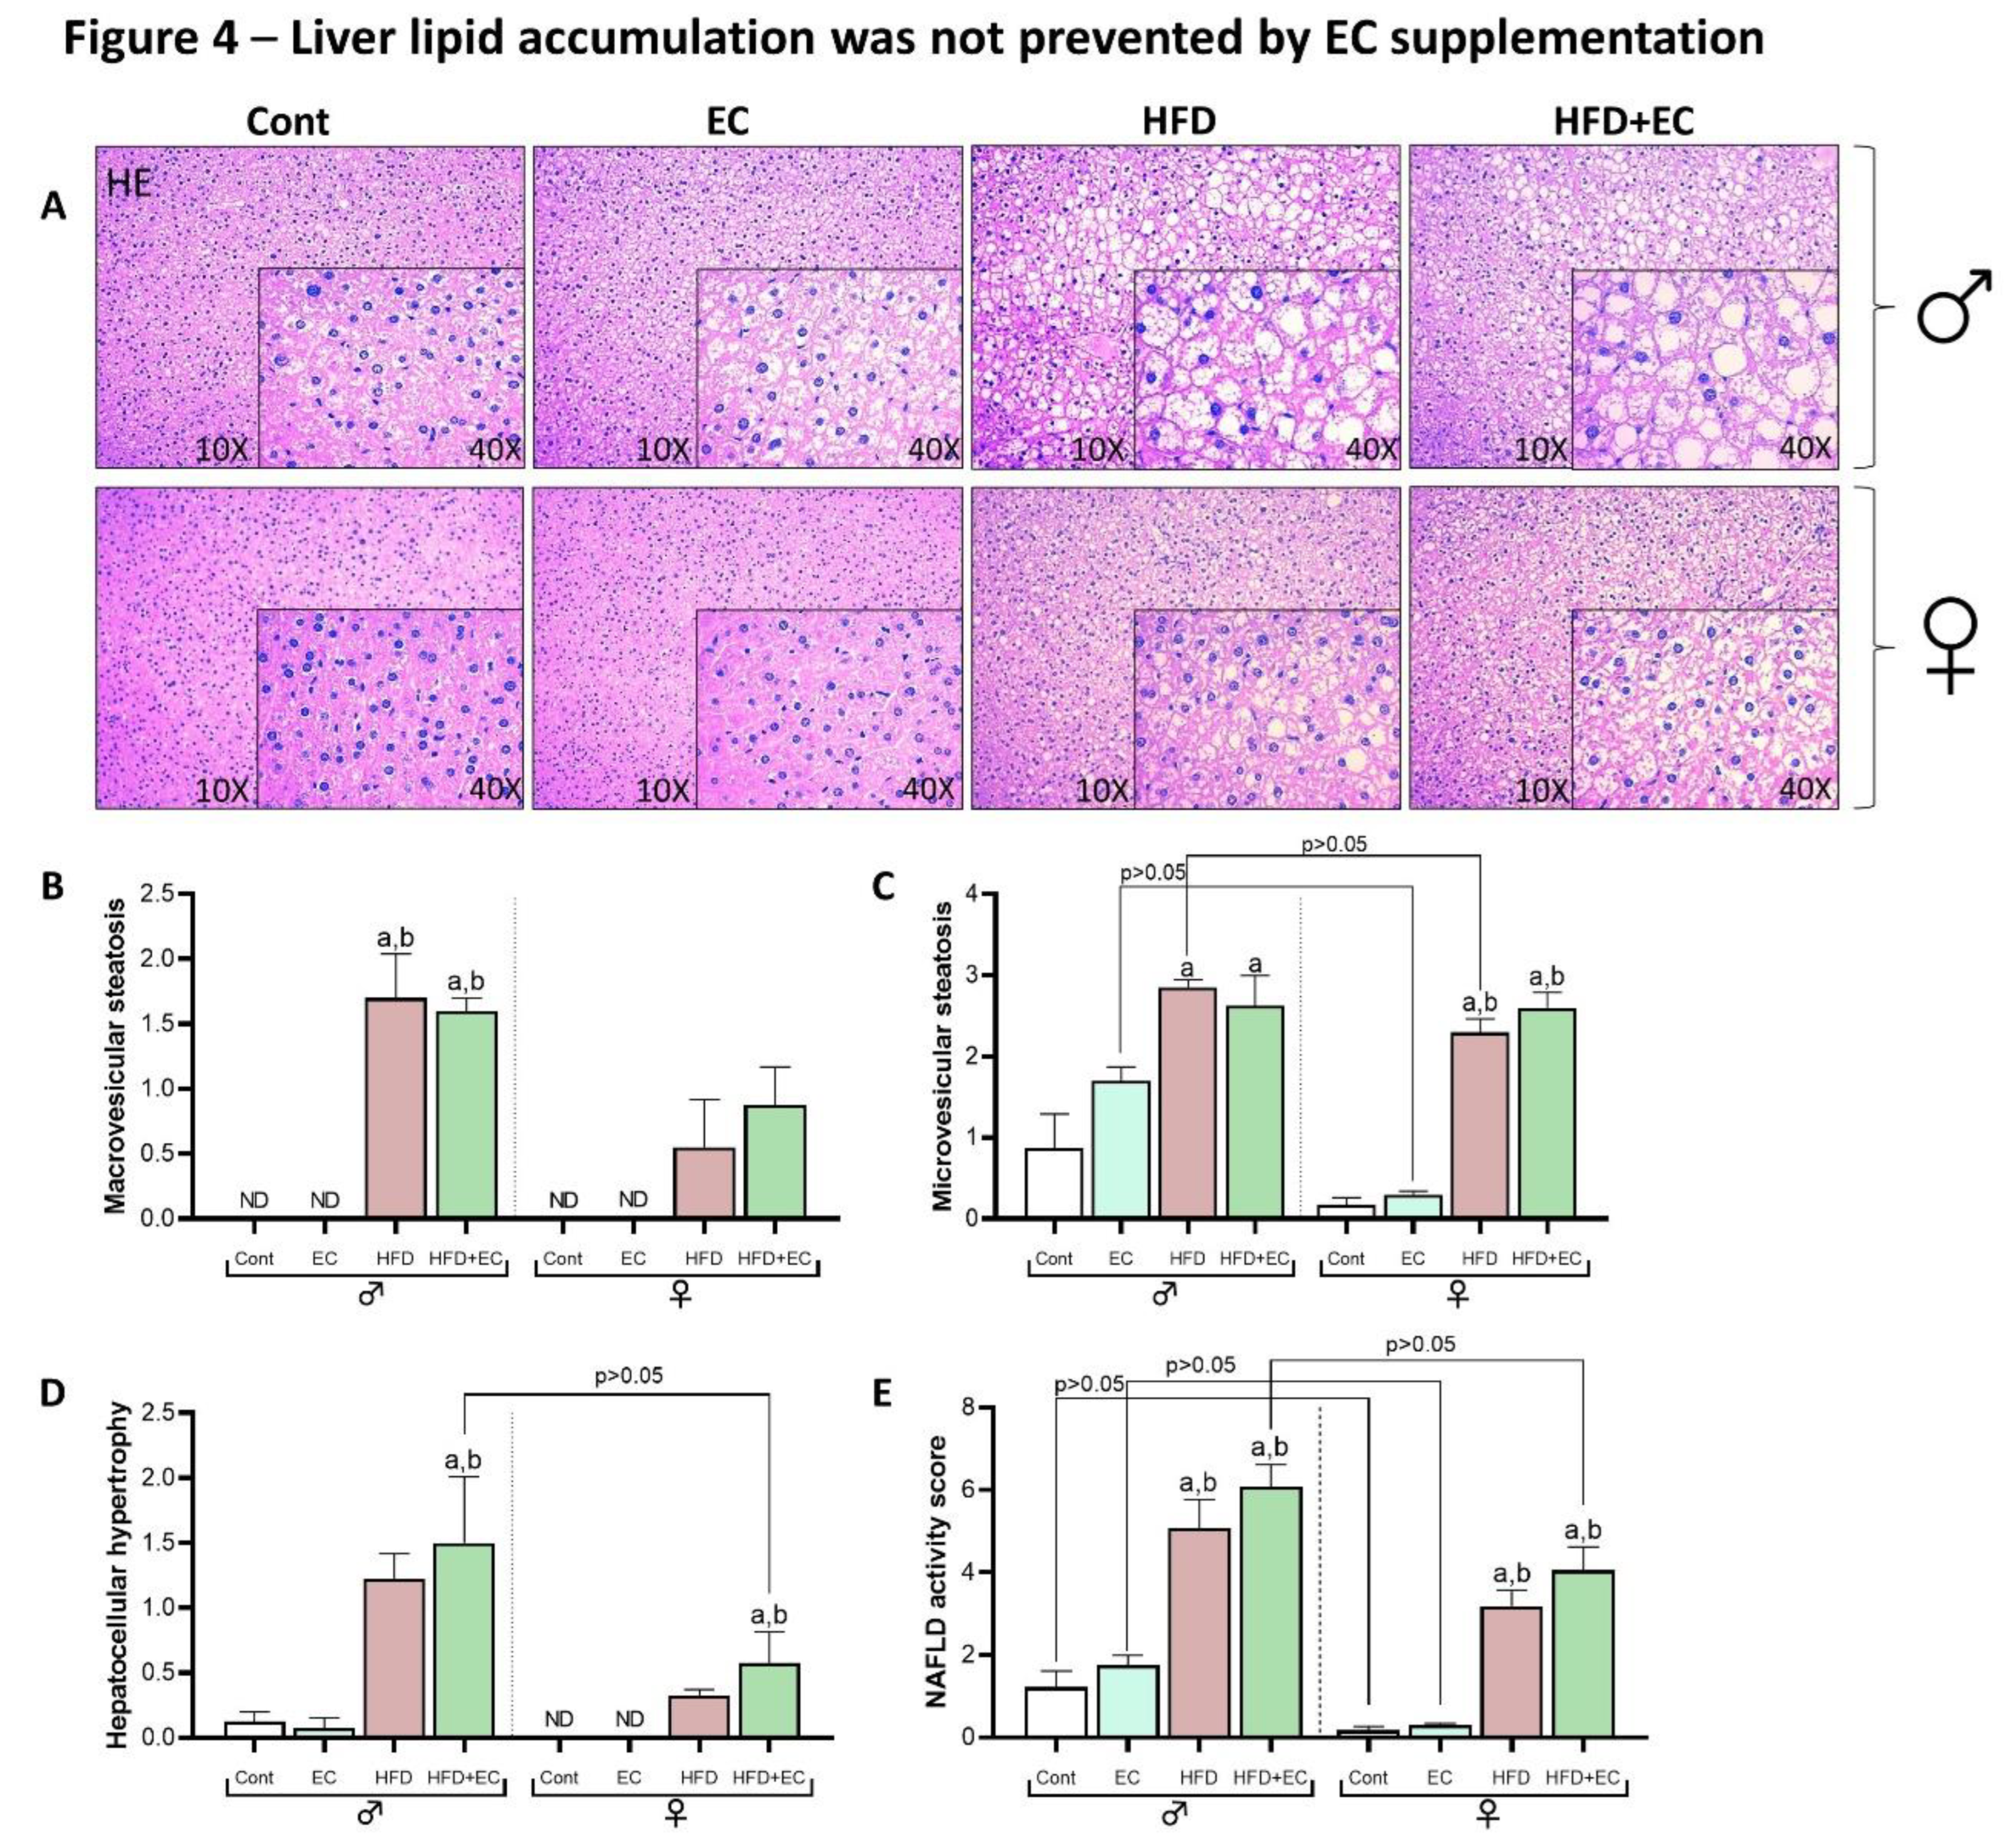

Table 1.
Biochemical analyses of male and female mice housed at thermoneutrality and supplemented with 20mg/kg of EC (n = 4-5 animals per group). Plasma uric acid and creatinine (mg/dL), plasma ALT – Alanine Transaminase, AST- Aspartate Transaminase and GGT – Gamma-glutamyl Transferase (U/L), plasma adiponectin (μg/mL) and fasting glycemia (mg/dL). Results are presented as mean ± SEM. ANOVA one-way and Student’s t-test were used for all the statistical analysis. For ANOVA one-way, a = statistical difference compared to the Cont group, b = statistical difference compared to the EC group and c = statistical difference compared to the HFD group, respectively, with p<0.05. For t-test analyses between sexes, the p values are indicated as *p<0.05 in the table.
 |
Disclaimer/Publisher’s Note: The statements, opinions and data contained in all publications are solely those of the individual author(s) and contributor(s) and not of MDPI and/or the editor(s). MDPI and/or the editor(s) disclaim responsibility for any injury to people or property resulting from any ideas, methods, instructions or products referred to in the content. |
© 2024 by the authors. Licensee MDPI, Basel, Switzerland. This article is an open access article distributed under the terms and conditions of the Creative Commons Attribution (CC BY) license (http://creativecommons.org/licenses/by/4.0/).
Copyright: This open access article is published under a Creative Commons CC BY 4.0 license, which permit the free download, distribution, and reuse, provided that the author and preprint are cited in any reuse.


